The Basic Seven (B7) The Basic Seven (B7) Tools of Quality Tools of Quality A PowerPoint Training A PowerPoint Training Presentation Presentation By Keith H. Cooper By Keith H. Cooper "As much as 95% of quality related problems in the factory can be sol ved "As much as 95% of quality related problems in the factory can be sol ved with seven fundamental quantitative tools." - Kaoru Ishikawa with seven fundamental quantitative tools." - Kaoru Ishikawa

Welcome message from author
This document is posted to help you gain knowledge. Please leave a comment to let me know what you think about it! Share it to your friends and learn new things together.
Transcript
8/14/2019 The Basic Seven QC Tools
http://slidepdf.com/reader/full/the-basic-seven-qc-tools 1/38
The Basic Seven (B7)The Basic Seven (B7)
Tools of QualityTools of Quality
A PowerPoint TrainingA PowerPoint Training
PresentationPresentation
By Keith H. Cooper By Keith H. Cooper
"As much as 95% of quality related problems in the factory can be solved"As much as 95% of quality related problems in the factory can be solved
with seven fundamental quantitative tools." - Kaoru Ishikawawith seven fundamental quantitative tools." - Kaoru Ishikawa

8/14/2019 The Basic Seven QC Tools
http://slidepdf.com/reader/full/the-basic-seven-qc-tools 2/38
What are the Basic What are the Basic
Seven Tools of Quality?Seven Tools of Quality?
• Fishbone DiagramsFishbone Diagrams
• HistogramsHistograms
• Pareto AnalysisPareto Analysis
• FlowchartsFlowcharts
• Scatter PlotsScatter Plots
• Run ChartsRun Charts• Control ChartsControl Charts

8/14/2019 The Basic Seven QC Tools
http://slidepdf.com/reader/full/the-basic-seven-qc-tools 3/38
Where did the Basic Where did the Basic
Seven come from?Seven come from?
Kaoru IshikawaKaoru Ishikawa• Known for “Democratizing Statistics”Known for “Democratizing Statistics”
• The Basic Seven Tools made statisticalThe Basic Seven Tools made statistical
analysis less complicated for the averageanalysis less complicated for the average
personperson
• Good Visual Aids make statistical andGood Visual Aids make statistical and
quality control more comprehendible.quality control more comprehendible.
8/14/2019 The Basic Seven QC Tools
http://slidepdf.com/reader/full/the-basic-seven-qc-tools 4/38
The Basic Seven (B7)The Basic Seven (B7)
Tools of QualityTools of Quality
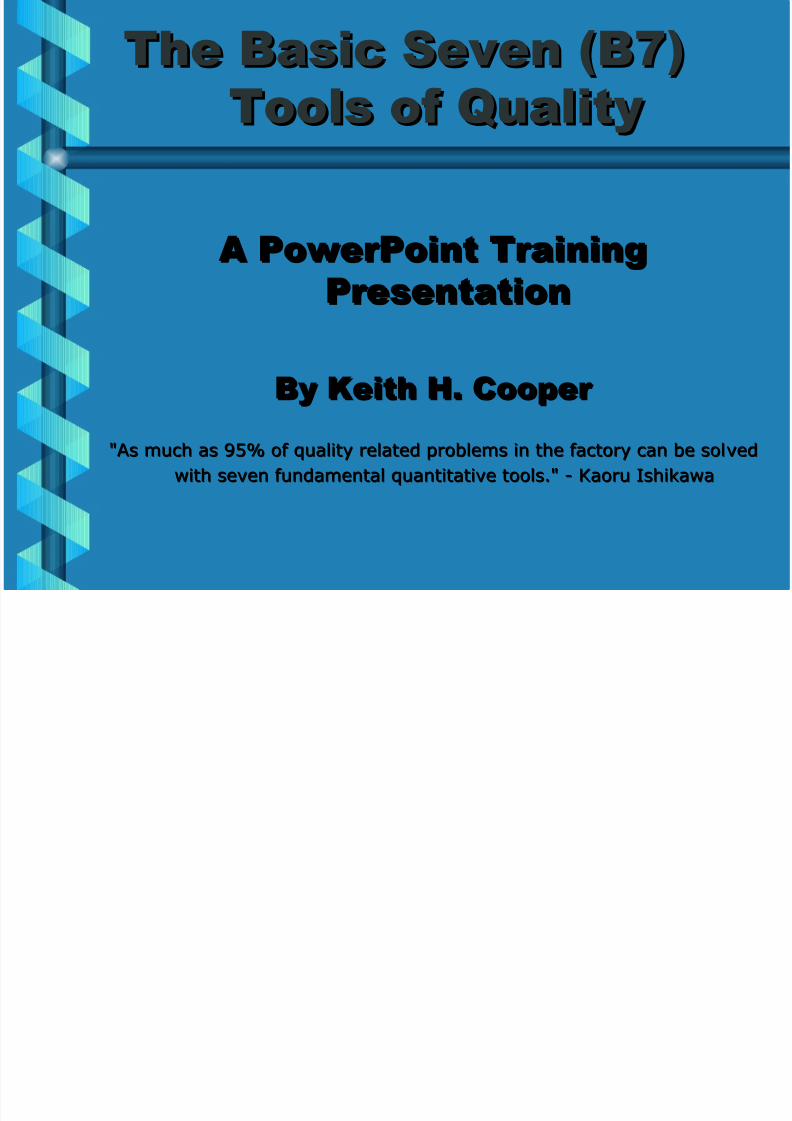
Fishbone DiagramsFishbone Dia
grams
• No statistics involvedNo statistics involved
• Maps out a process/problemMaps out a process/problem
• Makes improvement easier Makes improvement easier
• Looks like a “Fish Skeleton”Looks like a “Fish Skeleton”

8/14/2019 The Basic Seven QC Tools
http://slidepdf.com/reader/full/the-basic-seven-qc-tools 5/38
Constructing a FishboneConstructing a Fishbone
DiagramDiagram
• Step 1 - Identify the ProblemStep 1 - Identify the Problem
• Step 2 - Draw “spine” and “bones”Step 2 - Draw “spine” and “bones”
Example:Example: High Inventory Shrinkage at local DrugHigh Inventory Shrinkage at local Drug
StoreStore
Shrinkage

8/14/2019 The Basic Seven QC Tools
http://slidepdf.com/reader/full/the-basic-seven-qc-tools 6/38
Co nst ructing ao nst ructing a
Fish bone Dia gramish bone Dia gram
• Step 3 - Identify different areas whereStep 3 - Identify different areas where
problems may arise fromproblems may arise from
Ex. :Ex. : High Inventory Shrinkage at local Drug StoreHigh Inventory Shrinkage at local Drug Store
Shrinkage
employees
shoplifters

8/14/2019 The Basic Seven QC Tools
http://slidepdf.com/reader/full/the-basic-seven-qc-tools 7/38
Co nst ructing ao nst ructing a
Fish bone Dia gramish bone Dia gram
• Step 4 - Identify what these specificStep 4 - Identify what these specific
causes could becauses could be
Ex. :Ex. : High Inventory Shrinkage at local Drug StoreHigh Inventory Shrinkage at local Drug Store
Shrinkage
shoplifters
Anti-theft tags poorly designedExpensive merchandise out
in the open
No security/ surveillance
8/14/2019 The Basic Seven QC Tools
http://slidepdf.com/reader/full/the-basic-seven-qc-tools 8/38
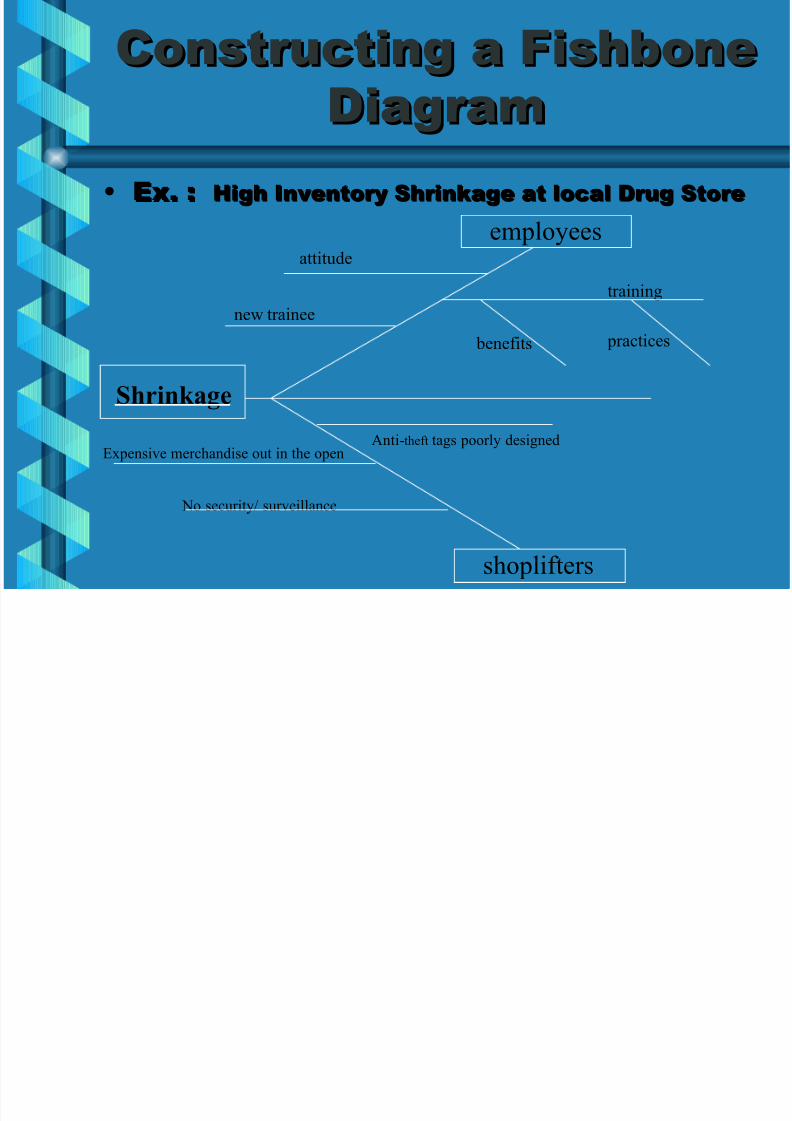
Constructing a FishboneConstructing a Fishbone
DiagramDiagram
• Ex. :Ex. : High Inventory Shrinkage at local Drug StoreHigh Inventory Shrinkage at local Drug Store
Shrinkage
shoplifters
Anti-theft tags poorly designedExpensive merchandise out in the open
No security/ surveillance
employeesattitude
new trainee
training
benefits practices

8/14/2019 The Basic Seven QC Tools
http://slidepdf.com/reader/full/the-basic-seven-qc-tools 9/38
Constructing a FishboneConstructing a Fishbone
DiagramDiagram
• Step 5 – Use the finished diagram toStep 5 – Use the finished diagram to
brainstorm solutions to the main problems.brainstorm solutions to the main problems.

8/14/2019 The Basic Seven QC Tools
http://slidepdf.com/reader/full/the-basic-seven-qc-tools 10/38
The Basic Seven (B7)The Basic Seven (B7)
Tools of QualityTools of Quality
HistogramsHistograms
• Bar chartBar chart
• Used to graphically represent groupsUsed to graphically represent groups
of dataof data
8/14/2019 The Basic Seven QC Tools
http://slidepdf.com/reader/full/the-basic-seven-qc-tools 11/38
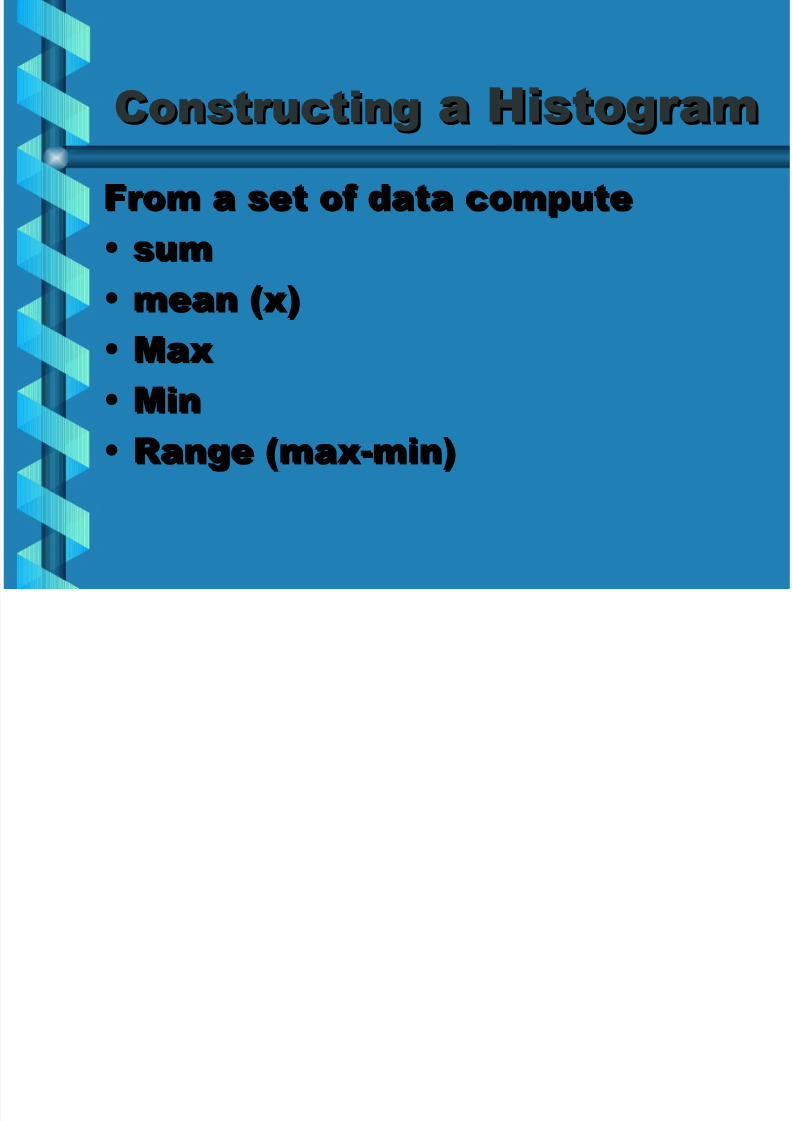
ConstructingConstructing a Histograma Histogram
From a set of data computeFrom a set of data compute
• sumsum
• mean (x)mean (x)
• MaxMax
• MinMin• Range (max-min)Range (max-min)
8/14/2019 The Basic Seven QC Tools
http://slidepdf.com/reader/full/the-basic-seven-qc-tools 12/38
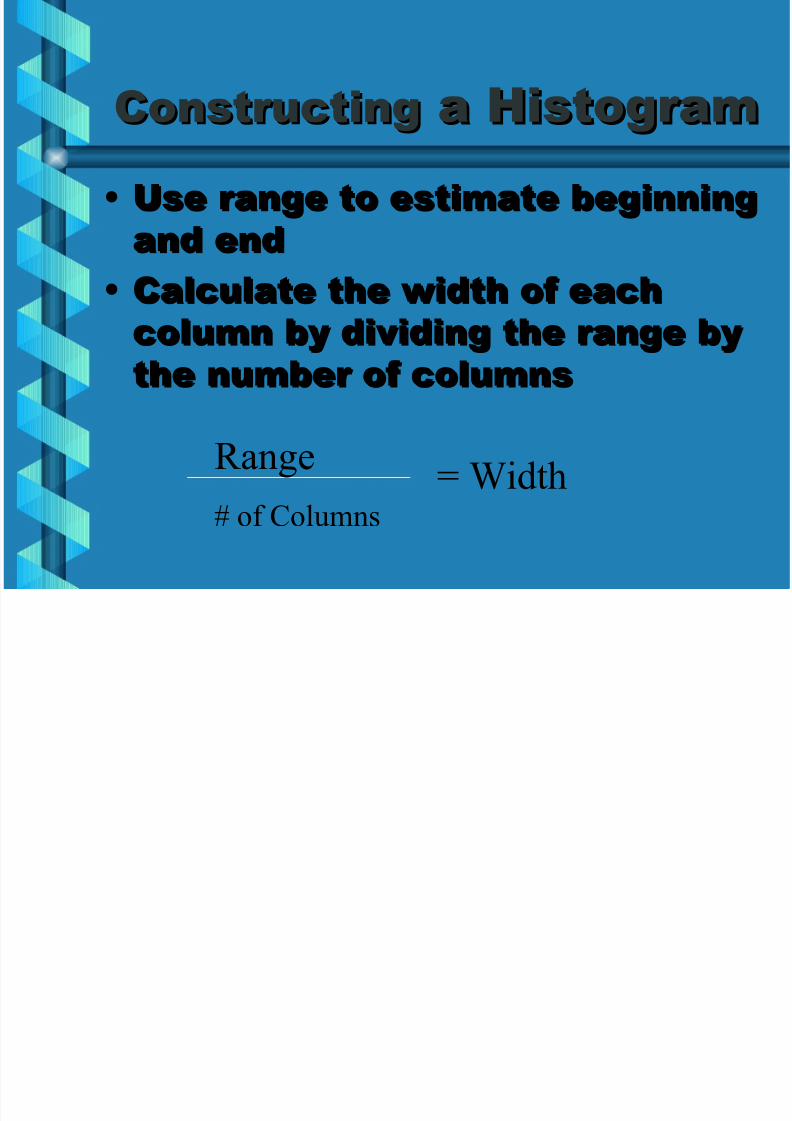
ConstructingConstructing a Histograma Histogram
• Use range to estimate beginningUse range to estimate beginning
and endand end
• Calculate the width of eachCalculate the width of each
column by dividing the range bycolumn by dividing the range by
the number of columnsthe number of columns
Range
# of Columns
= Width
8/14/2019 The Basic Seven QC Tools
http://slidepdf.com/reader/full/the-basic-seven-qc-tools 13/38
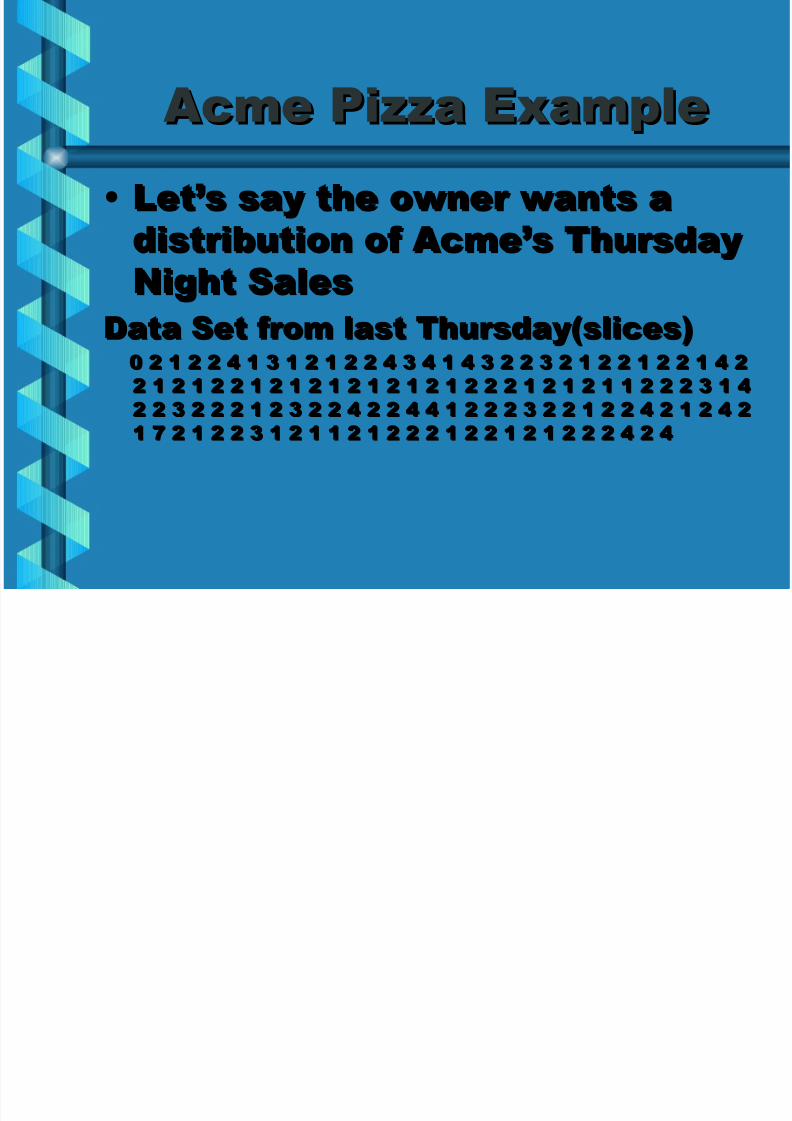
Acme Pizza ExampleAcme Pizza Example
• Let’s say the owner wants aLet’s say the owner wants a
distribution of Acme’s Thursdaydistribution of Acme’s Thursday
Night SalesNight SalesData Set from last Thursday(slices)Data Set from last Thursday(slices)
0 2 1 2 2 4 1 3 1 2 1 2 2 4 3 4 1 4 3 2 2 3 2 1 2 2 1 2 2 1 4 20 2 1 2 2 4 1 3 1 2 1 2 2 4 3 4 1 4 3 2 2 3 2 1 2 2 1 2 2 1 4 2
2 1 2 1 2 2 1 2 1 2 1 2 1 2 1 2 1 2 2 2 1 2 1 2 1 1 2 2 2 3 1 42 1 2 1 2 2 1 2 1 2 1 2 1 2 1 2 1 2 2 2 1 2 1 2 1 1 2 2 2 3 1 4
2 2 3 2 2 2 1 2 3 2 2 4 2 2 4 4 1 2 2 2 3 2 2 1 2 2 4 2 1 2 4 22 2 3 2 2 2 1 2 3 2 2 4 2 2 4 4 1 2 2 2 3 2 2 1 2 2 4 2 1 2 4 21 7 2 1 2 2 3 1 2 1 1 2 1 2 2 2 1 2 2 1 2 1 2 2 2 4 2 41 7 2 1 2 2 3 1 2 1 1 2 1 2 2 2 1 2 2 1 2 1 2 2 2 4 2 4

8/14/2019 The Basic Seven QC Tools
http://slidepdf.com/reader/full/the-basic-seven-qc-tools 14/38
Acme Pizza ExampleAcme Pizza Example
Mean = 2.032258Mean = 2.032258
Max = 7Max = 7
Min = 0Min = 0
Range = 7Range = 7
QuestionQuestionFor 7 columns what would the widthFor 7 columns what would the width
be?be?Range/Columns=7/7=1 slice

8/14/2019 The Basic Seven QC Tools
http://slidepdf.com/reader/full/the-basic-seven-qc-tools 15/38
Acme Pizza ExampleAcme Pizza Example
33
65
812
0 0 1
0
10
20
30
40
50
60
70
1 2 3 4 5 6 7
Slices of Pizza
# t i m
e s
o r d
e r e d
Histogram
8/14/2019 The Basic Seven QC Tools
http://slidepdf.com/reader/full/the-basic-seven-qc-tools 16/38
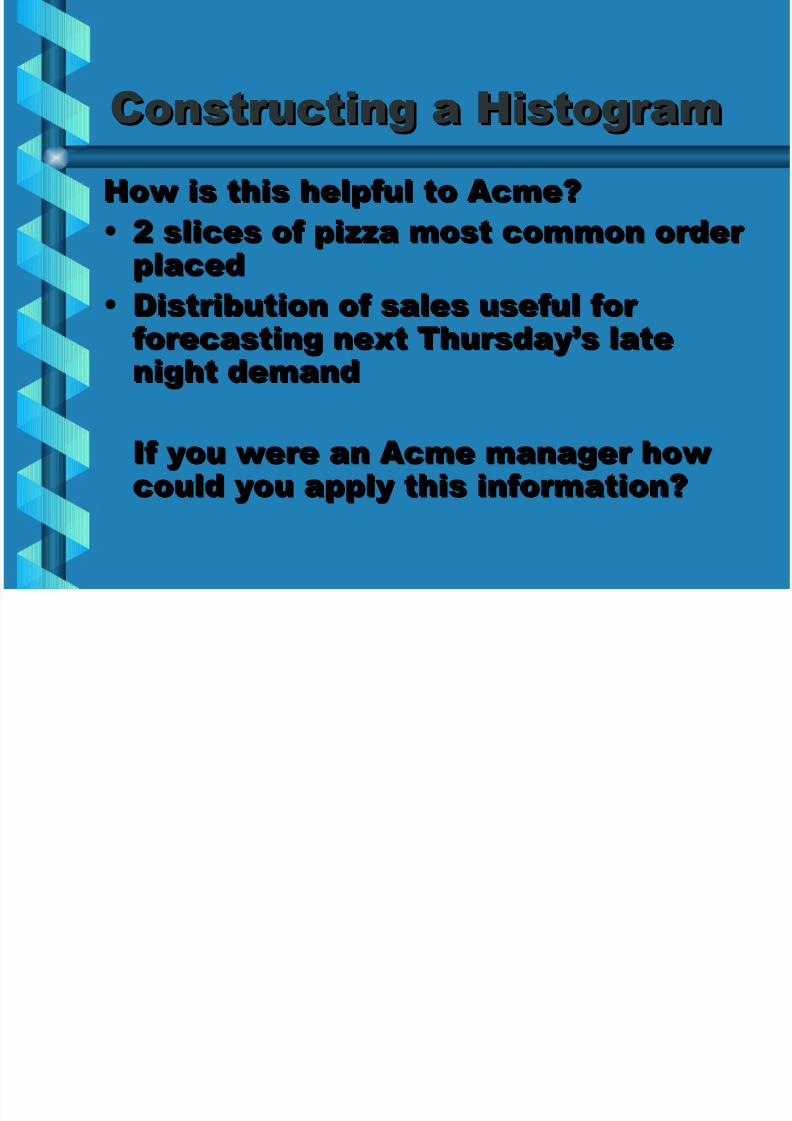
Constructing a HistogramConstructing a Histogram
How is this helpful to Acme?How is this helpful to Acme?
• 2 slices of pizza most common order 2 slices of pizza most common order
placedplaced• Distribution of sales useful for Distribution of sales useful for
forecasting next Thursday’s lateforecasting next Thursday’s latenight demandnight demand
If you were an Acme manager howIf you were an Acme manager howcould you apply this information?could you apply this information?
8/14/2019 The Basic Seven QC Tools
http://slidepdf.com/reader/full/the-basic-seven-qc-tools 17/38
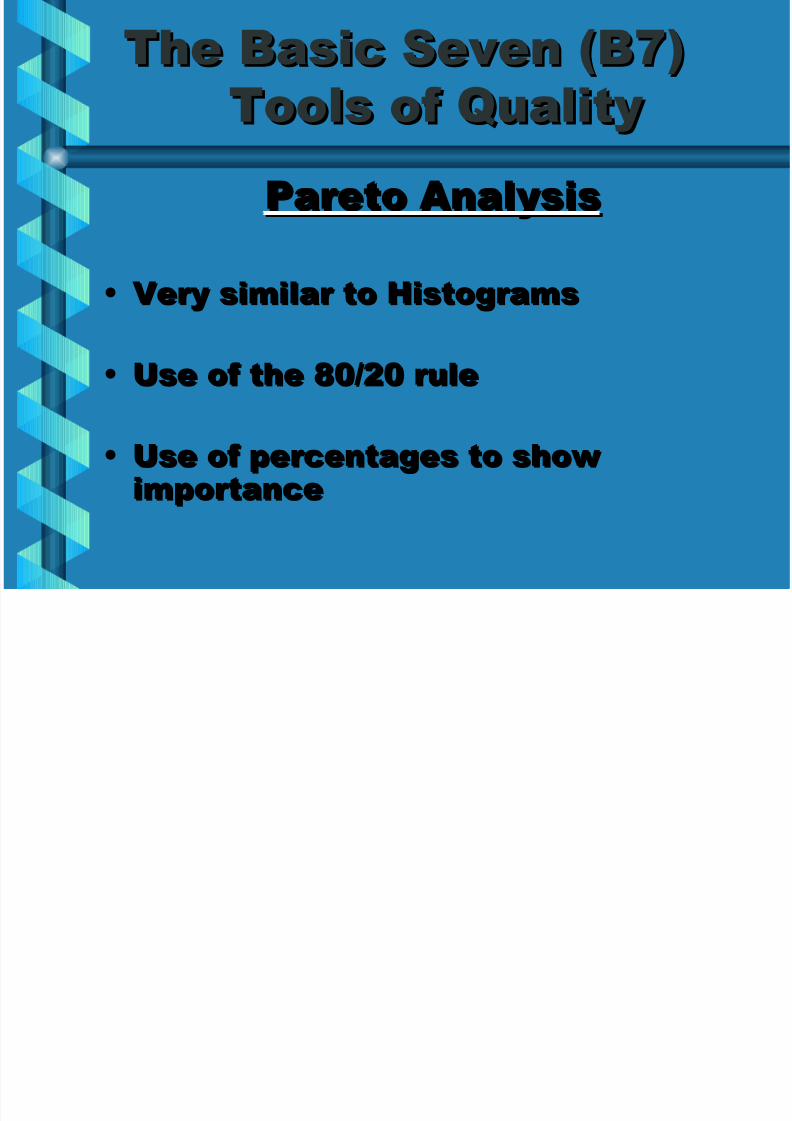
The Basic Seven (B7)The Basic Seven (B7)
Tools of QualityTools of Quality
Pareto AnalysisPareto Analysis
• Very similar to HistogramsVery similar to Histograms
• Use of the 80/20 ruleUse of the 80/20 rule
• Use of percentages to showUse of percentages to showimportanceimportance
8/14/2019 The Basic Seven QC Tools
http://slidepdf.com/reader/full/the-basic-seven-qc-tools 18/38
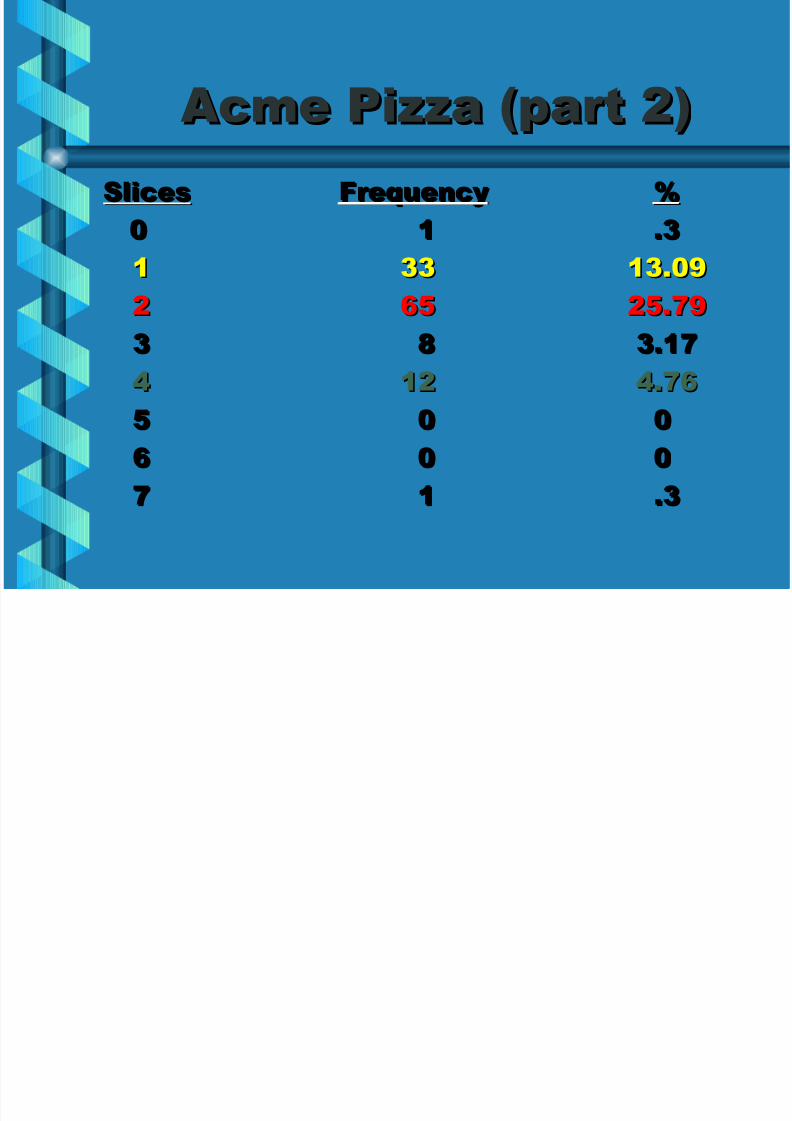
Acme Pizza (part 2)Acme Pizza (part 2)
SlicesSlices FrequencyFrequency %%
00 11 .3.3
11 3333 13.0913.0922 6565 25.7925.79
33 88 3.173.17
44 1212 4.764.76
55 00 00
66 00 00
77 11 .3.3
8/14/2019 The Basic Seven QC Tools
http://slidepdf.com/reader/full/the-basic-seven-qc-tools 19/38
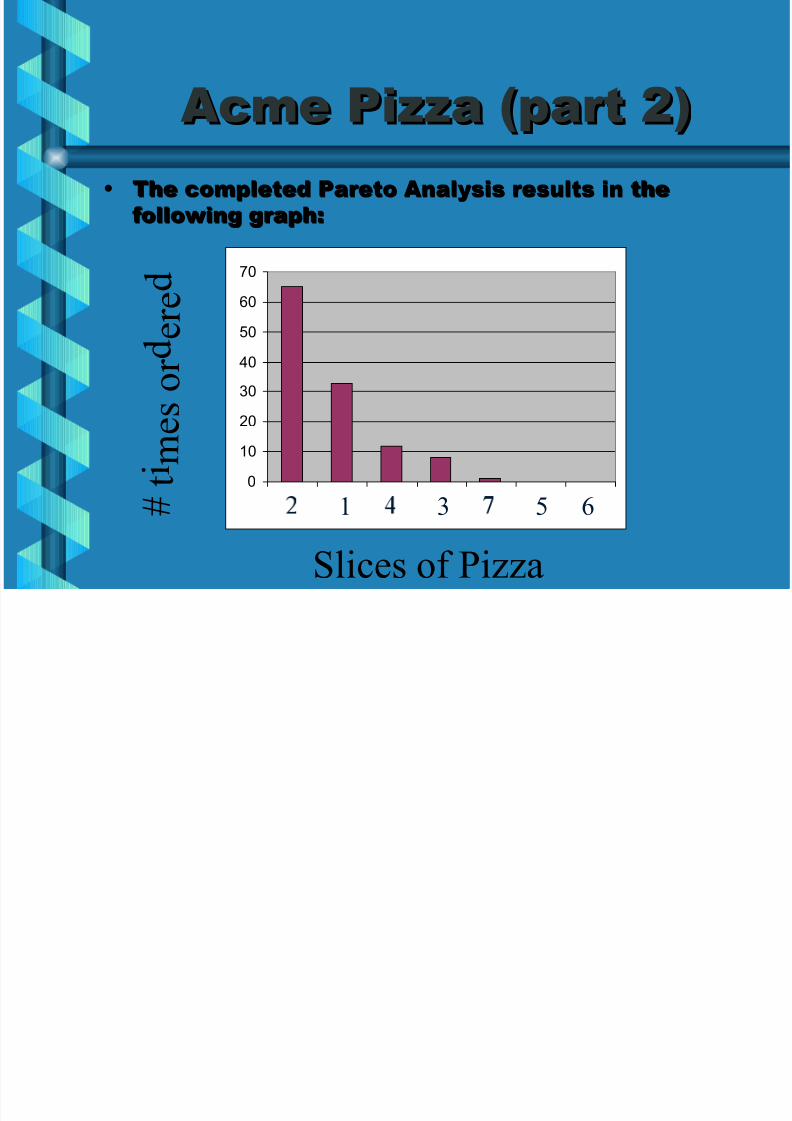
Acme Pizza (part 2)Acme Pizza (part 2)
• The completed Pareto Analysis results in theThe completed Pareto Analysis results in the
following graph:following graph:
0
10
20
30
40
50
60
70
1 2 3 4 5 6 7
Slices of Pizza
# t i m
e s
o r d
e r e d
1 3 5 6
8/14/2019 The Basic Seven QC Tools
http://slidepdf.com/reader/full/the-basic-seven-qc-tools 20/38
Acme Pizza (part 2)Acme Pizza (part 2)
Critical ThinkingCritical Thinking
• How does the Pareto AnalysisHow does the Pareto Analysis
differ from the Histogram?differ from the Histogram?
• How can this be a useful tool toHow can this be a useful tool to
the Acme boss?the Acme boss?

8/14/2019 The Basic Seven QC Tools
http://slidepdf.com/reader/full/the-basic-seven-qc-tools 21/38
The Basic Seven (B7)The Basic Seven (B7)
Tools of QualityTools of Quality
FlowchartsFlowcharts
• A graphical picture of a PROCESSA graphical picture of a PROCESS
Process Decision
The process flow
8/14/2019 The Basic Seven QC Tools
http://slidepdf.com/reader/full/the-basic-seven-qc-tools 22/38

8/14/2019 The Basic Seven QC Tools
http://slidepdf.com/reader/full/the-basic-seven-qc-tools 23/38
f
8/14/2019 The Basic Seven QC Tools
http://slidepdf.com/reader/full/the-basic-seven-qc-tools 24/38
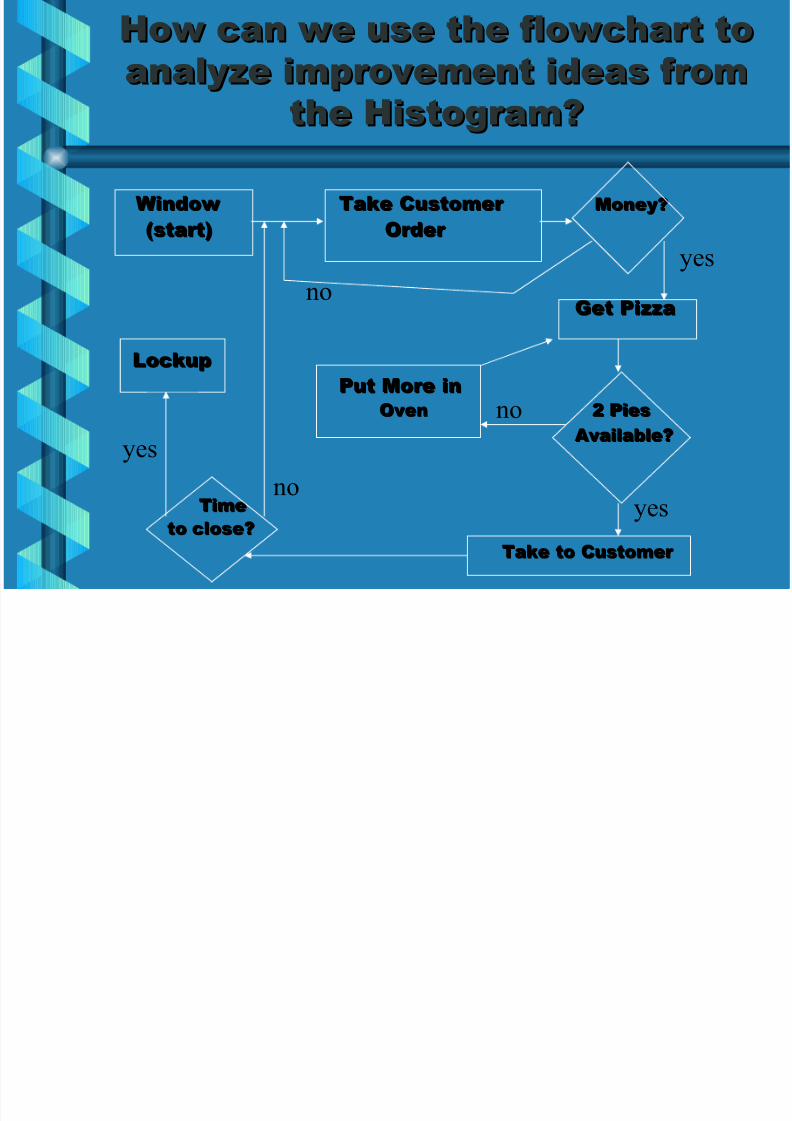
How can we use the flowchart toHow can we use the flowchart to
analyze improvement ideas fromanalyze improvement ideas from
the Histogram?the Histogram?
Window Window Take Customer Take Customer Money?Money?
(start)(start) Order Order
Get PizzaGet Pizza
LockupLockup
Put More inPut More in
OvenOven 2 Pies2 Pies Available?Available?
TimeTime
to close?to close?
Take to Customer Take to Customer
no
yes
no
yesno
yes
8/14/2019 The Basic Seven QC Tools
http://slidepdf.com/reader/full/the-basic-seven-qc-tools 25/38
8/14/2019 The Basic Seven QC Tools
http://slidepdf.com/reader/full/the-basic-seven-qc-tools 26/38
The Basic Seven (B7)The Basic Seven (B7)
Tools of QualityTools of Quality
Scatter PlotsScatter Plots
•2 Dimensional X/Y plots2 Dimensional X/Y plots
• Used to show relationshipUsed to show relationship
between independent(x) andbetween independent(x) and
dependent(y) variablesdependent(y) variables
8/14/2019 The Basic Seven QC Tools
http://slidepdf.com/reader/full/the-basic-seven-qc-tools 27/38
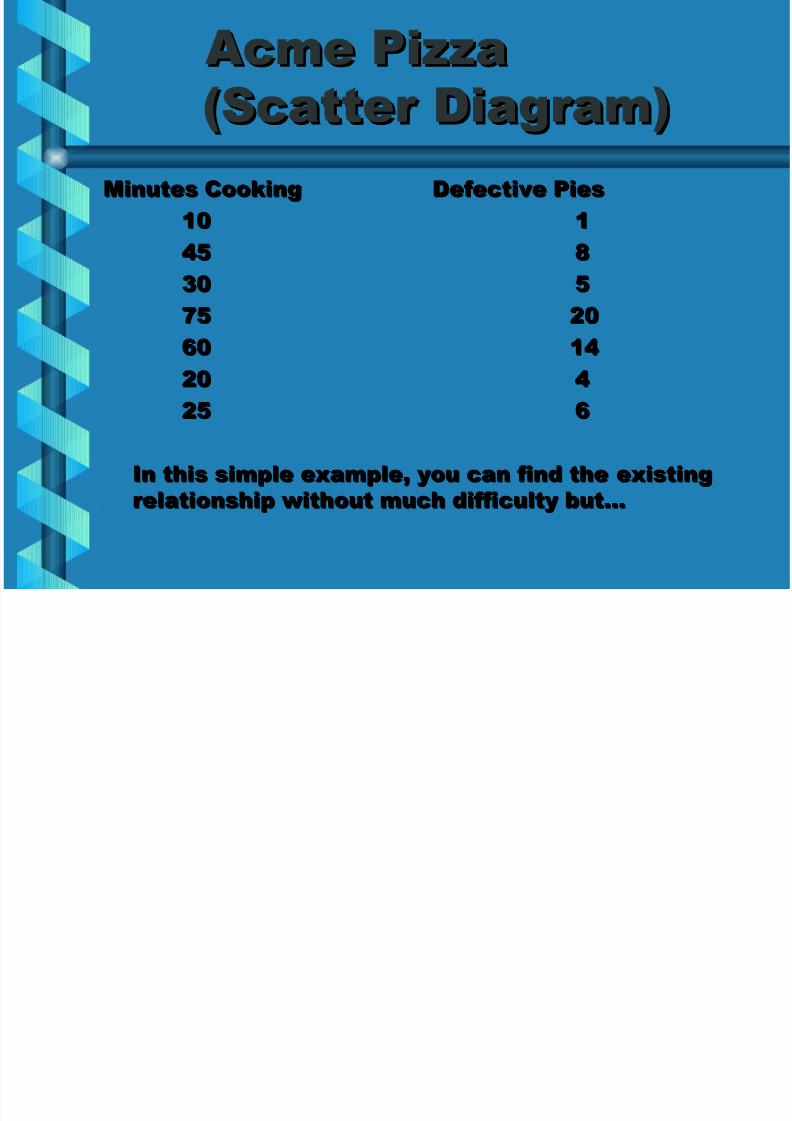
Acme PizzaAcme Pizza
(Scatter Diagram)(Scatter Diagram)
Minutes CookingMinutes Cooking Defective PiesDefective Pies
1010 11
4545 88
3030 55
7575 2020
6060 1414
2020 44
2525 66
In this simple example, you can find the existingIn this simple example, you can find the existing
relationship without much difficulty but…relationship without much difficulty but…
8/14/2019 The Basic Seven QC Tools
http://slidepdf.com/reader/full/the-basic-seven-qc-tools 28/38
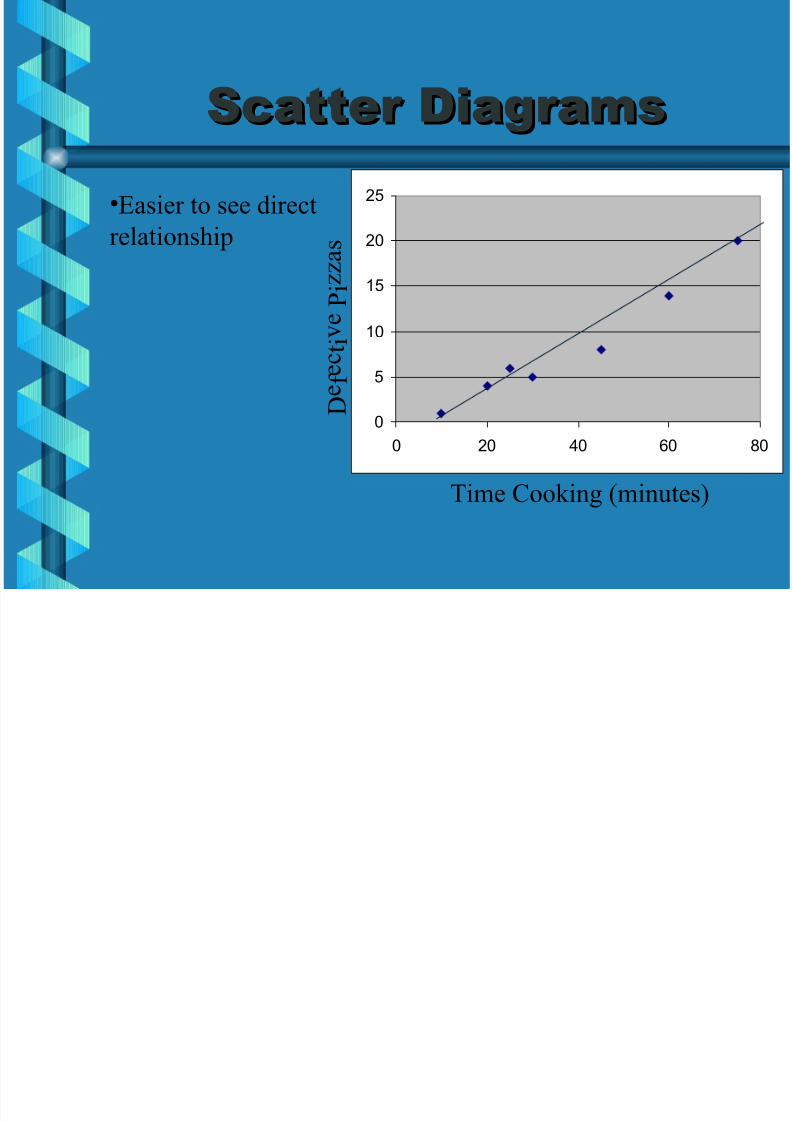
Scatter DiagramsScatter Diagrams
0
5
10
15
20
25
0 20 40 60 80
•Easier to see direct
relationship
Time Cooking (minutes)
D e f e c t i v
e P i z
z a
s
8/14/2019 The Basic Seven QC Tools
http://slidepdf.com/reader/full/the-basic-seven-qc-tools 29/38
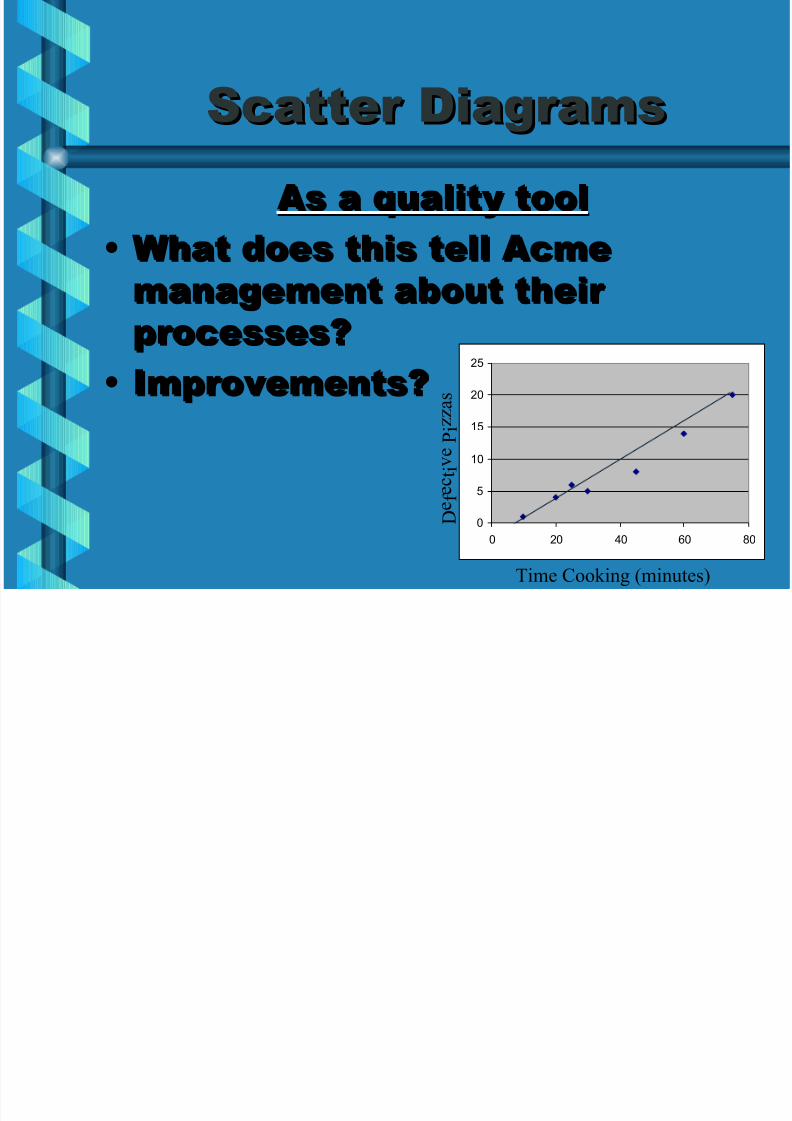
Scatter DiagramsScatter Diagrams
As a quality toolAs a quality tool
• What does this tell Acme What does this tell Acme
management about their management about their processes?processes?
• Improvements?Improvements?
0
5
10
15
20
25
0 20 40 60 80
Time Cooking (minutes)
D e f e c t i v
e P
i z z a s
8/14/2019 The Basic Seven QC Tools
http://slidepdf.com/reader/full/the-basic-seven-qc-tools 30/38
The Basic Seven (B7)The Basic Seven (B7)
Tools of QualityTools of Quality
Run chartsRun charts
• Time-based (x-axis)Time-based (x-axis)
• CyclicalCyclical
• Look for patternsLook for patterns
8/14/2019 The Basic Seven QC Tools
http://slidepdf.com/reader/full/the-basic-seven-qc-tools 31/38
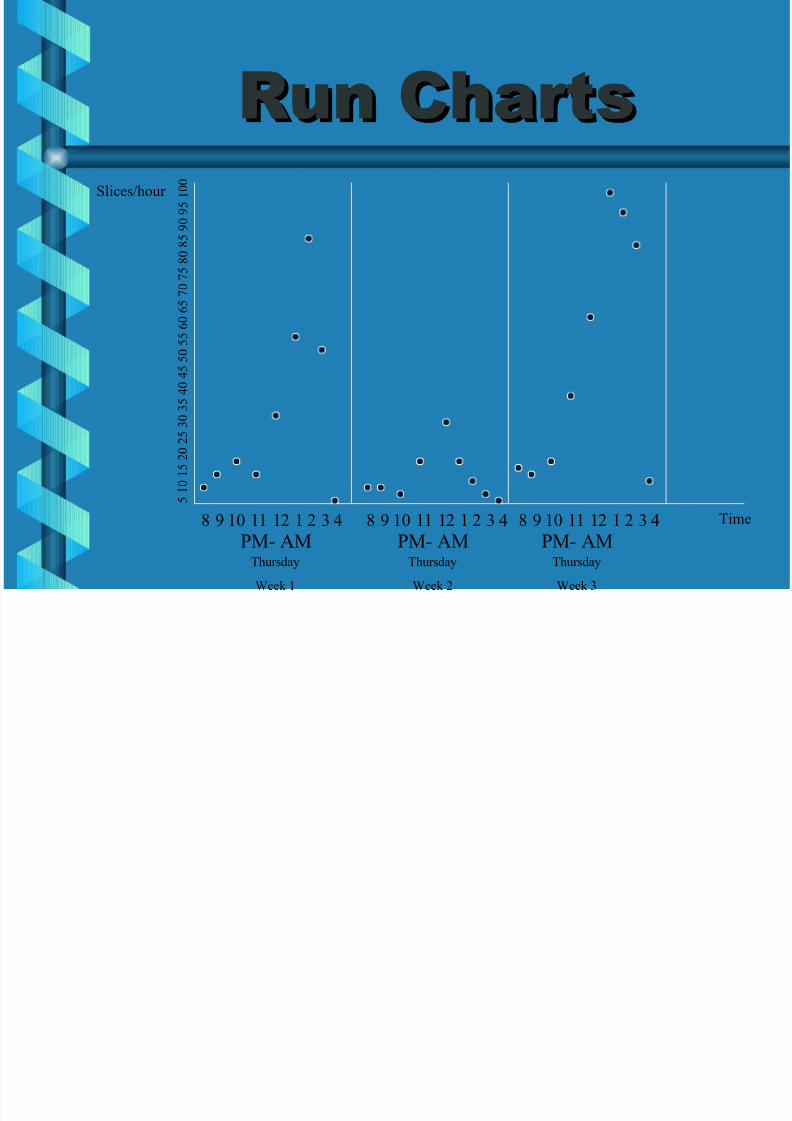
Run ChartsRun Charts
8 9 10 11 12 1 2 3 4 8 9 10 11 12 1 2 3 4 8 9 10 11 12 1 2 3 4
PM- AM PM- AM PM- AMThursday
Week 1
Thursday
Week 2
Thursday
Week 3
5
10
15
20
25
30
35
40
45
50
55
60
65
70
75
80
85
90
95
100
Slices/hour
Time
8/14/2019 The Basic Seven QC Tools
http://slidepdf.com/reader/full/the-basic-seven-qc-tools 32/38
The Basic Seven (B7)The Basic Seven (B7)
Tools of QualityTools of Quality
Control ChartsControl Charts
• Deviation from MeanDeviation from Mean
• Upper and Lower Spec’sUpper and Lower Spec’s
• RangeRange
8/14/2019 The Basic Seven QC Tools
http://slidepdf.com/reader/full/the-basic-seven-qc-tools 33/38
8/14/2019 The Basic Seven QC Tools
http://slidepdf.com/reader/full/the-basic-seven-qc-tools 34/38
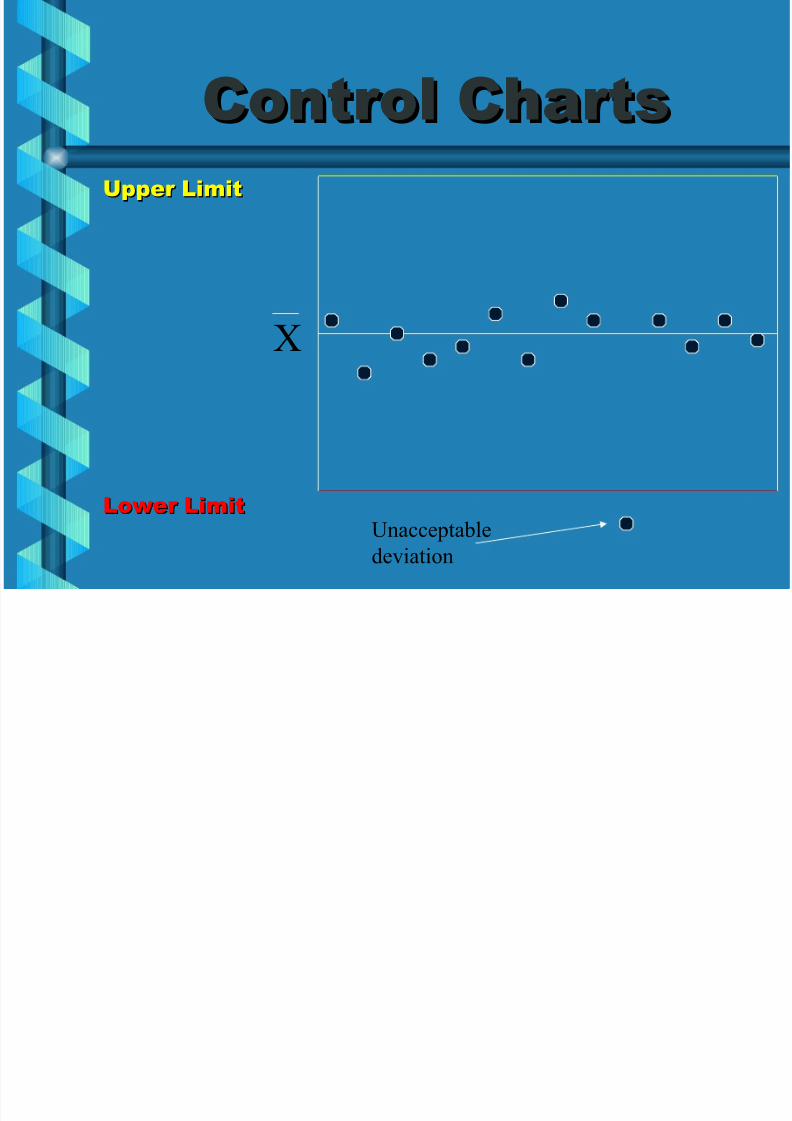
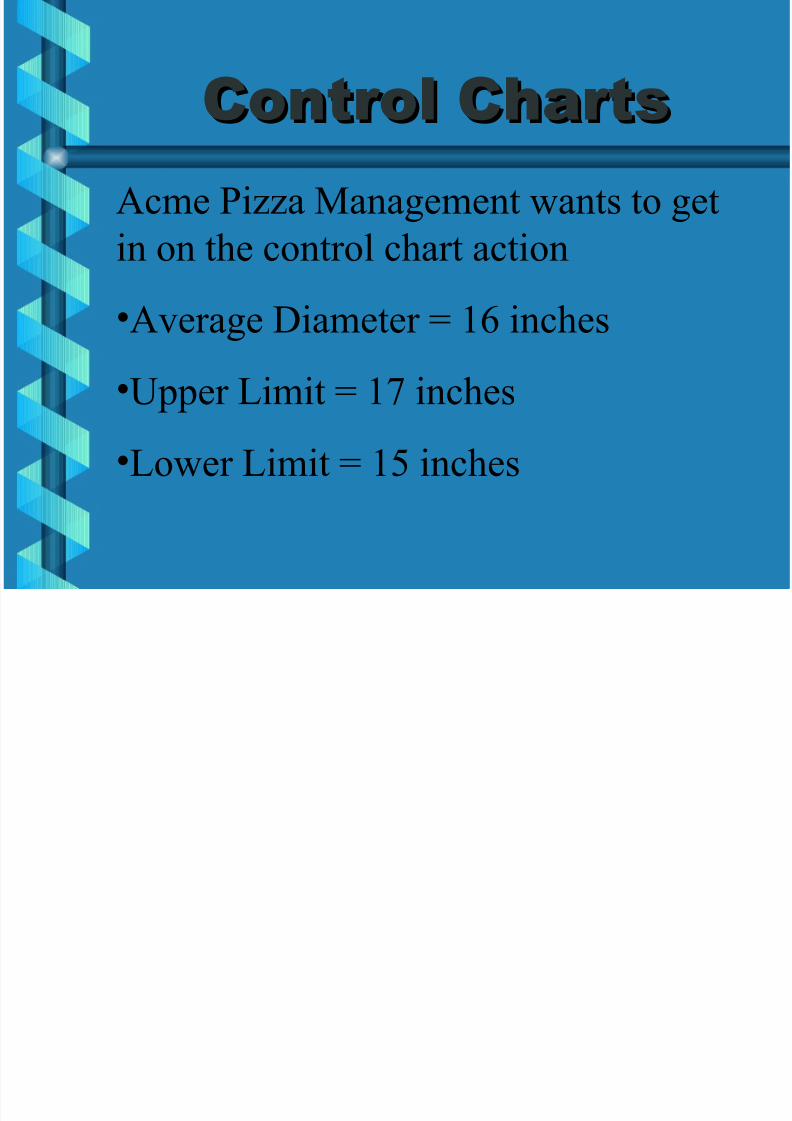
Control ChartsControl Charts
Acme Pizza Management wants to get
in on the control chart action
•Average Diameter = 16 inches
•Upper Limit = 17 inches
•Lower Limit = 15 inches

8/14/2019 The Basic Seven QC Tools
http://slidepdf.com/reader/full/the-basic-seven-qc-tools 35/38
Acme exampleAcme example
Control ChartsControl Charts
Upper LimitUpper Limit
17 inches17 inches
Lower LimitLower Limit
15 Inches15 Inches
Small Pie
X16 inches=

8/14/2019 The Basic Seven QC Tools
http://slidepdf.com/reader/full/the-basic-seven-qc-tools 36/38
Acme example #50Acme example #50
Control ChartsControl Charts
•Pies within specifications were
acceptable
•One abnormally small pie is
“uncommon”
•Should be examined for quality control
8/14/2019 The Basic Seven QC Tools
http://slidepdf.com/reader/full/the-basic-seven-qc-tools 37/38
SummarySummary
• Basic Seven Tools of QualityBasic Seven Tools of Quality
• Measuring dataMeasuring data
•Quality AnalysisQuality Analysis
• ““Democratized statistics”Democratized statistics”
8/14/2019 The Basic Seven QC Tools
http://slidepdf.com/reader/full/the-basic-seven-qc-tools 38/38
BibliographyBibliography
• Foster, Thomas.Foster, Thomas. Managing Quality. An IntegrativeManaging Quality. An IntegrativeApproachApproach. Upper Saddle River : Prentice Hall,. Upper Saddle River : Prentice Hall, 2001.2001.
• Stevenson, William. “Supercharging Your ParetoStevenson, William. “Supercharging Your ParetoAnalysis.”Analysis.” Quality ProgressQuality Progress October 2000:October 2000:51-55.51-55.
• ““Dr Ka oru Is hik aw a.” In terne tr Ka oru Is hik aw a.” In terne t“http://www.dti.gov.uk/mbp/bpgt/m9ja00001/m9j“http://www.dti.gov.uk/mbp/bpgt/m9ja00001/m9j
a0000110.html.” 16 February 2001.a0000110.html.” 16 February 2001.
• ““Chemical and Process Engineering.” Internet.Chemical and Process Engineering.” Internet.“http://lorien.ncl.ac.uk/ming/spc/spc8.htm.” 17“http://lorien.ncl.ac.uk/ming/spc/spc8.htm.” 17 FebruaryFebruary2001.2001.
Related Documents