The Barclays Data Science Hackathon: Building Retail Recommender Systems based on Customer Shopping Behavior Gianmario Spacagna @gm_spacagna Data Science Milan meetup, 13 July 2016

The Barclays Data Science Hackathon: Building Retail Recommender Systems based on Customer Shopping Behaviour - Gianmario Spacagna, Pirelli
Apr 16, 2017
Welcome message from author
This document is posted to help you gain knowledge. Please leave a comment to let me know what you think about it! Share it to your friends and learn new things together.
Transcript
The Barclays Data Science Hackathon:
Building Retail Recommender Systems based on Customer Shopping Behavior GianmarioSpacagna@gm_spacagna
DataScienceMilanmeetup,13July2016
The Barclays Data Science Team • Retail Business Banking division based in the HQ
(Canary Wharf, London)
• Back in time (Dec 2015) was 6 members: Head + mix of (engineering and machine learning) specialists
• Goal: building data-driven applications such as: – Insights Engine for small businesses – Complaints NLP analytics – Mortgage predictive models – Pricing optimisation – Graph fraud detection – and so on...
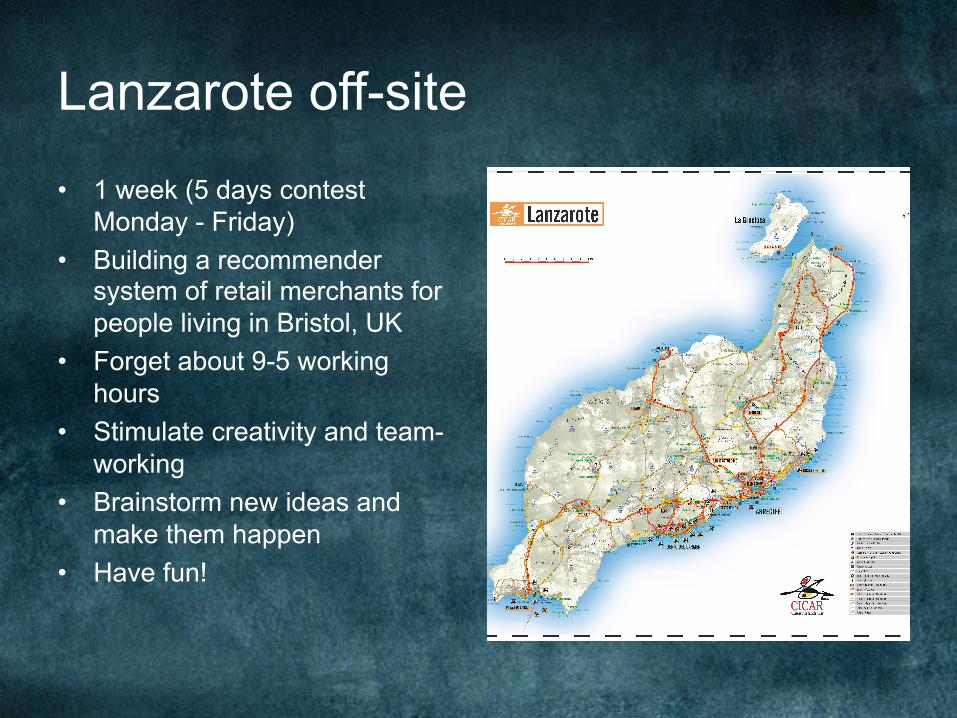
Lanzarote off-site
• 1 week (5 days contest Monday - Friday)
• Building a recommender system of retail merchants for people living in Bristol, UK
• Forget about 9-5 working hours
• Stimulate creativity and team-working
• Brainstorm new ideas and make them happen
• Have fun!

The technical challenges
• No infrastructure available, only laptops and a 1G WiFi shared Internet connection.
• Build, test, and refactor quickly, no time for long end-to-end evaluations.
• Work with common structures without constraining individual initiative and innovation.
• Design for deployment to production on a multi-tenant cluster.
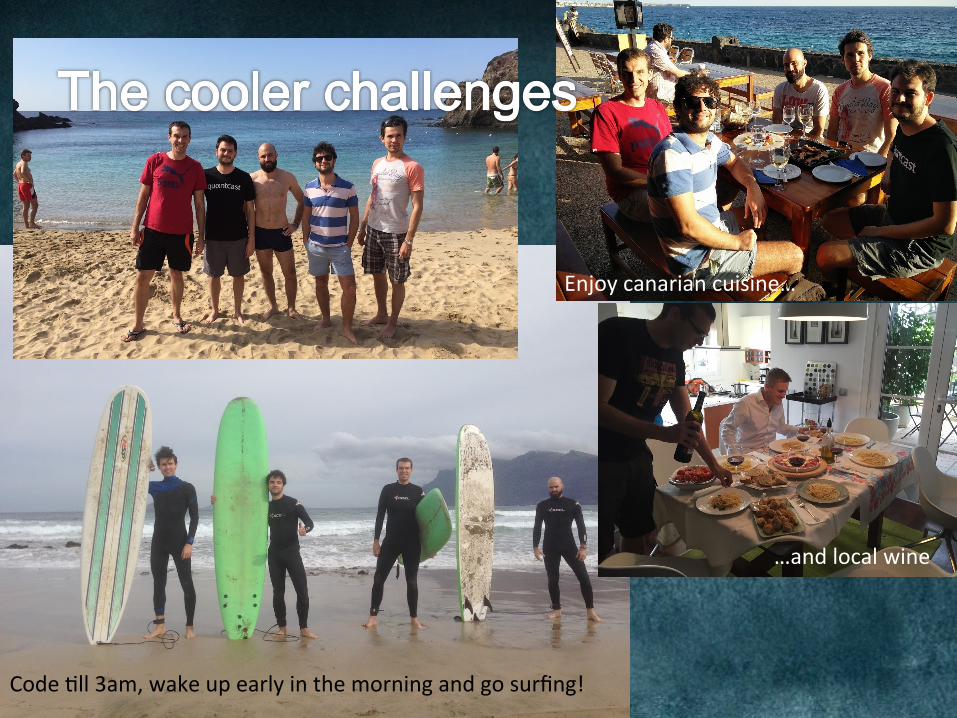
Code@ll3am,wakeupearlyinthemorningandgosurfing!
Enjoycanariancuisine…
…andlocalwine

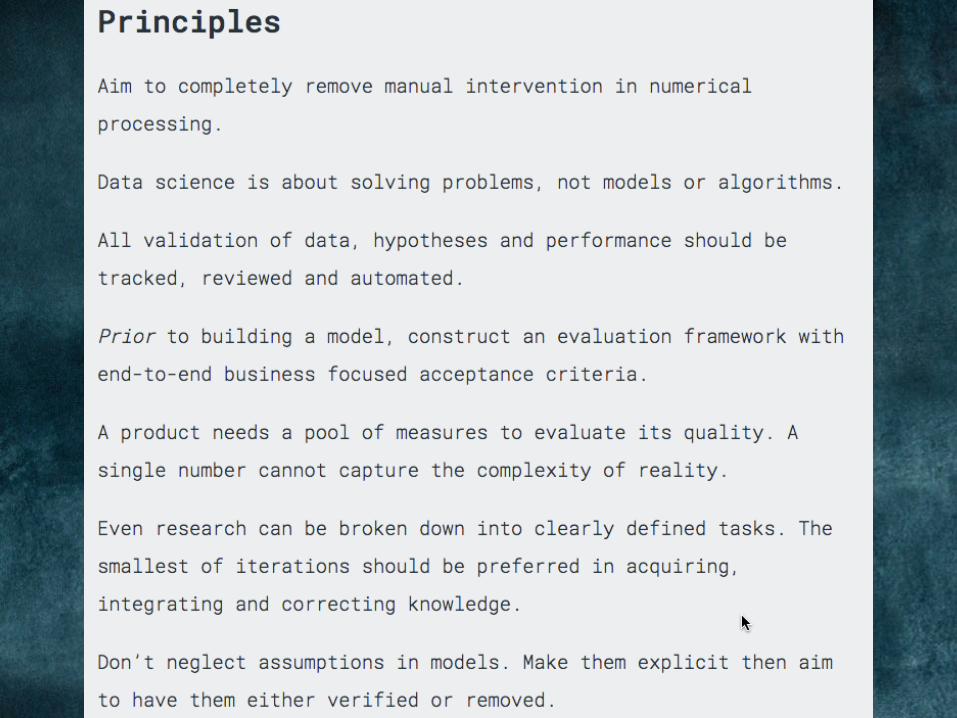
The Professional Data Science Manifesto work in progress…
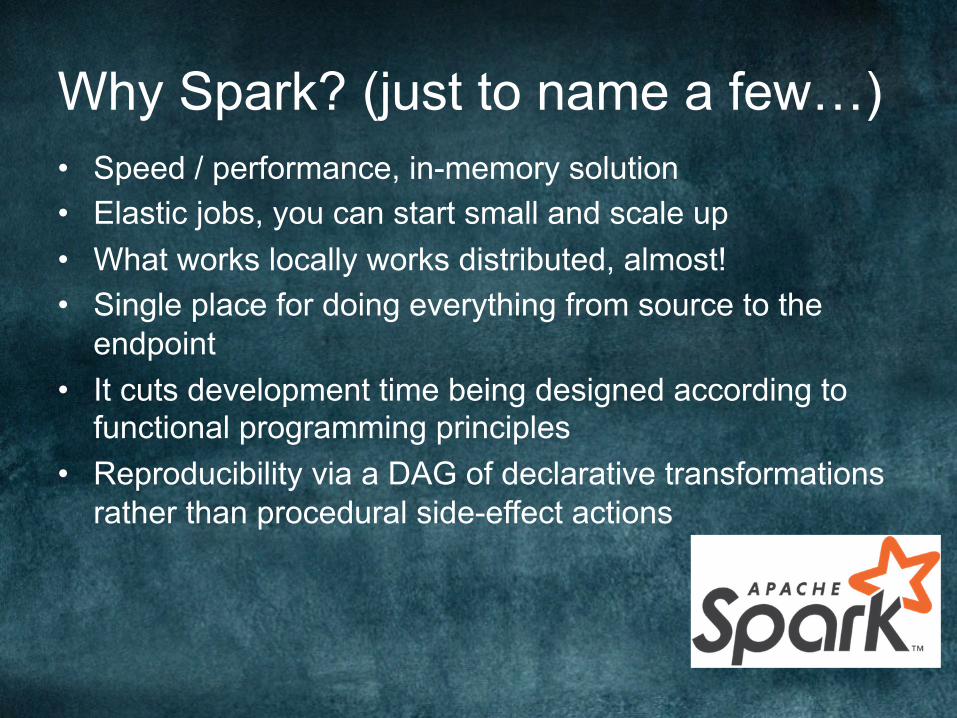
Why Spark? (just to name a few…) • Speed / performance, in-memory solution • Elastic jobs, you can start small and scale up • What works locally works distributed, almost! • Single place for doing everything from source to the
endpoint • It cuts development time being designed according to
functional programming principles • Reproducibility via a DAG of declarative transformations
rather than procedural side-effect actions
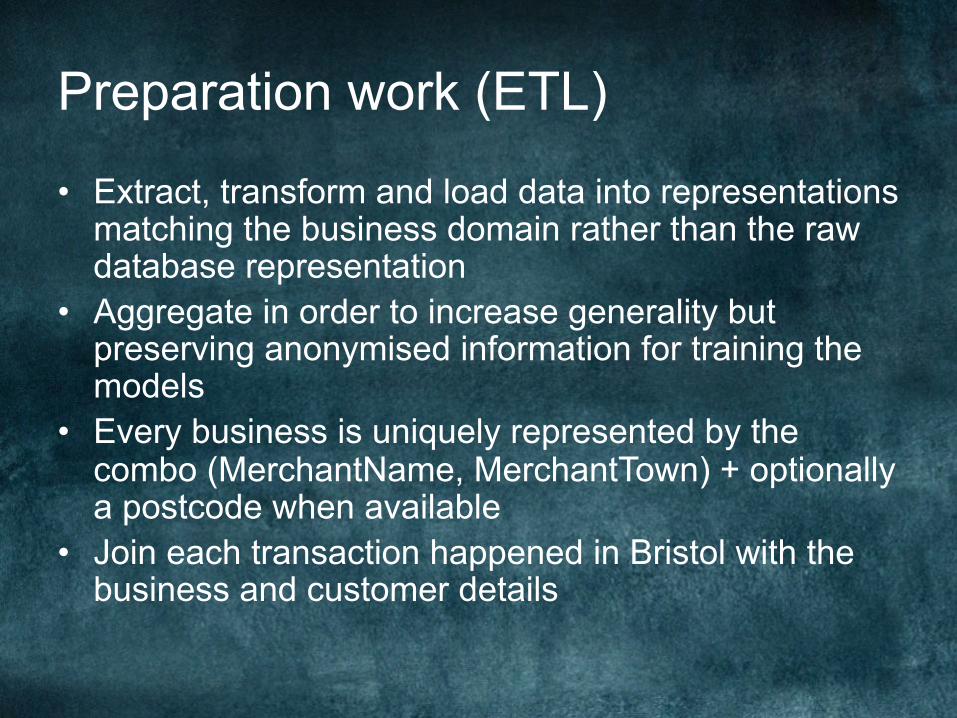
Preparation work (ETL)
• Extract, transform and load data into representations matching the business domain rather than the raw database representation
• Aggregate in order to increase generality but preserving anonymised information for training the models
• Every business is uniquely represented by the combo (MerchantName, MerchantTown) + optionally a postcode when available
• Join each transaction happened in Bristol with the business and customer details
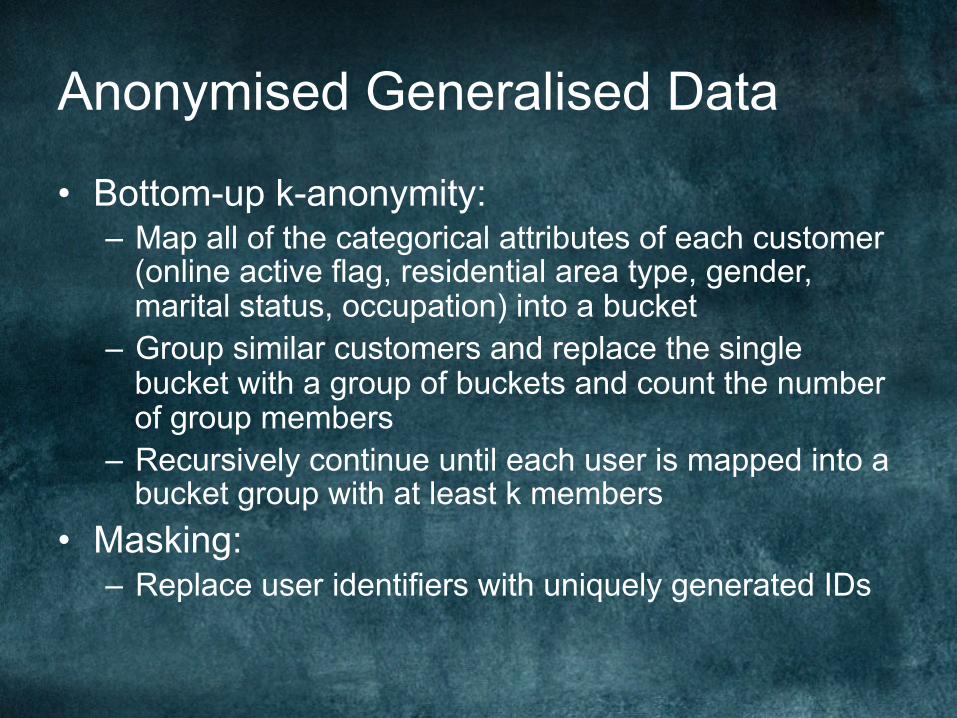
Anonymised Generalised Data
• Bottom-up k-anonymity: – Map all of the categorical attributes of each customer
(online active flag, residential area type, gender, marital status, occupation) into a bucket
– Group similar customers and replace the single bucket with a group of buckets and count the number of group members
– Recursively continue until each user is mapped into a bucket group with at least k members
• Masking: – Replace user identifiers with uniquely generated IDs
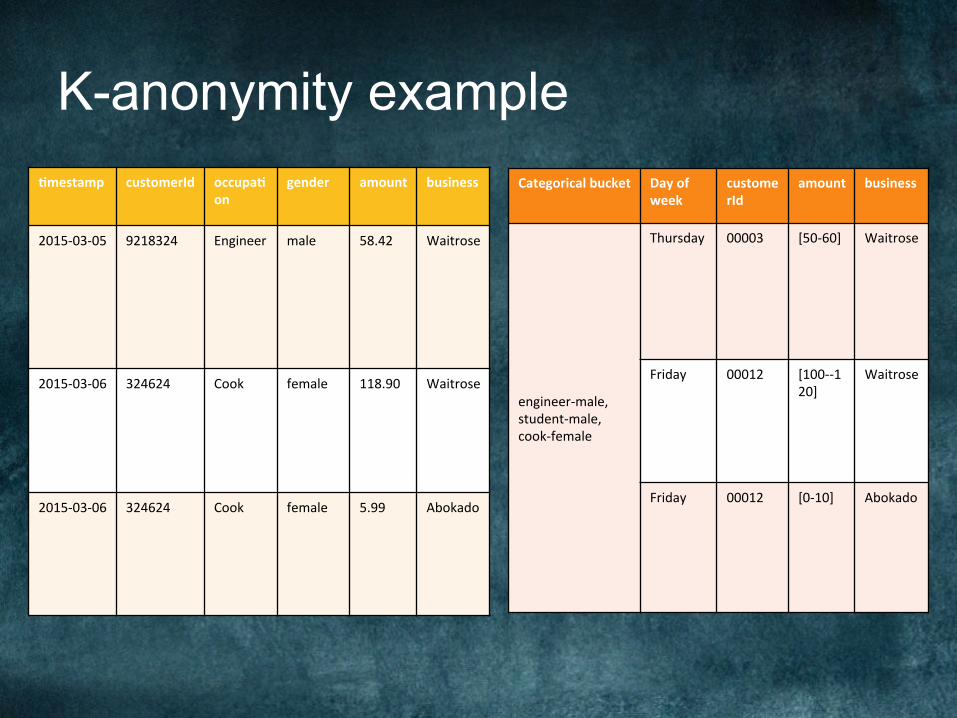
K-anonymity example !mestamp customerId occupa!
ongender amount business
2015-03-05 9218324 Engineer male 58.42 Waitrose
2015-03-06 324624 Cook female 118.90 Waitrose
2015-03-06
324624 Cook female 5.99 Abokado
Categoricalbucket Dayofweek
customerId
amount business
engineer-male,student-male,cook-female
Thursday 00003 [50-60] Waitrose
Friday 00012 [100--120]
Waitrose
Friday 00012 [0-10] Abokado
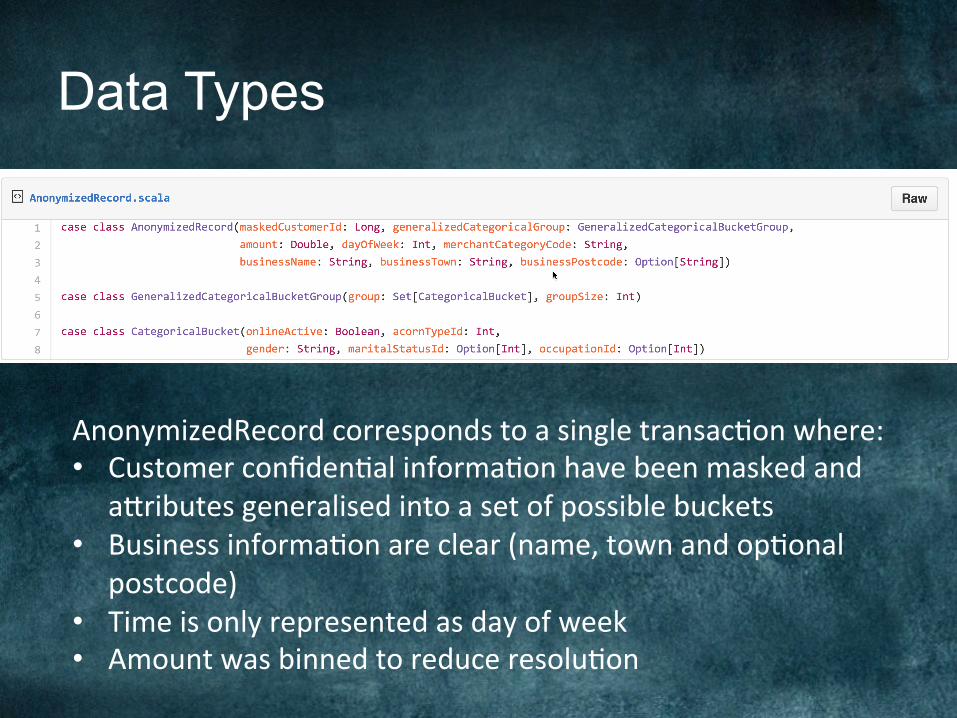
Data Types
AnonymizedRecordcorrespondstoasingletransac@onwhere:• Customerconfiden@alinforma@onhavebeenmaskedand
a[ributesgeneralisedintoasetofpossiblebuckets• Businessinforma@onareclear(name,townandop@onal
postcode)• Timeisonlyrepresentedasdayofweek• Amountwasbinnedtoreduceresolu@on
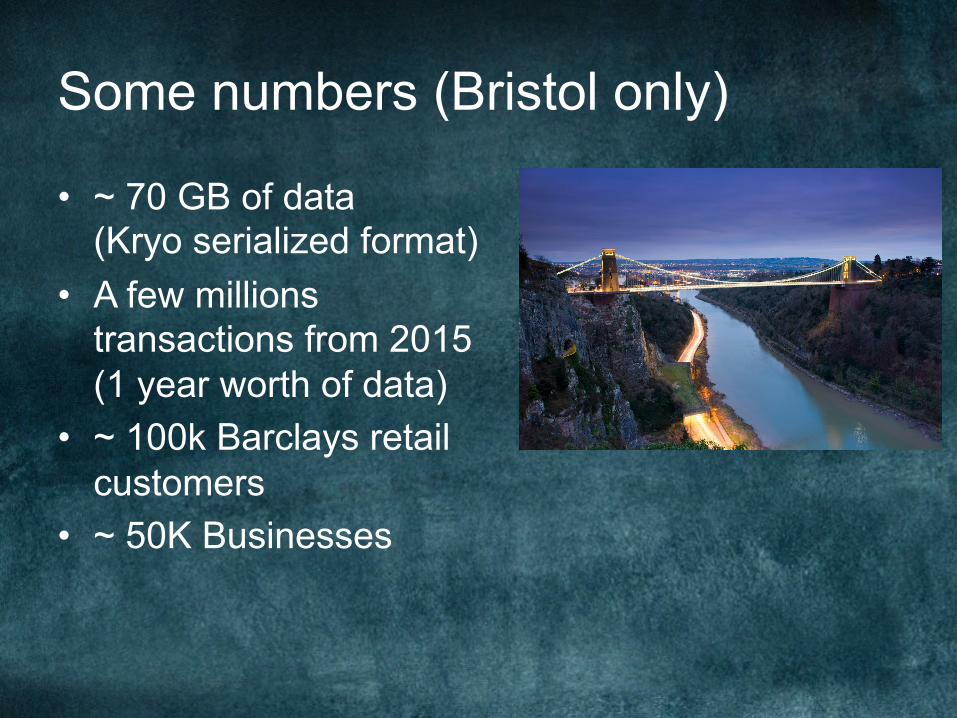
Some numbers (Bristol only)
• ~ 70 GB of data (Kryo serialized format)
• A few millions transactions from 2015 (1 year worth of data)
• ~ 100k Barclays retail customers
• ~ 50K Businesses
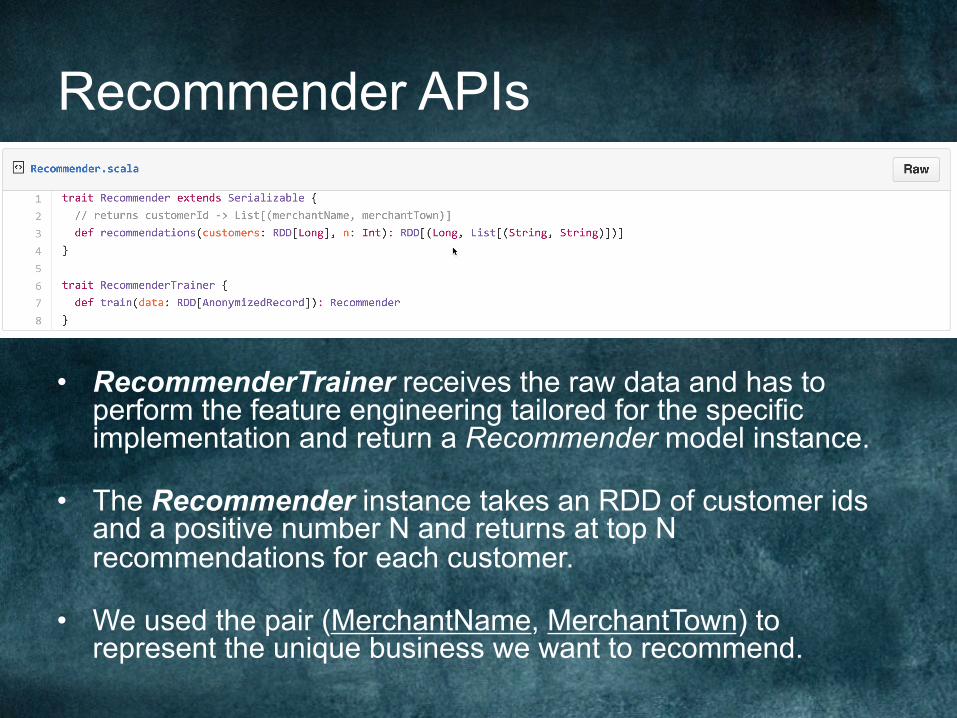
Recommender APIs
• RecommenderTrainer receives the raw data and has to perform the feature engineering tailored for the specific implementation and return a Recommender model instance.
• The Recommender instance takes an RDD of customer ids and a positive number N and returns at top N recommendations for each customer.
• We used the pair (MerchantName, MerchantTown) to represent the unique business we want to recommend.

Thoughts on Efficient Spark Programming (Vancouver Spark Meetup 03-09-2015) http://www.slideshare.net/nielsh1/thoughts-on-efficient-spark-programming-vancouver-spark-meetup-03092015
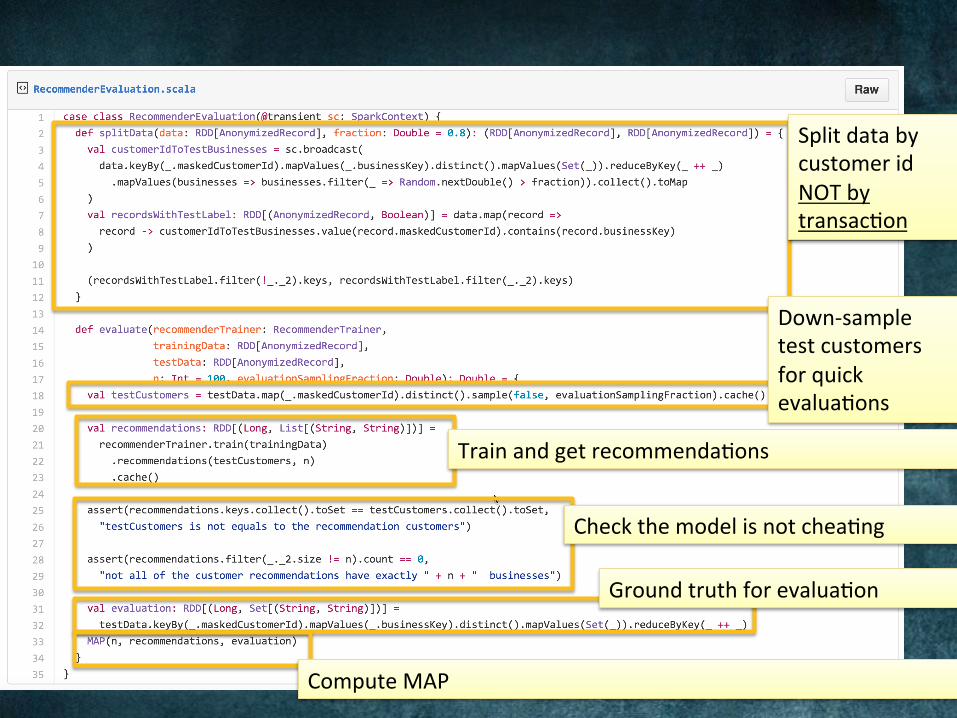
SplitdatabycustomeridNOTbytransac@on
Down-sampletestcustomersforquickevalua@ons
Trainandgetrecommenda@ons
Checkthemodelisnotchea@ng
Groundtruthforevalua@on
ComputeMAP
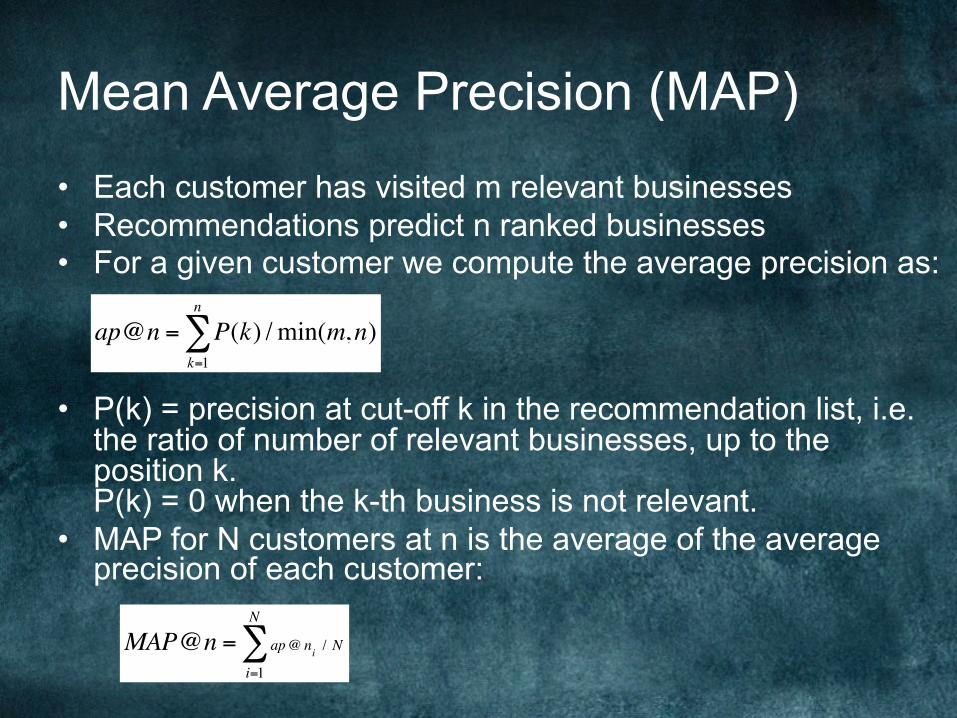
Mean Average Precision (MAP) • Each customer has visited m relevant businesses • Recommendations predict n ranked businesses • For a given customer we compute the average precision as:
• P(k) = precision at cut-off k in the recommendation list, i.e. the ratio of number of relevant businesses, up to the position k. P(k) = 0 when the k-th business is not relevant.
• MAP for N customers at n is the average of the average precision of each customer:
ap@n = P(k) / min(m,n)k=1
n
∑
MAP@n = ap@ ni / N
i=1
N
∑
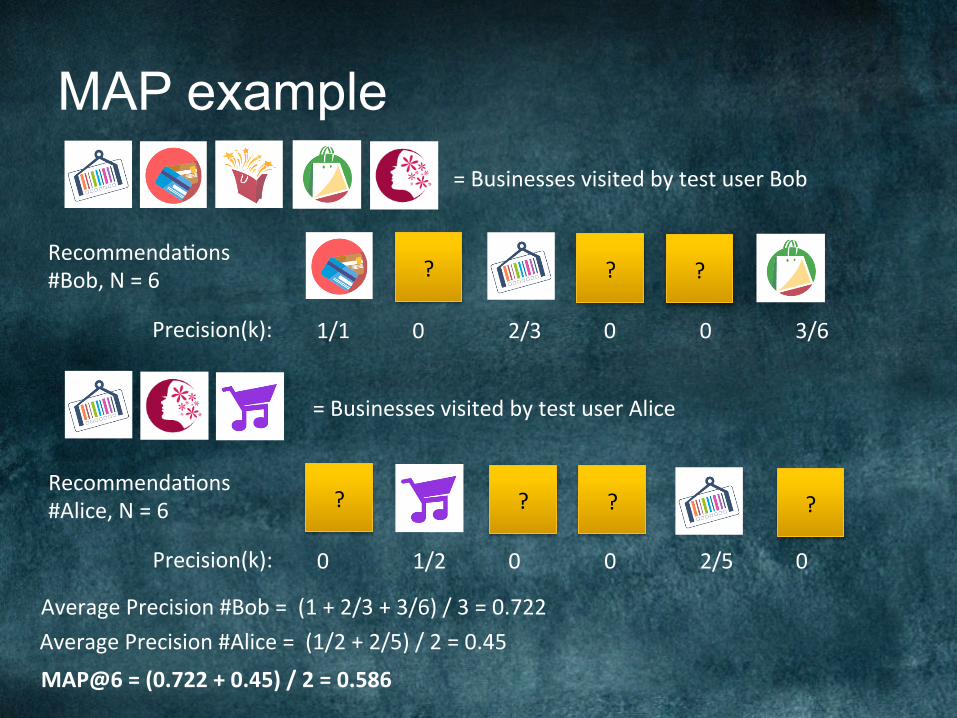
MAP example =BusinessesvisitedbytestuserBob
? ? ?Recommenda@ons#Bob,N=6
Precision(k): 1/1 0 2/3 0 0 3/6
AveragePrecision#Bob=(1+2/3+3/6)/3=0.722AveragePrecision#Alice=(1/2+2/5)/2=0.45
MAP@6=(0.722+0.45)/2=0.586
=BusinessesvisitedbytestuserAlice
? ?Recommenda@ons#Alice,N=6
Precision(k): 0 1/2 0 0 2/5 0
? ?
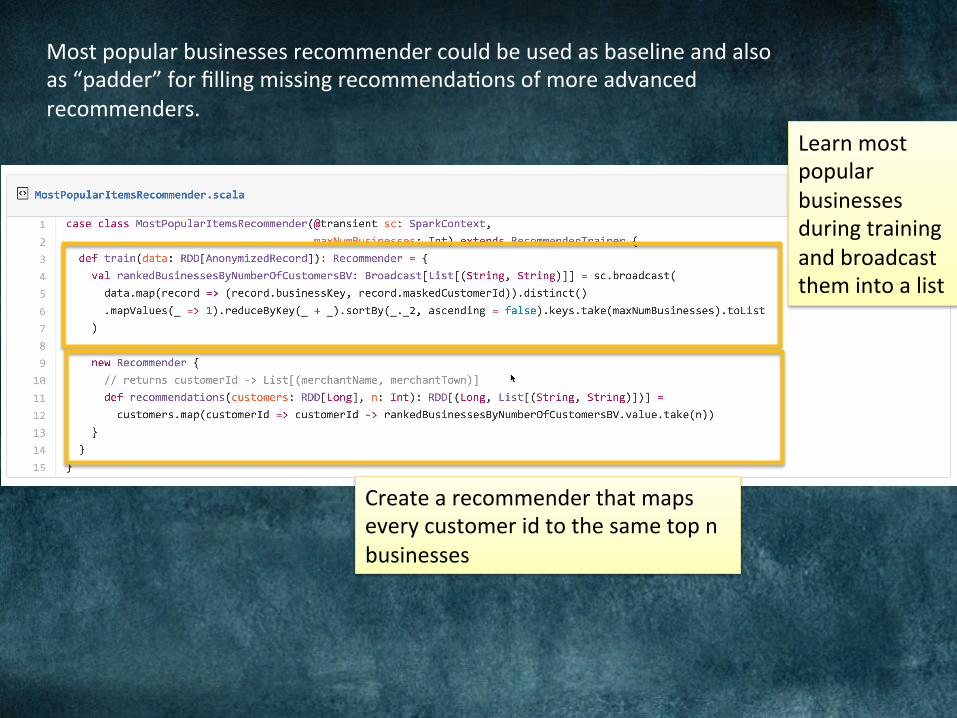
Most Popular Businesses
Learnmostpopularbusinessesduringtrainingandbroadcastthemintoalist
Createarecommenderthatmapseverycustomeridtothesametopnbusinesses
Mostpopularbusinessesrecommendercouldbeusedasbaselineandalsoas“padder”forfillingmissingrecommenda@onsofmoreadvancedrecommenders.
CUSTOMER-TO-CUSTOMER SIMILARITY MODELS
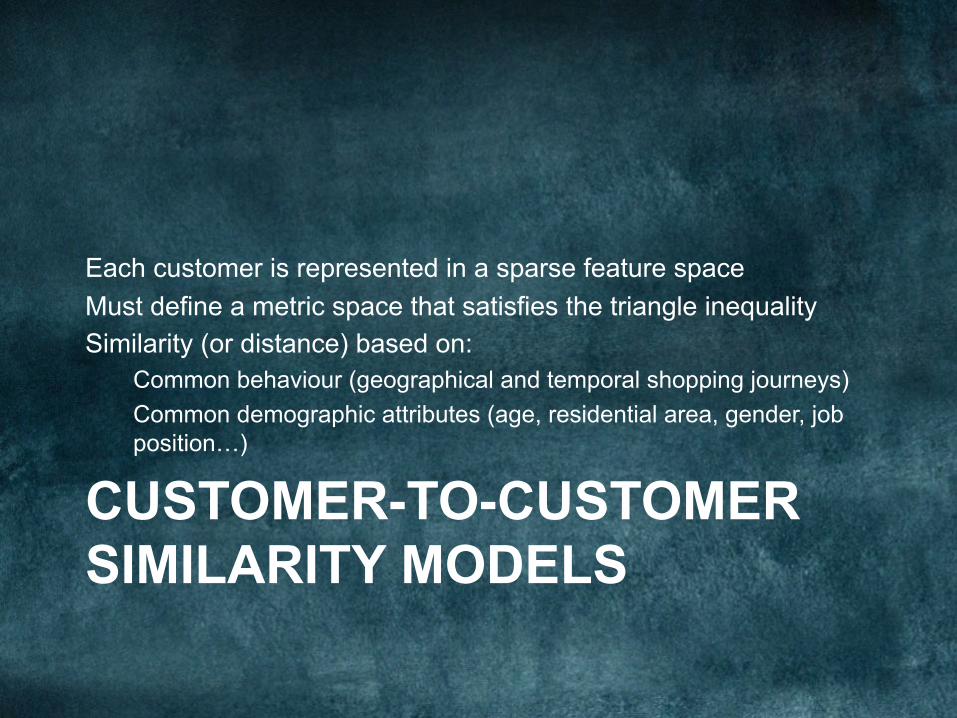
Each customer is represented in a sparse feature space Must define a metric space that satisfies the triangle inequality Similarity (or distance) based on:
Common behaviour (geographical and temporal shopping journeys) Common demographic attributes (age, residential area, gender, job position…)
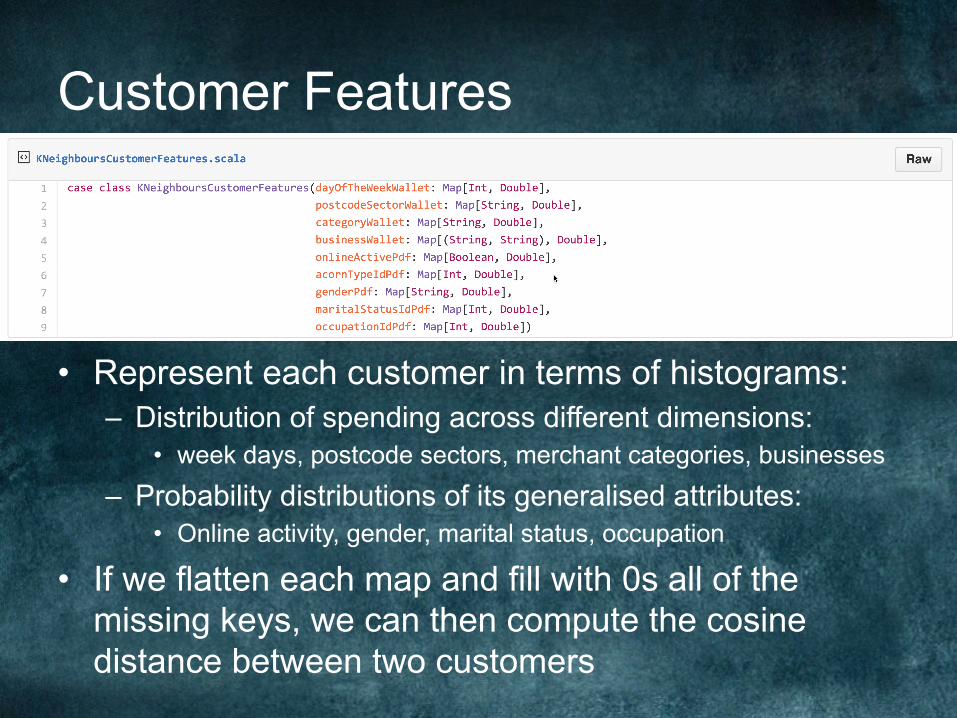
Customer Features
• Represent each customer in terms of histograms: – Distribution of spending across different dimensions:
• week days, postcode sectors, merchant categories, businesses
– Probability distributions of its generalised attributes: • Online activity, gender, marital status, occupation
• If we flatten each map and fill with 0s all of the missing keys, we can then compute the cosine distance between two customers
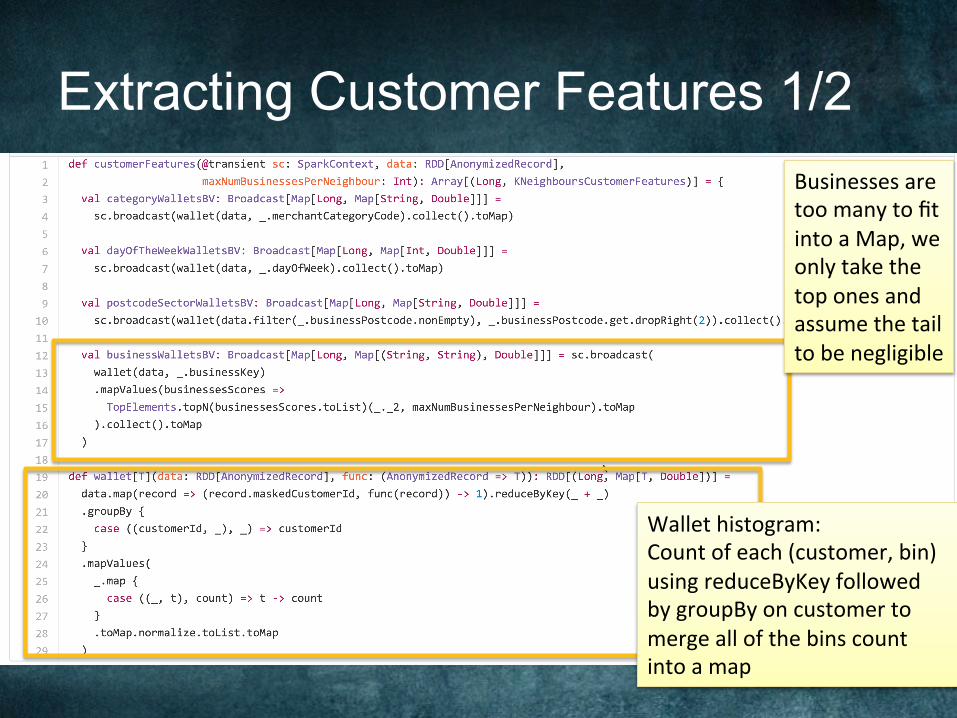
Extracting Customer Features 1/2 BusinessesaretoomanytofitintoaMap,weonlytakethetoponesandassumethetailtobenegligible
Wallethistogram:Countofeach(customer,bin)usingreduceByKeyfollowedbygroupByoncustomertomergeallofthebinscountintoamap
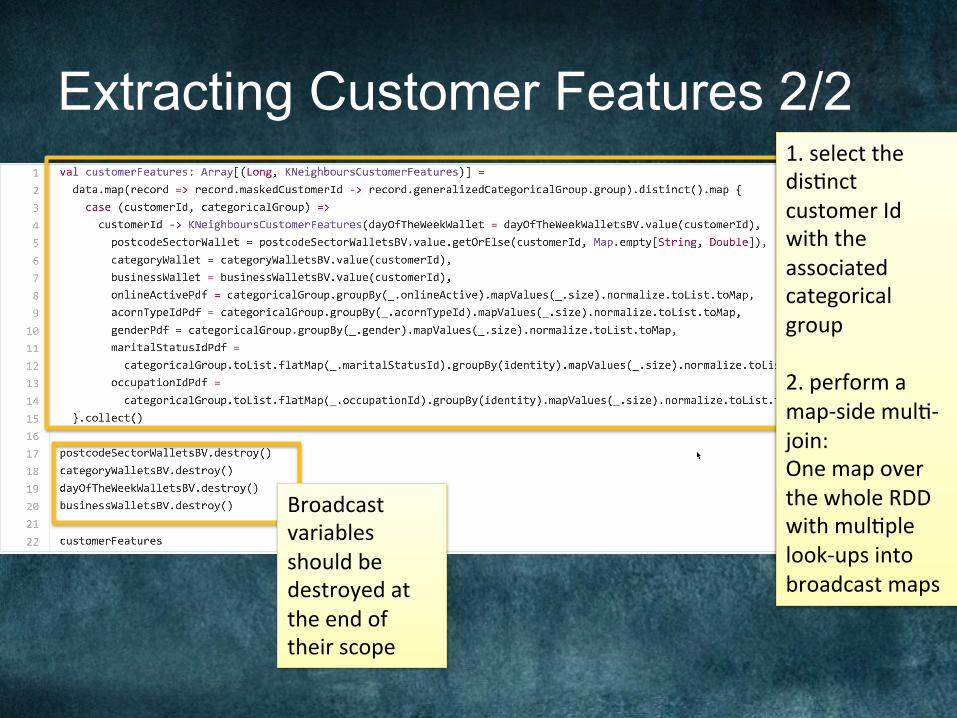
Extracting Customer Features 2/2
Broadcastvariablesshouldbedestroyedattheendoftheirscope
1.selectthedis@nctcustomerIdwiththeassociatedcategoricalgroup2.performamap-sidemul@-join:OnemapoverthewholeRDDwithmul@plelook-upsintobroadcastmaps
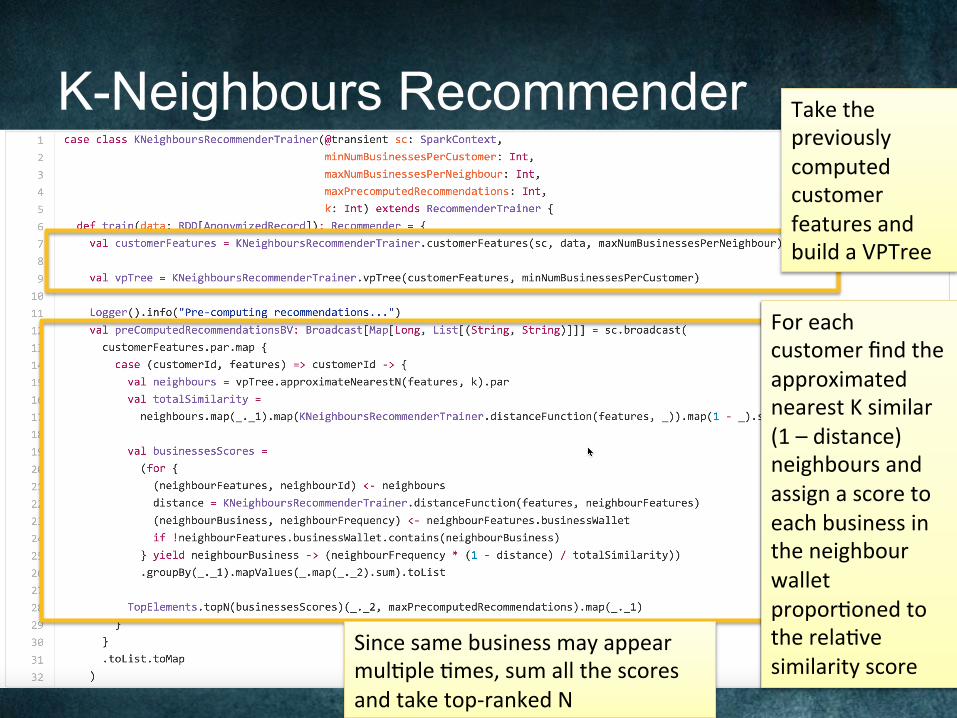
K-Neighbours Recommender TakethepreviouslycomputedcustomerfeaturesandbuildaVPTree
ForeachcustomerfindtheapproximatednearestKsimilar(1–distance)neighboursandassignascoretoeachbusinessintheneighbourwalletpropor@onedtotherela@vesimilarityscore
Sincesamebusinessmayappearmul@ple@mes,sumallthescoresandtaketop-rankedN
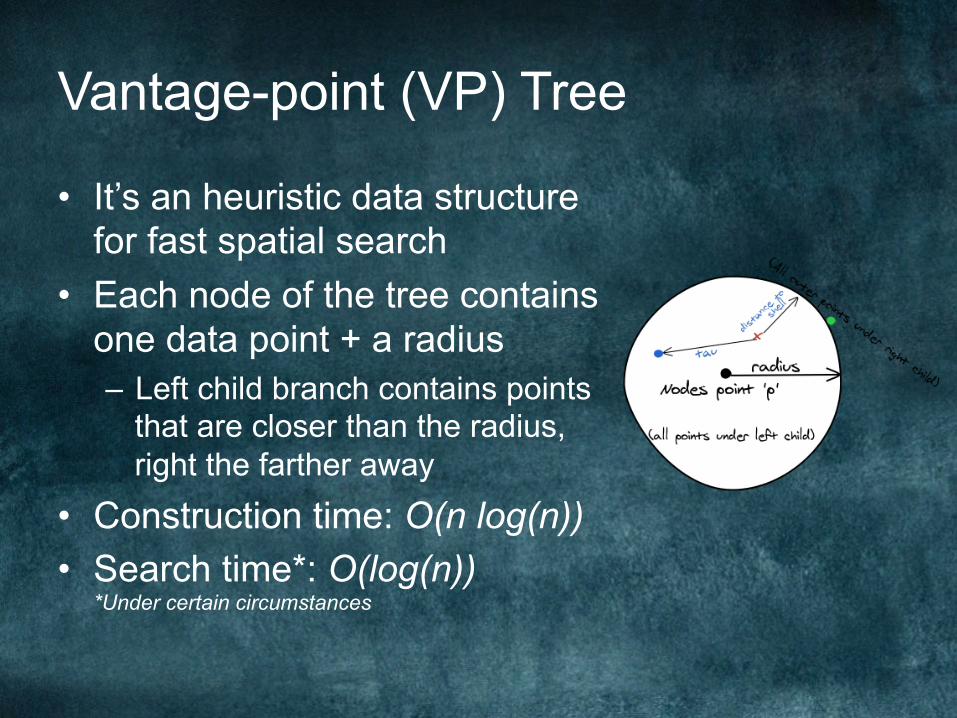
Vantage-point (VP) Tree
• It’s an heuristic data structure for fast spatial search
• Each node of the tree contains one data point + a radius – Left child branch contains points
that are closer than the radius, right the farther away
• Construction time: O(n log(n)) • Search time*: O(log(n))
*Under certain circumstances
BUSINESS-TO-BUSINESS SIMILARITY MODELS
Similarity metric based on the portion of common customers
Conditional probability Tanimoto Coefficient
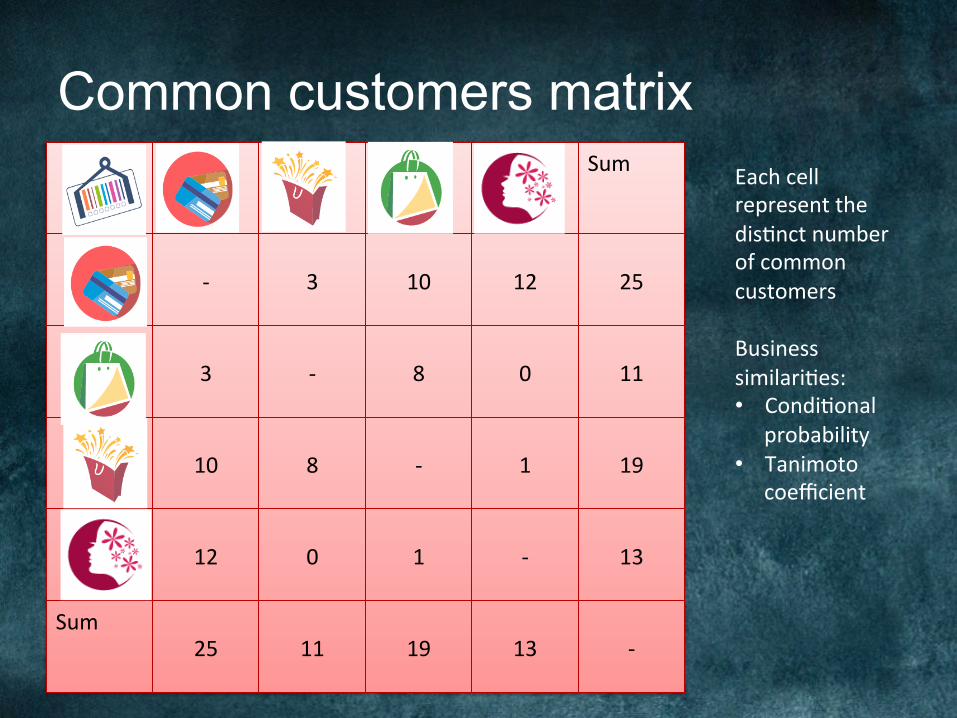
Common customers matrix Sum
- 3 10 12 25
3 - 8 0 11
10 8 - 1 19
12 0 1 - 13
Sum25 11 19 13 -
Eachcellrepresentthedis@nctnumberofcommoncustomersBusinesssimilari@es:• Condi@onal
probability• Tanimoto
coefficient
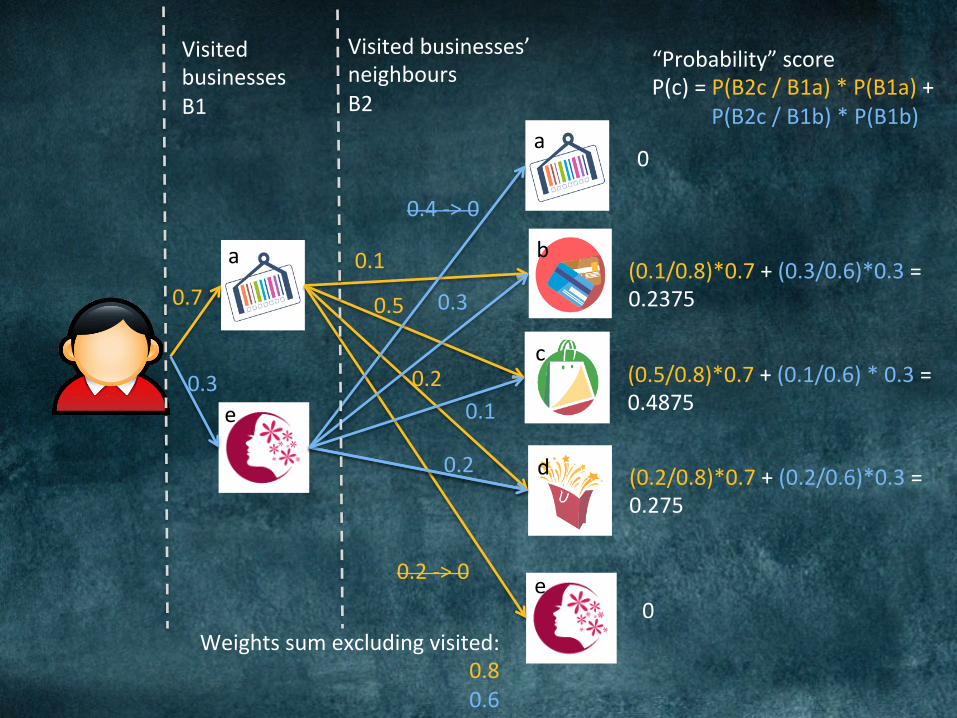
0.7
0.3
0.1
0.5
0.2
0
0.2->0
0.4->0
0.3
0.1
0.2
VisitedbusinessesB1
Visitedbusinesses’neighboursB2
Weightssumexcludingvisited:0.80.6
“Probability”scoreP(c)=P(B2c/B1a)*P(B1a)+P(B2c/B1b)*P(B1b)
(0.1/0.8)*0.7+(0.3/0.6)*0.3=0.2375
(0.5/0.8)*0.7+(0.1/0.6)*0.3=0.4875
(0.2/0.8)*0.7+(0.2/0.6)*0.3=0.275
0
a
a
b
c
d
e
e
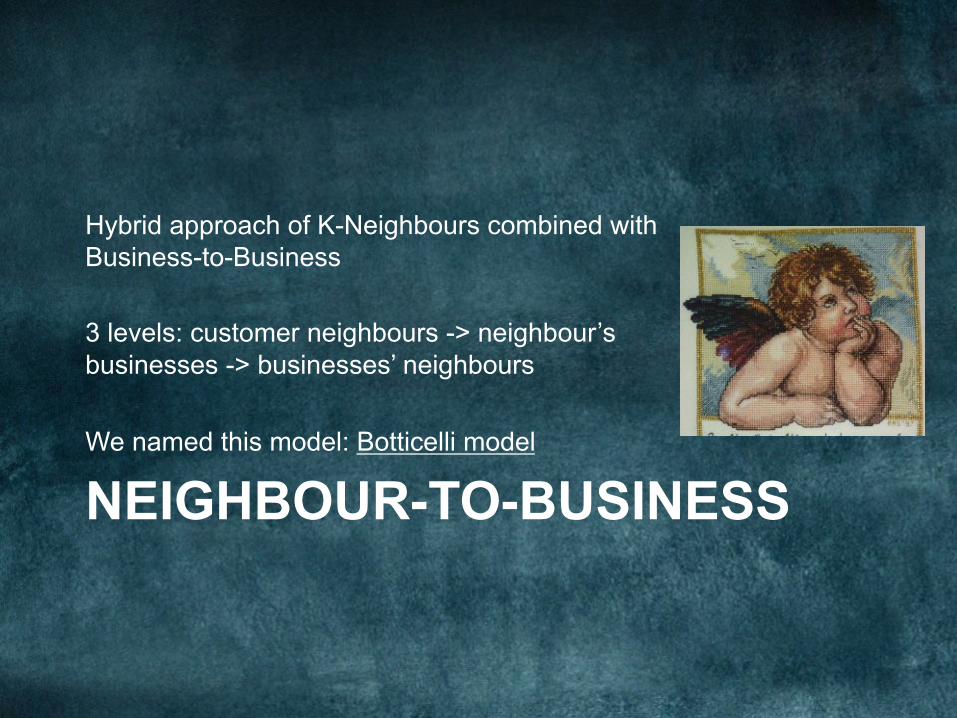
NEIGHBOUR-TO-BUSINESS
Hybrid approach of K-Neighbours combined with Business-to-Business 3 levels: customer neighbours -> neighbour’s businesses -> businesses’ neighbours We named this model: Botticelli model
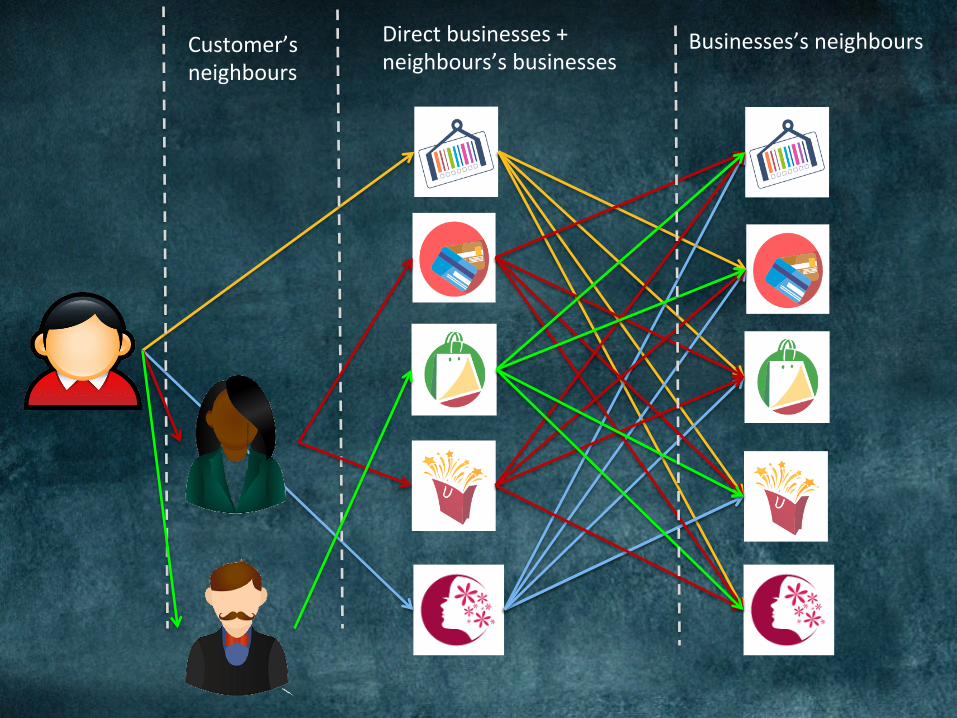
Customer’sneighbours
Directbusinesses+neighbours’sbusinesses
Businesses’sneighbours
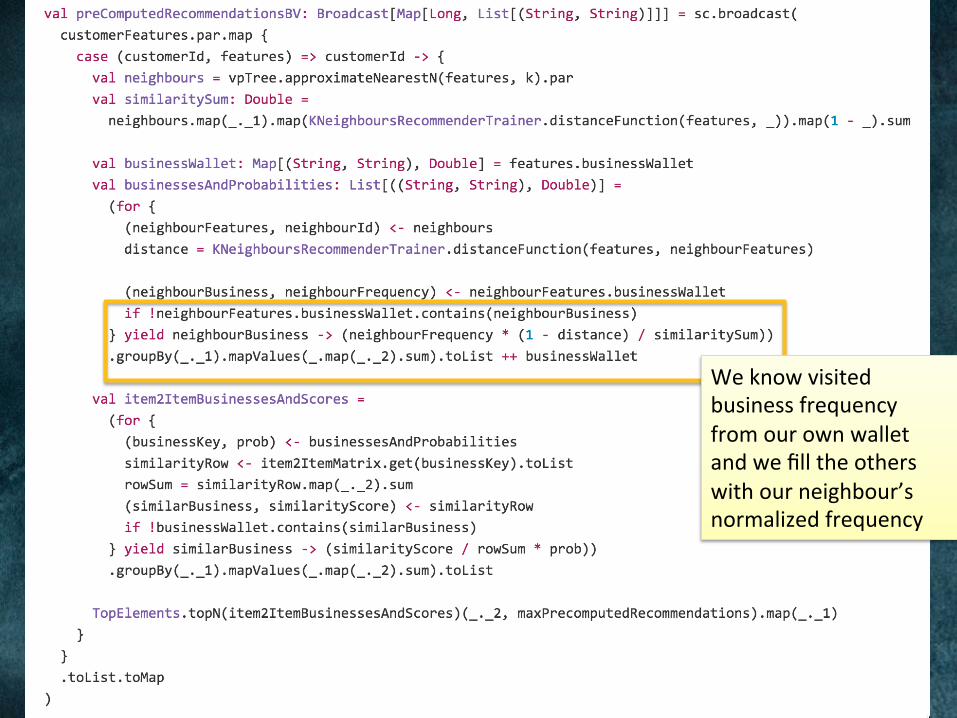
Weknowvisitedbusinessfrequencyfromourownwalletandwefilltheotherswithourneighbour’snormalizedfrequency
MATRIX FACTORIZATION MODELS
Factorize the transaction matrix of Customer-to-Business into 2 matrices of Customer-to-Topic and Topic-to-Business (e.g. LSA, SVD…) Recommendations are done by applying linear algebra
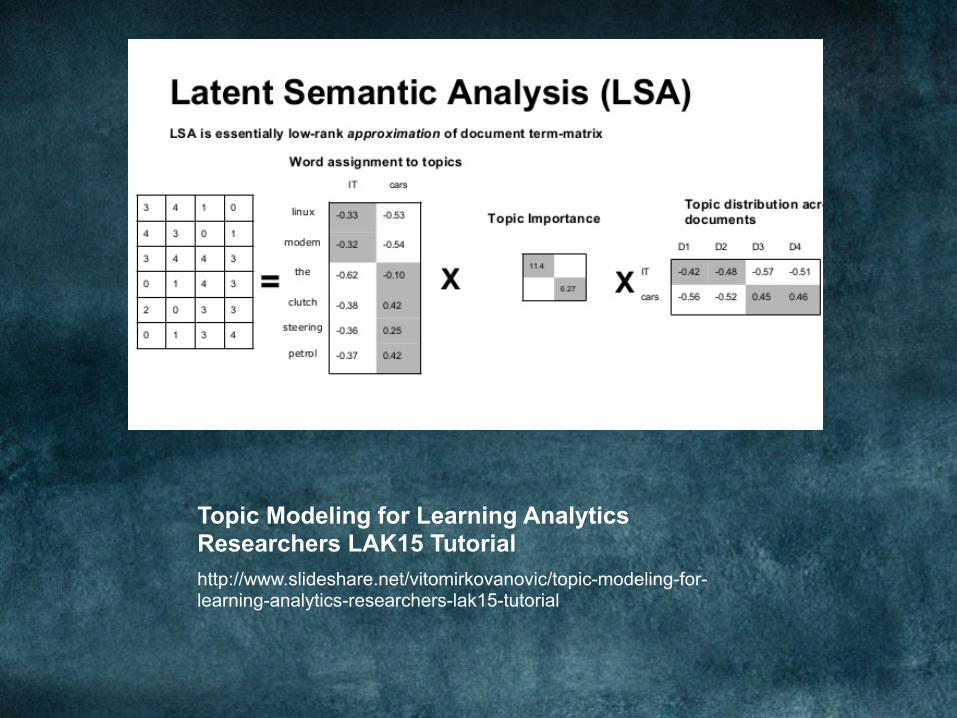
Topic Modeling for Learning Analytics Researchers LAK15 Tutorial http://www.slideshare.net/vitomirkovanovic/topic-modeling-for-learning-analytics-researchers-lak15-tutorial
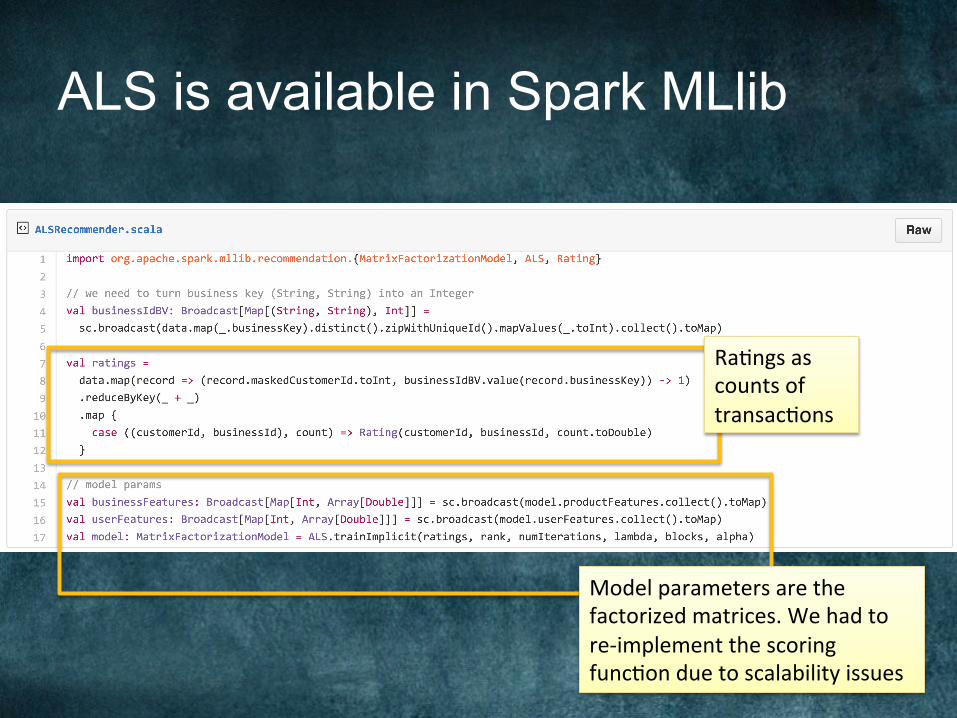
ALS is available in Spark MLlib
Ra@ngsascountsoftransac@ons
Modelparametersarethefactorizedmatrices.Wehadtore-implementthescoringfunc@onduetoscalabilityissues

Recommendation scores produced by multiplying vectors
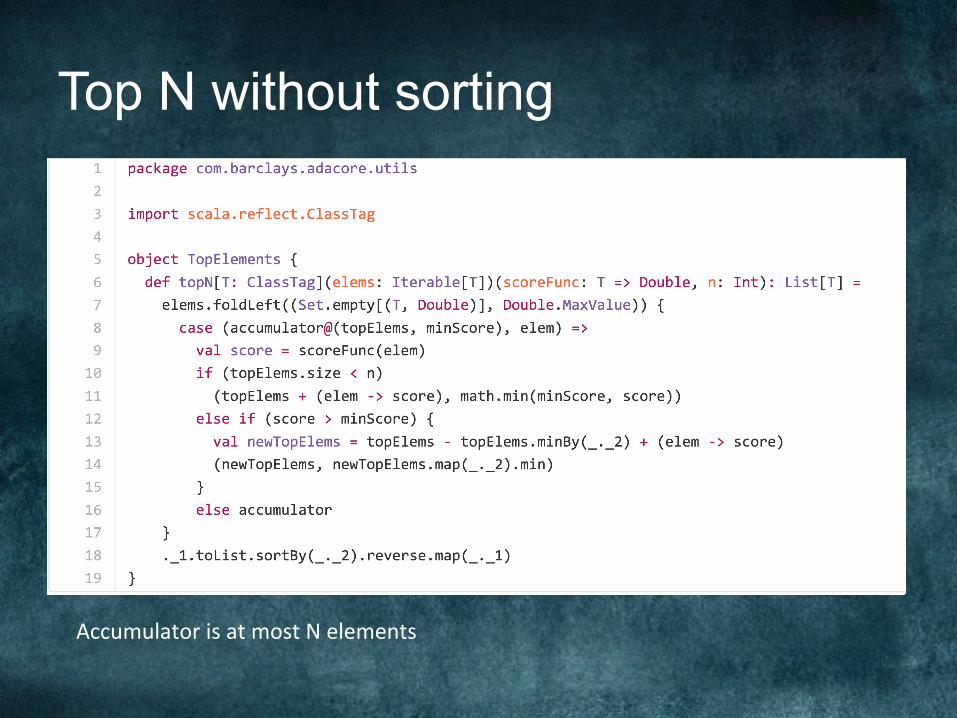
Top N without sorting
AccumulatorisatmostNelements
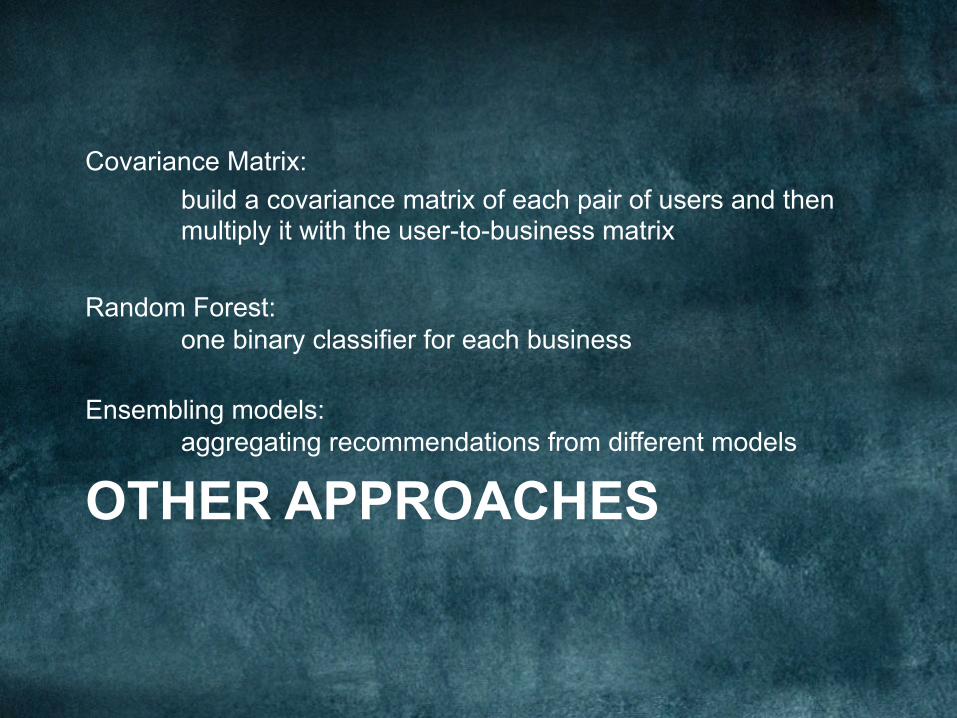
OTHER APPROACHES
Covariance Matrix: build a covariance matrix of each pair of users and then multiply it with the user-to-business matrix
Random Forest:
one binary classifier for each business Ensembling models:
aggregating recommendations from different models

SUMMARY AND CONCLUSIONS
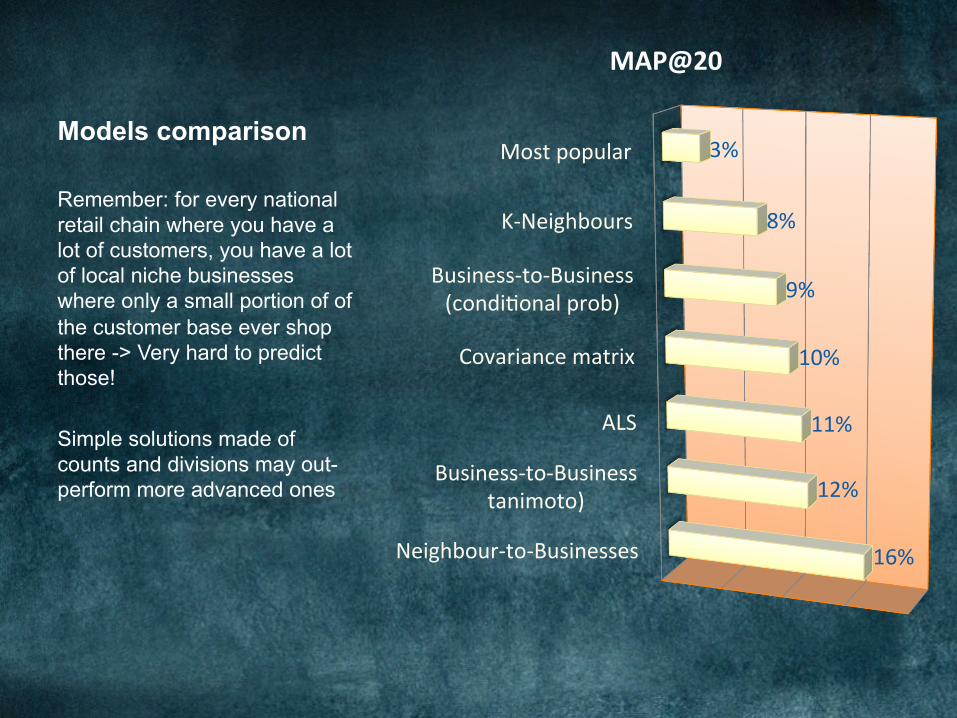
Models comparison
Neighbour-to-Businesses
Business-to-Businesstanimoto)
ALS
Covariancematrix
Business-to-Business(condi@onalprob)
K-Neighbours
Mostpopular
16%
12%
11%
10%
9%
8%
3%
MAP@20
Remember: for every national retail chain where you have a lot of customers, you have a lot of local niche businesses where only a small portion of of the customer base ever shop there -> Very hard to predict those! Simple solutions made of counts and divisions may out-perform more advanced ones
Limitations
• ML and MLlib are not flexible enough and need some extra development (bloody private fields)
• Linear algebra libraries in MLlib are limited, it took as a while to learn how to optimize them
• Scala and Spark create confusion for some method behaviour (e.g. fold, collect, mapValues, groupBy)
• Many machine learning libraries are based on vectors and don’t easily allow ad-hoc definition of data types based on the business context
Conclusions
• Spark and Scala were excellent tools for rapid prototyping during the week, especially for bespoke algorithms.
• We used the same production stack together with notebooks for ad-hoc explorations or quick and dirty tests.
• At the end of the hackathon the best model is almost a production-ready MVP
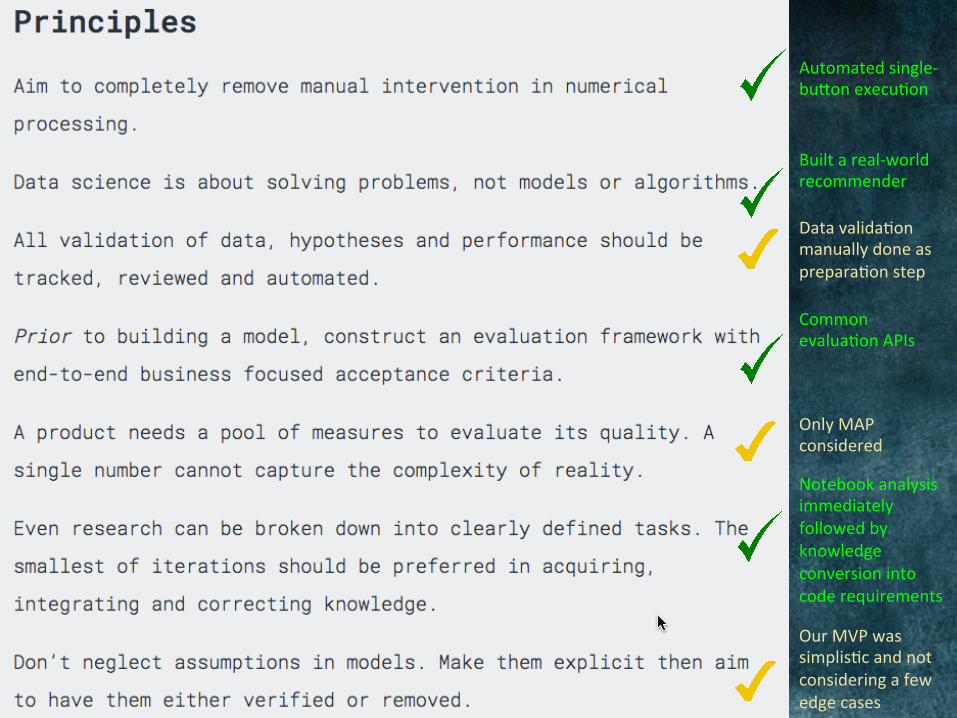
Automatedsingle-bu[onexecu@on
Builtareal-worldrecommender
Commonevalua@onAPIs
Datavalida@onmanuallydoneasprepara@onstep
OnlyMAPconsidered
Notebookanalysisimmediatelyfollowedbyknowledgeconversionintocoderequirements
OurMVPwassimplis@candnotconsideringafewedgecases
Off-site
• Success of the hackathon was not solely down to technology.
• Innovation requires an environment where: – great people can connect – set clear ambitious goals – work together free of distractions – pressure of delivering comes from the group – Fail safely, go to sleep, wake up next day (go surfing)
and try again!
https://blog.cloudera.com/blog/2016/05/the-barclays-data-science-hackathon-using-apache-spark-and-scala-for-rapid-prototyping/
Original article on Cloudera Engineering Blog
https://github.com/gm-spacagna/lanzarote-awesomeness
GitHub code
Further Reading
A lot of references regarding Agile and Spark http://datasciencevademecum.wordpress.com Data Science Vademecum
TheBarclaysDataScienceteamatthishackathonwas:PanosMalliakas,VictorParaschiv,HarryPowell,CharisSfyrakis,GianmarioSpacagnaandRaffaelStrassnig
http://www.datasciencemanifesto.org/ The Professional Data Science Manifesto
Related Documents