A Division of Westpac Banking Corporation ABN 33 007 457 141 AFSL 233714 The BankSA State Monitor - an ongoing independent survey of South Australian Consumer & Business Confidence Research Results No. 62 – March 2017 Media Contacts: Jayne Flaherty, BankSA Corporate Affairs Telephone: (08) 8424 4570 or 0478 335 544 Email: [email protected] Megan Grey, BankSA Corporate Affairs Telephone: (08) 8424 4470 or 0466 320 662 Email: [email protected]

Welcome message from author
This document is posted to help you gain knowledge. Please leave a comment to let me know what you think about it! Share it to your friends and learn new things together.
Transcript

A Division of Westpac Banking Corporation ABN 33 007 457 141
AFSL 233714
The BankSA State Monitor - an ongoing independent survey of South Australian Consumer & Business Confidence
Research Results
No. 62 – March 2017 Media Contacts: Jayne Flaherty, BankSA Corporate Affairs Telephone: (08) 8424 4570 or 0478 335 544 Email: [email protected] Megan Grey, BankSA Corporate Affairs Telephone: (08) 8424 4470 or 0466 320 662 Email: [email protected]

TABLE OF CONTENTS 1 INTRODUCTION ...................................................................................................................................................... 3 2 METHODOLOGY ..................................................................................................................................................... 3 3 RESEARCH OBJECTIVES ..................................................................................................................................... 4 4 RESULTS ................................................................................................................................................................. 4
4.1 SUMMARY OF RESULTS ...................................................................................................................................... 5 4.1.1 Top Line Results – Consumer Summary ............................................................................... 5 4.1.2 Top Line Results – Business Summary ................................................................................. 6
4.2 ENVIRONMENT DURING WHICH THIS STATE MONITOR WAS CONDUCTED ................................................................ 7 4.3 COMMENTARY ON WAVE 62 RESULTS ................................................................................................................. 7
5 SUMMARY OF RESULTS ..................................................................................................................................... 10 5.1 CONSUMER TRACKING MONITOR ...................................................................................................................... 10 5.2 BUSINESS TRACKING MONITOR ......................................................................................................................... 10
6 DETAILED RESULTS ............................................................................................................................................ 12 6.1 CONSUMER TRACKING MONITOR – TOP LINE RESULTS ...................................................................................... 12
6.1.1 Latest Figures ....................................................................................................................... 12 6.1.2 Detailed Results ................................................................................................................... 13
6.2 BUSINESS TRACKING MONITOR – TOP LINE RESULTS ........................................................................................ 15 6.2.1 Latest Figures ....................................................................................................................... 15 6.2.2 Detailed Results ................................................................................................................... 16
7 NOTES ON ISSUES PREVALENT DURING FIELDWORK ................................................................................. 18

Page 3
March 2017 Report
1 INTRODUCTION The BankSA State Monitor is an ongoing independent survey (conducted three times a year) on South Australian consumer and business confidence. The survey commenced in November 1997. This report details the results of the 62
nd survey.
2 METHODOLOGY The Bank commissions separate surveys for the consumer market and business community.
Consumer Tracking Monitor
Telephone survey
Conducted three times a year (February, July, October)
Consumer indicators include:
Confidence about the future
Self esteem
Consumer purchase (last three months)
Consumer purchase (next three months)
State pride
Mood of the consumers
Confidence about small businesses
Job security
Lifestyle stability
Technology adoption
Business Tracking Monitor
Telephone survey
Conducted three times a year (February, July, October)
Business indicators include:
Confidence about the future
Business confidence
Business purchase
Business stability
Business expansion
State pride
Mood
Confidence about small businesses
Income security
Technology adoption

Page 4
March 2017 Report
3 RESEARCH OBJECTIVES To provide an overall index of consumer and business ‘confidence’ representing the South Australian consumer and business segments.
4 RESULTS A base of 100 is used, to which the overall results are either added or deducted. If a result greater than 100 is achieved, this represents a positive result and if the result is less than 100, a negative result is represented. Based on this index a maximum score is 200 and a minimum score is zero. If the index is below 100, this means that there are more pessimistic than optimistic respondents. Therefore, any score above 100 represents a positive confidence result and obviously the higher the result, the more confident the response. BankSA Total Confidence Index
Consumer confidence decreased 4.3 points from 102.1 to 97.8 index points, the lowest confidence level since reporting commenced in late 1997.
Business confidence decreased by 4.1 points, from 108.1 in Oct-16 to 104.0 in Feb-17.
90
95
100
105
110
115
120
125
130
135
140
145
150
No
v-9
7
Ma
y-9
8
No
v-9
8
Ma
y-9
9
No
v-9
9
Ma
y-0
0
No
v-0
0
Ma
y-0
1
Fe
b-0
2
Aug
-02
Ma
y-0
3
Fe
b-0
4
Aug
-04
Ma
y-0
5
Fe
b-0
6
Aug
-06
Ma
y-0
7
Fe
b-0
8
Aug
-08
Ma
y-0
9
Fe
b-1
0
Oct-
10
Ma
y-1
1
Fe
b-1
2
Aug
-12
Ma
y-1
3
Fe
b-1
4
Aug
-14
Ju
n-1
5
Fe
b-1
6
Oct-
16
CONSUMER and BUSINESS INDEX
Consumer Index Business Index

Page 5
March 2017 Report
4.1 Summary of Results
4.1.1 Top Line Results – Consumer Summary Consumer confidence decreased 4.3 points from 102.1 to 97.8 index points.
Q Tracking Indicator Question Asked
Latest
Result
Movement
(Net)
Net
Movement
since last
survey
Highest (Best) Result Lowest (Worst) Result
1 Confidence about How confident are you that the climate for - ve -11% Lowest level ever 50 - 64
the future consumer spending will improve over the 18 -24 65+
next 12 months? Blue Collar White Collar
Males
2 Consumer How confident are you that there will be a - ve -2% 18 - 24 18 - 24
confidence significant positive change in your Males Blue Collar
financial position in the next 12 months? White Collar Females
Metro Rural
3 Consumer purchase Have you made any significant purchases + ve 41% Highest level in 5 yrs 25 - 34
(past three months) in the last three months, such as real 18 - 24
estate, cars, whitegoods, hi-fi equipment Metro
or holiday travel? White Collar
Males
4 Consumer purchase Are you or your household likely to make + ve 47% Highest level ever 50 - 64
(next three months) a major purchase in the next three Largest Increase 65 +
months of real estate, cars, whitegoods 35 - 49
hi-fi equipment or holiday travel? White Collar
Metro
5 State pride When you look at how things are going - ve -39% Lowest level ever 50 - 64
in SA, how proud are you to be a South Largest Decrease Blue Collar
Australian? 18 - 24 Males
6 Mood Which words best describe how you feel - ve -25% Lowest level ever 50 - 64
about your own household situation at Largest Decrease Metro
present? 18 - 24 White Collar
65+ Males
7 Small business When you think about small business in - ve -12% Lowest level ever Metro
activity SA generally, does small business seem 18 - 24 White Collar
to be picking up, steady or slowing down? 25 - 34
8 Job security In the last three months, has your - ve 4% White Collar 39% from 47% 35 - 49 47% from 35%
household or family been affected by an "worried" 18 - 24 39% from 57% Blue Collar 50% from 30%
inability to find suitable work or worried Rural 42% from 38%
about losing existing employment?
9 Lifestyle stability If you or someone in your household or + ve 2% 18 - 24 50 - 64
family wanted to change jobs, how 25 - 34 Rural
confident are you that suitable work would Metro Blue Collar
be available? Males Females
White Collar
10 Technology How confident do you feel about using - ve -31% Largest Decrease White Collar
adoption technologies such as credit cards, 25 - 34 Rural
computers, mobile phones, ATMs and 35 - 49
EFTPOS?
CONSUMER TOP LINE SUMMARY

Page 6
March 2017 Report
4.1.2 Top Line Results – Business Summary
Similar as consumer confidence, Business confidence decreased by 4.1 points, from 108.1 in Oct-16 to 104.0 in Feb-17.
Q Tracking Indicator Question Asked
Latest
Result
Movement
(Net)
Net
Movement
since last
survey
Highest (Best) Result Lowest (Worst) Result
1 Business How confident are you that the climate for - ve -7% Community Service Finance
confidence doing business in SA will improve over Construction Recreation
the next 12 months? Large-size businesses Mid-size businesses
Rural Metro
2 Confidence about How confident are you that there will be a + ve 2% Manufacturing Construction
the future significant improvement in the performance Rural Wholesale/Retail
of your business in the next 12 months? Largest by t/o Finance
Mid-size by fte
3 Business How likely is it that your business will - ve -5% Agriculture Wholesale/Retail
purchase make a major purchase in the next 12 Construction Finance
months, such as office equipment, cars, Largest by t/o and fte Metro
commercial real estate or other investments?
4 Business stability In the last three months, have you created - ve -7% Community Service Finance
(past three months) any additional employment or taken on any Construction Metro
additional employees in your business? Largest by t/o and fte
5 Business expansion In the next three months, are you likely to - ve -12% Agriculture Finance
(next three months) create any additional employment or take on Largest by t/o and fte Recreation
any additional employees in your business? Micro-size businesses
6 State pride When you look at how things are going - ve -3% Community Service Agriculture
in SA, how proud are you to be a South Manufacturing Finance
Australian? Mid-size by fte Metro
Rural
7 Mood Which words best describe how you feel - ve -8% Community Service Wholesale/Retail
about your own business situation at Largest by t/o and fte Construction
present? Rural Mid-size by t/o and fte
Metro
8 Small business When you think about small business in - ve -10% 45% report direction is down All industries -ve
activity SA generally, does small business seem Neutral to 42% from 39% Finance
to be picking up, steady or slowing down? Community Service / Construction Mid-size business by fte
Mid-size by t/o Metro
9 Income security In the last three months, has your business + ve -10% 45% "worried", down 10% Wholesale/Retail 62%
been affected by any downturn in turnover or "affected" Rural 45%, from 58% Manufacturing (58%)
have you been worried about possible Micro-size by t/o and fte
downturn in turnover?
10 Technology How confident do you feel about using - ve -12% Wholesale/Retail Metro
adoption technologies such as credit cards, Finance
computers, mobile phones, ATMs and Largest by t/o, Mid by fte
EFTPOS?
BUSINESS TOP LINE SUMMARY

Page 7
March 2017 Report
4.2 Environment during which this State Monitor was conducted The context in which the latest State Monitor was conducted helps to understand the index changes. At an international level, the context included:
Economically - Moderate growth widely predicted to continue.
Politically - Uncertainty in many parts of the world; the Trump administration takes office in the US; ongoing Middle-East and African conflict and displacement of many civilians; Brexit edging closer; a number of elections in European countries with far-right Parties on the rise in response to mass migration from the Middle-East.
Socially - Mass migration to Europe from the Middle-East causing some EU countries to apply quotas and close borders, the US closing its borders to immigrants from six countries.
Environmentally – Debate about global warming, with evidence of a two decade-long halt or slowdown in warming. Western countries shifting from coal to renewables and gas in their energy mix.
At a national level in Australia, the context included:
Economically - Stable but sub-par economic growth forecast for 2017. Iron ore prices on the rise, boosting
mining stocks. Record agricultural harvests boosting the agricultural sector.
Politically – Low poll numbers for the incumbent Turnbull Government. A vocal Senate crossbench blocking Budget savings measures and arguing for compromises to government bills; the rise of Pauline Hanson’s One Nation Party to levels of support in the polls not seen since 1998; looming State elections in WA and Qld.
Socially – Australia’s period of summer holidays, including Christmas, Australia Day and the summer sports season. Preparations underway for the start of the AFL season.
Environmentally - Extreme weather events in SA and NSW. Some flooding in Victoria and WA. Good seasonal rainfalls producing record crop yields across the southern half of Australia.
At a state level in South Australia:
Economically – Mixed – the looming GMH closure; businesses affected by the blackouts, and high power prices more generally a concern for business.
Politically – Ongoing energy security debate, the RAH build delay and electoral boundary redistributions.
Socially - Relatively stable.
Environmentally - Extreme heat on some days created blackouts over the period from September 2016 – January 2017 causing debate over South Australia’s green energy mix.
4.3 Commentary on Wave 62 Results Following a sharp lift in consumer confidence between February to July last year, confidence has fallen for the past two surveys. An index of 97.8 (below 100 index point benchmark) is indicative of a pessimistic mood in the South Australian consumer population. On an annualized basis, the current results when placed in an historical context show that the current consumer confidence level remains low by historical standards (see table below):
BSA State MonitorAnnualised
Index
2007 (3 surveys) 123.3
2008 (3 surveys) 118.9
2009 (3 surveys) 115.4
2010 (3 surveys) 123.5
2011 (3 surveys) 115.8
2012 (3 surveys) 103.8
2013 (3 surveys) 109.4
2014 (3 surveys) 105.8
2015 (3 surveys) 102.1
2016 (3 surveys) 103.3
2017 (1 survey) 97.8

Page 8
March 2017 Report
Business confidence fell by a similar amount as consumer confidence but it remains above the 100 point index for the third successive survey. The latest business confidence reading of 104.1 is equal to the 2-year average business confidence index for 2015/2016. Contextually, the recent fall in both consumer and business confidence may be a reflection of extreme weather events and associated blackouts; job losses at GMH, ASC and Pfizer, and the imminent closure of GMH; the ongoing media coverage of delays to the new RAH building; changes to pensions coming into effect in early 2017, and welfare debt recovery being undertaken by Centrelink. Consumer Comments The ten measures that contribute to the consumer confidence index show improvement in three and a decline in seven measures. These ten variables are combined to produce the composite consumer confidence index, and examination of each of these variables individually helps to explain those factors that have influenced the index either in a negative or positive way. The measures reporting positive results are:
Confidence about employment mobility is slightly higher;
Higher incidence of having made significant purchases in the last 3 months; and
Likelihood of a major purchase in the next 3 months has improved.
The measures reporting negative results are:
Pride in South Australia;
An increase in concerns relating to unemployment impacting their household;
Adaptation to new technology has declined;
Decreased confidence about the climate for consumer spending over the next 12 months;
Slightly decreased confidence that consumers’ own financial position will improve in the next 12 months;
Sentiment about their overall household situation is more negative; and
A perception that local businesses have decreased in business activity. A total of 28 factors were provided to consumers in the survey, as potential factors making consumers optimistic or pessimistic about the future. Of these factors, 27 of the 28 factors report negative shifts with only a small positive shift on “interest rates”.
The biggest negative shifts in sentiment since October last year have been in the following areas: o Australia’s long term outlook; o Petrol prices; o Unemployment levels; o Wages relative to cost of living; o South Australia’s long term outlook; o The state of the Australian economy; and o The state of the South Australian economy.
Business Comments Of the 10 factors contributing to the business confidence index, there are similar results as the consumer survey, but with two factors improving and eight factors showing a negative shift. The measures reporting positive shifts are:
Net confidence is higher about their own business prospects in the next 12 months; and
A lower incidence of being impacted by falling turnover.

Page 9
March 2017 Report
Measures reporting negatively are:
Pride in South Australia is down;
Their own overall current business situation has declined;
Confidence about adoption of new technology is lower;
Confidence about the climate for doing business in the next 12 months is lower;
Intention to make a major purchase in the next 12 months has dropped;
The creation of additional employment in the last 3 months is down;
Decreased intention to create new employment in the next 3 months; and
A lower perception that small business activity is picking up. A total of 28 factors were provided to business owners in the survey, as potential factors making businesses optimistic or pessimistic about the future. Of these factors, six reported a positive shift with 22 reporting a negative shift, from Oct-16 to Feb-17. The major factors reporting an increase in optimism (or a decrease in pessimism), are:
Unemployment;
World affairs;
Small business performance generally; and
The long term outlook for South Australia. The main factors contributing to pessimism relate to:
Wages relative to cost of living;
Petrol prices;
The River Murray;
Media reports on consumer confidence;
Newspaper headlines;
The national economy;
The corporate sector’s performance; and
Retail sales. Conclusions Consumer confidence fell by 4.3 index points in February 2017 to 97.8 (below the baseline of 100 points) indicating that pessimism now outweighs optimism across the State. The fall in confidence is among blue collar and non-working households, with white collar households actually lifting in confidence. This is likely to be due to loss of blue collar jobs in South Australia, and changes to pensions and welfare payments creating uncertainty for pensioners and welfare recipients. A large contributor to the drop in consumer confidence was a fall in State pride, possibly driven by loss of GMH, the new RAH having problems, ASC job losses despite the submarine announcement, and the State’s energy security issues.
Consumers appear to be trying to make 2017 a better year with major purchases, but changes to pensions, superannuation and welfare, extreme weather, blackouts, industry losses, ongoing high unemployment and infrastructure problems may have dampened confidence overall. Business confidence fell between Oct-16 and Feb-17 by 4.1 points, in line with a similar fall in consumer confidence over the same period. The fall in business confidence follows two successive increases in business confidence in 2016, suggesting that business momentum may have stalled in the early part of 2017, however, confidence remains at the 2-year average recorded in 2015/16. Results suggest the South Australian SME sector is reluctant to invest for growth, or to hire new staff to stimulate growth, but with consumers indicating their recent spending increases and intentions to continue making major purchases in coming months, there is reason to be optimistic that this increased spending will benefit South Australian SMEs.

Page 10
March 2017 Report
5 SUMMARY OF RESULTS
5.1 Consumer Tracking Monitor Key Observations
Overall index
There is an overall decrease (of 4.3 index points) in the Consumer Confidence Index.
Analysis of the consumer results suggests that the decrease in consumer confidence has been driven by negative results in the 25-34 and 50+ age segments; females, blue collar employees; and rural based respondents.
On a positive note, consumer purchase indicators have rebounded from low points last survey, with “made a purchase in the past three months” up to its best result in five years (46% did make a purchase), and “will make a purchase in the next three months” up to its highest level ever reported, at 38%.
For the consumer monitor, the three highest net positive measures are: adoption of technology; state pride and job security (replacing current mood).
The Consumer Index fell below the Business Index last survey, and has remained lower this survey – a reversal on the previous two surveys in 2016.
The age segment 50-64 reports the largest drop this survey, resulting in it falling further below the 100 index point benchmark and to its lowest level since this survey commenced in 1997, and remaining the lowest of all age segments.
Points to note for this survey, based on consumer demographics are:
Confidence is under the 100 index base for 25-34, 50-64 and 65+ age segments;
Age segment 18-24 ranks as the most positive (has been the highest for the past eight waves) and reports a positive movement this survey;
Confidence levels for females and males are similar, with both decreasing this survey (with females down 4.9 to 97.9), and males down 3.2 to 98.0 points;
White collar remains at higher confidence than the blue collar segment, widening the gap with white collar up by 4.1, to 109.6, while blue collar has decreased by 9.4 to 95.4 points; and
Confidence ranking between metro and rural is unchanged, with Metro remaining more confident, but both have decreased for the 2nd consecutive survey, with rural dropping further under 100 index points, to 92.5 points (down 7.0) and its lowest level ever reported, and metro down 3.3 to 100.1 points, just above the 100 index point benchmark.
5.2 Business Tracking Monitor Key Observations
Overall index
There is an overall decrease (of 4.1 index points) in the Business Confidence Index.
Analysis of the business results suggests that the decrease in business confidence is a result of decreases in the agriculture and construction sectors, mid-size SME businesses by Turnover and FTE numbers (same as last two surveys), and metro locations.
State pride and mood about current business situation have both fallen to their lowest level since Aug-11, and 2nd lowest levels ever reported.
Rural confidence reports its 3rd consecutive increase and is now higher than Metro, which has dropped this month, however both remain above 100 index points.
The agriculture industry reports a large decrease but it remains above 100 index points, and is 2nd (behind Community Service) as the most confident industry. The decrease in agriculture has been offset slightly by a good increase in the manufacturing industry which has rebounded from the last survey where it reported its largest decrease since the State Monitor commenced.
Community service and Recreational report good increases this survey, while wholesale/retail and finance both report decreases and fall below the 100 index point benchmark.
For the business monitor, the three highest net positive measures are: technology adoption, state pride and confident about future improvement in own business.
Micro businesses by T/O and by FTE remain below the 100 index points base (below 100 for the past four surveys), however there are mixed results with T/O increasing but FTE decreasing for this business size, this survey.

Page 11
March 2017 Report
Mid-size business by T/O and FTE have decreased significantly this survey but remain higher than micro businesses and lower than larger businesses.
By turnover: <0.5m – increased by 1.0 points; >0.5m<1m – decreased by 15.8 points; and >1m – decreased by 0.7 points.
By FTE: < 5fte – decreased by 5.0 points; 5-10fte – decreased by 14.8 points; and +10fte – increased by 9.0 points.
Metro has dropped while and Rural has improved.
Points to note this survey, based on business demographics, are:
Highest confidence in the large-sized businesses by FTE and Turnover;
Lower confidence among metro businesses compared with rural businesses, a reversal on the past three surveys;
Lowest confidence levels in the wholesale/retail and finance industries (both under 100 index points); and

Page 12
March 2017 Report
6 DETAILED RESULTS
6.1 Consumer Tracking Monitor – Top Line Results
6.1.1 Latest Figures (Note, movements since last survey in small print)
Question
No.Tracking Indicator Question Asked Results Results Results
Net
Positive
Result
Wave 62
Confident
Not
Confident Neutral
1 Confidence about How confident are you that the climate for 26% 42% 25%
the future consumer spending will improve over the
next 12 months? -1% 10% -15%
2 Consumer How confident are you that there will be a 32% 42% 23%
confidence significant positive change in your
financial position in the next 12 months? 1% 3% -6%
9 Lifestyle stability If you or someone in your household or 27% 58% 11%
family wanted to change jobs, how
confident are you that suitable work would 6% 4% -14%
be available?
10 Technology How confident do you feel about using 66% 18% 14%
adoption technologies such as credit cards,
computers, mobile phones, ATMs and -20% 11% 8%
EFTPOS?
Proud Not Proud Neutral
5 State pride When you look at how things are going 54% 23% 22%
in SA, how proud are you to be a South
Australian? -23% 16% 6%
Yes No
3 Consumer Have you made any significant purchases 46% 51%
purchase in the last three months, such as real
(past three months) estate, cars, whitegoods, hi-fi equipment 19% -22%
or holiday travel?
4 Consumer Are you or your household likely to make 38% 47%
purchase a major purchase in the next three
(next three months) months of real estate, cars, whitegoods 17% -30%
hi-fi equipment or holiday travel?
8 Job security In the last three months, has your 41% 54%
household or family been affected by an
inability to find suitable work or worried 4% -9%
about losing existing employment?
Positive Negative Neutral
6 Mood Which words best describe how you feel 50% 44% 7%
about your own household situation at
present? -15% 10% 6%
Up Down Neutral
7 Small business When you think about small business in 3% 52% 40%
confidence SA generally, does small business seem
to be picking up, steady or slowing down? -5% 7% -4%

Page 13
March 2017 Report
6.1.2 Detailed Results
Note, % increases/decreases in following comments refer to movements in percentage points Consumer Spending Climate (Q1)
The latest results are down this survey, from -5% to -16% (net confidence), extending a –ve result to four of the past five surveys, and the lowest level ever reported.
Net confidence on this question is highest for the 18-24 (24% from 32%) and lowest for 50+ at -39%.
Metro is down to -16% from -3%, with rural also down, from -7% to -18%.
This survey sees white-collar reporting a decrease from +4% to -7%, but
blue-collar a very slight increase to -7% from -8%.
Decreases for males to -13% from +5%, and females are down from -14% to -19%. Financial Change (Q2)
The latest results have declined slightly for the 2nd consecutive survey, from -8% to -10% - this extends the net negative results to 18 surveys.
Those most confident about their own financial situation improving is 18-24 age segment at 18%, up from 12% last survey.
Metro responses report a slight increase to -3% from -4%, while rural has decreased to -27% from -17%.
Blue-collar is down to -7% (from +1%), while white-collar has improved to +8% from 0% from +2%. “Other” is better this survey up to -33% from -43%.
Males report an increase to -7% from -10%, while females have decreased to -8% from -4%. Made Significant Purchase (Q3)
“Did make a major purchase” increased this survey to 46% from 27%, to be at its best level since Feb-12.
The highest incidence of major purchases was by 18-24 ages (at 55% from 32%).
The lowest incidence of major purchases was 25-34 at 38%, but up from 23%.
White collar increased to 57% from 32%, and blue-collar is up to 37% from 30%, making a purchase.
Movement across both Metro and Rural has increased, with Metro up to 48% from 29%, and rural to 39% down from 23%.
Males increased from 21% to 43%, and female spending 48% from 33%. Make Significant Purchase (Q4)
The latest result has rebounded from the previous drop, reporting its biggest increase in the likelihood to make a major purchase in the next three months, up to 38% from 21%, and the highest level ever reported.
The highest intention to purchase is in the 35-49 ages (at 49% from 14%) and white-collars at 46% (from 24%).
The lowest purchase intention figures are 50-64 at 22%, and 65+ at 34%, but up from 19% and 13% respectively.
Higher levels are reported for metro (41%, from 22%), rural (32% from 20%), and blue-collar (41% from 17%). Pride in SA (Q5)
Pride in the state reports its largest drop and lowest ever result this survey, decreasing to 31% from 70% net overall (54% for “proud” responses, from 77%).
The proudest segments are 18-24 (78%), reporting “proud” replies.
The least proud segments are 50-64 at 42%, which is down from 71% “proud”.
White collar have decreased by 13% to 64%, with blue collar falling to 45% from 78%.
Metro has decreased (52% from 78%) as has rural, which is down to 60%, from 74%.
Females, at 56%, are slightly higher than males on 53%. Feel about Household Situation (Q6)
The latest results have dropped to 6% from 31%, an all-time low result.
The net positive mood is highest among 65+ at 30% (down from 52%), 18-24 at 27% (but down from 44%) and females (7% from 29%).
Across the regions, metro (4%, from 32%) and rural (7%, from 30%) are both lower.
White-collar is down to 21% from 40% and blue-collar down to 7% from 19%.
The net positive mood is lowest among the 50-64 at -17%, down from +20%.
Net male responses have decreased to 4% (from 34%). Business Activity (Q7)
The latest results has extended last survey’s drop, to -49% from -37%, and remaining as a net negative level since May-2010, and now the lowest ever result.
All age segments are in negative results, with 18-24 at -14 being the most positive, as per last four surveys.
City respondents report a drop to -48% from -34%, while rural has also dropped, to -50% from -42%.
White collar is down to -45% from -30%, blue-collar is down to -42% from -38%, but ‘other’ employment category is up slightly to -55% from -59%.
A decrease by males to -49% from -39%, and also for females to -48% from -38%

Page 14
March 2017 Report
Worried by Unemployment (Q8)
A poorer result again this survey with the % of “worried” respondents increasing from 37% to 41%.
The highest level of concern about unemployment is across the ages from 25 to 64, at around 46%, but with 35-49 jumping from 35% to 47% “worried”.
Males and females are at similar levels of 40%, up from 37% last survey.
Blue collar at 50% worried (up from 30%) with white collar at 39% (but down from 47%).
“Worried” responses for ages 18-24 have dropped from 57% to 39%.
The % “worried” of metro respondents has increased to 40% ‘worried’, (from 37%), and rural to 42% from 38% ‘worried’.
Could Change to a Better Job (Q9)
Following a decrease last survey, there is a small increase this survey with perceived job mobility at -31% from -33%.
Confidence about job mobility is highest in Under 35’s at +26%, rural -29% and males to -27% (from -39%).
Confidence about job mobility is lowest in the 50-64 segment at -63% from -49%.
White and blue-collar response report different results this survey with white-collar up to -26% from -36%, but blue-collar down -29% from -16%.
Metro has improved to -32% (from -37%) below rural at -29%, from -27%.
Females have decreased to -35%, from -30%, but males increased to -27%, up from -39%. Using New Technology (Q10)
The latest result ceases the recent upwards trend, reporting the largest ever drop this survey, decreasing from 79% to 48% for net confidence in using new technology.
Confidence with technology has declined across all age segments this survey, with confidence ranging between 48% to 82% “confident” was 80% - 89% last survey.
Confidence with technology is at similar levels this survey for employee types, however white collar has dropped 17 points to 72% and blue collar 13 points to 74%.
Rural has decreased from 88% to 60% “confident”, with metro decreasing to 69% from 85%.

Page 15
March 2017 Report
6.2 Business Tracking Monitor – Top Line Results
6.2.1 Latest Figures (Note, movements since last survey in small print)
Question
No.Tracking Indicator Question Asked Results Results Results
Net
Positive
Result
Wave 62
Confident
Not
Confident Neutral
1 Business How confident are you that the climate for 39% 35% 25%
confidence doing business in SA will improve over
the next 12 months? -5% 2% 3%
2 Confidence about How confident are you that there will be a 54% 21% 23%
the future significant improvement in the performance
of your business in the next 12 months? -2% -4% 5%
3 Business How likely is it that your business will 34% 55% 11%
purchase make a major purchase in the next 12
months, such as office equipment, cars, -2% 3% 1%
commercial real estate or other investments?
10 Technology How confident do you feel about using 76% 11% 12%
adoption technologies such as credit cards,
computers, mobile phones, ATMs and -8% 4% 5%
EFTPOS?
Proud Not Proud Neutral
6 State pride When you look at how things are going 72% 16% 11%
in SA, how proud are you to be a South
Australian? -2% 1% 1%
Yes No
4 Business In the last three months, have you created 28% 70%
stability any additional employment or taken on any
(past three months) additional employees in your business? -4% 3%
5 Business In the next three months, are you likely to 25% 68%
expansion create any additional employment or take on
(next three months) any additional employees in your business? -7% 5%
9 Income security In the last three months, has your business 45% 52%
been affected by any downturn in turnover or
have you been worried about possible -10% 11%
downturn in turnover?
Positive Negative Neutral
7 Mood Which words best describe how you feel 58% 42% 0%
about your own business situation at
present? -3% 5% 0%
Up Down Neutral
8 Small business When you think about small business in 10% 45% 42%
confidence SA generally, does small business seem
to be picking up, steady or slowing down? -6% 4% 3%

Page 16
March 2017 Report
6.2.2 Detailed Results
Note, % increases/decreases in following comments refer to movements in percentage points Improved Business Climate (Q1)
The latest result sees a drop from 11% to 4% (net) of confidence in an improvement in the business climate in the next 12 months.
Mid-size businesses by turnover (-18% from +17%) and by FTE (-1% from +9%) have the lowest net confidence about the business climate.
Finance at -9% from -3% and recreation at -4% (from -13%) represent the lower confident industries.
Most confident about the business climate is the community service (29% up from 3%) and construction (17%, but down from 32%) industries and the larger-size businesses, by turnover at +18% (from 25%), and by FTE, at 26% up from 23%.
Metro has dropped to +1% from 14%, but rural has improved to +11% from 3%. Own Business Improvement (Q2)
The latest result for confidence about own business growth in the next 12 months has increased for the 2nd
consecutive survey, from 31% (net) to 33%.
Confidence about their own business growth prospects is lowest in construction (17% from 51%), wholesale/retail (17% from 25%) and finance (17% but up from -3%).
Confidence about their own business growth is highest among manufacturing businesses (at 64% from -6%), and largest-size businesses by T/O at 48% (from 46%) and mid-size businesses by FTE at 46% (from 50%).
Metro at 31% is up from 26%, and rural is up, from 20% to 38%. Make Significant Purchase (Q3)
The incidence of businesses intending to make a major purchase in the next 12 months has decreased for the 2
nd consecutive survey, to 34% (from 36%).
Intention to purchase is lowest in the finance and wholesale/retail industries at 25% and 29% respectively.
Intention to purchase is highest in the agriculture (at 38%, but down from 46%) and construction industries (37% from 40%), larger-sized businesses (FTE) at 66% from 54% and (by turnover) at 48% from 49%.
Metro has dropped to 33% from 37%, but rural is unchanged at 35%. Have Created Additional Employment (Q4)
The incidence of businesses creating additional employment in the past three months has decreased this survey to 28% (26%32%28%).
The highest incidence of recent employment creation was in community service (35%, from 44%), construction (30% from 35%) and large-sized enterprises (T/O) at 44% from 47%, and (FTE) at 60% up from 51%.
The lowest incidence of creating additional employment was in finance at 18% (from 27%) and manufacturing, unchanged at 19%.
Metro has decreased to 27% (from 32%), but rural is unchanged at 32%. Will Create Additional Employment (Q5)
Confidence about creating new employment in the next three months has dropped with the latest results moving to 25%, down from 32% last survey.
The lowest intention to create new employment is in finance at 16% (from 32%), recreation at 15% (from 28%) and micro businesses at 18% (from 19%) for T/O and 19% (from 22%), for FTE.
The highest level of creating additional employment is in the agriculture sector, at 36% “likelihood” (from 46%), and the large businesses (by t/o and fte) at 33% (from 44%) and 44% (from 48%), respectively.
Metro +27% (from 32%) with rural down to 18%, from 33%. Pride in SA (Q6)
Pride in SA has decreased to 56% (net), from 59%, this survey.
Pride is strongest in the community service and manufacturing sectors at 83% and 81% “proud” responses.
Pride is lowest in the agriculture (64% from 73%) and finance (66% from 86%) sectors.
The mid-size businesses by FTE and larger-sized by Turnover, are the most confident at 77% (from 82%) and 75% (from 79%) respectively.
Following a large decline last survey, the level of Pride has stabilised in the largest size businesses by FTE, at 75% this survey.
Rural respondents are higher than Metro, at 74% (from 76%) compared with metro at 71% (from 75%).

Page 17
March 2017 Report
Feel about Business Situation (Q7)
Net positive feelings about their own business circumstances decreased from +24% last wave to +16% this wave.
Confidence about their own business situation was lowest in the wholesale/retail sector with a drop to -3% from +18%, and construction which has fallen to 4%, from 24%.
Confidence about their own circumstances was highest in the community service sector (60% up from 38%), larger-size businesses by turnover at 37% (from 31%) and by FTE at 29% (from 18%).
Confidence has dropped in the mid-sized businesses by T/O and FTE, falling from 34% to 6% and 4%, respectively.
A positive shift in current situation is reported for rural to 31% (from 18%), but in Metro a downward move to 10% from 26%.
General Direction of Small Business (Q8)
Net confidence about how SMEs in South Australia are performing generally, has declined this survey, to -35% from -25%.
45% (from 41%) of businesses report that business direction is down, and 10% report a positive result (down from 16%). Neutral responses increased to 42% (from 39%).
All industries report a negative result, with community service (-35%) and construction (-30%) being the most positive, and finance being the least confident at -40%, a drop from -25%.
Rural is unchanged at -37%, but for metro a decrease to -35% (from -20%).
Mid-sized business by T/O at -27% down from -6%) and larger-size by FTE, at -13% (up from -26%), are the most positive.
Mid-size business by FTE have dropped to -39%, from -19%. Downturn in Turnover (Q9)
For the first time since late 2015, the number of businesses worried about a downturn in turnover, is under 50%, with the latest result at 45% “worried”.
Concerns about a downturn in their own turnover are highest in wholesale / retail (unchanged at 62%), manufacturing at 58% (from 55%), and micro-businesses by FTE 47% (from 55%) and by T/O at 47% (from 55%).
“Worried” responses across metro to 45%, down from 54%, and rural also to 45%, from 58%.
The larger-sized businesses have improved in this measure, with both T/O and FTE dropping to 41% “worried” from 59% and 57% respectively last survey.
Agriculture businesses report 47% worried, much higher than 27% last survey. Using New Technology (Q10)
Business confidence about adoption of new technology in the business decreased to a net of +65% (from 77%).
The most confident businesses in terms of adopting new technologies are wholesale/retail and finance, both at 80+% “confident”, large-size businesses (by turnover) of 84% and mid-size businesses (by FTE) also at 84%.
Metro at 75% (from 86%) remains is lower than rural this survey, with rural at 78% (but down from 81%).

7 NOTES ON ISSUES PREVALENT DURING FIELDWORK
Date of Fieldwork Comments Wave 1 (Oct 97) Fieldwork conducted during State election build-up
Wave 2 (Jan 98) Fieldwork conducted during holiday period, post Adelaide Crows premiership
Wave 3 (Apr 98) Fieldwork conducted amid media coverage of Asian economic crisis
Wave 4 (Jul 98) Fieldwork conducted amid media coverage of the $A decline and continued coverage of Asian economic crisis
Wave 5 (Oct 98) Fieldwork conducted after Federal election and Adelaide Crows premiership
Wave 6 (Jan 99) Fieldwork conducted during holiday period
Wave 7 (Apr 99) Fieldwork conducted amid media coverage of the Yugoslavia and East Timor conflicts, also the ETSA sale was voted down
Wave 8 (Jul 99) Continuing good economic results and GST uncertainty
Wave 9 (Oct 99) East Timor conflict and media coverage leading up to republic referendum
Wave 10 (Jan 00) GST uncertainty and high car and petrol prices
Wave 11 (Apr 00) GST uncertainty, speculation of further interest rate rises and decline in value of $A
Wave 12 (Jul 00) Fieldwork conducted post GST introduction
Wave 13 (Oct 00) Fieldwork conducted post Olympics, continuing fall in $A and Higher fuel prices
Wave 14 (Jan 01) Business issues - Continuing effects of GST on demand in some industries, impact of low exchange rate on cost of imports, negative forecasts coming out of the USA suggesting an economic downturn and possible recession. Consumer issues - Consumers are not affected negatively by the introduction of the GST, anticipation of a positive year based on current economic growth and seasonal "good feel" factors (Christmas, New Year, holidays, summer).
Wave 15 (Apr 01) Record low value of the Australian dollar, cost of living rises (GST, fuel, electricity) and business cost increases (GST, fuel, electricity)
Wave 16 (Jul 01) No issues at time of fieldwork
Wave 17 (Jan 02) Upcoming State election
Wave 18 (Apr 02) No issues at time of fieldwork
Wave 19 (Jul 02) Increasing interest rates
Wave 20 (Jan 03) Prospect of Australia becoming involved in a war with Iraq, drought affecting many of the State’s farming districts, a Federal Government funded campaign to “be alert but not alarmed” at the prospect of terrorist attacks on Australian soil, historically low unemployment levels and low interest rates, record agricultural commodity prices, average annual growth of house values in South Australia of 17% in 2002, Australia retaining the Ashes.
Wave 21 (Apr 03) Iraq war, widespread drought, controversy surrounding the Governor General, SARS affecting travel and exports, low unemployment levels and low interest rates, high agricultural commodity prices, State and National economies continuing to grow, average annual growth of house values in South Australia, the housing boom continuing in South Australia well into 2003, preliminary talks of a tough State budget for SA this year, the Australian dollar at a 2 year high against the US dollar.
Wave 22 (Jul 03) An end to the Iraq war, continuing strong Australian economy, signs of an upturn in the US and world economies, strong South Australian economic sectors- housing and construction, agriculture (end of drought) and manufacturing in particular, property value continuing to rise and positive prospects for employment
Wave 23 (Jan 04) Continuing good economic climate, including good retail, housing and car sales. Strong Australian dollar and rising home values. Expectation of continued interest rate increases.
Wave 24 (Apr 04) Weakening Australian dollar, slowdown in housing sector, higher petrol prices and uncertainty with Mitsubishi’s future.
Wave 25 (Aug 04) Weakening Australian dollar, higher petrol prices, stable interest rates, continuing strong retail, car and housing sales
Wave 26 (Jan 05) Continuing good economic climate, strong Australian dollar and rising home values. Expectation of interest rate increases. Tsunami and Eyre Peninsula bushfires.
Wave 27 (Apr 05) Low unemployment rate, continuing high petrol prices, impact of March interest rate rise and uncertainty of further interest rate increases, threatening drought, low commodity prices, pending Federal and State budgets.
Wave 28 (Aug 05) Low unemployment rate, continuing high petrol prices, recent good rainfall, slight softening of housing market, London bombings, media attention re Industrial Relation changes.

Page 19
March 2017 Report
Date of Fieldwork Comments
Wave 29 (Jan 06) Low unemployment rate, continuing high petrol prices, slight softening of housing market, upcoming State election, issues in the media relating to the airport, new trams and electricity.
Wave 30 (Apr 06) Fieldwork conducted amid low unemployment rate, continuing high petrol prices, slight softening of housing market, and positive reactions to the State Election, opening of the new airport terminal and numerous major events including the Fringe, the Clipsal 500 and the Festival of Arts.
Wave 31 (Aug 06) Fieldwork conducted amid low unemployment rate, petrol prices increasing to record levels, a recent interest rate rise with forecasts of further imminent rate rises and low rainfall across the state.
Wave 32 (Feb07) Fieldwork conducted amid low unemployment rate, lower petrol prices, a stable interest rate environment, and ongoing drought and water restriction conditions.
Wave 33 (May07) Fieldwork conducted amid low unemployment rate, a stable interest rate environment, ongoing drought and water restriction conditions, higher petrol prices and during the lead up to the Federal Budget.
Wave 34 (Aug 07) Fieldwork conducted following an interest rate increase, ongoing water restrictions, decrease in value of $A, share market volatility, inflationary pressures, lower petrol prices and Federal election speculation.
Wave 35 (Feb 08) Fieldwork conducted following an interest rate increase, ongoing water restrictions, share market volatility, inflationary pressures, variable petrol prices, continuing good housing market, new Federal Government and the announcement of the Mitsubishi closure.
Wave 36 (May 08) Fieldwork conducted amid steady interest rates, inflation peaking at a 16 year high of 4.2%, petrol prices approaching $1.50 and further increases expected, softening housing market, media speculation re Federal Budget.
Wave 37 (Aug 08) Fieldwork conducted with official interest rates on hold, inflation still above the RBA’s target band, petrol prices around $1.50 but after peaking at $1.70, media speculation about an economic slowdown, debate about the form and timing of an emissions trading scheme, continuing uncertainty about the state’s rainfall for this year, and dire predictions about the fate of the Lower Lakes.
Wave 38 (Feb 09) Fieldwork conducted after the RBA slashed interest rates by 1% on February 3, after the announcement by the Federal Government of a further $42 billion stimulus package and just before the devastating Victorian bushfires.
Wave 39 (May 09) Fieldwork conducted after the RBA meeting with no change to rates, ongoing GFC concerns, a “recessionary” economy, media commentary of upcoming Federal Budget and swine flu concerns while being balanced by some good rains, “mad March” activities, the release of the White Paper, and the receipt of payments from the stimulus package.
Wave 40 (Aug 09) Fieldwork conducted after the RBA meeting with no change to rates, good rains in July, continuation of Federal Government stimulus spending, steady unemployment figures, positive commentary regarding GFC, extension of FHOG and increases in petrol prices and Australian/US dollar.
Wave 41 (Feb 10) Fieldwork conducted after the RBA meeting with no change to rates, steady unemployment figures, positive commentary regarding GFC, increases in petrol prices and Australian/US dollar, continued commentary on ETS, reduction of first home buyers grant and initial media coverage of upcoming State election
Wave 43 (Oct 10) Fieldwork conducted after the October RBA meeting with no change to rates and post the Federal Government election decision and State Government budget announcement
Wave 44 (Feb 11) Fieldwork conducted after the October RBA meeting with no change to rates, during the floods and cyclone in the Eastern states, and amid the media coverage of local issues with State Government.
Wave 45 (May 11) Fieldwork conducted after the May RBA meeting with no change to rates, and post the 2011 Federal Budget announcement. Also during ongoing media coverage of Kevin Foley and Adelaide Oval development, and continuing high petrol prices, “soft” housing market and high $A
Wave 46 (Aug 11) Fieldwork conducted after the August RBA meeting with no change to rates and the start of a substantial fall in global sharemarkets. Also during ongoing media coverage of State Government leadership issues, poor retail sales, continuing “soft” housing market and high $A
Wave 47 (Feb 12) Fieldwork conducted after the February RBA meeting with no change to rates, but amid some talk about “out of cycle” home loan rate increases by banks, poor retail sales, continuing “soft” housing market and high $A
Wave 48 (May 12) Fieldwork conducted after the May RBA meeting with a 0.5% cut to rates, and post the 2012 Federal Budget announcement.
Wave 49 (Aug 12) Fieldwork conducted after the August RBA meeting with rates remaining unchanged, continuing high $A, reasonable economic growth and unemployment figures, uncertainty about the future of Olympic Dam, and ongoing uncertainties with the global economy.
Wave 50 (Feb 13) Fieldwork conducted after the February RBA meeting with rates remaining unchanged, continuing high $A, reasonable post-Christmas economic figures, the share-market continuing to improve, after the announcement of the Federal election and the State Opposition leadership change. Also locally, leading in to “Mad March” which tend to lift confidence levels. Internationally, the US avoiding the fiscal cliff and the US Presidency settled, as well as some better news out of Europe
Page 20
March 2017 Report
Date of Fieldwork Comments
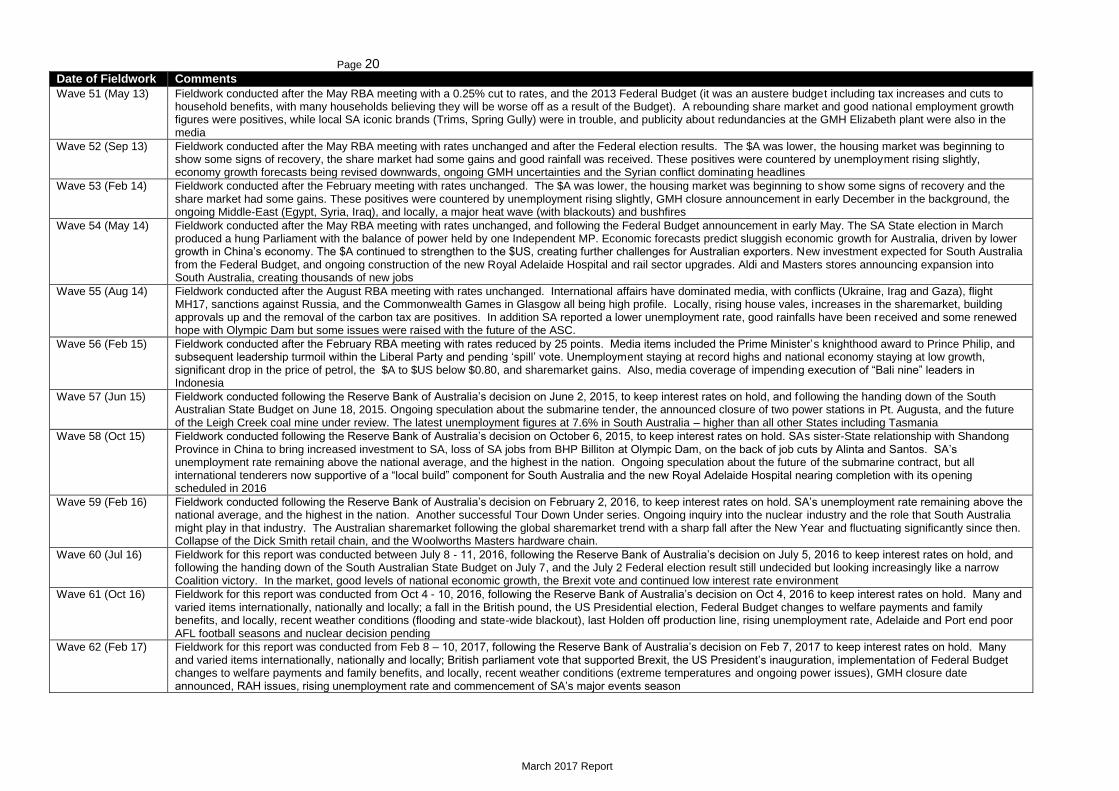
Wave 51 (May 13) Fieldwork conducted after the May RBA meeting with a 0.25% cut to rates, and the 2013 Federal Budget (it was an austere budget including tax increases and cuts to household benefits, with many households believing they will be worse off as a result of the Budget). A rebounding share market and good national employment growth figures were positives, while local SA iconic brands (Trims, Spring Gully) were in trouble, and publicity about redundancies at the GMH Elizabeth plant were also in the media
Wave 52 (Sep 13) Fieldwork conducted after the May RBA meeting with rates unchanged and after the Federal election results. The $A was lower, the housing market was beginning to show some signs of recovery, the share market had some gains and good rainfall was received. These positives were countered by unemployment rising slightly, economy growth forecasts being revised downwards, ongoing GMH uncertainties and the Syrian conflict dominating headlines
Wave 53 (Feb 14) Fieldwork conducted after the February meeting with rates unchanged. The $A was lower, the housing market was beginning to show some signs of recovery and the share market had some gains. These positives were countered by unemployment rising slightly, GMH closure announcement in early December in the background, the ongoing Middle-East (Egypt, Syria, Iraq), and locally, a major heat wave (with blackouts) and bushfires
Wave 54 (May 14) Fieldwork conducted after the May RBA meeting with rates unchanged, and following the Federal Budget announcement in early May. The SA State election in March produced a hung Parliament with the balance of power held by one Independent MP. Economic forecasts predict sluggish economic growth for Australia, driven by lower growth in China’s economy. The $A continued to strengthen to the $US, creating further challenges for Australian exporters. New investment expected for South Australia from the Federal Budget, and ongoing construction of the new Royal Adelaide Hospital and rail sector upgrades. Aldi and Masters stores announcing expansion into South Australia, creating thousands of new jobs
Wave 55 (Aug 14) Fieldwork conducted after the August RBA meeting with rates unchanged. International affairs have dominated media, with conflicts (Ukraine, Irag and Gaza), flight MH17, sanctions against Russia, and the Commonwealth Games in Glasgow all being high profile. Locally, rising house vales, increases in the sharemarket, building approvals up and the removal of the carbon tax are positives. In addition SA reported a lower unemployment rate, good rainfalls have been received and some renewed hope with Olympic Dam but some issues were raised with the future of the ASC.
Wave 56 (Feb 15) Fieldwork conducted after the February RBA meeting with rates reduced by 25 points. Media items included the Prime Minister’s knighthood award to Prince Philip, and subsequent leadership turmoil within the Liberal Party and pending ‘spill’ vote. Unemployment staying at record highs and national economy staying at low growth, significant drop in the price of petrol, the $A to $US below $0.80, and sharemarket gains. Also, media coverage of impending execution of “Bali nine” leaders in Indonesia
Wave 57 (Jun 15) Fieldwork conducted following the Reserve Bank of Australia’s decision on June 2, 2015, to keep interest rates on hold, and following the handing down of the South Australian State Budget on June 18, 2015. Ongoing speculation about the submarine tender, the announced closure of two power stations in Pt. Augusta, and the future of the Leigh Creek coal mine under review. The latest unemployment figures at 7.6% in South Australia – higher than all other States including Tasmania
Wave 58 (Oct 15) Fieldwork conducted following the Reserve Bank of Australia’s decision on October 6, 2015, to keep interest rates on hold. SAs sister-State relationship with Shandong Province in China to bring increased investment to SA, loss of SA jobs from BHP Billiton at Olympic Dam, on the back of job cuts by Alinta and Santos. SA’s unemployment rate remaining above the national average, and the highest in the nation. Ongoing speculation about the future of the submarine contract, but all international tenderers now supportive of a “local build” component for South Australia and the new Royal Adelaide Hospital nearing completion with its opening scheduled in 2016
Wave 59 (Feb 16) Fieldwork conducted following the Reserve Bank of Australia’s decision on February 2, 2016, to keep interest rates on hold. SA’s unemployment rate remaining above the national average, and the highest in the nation. Another successful Tour Down Under series. Ongoing inquiry into the nuclear industry and the role that South Australia might play in that industry. The Australian sharemarket following the global sharemarket trend with a sharp fall after the New Year and fluctuating significantly since then. Collapse of the Dick Smith retail chain, and the Woolworths Masters hardware chain.
Wave 60 (Jul 16) Fieldwork for this report was conducted between July 8 - 11, 2016, following the Reserve Bank of Australia’s decision on July 5, 2016 to keep interest rates on hold, and following the handing down of the South Australian State Budget on July 7, and the July 2 Federal election result still undecided but looking increasingly like a narrow Coalition victory. In the market, good levels of national economic growth, the Brexit vote and continued low interest rate environment
Wave 61 (Oct 16) Fieldwork for this report was conducted from Oct 4 - 10, 2016, following the Reserve Bank of Australia’s decision on Oct 4, 2016 to keep interest rates on hold. Many and varied items internationally, nationally and locally; a fall in the British pound, the US Presidential election, Federal Budget changes to welfare payments and family benefits, and locally, recent weather conditions (flooding and state-wide blackout), last Holden off production line, rising unemployment rate, Adelaide and Port end poor AFL football seasons and nuclear decision pending
Wave 62 (Feb 17) Fieldwork for this report was conducted from Feb 8 – 10, 2017, following the Reserve Bank of Australia’s decision on Feb 7, 2017 to keep interest rates on hold. Many and varied items internationally, nationally and locally; British parliament vote that supported Brexit, the US President’s inauguration, implementat ion of Federal Budget changes to welfare payments and family benefits, and locally, recent weather conditions (extreme temperatures and ongoing power issues), GMH closure date announced, RAH issues, rising unemployment rate and commencement of SA’s major events season
Related Documents


