Welcome message from author
This document is posted to help you gain knowledge. Please leave a comment to let me know what you think about it! Share it to your friends and learn new things together.
Transcript
The automobile technological systems.
An empirical analysis of four European
countries�
Riccardo Leoncini | Sandro [email protected] | [email protected]
IDSE{CNR, Via Amp�ere 56, 20131 Milano, Italy
September 24, 1999
Paper prepared for the
EUNIP International Conference
9-10 December 1999, Dublin, Ireland
Very preliminary. Comments welcome
�This paper has been produced within the Project \The Impact of Regulation on Innovation" (Contract No.13808-1998-03 F1EI SEV IT).
1
Abstract
The aim of this paper is to study the automobile industry of the most importantEuropean countries (France, Germany, Great Britain and Italy) from a sectoral,system perspective. The main relationships within and between the building blocksconstituting the automobile technological system are mapped and evaluated, bothin cross-sectional and in temporal terms. The importance of the sectoral TS as theunit of our analysis appears evident at both levels. Some general sectoral proper-ties emerge, which however hold in the four countries to a di�erent extent, thussuggesting how the institutional set-up works as a di�erentiating element. A sus-tained process of change in the various elements of the automobile TS is detected,nevertheless resulting in a relatively stable path of development. The countries con-sidered reveal di�erent patterns of motor vehicles trade specialisation in di�erentgeographical areas, with changes over time. Also foreign direct investments showthe existence of very di�erent trajectories and outward/inward balances.
2
1 Introduction
Although its meaning is not completely unambiguous, the concept of globalization seems to havebecome nowadays a useful catchword to describe the present phase of high international inte-gration (OECD, 1992). Not only has the volume of exchanges between countries increased, butalso new channels have been established to di�use goods, information and knowledge aroundthe world. This is also true with respect to technological change. The fact that innovationcan be produced and appropriated in locations other than those where �rms reside, by ex-ploiting a scienti�c knowledge base which spreads across countries, induces to think in termsof `techno{globalism'. Simultaneously, the innovative relationships established within and be-tween di�erent economic sectors, either deliberately (i.e. in terms of technological transfers) ornaturally (i.e. in terms of spillovers), have largely increased.
These phenomena have raised the problem of how to study the structure of a certain industryand its actual degree of `intersectoralisation' and `internationalisation'. In this paper we arguethat a sectoral interpretation of the concept of technological system (Carlsson and Stankiewicz,1991) can be usefully adopted in pursuing this objective.
Indeed, the spatial and interindustrial extension of the techno-economic relationships thatmake up for a technological system (TS) are two key elements in evaluating the structure of oneindustry and the nature of the structural change it eventually undergoes along time. Further-more, when it is accompanied by an institutional kind of analysis, the concept of sectoral TSallows for the integration of the domain of the institutional set-up | that regulates, constrainsand stimulates the production and the innovation processes of the relative organisations (�rms,research institutes, associations, etc.) | with the relevant techno{economic relations within acoherent framework.
The argument we put forward appears particularly relevant in the case of the automobileindustry. On the one hand, its `chain{value' appears to be one of the most interrelated, whenproducer{users and producer{producer relationships are considered, and when the role of in-stitutional regulations is clearly recognised, both as innovative constraints and as innovativeincentives. On the other hand, this sector is one in which international relationships are sowidespread to identify a truly transnational, if not even a global kind of TS.
This paper aims at empirically de�ning and evaluating the sectoral technological systemsof the automobile industry with respect to the most important European countries (France,Germany, Great Britain and Italy). In particular, using data on production and innovationintraindustry{intersectoral ows, along with data on bilateral trade and foreign direct invest-ment, we will try to map the relevant relationships within the main building blocks constitutingthe automobile TS. In so doing, we intend to furnish a novel viewpoint with which we will tryto make a direct appreciation of the phenomena linked to (or determining) the evolution of theautomobile industry, such as, for instance, the degree of decentralisation in production, at both
3
national and international level, and the relevant user-producer linkages.The paper is organised as follows. In paragraph 2 the extension of the automobile TS is
de�ned. Its peculiar dimensions are then analyised: the industrial structure and interactions(Par. 3), the innovative activities (Par. 4), and the international relationships (Par. 5).Paragraph 6 concludes.
2 The extension of the automobile technological system
As we said already said, in this paper we are interested neither in an industrial nor in aorganisational analysis of the automobile industry, for which there is abundance of literature.We want instead to present a rather di�erent angle from which to look at it. Indeed, whatwe propose here is to analyse the automobile TS, which is constituted by the clustering of thetechno{economic activities of the relevant actors, and therefore is quite di�erent in its extensionfrom the automobile sector itself.
The aim of this paragraph is to de�ne the domain of such a TS. The way we intend to do it isby referring to the extent to which the automobile �rms interact and enlarge their relationshipswith other organisations of the economic system. Therefore, we will refer to the huge and variedliterature on the institutional analyses of techno{economic relationships which goes under themain heading of national systems of innovation/technological systems (e.g. Lundvall, 1992;Nelson, 1993; Carlsson, 1995; De Liso and Metcalfe, 1996; Edquist, 1997; Leoncini, 1998; etc.).
In particular we will consider, on the one hand, that part of the literature on technologicalsystems that refers to sectoral or industrial speci�cations. This approach di�ers from othersthat refer explicitly to the geographical extension of the set of institutions supporting, shapingand determining the rate and direction of techno{economic activity (Lundvall, 1988, p. 10;Nelson and Rosenberg, 1993, p. 3). Indeed, although the relevance of the institutional set-upseems to `constrain' the vision of the system considered, and hence to force a national (orregional) view of these kinds of relationships, a sectoral approach is also extremely relevant inunderstanding technological change.
On the other hand, in our analysis we will also consider some other contributions whichrefer to the importance of the clusterisation of techno{economic activities.1 Indeed, �rms andother institutional actors are linked by di�erent kinds of interactions (such as, for example,user-producer and input{output relations) and constitute networks which are reducible neitherto the industry nor to the nation level. Although both levels are liable to be appropriatedimensions for an industry such as motor vehicles, whose actors are surely national champions,it also true that they extend their �eld of action in other industries too, both indise and outside
1Such as Carlsson and Stankiewicz (1991). See also, in another but related �eld, Hughes (1989).
4
their own countries.2
Our starting point is therefore the idea that there exists a `sectoral' TS for the automobileindustry, which has an interindustrial dimension that is, for some aspects, bigger than that ofthe nation, and for some other a smaller one. The de�nition of the boundaries of the automobileTS thus becomes a very important issue and cannot be resolved with an ad hoc de�nition.3
Indeed, it is crucial in order to identify the domain within which the main institutional andtechno{economic relationships occur and should therefore be preliminary to the analysis of thenature of the relevant actors and the kind of clustering they constitute.
In this paper, we will therefore try to determine the extension and the characteristics ofthe automobile TS for France, Germany, Great Britain and Italy, by looking at three interre-lated aspects: the type and intensity of the industrial relationships, the nature and the mapof the innovative interactions, and the structure and the direction of their international exten-sion. Indeed, these are three important dimensions to understand how di�erent institutionalarrangements among actors generate di�erent techno{economic performances in the automobileindustry. This is possible essentially because this particular TS is constituted by few big actorsacting contemporarily at a supranational{regional level, but also with a relevant intra{nationalfocus as far as the main techno{economic activities are concerned.
3 The industry side
This paragraph is devoted to the analysis of the automobile TS from an industry perspective.First, through data of general nature, we will brie y sketch some features of its relative weightwithin the European Union and of its structure (Paragraph 3.1). As the literature about thistopic has become really massive, the picture we provide is deliberately not very detailed. Wewill rather focus on relational kind of aspects, for which the analysis is not yet fully developed.More precisely, by means of input{output techniques, we intend to investigate the role of thesurrounding industrial set-up for the material acquisitions and di�usions of the automobilesector (Paragraph 3.2). In so doing, we will be able to infer and analyse how the di�erentinstitutional arrangements of the investigated countries are able to in uence the establishmentof di�erent patterns of interactions among those actors which make up for its chain-value.
Preliminarily, it must be stressed that, both in the present and in the following sections(4.2 and 4.3), our analysis has been constrained by the availability of comparable input{outputtables and innovation data for the four investigated countries. Some speci�c years and sectoral
2Obviously, there are not very clear cut distinctions, and, as Carlsson and Stankiewicz (1991, p. 111) pointout, their notion of TS and that of NSI are due to nearly coincide if the TS is given a national dimension.
3These problems apply, though in a di�erent way, also to national TS. See Leoncini and Montresor (1999a)for an investigation of the extension of a group of national TS.
5
disaggregations had therefore to be chosen. However, the structural nature of the relevant dataallows us to extend the relative results at least to a certain extent.4
3.1 General outlook
This section aims at giving a very brief and idiosyncratic picture of the European automobileindustry, with a particular emphasis on the four countries that are the focus of this paper(France, Germany, Great Britain and Italy). As we have already said, we will limit ourselvesto a very general overview for at least two reasons. On the one hand, the literature on theissue is really massive, and it is not our aim to replicate existing analyses. On the otherhand, the declared intent of this paper is quite circumscribed, as the focus is on relational (i.e.interactive) aspects. Accordingly, at this stage, we will analyse few overall data, in order tobetter understand which are the problems at stake in dealing with the kind of empirical analysiswe intend to pursue.
First, we will only consider ten European producers (BMW, Fiat, Ford, General Motors,Mercedes, PSA, Renault, Saab, Volkswagen and Volvo) and exclude the other brands that theyown in di�erent ways. Second, in this section we will consider only production in West{Europeand leave out the volume of production made elsewhere by these ten producers. This is becausewe are interested in the patterns of production that the big manufacturers implement in theirhome country and in countries with comparable techno{economic conditions. Third, we willmainly refer to some recent years for which we have suÆciently detailed data. In spite of thesecaveats, some facts are quite relevant for our analysis.
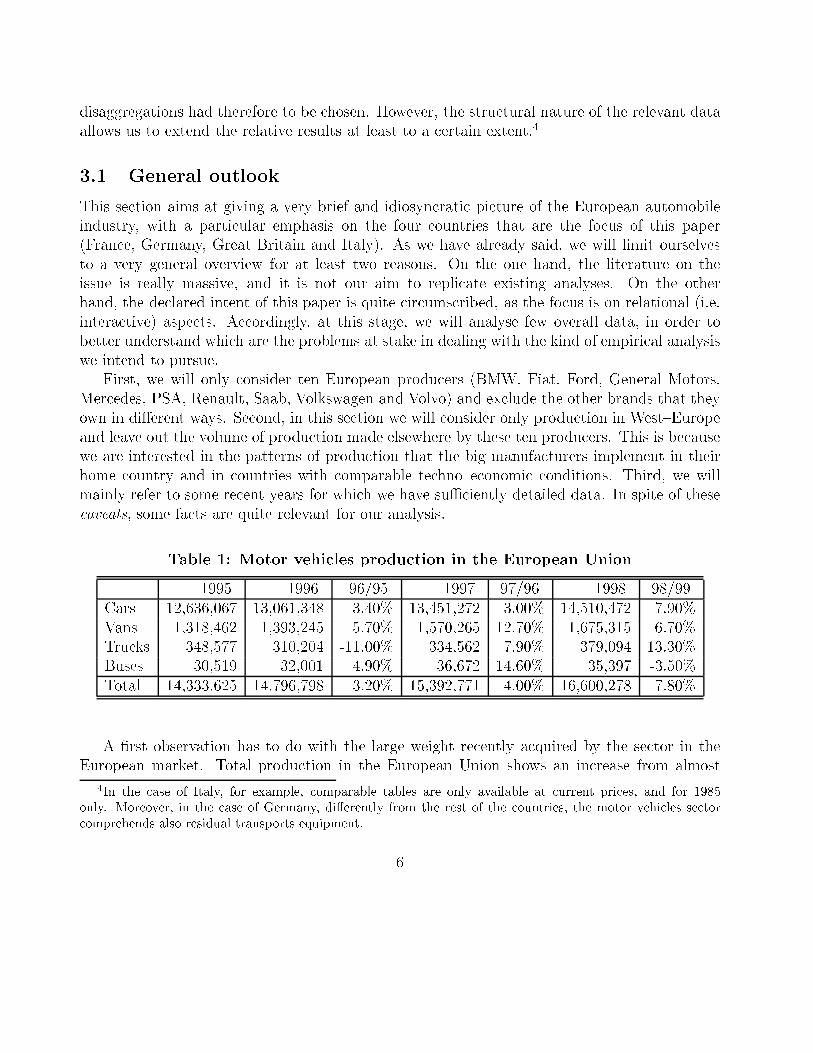
Table 1: Motor vehicles production in the European Union
1995 1996 96/95 1997 97/96 1998 98/99Cars 12,636,067 13,061,348 3.40% 13,451,272 3.00% 14,510,472 7.90%Vans 1,318,462 1,393,245 5.70% 1,570,265 12.70% 1,675,315 6.70%Trucks 348,577 310,204 -11.00% 334,562 7.90% 379,094 13.30%Buses 30,519 32,001 4.90% 36,672 14.60% 35,397 -3.50%Total 14,333,625 14,796,798 3.20% 15,392,771 4.00% 16,600,278 7.80%
A �rst observation has to do with the large weight recently acquired by the sector in theEuropean market. Total production in the European Union shows an increase from almost
4In the case of Italy, for example, comparable tables are only available at current prices, and for 1985only. Moreover, in the case of Germany, di�erently from the rest of the countries, the motor vehicles sectorcomprehends also residual transports equipment.
6
14 million vehicles in 1995 to 16 millions in 1998, with an increasing rate of change (Table1). Indeed, although the production of cars has witnessed a doubling of its rate of changein 1998, favourable elements have to be considered, such as the well known policies of Stateaid to consumers (via scrapping schemes). Furthermore, let us observe that the extent of thevariations is di�erent for di�erent classes of vehicles, and that, for example, commercial vehiclesshow more marked cyclical variations.5
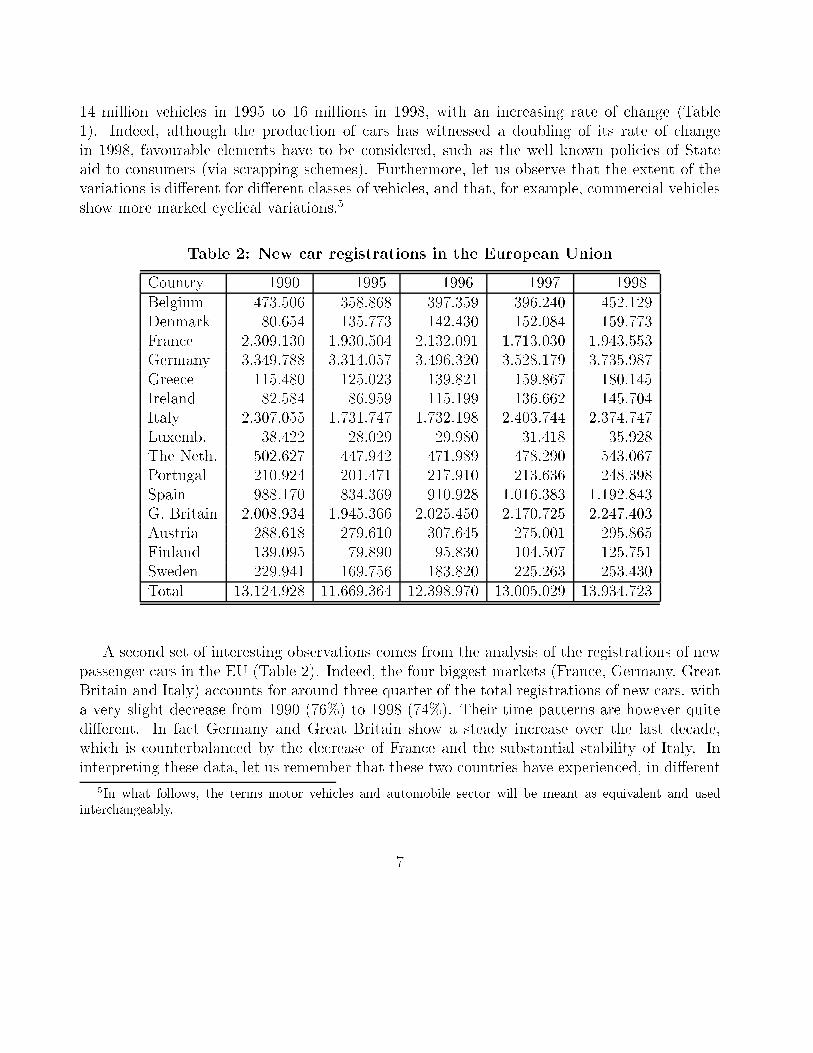
Table 2: New car registrations in the European Union
Country 1990 1995 1996 1997 1998Belgium 473.506 358.868 397.359 396.240 452.129Denmark 80.654 135.773 142.430 152.084 159.773France 2.309.130 1.930.504 2.132.091 1.713.030 1.943.553Germany 3.349.788 3.314.057 3.496.320 3.528.179 3.735.987Greece 115.480 125.023 139.821 159.867 180.145Ireland 82.584 86.959 115.199 136.662 145.704Italy 2.307.055 1.731.747 1.732.198 2.403.744 2.374.747Luxemb. 38.422 28.029 29.980 31.418 35.928The Neth. 502.627 447.942 471.989 478.290 543.067Portugal 210.924 201.471 217.910 213.636 248.398Spain 988.170 834.369 910.928 1.016.383 1.192.843G. Britain 2.008.934 1.945.366 2.025.450 2.170.725 2.247.403Austria 288.618 279.610 307.645 275.001 295.865Finland 139.095 79.890 95.830 104.507 125.751Sweden 229.941 169.756 183.820 225.263 253.430Total 13.124.928 11.669.364 12.398.970 13.005.029 13.934.723
A second set of interesting observations comes from the analysis of the registrations of newpassenger cars in the EU (Table 2). Indeed, the four biggest markets (France, Germany, GreatBritain and Italy) accounts for around three quarter of the total registrations of new cars, witha very slight decrease from 1990 (76%) to 1998 (74%). Their time patterns are however quitedi�erent. In fact Germany and Great Britain show a steady increase over the last decade,which is counterbalanced by the decrease of France and the substantial stability of Italy. Ininterpreting these data, let us remember that these two countries have experienced, in di�erent
5In what follows, the terms motor vehicles and automobile sector will be meant as equivalent and usedinterchangeably.
7
times, State funded scrapping schemes which contributed to smooth the decline. Such a policyworked better in Italy probably because of the older age of the car stock. Indeed, in 1997 newcar registrations in Italy increased by 38.8%, while one year before in France the increase was`just' 10.4%. Spain is the only other European market to overcome the threshold of one millionnew cars registered.
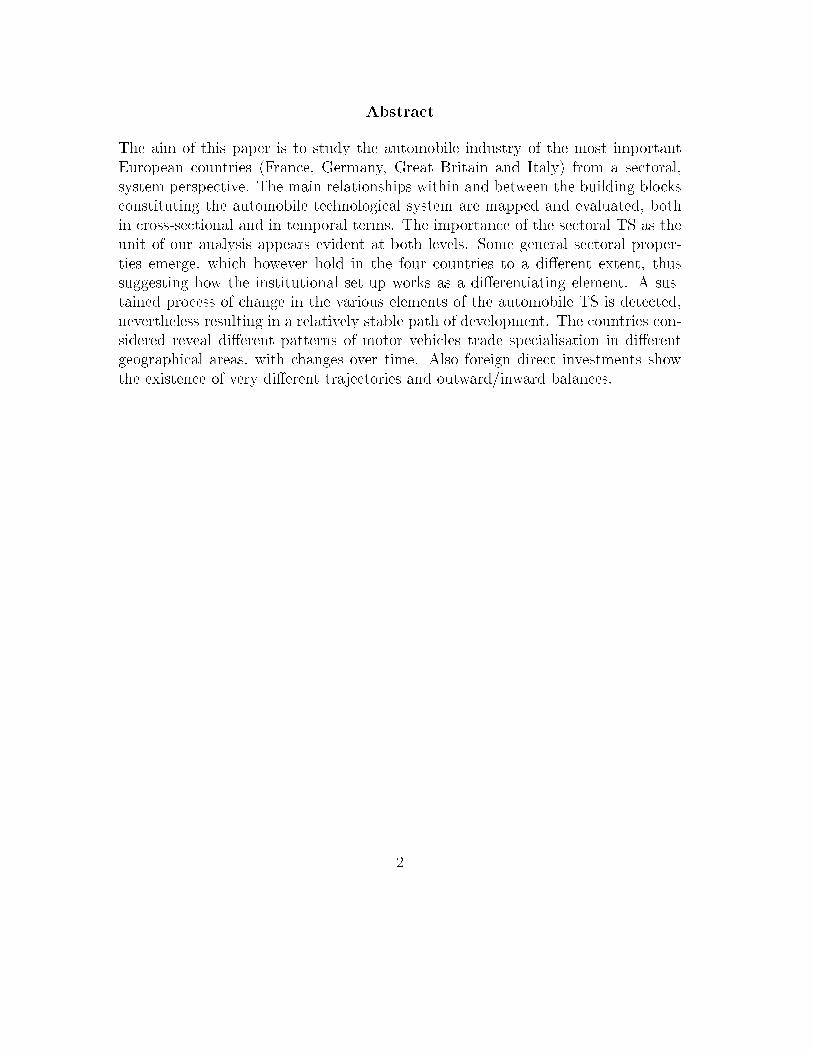
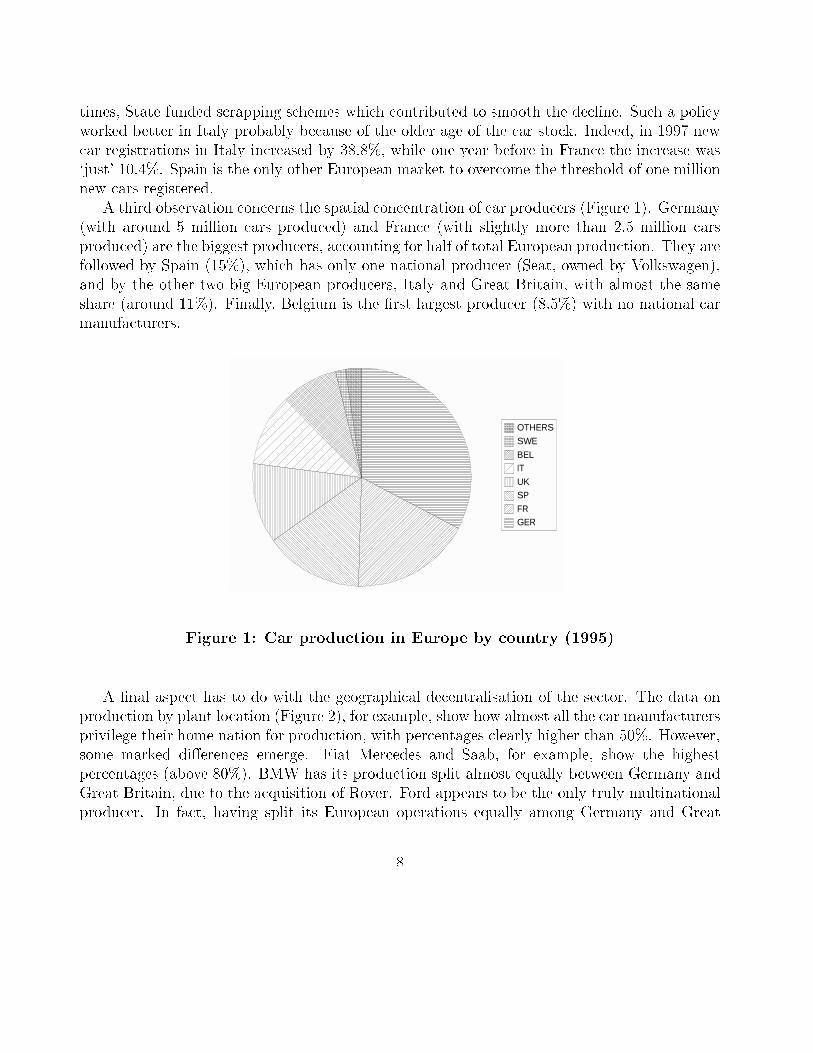
A third observation concerns the spatial concentration of car producers (Figure 1). Germany(with around 5 million cars produced) and France (with slightly more than 2.5 million carsproduced) are the biggest producers, accounting for half of total European production. They arefollowed by Spain (15%), which has only one national producer (Seat, owned by Volkswagen),and by the other two big European producers, Italy and Great Britain, with almost the sameshare (around 11%). Finally, Belgium is the �rst largest producer (8.5%) with no national carmanufacturers.
OTHERS
SWE
BELIT
UKSP
FRGER
Figure 1: Car production in Europe by country (1995)
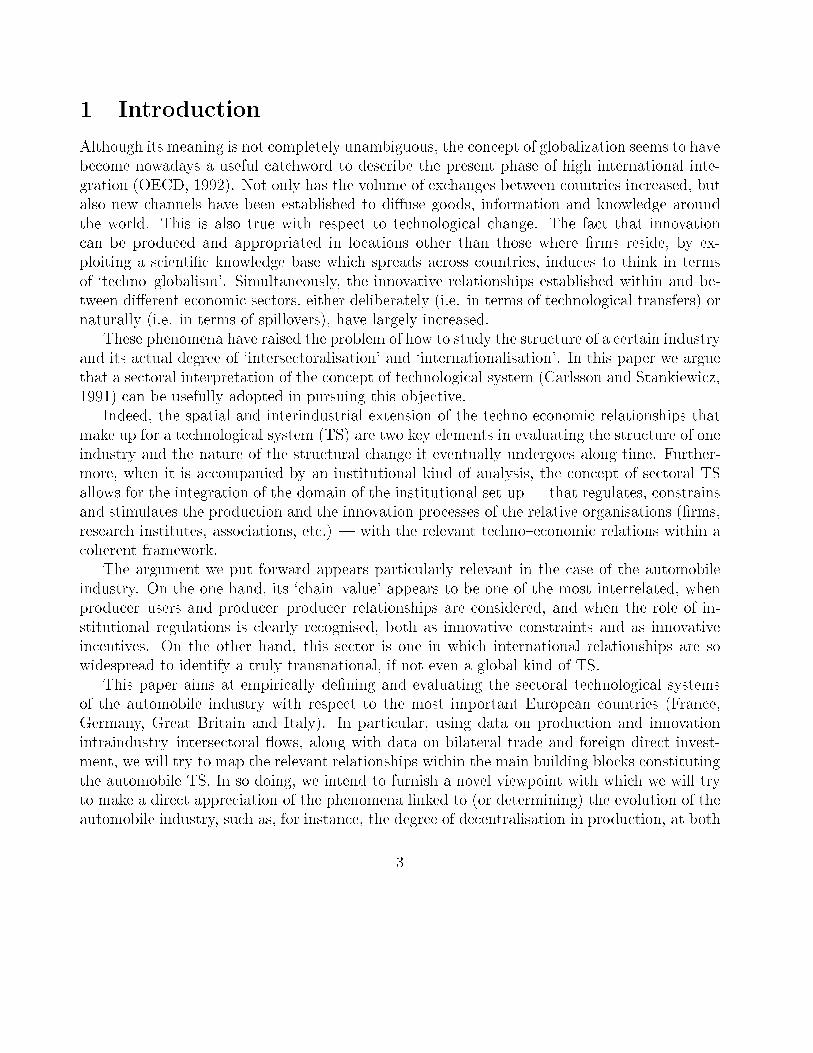
A �nal aspect has to do with the geographical decentralisation of the sector. The data onproduction by plant location (Figure 2), for example, show how almost all the car manufacturersprivilege their home nation for production, with percentages clearly higher than 50%. However,some marked di�erences emerge. Fiat Mercedes and Saab, for example, show the highestpercentages (above 80%). BMW has its production split almost equally between Germany andGreat Britain, due to the acquisition of Rover. Ford appears to be the only truly multinationalproducer. In fact, having split its European operations equally among Germany and Great
8
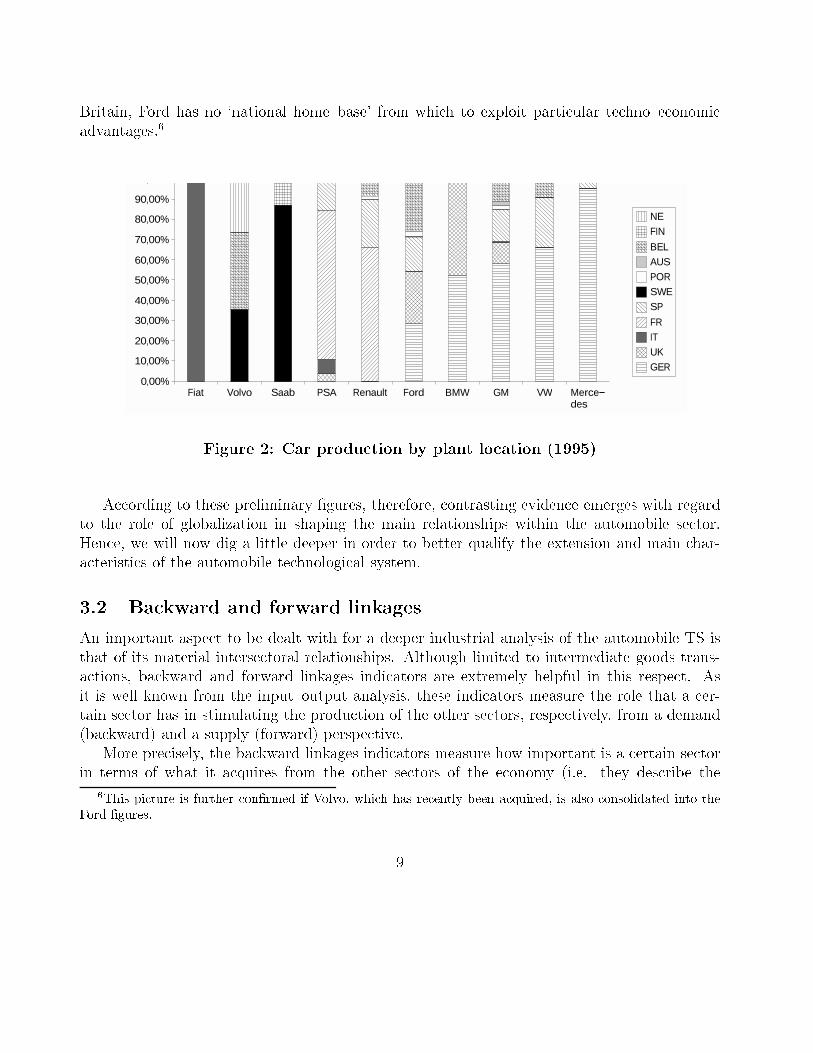
Britain, Ford has no `national home{base' from which to exploit particular techno{economicadvantages.6
Fiat Volvo Saab PSA Renault Ford BMW GM VW Merce−−des
0,00%
10,00%
20,00%
30,00%
40,00%
50,00%
60,00%
70,00%
80,00%
90,00%
,
NE
FIN
BEL
AUS
POR
SWE
SP
FR
IT
UK
GER
Figure 2: Car production by plant location (1995)
According to these preliminary �gures, therefore, contrasting evidence emerges with regardto the role of globalization in shaping the main relationships within the automobile sector.Hence, we will now dig a little deeper in order to better qualify the extension and main char-acteristics of the automobile technological system.
3.2 Backward and forward linkages
An important aspect to be dealt with for a deeper industrial analysis of the automobile TS isthat of its material intersectoral relationships. Although limited to intermediate goods trans-actions, backward and forward linkages indicators are extremely helpful in this respect. Asit is well known from the input{output analysis, these indicators measure the role that a cer-tain sector has in stimulating the production of the other sectors, respectively, from a demand(backward) and a supply (forward) perspective.
More precisely, the backward linkages indicators measure how important is a certain sectorin terms of what it acquires from the other sectors of the economy (i.e. they describe the
6This picture is further con�rmed if Volvo, which has recently been acquired, is also consolidated into theFord �gures.
9
material transactions of a sector with the rest of the economy from an input perspective). Twobackward linkages indicators are available: direct and total. The �rst one accounts only for theacquisitions made by one sector from the others to obtain its immediate inputs. Analytically, theindicator of direct backward linkages (DBL) is given, for a generic sector j, by the correspondentsum by column of the input coeÆcient matrix, A:
DBLj =X
i
aij
where aij is the generic element of A, de�ned as A = (X)(x̂)�1, where X is the intersectoralproduction matrix, while x̂ is the diagonal vector of total sectoral output. Accordingly, 0 <DBLj < 1.
The total backward linkages indicator (TBL) refers to both the direct and indirect acqui-sitions (i.e. in subsequent production rounds) that a certain sector makes from the others.Formally, for a generic sector j, it is given by the correspondent sum by column of the Leontiefinverse:
TBLj =X
i
�ij
where �ij is the generic element of the Leontief inverse, L, de�ned as L = (I�A)�1, where Iis the identity matrix.
In addition to backward linkages, forward linkages indicators can also be de�ned, whichmeasure the role of a certain sector for the acquisitions of the others (i.e. they indicate howimportant is a sector for the rest of the economy from an output perspective).
Similarly to the backward linkages indicators, also forward linkages ones can be either director total. The former, which still refer to the output that a certain sector directly provides tothe others (DFL), is given by the sum by row of the output coeÆcient matrix, A�. For thegeneric sector i, it is de�ned as:
DFLi =X
j
a�ij
where a�ij is the generic element of A�, de�ned as A� = (x̂)�1(X):
The total forward linkages indicator (TFL), which again measures the importance of acertain sector in terms of the output that it provides to the others, both directly and indirectly,is given by the sum by row of the `output' Leontief inverse, L�. Analytically, for the genericsector i it s given by:
TFLi =X
j
��ij
where ��ij is the generic element of L�, in turn de�ned as L� = (I�A�)�1:
Coming now to the calculation of the four indicators for the automobile sector of the coun-tries considered (Table 3), some particular methodological choices have been made. The years
10
of reference have been selected on the basis of the availability of comparable I{O tables (DSTI(STAN, I{O), 1994). Their matching has brought us to work out the previous indicators withrespect to a 30 sectors disaggregation (see Appendix A.1).
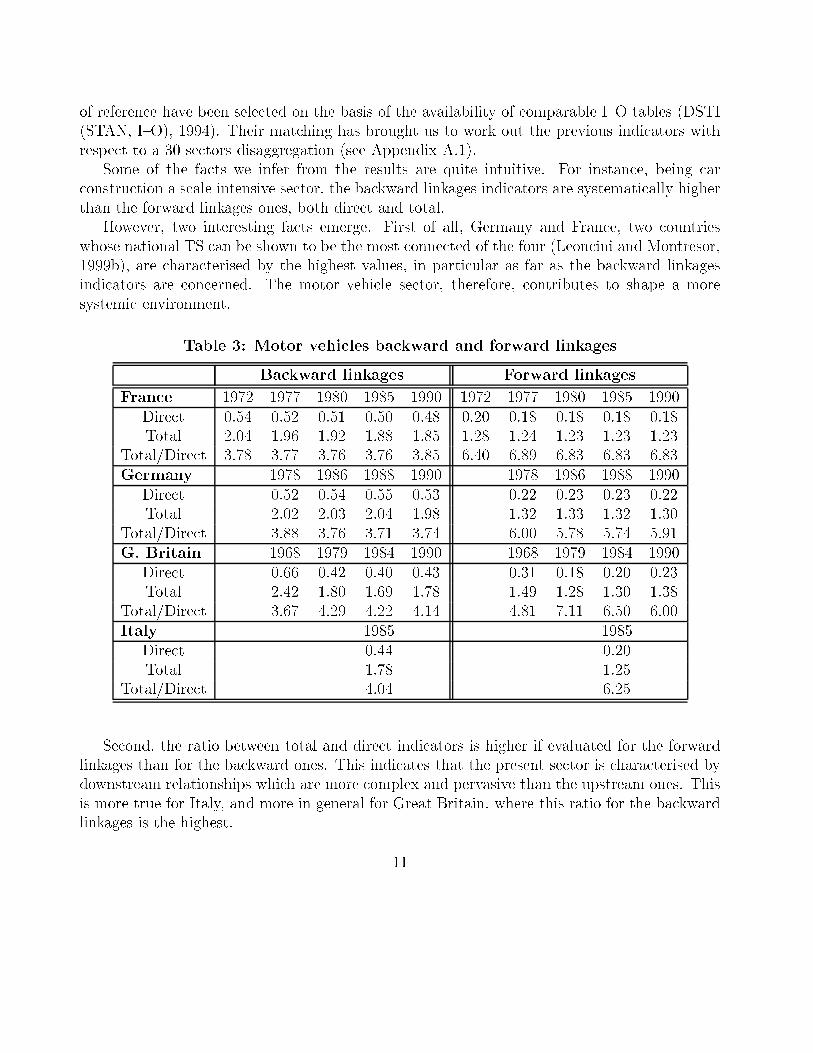
Some of the facts we infer from the results are quite intuitive. For instance, being carconstruction a scale intensive sector, the backward linkages indicators are systematically higherthan the forward linkages ones, both direct and total.
However, two interesting facts emerge. First of all, Germany and France, two countrieswhose national TS can be shown to be the most connected of the four (Leoncini and Montresor,1999b), are characterised by the highest values, in particular as far as the backward linkagesindicators are concerned. The motor vehicle sector, therefore, contributes to shape a moresystemic environment.
Table 3: Motor vehicles backward and forward linkages
Backward linkages Forward linkages
France 1972 1977 1980 1985 1990 1972 1977 1980 1985 1990Direct 0.54 0.52 0.51 0.50 0.48 0.20 0.18 0.18 0.18 0.18Total 2.04 1.96 1.92 1.88 1.85 1.28 1.24 1.23 1.23 1.23
Total/Direct 3.78 3.77 3.76 3.76 3.85 6.40 6.89 6.83 6.83 6.83Germany 1978 1986 1988 1990 1978 1986 1988 1990
Direct 0.52 0.54 0.55 0.53 0.22 0.23 0.23 0.22Total 2.02 2.03 2.04 1.98 1.32 1.33 1.32 1.30
Total/Direct 3.88 3.76 3.71 3.74 6.00 5.78 5.74 5.91G. Britain 1968 1979 1984 1990 1968 1979 1984 1990
Direct 0.66 0.42 0.40 0.43 0.31 0.18 0.20 0.23Total 2.42 1.80 1.69 1.78 1.49 1.28 1.30 1.38
Total/Direct 3.67 4.29 4.22 4.14 4.81 7.11 6.50 6.00Italy 1985 1985
Direct 0.44 0.20Total 1.78 1.25
Total/Direct 4.04 6.25
Second, the ratio between total and direct indicators is higher if evaluated for the forwardlinkages than for the backward ones. This indicates that the present sector is characterised bydownstream relationships which are more complex and pervasive than the upstream ones. Thisis more true for Italy, and more in general for Great Britain, where this ratio for the backwardlinkages is the highest.
11
Indeed, the British automobile TS seems to be the only one in which the sector reveals astructural kind of change. The values of both types of indicators tend to decrease along time(apart from the starting period), di�erently from the other countries, where they remain moreor less stable. Di�erent interpretations can of course be put forward to explain this evidence.Among the others, the e�ects of an increase in the internationalisation degree of the same sectoralong the considered period seems to be con�rmed by the fact that the indicators are build upon total matrices, including both internal and imported production.
4 The innovative side
Although the economic relationships we have previously observed are very important to identifya TS, their innovative counterpart (i.e. the innovative sub{system) constitutes its core. Accord-ingly, in this paragraph a thorough analysis of the innovative structure will be provided. Firstof all, we will detail the main indicators of the innovative e�orts of the automobile TS, thatis, their R&D expenditure and patenting activity. Subsequently, we will evaluate the techno{economic interrelationships of the TS by analysing the innovative pervasivity and dependencyof the relative sector, and by mapping the network of their relative innovation ows.
4.1 R&D and patents
As it is well known, although with some caveats, R&D expenditure and patents can be utilised,respectively, as input and output indicators of the innovative activity.7 Accordingly, they allowus to track down how the di�erent arrangements of each TS are re ected into its technologicalperformance, both in terms of incentives and eÆciency. Indeed, on the one side, the level ofR&D expenditure is likely to be correlated to the perceived market possibilities open to thevarious �rms. While the translation of purely technological activity into innovation, and henceinto e�ective techno{economic performances, can be approximated by the level of patentingactivity (e.g. by patents count).
As far as the R&D expenditure is concerned, we do not want to elaborate on well knownfeatures of the innovative performances of the four TS investigated. On the contrary, as wehave already done for the industry side, we will highlight few idiosyncratic data in order toshow some peculiarities which are useful for our particular discussion.
At the outset, let us observe how, along the chosen period, the R&D expenditure in thissector has substantially increased its weight in absolute terms. In particular, from 1973 to 1980it has undergone a steady increase (DSTI (STAN, Anberd), 1994). If 1973 is made equal to 100,
7It is not the aim of this paper to discuss in deep the pros and cons of these innovative proxies. For moredetails, see, among others, Patel and Pavitt (1995).
12
in 1980 R&D expenditure was 275, with the highest and the lowest values for Germany (359)and for Italy (193) respectively. This period has been followed by the substantial stand{byaround an average of more or less 250 for the �rst half of the `80s. Since then R&D has showna very substantial increase, reaching an average of 892 in 1992, with Germany and GreatBritain respectively as top (1294) and worst performer (639). Along the period considered(1973{1992), the four countries have experienced an average compounded rate of growth equalto 11.6%. Germany has the highest growth rate (13.7%), followed by Italy (11.3%), France(10.8%), and Great Britain (9.7%).
1973 1974 1975 1976 1977 1978 1979 1980 1981 1982 1983 1984 1985 1986 1987 1988 1989 1990 199100
0.005
0.01
0.015
0.02
0.025
0.03
0.035
0.04
France
Germany
G. Britain
Italy
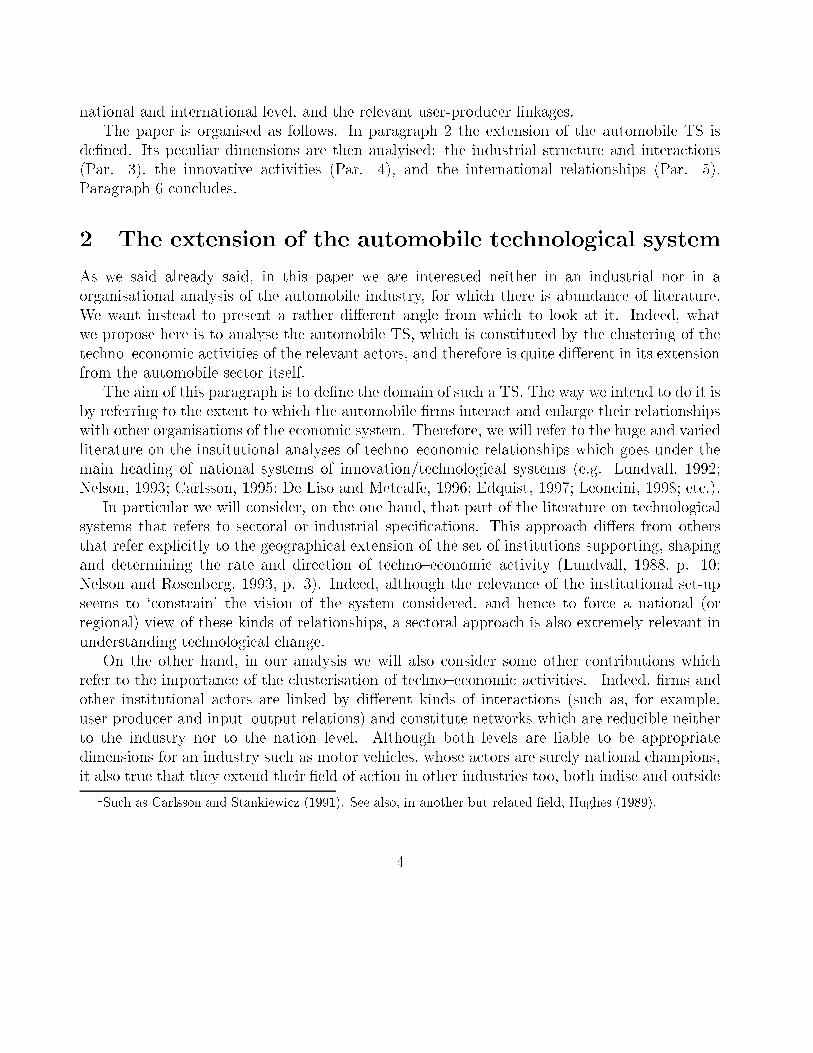
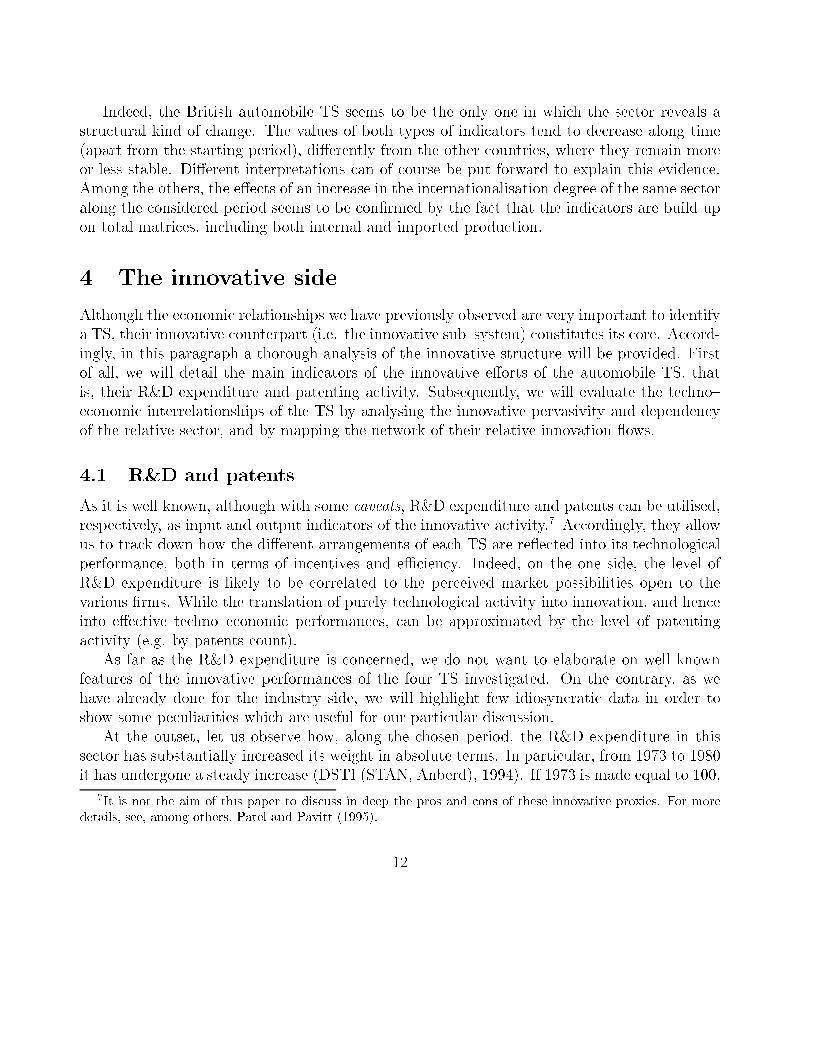
Figure 3: Quota of R&D in motor vehicles on total manufacturing production
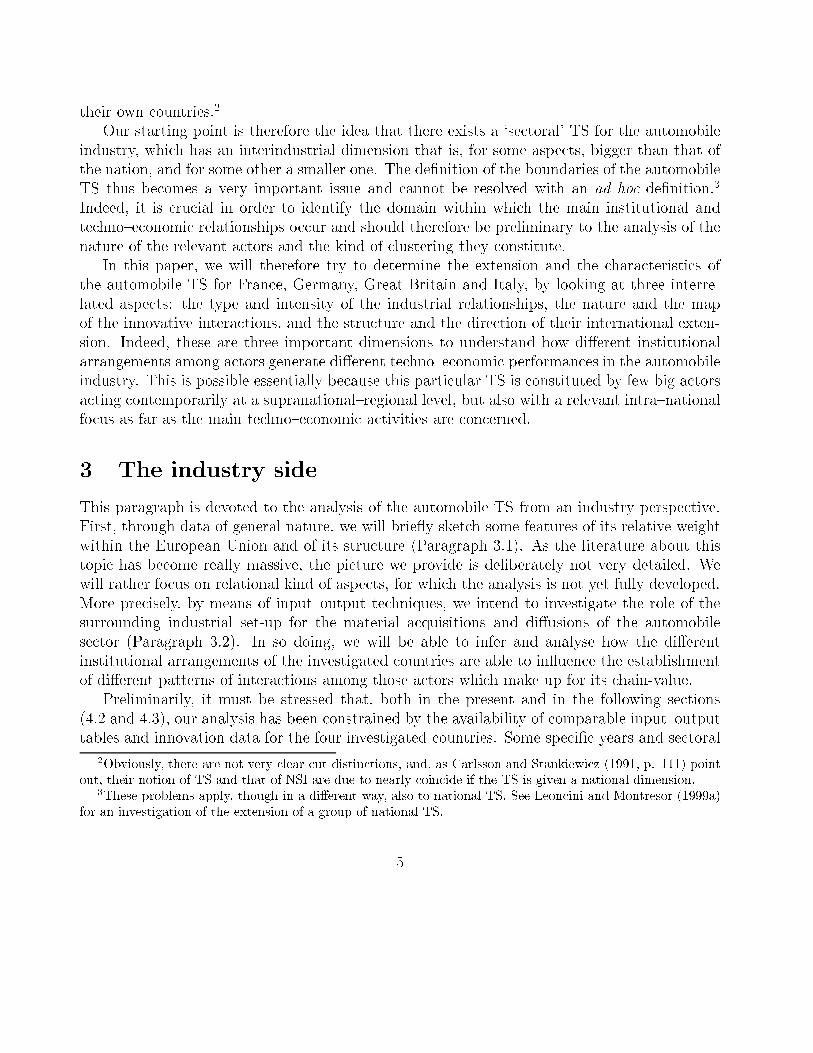
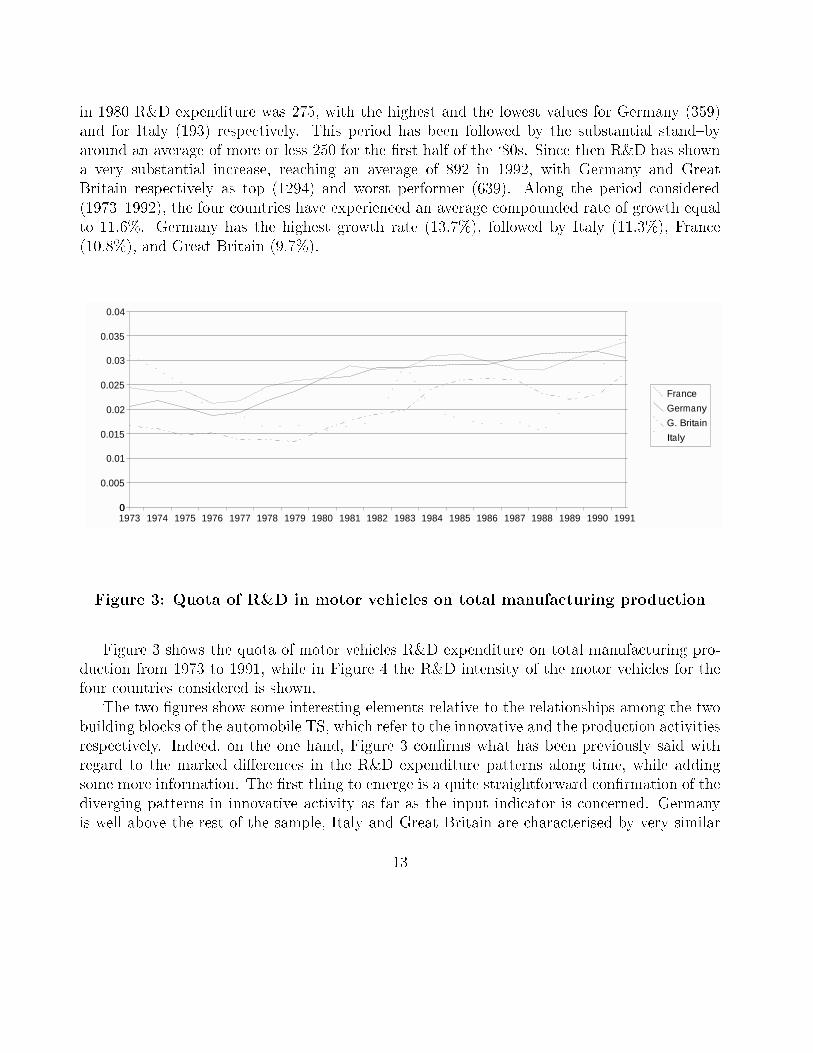
Figure 3 shows the quota of motor vehicles R&D expenditure on total manufacturing pro-duction from 1973 to 1991, while in Figure 4 the R&D intensity of the motor vehicles for thefour countries considered is shown.
The two �gures show some interesting elements relative to the relationships among the twobuilding blocks of the automobile TS, which refer to the innovative and the production activitiesrespectively. Indeed, on the one hand, Figure 3 con�rms what has been previously said withregard to the marked di�erences in the R&D expenditure patterns along time, while addingsome more information. The �rst thing to emerge is a quite straightforward con�rmation of thediverging patterns in innovative activity as far as the input indicator is concerned. Germanyis well above the rest of the sample, Italy and Great Britain are characterised by very similar
13
1973 1974 1975 1976 1977 1978 1979 1980 1981 1982 1983 1984 1985 1986 1987 1988 1989 1990 1991 1992 199300
0.0005
0.001
0.0015
0.002
0.0025
0.003
0.0035
0.004
0.0045
France
Germany
G. Britain
Italy
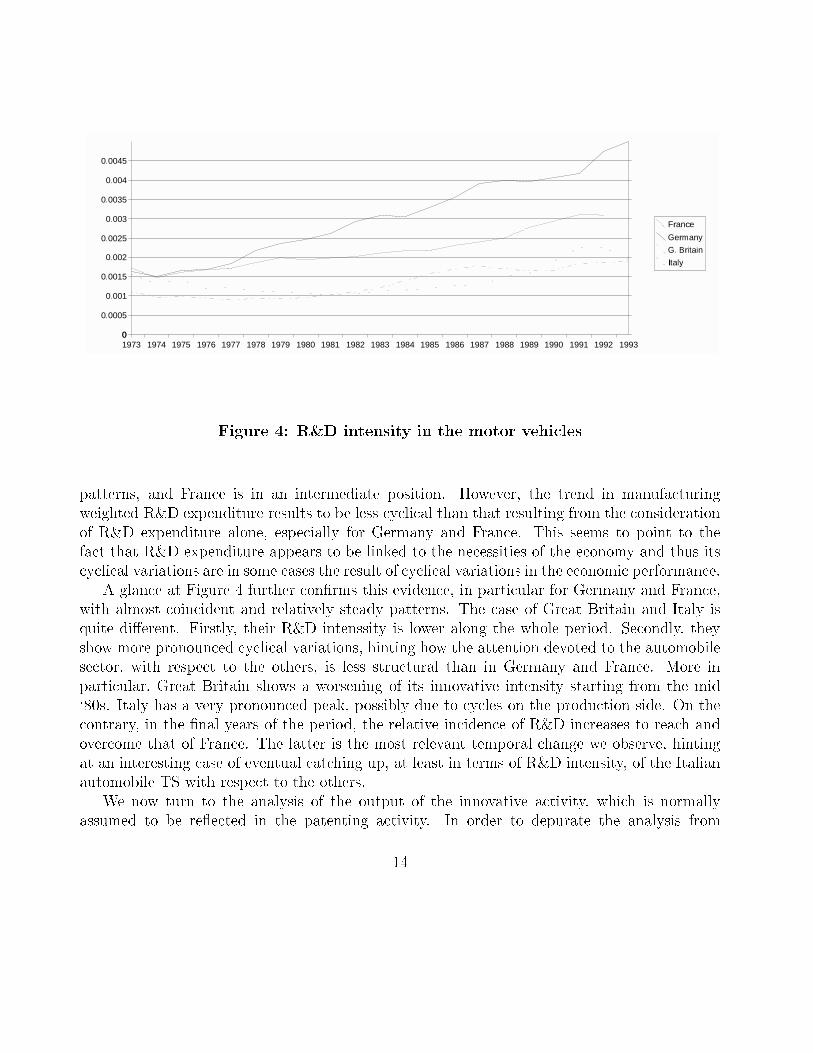
Figure 4: R&D intensity in the motor vehicles
patterns, and France is in an intermediate position. However, the trend in manufacturingweighted R&D expenditure results to be less cyclical than that resulting from the considerationof R&D expenditure alone, especially for Germany and France. This seems to point to thefact that R&D expenditure appears to be linked to the necessities of the economy and thus itscyclical variations are in some cases the result of cyclical variations in the economic performance.
A glance at Figure 4 further con�rms this evidence, in particular for Germany and France,with almost coincident and relatively steady patterns. The case of Great Britain and Italy isquite di�erent. Firstly, their R&D intenssity is lower along the whole period. Secondly, theyshow more pronounced cyclical variations, hinting how the attention devoted to the automobilesector, with respect to the others, is less structural than in Germany and France. More inparticular, Great Britain shows a worsening of its innovative intensity starting from the mid`80s. Italy has a very pronounced peak, possibly due to cycles on the production side. On thecontrary, in the �nal years of the period, the relative incidence of R&D increases to reach andovercome that of France. The latter is the most relevant temporal change we observe, hintingat an interesting case of eventual catching up, at least in terms of R&D intensity, of the Italianautomobile TS with respect to the others.
We now turn to the analysis of the output of the innovative activity, which is normallyassumed to be re ected in the patenting activity. In order to depurate the analysis from
14
1977 1978 1979 1980 1981 1982 1983 1984 1985 1986 1987 1988 1989 1990 1991 1992 1993 1994 1995−0.15
−0.1
−0.05
00
0.05
0.1
0.15
0.2
0.25
0.3
0.35
France
Germ any
ItalyUK
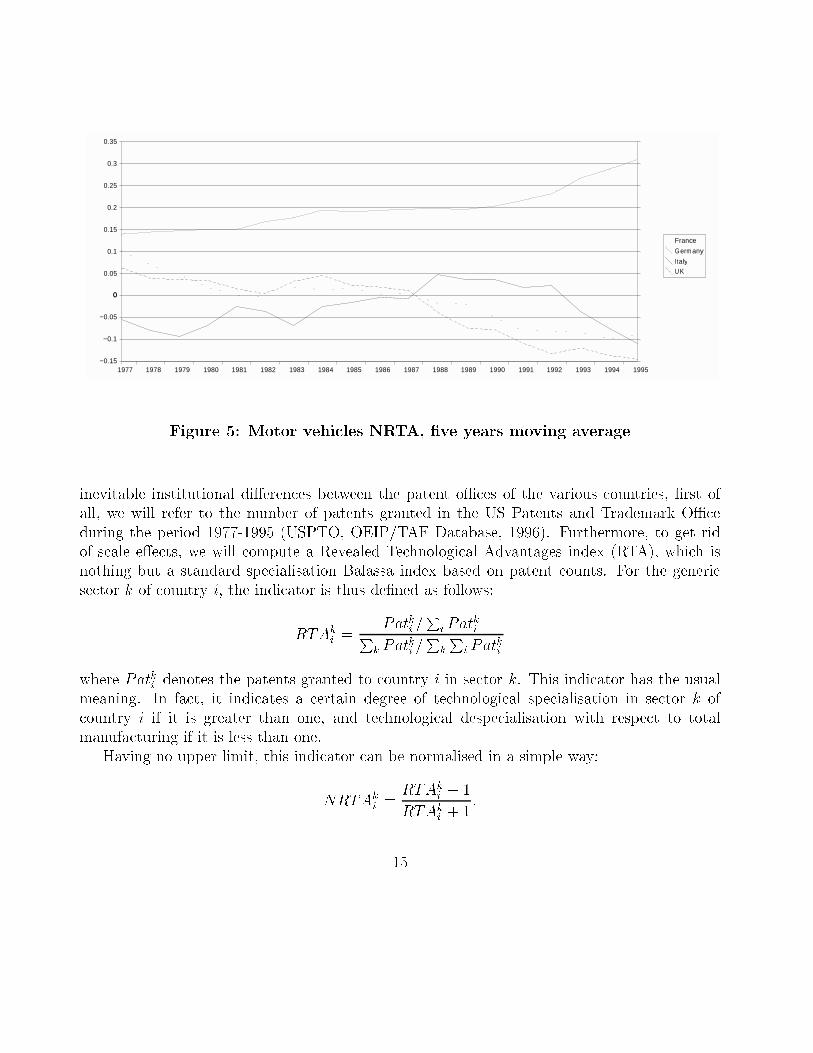
Figure 5: Motor vehicles NRTA, �ve years moving average
inevitable institutional di�erences between the patent oÆces of the various countries, �rst ofall, we will refer to the number of patents granted in the US Patents and Trademark OÆceduring the period 1977-1995 (USPTO, OEIP/TAF Database, 1996). Furthermore, to get ridof scale e�ects, we will compute a Revealed Technological Advantages index (RTA), which isnothing but a standard specialisation Balassa index based on patent counts. For the genericsector k of country i, the indicator is thus de�ned as follows:
RTAki =
Patki =P
i PatkiP
k Patki =P
k
Pi Pat
ki
where Patki denotes the patents granted to country i in sector k. This indicator has the usualmeaning. In fact, it indicates a certain degree of technological specialisation in sector k ofcountry i if it is greater than one, and technological despecialisation with respect to totalmanufacturing if it is less than one.
Having no upper limit, this indicator can be normalised in a simple way:
NRTAki =
RTAki � 1
RTAki + 1
:
15
Accordingly, country i turns out to be specialised in sector k if �1 < NRTAki < 0, while it is
despecialised if 0 < NRTAki < 1.
The analysis of Figure 5 shows quite clear patterns. Indeed, a rather evident diverging trendin patenting emerges, suggesting an increasing level of polarisation in the innovative results ofthe di�erent TS. Germany is in fact the only country with positive and increasing values of theNRTA for the whole period examined. On the opposite, the rest of the countries experience adecline in their relative technological advantages, though with di�erent intensity. France hasthe steepest declining trend. Starting from positive values in 1977 (NRTA = 0.10), only slightlylower than that of Germany (NRTA = 0.14), it ends up with a very wide gap. Great Britainshows more or less the same pattern as France, but with a more pronounced decrease startingfrom the mid `80s, and it ends up with the lowest NRTA value (-0.15) at the end of the period.Italy has once more the most varied trajectory. In fact, it shows a cyclical upward trend thatlasts until the end of the `80s, peaking in 1988 to the positive value of 0.05. Then it startsa mild decline until 1992, with positive values, followed by a steep decline that reaches theabsolute minimum at the end of the period in 1995 (RTA = -0.11).
In conclusion, three are the main evidences emerging from this analysis. First, the steadyincrease of the motor vehicles technological comparative advantage of Germany, which there-fore seems to have been the explicit target of its technological activity. Second, the irregularbut apparent increase in the automobile despecialisation of France and Great Britain, whichsuggests a possible shift in their sectoral technological activity. Finally, the performance ofGreat Britain and Italy, which appears to be more contrasted and in need of a more completekind of analysis in order to exhaust the whole spectrum of possible causes.
4.2 Innovative pervasivity and dependency
As in the case of the industry side, also for the innovative side a deeper analysis is carried outwith respect to relational kind of aspects.
A �rst preliminary indicator of the techno{economic interrelationships within the automo-bile TS can be considered that of the innovative pervasivity or dependency of the correspondenteconomic sector. Indeed, similarly to the backward and forward linkages indicators, the perva-sivity/dependency ones identify the role of a certain sector within a certain web of interactions,but this time in innovative terms, by looking at intersectoral innovation rather than production ows. Once again, the reference can be to either direct or total innovation ows, and the lattercan in turn be measured in di�erent ways (Montresor, 1998). However, as we have argued else-where (Leoncini et al., 1996), the analysis of innovation ows embodied into total production ows, in turn activated by the �nal demand, reveals the most consistent with the notion of TSwe consider. Accordingly, the same indicators will be built up on the basis of a matrix de�nedas F = r̂R, where r̂ is the diagonal vector of the selected innovative proxy (in this case R&D
16
expenditure), and R is de�ned as R = (x̂)�1Bd̂, where d̂ is the diagonal vector of sectoral �naldemand.
As each element of F, fij, measures the innovation produced by sector i and embodied inthe �nal production of sector j, a �rst absolute index of pervasivity/dependency (APD) can bede�ned for sector k as:
APDk =Dk � IkAk � Ik
=
Pj fkj � fkkPi fik � fkk
where Dk are the innovative di�usions of sector k (i.e. the row total of the innovation owsmatrix, F, for the same sector), Ak the innovative acquisitions (i.e. the column total of F forthe same sector), while Ik stands for the intrasectoral di�usions of the sector itself, as fromthe correspondent cell on the principal diagonal. Since we are interested only in intersectoralrelationships, such di�usions will be left out, so that the numerator and the denominator denote,respectively, net di�usions and net acquisitions.
The meaning of the indicator is quite straightforward. If ADPk > 1, sector k is said tobe pervasive, that is, its intersectoral innovative acquisitions are less than its di�usions. Thereverse holds if 0 < ADPk < 1, as sector k, in this case, depends on the rest of the economicsectors for its innovative inputs more than the others depend on it.
Since the previous index has no upper ceiling, it can be normalised as follows:
NPDk =APDk � 1
APDk + 1:
In this way, k will turn out to be dependent if �1 < NPDk < 0, while it will be pervasive if0 < NPDk < 1.
The two indexes are showed in Table 4 for comparable years with the previous ly calculatedindicators.8
Similarly to the industrial analysis, on which, to a certain extent, the innovative one isbased,9 the data show that, as expected, the automobile sector is quite dependent for itstechnological acquisitions on the rest of the economic sectors. In absolute terms, its innovativedi�usions do not generally reach 10% of the corresponding acquisitions. This is particularly truefor France, where they are stable around 2%, while in Great Britain the innovative di�usionsare as much as 10% of the acquisitions.
8To be sure, as the data on sectoral R&D (DSTI (STAN, Anberd), 1994) are not available before 1973on a comparable basis, the earlier years of the two indicators series do not coincide. The same holds for therelative sectoral disaggregation. By matching I{O tables with R&D data we have in fact a less disaggregatedclassi�cation of 19 sectors (see Appendix A.2).
9Let us remember that the innovative ows utilised to produce the ADP indicators are embodied in inter-sectoral production ows.
17
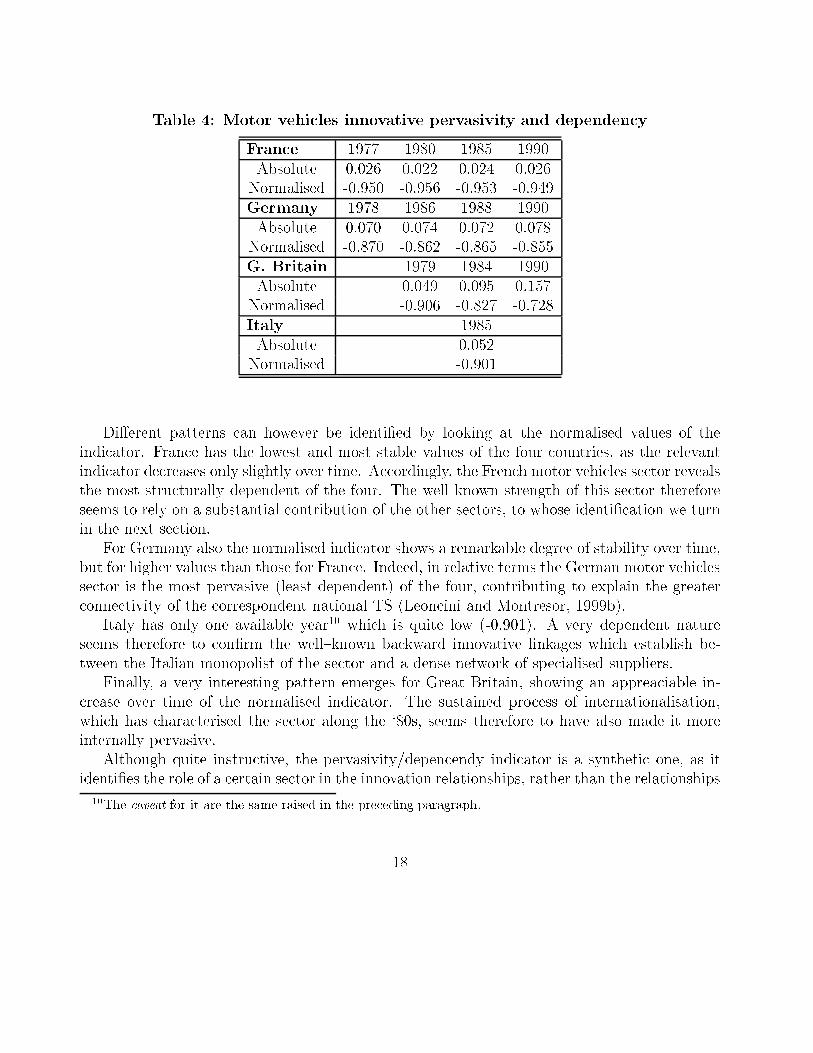
Table 4: Motor vehicles innovative pervasivity and dependency
France 1977 1980 1985 1990Absolute 0.026 0.022 0.024 0.026Normalised -0.950 -0.956 -0.953 -0.949Germany 1978 1986 1988 1990Absolute 0.070 0.074 0.072 0.078Normalised -0.870 -0.862 -0.865 -0.855G. Britain 1979 1984 1990Absolute 0.049 0.095 0.157Normalised -0.906 -0.827 -0.728Italy 1985Absolute 0.052Normalised -0.901
Di�erent patterns can however be identi�ed by looking at the normalised values of theindicator. France has the lowest and most stable values of the four countries, as the relevantindicator decreases only slightly over time. Accordingly, the French motor vehicles sector revealsthe most structurally dependent of the four. The well known strength of this sector thereforeseems to rely on a substantial contribution of the other sectors, to whose identi�cation we turnin the next section.
For Germany also the normalised indicator shows a remarkable degree of stability over time,but for higher values than those for France. Indeed, in relative terms the German motor vehiclessector is the most pervasive (least dependent) of the four, contributing to explain the greaterconnectivity of the correspondent national TS (Leoncini and Montresor, 1999b).
Italy has only one available year10 which is quite low (-0.901). A very dependent natureseems therefore to con�rm the well{known backward innovative linkages which establish be-tween the Italian monopolist of the sector and a dense network of specialised suppliers.
Finally, a very interesting pattern emerges for Great Britain, showing an appreaciable in-crease over time of the normalised indicator. The sustained process of internationalisation,which has characterised the sector along the `80s, seems therefore to have also made it moreinternally pervasive.
Although quite instructive, the pervasivity/depencendy indicator is a synthetic one, as itidenti�es the role of a certain sector in the innovation relationships, rather than the relationships
10The caveat for it are the same raised in the preceding paragraph.
18
themselves. Hence, more details about the latter can be obtained by mapping the relevantinnovation ows, a task we will accomplish in the next section.
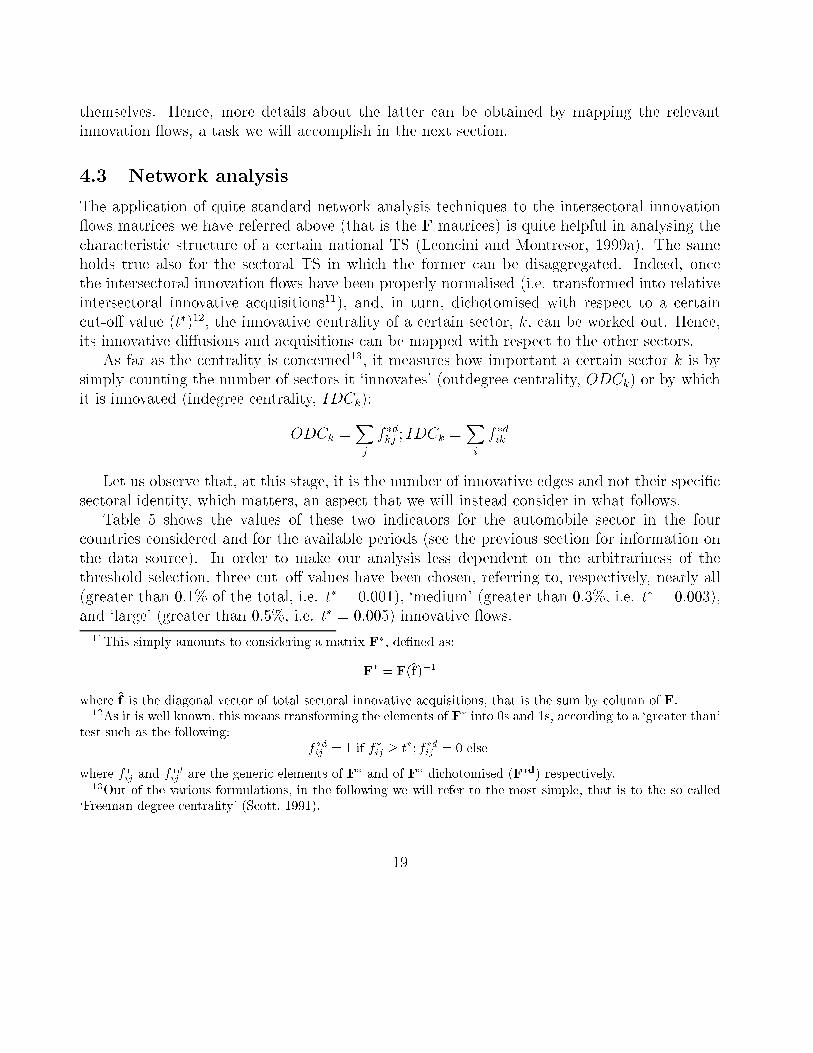
4.3 Network analysis
The application of quite standard network analysis techniques to the intersectoral innovation ows matrices we have referred above (that is the F matrices) is quite helpful in analysing thecharacteristic structure of a certain national TS (Leoncini and Montresor, 1999a). The sameholds true also for the sectoral TS in which the former can be disaggregated. Indeed, oncethe intersectoral innovation ows have been properly normalised (i.e. transformed into relativeintersectoral innovative acquisitions11), and, in turn, dichotomised with respect to a certaincut-o� value (t�)12, the innovative centrality of a certain sector, k, can be worked out. Hence,its innovative di�usions and acquisitions can be mapped with respect to the other sectors.
As far as the centrality is concerned13, it measures how important a certain sector k is bysimply counting the number of sectors it `innovates' (outdegree centrality, ODCk) or by whichit is innovated (indegree centrality, IDCk):
ODCk =X
j
f �dkj ; IDCk =X
i
f �dik
Let us observe that, at this stage, it is the number of innovative edges and not their speci�csectoral identity, which matters, an aspect that we will instead consider in what follows.
Table 5 shows the values of these two indicators for the automobile sector in the fourcountries considered and for the available periods (see the previous section for information onthe data source). In order to make our analysis less dependent on the arbitrariness of thethreshold selection, three cut{o� values have been chosen, referring to, respectively, nearly all(greater than 0.1% of the total, i.e. t� = 0:001), `medium' (greater than 0.3%, i.e. t� = 0:003),and `large' (greater than 0.5%, i.e. t� = 0:005) innovative ows.
11This simply amounts to considering a matrix F�, de�ned as:
F� = F(̂f )�1
where f̂ is the diagonal vector of total sectoral innovative acquisitions, that is the sum by column of F.12As it is well known, this means transforming the elements of F� into 0s and 1s, according to a `greater than'
test such as the following:f�dij = 1 if f�ij � t�; f�dij = 0 else
where f�ij and f�dij are the generic elements of F� and of F� dichotomised (F�d) respectively.13Out of the various formulations, in the following we will refer to the most simple, that is to the so called
`Freeman degree centrality' (Scott, 1991).
19
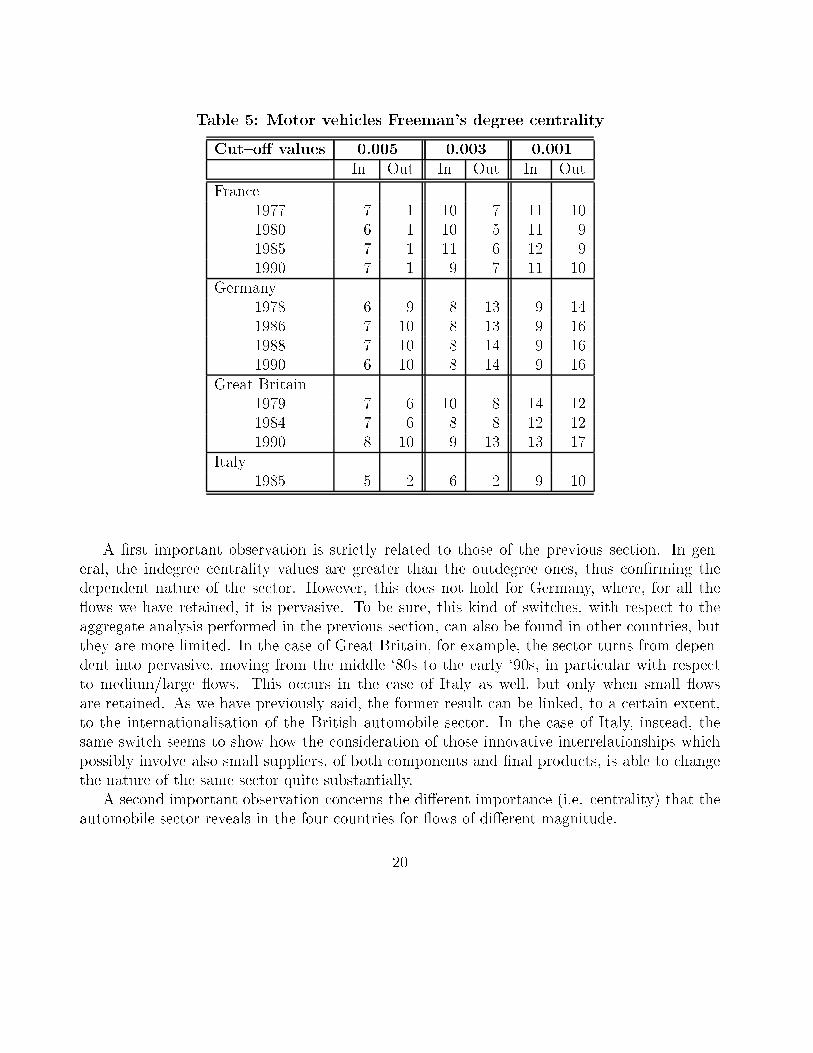
Table 5: Motor vehicles Freeman's degree centrality
Cut{o� values 0.005 0.003 0.001In Out In Out In Out
France1977 7 1 10 7 11 101980 6 1 10 5 11 91985 7 1 11 6 12 91990 7 1 9 7 11 10
Germany1978 6 9 8 13 9 141986 7 10 8 13 9 161988 7 10 8 14 9 161990 6 10 8 14 9 16
Great Britain1979 7 6 10 8 14 121984 7 6 8 8 12 121990 8 10 9 13 13 17
Italy1985 5 2 6 2 9 10
A �rst important observation is strictly related to those of the previous section. In gen-eral, the indegree centrality values are greater than the outdegree ones, thus con�rming thedependent nature of the sector. However, this does not hold for Germany, where, for all the ows we have retained, it is pervasive. To be sure, this kind of switches, with respect to theaggregate analysis performed in the previous section, can also be found in other countries, butthey are more limited. In the case of Great Britain, for example, the sector turns from depen-dent into pervasive, moving from the middle `80s to the early `90s, in particular with respectto medium/large ows. This occurs in the case of Italy as well, but only when small owsare retained. As we have previously said, the former result can be linked, to a certain extent,to the internationalisation of the British automobile sector. In the case of Italy, instead, thesame switch seems to show how the consideration of those innovative interrelationships whichpossibly involve also small suppliers, of both components and �nal products, is able to changethe nature of the same sector quite substantially.
A second important observation concerns the di�erent importance (i.e. centrality) that theautomobile sector reveals in the four countries for ows of di�erent magnitude.
20
As for the outdegree values, the German automobile sector is the most central with respectto all the cut{o� values and, what is more, with relatively less `drops' in cutting out smalland medium innovative acquisitions, that is, in moving from 0.001 to 0.005. Always from anoutward perspective, the British automobile sector is the second most central for all the cut{o�values, but, this time, the relative indicator decreases substantially in moving from 0.001 to0.003, and less from 0.003 to 0.005: small size di�usions therefore seem to be particular relevantalso in Great Britain. As far as France and Italy are concerned, the innovative di�usions arerelatively less consistent. Furthermore, the changes we observe in increasing the magnitudeof the relevant threshold are much more consistent. In particular, in France the innovativedi�usions of the motor vehicles which overcome the largest reference ow (i.e. 0.005) reachone sector only, while, in Italy, it suÆces to leave out ows of medium dimension to con�ne itspervasivity to two sectors only.
Substantially di�erent results emerge from the analysis of the indegree centrality. At �rst,let us observe that the di�erences between the four countries in the considered sector are lessevident than for the outdegree values, with the partial exception of the smallest of the cut{o� values (0.001). The `homogenising' e�ect of their input{output structures (caught by thecolumns) seems therefore to weight more than the `di�erentiating' e�ect entailed by their R&Dsystem (caught by the rows). Also the di�erences we observe in moving between the cut{o� values appear generally less substantial than for the outdegree values. Acquisitions seemtherefore more homogeneous than di�usions for the present cut{o� values, as their criticalthresholds are possibly higher. Finally, also the rank of the countries is substantially di�erent.Apart from 0.003, with respect to which they are slightly dominated by France, the acquisitionsof the British automobile sector count more than in the other countries. This is particularlytrue when nearly all the ows are considered (that is, for 0.001), while in retaining mediumand large ows the acquisitions reduce substantially. What we have previously observed inaggregate terms, therefore, �nds a con�rmation only for a limited subset of innovation ows.This is even more true for Italy, as the dependent nature of its automobile sector appears evidentonly when ows of a certain magnitude are left out. The indegree centrality of the sector inFrance and Germany is instead more stable across the cut{o� values, and intermediate withrespect to that of Great Britain and Italy. As in aggregate terms, the French acquisitions aremore consistent than the German ones, although the consideration of large ows only entails acertain homogenisation.
A last remark is due for the temporal changes we observe in the centrality indicators. Tobe sure, in general, they are not so relevant, so that the automobile sector appears as muchcentral at the beginning as at the end of the considered period, in all countries and for all thecut{o� values.
In general terms, let us observe that, as we expected, the outdegree centrality is slightlymore variable than the indegree. Indeed, the incidence of R&D expenditure varies more than
21
the input{output structures along time. However, the temporal changes are relatively moreconsistent when both small and large ows are considered, while the reference to large owsonly entails a greater degree of stability.
More speci�cally, as we have already observed at aggregate level, the most consistent varia-tions concern Great Britain, where the outdegree centrality of the automobile sector increasessubstantially for all the cut{o� values, in particular from 1984 to 1990. Furthermore, a partfrom the large ows, also its indegree centrality progressively decreases along time. As for therest, if we except the outdegree `jumps' revealed by Germany, the centrality of the automobilesector remains quite stable.
FRANCE
R19R18
R17
R16
R15
R14
R13
R12
R11
R10 R9
R8
R7
R6
R5
R4
R3
R2
R1
GERMANY
R1R2
R3
R4
R5
R6
R7
R8
R9
R10R11
R12
R13
R14
R15
R16
R17
R18
R19
BRITAIN
R1R2
R3
R4
R5
R6
R7
R8
R9
R10R11
R12
R13
R14
R15
R16
R17
R18
R19
ITALY
R1R2
R3
R4
R5
R6
R7
R8
R9
R10R11
R12
R13
R14
R15
R16
R17
R18
R19
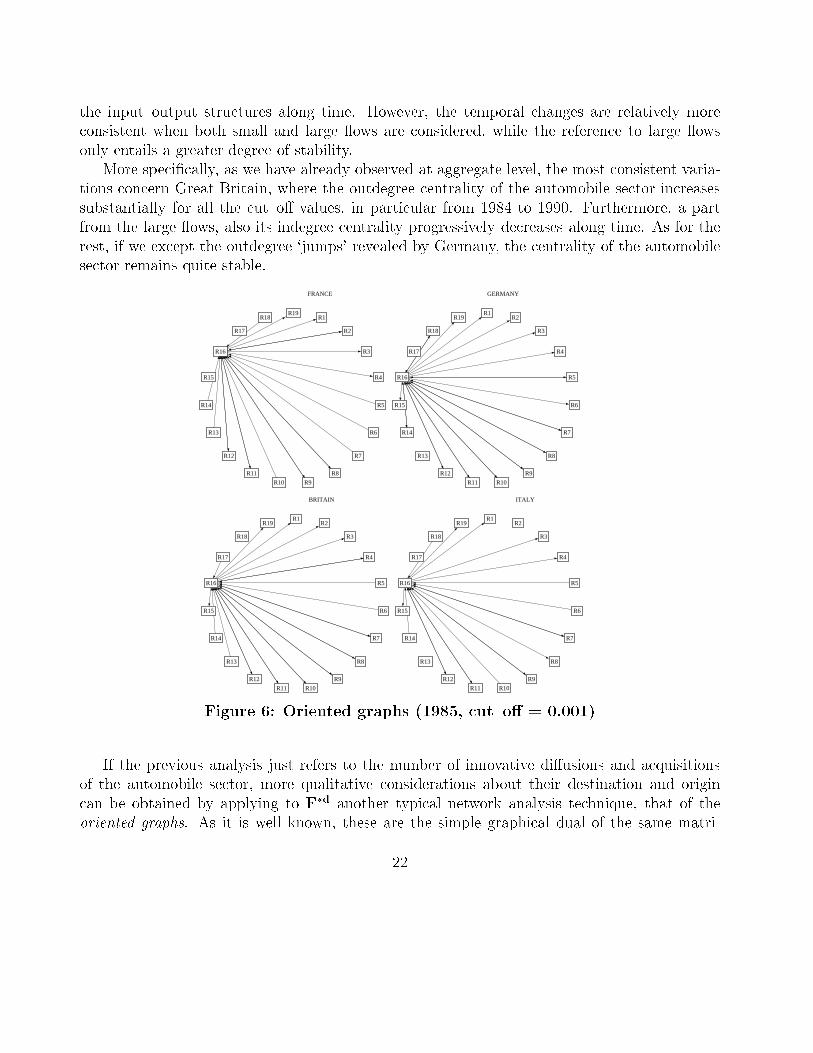
Figure 6: Oriented graphs (1985, cut{o� = 0.001)
If the previous analysis just refers to the number of innovative di�usions and acquisitionsof the automobile sector, more qualitative considerations about their destination and origincan be obtained by applying to F�d another typical network analysis technique, that of theoriented graphs. As it is well known, these are the simple graphical dual of the same matri-
22
FRANCE
R19R18
R17
R16
R15
R14
R13
R12
R11
R10 R9
R8
R7
R6
R5
R4
R3
R2
R1
GERMANY
R1R2
R3
R4
R5
R6
R7
R8
R9
R10R11
R12
R13
R14
R15
R16
R17
R18
R19
BRITAIN
R1R2
R3
R4
R5
R6
R7
R8
R9
R10R11
R12
R13
R14
R15
R16
R17
R18
R19
ITALY
R1R2
R3
R4
R5
R6
R7
R8
R9
R10R11
R12
R13
R14
R15
R16
R17
R18
R19
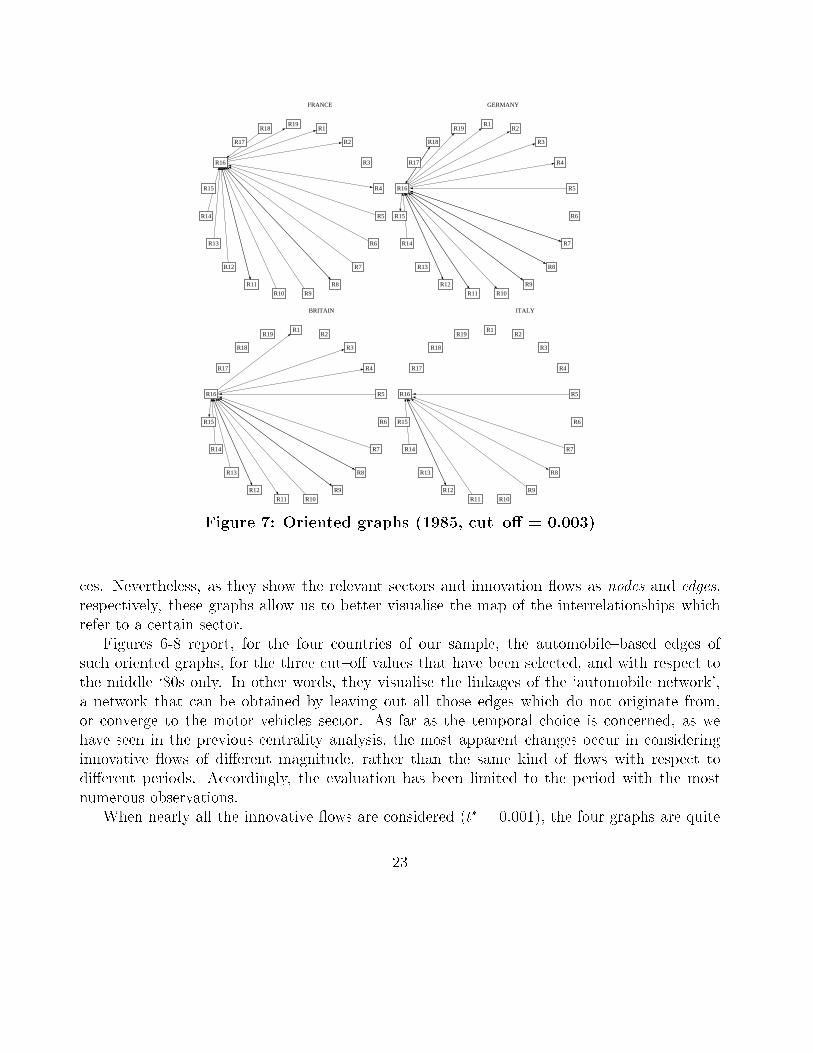
Figure 7: Oriented graphs (1985, cut{o� = 0.003)
ces. Nevertheless, as they show the relevant sectors and innovation ows as nodes and edges,respectively, these graphs allow us to better visualise the map of the interrelationships whichrefer to a certain sector.
Figures 6-8 report, for the four countries of our sample, the automobile{based edges ofsuch oriented graphs, for the three cut{o� values that have been selected, and with respect tothe middle `80s only. In other words, they visualise the linkages of the `automobile network',a network that can be obtained by leaving out all those edges which do not originate from,or converge to the motor vehicles sector. As far as the temporal choice is concerned, as wehave seen in the previous centrality analysis, the most apparent changes occur in consideringinnovative ows of di�erent magnitude, rather than the same kind of ows with respect todi�erent periods. Accordingly, the evaluation has been limited to the period with the mostnumerous observations.
When nearly all the innovative ows are considered (t� = 0:001), the four graphs are quite
23
FRANCE
R1R2
R3
R4
R5
R6
R7
R8
R9
R10R11
R12
R13
R14
R15
R16
R17
R18
R19
GERMANY
R1R2
R3
R4
R5
R6
R7
R8
R9
R10R11
R12
R13
R14
R15
R16
R17
R18
R19
BRITAIN
R1R2
R3
R4
R5
R6
R7
R8
R9
R10R11
R12
R13
R14
R15
R16
R17
R18
R19
ITALY
R1R2
R3
R4
R5
R6
R7
R8
R9
R10R11
R12
R13
R14
R15
R16
R17
R18
R19
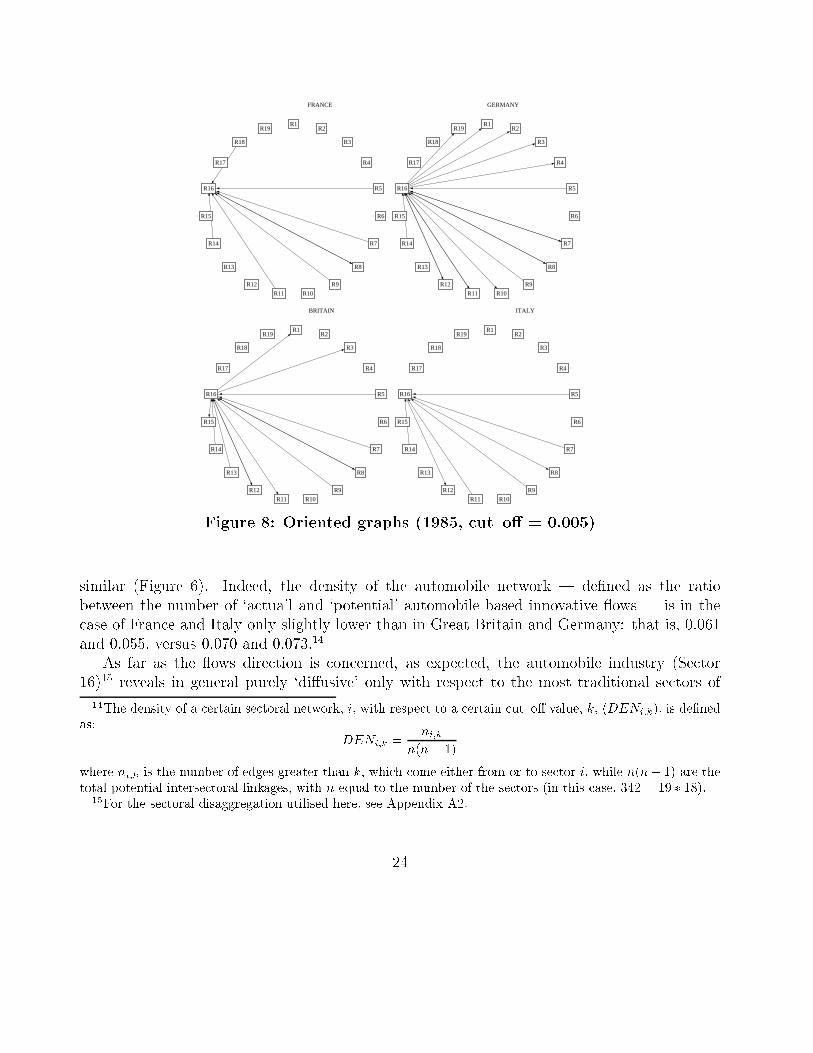
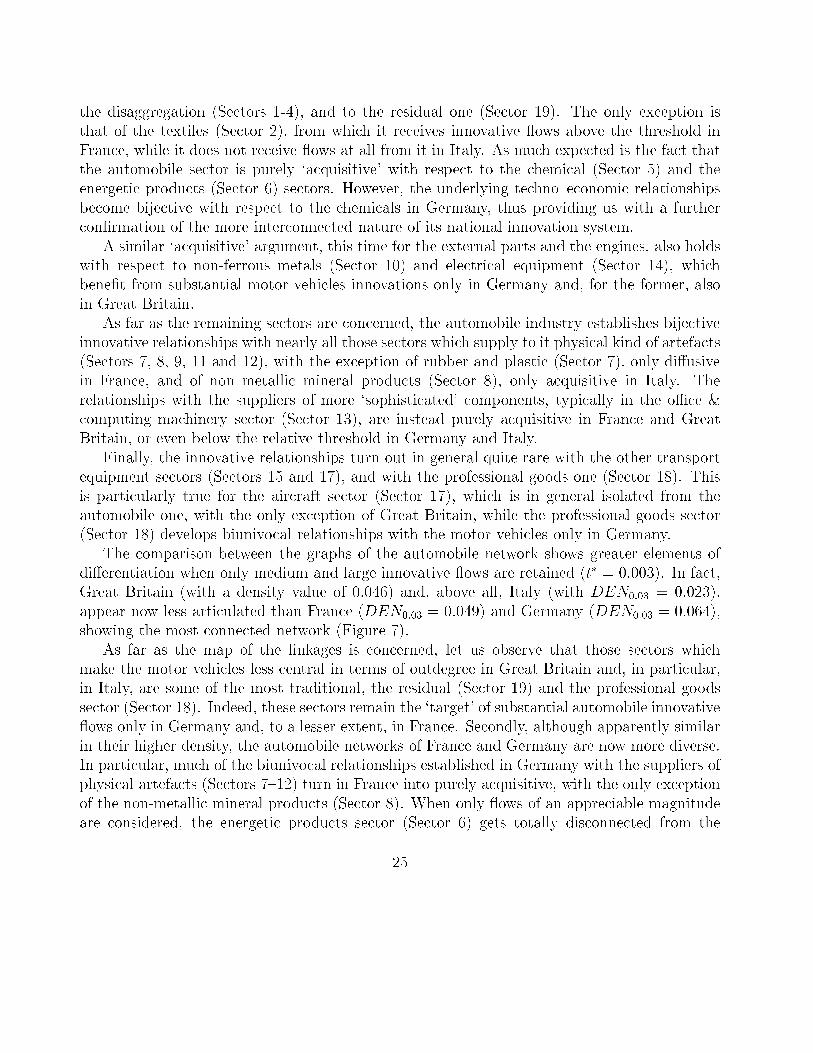
Figure 8: Oriented graphs (1985, cut{o� = 0.005)
similar (Figure 6). Indeed, the density of the automobile network | de�ned as the ratiobetween the number of `actua'l and `potential' automobile based innovative ows | is in thecase of France and Italy only slightly lower than in Great Britain and Germany: that is, 0.061and 0.055, versus 0.070 and 0.073.14
As far as the ows direction is concerned, as expected, the automobile industry (Sector16)15 reveals in general purely `di�usive' only with respect to the most traditional sectors of
14The density of a certain sectoral network, i, with respect to a certain cut{o� value, k, (DENi;k), is de�nedas:
DENi;k =ni;k
n(n� 1)
where ni;k is the number of edges greater than k, which come either from or to sector i, while n(n� 1) are thetotal potential intersectoral linkages, with n equal to the number of the sectors (in this case, 342 = 19 � 18).
15For the sectoral disaggregation utilised here, see Appendix A2.
24
the disaggregation (Sectors 1-4), and to the residual one (Sector 19). The only exception isthat of the textiles (Sector 2), from which it receives innovative ows above the threshold inFrance, while it does not receive ows at all from it in Italy. As much expected is the fact thatthe automobile sector is purely `acquisitive' with respect to the chemical (Sector 5) and theenergetic products (Sector 6) sectors. However, the underlying techno{economic relationshipsbecome bijective with respect to the chemicals in Germany, thus providing us with a furthercon�rmation of the more interconnected nature of its national innovation system.
A similar `acquisitive' argument, this time for the external parts and the engines, also holdswith respect to non-ferrous metals (Sector 10) and electrical equipment (Sector 14), whichbene�t from substantial motor vehicles innovations only in Germany and, for the former, alsoin Great Britain.
As far as the remaining sectors are concerned, the automobile industry establishes bijectiveinnovative relationships with nearly all those sectors which supply to it physical kind of artefacts(Sectors 7, 8, 9, 11 and 12), with the exception of rubber and plastic (Sector 7), only di�usivein France, and of non metallic mineral products (Sector 8), only acquisitive in Italy. Therelationships with the suppliers of more `sophisticated' components, typically in the oÆce &computing machinery sector (Sector 13), are instead purely acquisitive in France and GreatBritain, or even below the relative threshold in Germany and Italy.
Finally, the innovative relationships turn out in general quite rare with the other transportequipment sectors (Sectors 15 and 17), and with the professional goods one (Sector 18). Thisis particularly true for the aircraft sector (Sector 17), which is in general isolated from theautomobile one, with the only exception of Great Britain, while the professional goods sector(Sector 18) develops biunivocal relationships with the motor vehicles only in Germany.
The comparison between the graphs of the automobile network shows greater elements ofdi�erentiation when only medium and large innovative ows are retained (t� = 0:003). In fact,Great Britain (with a density value of 0.046) and, above all, Italy (with DEN0:03 = 0:023),appear now less articulated than France (DEN0:03 = 0:049) and Germany (DEN0:03 = 0:064),showing the most connected network (Figure 7).
As far as the map of the linkages is concerned, let us observe that those sectors whichmake the motor vehicles less central in terms of outdegree in Great Britain and, in particular,in Italy, are some of the most traditional, the residual (Sector 19) and the professional goodssector (Sector 18). Indeed, these sectors remain the `target' of substantial automobile innovative ows only in Germany and, to a lesser extent, in France. Secondly, although apparently similarin their higher density, the automobile networks of France and Germany are now more diverse.In particular, much of the biunivocal relationships established in Germany with the suppliers ofphysical artefacts (Sectors 7{12) turn in France into purely acquisitive, with the only exceptionof the non-metallic mineral products (Sector 8). When only ows of an appreciable magnitudeare considered, the energetic products sector (Sector 6) gets totally disconnected from the
25
automobile one, while the same occurs also for the non-ferrous metals (Sector 10), but in Italyonly. That the relationships between these two sectors are in the Italian system of innovationsubstantially a�ected by small innovation and production ows therefore emerges once morehere and more precisely.
When only large innovation ows are considered (t� = 0:005), the density gap between theGerman and the other automobile TS becomes more apparent (Figure 8). The percentage ofactual innovative linkages is, in the �rst case, of nearly 5% of the total, while it is around4% in Great Britain (DEN0:05 = 0:038), and 2% in France and Italy (DEN0:05 = 0:023 andDEN0:05 = 0:020, respectively).
More precisely, the only innovative ows that survive the dichotomisation in France and inItaly refer to some of the sectors of the central part of the disaggregation (Sectors 7, 9, 11),to which it adds the professional good sector (Sector 18) in France. Furthermore, a part fromthe non-metallic mineral products (Sector 8), these relationships are all univocal and identifyinnovative transfers towards the motor vehicles sector. The same kind of univocal relationshipscan be also identi�ed in Great Britain, where `large' di�usions can however still be identi�edfrom the automobile sector to food & beverages (Sector 1) and to textiles (Sector 2).
Con�rming what can be observed by looking at all the innovative interrelationships (Leonciniand Montresor, 1999b), the German automobile network is by far the most dense. On the onehand, the only sectors which fall out of the network are the energetic products (Sector 6) andthe aircraft sector (Sectors 17) as in the other countries, the professional goods sector (Sector18) as in Great Britain and Italy, and the oÆce & computing industry as in Italy. On the otherhand, much of the suppliers of the relevant physical components receive substantial innovative ows from the automobile sector.
5 The international side
The relationships we have considered in the previous paragraphs are exclusively internal. Inother words, we have focus our attention on those production and innovation interactionsthat the automobile TS establishes within the country where the relative companies reside.However, as we have said at the beginning, the sectoral TS extends also outside the country oftheir home{base, and through di�erent material and immaterial exchanges.
Among the other, trade ows and foreign direct investments represent two channels whoseanalysis can be useful in disentangling the actual degree of internationalisation (trade) andtransnationalisation (FDI) of the automobile TS. To these ows we now turn our attention.
26
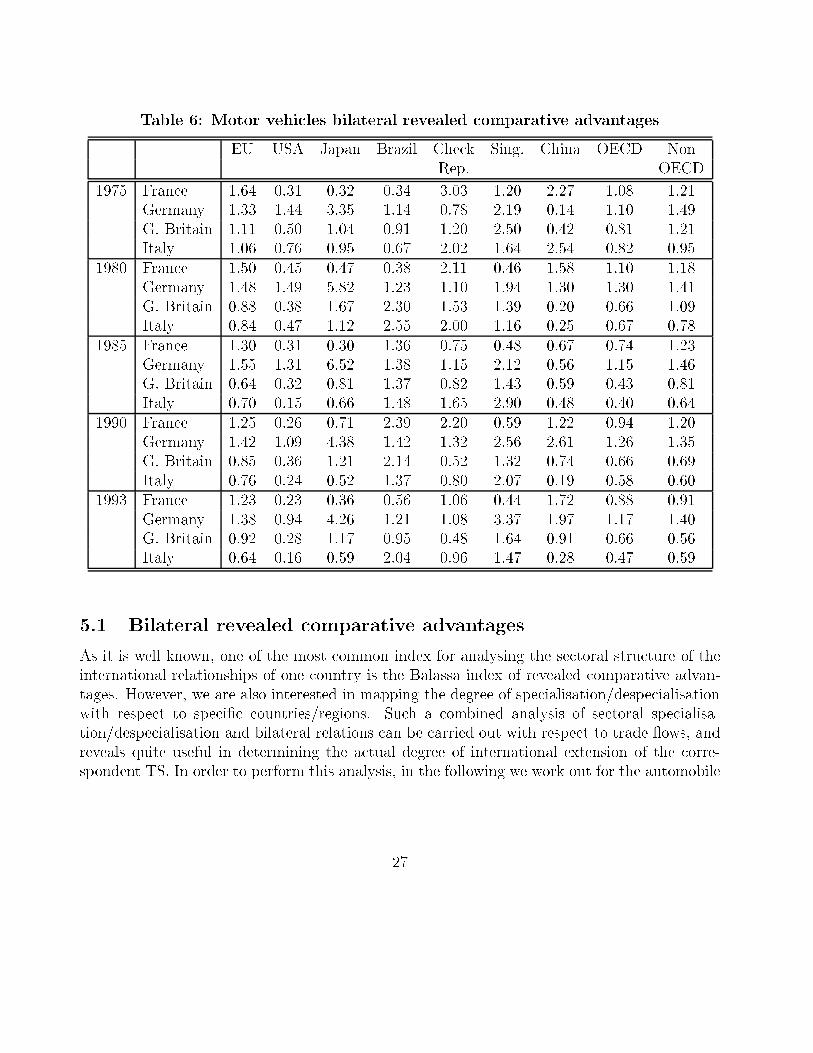
Table 6: Motor vehicles bilateral revealed comparative advantages
EU USA Japan Brazil Check Sing. China OECD NonRep. OECD
1975 France 1.64 0.31 0.32 0.34 3.03 1.20 2.27 1.08 1.21Germany 1.33 1.44 3.35 1.14 0.78 2.19 0.14 1.10 1.49G. Britain 1.11 0.50 1.04 0.91 1.20 2.50 0.42 0.81 1.21Italy 1.06 0.76 0.95 0.67 2.02 1.64 2.54 0.82 0.95
1980 France 1.50 0.45 0.47 0.38 2.11 0.46 1.58 1.10 1.18Germany 1.48 1.49 5.82 1.23 1.10 1.94 1.30 1.30 1.41G. Britain 0.88 0.38 1.67 2.30 1.53 1.39 0.20 0.66 1.09Italy 0.84 0.47 1.12 2.55 2.00 1.16 0.25 0.67 0.78
1985 France 1.30 0.31 0.30 1.36 0.75 0.48 0.67 0.74 1.23Germany 1.55 1.31 6.52 1.38 1.15 2.12 0.56 1.15 1.46G. Britain 0.64 0.32 0.81 1.37 0.82 1.43 0.59 0.43 0.81Italy 0.70 0.15 0.66 1.48 1.65 2.90 0.48 0.40 0.64
1990 France 1.25 0.26 0.71 2.39 2.20 0.59 1.22 0.94 1.20Germany 1.42 1.09 4.38 1.42 1.32 2.56 2.61 1.26 1.35G. Britain 0.85 0.36 1.21 2.14 0.52 1.32 0.74 0.66 0.69Italy 0.76 0.24 0.52 1.37 0.80 2.07 0.19 0.58 0.60
1993 France 1.23 0.23 0.36 0.56 1.06 0.44 1.72 0.88 0.91Germany 1.38 0.94 4.26 1.21 1.08 3.37 1.97 1.17 1.40G. Britain 0.92 0.28 1.17 0.95 0.48 1.64 0.91 0.66 0.56Italy 0.64 0.16 0.59 2.04 0.96 1.47 0.28 0.47 0.59
5.1 Bilateral revealed comparative advantages
As it is well known, one of the most common index for analysing the sectoral structure of theinternational relationships of one country is the Balassa index of revealed comparative advan-tages. However, we are also interested in mapping the degree of specialisation/despecialisationwith respect to speci�c countries/regions. Such a combined analysis of sectoral specialisa-tion/despecialisation and bilateral relations can be carried out with respect to trade ows, andreveals quite useful in determining the actual degree of international extension of the corre-spondent TS. In order to perform this analysis, in the following we work out for the automobile
27
sector a Bilateral Revealed Comparative Advantages indicator (BRCA), de�ned as follows:
BRCAji;k =
Expji;k=P
iExpji;k
Pk Exp
ji;k=P
k
PiExp
ji;k
where Expji;k denotes the export made by country i in sector k to country j. In other words,the BRCA is nothing but the ratio between the sectoral and the total export shares of a certainorigin country i to a destination country j.
As for the standard RCA, the meaning of this indicator depends on its values being greateror lower than one. In the former case, it shows a revealed bilateral comparative advantage, thatis, the exports of the automobile sector perform better than those of the rest of the industrialsectors in a certain country. Hence, we have a relative specialisation in this sector, but withrespect to a speci�c geographical area. The opposite holds for values less than one, whichindicate a relative despecialisation in automobile manufacturing with respect to a certain area.
Therefore, the reference to bilateral, rather than to standard RCA allows us to map geo-graphically the relative strength of a certain country in the automobile sector. We are thusable to compare the di�erent spatial patterns of internationalisation that the relative TS hasundergone, at least by allocating the national production abroad.
As far as the calculations are concerned, the reference years have been chosen in order towork out the BRCA indicator for the same periods of the previous indicators (Table 6).16 As forthe destination countries, they have been chosen in order to give an account of the automobileinternational specialisation in the main world markets, both established, such as the EU, USAand Japan, and emerging, such as South Eastern and South Western Asia (Singapore andChina) and Latin America (Brazil), although we are aware that this choice may lead to somedistorted results.
The results we have obtained with respect to the European market con�rm our expectationsto a certain extent. France and Germany are the only countries, out of the four, with a persistentspecialisation in this area. Furthermore, the recent expansion of the mergers and acquisitionactivities of the German car producers seems to be con�rmed by the shift we observed in themagnitude of the BRCA indexes from France, which has the highest values until the early `80s,to Germany, which, although following a decreasing pattern, overcome France from then on.The comparative advantages initially revealed by Great Britain and Italy turn into a progressivedisadvantage in the early `80s, partially recovered by Great Britain only, in the most recentperiod. Also in this case, the pattern in the BRCA of the two countries is decreasing, insofarsuggesting the penetration of other car producers in Europe (notably from the Far East).
16The data on trade ows are taken from the OECD STAN database on Bilateral Trade (DSTI (STAN,Bilateral Trade Database), 1997).
28
Moreover, it also emerges that Great Britain and Italy might have shifted their specialisationarea, rather than competing with France and Germany in the same market. A suggestiveexample is given by the case of the Brazilian market, in which, since the early `80s, both Italyand Great Britain acquire specialisation which are greater than, or at least comparable with,those of France and Germany. A similar argument seems to hold for the case of Singapore,where Italy and Great Britain are however still dominated by Germany.
Germany appears the only competitive car producer of the four in the USA, although witha decreasing trend, and, more evidently, in Japan, where Great Britain only reveals a certaindegree of specialisation. Furthermore, in the most recent period, Germany also overcomes thepreviously unique and consistent specialisation of France in the Chinese market.
A last speci�c remark concerns the Eastern market, here represented by the Check Republic.Here as well, a certain change emerges which con�rms the increasing internationalisation of theGerman car producers. Until the early `80s, France and Italy revealed the most competitiveproducers in that area. However, entering the globalization phase, Italy looses its comparativeadvantages, apparently at the expenses of Germany, which joins France as the only specialisedcountry in the Check Republic.
5.2 Foreign Direct Investments
As it is generally argued, one characteristic of the globalization process is that the volume offoreign direct investments (FDI) has been increasing more than exports as a means of interna-tional integration (OECD, 1992, Ch. 10). Indeed, by establishing production and innovationunits abroad, �rms have turned from purely international to transnational, if not even global.
This is true, in particular, for the motor vehicles sector, for which the geographical dispersionof the subsidiaries of a certain parent company around the world is becoming so widespreadthat, in some cases, the actual nationality of an automobile transnational corporations (TNC)could not be determined on the basis of a purely territorial criterion. A certain con�rmationof this fact can be obtained by looking at the largest transnational corporations (abroad) andforeign aÆliates (in the host economy) of the four countries analysed, in terms of sales (Table7).
First of all, �rms operating in the motor vehicles sector are the biggest transnational cor-porations in three out of the four countries examined, where these �rms rank in the �rst threepositions apart from one case (Germany). As far as the foreign penetration in these countriesis concerned, again, the dimension of the automobile foreign aÆliates is quite big, with the onlyexception of Italy. However, it is Italian the only non{USA foreign aÆliate (in France).
By combining the two previous bits of analysis, a certain level of di�erentiation seemsto emerge among two groups of countries: France and Germany, on the one hand, and GreatBritain and Italy, on the other. Indeed, the former group seems to be characterised by a certain
29
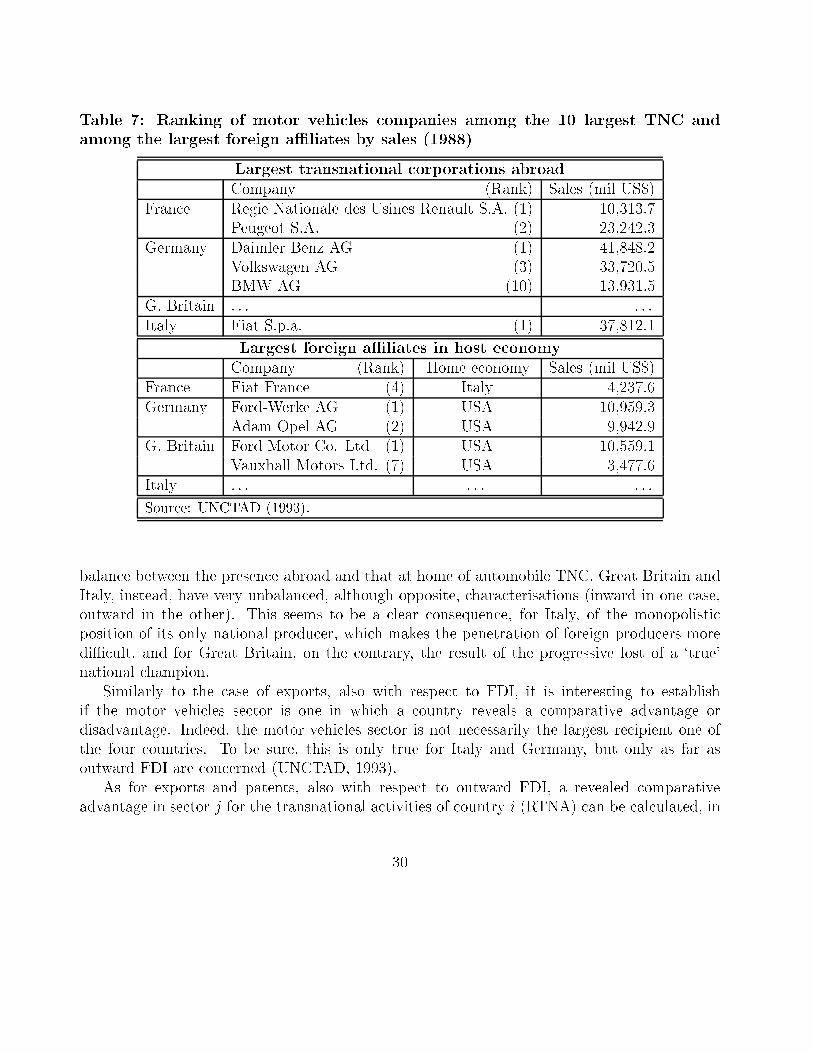
Table 7: Ranking of motor vehicles companies among the 10 largest TNC andamong the largest foreign aÆliates by sales (1988)
Largest transnational corporations abroadCompany (Rank) Sales (mil US$)
France Regie Nationale des Usines Renault S.A. (1) 10,313.7Peugeot S.A. (2) 23,242.3
Germany Daimler Benz AG (1) 41,848.2Volkswagen AG (3) 33,720.5BMW AG (10) 13,931.5
G. Britain . . . . . .Italy Fiat S.p.a. (1) 37,812.1
Largest foreign aÆliates in host economyCompany (Rank) Home economy Sales (mil US$)
France Fiat France (4) Italy 4,237.6Germany Ford-Werke AG (1) USA 10,959.3
Adam Opel AG (2) USA 9,942.9G. Britain Ford Motor Co. Ltd (1) USA 10,559.1
Vauxhall Motors Ltd. (7) USA 3,477.6Italy . . . . . . . . .
Source: UNCTAD (1993).
balance between the presence abroad and that at home of automobile TNC. Great Britain andItaly, instead, have very unbalanced, although opposite, characterisations (inward in one case,outward in the other). This seems to be a clear consequence, for Italy, of the monopolisticposition of its only national producer, which makes the penetration of foreign producers morediÆcult, and for Great Britain, on the contrary, the result of the progressive lost of a `true'national champion.
Similarly to the case of exports, also with respect to FDI, it is interesting to establishif the motor vehicles sector is one in which a country reveals a comparative advantage ordisadvantage. Indeed, the motor vehicles sector is not necessarily the largest recipient one ofthe four countries. To be sure, this is only true for Italy and Germany, but only as far asoutward FDI are concerned (UNCTAD, 1993).
As for exports and patents, also with respect to outward FDI, a revealed comparativeadvantage in sector j for the transnational activities of country i (RTNA) can be calculated, in
30
Outw
ard
early ’80SO
utward
early ’90S
Inward
early ’80S
Inward
early ’90S
00
0.01
0.02
0.03
0.04
0.05
0.06
0.07
0.08
0.09
0.1
0.11
France
Germ
anyItaly
UK
% of total FDI
Figure
9:Stock
ofmotorvehicle
sFDIontotalFDIsto
ck
orderto
know
ifthetran
snation
alactiv
itiesofonecou
ntry
arecharacterised
byaspecialisation
intheautom
obile
sectoror
not:
RTNA
i;j=
FDIi;j =P
i FDIi;j
PjFDIi;j =P
i PjFDIi;j :
For
reasonsthat
will
appear
clearin
awhile,
itiscon
venien
tto
rearrange
theprev
ious
formula
astheratio
betw
eenthesectoral
FDIshare
ofcou
ntry
iandthat
ofthe`W
orld'of
reference:
RTNA
i;j=
FDIi;j =P
jFDIi;j
Pi F
DIi;j =P
i PjFDIi;j :
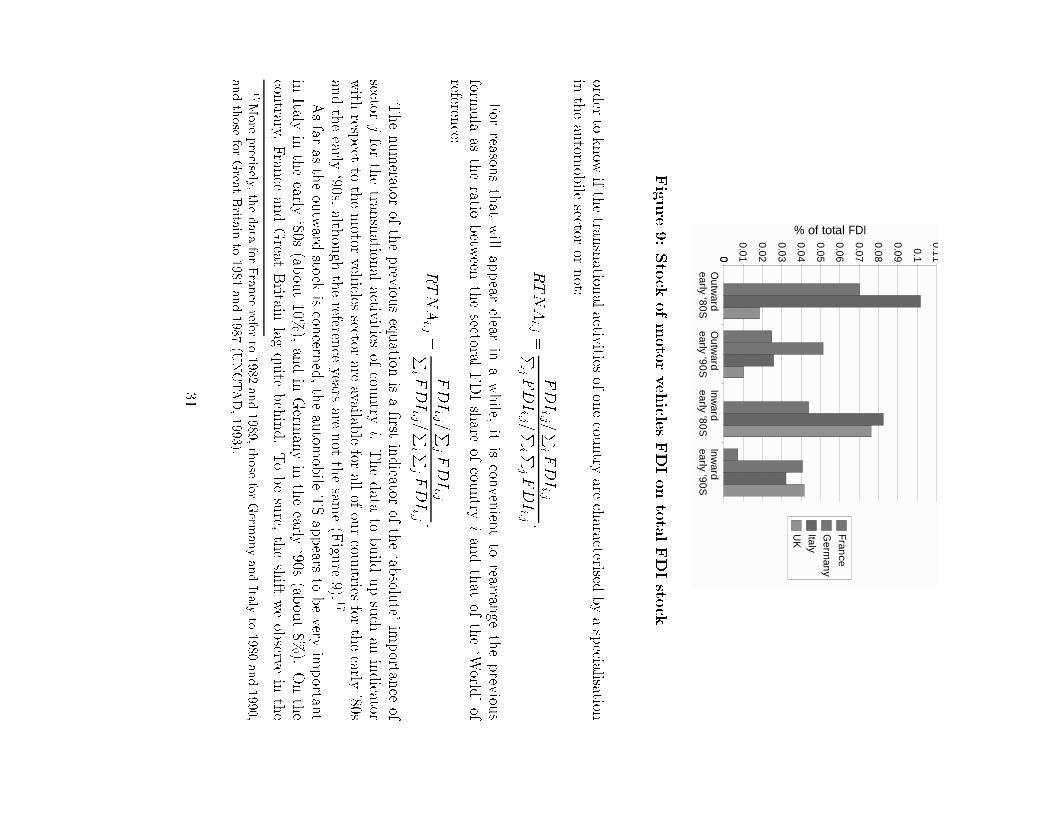
Thenumerator
oftheprev
iousequation
isa�rst
indicator
ofthe`ab
solute'
importan
ceof
sectorjfor
thetran
snation
alactiv
itiesof
country
i.Thedata
tobuild
upsuch
anindicator
with
respect
tothemotor
vehicles
sectorare
availablefor
allofourcou
ntries
fortheearly
'80sandtheearly
`90s,alth
ough
thereferen
ceyears
arenot
thesam
e(Figu
re9).
17
Asfar
astheoutward
stock
iscon
cerned,theautom
obile
TSappears
tobevery
importan
tin
Italyin
theearly
`80s(ab
out10%
),andin
Germ
anyin
theearly
`90s(ab
out8%
).Onthe
contrary,
Fran
ceandGreat
Britain
lagquite
behind.Tobesure,
theshift
weobserve
inthe
17M
ore
precisely,
thedata
forFrance
referto
1982and1989,those
forGerm
anyandIta
lyto
1980and1990,
andthose
forGrea
tBrita
into
1981and1987(U
NCTAD,1993).
31
leadership along the decade is the result of a more general trend. Indeed, the relative weightof the transnational activities of the automobile TS decreases in general from the early `80s,possibly because of the extension of the transnational activities of the other manufacturingsectors.
Coming now to the inward FDI stocks, their incidence on manufacturing is the highest inItaly and Great Britain (around 8%) in the early `80s, with a consistent gap with respect toGermany (about 4%). Following the decrease undergone by the sector also in inward terms,the rank appears quite di�erent in the early `90s. In fact, with the exception of France (whereit has a very low weight, less than 1%), Italy and Great Britain are joined by Germany arounda share of 3{4% of all the manufacturing inward stocks.
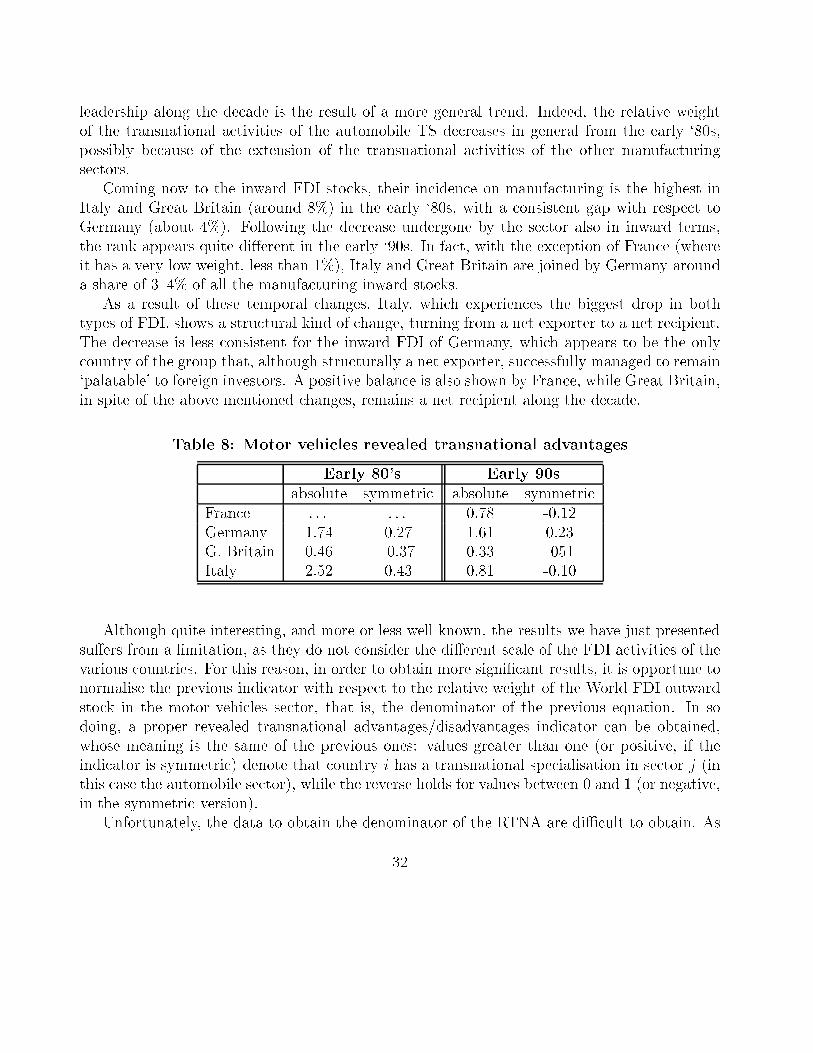
As a result of these temporal changes, Italy, which experiences the biggest drop in bothtypes of FDI, shows a structural kind of change, turning from a net exporter to a net recipient.The decrease is less consistent for the inward FDI of Germany, which appears to be the onlycountry of the group that, although structurally a net exporter, successfully managed to remain`palatable' to foreign investors. A positive balance is also shown by France, while Great Britain,in spite of the above mentioned changes, remains a net recipient along the decade.
Table 8: Motor vehicles revealed transnational advantages
Early 80's Early 90sabsolute symmetric absolute symmetric
France . . . . . . 0.78 -0.12Germany 1.74 0.27 1.61 0.23G. Britain 0.46 -0.37 0.33 -051Italy 2.52 0.43 0.81 -0.10
Although quite interesting, and more or less well known, the results we have just presentedsu�ers from a limitation, as they do not consider the di�erent scale of the FDI activities of thevarious countries. For this reason, in order to obtain more signi�cant results, it is opportune tonormalise the previous indicator with respect to the relative weight of the World FDI outwardstock in the motor vehicles sector, that is, the denominator of the previous equation. In sodoing, a proper revealed transnational advantages/disadvantages indicator can be obtained,whose meaning is the same of the previous ones: values greater than one (or positive, if theindicator is symmetric) denote that country i has a transnational specialisation in sector j (inthis case the automobile sector), while the reverse holds for values between 0 and 1 (or negative,in the symmetric version).
Unfortunately, the data to obtain the denominator of the RTNA are diÆcult to obtain. As
32
data on both the automobile and the total outward FDI stocks are not available for all theWorld countries, and for the same periods, a `second best' solution is to work out the speciali-sation/despecialisation index with respect to a more circumscribed area (the OECD countries)and to wide temporal references (such as the early '80s and the early '90s), encompassing yearsthat, although not coincident, are close enough between them.18 With these caveats in mind,the RTNA indicators in the automobile sector of the four countries of our sample are reportedin Table 8.
Quite di�erently from the previous �gures, the computation of the RTNA indicators showsa more composite picture. In the �rst period, Italy is the most specialised country in theautomobile sector. However, it experiences a very sharp drop in the early `90s, when it isovercome by Germany, for which, in turn, the indicator remains more or less stable, suggestinga persistent specialisation. To be sure, Italy is the only country for which, again, a structuralchange occurs, from specialised to slightly despecialised. This is certainly due to the very lowlevel of the denominator of the RTNA formula, and thus simply expresses the irrelevance of therest of the economic sectors with respect to the automobile sector, in terms of FDI. Therefore,the large decrease of the indicator seems to be due more to the internationalisation of the Italianeconomy as a whole, rather than to an absolute weakening of the automobile sector.
Great Britain, as expected, has the lowest values, and is the only despecialised country inthe early `80s. France, for which data are available for the last period only, is characterised bya despecialisation with values almost equal to those of Italy, but with an underlying structureof the FDI completely di�erent.
6 Conclusions
In this paper the structure of the automobile industry has been analysed from a system perspec-tive. Given the importance of the techno-economic interrelationships which establish betweenthis and other sectors, both inside and outside a certain economy, the concept of technologicalsystem has been used as unit of analysis to investigate the innovative process of the motorvehicles.
By examining the characteristics of both production and innovation ows, both intersectoraland international, we have tried to determine the extension and the most important featuresof the automobile TS of the four biggest European markets (i.e. France, Germany, Italy andGreat Britain) in the last decade.
18To be sure, the World of reference we have retained for our calculations is a subset of the OECD countries.However, the countries for which data are not available are presumably not very important in terms of outwardFDI.
33
As the aspects we have addressed are quite numerous, and have been examined by using aset of heterogeneous analytical instruments (such as input-output theory, network techniques,specialisation analysis), the results we have obtained are manifold and diÆcult to be exhaus-tively synthesised. Some important conclusions can however be drawn.
The �rst set of conclusions refer to the importance of the sectoral TS as the unit of analysis.Indeed, fresh insights can be brought into the study of a very traditional industry such as theautomobile industry.
Firstly, we have detected a very high degree of stability in the face of change. The variousTS examined managed, more or less successfully, to maintain their stability by means of ahigh level of internal change. In fact, in front of an overall stability of the usual industrialindicators, our di�erent levels of analysis have detected a sustained process of change in thevarious elements of the automobile TS, all of which contributed to a relatively steady path ofdevelopment.
Secondly, `scale e�ects' are very much evident for TS rather than for single producers. Inthis sense, notions such as \reverse salient" (Hughes, 1989) and \functional failures"(Constant,1980) appear to be appropriate in the description of what has going on in the automobileindustry in the decade we have examined.
Thirdly, the TS dynamics we have observed, are more varied and characterised by a highdegree of structural change, than that characterising the single TS units. As we have noted,dynamic e�ects are very diversi�ed. Di�erent parts of the TS, with di�erent relative dimensionand weight, have undergone substantial changes along time. These changes were di�erent amongthe various TS, but also, when they were more or less similar, the result was by any mean thesame. Indeed, some of them were subject to structural change forced by the underlying processof di�used technological change, while for others the globalization played an important role,while, �nally, for others it was the institutional change to trigger the evolution of the TS. Forall the combination of the three was surely never the same.
Coming now to more detailed aspects, the following points are worth stressing again.First of all, when internal techno-economic relationships are considered, the automobile
industry shows some general sectoral properties (such as dominant backward linkages andinnovative dependence) that hold in all the countries of our sample. However, the same charac-teristics apply to the four countries to a di�erent extent, thus suggesting how the institutionalset-up, within which a certain industry operates, might works as a di�erentiating element. Forexample, the French automobile industry relies on external innovations much more than theGerman one, whose pervasivity in turn contributes to make its national innovation system moreconnected. Further di�erences emerge when the speci�c nature of the techno-economic owsis analysed in more detail. In the case of Italy, for example, the automobile sector reveals aninnovative dependent sector, unless innovation ows of small dimension are also considered,insofar catching the dense network of relationships which establish with small size specialised
34
supplier �rms. When both small and large innovative ows are considered, instead, the Italiansector turns out pervasive, while the German automobile TS becomes the only one which getsinnovations from traditional kind of sectors for ows of large magnitude.
Secondly, temporal aspects are also very relevant in analysing (internal) intersectoral re-lationships. Indeed, along the retained period, apparent divergence phenomena can be foundby looking at proper innovative indicators. The progressive increase of the (total manufac-turing weighted) R&D expenditure, and of the revealed (by patents) technological advantageof the German motor vehicles, as opposed to, respectively, a less substantial increase and adecrease in France and Great Britain, is the most relevant example. Although cyclical factorsalso intervene in explaining these results, as it is apparently shown by the irregular trends ofthe Italian TS, more structural kind of changes can also be detected. A signi�cant example isprovided by the British motor vehicles, with respect to which the well-know recent pattern ofinternationalisation has brought a very substantial decrease of its production backward linkagesand of its innovative dependence. In this case therefore, it is the evolution undergone by therelative innovation system in a climate of globalization to have entailed a change in the sectoralcharacteristics of the automobile industry.
Finally, interesting results have been also obtained by looking at the international relation-ships of the automobile TS. As far as export ows are concerned, a part from the uncontesteddominance of France and Germany on the European market, the countries considered revealdi�erent patterns of specialisation in di�erent geographical areas. In spite of some recentchanges, the Italian automobile industry, for example, appears relatively more successful inthe penetration of developing countries, while Germany reveals more specialised in Japan andUSA.
A similar argument holds when foreign direct investments are considered. On the one hand,automobile companies are among the most multinationalised in all of our countries, both interms of transnational subsidiaries abroad and of hosted foreign aÆliates. On the other hand,inward FDI are more relevant than the outward in some countries (such as Great Britain),while the reverse holds in some other (for example, Germany). Country speci�c e�ects canalso be identi�ed by looking at the temporal changes of both inward and outward FDI, whichare in general decreasing from the early `80s to the early `90s. Hence, for example, the sign ofthe FDI balance, and of the relative outward specialisation, changes signi�cantly in the case ofItaly, which turns from a net exporter to a net FDI recipient.
Although many other important aspects have been left out from the analysis, which couldtherefore be integrated in several respects (in particular organisational), the results obtainedare quite interesting. Indeed, they suggest how the relational and contextual elements which arecaught by the notion of technological system are among the factors which explain the di�erentnational performances of the European automobile industry. In other words, the automobiletechnological system reveals properties that, although idiosyncratic, induce di�erent innovative
35
outcomes, depending on their matching with di�erent institutional set-ups, which are sectoralbut also, and especially, national. Di�erent systemic approaches should therefore be consideredas complementary, rather than substitute or even contrasting.
7 References
Carlsson B. (ed.) (1995), Technological Systems and Economic Performance: The Case ofFactory Automation, Kluwer, Dordrecht.
Carlsson B. and Stankiewicz R. (1991), On the nature, functions and composition of techno-logical systems, Journal of Evolutionary Economics, vol. 1, pp. 93-118.
Constant E. (1980), The Origins of the Turbojet Revolution, Johns Hopkins University Press,Baltimore.
De Liso N. and Metcalfe S. (1996), On technological systems and technological paradigms,in Helmst�adter E. and Perlman M. (eds.), Behavioral Norms, Technological Progress, andEconomic Dynamics, University of Michigan Press, Ann Arbor.
Edquist C. (ed.) (1997), Systems of Innovation. Technologies, Institutions and Organization,Pinter, London.
Hughes T. (1989), The evolution of large technological systems, in Bijker W. et al (eds.), TheSocial Construction of Technological Systems, MIT Press, Harvard.
Leoncini R. (1998), The nature of long-run technological change: innovation, evolution andtechnological systems, Research Policy, vol. 27, pp. 75-93.
Leoncini R. and Montresor S. (1999a), Classifying technological systems: an empirical appli-cation to eight OECD countries, in Saviotti P. and Nooteboom B. (eds.), Knowledge andInnovation. From the Firm to Innovation Systems, Edward Elgar, Cheltenham (forthcom-ing).
Leoncini R. and Montresor S. (1999b), Network analysis of eight technological systems, Inter-national Review of Applied Economics (forthcoming).
Leoncini R., Maggioni M. and Montresor S. (1996), Intersectoral innovation ows and nationaltechnological systems: network analysis for comparing Italy and Germany, Research Policy,vol. 25, pp. 415-430.
Lundvall B. (1988), Innovation as an interactive process: from user-producer interaction to thenational system of innovation, in Dosi G. et al. (eds.), Technical Change and EconomicTheory, Pinter, London.
Lundvall B. (ed.) (1992), National Systems of Innovation. Towards a Theory of Innovationand Interactive Learning, Pinter, London.
Montresor S. (1998), Un'analisi intersettoriale dei sistemi tecnologici: evidenze empiriche sualcuni paesi dell'area OCSE nel decennio 1980-1990, unpublished PhD dissertation, Uni-
36
versity of Bologna.
Nelson R. (ed.) (1993), National Innovation Systems. A Comparative Analysis, Oxford Uni-versity Press, New York.
Nelson R. and Rosenberg N. (1993), Technical innovation and national systems, in Nelson R.(ed.), National Innovation Systems. A Comparative Analysis, Oxford University Press,New York.
OECD (1992), Technology and the Economy. The Key Rekationships, OECD, Paris.
Patel P. and Pavitt K. (1995), Patterns of technological activity: their measurement and inter-pretation, in Stoneman P. (ed.), Handbook of the Economics of Innovation and TechnologicalChange, Blackwell, Oxford.
Scott, J. (1991), Social Network Analysis. A Handbook, MIT Press, Cambridge, Massachusetts.
UNCTAD (1993), World Investment Directory, New York, United Nations.
37
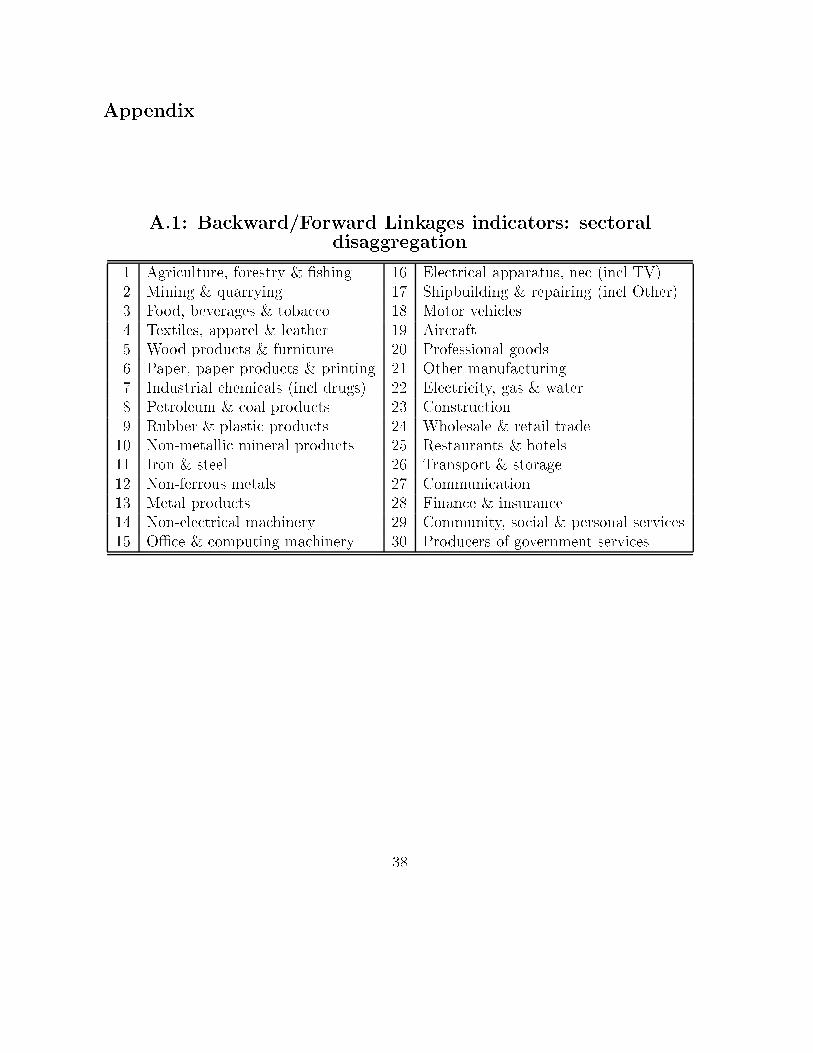
Appendix
A.1: Backward/Forward Linkages indicators: sectoraldisaggregation
1 Agriculture, forestry & �shing 16 Electrical apparatus, nec (incl TV)2 Mining & quarrying 17 Shipbuilding & repairing (incl Other)3 Food, beverages & tobacco 18 Motor vehicles4 Textiles, apparel & leather 19 Aircraft5 Wood products & furniture 20 Professional goods6 Paper, paper products & printing 21 Other manufacturing7 Industrial chemicals (incl drugs) 22 Electricity, gas & water8 Petroleum & coal products 23 Construction9 Rubber & plastic products 24 Wholesale & retail trade10 Non-metallic mineral products 25 Restaurants & hotels11 Iron & steel 26 Transport & storage12 Non-ferrous metals 27 Communication13 Metal products 28 Finance & insurance14 Non-electrical machinery 29 Community, social & personal services15 OÆce & computing machinery 30 Producers of government services
38
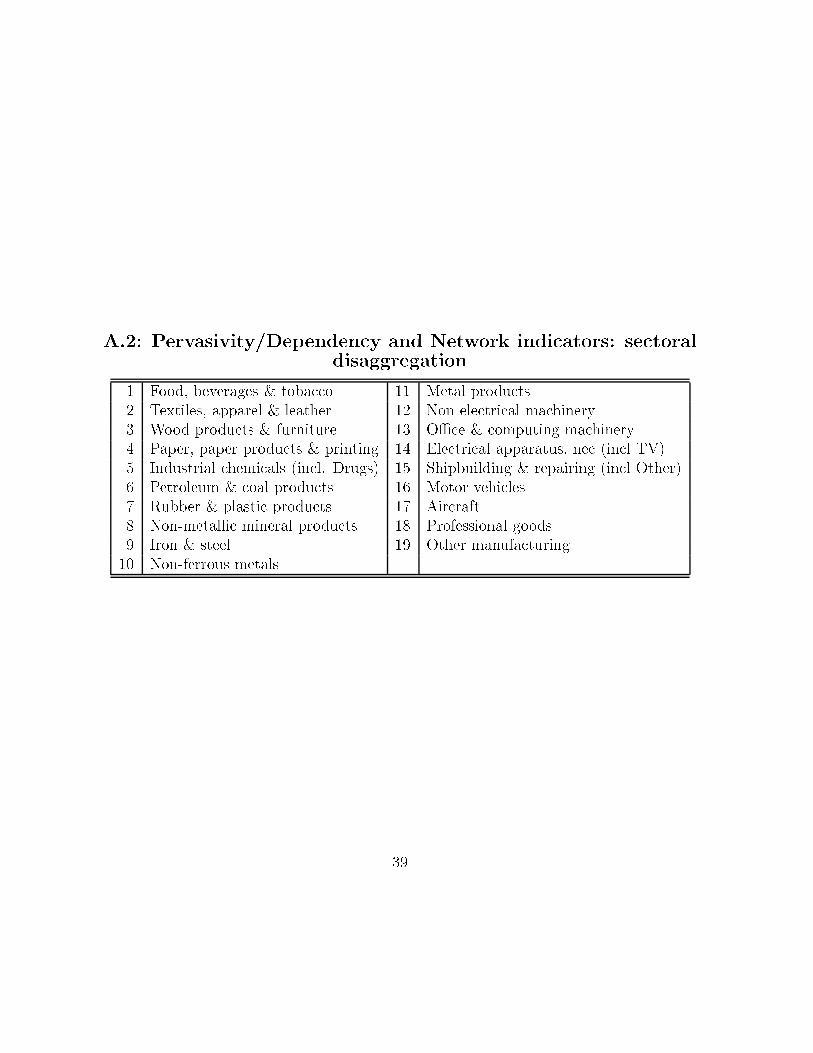
A.2: Pervasivity/Dependency and Network indicators: sectoraldisaggregation
1 Food, beverages & tobacco 11 Metal products2 Textiles, apparel & leather 12 Non-electrical machinery3 Wood products & furniture 13 OÆce & computing machinery4 Paper, paper products & printing 14 Electrical apparatus, nec (incl TV)5 Industrial chemicals (incl. Drugs) 15 Shipbuilding & repairing (incl Other)6 Petroleum & coal products 16 Motor vehicles7 Rubber & plastic products 17 Aircraft8 Non-metallic mineral products 18 Professional goods9 Iron & steel 19 Other manufacturing10 Non-ferrous metals
39
Related Documents