The Australian Imaging Biomarkers and Lifestyle Flagship Study of Ageing (AUSTRALIAN ADNI) . July 2014 UPDATE Christopher Rowe MD – Neuroimaging stream leader

Welcome message from author
This document is posted to help you gain knowledge. Please leave a comment to let me know what you think about it! Share it to your friends and learn new things together.
Transcript

The Australian Imaging Biomarkers and Lifestyle
Flagship Study of Ageing
(AUSTRALIAN ADNI) .
July 2014 UPDATE
Christopher Rowe MD – Neuroimaging stream leader

The Australian Imaging
Biomarkers and
Lifestyle Flagship Study
of Ageing.
150 Vietnam
AIBL-VETS Funded by Piramal
US DOD
6 yrs
Origin
al
Cohort
632 not imaged 823 not imaged 738 not imaged
288 imaged
MRI + 11C-PiB
Funded by CSIRO
192 imaged MRI and 11C-PiB
Funded by SIEF
230 imaged MRI + 11C-PiB
Funded by CSIRO
102
Flutemetamol
Funded by GE
94
Florbetapir
Funded anon & DCRC
300 Not imaged
142 11C-PiB
Funded by SIEF
0 yrs
1112 recruited
1.5 yrs
968
3 yrs
824
4.5 yrs
718
145 new
F-18 Flutemetamol Funded by GE
October 2006
2014-15
240 for TAU imaging
(Avid and GE)
F-18 Flutemetamol Funded by GE
Florbetapir
Funded by DCRC
NAV4694
Funded by Navidea
F-18 Flutemetamol Funded by GE
90 new
Florbetapir Funded anon
Florbetapir Funded DCRC
NAV4694
Not imaged
30 11C-PiB
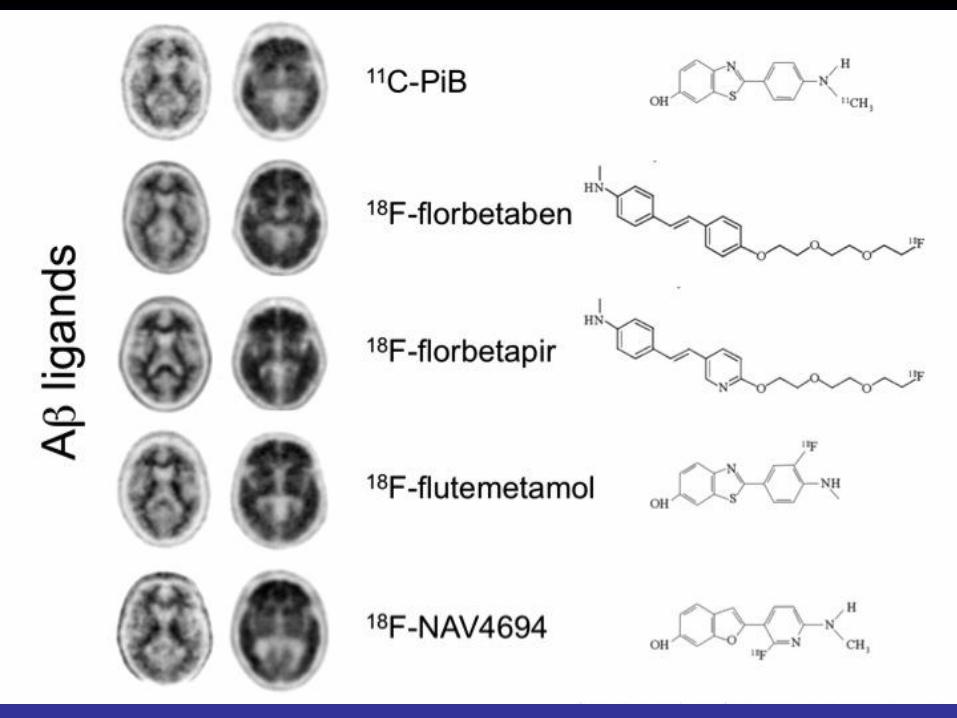
4.5 year data release coming soon PiB Baseline (288), 3 years (173), 4.5 yrs (141)
Plus 230 added from original cohort (flutemetamol, florbetapir or PiB at 4.5 yrs)
i.e. amyloid scan status known in 371 subjects with 4.5 yrs of follow-up.
Plus 250 new recruits (160 flute, 90 FBP)
The Australian Imaging
Biomarkers and Lifestyle
Flagship Study of Ageing.
www.adni.loni.usc.edu - Data and Samples - Access Data

610 research groups granted access to AIBL@LONI through ADNI website
Includes access granted to the following companies:
Abbott Labs, Abiant, ADM diagnostics, Astra Zeneca, Avid, BioClinica, Biogen Idec, Bristol-Myers Squibb, Cogstate Cytokinetics, Eisai, Elan, Eli Lilly, GE Health Care, General Resonance, Genetech, Imorphics, Iris Biotechnologies, Janssen, Johnson Johnson, M and M Scientific, Merck & Co, Mimvista, Pentara Corp, Pfizer, Philips, Predixion software, Rancho Biosciences, Servier, Siemens, Soft team solutions, UCB, United Biosource Corp.
Canada USA Colombia Mexico Cuba Argentina
Belgium Netherlands Switzerland Poland Algeria Egypt Bulgaria Israel Turkey
China Taiwan Japan Hong Kong Korea Australia New Zealand
Finland Sweden
Denmark UK Ireland Germany France Spain Italy
India Pakistan Saudi Arabia Iran

Ne
oco
rtic
al S
UV
Rcb
HC
-
MCI
+
AD
MCI-
HC+
*
1.0
1.5
2.0
2.5
3.0
Time (years)
Mean SUVR AD+
(2.33)
19.2 yr (95%CI 17-23 yrs)
Mean SUVR HC-
(1.17) 12.0 yr
(95%CI 10-15 yrs)
0 10 20 30 40
0.043 SUVR/yr (95%CI 0.037-0.049 SUVR/yr)
The natural history of Ab deposition
in sporadic AD
Villemagne VL, et al. 2013 Lancet Neurology

3 year clinical progression rate vs PiB SUVR
HC (n = 183)
MCI (n = 87)
AD (n = 79)
Ne
oco
rtic
al S
UV
R
2.50
1.00
1.50
2.00
3.00
RASAD March 2012
PPV 17% PPV 44%
PPV 35%
PPV 82%
Rowe CC, et al. Ann Neurology 2013

HC to MCI or AD over 3 years
(n=183; 13% progressed)
HC positive
for marker OR PPV NPV
HV 46 2.2 0.20 0.90
e4 74 2.1 0.18 0.91
EM<-0.5 22 4.2 0.32 0.90
PiB 53 4.8 0.26 0.93
PiB+e4 34 5.7 0.29 0.93
PiB+HV 17 10 0.47 0.92
PiB+EM 10 16 0.50 0.94
AIBL composite EM Z-score <-1 (n=49), OR 11, PPV 35%, NPV 96%
without correction for age or education.

MCI to AD over 3 years (n=87; 59% progressed)
MCI positive
for marker Odds Ratio PPV NPV
HV 48 4 0.67 0.65
ApoE-e4 50 5 0.74 0.66
CVLT<-1.5 61 11 0.80 0.74
PiB 60 15 0.77 0.82
PiB+e4 47 16 0.79 0.81
PiB+HV 35 44 0.83 0.90
PiB+CVLT 43 na
0.86 1.00
Rowe CC, et al. Ann Neurology 2013

Initial Ab burden is a better predictor of
progression from MCI to AD than the
rate of Ab accumulation
Rate
s o
f Ab d
ep
ositio
n
Ab b
urd
en
non-converters converters non-converters converters
p = 0.001 p < 0.0001
OR = 5.4 OR = 15

Rat
e o
f ep
iso
dic
mem
ory
dec
lin
e
Rate of Ab deposition (SUVR/yr)
R2 = 0.32 (p = 0.0134)
R2 = 0.42 (p = 0.023)
PiB- (n=80)
Accumulators (n=120)
PiB+ (n=40)
R2 = 0.07 (p = 0.54)
Relation between rate of Ab deposition
and rate of episodic memory decline in HC
-0.6
-0.2
-0.8
0.0
-0.4
0.2
0.4
-0.6
-0.2
-0.8
0.0
-0.4
0.2
0.4
0.00 0.02 0.04 0.06 0.12 0.10 0.08 0.00 0.02 0.04 0.08 0.06
4.5-year follow-up
adjusted for age, gender, education, ApoE

Relation between rate of Ab deposition
and rate of episodic memory decline
4.5-year follow-up
THRESHOLD adjusted for age, gender, yoe, ApoE +adjusting baseline SUVR
PiB SUVR 1.2 (n=68) R2 = 0.19 (p = 0.0353) R2 = 0.35 (p = 0.313)
PiB SUVR 1.3 (n=48) R2 = 0.28 (p = 0.0162) R2 = 0.38 (p = 0.060)
PiB SUVR 1.4 (n=42) R2 = 0.30 (p = 0.0150) R2 = 0.39 (p = 0.028)
PiB SUVR 1.5 (n=40) R2 = 0.31 (p = 0.0134) R2 = 0.42 (p = 0.023)
PiB SUVR 1.6 (n=37) R2 = 0.31 (p = 0.0383) R2 = 0.41 (p = 0.031)
PiB SUVR 1.9 (n=21) R2 = 0.40 (p = 0.080) R2 = 0.48 (p = 0.067)
Accumulators (n=120)

(1.20)

2
4
6
8
10
12
14
Baseline 18 months 36 months
2
4
6
8
10
12
14
Baseline 18 months 36 months
CV
LT-I
I D
ela
yed
Re
call
Memory Test Performance over 3 years
PiB -ve n = 16, SUVR = 1.18
PiB +ve n = 32, SUVR = 2.21
PiB -ve n =122, SUVR = 1.16
PiB +ve n = 55, SUVR = 1.95
Healthy Older Persons
Mild Cognitive Impairment

PiB, Cerebrovascular Disease and Episodic Memory
Females
• Slope for PiB+ = -0.14 per year (p<0.001) • Significant time x age interaction (p=0.008). • Significant main effect but not time interaction for CVD (p=0.01), gender (p=0.01) and
YOE (p<0.001)
Males

Executive Function
Females
• Slope for PiB+ = -0.06/year (p=0.09) • Slope for CVD = 0.1/year (p=0.01) • Significant main effects of gender, education, age • Significant x time effect of CVD, trend for PiB+
Males

Episodic Memory and Educational Attainment
• Slope for PiB+ = -0.14 per year (p<0.001)
• Significant time x age interaction (p=0.008).
• Significant main effect but not time interaction for CVD (p=0.01), gender (p=0.01) and YOE (p<0.001)

PiB, CVD and Change in PiB SUVR

-2.40
-2.20
-2.00
-1.80
-1.60
-1.40
-1.20
-1.00
-0.80
-0.60
-0.40
-0.20
0.00
0.20
Baseline 18 month 36 month 54 month
Epis
od
ic M
em
ory
p<.05
p<.05
p<.001
HA Aβ+ 54 months: Effect of APOE & BDNF
Aβ+ ε4- BDNFVal/Val n = 19
Aβ+ ε4- BDNFMet n = 11
Aβ+ ε4+ BDNFVal/Val n = 27
Aβ+ ε4+ BDNFMet n = 14 EM = AIBL Episodic Memory Composite

• High Aβ : Healthy older adults: faster cognitive decline; ↑ progression to MCI
• Low Aβ : Healthy older adults: no decline
• APOE ε4
– High Aβ + ε4 carriage faster cognitive decline over 54 months (Mormino et al., in press)
• BDNF Val66Met
– No effect on individuals with low Aβ
– Healthy older adults with high Aβ
• Met carriers ↑ memory decline/hippocampal atrophy
High Aβ + ε4 carriage + BDNFMet ↑↑ memory decline
Conclusions and general summary

Subjective Memory Complaint
• SMC is associated with higher scores on
anxiety scales but correlations with poorer
cognitive performance and amyloid burden
have been inconsistent - though tending
towards an association.
• In the original AIBL imaging cohort of 177 HC
54% were SMC i.e. answered yes to “Do you
have difficulty with your memory?” with
normal psychometric test results.
• We only found higher anxiety scores and no
overall increase in PiB+ve prevalence.

Rowe CC, et al. Neurobiology of Aging. 2010; 31:1275-1283.
Neo
co
rtic
al
SU
VR
cb
HC
nMC (e4-)
MCI AD HC
SMC (e4+)
HC
nMC (e4+)
HC
SMC (e4-)
*† * * 3.5
3.0
2.5
2.0
1.5
1.0
But there was a difference when SMC
was associated with ApoE-e4
66% 30%

*Significantly different from nMC, p <0.05
18F-flutemetamol SUVR
Neo
co
rtic
al
SU
VR
po
ns
nMC (e4-)
SMC (e4+)
nMC (e4+)
SMC (e4-)
*
1.1
1.0
0.9
0.8
0.5
0.4
0.6
0.7 18%
63%

Retinal amyloid fluorescence imaging
Koronyo-Hamaoui et al.
NeuroImage 2011;
Masuda et al. Bioorg Med
Chem. 2011
Proprietary curcumin formulation with
scientifically tested and defined chemical
content and high-bioavailability.
NeuroVision Imaging
Los Angeles, CA

HC-
HC-
HC+
HC-
HC-
AD+
HC-HC-
AD+
HC-
HC-
HC+
AD+
AD+AD+
HC-
HC+
HC+
AD+
AD+
AD+
HC+
HC-
HC+
MCI+
MCI-
MCI+HC+
HC+
MCI-MCI-
MCI+
HC+
MCI+
MCI-
MCI+
MCI+
MCI+
HC+
R² = 0.586
0.5
1.0
1.5
2.0
2.5
3.0
3.5
0.5 1 1.5 2 2.5 3 3.5
Re
tin
al A
myl
oid
Ind
ex
Brain Neocortical SUVR
p < 0.0001
Retinal amyloid index correlates with
Neocortical SUVR
No False Negatives
Retinal amyloid fluorescence imaging | Shaun Frost

Bellingham et al., Front Physiol. 2012;3:124.
Alzheimer’s Disease
Parkinson’s Disease
Prion Disease
Motor Neuron Disease Frontotemporal
Dementia
Exosomes as biomarkers for AD •Exosomes = Extracellular membrane vesicles, 50-130nm in diameter •Secreted by a variety of mammalian cells •Isolated from a variety of biological fluids
• serum, plasma, CSF, milk, urine, saliva, etc... •Contain protein and RNA (including miRNA) •Source of circulating biomarkers •Contain many proteins involved in neurodegenerative diseases Current Study: • AIM: to identify AD miRNA profile in blood derived exosomes •APPROACH: isolated exosomes from blood of healthy aged controls and AD patients • Profile the exosomal miRNA using next gen sequencing • validate the miRNA profile using qPCR
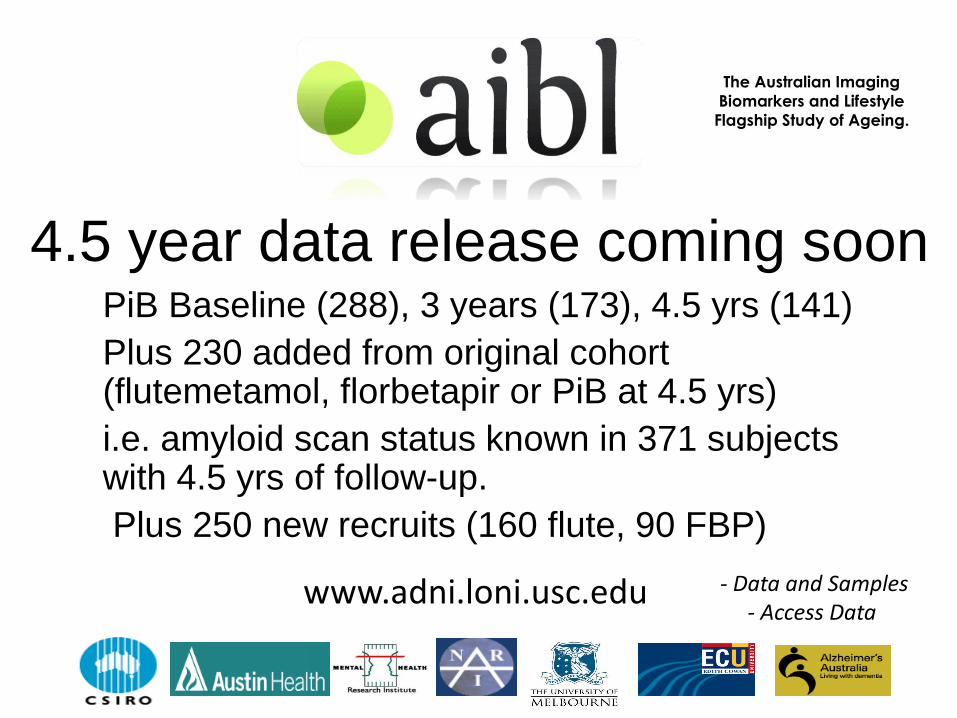
Differentially expressed exosomal miRNA in AD patients
– 17 miRNA were found to be significantly deregulated (p (AD Vs HC) ≤ 0·05)
– There are two major clusters: • Cluster 1 contains 15 miRNA which were found to be up-regulated.
• Cluster 2 contains 3 miRNA which were found to be down-regulated.
– Validation in 15 AD and 35 Healthy Controls blind to diagnosis using qPCR: • 13/15 AD correctly identified (Sensitivity of 87%) (2 patients high Aβ / APOε4 negative)
• 27/35 HC correctly identified (Specificity of 77%) (5 subjects high Aβ / 3 APOε4 positive)
miR
NA
’s

Original PiB-PET Enrichment PiB-PET Florbetapir Flutemetamol
Correlation of Imaged and Blood-Based Estimates of Neocortical Amyloid Burden (NAB)
β=0.23 p<0.001
β=0.54 p<0.0001
Burnham et al Predicting AD from a blood based biomarker profile Jul 14 4-5:30pm O2-13-06 Hall A1

Bivariate correlates of progression to Alzheimer’s disease over 54 Months
No Yes Odds χ2 p Odds
ratio
(95%CI)
PPV
(95%CI)
NPV
(95%CI)
HC Progressed to MCI/AD
Predicted PiB Negative 304
(95.30%)
15 (4.70%) 0.05
Predicted PiB Positive 240
(90.37%)
26 (9.63%) 0.11 4.75 0.003 2.16
(1.12-4.17)
9.90%
(8.18%-11.95% )
95.16%
(93.30%-96.52%)
MCI Progressed to AD
Predicted PiB Negative 10 (71.43%) 4 (28.57%) 0.40
Predicted PiB Positive 7 (20.00%) 28 (80.00%) 4.00 9.51 0.002 10.00
(2.41-41.58)
71.62%
(60.74%-
80.45%)
79.85%
(63.14%-90.16%)

APOE genotype-dependent effects of diet and physical activity on
cognition and Alzheimer's-related pathology:
Data from the AIBL Study of Ageing
Rainey-Smith et al., Jul 14 2014, 2:15PM - 3:45PM, Hall A3, O2-02-05
Linear mixed models (LMM) analyses: p < 0.01. Controlling for age, gender, years of education, country of
birth, body mass index, energy intake.
Gardener, Rainey-Smith et al, 2014, Molecular Psychiatry (In press).
Baseli
ne
18
months
36
months

Rainey-Smith et al., Jul 14 2014, 2:15PM - 3:45PM, Hall A3, O2-02-05
Significant interaction of the BDNF Val66Met variant with physical
activity was observed for hippocampal and temporal lobe volumes
(volumes corrected for intracranial volume).
This association did not exist in BDNF Met carriers.
Brown et al, 2014 Neurology (In press).
Higher levels of PA associated with larger temporal lobe and hippocampal volume in BDNF Val/Val homozygotes

Future Directions for AIBL Imaging
• Further refine prognostic value and comparative effectiveness of imaging and blood biomarkers
• Examine genetic and environmental influences on rate of decline in Ab+ve HC
• Add Tau imaging
• Create a new pool of amyloid scan positive HC and MCI for early intervention trials
• Use AIBL infrastructure to support the A4 and DIAN therapy trials

Acknowledgements and thanks
AIBL is a large collaborative study and a complete list of contributors and the management committee can be found at www.aibl.csiro.au This research was funded in part by the Science and Industry Endowment Fund and CSIRO. We thank all who took part in the study.
Related Documents