University of South Carolina University of South Carolina Scholar Commons Scholar Commons Theses and Dissertations 2017 The Association Of Changes In Cardiorespiratory Fitness With The Association Of Changes In Cardiorespiratory Fitness With Changes In Cardiometabolic Risk Factors Changes In Cardiometabolic Risk Factors Leanna Marie Ross University of South Carolina Follow this and additional works at: https://scholarcommons.sc.edu/etd Part of the Exercise Science Commons Recommended Citation Recommended Citation Ross, L. M.(2017). The Association Of Changes In Cardiorespiratory Fitness With Changes In Cardiometabolic Risk Factors. (Doctoral dissertation). Retrieved from https://scholarcommons.sc.edu/ etd/4390 This Open Access Dissertation is brought to you by Scholar Commons. It has been accepted for inclusion in Theses and Dissertations by an authorized administrator of Scholar Commons. For more information, please contact [email protected].

Welcome message from author
This document is posted to help you gain knowledge. Please leave a comment to let me know what you think about it! Share it to your friends and learn new things together.
Transcript
University of South Carolina University of South Carolina
Scholar Commons Scholar Commons
Theses and Dissertations
2017
The Association Of Changes In Cardiorespiratory Fitness With The Association Of Changes In Cardiorespiratory Fitness With
Changes In Cardiometabolic Risk Factors Changes In Cardiometabolic Risk Factors
Leanna Marie Ross University of South Carolina
Follow this and additional works at: https://scholarcommons.sc.edu/etd
Part of the Exercise Science Commons
Recommended Citation Recommended Citation Ross, L. M.(2017). The Association Of Changes In Cardiorespiratory Fitness With Changes In Cardiometabolic Risk Factors. (Doctoral dissertation). Retrieved from https://scholarcommons.sc.edu/etd/4390
This Open Access Dissertation is brought to you by Scholar Commons. It has been accepted for inclusion in Theses and Dissertations by an authorized administrator of Scholar Commons. For more information, please contact [email protected].

!
THE ASSOCIATION OF CHANGES IN CARDIORESPIRATORY FITNESS WITH CHANGES IN CARDIOMETABOLIC RISK FACTORS
by
Leanna Marie Ross
Bachelor of Science Saint Mary’s College, 2011
Master of Science
University of South Carolina, 2013
Submitted in Partial Fulfillment of the Requirements
For the Degree of Doctor of Philosophy in
Exercise Science
The Norman J. Arnold School of Public Health
University of South Carolina
2017
Accepted by:
J. Larry Durstine, Major Professor
Mark A. Sarzynski, Committee Member
Steven N. Blair, Committee Member
Robin P. Shook, Committee Member
Clemens Drenowatz, Committee Member
Cheryl L. Addy, Vice Provost and Dean of the Graduate School

ii
© Copyright by Leanna Marie Ross, 2017 All Rights Reserved.

iii
DEDICATION
To my Lord and Savior, Jesus Christ, my parents, Charles and Ardeth, my
brother, Ryan, and my family and friends who have been a constant source of
support, encouragement, and love. 2 Peter 3:18
In loving memory of Dr. Raja Fayad, who played an inspirational role in the
pursuit of my doctoral degree.

iv
ACKNOWLEDGEMENTS
As I reflect on my time at USC, I am reminded of numerous opportunities
that have not only prepared me for my career as a scientist, but also enriched my
life as a whole. I am forever grateful for the people that God introduced to my life
during this journey who have provided encouragement, support, laughter,
kindness, mentorship, and friendship. You all fill a special place in my heart.
To my committee members, I continue to be at a loss for words that truly
encompass my gratitude for all you have done for me along this journey. Dr. Blair
and Dr. Durstine, your influence in my life extends far past the realms of teaching
and research. I consider you to be family and appreciate all of the opportunities
and unwavering support that you have provided over the past several years. Dr.
Shook, you have been there for me since day one of graduate school. I am
thankful that my time at USC has come full circle with you being a part of my
dissertation committee. Dr. Drenowatz, your guidance throughout my time as a
doctoral student helped shape my abilities to become an exercise scientist, and I
am glad you were able to be a part of this process even after your move back
home. Dr. Sarzynski, thank you for your countless hours dedicated to helping
me. You enabled my initial research idea to grow into an outstanding project. The
cascade of opportunities from your mentorship has led me to the next step in my
journey: beginning my dream postdoctoral fellowship at Duke University. I cannot
wait to see what happens next!

v
ABSTRACT
Cardiorespiratory fitness (CRF) is well established as having a strong inverse
association with numerous cardiovascular disease (CVD) risk factors and mortality. As
CVD remains the number one cause of death in America, the detrimental effects of low
CRF present a substantial health threat. The studies presented in this dissertation
syndicate both epidemiologic and clinical data that will enrich the knowledge base
regarding the magnitude of change in CRF in relation to CVD risk factors.
Recently, the American Heart Association established a new construct termed
ideal cardiovascular health (CVH), which is characterized by seven metrics known as
Life’s Simple 7. The concept emphasizes seven positive health factors and behaviors.
The promotion of achieving and retaining these metrics at an ideal level serves to
improve CVH and decrease public health burden and CVD mortality. This first study of
this dissertation found that higher levels of CRF are strongly associated with better CVH
profiles, which was demonstrated by individuals with moderate and high CRF exhibiting
almost 11 and 40 times greater odds of having average or optimum CVH scores,
respectively, compared to low fit individuals. Additionally, longitudinal analyses showed
that improvements in CRF over time are associated with significant improvements in
CVH score. These findings support the vital role CRF plays in public health efforts
aiming to prevent the development of CVD and reduce CVD mortality risk.
Secondly, this dissertation investigated the responsiveness of CRF, as measured
by maximal oxygen consumption (V̇O2max), and CVD risk factors following aerobic
exercise intervention. Aerobic exercise interventions are used to increase CRF in order
to help combat the detrimental effects of low CRF. However, relying solely upon group
vi
mean changes can be misleading as considerable inter-individual variation exists in the
ability to improve CRF and CVD risk factors to standardized interventions. This study is
likely the first assess the prevalence of V̇O2max responsiveness across 14 diverse
exercise interventions. Although the exercise interventions produced significant mean
increases in V̇O2max, evaluation of individual changes in V̇O2max revealed that 34% of the
total sample was considered low V̇O2max responsive. Within studies that employed
multiple exercise interventions, a trend emerged. As exercise amount and intensity
increased within studies, prevalence of low V̇O2max response decreased. The utility of
these responsiveness cutpoints helps to provide a better understanding of the inter-
individual variation in response to exercise training to enhance our ability to provide
personalized exercise prescription for improved health and attenuated CVD risk.
vii
TABLE OF CONTENTS
Dedication ............................................................................................................. iii
Acknowledgements ............................................................................................... iv
Abstract .................................................................................................................. v
List of Tables ...................................................................................................... viii
List of Figures ....................................................................................................... ix
Chapter 1 Overall Introduction ............................................................................... 1
Chapter 2 General Methodology ............................................................................ 7
Chapter 3 Literature Review ................................................................................ 26
Chapter 4 The Association of Cardiorespiratory Fitness and Ideal Cardiovascular Health in the Aerobics Center Longitudinal Study ............................................... 41 Chapter 5 Cardiorespiratory Fitness and Cardiometabolic Disease Risk Factor Responsiveness Following Aerobic Exercise Intervention .................................. 57 Chapter 6 Overall Discussion .............................................................................. 81
References .......................................................................................................... 85

viii
LIST OF TABLES
Table 4.1 Definition of poor, intermediate, and ideal levels for each cardiovascular health metric ................................................................................ 53 Table 4.2 Baseline characteristics by sex ........................................................... 53
Table 4.3 Prevalence of participants meeting ideal levels for each cardiovascular health metric at baseline in the total population and by sex ................................ 54 Table 5.1 Study-specific exercise intervention information .................................. 73
Table 5.2 Baseline characteristics by study ......................................................... 73
Table 5.3a Mean change and prevalence of low response for each cardiometabolic risk factor by absolute V̇O2max response group ......................... 74 Table 5.3b Mean change and prevalence of low response for each cardiometabolic risk factor by relative V̇O2max response group ........................... 74
ix
LIST OF FIGURES
Figure 4.1 Prevalence of inadequate, average, and optimum scores for cardiovascular health by baseline fitness category ............................................. 54 Figure 4.2 Average treadmill time in the total population and by sex based on ideal cardiovascular health category ................................................................... 55 Figure 4.3 Adjusted odds of being in the average or higher ideal cardiovascular health category by baseline fitness category ....................................................... 55 Figure 4.4 Percent change in ideal cardiovascular health score by change in fitness group ........................................................................................................ 56 Figure 5.1 Distribution of absolute V̇O2max training response across studies ....... 75
Figure 5.2a Prevalence of low V̇O2max response based on absolute terms for each exercise intervention ordered by increasing dose of exercise .................... 75 Figure 5.2b Prevalence of low V̇O2max response based on relative terms for each exercise intervention ordered by increasing dose of exercise ............................. 76 Figure 5.3 Prevalence of low V̇O2max response based on relative terms for studies employing multiple interventions ordered by increasing dose of exercise ........... 76 Figure 5.4a Prevalence of low response for plasma fasting insulin across studies by relative V̇O2max groups ..................................................................................... 77 Figure 5.4b Prevalence of low response for plasma HDL-C across studies by relative V̇O2max groups .......................................................................................... 77 Figure 5.4c Prevalence of low response for plasma triglycerides across studies by relative V̇O2max groups ..................................................................................... 78 Figure 5.4d Prevalence of low response for resting systolic blood pressure across studies by relative V̇O2max groups ............................................................. 78 Figure 5.5a Distribution of risk factor response score for all exercisers by absolute V̇O2max groups ....................................................................................... 79

x
Figure 5.5b Distribution of risk factor response score for all exercisers by relative V̇O2max groups ..................................................................................................... 79 Figure 5.6a Distribution of risk factor response score amongst absolute low V̇O2max responders ............................................................................................... 80 Figure 5.6b Distribution of risk factor response score amongst relative low V̇O2max responders ........................................................................................................... 80

1
CHAPTER 1
OVERALL INTRODUCTION
Cardiorespiratory fitness (CRF) is well established as having a strong
inverse association with numerous cardiovascular disease (CVD) risk factors and
mortality.1 As CVD remains the number one cause of death in America,2 the
detrimental effects of low CRF present a substantial health threat. Recently, the
American Heart Association (AHA) launched a new primordial prevention
approach called, “Life’s Simple 7” which emphasizes seven positive health
factors and behaviors [blood cholesterol, blood pressure (BP), fasting plasma
glucose, diet quality, physical activity (PA), smoking, and body mass index
(BMI)]. The promotion of achieving and retaining these health metrics at an ideal
level serves to improve cardiovascular health (CVH) and decrease public health
burden and CVD mortality in the United States (U.S.).3 Despite the strong
associations between CRF and each individual component of “Life’s Simple 7,”
the associations between CRF and ideal CVH in adults cross-sectionally or
longitudinally are currently unknown.
Aerobic exercise interventions are used to increase CRF, as measured by
maximal oxygen uptake (V̇O2max), as an experimental approach in order to help
combat the detrimental effects of low CRF. However, considerable inter-
individual variation exists in the ability to improve CRF and CVD risk factors in
response to regular exercise. Given the strong relationship between V̇O2max and

2
cardiometabolic risk factors, identifying individuals who may not experience
clinically significant gains in CRF with aerobic training (i.e., low V̇O2max response)
is of great interest. The ability to identify individuals who respond unfavorably to
an exercise intervention will facilitate adjustment of their exercise prescription to
maximize clinically important health adaptations.
The studies of this dissertation syndicated both epidemiologic and clinical
data to enrich the knowledge base regarding the magnitude of change in CRF
and cardiovascular health markers. The relationship between changes in CRF
and changes in ideal CVH profile were established by analyzing data from a
large prospective, longitudinal study. Then, data from eight large exercise
training studies comprised of 14 different standardized exercise interventions
was utilized to assess the prevalence of low V̇O2max response and determine if
V̇O2max responsiveness is related to concomitant changes in cardiometabolic risk
factors. Thus, the purpose of these studies was to 1) identify the relationship
between ideal cardiovascular health and CRF both cross-sectionally and
longitudinally, 2) ascertain the prevalence of low V̇O2max response across several
standardized aerobic exercise interventions, and 3) identify the relationship
between V̇O2max responsiveness and changes in CVD risk factors across the
aforementioned exercise interventions. The following aims were proposed to
accomplish these goals.
Aim 1 evaluated whether ideal CVH as defined by AHA’s ‘Life’s Simple Seven’ is
associated with CRF. In addition, the relationship between changes in CRF and
changes in ideal CVH score over time was examined. These associations were
3
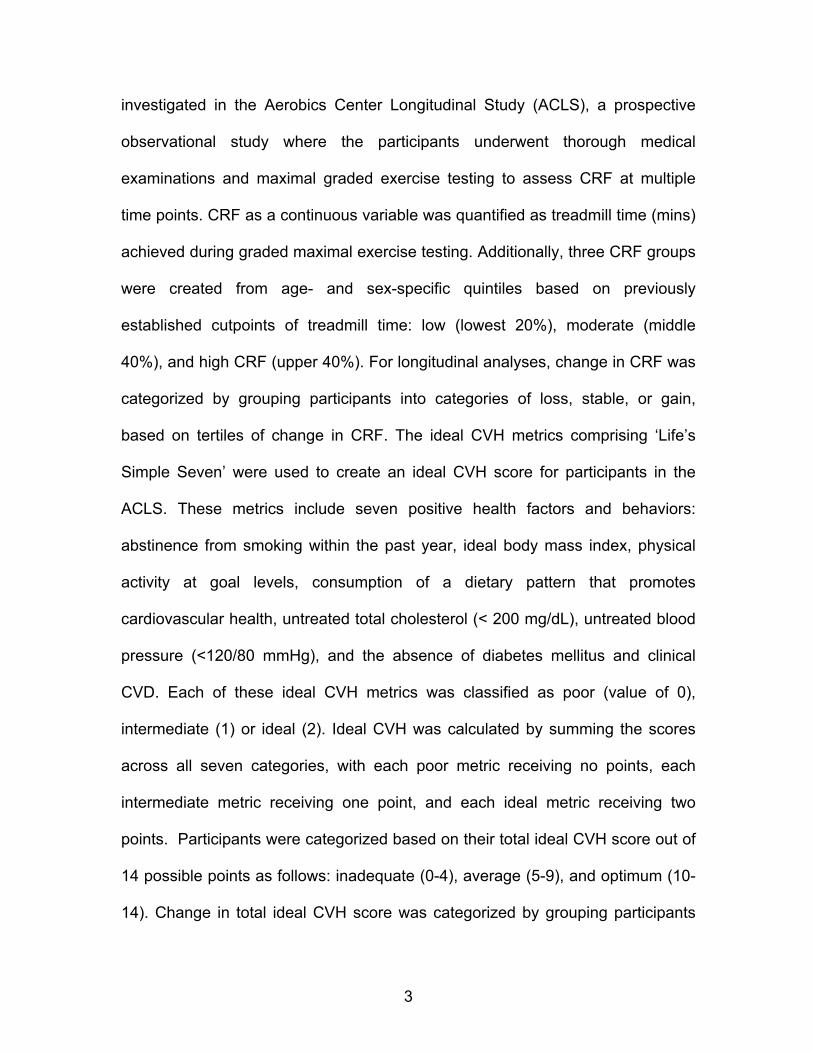
investigated in the Aerobics Center Longitudinal Study (ACLS), a prospective
observational study where the participants underwent thorough medical
examinations and maximal graded exercise testing to assess CRF at multiple
time points. CRF as a continuous variable was quantified as treadmill time (mins)
achieved during graded maximal exercise testing. Additionally, three CRF groups
were created from age- and sex-specific quintiles based on previously
established cutpoints of treadmill time: low (lowest 20%), moderate (middle
40%), and high CRF (upper 40%). For longitudinal analyses, change in CRF was
categorized by grouping participants into categories of loss, stable, or gain,
based on tertiles of change in CRF. The ideal CVH metrics comprising ‘Life’s
Simple Seven’ were used to create an ideal CVH score for participants in the
ACLS. These metrics include seven positive health factors and behaviors:
abstinence from smoking within the past year, ideal body mass index, physical
activity at goal levels, consumption of a dietary pattern that promotes
cardiovascular health, untreated total cholesterol (< 200 mg/dL), untreated blood
pressure (<120/80 mmHg), and the absence of diabetes mellitus and clinical
CVD. Each of these ideal CVH metrics was classified as poor (value of 0),
intermediate (1) or ideal (2). Ideal CVH was calculated by summing the scores
across all seven categories, with each poor metric receiving no points, each
intermediate metric receiving one point, and each ideal metric receiving two
points. Participants were categorized based on their total ideal CVH score out of
14 possible points as follows: inadequate (0-4), average (5-9), and optimum (10-
14). Change in total ideal CVH score was categorized by grouping participants
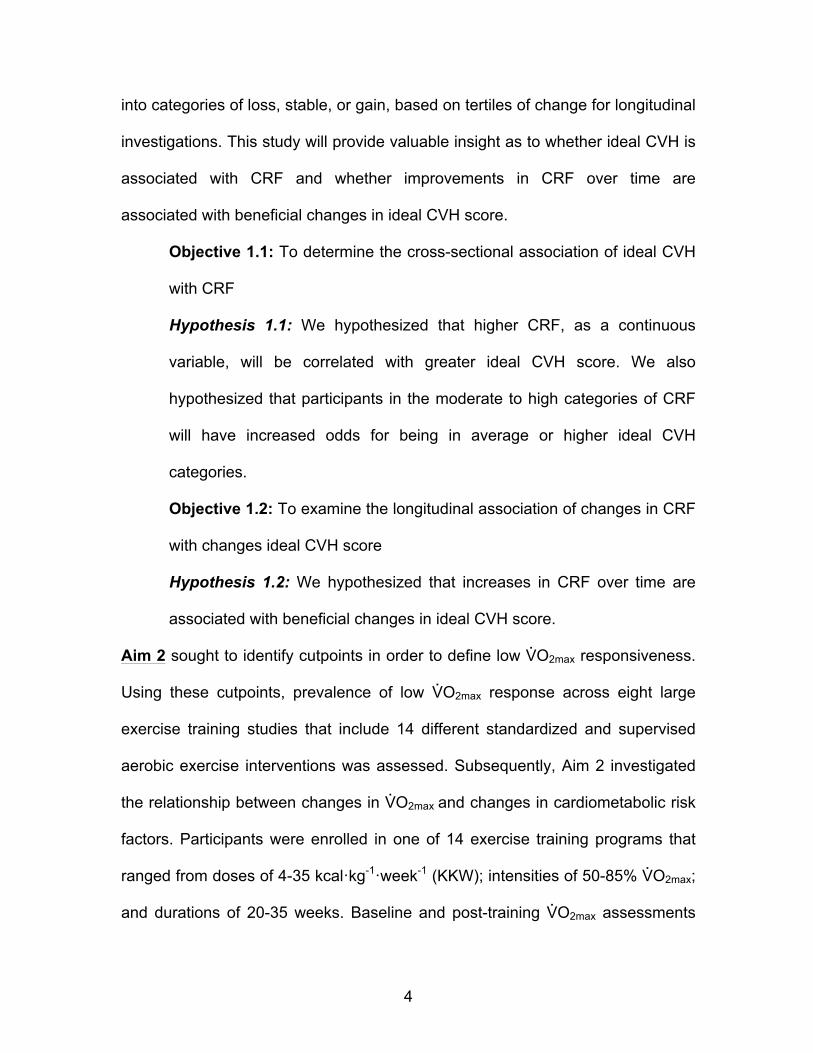
4
into categories of loss, stable, or gain, based on tertiles of change for longitudinal
investigations. This study will provide valuable insight as to whether ideal CVH is
associated with CRF and whether improvements in CRF over time are
associated with beneficial changes in ideal CVH score.
Objective 1.1: To determine the cross-sectional association of ideal CVH
with CRF
Hypothesis 1.1: We hypothesized that higher CRF, as a continuous
variable, will be correlated with greater ideal CVH score. We also
hypothesized that participants in the moderate to high categories of CRF
will have increased odds for being in average or higher ideal CVH
categories.
Objective 1.2: To examine the longitudinal association of changes in CRF
with changes ideal CVH score
Hypothesis 1.2: We hypothesized that increases in CRF over time are
associated with beneficial changes in ideal CVH score.
Aim 2 sought to identify cutpoints in order to define low V̇O2max responsiveness.
Using these cutpoints, prevalence of low V̇O2max response across eight large
exercise training studies that include 14 different standardized and supervised
aerobic exercise interventions was assessed. Subsequently, Aim 2 investigated
the relationship between changes in V̇O2max and changes in cardiometabolic risk
factors. Participants were enrolled in one of 14 exercise training programs that
ranged from doses of 4-35 kcal·kg-1·week-1 (KKW); intensities of 50-85% V̇O2max;
and durations of 20-35 weeks. Baseline and post-training V̇O2max assessments

5
were completed via maximal graded exercise testing. Low V̇O2max response was
defined in both absolute and relative terms based on technical error (TE) and
coefficient of variation values derived from three repeatability studies in the
HERITAGE Study. Results from this aim determined the association between
V̇O2max responsiveness and concomitant changes in cardiometabolic risk factors
[resting systolic blood pressure (SBP) and fasting insulin, high-density lipoprotein
cholesterol (HDL-C), and triglycerides (TG)]. This enhanced understanding will
improve the ability to develop and adjust future exercise programming.
Objective 2.1: To identify cutpoints to define responsiveness of change in
V̇O2max following standardized aerobic exercise interventions
Objective 2.2: To determine the prevalence of low V̇O2max response
across multiple standardized aerobic exercise interventions
Objective 2.3: To examine whether exercise dose and/or intensity is
associated with the prevalence of low V̇O2max response
Hypothesis 2.3: We hypothesized that greater exercise dose and
intensity will yield lower prevalence of low V̇O2max response, with intensity
playing a larger role in V̇O2max responsiveness.
Objective 2.4: To compare differences in changes of cardiometabolic risk
factors between V̇O2max response groups
Hypothesis 2.4: V̇O2max responders will have greater beneficial changes
in cardiometabolic risk factors compared to low V̇O2max responders.
Objective 2.5: To determine the distribution of low responses across all
traits (CRF, resting SBP, fasting insulin, HDL-C, and TG)
6
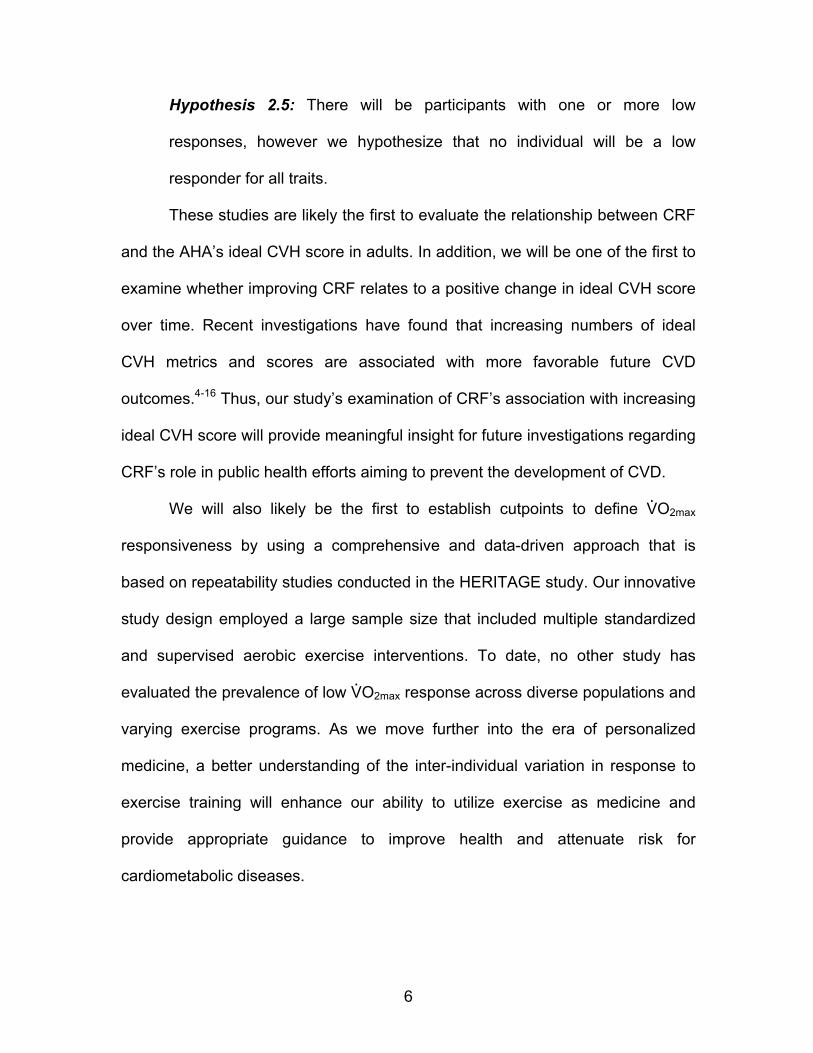
Hypothesis 2.5: There will be participants with one or more low
responses, however we hypothesize that no individual will be a low
responder for all traits.
These studies are likely the first to evaluate the relationship between CRF
and the AHA’s ideal CVH score in adults. In addition, we will be one of the first to
examine whether improving CRF relates to a positive change in ideal CVH score
over time. Recent investigations have found that increasing numbers of ideal
CVH metrics and scores are associated with more favorable future CVD
outcomes.4-16 Thus, our study’s examination of CRF’s association with increasing
ideal CVH score will provide meaningful insight for future investigations regarding
CRF’s role in public health efforts aiming to prevent the development of CVD.
We will also likely be the first to establish cutpoints to define V̇O2max
responsiveness by using a comprehensive and data-driven approach that is
based on repeatability studies conducted in the HERITAGE study. Our innovative
study design employed a large sample size that included multiple standardized
and supervised aerobic exercise interventions. To date, no other study has
evaluated the prevalence of low V̇O2max response across diverse populations and
varying exercise programs. As we move further into the era of personalized
medicine, a better understanding of the inter-individual variation in response to
exercise training will enhance our ability to utilize exercise as medicine and
provide appropriate guidance to improve health and attenuate risk for
cardiometabolic diseases.

7
CHAPTER 2
GENERAL METHODOLOGY
Aim 1
Aim 1 evaluated if ideal cardiovascular health (CVH) as defined by the
AHA’s “Life’s Simple Seven”3 is associated with CRF (Objective 1.1). In addition,
the relationship between changes in CRF and changes in ideal CVH score over
time was examined (Objective 1.2).
Study Design
This study employed both cross-sectional and longitudinal analyses. A
cross-sectional analysis examined if CRF is associated with ideal CVH. A
longitudinal analysis was used to examine the relationship between changes in
CRF and changes in ideal CVH score over time.
To address aim 1, data from the ACLS was utilized. The ACLS is a
prospective observational study of participants who were self-, employer-, or
physician-referred for an extensive medical examination at the Cooper Clinic in
Dallas, Texas. The study investigated the health outcomes associated with
physical activity and CRF levels. All participants received written and oral
informed consent and the ACLS study has been reviewed and approved annually
by the Cooper Institute’s Institutional Review Board.
!
8
Study Population
This study included participants from the ACLS who completed at least
two medical examinations by a physician after a 12-hour (hr) overnight fast
between the years of 1987-1999. The medical examination was a complete
preventive medical evaluation including physical examination, personal and
family health history, questionnaires (demographics and health habits),
anthropometry, resting electrocardiography, blood chemistry analyses, blood
pressure, and a maximal exercise treadmill test. Health history questionnaires
included: personal history of myocardial infarction, stroke, hypertension,
diabetes, and cancer; parental history of CVD; smoking status, alcohol intake,
and PA. Participants also completed a 3-day diet recall. Time between
examinations ranged from 12 months to 11 years. Details of the examinations
have been described elsewhere.17 Participants with complete data on CRF and
all of the AHA’s “Life’s simple 7”3 health behaviors and factors (smoking, BMI,
PA, dietary data, blood cholesterol, blood pressure, and fasting plasma glucose)
were included. Participants were excluded if they had any form of CVD or cancer,
or if they had abnormal findings on electrocardiography at baseline.
Measurements
Anthropometrics. Anthropometric measures were taken and BMI was
calculated as weight in kilograms divided by height in meters squared. BMI
values were classified as follows: normal (18.5-24.9 kg/m2), overweight (25.0-
29.9 kg/m2), or obese (≥30.0 kg/m2). Resting blood pressure was measured by
the auscultatory method with a mercury sphygmomanometer. To ensure

!
9
accuracy, two measures were taken and if the readings differed by more than 5
mmHg, then a third measure was taken and all the measures were averaged.
Blood samples were taken from the antecubital vein after 15 to 20 minutes (min)
of sitting. Concentrations of total cholesterol and fasting plasma glucose were
measured by automated techniques.18-20
Cardiorespiratory fitness. Maximal treadmill testing using a modified
Balke protocol was used to assess CRF, which was defined as treadmill time in
min, at baseline and during follow-up visits, as previously described.17, 21 Three
CRF groups were created from age- and sex-specific quintiles based on the
previously established cutpoints of treadmill time: low (lowest 20%), moderate
(middle 40%), and high (upper 40%) CRF.17
Change in CRF as a continuous variable was calculated as the difference
in treadmill time between the first two adjunct examinations and divided by the
number of years between them. Annual change in CRF was used to define
change in fitness because the intervals between the follow-up examinations
varied among individuals in our cohort. Annual change in CRF was categorized
by grouping participants into categories of loss, stable, or gain, based on tertiles
of change in CRF. For example, a participant categorized in the low CRF group
at baseline and increased to the moderate CRF group at follow-up would be
categorized as gain in the CRF change groups.
Diet. Participants were asked to keep detailed records of everything they
consumed over two pre-assigned weekdays and one weekend day for the 3-day
dietary assessment. Written instructions on how to accurately describe foods and

!
10
portion sizes were given to each participant. Registered dietitians at the Cooper
Clinic coded and analyzed the diet records using the Cooper Clinic Nutrition and
Exercise Evaluation system. Achievement of the AHA diet goals were
categorized as follows: 4.5 or more servings of fruits and vegetables per day, two
or more 3.5 oz. servings per week of fish, shellfish, or other seafood, three or
more servings per day of whole grains, and less than 1500 mg per day of
sodium. Diet scores were assigned by giving a point for each diet goal met (i.e.,
consuming <1500 mg/day of sodium is one point) for a total possible score of
four points.
Physical Activity. Participants completed a formerly validated
questionnaire to assess leisure time PA over the past three months, which
included type, frequency, and duration of activity. PA categories were created
based on the responses to 10 specific activities: walking, jogging, running,
treadmill exercise, cycling, stationary cycling, swimming, racquet sports, aerobic
dance, and other sports related activities. The intensity of the activities was
estimated using speed-specific or activity-specific MET values from the
Compendium of Physical Activities.22 MET-min per week (min/wk) were then
calculated by multiplying the MET value for each activity by frequency and
duration. Then, MET-min/wk for all activities was added together. For the present
study, participants were classified into three categories based on the 2008
Physical Activity Guidelines for Americans:23 inactive (0 MET-min/wk), insufficient
(1-499 MET-min/wk), and recommended (≥500 MET-min/wk).
!
11
AHA Ideal Cardiovascular Health. Ideal CVH was determined by
assessing the presence of seven positive health factors and behaviors that
include: abstinence from smoking within the past year, ideal body mass index,
physical activity at goal levels, consumption of a dietary pattern that promotes
cardiovascular health, untreated total cholesterol (<200 mg/dL), untreated blood
pressure (<120/80 mmHg), and the absence of diabetes mellitus and clinical
CVD.3 Each of these ideal CVH metrics will be classified as poor (value of 0),
intermediate (1) or ideal (2). Ideal CVH was calculated by summing the scores
across all seven categories, with each poor metric receiving no points, each
intermediate metric receiving one point, and each ideal metric receiving two
points. Participants’ were categorized based on their total ideal CVH score out of
14 possible points as follows: inadequate (0-4 points), average (5-9 points), and
optimum (10-14 points).
Change in total ideal CVH score as a discrete variable was calculated as
the difference in total ideal CVH score between the first two adjunct
examinations, and divided by the number of years between them. Change in total
ideal CVH score was categorized by grouping participants into categories of loss,
stable, or gain, based on tertiles of change as described above for change in
CRF categories.
Data Analysis
Baseline characteristics were summarized for the total population and by
sex. Differences between sexes at baseline were determined by t-tests for
continuous variables and chi-square tests for categorical variables. Multivariable
!
12
general linear and logistic regression models were used to evaluate the
association of baseline CRF with baseline ideal CVH score and to estimate the
odds of being in the average or optimum ideal CVH categories by baseline CRF
categories, respectively. These cross-sectional analyses controlled for age, sex,
and year of examination.
To investigate the longitudinal association between changes in CRF and
changes in ideal CVH, we employed linear regression models adjusting for age,
sex, and time between exam dates. Separate models that included CRF and
ideal CVH as either continuous or categorical variables were used. All models
were performed in the total population and stratified by sex (removing sex as
covariate in model).
SAS version 9.4 was used for all statistical analyses. The threshold for
statistical significance was set at the p<0.05 level.
Aim 2
Aim 2 established cutpoints in order to define responsiveness for change
in V̇O2max following standardized aerobic exercise interventions (Objective 2.1).
Using this definition, assessment of the prevalence of low V̇O2max response
across 14 large, standardized aerobic exercise interventions was completed
(Objective 2.2). Furthermore, aim 2 examined whether exercise dose, intensity,
and/or program duration is associated with the prevalence of low V̇O2max
response (Objective 2.3). Subsequently, Aim 2 investigated the relationship
between changes in V̇O2max and changes in cardiometabolic risk factors (resting
SBP and fasting plasma insulin, HDL-C, and TG) utilizing these 14 aerobic
!
13
exercise interventions. This aim compared the difference of changes in
cardiometabolic risk factors between V̇O2max response groups (Objective 2.4).
Additionally, this aim explored the distribution of low responses across all traits
via a total risk factor response score (Objective 2.5).
Study Design
This study employed both cross-sectional and longitudinal designs to
analyze data from previously completed experimental trials. A longitudinal design
was used to determine participants’ change in V̇O2max from baseline to post
aerobic exercise intervention. Two cutpoints were applied to the V̇O2max change
scores in order to define low V̇O2max response in both absolute and relative
terms. Subsequently, these created categories of V̇O2max responsiveness were
used in a cross-sectional analysis in order to determine the prevalence of low
V̇O2max response for each intervention and determine if V̇O2max responsiveness is
related to concomitant changes in cardiometabolic risk factors. To address aim 2,
data from 14 completed aerobic exercise interventions from eight of the largest
exercise training studies was utilized.
Study Population
The present study examined data from 14 distinct supervised exercise
interventions (n=1,724) from the following completed exercise training studies:
Health, Risk Factors, Exercise Training And Genetics Family Study (HERITAGE),
Dose-Response to Exercise in Women (DREW), Gene Exercise Research Study
(GERS), Energy Flux, Examination of Mechanisms of Exercise-induced Weight
Compensation (E- MECHANIC), Inflammation and Exercise (INFLAME), and

!
14
Studies of a Targeted Risk Reduction Intervention through Defined Exercise
(STRRIDE) I and II. These interventions provide a diverse array of populations,
standardized exercise programs, and baseline fitness levels. Overall, these
exercise interventions ranged from doses of 4-35 kcal·kg-1·week-1 (KKW);
intensities of 50-85% V̇O2max; and durations of 20-35 weeks. All participants from
these exercise training studies received written and oral informed consent. The
studies were all reviewed and approved by each institution’s Institutional Review
Board.
Exercise Training Study Protocols
DREW. The DREW Study was a randomized controlled dose-response
exercise trial. The present study sample will include 361 previously sedentary,
postmenopausal women (63% White) with a BMI of 25-40 kg/m2, resting systolic
blood pressure of 120-159 mmHg, and resting diastolic blood pressure ≤99
mmHg who completed one of three 24-week aerobic exercise programs. The
three exercise programs expended 4 (n=155), 8 (n=104), or 12 (n=102) kcal per
kg of body weight per week (KKW). All participants alternated training sessions
on a cycle ergometer or treadmill with a target intensity of 50% V̇O2max. Exercise
training sessions were completed three to four times per week.24
GERS. The GERS sample will include 171 previously sedentary, non-
diabetic, non-smoking men and women (56%) aged 50-71 years (73% White).
Participants had no history of CVD, were normotensive or had medication-
controlled blood pressure, and had a BMI <37 kg/m2. The exercise training
program consisted of 24 weeks (three sessions per week) of aerobic exercise.
!
15
Participants used various types of aerobic exercise equipment including cycle
ergometers, treadmills, rowers, and elliptical, skier, and stepping machines.25
Exercise training progressed to a target exercise intensity of 70% V̇O2max.26, 27
HERITAGE. The HERITAGE sample included 718 (66% White) men and
women (56%) aged 17-65 years who completed a 20-week endurance exercise
program. Participants were sedentary at baseline, normotensive to untreated
mildly hypertensive (<160/100), and body mass index (BMI) was less than 40.0
kg/m2. The exercise program consisted of aerobic exercise performed three days
per week on a cycle ergometer. Training progressed to a target exercise intensity
of 75% V̇O2max.28
Energy Flux. The Energy Flux Study was a randomized controlled
exercise trial. The present study sample will include 65 men and women (46%)
aged 21-45 years (48% White) who completed one of two 24-week aerobic
exercise interventions. Participants were previously sedentary, generally healthy
adults with a BMI of 25-35 kg/m2. The two exercise intervention programs
expended 17.5 (n=33) or 35 (n=32) KKW. Training progressed to target exercise
intensity 70-75% maximal heart rate (HR) (based on most recent maximal
exercise test). All exercise was performed on a treadmill 3-6 times per week.
INFLAME. The INFLAME sample will include 66 previously sedentary,
generally healthy, non-smoking men and women (65%) who completed a 16-
week aerobic exercise intervention. Participants (65% White) were aged 30-75
years with a BMI 18-40 kg/m2, blood pressure <140/90 mmHg, and elevated
plasma C-Reactive Protein concentration (≥2.0 mg/L but <10.0 mg/L) at baseline.
!
16
Exercise training expended 16 KKW at a target exercise intensity 60-80%
V̇O2max. Exercise was performed on either a treadmill or cycle ergometer 3-5
times per week.29
E-MECHANIC. E-MECHANIC was a six-month randomized controlled
exercise trial. The sample to be used for the present study includes 117 men and
women (72%) who completed one of two aerobic exercise interventions.
Participants (68% White) were non-smoking, generally healthy, previously
sedentary adults (aged 18-65 years) with a BMI of 25-45 kg/m2. The two exercise
groups expended 8 (n=60) or 20 (n=57) KKW for 24 weeks. All exercise was
performed on a treadmill at a target intensity of 65-85% V̇O2max. Exercise
sessions were completed 3-5 times per week.30
STRRIDE. The STRRIDE I and II studies were randomized controlled
exercise trials lasting for eight months. The present study sample includes 227
(83% White) non-smoking men and women (50%) who completed one of four
exercise training interventions. Participants were free of diabetes and coronary
artery disease, aged 40-65 years with a BMI 25-35 kg/m2, resting blood pressure
<160/90 mmHg, and mild-to-moderate dyslipidemia [low-density lipoprotein
cholesterol (LDL-C) 130-190 mg/dL and/or HDL-C 40mg/dL (men) or 45 mg/dL
(women)]. Combining STRRIDE I and II, participants completed one of four
exercise interventions: mild (14 KKW; 40-55% V̇O2peak; n=36), moderate (14
KKW; 65-80% V̇O2peak; n=90), high (23 KKW; 65-80% V̇O2peak; n=57), or
moderate plus resistance training (three days per week, three sets per day, and

!
17
8-12 repetitions per set; n=44). Aerobic exercise was performed three times per
week on treadmills, elliptical machines, or cycle ergometers.31, 32
Study-Specific Measurements
DREW. Full details of the DREW study design and methods are available
elsewhere.24 The DREW Study participants completed laboratory and self-report
measures at baseline and six months. Measures included: V̇O2max, resting BP,
anthropometry, dietary habits, PA history, medication use, menstrual history,
personal and family medical history, and fasting cholesterol, TG, and glucose.
V̇O2max was assessed via two maximal cycle ergometer tests on separate days at
baseline and follow-up. Participants practiced on the cycle ergometer during the
initial baseline medical assessment. Prior to exercise testing, resting
electrocardiography (ECG), heart rate (HR), and BP were measured. Participants
exercised at 30 Watts (W) for 2 min, 50 W for 4 min, followed by increases of 20
W every 2 min until exhaustion. Throughout the test, BP, HR, ECG, V̇O2, carbon
dioxide (CO2) production, ventilation and respiratory exchange ratio (RER) were
measured. Respiratory gases were measured using a ParvoMedics True Max
2400 metabolic measurement cart (Sandy, UT). Two fitness tests were
performed on separate days at baseline and follow-up. The average V̇O2max from
these two tests was used as V̇O2max.
Following a 30-min recumbent rest period, at least four BP measurements
were taken using an automated BP unit (Colin STBP-780). Each BP
measurement was separated by two min.

!
18
At baseline and follow-up, blood samples were obtained via an antecubital
vein following a 10-12 hr fast. Fasting blood glucose concentration and blood
lipid profiles were determined with a Dimension RXL analyzer (Oxford, CT).
Additionally, plasma insulin was measured by electrochemiluminescence.
GERS. Full details of the GERS study design and methods are available
elsewhere.26, 27 Study measurements included medical history, fasting blood
samples (genotyping and plasma lipids), glucose tolerance testing, physical and
cardiovascular examination by a physician, and maximal exercise testing at
baseline and post-training. V̇O2max was assessed via Bruce maximal treadmill
exercise testing.33 HR, BP, and ECG results were recorded prior to the start of
the test, at the end of each exercise stage, and after completion of the test. V̇O2
was measured continuously and directly throughout the test using a customized
metabolic system (Marquette Respiratory Mass Spectrometer, Rayfield Mixing
Chamber, VMM Ventilatory Turbine).
Participants were fasted and sat quietly in the laboratory for 15 min prior to
resting BP measurements were obtained. BP was measured while the
participants were seated with their arm at heart level. Two measurement values
had to agree within ± 5 mmHg. Averages from two days of BP measures were
used to determine resting BP.
Blood samples were obtained in the morning following an overnight fast.
For plasma lipid levels, blood samples were taken on two separate days and
averaged. At least three days before exercise training began, blood samples
were drawn after the completion of the 6-wk dietary stabilization period. Post-

!
19
training samples were obtained 24-36 hr after the participant’s final exercise
training session. Plasma insulin levels were determined via radioimmunoassay
(Linco Research, St. Charles, MO). Plasma HDL-C levels were measured after
precipitation with dextran sulfate on a CDC-certified Hitachi 717 analyzer.
HERITAGE. Full details of the HERITAGE study design and methods are
reported elsewhere.28 Participant measures included: blood samples (plasma
lipids, glucose, insulin, sex steroids, glucocorticoids), body fat and fat distribution,
dietary and activity habits (questionnaires), several genetic analyses, and two
maximal exercise tests at baseline and follow-up. These two tests were
conducted at approximately the same time of day with at least 48 hrs between
the two tests. All maximal exercise tests were performed on a cycle ergometer
and included the following measures: ventilatory rate (V̇E), V̇O2, volume of carbon
dioxide expired (V̇CO2), RER, BP, HR, cardiac output, stroke volume, and blood
variables (glucose, free-fatty acids, lactate, and total proteins).
Respiratory gases were measured by using a SensorMedics 2900 metabolic cart.
The average V̇O2max from the two tests was calculated and recorded as V̇O2max
for each subject given that both values were within 5% of each other. If V̇O2max
from the two tests differed by more than 5%, the higher V̇O2max value was used.
Following a 5-min rest period, resting BP was measured using an
automated blood pressure unit (Colin STBP-780; San Antonio, TX). At 2-min
intervals, four readings were taken. Resting BP was recorded as the mean of
three or more reliable measurements.
!
20
Blood samples were obtained from venipuncture of an antecubital vein
into vacutainer tubes containing EDTA. Blood draws were performed in the
morning following a 12-hr fast. Blood samples were collected twice at baseline on
separate days. Post-training blood samples were taken at 24 and 72 hr after the
final training session. Samples were obtained early in the follicular phase of the
menstrual cycle for eumenorrheic women. Total cholesterol and TG levels were
determined in plasma and lipoproteins by enzymatic methods (Technicon RA-
500 Analyzer; Bayer Corporation Inc., Tarrytown, NY). HDL-C fractions were
obtained after precipitation of LDL in the infranatant via the heparin manganese
chloride method. Fasting plasma insulin samples were obtained at baseline as
well as one and three days after the final exercise bout. Plasma insulin (i.e.,
immunoreactive insulin) was measured by radioimmunoassay following
polyethylene glycol separation.
Energy Flux. Full details of the Energy Flux Study design and methods
are in submission. Measurements of body composition, energy expenditure,
resting metabolic rate, peak oxygen consumption (V̇O2peak), dietary intake (four
day diet recall), blood chemistry (glucose, leptin, grehlin, C-reactive protein,
apolipoprotein B, β-hydroxybutyrate, a lipid panel), and several questionnaires
regarding health behavior, current mood status, and overall health were
completed at baseline, three and six months. V̇O2peak was assessed on a
treadmill using a modified Bruce protocol with ECG. This exercise test consisted
of two-minute stages in which the participants worked to volitional fatigue, as
previously described.34 BP, HR, and rating of perceived exertion (RPE) were
!
21
recorded during the last 30 seconds (s) of each stage. Expired gases were
collected continuously via a stationary metabolic system (True One 2400,
ParvoMedics, Sandy, UT) to determine V̇O2peak. Participants in both exercise
groups performed a second fitness test at the end of the four-week run-in period
to adjust exercise intensity due to potential acute training adaptations.
Resting BP was measured using a sphygmomanometer and stethoscope
while the participant was sitting quietly. At least two measurements were taken to
be within 10 mmHg for systolic BP and within 5 mmHg for diastolic BP. The
average of the measurements was recorded as resting BP.
Following a 12-hr fast and 24-hr abstention from physical activity, blood
samples were obtained at baseline, 3-months, and 6-months (post-intervention).
Blood samples were obtained from an antecubital vein into tubes containing
EDTA. Samples were stored at -80°C and sent in entirety to LabCorp (Columbia,
SC) for fasting HDL-C, TG, and insulin analysis upon completion of the study.
INFLAME. Full details of the INFLAME design and methods can be
obtained elsewhere.29 Study measurements were completed at baseline and
post-training and included the following: anthropometrics, blood chemistry (C-
reactive protein, lipids, fasting glucose, and insulin), BP, CRF, and energy intake.
Fitness testing was performed on a cycle ergometer with ECG. Participants
cycled at 30 W for 2 min, 50 W for 4 min, and subsequent increases of 20 W
every 2 min until participants could no longer maintain a pedal cadence of 50
rpm. Throughout the test, HR, RPE, V̇O2, CO2 production, ventilation, and RER

!
22
were recorded. Respiratory gases were measured using a ParvoMedics’
TrueOne 2400 (Sandy, UT) Metabolic Measurement Cart.35
At least four BP measurements were performed after a 30-min recumbent
rest period using an automated blood pressure unit (Colin STBP-780). Each
measurement was separated by 2 min.
Throughout the trial, blood samples were taken at three separate visits: 3
ml at the orientation session, 20 ml at baseline (approximately two weeks later),
and 20 ml at the 4-month follow-up assessment. Participants were fasted for 10-
12 hr for each of the blood samples. Additionally, participants refrained from
consuming alcohol or exercising for 24 hr and acutely refrained from using
aspirin or anti-inflammatory medications for 48 hr prior to blood samples being
obtained. Plasma insulin was measured by electrochemiluminescence. Fasting
blood glucose concentration and blood lipid profiles were measured with a
Dimension RXL analyzer.
E-MECHANIC. Details of the E-MECHANIC study design and methods
are available elsewhere.30 Primary assessments for this study occurred at
baseline and post-training (24 weeks), and also utilized a truncated assessment
period at week 4 to identify potential short- term changes in outcome variables.
Participant assessments included anthropometrics, body composition, energy
metabolism, physical activity (including V̇O2max), and blood chemistry. V̇O2peak
was determined by a graded treadmill exercise test. Treadmill speed began at
2.4 mph on a level grade for two min. Treadmill speed and/or grade increased
every two min until volitional fatigue was reached. Throughout the intervention,

!
23
caloric expenditure rate was measured during exercise training with a metabolic
cart. At least two resting BP measurements were taken after the participant
rested in a seated position for at least five min.
STRRIDE. For the STRRIDE (i.e., STRRIDE I) and STRRIDE AT/RT (i.e.,
STRRIDE II) studies, full details of study design and methods are available
elsewhere.31, 32, 36 Study measurements included anthropometrics, BP, blood
chemistry (carbohydrate and lipid metabolism), food intake, Metabolic Syndrome
z score, and cardiorespiratory fitness at baseline and post-training.31 Additionally
in STRRIDE II, overall strength was measured.32 To assess V̇O2peak, maximal
cardiopulmonary exercise tests with ECG and expired gas analysis were
performed on a treadmill. Expired gases were measured using a ParvoMedics’
TrueMax 2400 Metabolic Cart (Sandy, UT). The protocol consisted of 2-min
stages, increasing the work rate by approximately 1 MET per stage. The V̇O2 for
the last 40 s of each state were averaged to determine V̇O2peak.
For STRRIDE I, resting BP was measured in the standing position just
prior to maximal exercise testing. For STRRIDE II, resting BP was taken every 20
min during the last hr of the 3-hr intravenous glucose tolerance test (GTT).
Values were averaged to obtain resting BP.
Fasted blood samples were taken at baseline and post-intervention
approximately 30-min prior to the start of the GTT. In regards to post-
intervention, blood samples were obtained 16-24 hr after the final exercise
training session. Blood samples were taken into EDTA tubes from an intravenous
catheter in the antecubital area. In order to control for inter-technician and inter-

!
24
assay variability, pre- and post-intervention plasma samples from the same
subject were analyzed together. Fasting insulin was measured by immunoassay
(Access Immunoassay System, Beckman Coulter, Fullerton, CA). Fasting HDL-C
and TG concentrations were estimated with NMR spectroscopy (LipoScience,
Raleigh, NC).
Data Analysis
In order to quantify low V̇O2max responsiveness, we applied the findings of
Skinner et al.’s report regarding the reproducibility of V̇O2max measured from
maximal exercise testing in HERITAGE to the additional aerobic exercise
interventions.37 Based on technical error (TE) and coefficient of variation values
derived from this study, low V̇O2max response was defined in both absolute (gain
<120 ml/min from baseline value) and relative (gain <5% of study-specific
baseline average V̇O2max) terms. Subsequently, the prevalence of low V̇O2max
response across interventions was calculated based on both the absolute and
relative definitions. We used within-study group comparisons to compare the
relative low V̇O2max responsiveness within studies that employed multiple
exercise interventions.
Based on previous literature from HERITAGE,37-42 low response for each
cardiometabolic trait following exercise training was defined as any change value
beyond 1xTE in a direction indicating a worsening of the risk factor was
considered a low response. Baseline characteristics were summarized for the
total population and by study. Prevalence of low response for each trait was
assessed on the basis of the number of participants who exceeded the 1xTE
!
25
calculations. For each of the cardiometabolic risk factors, a logistic regression
was performed to compare the distribution of low response between V̇O2max
response groups.
A total response score for all of the cardiometabolic risk factors was
calculated for each participant. Each risk factor classified as a low response
received no points, while each risk factor classified as a response received one
point. Thus, a participant that did not display any low responses would receive
four total points for their cardiometabolic risk factor score. A Χ2 test was
performed to compare the distribution of the total response score between
V̇O2max (relative) response groups. SAS version 9.4 was used for all statistical
analyses. The threshold for statistical significance was set at the p = 0.05 level.

!
26
CHAPTER 3
LITERATURE REVIEW
Cardiorespiratory fitness
CRF is defined as the ability of the circulatory, respiratory, and muscular
systems to supply oxygen to the body in order to perform physical work. Since
CRF integrates numerous systems in the body, CRF quantifies the functional
capacity of an individual and reflects total body health. CRF can be measured
directly via maximal exercise tests and is expressed as V̇O2max. Although less
precise, estimated CRF can be easily derived from the peak work rate achieved
on a treadmill or cycle ergometer. Estimated CRF is commonly expressed in
terms of metabolic equivalents (METs; a multiple of the resting metabolic rate
approximating 3.5 mL·kg−1·min−1).
Cardiorespiratory fitness and mortality risk
Whether estimated or measured directly, mounting evidence has
developed over the past 30 years establishing a strong inverse relationship
between CRF and risk for CVD and all-cause mortality.17, 43, 44 Additionally, low
levels of CRF are associated with higher mortality rates attributable to several
cancers, especially colon and breast cancers.45 Moreover, mortality risk is
notably reduced as CRF improves.46 In a recent scientific statement from the
AHA concerning the importance of assessing CRF as a clinical vital sign, Ross
and colleagues47 highlighted several critical references that express CRF in the
!
27
terms of survival benefit per MET. Collectively, these studies showed that each
1-MET increment in CRF, which is a small, relatively attainable increment in
fitness, was associated with a 10-25% improvement in survival.47 Furthermore,
mortality risk reduction has even been shown to decrease by as much as 30% in
low fit individuals (peak MET level <5) with CVD who improved exercise capacity
following cardiac rehabilitation participation.48
Recently, Naci and Ioannidis published a network meta-analysis to
compare the effectiveness of exercise and pharmaceutical drug intervention on
mortality risk.49 This study included 16 meta-analyses (12 drug and four exercise)
along with three additional recent exercise trials, which collectively totaled 305
randomized controlled trials (n=339,274). This analysis examined the benefits of
exercise on the secondary prevention of coronary heart disease, treatment of
heart failure, diabetes prevention, and stroke rehabilitation. This study did not
find a statistical difference between exercise and pharmaceutical interventions in
terms of mortality benefits for secondary prevention of coronary heart disease
and diabetes. The results also showed that exercise and physical activity
interventions were actually more effective than pharmaceutical interventions for
the secondary prevention of stroke mortality. The authors noted that evidence
from randomized controlled trials regarding mortality benefits from exercise
intervention is scarce, especially when compared to the pharmaceutical
intervention evidence (only 57 out of 305 trials were exercise interventions).
Despite this limitation in the evidence base, Naci and Ioannidis’s study suggests

!
28
that exercise and drug interventions are potentially similar in effectiveness for
mortality benefits.49
Cardiorespiratory fitness and cardiovascular disease risk
Several recent studies have shown the prominent role that CRF plays as a
predictor of adverse CVH outcomes (e.g., acute myocardial infarction, ischemic
heart disease, and CVD mortality). Compared to traditional risk factors, such as
hypertension (HTN), insulin resistance, lipid abnormalities, smoking, and obesity,
low CRF is the strongest predictor of risk for adverse CVH outcomes, including
mortality.50-58 Remarkably, CRF level is not solely a critical risk factor for CVD;
CRF also plays an influential role as a moderator for traditional CVD risk factors.
Hypertension
Chronic HTN is a major risk factor for CVD. Among individuals who
develop adverse CVH outcomes, HTN is the most common risk factor. As stated
by the Joint National Committee on Prevention, Detection, Evaluation, and
Treatment of High Blood Pressure, the direct relationship between CVD risk and
blood pressure (BP) begins at 115/75 mmHg.59 For each increment of 20/10
mmHg, CVD risk doubles.60
In 1984, Blair and colleagues were the first to investigate the relationship
between measured CRF and HTN incident.61 Participants were normotensive,
predominantly white, well-educated men and women (n=6,039) from the Aerobics
Center Longitudinal Study (ACLS). Participant follow-up ranged from one to 12
years. Blair et al. found that low fit individuals had a 1.5 times increased risk for
developing HTN compared to high fit individuals, even after controlling for age,
!
29
sex, body mass index, baseline BP, and follow-up interval. For low fit individuals
that were also in the highest BP category at baseline, risk for developing HTN
increased tenfold.61 These findings were confirmed by Sawada et al.62 in 3,305
normotensive Japanese men that were followed for five years. After adjusting for
age, body fat, baseline BP, and additional confounding variables, relative risk for
the development of HTN was 1.9 times greater for the least fit group compared to
the group with the highest fitness level.62 In 2003, Carnethon et al. looked at the
relationship between CRF in young adulthood and the development of CVD risk
factors in 2,478 participants from the Coronary Artery Risk Development in
Young Adults (CARDIA) study. The authors reported that each one-minute
decrease in maximal treadmill time performance was associated with a 19%
higher 15-year risk of incident HTN among men and women after adjustment for
age, sex, weight gain, and other confounding variables.63 In addition, a
subsequent study from the ACLS examined the association between CRF and
incident HTN exclusively in women who were normotensive at baseline. Results
showed that for each 1-MET increment in maximal exercise treadmill test
performance, there were 19% lower odds for developing HTN.64
Lifestyle interventions, such as increased physical activity and weight loss,
contribute significantly to successful BP control. These positive lifestyle
modifications provide beneficial changes in BP with minimal side effects.65
Several meta-analyses have reviewed numerous well-controlled aerobic exercise
studies and have consistently documented significant reductions in resting BP
following intervention.66-82 Thus, leading organizations around the world
!
30
recommend approaches that include regular physical activity to prevent and treat
HTN.59, 83-86
In 2013, Cornelissen and Smart published the largest meta-analysis to
date on randomized controlled trials investigating the effects of exercise training
on resting blood pressure (n=5,223; 3,401 exercisers and 1,822 sedentary
controls).80 This study included exercise interventions of endurance (105 groups),
dynamic resistance (29 groups), combined endurance and resistance training (14
groups), and isometric resistance training (5 groups) in adults who ranged from
normotensive to hypertensive. For the purpose of this literature review,
discussion focuses on endurance exercise training. Overall, training duration
ranged from four to 52 weeks and included one to seven exercise sessions per
week (majority of sessions lasted 30-60 minutes). Exercise intensity ranged from
35-95% V̇O2peak. Endurance exercise training-mediated decreases in BP
averaged 3.5 mmHg for systolic BP and 2.5 mmHg for diastolic BP. Additionally,
the largest reductions in BP following endurance training were significantly
greater in hypertensive individuals compared to prehypertensive and
normotensive individuals. These results are consistent with previous systematic
reviews stating that structured aerobic exercise interventions of moderate
intensity and adequate volume result in an independent reduction in resting BP of
approximately 4-10 mmHg in systolic and 3-8 mmHg diastolic BP regardless of
age or sex for individuals with stage 1 HTN.65, 85, 87, 88 Based in part upon this
scientific evidence, Pescatello and colleagues published an exercise prescription
update regarding HTN.89 This updated exercise prescription includes the

!
31
following to elicit the greatest BP benefit for adults with HTN: ≥30 minutes per
day of moderate intensity aerobic exercise on most days of the week and
dynamic resistance exercise 2-3 days per week, totaling ≥150 minutes of
exercise per week.
Insulin resistance
Insulin resistance develops when the body produces insulin but does not
use insulin efficiently to uptake glucose into cells for energy usage and storage,
causing a buildup of glucose in the blood. This hyperglycemic state triggers the
pancreas to increase β-cell production of insulin to try to counteract the high
levels of blood glucose. Eventually, the β-cells can no longer meet the demands
for insulin production caused by hyperglycemia, exacerbating the levels of
glucose in the blood. Insulin resistance can lead to the development of Type 2
diabetes mellitus (T2D) and CVD. As stated by the AHA, an individual with T2D
is at approximately two to four times greater risk for dying from CVD compared to
a non-diabetic individual.2, 90
Several large observational cohort studies, including the Harvard Alumni
Study91, US male physicians92, and the Nurses’ Health Study93, 94, have
established physical activity participation as a highly effective way to avert or
delay T2D onset, and can reduce adverse CVH outcome and mortality risk
amongst those with T2D. In addition to general physical activity participation,
there is a well-documented, inverse, curvilinear association between CRF and
risk of prediabetes, T2D, and metabolic syndrome.93, 95-99 Individuals with
moderate to high levels of CRF only have small differences in T2D risk rates

!
32
between each CRF level. Conversely, those with low CRF that gain small
increments in CRF are associated with large decreases in risk for developing
T2D, highlighting the importance of physical activity and exercise interventions
targeting individuals who are the least fit and stand the most to gain from
improved CRF.47
In the human body, skeletal muscle is the largest consumer of glucose.
Not only does insulin stimulate uptake of glucose into muscle cells, but these
cells also have glucose transporter proteins, GLUT-4 specifically, that instigate
glucose uptake. Exercise increases glucose uptake into working muscle cells via
the GLUT-4 transporter in an insulin-independent manner.100 A strong evidence
base exists with numerous exercise training studies supporting the idea that both
aerobic and anaerobic exercise training can improve both glucose uptake and
insulin sensitivity, making exercise a remarkable modulator for T2D and CVD
risk.101, 102
The seminal study by the Diabetes Prevention Program study provided
strong evidence that lifestyle modifications including diet and exercise were more
effective than pharmaceutical treatment using metformin in reducing the
incidence of T2D.103 Participants (n=3,234) were nondiabetic and had elevated
fasting and post-load plasma glucose concentrations. Participants were
randomized to one of three groups: placebo, metformin (850 mg twice daily), or a
lifestyle modification group. Participants in the lifestyle intervention group were
encouraged to achieve goals of 7% weight loss and ≥150 minutes per week of
physical activity. After an average follow-up time of 2.8 years, the lifestyle
!
33
intervention reduced T2D incidence by 58%, which was significantly greater than
the 31% reduction in the metformin group. This study stated that in order to
prevent a single case of T2D during a three-year period, 6.9 individuals would
have to participate in the lifestyle intervention, while 13.9 individuals would have
to receive metformin.
In 2014, Conn and colleagues were the first to publish a comprehensive
meta-analysis regarding the effects of supervised exercise training on insulin
sensitivity in healthy adults.104 This analysis included both published and
unpublished exercise intervention studies that measured insulin sensitivity, and
included 78 study reports and a total of 2,509 men and women. Unfortunately,
only 68 of the reports provided adequate details of the exercise intervention. Of
those reported, the median of the average exercise session time during
supervised training was 51 minutes; the median of average session frequency
was three per week; and the median of mean total number of exercise sessions
was 51. Overall, this review documented moderate improvements in insulin
sensitivity in healthy adults following supervised exercise interventions (mean
effect size 0.38 and 0.43).
Recently, Bird and Hawley reviewed the literature regarding the effects of
physical activity and exercise on insulin sensitivity to provide an update on the
latest research published between 2013 and 2016.105 In addition to furthering the
support of physical activity’s beneficial association with insulin sensitivity, the
authors summarized the following new findings: aerobic exercise may increase
insulin sensitivity without a detectable increase in V̇O2max, a dose effect is
!
34
emerging that shows increases in both exercise volume and intensity modulate
insulin sensitivity, aerobic exercise combined with resistance exercise may be
the most effective approach compared to either exercise mode alone, and
exercise induced benefits in insulin sensitivity may be augmented by appropriate
dietary changes.
Dyslipidemia
Another major risk factor for CVD is dyslipidemia, a condition in which
plasma cholesterol, TG, or both are elevated. Dyslipidemia can include both low
levels of HDL-C; (HDL particles remove cholesterol from arteries) and high levels
of LDL-C (LDL particles increase fatty deposits in arteries), which leads to
increased risk of plaque buildup and blockages. Prevalence of lipid abnormalities
in the United States estimated from the 2003-2006 National Health and Nutrition
Examination Survey (NHANES) are as follows: 53% of U.S. adults have lipid
abnormalities; 27% have high LDL-C; 23% have low HDL-C; and 30% have high
TG. In a previous epidemiological study from 2000, low levels of HDL-C and
elevated total cholesterol to HDL-C ratios were independently associated with
risk for coronary artery disease (CAD). For every 1 mg/dL increase in HDL-C,
there was a 2% decreased risk for CAD in men and a 3% reduction in risk for
women.106
In 2015, Sarzynski et al.107 examined the associations of baseline CRF
and changes in CRF on incident dyslipidemias in participants from the CARDIA
study (n=4,898). Over a 25-yr follow-up period, a significant inverse relationship
was found between the 25-yr incidence rate for each dyslipidemic trait (low HDL-
!
35
C, high TG, and high LDL-C) and baseline CRF. For example, the 25-yr incident
rate for high TG was 42% lower in the highest CRF quartile at baseline compared
to the lowest CRF quartile. For each of these dyslipidemic traits, those in the
highest sex-specific CRF quartile at baseline had significantly lower incidence
rates than the other three CRF quartiles. For each additional stage completed
during maximal fitness testing (two min per stage), risk for incident low HDL-C,
high TG, and high LDL-C was decreased by 9%, 16%, and 14%, respectively.
When evaluating the influence of sex and race, the association of baseline CRF
with 25-yr incidence of high TG appeared to be limited to white participants only.
There were no significant associations found in black participants. Longitudinal
results from adjusted regression models were not significant for the prediction of
5-yr incidence of dyslipidemias based on 20-yr change in CRF. On the other
hand, baseline CRF did significantly predict 5-yr incidence of high TG.107 The
results from this study support the notion that achieving higher levels of CRF are
related to decreased risk for incidence of dyslipidemias, particularly high TG.
A recent report looked at the impact of both baseline CRF and changes in
CRF on the risk for developing atherogenic dyslipidemia in men and women from
the ACLS.108 Atherogenic dyslipidemia was defined by the following: low HDL-C
(<40 mg/dL), high LDL-C (≥160 mg/dL), and high TG (≥200 mg/dL). A total of
9,651 participants were followed over an average of 8.9 years. During follow-up,
193 participants developed atherogenic dyslipidemia. Participants with high
levels of CRF at baseline had 43% lower odds of developing atherogenic
dyslipidemia compared to low fit individuals. However, once baseline HDL-C,

!
36
LDL-C, and TG were accounted for in the analysis, this association became
nonsignificant. When looking at changes in CRF over time, participants who
maintained their fitness level had 43% lower odds of developing atherogenic
dyslipidemia compared to those who had a reduction in CRF level. This
relationship remained statistically significant after additional adjustment for
baseline lipid metrics.108 Therefore, this study demonstrated a protective effect of
CRF against the risk for developing atherogenic dyslipidemia.
The majority of epidemiological and clinical evidence supports the
following concept: when adequate intensity, duration, and volume of aerobic
exercise are performed by both healthy individuals and those with dyslipidemia,
there are favorable and independent alterations in blood lipids and lipoproteins.88,
109-111 Mounting evidence exists suggesting that the magnitude of changes in
HDL-C is related more to the volume of exercise rather than the intensity.109, 110,
112 To achieve significant changes in HDL-C, volume of exercise needed is
estimated to be 1,000 to 1,500 kcal/week.113,88
When looking at the components of dyslipidemia, the evidence describing
increases in HDL-C with exercise is more consistent in comparison to the
evidence describing reductions in total cholesterol, LDL-C, and TG
concentrations.111, 112, 114 LDL-C is largely unaffected by regular exercise when
body weight and diet remain unchanged.114-116 When exercise is combined with
alterations in diet in patients with dyslipidemia, LDL-C reductions can be greater
compared to reductions achieved by diet or exercise alone.117 Furthermore,

!
37
exercise training has been shown to attenuate reductions in HDL-C that typically
result from low-fat diets.117-120
Kodama and colleagues performed a meta-analysis investigating the
effects of aerobic exercise training studies on HDL-C.121 Twenty-five aerobic
training randomized controlled trials were included for review. Average
intervention duration was 27 weeks with a mean frequency of 3.7 sessions per
week, mean session time of 40.5 minutes, mean estimated energy expenditure
was 1,019 kcal/week, and mean absolute and relative intensity was 64.8%
V̇O2max and 5.3 METs, respectively. Overall, the exercise interventions produced
a modest, yet highly significant beneficial change in HDL-C of 2.53 mg/dL. This
analysis estimated a minimal exercise volume threshold of 900 kcal/week or 120
minutes of total exercise per week to induce a significant elevation in HDL-C. In
addition, each 10-minute increase in exercise duration corresponded to
approximately a 1.4 mg/dL elevation in HDL-C. Finally, exercise training was
found to be more effective in participants with lower body mass index or higher
baseline HDL-C levels.
Overweight and obesity
According to the World Health Organization (WHO), overweight (OW) and
obesity (OB) are classified by the following: OW is a body mass index (BMI)
between 25.0-29.9 kg/m2 and OB is a BMI greater than or equal to 30 kg/m2.
Based upon NHANES data from 2009-2012, 69% of U.S. adults are OW and
35% are considered OB.122 As documented by numerous reports, there is a
strong association between OW/OB and increased prevalence of CVD, making

!
38
OW and OB well-established CVD risk factors.122-128 In addition, excess risk
results from OW and OB coexisting with several other major CVD risk factors,
like HTN, atherosclerosis, metabolic syndrome, dyslipidemia, T2D, and
obstructive sleep apnea.129 Increased adiposity, especially visceral adiposity, has
also been shown to independently provoke alterations in cardiac structure and
function, further compounding the effects of OB on CVD risk.129, 130
Both central and peripheral hemodynamics are altered by weight gain and
OB that predispose individuals to ventricular dysfunction and heart failure,
including increased central and total blood volume, decreased systemic vascular
resistance, and increased left ventricular (LV) stroke volume and filling
pressures, cardiac output, and pulmonary artery pressures.130-133 OB increases
the likelihood of having LV remodeling, left atrial enlargement, increased right
ventricular mass, and greater end-diastolic volume.134-137 Moreover, OB is
associated with LV diastolic dysfunction, subclinical LV systolic dysfunction, and
reduced right ventricular ejection fraction. 132, 138-141
Although a strong association between excess adiposity and CVD risk
exists, the evidence base demonstrating a phenomenon termed the “obesity
paradox” has grown. Recent evidence from Lavie and colleagues has shown a
better prognosis in patients with CVD who are OW and mildly OB compared to
patients with CVD who are leaner. Patients with CVD who are underweight
usually display the worst outcomes.131, 132 Currently, the mechanisms by which
this phenomenon relates to CVD outcomes are poorly understood.129 Although
this topic is beyond the scope of this review, this growing area of research
!
39
suggests that muscle mass, strength, and CRF are major prognostic
determinants in OB patients with CVD (specifically coronary artery disease and
heart failure) and is important to note.142-145
A complex interaction exists between adiposity and CRF in regards to
CVD risk and mortality, referred to as the “fit and fat” phenomenon, where high
levels of CRF largely negate the adverse health effects of body fatness and
additional CVD risk factors like OW/OB, T2D, and HTN.146-155 Two landmark
fitness-fatness studies arose from the ACLS in 1999.154, 155 Both of these studies
analyzed data from over 21,000 men with approximately 8-10 years of follow-up
from the ACLS and found that low CRF was strongly, independently, and
inversely associated with CVD and all-cause mortality, regardless of body
fatness. These pivotal studies concluded that OB did not appear to increase
mortality risk in fit men, and that low CRF is as important as T2D, HTN, high
cholesterol, and smoking as a predictor of CVD and all-cause mortality in OW
and OB men. Since then, these findings have remained consistent amongst
additional ACLS reports in both men and women.156 For example, in 14,345 men
from the ACLS, Lee and colleagues found that each 1-MET increase in CRF
between two maximal exercise tests that were on average 6.3 years apart was
associated with a 15% reduction in all-cause mortality and a 19% reduction in
CVD mortality (results were after adjustment for potential confounders and
changes in CRF).157 Change in BMI was not associated with CVD or all-cause
mortality after adjustment for potential confounders and CRF change.

!
40
Additionally, men who lost fitness had higher risks of all-cause and CVD mortality
regardless of change in BMI.
There are several factors that appear to play a role in the alteration of
CVD risk due to increases in exercise and CRF in OW/OB patients, such as body
composition, insulin resistance, endothelial dysfunction, oxidative stress, platelet
reactivity, and inflammation.129 As visceral adiposity is a strong predictor of
CVD,158 one example of CRF-mediated changes in CVD risk is the ability of
exercise training to influence the distribution of body fat.36, 159-162 In 2013, Vissers
et al. conducted a meta-analysis of 15 exercise training studies without
hypocaloric diet on the effects of exercise on visceral adipose tissue (VAT) in
OW adults.162 This study analyzed data from 9 controlled and 6 uncontrolled
exercise trials (n=852), including aerobic, strength, or combined aerobic and
strength training interventions, that had measures of VAT from computed
tomography (CT) scan or magnetic resonance imaging (MRI). Overall, this meta-
analysis found that aerobic training of moderate or high intensity had the greatest
effect for reducing VAT in men and women compared to low intensity aerobic or
strength training. This study found that after just 12 weeks of intervention,
aerobic exercise training could beneficially reduce VAT (as measured by CT
analysis) by more than 30 cm2 in women and 40 cm2 in men. Thus, this study
concluded that decreases in VAT can be achieved via moderate and high
intensity aerobic exercise without hypocaloric diet in OW/OB individuals, which
beneficially effects CVD risk.162

41
CHAPTER 4
THE ASSOCIATION OF CARDIORESPIRATORY FITNESS AND
IDEAL CARDIOVASCULAR HEALTH IN THE AEROBICS CENTER
LONGITUDINAL STUDY
INTRODUCTION
In 2010, the American Heart Association (AHA) established a new
construct as part of the 2020 Impact Goals called ideal cardiovascular health
(CVH), which is characterized by seven metrics known as Life’s Simple 7 (LS7).3
The LS7 concept emphasizes seven positive health factors [blood cholesterol,
blood pressure (BP), and fasting plasma glucose] and behaviors [diet quality,
physical activity (PA), smoking, and body mass index (BMI)]. Each of the seven
components is classified into ideal, intermediate, or poor categories and an ideal
CVH score is created. A previous study from the Aerobics Center Longitudinal
Study (ACLS) showed that ideal CVH was associated with risk of cardiovascular
disease (CVD) mortality as demonstrated by an inverse, graded CVD mortality
risk in relation to the number of ideal metrics met.163 In addition, several cross-
sectional and prospective cohort studies have found that increasing numbers of
ideal CVH metrics are associated with decreased prevalence and incidence of
CVD outcomes.4-16

!
42
Cardiorespiratory fitness (CRF) is well established as having a strong
association with mortality and numerous CVD risk factors.1 Despite the strong
associations between CRF and each individual component of LS7, few studies
have examined the independent association of CRF and ideal CVH score.
Recently, Ruiz et al. found that CRF was positively associated with ideal CVH
score in European adolescents (N=510) and identified a theoretical CRF
threshold associated with a more favorable CVH profile.164 However, to our
knowledge no study has examined the association between CRF and ideal CVH
in adults neither cross-sectionally nor longitudinally. Therefore, the purposes of
our study were 1) to evaluate if CRF is associated with ideal CVH and 2) to
examine the relationship between changes in CRF and changes in ideal CVH
score over time in the ACLS cohort.
METHODS
Study Population
The ACLS is a prospective observational study of participants who were
self-, employer-, or physician-referred for an extensive medical examination at
the Cooper Clinic in Dallas, Texas. The study investigated the health outcomes
associated with PA and CRF.17 All participants received written and oral informed
consent and the ACLS study has been reviewed and approved annually by the
Cooper Institute’s Institutional Review Board. The present study included
individuals with complete data on CRF and all of the AHA’s LS7 health behaviors
and factors between the years of 1987-1999. Participants were excluded if they
had any form of CVD or cancer, or if they had abnormal findings on
!
43
electrocardiography at baseline. The final analysis included 11,590 participants
who were predominately white, well-educated, and upper middle class.17
Clinical Examinations
Participants completed at least one medical examination by a physician
after a 12-hour overnight fast. The medical examination was a complete
preventive medical evaluation including physical examination, personal and
family health history, questionnaires (demographics and health habits),
anthropometry, resting electrocardiography, blood chemistry analyses, BP, and a
maximal exercise treadmill test. Health history questionnaires included: personal
history of myocardial infarction, stroke, hypertension, diabetes, and cancer;
parental history of CVD; smoking status, alcohol intake, and PA. Participants also
completed a 3-day diet recall. Time between examinations ranged from 12
months to 11 years. Details of the examinations have been described
elsewhere.17
Measurements. Anthropometric measures were taken and BMI was
calculated as weight in kilograms divided by height in meters squared and
classified as follows: normal (18.5-24.9 kg/m2), overweight (25.0-29.9 kg/m2), or
obese (≥30.0 kg/m2). Resting BP was taken following AHA protocol.17 To ensure
accuracy, two measures were taken and if the readings differed by more than 5
mmHg, then a third measure was taken and all the measures were averaged.
Concentrations of total cholesterol and fasting plasma glucose were measured
by automated techniques that followed the standards of the Centers for Disease
Control and Prevention Lipids Standardization Program.165
!
44
Cardiorespiratory Fitness. Maximal treadmill testing using a modified
Balke protocol was used to assess CRF as treadmill time in minutes at baseline
and during follow-up visits, as previously described.17, 21 Three CRF groups were
created from age- and sex-specific quintiles based on the previously established
cutpoints of treadmill time: low (bottom 20%), moderate (middle 50%), and high
(top 20%) CRF.17 Change in CRF as a continuous variable was calculated as the
difference in treadmill time between the first two successive examinations and
divided by the number of years between them. Annual change in CRF was used
to define change in fitness because the intervals between the follow-up
examinations varied among individuals in ACLS. Change in CRF was
categorized by grouping participants into categories of loss, stable, or gain,
based on tertiles of change in CRF. For example, a participant categorized in the
low CRF group at baseline that increased to the moderate CRF group at follow-
up would be categorized in the gain group for CRF change.
Diet. Participants were asked to keep detailed records of everything they
consumed over two pre-assigned weekdays and one weekend day for the 3-day
dietary assessment. Written instructions on how to accurately describe foods and
portion sizes were given to each participant. Registered dietitians at the Cooper
Clinic coded and analyzed the diet records using the Cooper Clinic Nutrition and
Exercise Evaluation system. Achievement of the AHA diet goals was categorized
as follows: 4.5 or more servings of fruits and vegetables per day, two or more 3.5
oz. servings per week of fish, shellfish, or other seafood, three or more servings
per day of whole grains, and less than 1500 mg per day of sodium. Diet scores

!
45
were assigned by giving a point for each diet goal met (i.e., consuming <1500
mg/day of sodium is one point) for a total possible score of four points.
Physical Activity. Participants completed a formerly validated
questionnaire to assess leisure time PA over the past three months, which
included type, frequency, and duration of activity. PA categories were created
based on the responses for 10 specific activities: walking, jogging, running,
treadmill exercise, cycling, stationary cycling, swimming, racquet sports, aerobic
dance, and other sports related activities. The intensity of the activities was
estimated using speed-specific or activity-specific metabolic equivalent (MET)
values from the Compendium of Physical Activities.22 MET-minutes per week
(min/wk) were then calculated by multiplying the MET value for each activity by
frequency and duration. Then, MET-min/wk for all activities was added together.
Participants were classified into three categories based on the 2008 Physical
Activity Guidelines for Americans:23 inactive (0 MET-min/wk), insufficient (1-499
MET-min/wk), and recommended (≥500 MET-min/wk).
AHA Ideal Cardiovascular Health. Each ideal CVH metric was classified
as poor (0 points), intermediate (1 point), or ideal (2 points) as described in Table
4.1. The ideal CVH score was calculated on a 14-point scale and categorized as
follows: inadequate (0-4 points), average (5-9 points), and optimum (10-14
points).
Annual change in total ideal CVH score as a discrete variable was
calculated as the difference in total ideal CVH score between the two successive
examinations, and divided by the number of years between them. Annual change
!
46
in total ideal CVH score was categorized by grouping participants into categories
of loss, stable, or gain, based on tertiles of change as described above for
change in CRF categories.
Statistical Analysis
Baseline characteristics were summarized for the total population and by
sex. Differences between sexes at baseline were determined by t-tests for
continuous variables and chi-square tests for categorical variables. Multivariable
general linear and logistic regression models were used to evaluate the
association of baseline CRF with baseline ideal CVH score and to estimate the
odds of being in the average or optimum ideal CVH categories by baseline CRF
categories, respectively. These cross-sectional analyses controlled for age, sex,
and year of examination. To investigate the longitudinal association between
changes in CRF and changes in ideal CVH, we employed linear regression
models adjusting for age, sex, and time between exam dates. Separate models
that included CRF and ideal CVH as either continuous or categorical variables
were used. All models were performed in the total population and stratified by
sex (removing sex as covariate in model). Finally, we conducted sensitivity
analyses to examine the influence of each LS7 metric on total CVH score. No
collinearity was observed after performing analyses to examine the influence of
CRF on each of the LS7 metrics. SAS version 9.4 was used for all statistical
analyses. The threshold for statistical significance was set at the p<0.05 level.
!
47
RESULTS
Descriptive characteristics of the study population (n=11,590) are given in
Table 4.2. The study population had a mean (standard deviation) age of 45.8
(9.8) years and BMI of 25.8 (4.1) kg/m2. Males had higher baseline values for
BMI, BP, total cholesterol, fasting plasma glucose, and treadmill time compared
to females (p<0.0001). As shown in Table 4.3, the prevalence of participants
from the total sample meeting ideal levels for each CVH metric at baseline was
(in ascending order): healthy diet 4.3% (n=497), BP 33.0% (n=3,827), total
cholesterol 45.9% (5,314), BMI 47.2% (n=5,473), smoking 56.2% (n=6,515), PA
59.9% (n=6,938), and fasting plasma glucose 61.9% (7,171). Only 0.24% of the
total sample met ideal levels for all seven metrics at baseline.
Cross-sectional association of CRF and ideal CVH. Treadmill time was
moderately correlated (p<0.0001) with CVH score in both males (r=0.56) and
females (r=0.50). The prevalence of inadequate, average, and optimum
categories for CVH score by baseline CRF category is displayed in Figure 4.1.
For those in the low fitness group, only 10.8% were in the optimum category for
ideal CVH score, while 17.1% were in the poor category. Conversely, only 0.4%
of the high fit participants were in the poor category, while 54.2% achieved an
optimum ideal CVH score.
In multivariable regression models, baseline treadmill time, sex, and age
explained 15.2%, 14.3%, and 0.82% of the variance in total CVH score at
baseline (all p<0.0001), respectively. After adjusting for age, sex, and year of
examination, participants in the optimum CVH category had 20% and 43% higher
!
48
CRF levels than those in the average and inadequate CVH groups (p<0.0001),
respectively (Figure 4.2). The adjusted odds [shown as odds ratio (95%
confidence interval] of being in the average or optimum ideal CVH category were
10.9 (7.9-14.9) and 39.9 (28.7-55.4) times greater for individuals with moderate
and high CRF, respectively, compared to those with low CRF (p<0.0001) (Figure
4.3).
Longitudinal association of CRF and ideal CVH. The association
between change in fitness and change in ideal CVH score was examined in
2,555 adults who had at least two clinic visits. After a mean follow up of 3.3 ± 2.4
years, the average change in ideal CVH score per year was 3.9 ± 20.9% and the
average change in treadmill time per year was 1.2 ± 9.2% for the total sample.
Annual change in ideal CVH score and annual change in treadmill time were
positively correlated (p<0.0001) in both males (r = 0.40) and females (r = 0.26).
After controlling for age, sex, and time between exam dates, the gain in
fitness group (n=851) significantly (p<0.0001) increased their ideal CVH score by
13.9 ± 1.1%, while the loss of fitness group (n=873) significantly (p<0.0001)
decreased their score by 4.5 ± 1.1% (Figure 4.4). Baseline ideal CVH score and
annual change in treadmill time explained 18.5% and 9.0% of the annual change
in ideal CVH score, respectively, while changes in diet, cholesterol, smoking,
diastolic BP, PA, glucose, BMI, and systolic BP explained 7.5%, 4.9%, 2.8%,
2.2%, 1.5%, 1.5%, 0.8%, and 0.4%, respectively (p<0.0001 for all variables). For
every minute increase in treadmill time per year, annual ideal CVH score
significantly increased by 0.15 ± 0.01 (p<0.0001).

!
49
Discussion
This study is likely the first to examine both cross-sectional and
longitudinal associations of CRF with ideal CVH, as defined by the AHA’s LS7, in
middle-aged men and women. One of the main findings was that higher levels of
CRF are strongly associated with better CVH profiles, which is demonstrated by
moderate and high fit individuals having almost 11 and 40 times greater odds of
having average or optimum CVH, respectively, compared to low fit individuals. In
addition, our longitudinal analyses showed that improvements in CRF over time
are independently associated with concomitant increases in CVH scores and
these increases in CRF explained a greater amount of variance in CVH score
compared to each of the individual LS7 metrics (blood cholesterol, fasting plasma
glucose, BP, smoking, BMI, diet quality, and PA).
To date, the only study investigating the association between CRF and
ideal CVH was completed in European adolescents aged 12.5-17.5 years
enrolled in the Healthy Lifestyle in Europe by Nutrition in Adolescence (HELENA)
study.164 In this study, CRF was estimated via the 20m shuttle run test. The
results from this study complement our findings in adults, as higher CRF levels
were associated with a higher number of LS7 metrics at ideal levels in
adolescents. CRF levels were significantly higher in both boys and girls that met
at least four LS7 metrics at ideal levels. The results from the HELENA study and
the present ACLS study show promising associations between CRF level and
ideal CVH score in both adolescents and adults, thus warranting further
investigation in differing populations.
!
50
In 2012, Yang et al. examined ideal CVH prevalence trends across the
National Health and Nutrition Examination Survey (NHANES) in adult men and
women from 1988 to 2010.13 The study found that the prevalence of meeting all
LS7 metrics at ideal levels was low (only 1.2% in NHANES 2005-2010) and that
ideal BMI and fasting plasma glucose levels continued to decline during the study
period. The authors reported that the all-cause and CVD mortality benefits from
improved smoking and PA metrics were counteracted by the low prevalence of
BMI, diet, and plasma glucose at ideal conditions. As a moderator for these
traditional CVD risk factors, CRF has been shown to beneficially alter the
inhibitory effects of poor levels of the LS7 metrics on all-cause and CVD
mortality.17, 50, 51 Our study found that having moderate to high levels of CRF
greatly decreased the odds of having an inadequate CVH score. The importance
of this prominent relationship is highlighted when examining the association
between ideal CVH score and mortality risk. In NHANES, as the number of ideal
LS7 metrics met increased, all-cause, CVD, and ischemic heart disease mortality
rates significantly decreased.13 Therefore, even having a moderate level of CRF
decreases the odds of having an inadequate CVH score, which in turn is likely
related to decreased mortality rates. Thus, as mounting evidence strongly
supports the benefits of high levels of CRF and PA on CVD risk factors and
mortality,1 our findings emphasize the potential importance of lifestyle
interventions that include exercise/PA to improve both CRF and CVH status,
strengthening the AHA’s ideal CVH primordial prevention approach.

!
51
The present analyses benefited from several strengths of the ACLS study
design. The ACLS cohort includes a relatively large number of participants
enrolled in a prospective study with extensive follow-up. Participants underwent
thorough medical examinations and maximal exercise tests, providing several
valid, objective measures for some of the LS7 metrics and CRF at both baseline
and follow-up (average time between exam dates was 3.3 years). We also
excluded participants at baseline who had a history of CVD or cancer, who had a
BMI <18.5 kg/m2, or who had abnormalities on electrocardiography, which
reduced the likelihood of including participants who had underlying subclinical
disease. Our study also has limitations to consider. The use of the AHA’s ideal
CVH construct to create the CVH score assumes that all LS7 health factors and
behaviors equally contribute to the final score. To determine the relationship
between CRF and ideal CVH score, CRF was entered into the model
independently, but we acknowledge that each of the LS7 metrics have been
found to be associated with CRF. However, our analyses did not demonstrate
collinearity between CRF and the LS7 metrics. Additionally, the diet quality and
PA LS7 metrics in our study relied on self-report data, which can introduce
biases. The instruments and procedures utilized were standardized and validated
in order to minimize the effect of bias. Furthermore, compared with the AHA
definition of ideal CVH, we made minor adjustments to assessing diet quality,
smoking status, and medication use. There was insufficient information to include
sugar-sweetened beverages in assessing diet components, as well as lack of
information regarding the length of time since a former smoker had quit.

!
52
Conclusion
Our study found that higher levels of CRF are associated with better CVH
profiles in both men and women. In addition, improving CRF during middle age
was independently associated with higher CVH scores and greater improvement
in CVH. Our findings support future research regarding the use of exercise
interventions as a primordial prevention to not only improve CRF, but also to
improve and maintain ideal CVH to achieve the AHA 2020 Impact Goals and
reduce the burden of CVD in America.

!
53
Table 4.1. Definition of poor, intermediate, and ideal levels for each cardiovascular health metrica
Cardiovascular Health Metric Poor (0) Intermediate (1) Ideal (2)
Smoking Current Former Never
Body mass index (kg/m2) ≤30 25-29.9 18.5-24.9
Physical activity (MET-min/week) 0 1-499 ≥500
Healthy diet score (No. of components)
0-1 2 3-4
Total cholesterol (mg/dL) ≥240 200-239 <200
Blood pressure (mmHg) SBP ≥140 or
DBP ≥90 SBP 120-139 or
DBP 80-89 SBP <120 and
DBP <80
Fasting plasma glucose (mg/dL) ≥126 100-125 <100
MET: metabolic equivalent; SBP: systolic blood pressure; DBP: diastolic blood pressure a SI conversion factors: to convert total cholesterol values from mg/dL to mmol/L, multiply by 0.0259; to convert fasting plasma glucose values from mg/dL to mmol/L, multiply by 0.0555 b Plus no previous physician diagnosis of hypercholesterolemia c Plus no previous physician diagnosis of hypertension d Plus no previous physician diagnosis of diabetes or use of insulin
Table 4.2. Baseline characteristics by sex
Variable All (n=11,590)
Males (n=8,865)
Females (n=2,725)
Age (years) 45.8 (9.8) 46.2 (9.7) 44.8 (10.0)
Body mass index (kg/m2) 25.8 (4.1) 26.5 (3.7) 23.5 (4.4)
Systolic blood pressure (mmHg) 119.4 (13.9) 121.6 (13.1) 112.1 (13.8)
Diastolic blood pressure (mmHg) 80.1 (9.8) 81.5 (9.4) 75.4 (9.4)
Total cholesterol (mg/dL) 206.6 (39.9) 208.6 (40.0) 199.7 (39.2)
Fasting plasma glucose (mg/dL) 98.8 (16.1) 100.1 (15.5) 94.7 (17.2)
Treadmill time (min) 18.1 (5.2) 19.2 (4.9) 14.5 (4.6)
Data presented as mean (SD) P-value for difference between sexes < 0.0001 for all variables

!
54
Table 4.3. Prevalence of participants meeting ideal levels for each cardiovascular health metric at baseline in the total population and by sex
Cardiovascular health metric at ideal level
All (n=11,590)
Males (n=8,865)
Females (n=2,725)
Smoking* 56.2 53.5 65.0
Body mass index* 47.2 38.7 75.1
Physical activity 59.9 59.7 60.4
Diet* 4.3 4.6 3.4
Total cholesterol* 45.9 43.3 54.3
Blood pressure* 33.0 25.8 56.4
Fasting plasma glucose* 61.9 56.9 78.0
All seven metrics at ideal level
0.24 0.17 0.48
Data presented as percentage *Significantly different between sexes (p< 0.0001)
L o w M o d e r a te H ig h 0
2 0
4 0
6 0
8 0
1 0 0
B a s e lin e C R F C a te g o ry
Pa
rtic
ipa
nts
(%
)
In a d e q u a te (0 -4 )A v e ra g e (5 -9 )O p t im u m (1 0 -1 4 )
1 7%
7 2%
1 1%
6%
7 4%
2 1%4 5%
5 4%
Figure 4.1. Prevalence of inadequate, average, and optimum scores for cardiovascular health by baseline fitness category.

!
55
Figure 4.2. Average treadmill time in the total population and by sex based on ideal cardiovascular health category. Values adjusted for age and year of examination. p<0.0001 for all group and sex comparisons.
L o w
Mo d e ra
teH ig
h
L o w
Mo d e ra
teH ig
h
L o w
Mo d e ra
teH ig
h 0
1 0
2 0
3 0
4 0
5 0
F itn e s s C a te g o ry
Od
ds
Ra
tio
fo
r A
ve
rag
e o
r H
igh
er
Ide
al
CV
H
Male
Fem a le
Tota l
Figure 4.3. Adjusted odds of being in the average or higher ideal cardiovascular health category by baseline fitness category. Values adjusted for age and year of examination. p<0.0001 for all group and sex comparisons.
I n a d e q ua te(0 -4 )
A ve ra g e(5 -9 )
O p tim um(1 0 -1 4 )
0
5
1 0
1 5
2 0
2 5A
dju
ste
d T
rea
dm
ill
Tim
e (
min
s)
M a le
F e m a le
Id e a l C a rd io v a s c u la r H e a lth C a te g o ry
T o ta l

!
56
L o s s S ta b le G a in-1 0
-5
0
5
1 0
1 5
2 0
C h a n g e in F itn e s s g ro u p
% c
ha
ng
e i
n I
de
al
CV
H s
co
re
*
*
!
Figure 4.4. Percent change in ideal cardiovascular health score by change in fitness group. Values adjusted for age, sex, and time between exam dates. *p<0.0001 for difference with all other groups

57
CHAPTER 5
CARDIORESPIRATORY FITNESS AND CARDIOMETABOLIC
DISEASE RISK FACTOR RESPONSIVENESS FOLLOWING
AEROBIC EXERCISE INTERVENTION
INTRODUCTION
Cardiorespiratory fitness (CRF) is well established as having a strong
inverse association with numerous cardiometabolic disease risk factors and
cardiovascular disease (CVD) mortality.1 As CVD remains the number one cause
of death in America,2 the detrimental effects of low CRF present a substantial
health threat. In order to help combat these detrimental effects, aerobic exercise
interventions are used to increase CRF, as measured by maximal oxygen uptake
(V̇O2max), and improve cardiometabolic risk factor profile. However, considerable
inter-individual variation exists in the ability to improve V̇O2max and
cardiometabolic risk factors in response to regular exercise.166-172 Thus,
identifying individuals who do not experience significant gains in CRF with
aerobic training (i.e., low V̇O2max response) and how low V̇O2max response relates
to risk factor responsiveness is of great interest. As we move further into the era
of personalized medicine, a better understanding of the inter-individual variation
in response to regular exercise will enhance our ability to utilize exercise as
!!
58 !
medicine and provide appropriate guidance to improve health and attenuate CVD
risk.
The HEalth, RIsk factors, exercise Training And GEnetics (HERITAGE)
family study has been instrumental in the development of the strong body of
evidence supporting the presence of heterogeneous V̇O2max and cardiometabolic
risk factor responsiveness to exercise training.166-168, 173, 174 Although several
exercise training studies have reported the distribution of V̇O2max responsiveness
to standardized exercise interventions,166, 169, 171, 172, 174-180 the prevalence of
individuals experiencing low V̇O2max responsiveness remains unknown as there is
currently no widely accepted threshold to define V̇O2max responsiveness. Thus,
the goal of the present study was to establish cutpoints to identify low V̇O2max
response and examine the prevalence of low V̇O2max response across several
diverse exercise interventions. We also sought to examine the relationship
between V̇O2max responsiveness and exercise-induced changes in
cardiometabolic risk factors.
METHODS
The effects of standardized, supervised aerobic exercise training on
V̇O2max and cardiometabolic risk factor responsiveness was examined across
eight exercise training studies comprised of 14 distinct exercise interventions.
The studies are briefly described below, followed by the definitions of low
response for each trait and the statistical procedures employed. Overall, the
exercise interventions from these studies ranged from doses of 4-35 kcal·kg-
1·week-1 (KKW); intensities of 50-85% V̇O2max; and durations of 16-35 weeks.
!!
59 !
Study-specific exercise intervention information is shown in Table 5.1. Data on a
maximum of 1,724 adults who completed one of the 14 exercise interventions
were available for analysis.
Exercise Training Studies
Dose-Response to Exercise in Women (DREW) study. The DREW
Study was a randomized controlled dose-response exercise trial. A complete
description of the design, methods, and study participants has been published.24,
173 The present cohort included 361 previously sedentary, post-menopausal,
overweight or obese women (63% White) with high-normal blood pressure who
completed one of three 24-week aerobic exercise interventions. The three
exercise interventionss were designed for participants to expend 4 (n=155), 8
(n=104), or 12 (n=102) KKW. All participants alternated training sessions on a
cycle ergometer or treadmill with a target intensity of 50% V̇O2max. Exercise
training sessions were completed three to four times per week.
Gene Exercise Research Study (GERS). The GERS cohort included 171
previously sedentary, non-diabetic, non-smoking men and women (56%) aged
50-71 years (73% White). Participants had no history of CVD, had a BMI <37
kg/m2, and were either normotensive or had medication-controlled hypertension.
The exercise intervention consisted of 24 weeks (three sessions per week) of
aerobic exercise. Training progressed to a target exercise intensity of 70%
V̇O2max.26, 27 Participants used various types of aerobic exercise equipment
including cycle ergometers, treadmills, rowers, and elliptical, skier, and stepping
machines.25

!!
60 !
HERITAGE Family Study. The HERITAGE cohort included 718 (66%
White) men and women (56%) aged 17-65 years who completed a 20-week
aerobic exercise intervention. Participants were previously sedentary,
normotensive to untreated mildly hypertensive, and had a body mass index (BMI)
<40.0 kg/m2. The intervention consisted of aerobic exercise performed three
days per week on a cycle ergometer. Training progressed to a target exercise
intensity of 75% V̇O2max.28
Energy Flux study. The Energy Flux Study was a randomized controlled
exercise trial that included 64 men and women (45%) aged 21-45 years (48%
White) who completed one of two 24-week aerobic exercise interventions.
Participants were previously sedentary, generally healthy adults with a BMI of 25-
35 kg/m2. The two exercise interventions were designed for participants to
expend 17.5 (n=33) or 35 (n=31) KKW. Training progressed to a target exercise
intensity of 70-75% maximal heart rate. One month and three months into the
intervention, participants performed additional maximal exercise tests. Exercise
intensity was adjusted throughout the intervention based on the most recent
maximal exercise test. All exercise was performed on a treadmill 3-6 times per
week.
Inflammation and Exercise (INFLAME) study. The INFLAME cohort
included 66 previously sedentary, generally healthy, non-smoking men and
women (65%) with elevated plasma C-Reactive Protein concentration (≥2.0 mg/L
but <10.0 mg/L) who completed a 16-week aerobic exercise intervention. At
baseline, participants (65% White) were aged 30-75 years with a BMI 18-40

!!
61 !
kg/m2, and blood pressure <140/90 mmHg. The exercise intervention was
designed for participants to expend 16 KKW at a target exercise intensity 60-80%
V̇O2max. Exercise was performed on either a treadmill or cycle ergometer 3-5
times per week.29
Examination of Mechanisms of Exercise-induced Weight
Compensation (E-MECHANIC) study. E-MECHANIC was a six-month
randomized controlled exercise trial, which included 117 men and women (72%)
who completed one of two aerobic exercise interventions. Participants (68%
White) were non-smoking, generally healthy, previously sedentary adults (aged
18-65 years) with a BMI of 25-45 kg/m2. The two exercise interventions were
designed for participants to expend 8 (n=60) or 20 (n=57) KKW for 24 weeks. All
exercise was performed on a treadmill at a target intensity of 65-85% V̇O2max.
Exercise sessions were completed 3-5 times per week.30
Studies of a Targeted Risk Reduction Intervention through Defined
Exercise (STRRIDE). The STRRIDE I31 and II32 studies were randomized
exercise trials. The present cohort included 227 (83% White) non-smoking men
and women (50%) who completed eight months of exercise training. Participants
were free of diabetes and coronary artery disease, aged 40-65 years with a BMI
25-35 kg/m2, resting blood pressure <160/90 mmHg, and mild-to-moderate
dyslipidemia [low-density lipoprotein cholesterol (LDL-C) 130-190 mg/dL and/or
high-density lipoprotein cholesterol (HDL-C) 40mg/dL (men) or 45 mg/dL
(women)]. Combining STRRIDE I and II, participants completed one of four
exercise interventions: mild (14 KKW; 40-55% V̇O2peak; n=36), moderate (14
!!
62 !
KKW; 65-80% V̇O2peak; n=90), high (23 KKW; 65-80% V̇O2peak; n=57), or
moderate plus resistance training (three days per week, three sets per day, and
8-12 repetitions per set; n=44). Aerobic exercise was performed three times per
week on treadmills, elliptical machines, or cycle ergometers.
Measurements of Cardiorespiratory Fitness and Cardiometabolic Risk
Factors
All participants underwent multiple laboratory measures at baseline and
post-training. Full details for each of the studies are available elsewhere.24-32
Briefly, all studies objectively measured V̇O2max with gas exchange during graded
maximal exercise testing. Blood pressure was measured after participants sat
quietly for at least five minutes. Blood samples were obtained from venipuncture
of an antecubital vein in the morning following an overnight fast. Post-training
blood samples were obtained approximately 16-72 hours after the completion of
the final exercise session. All studies included plasma measures of HDL-C and
triglycerides (TG) via enzymatic methods except for STRRIDE I and II, which
assessed HDL-C and TG concentrations via nuclear magnetic resonance
spectroscopy. Plasma fasting insulin was assessed in all studies except Energy
Flux, E-MECHANIC, and STRRIDE II. Plasma fasting insulin was measured by
radioimmunoassay in GERS and HERITAGE, by immunoassay in STRRIDE I,
and by electrochemiluminescence in DREW and INFLAME. For each of these
traits, change (Δ) was calculated as the post-training value minus the baseline
value. Subsequently, the change values were used to determine responsiveness
of each trait based upon the following definitions.
!!
63 !
Definition of Low Responses
In order to define low responsiveness, technical error (TE) was used to
define the threshold values for each trait. TE is defined as the within-subject
standard deviation (SD) from repeated measures over a given period of time,
which takes into account the measurement error of the trait, including the
variance among laboratories or laboratory technicians, and the normal daily
biological variability of the trait. For this study, the definition of low response for
each trait was based on previous findings from reproducibility studies conducted
in HERITAGE.37-41 These studies were designed to quantify TE, coefficient of
variation (CV), and intraclass correlation for several traits measured in
HERITAGE. Based on the TE and CV values derived from these studies, low
V̇O2max response was defined in both absolute (gain <120 ml/min from baseline
value) and relative (gain < 5% of study-specific baseline average V̇O2max in
mL·kg- 1·min-1) terms. In regards to each of the cardiometabolic risk factors, any
value beyond 1xTE in a direction indicating a worsening of the risk factor was
considered a low response. Accordingly, the threshold values to determine low
response were: Δ plasma fasting insulin ≥12 pmol/L; Δ plasma HDL-C ≤0.12
mmol/L; Δ plasma TG ≥0.21 mmol/L; and Δ resting systolic blood pressure (SBP)
≥5 mmHg.
Statistical Analysis
Baseline characteristics were summarized for the total population and by
study. Prevalence of low response for each trait was assessed on the basis of
the number of participants who exceeded the 1xTE threshold defined above. For
!!
64 !
each of the cardiometabolic risk factors, a logistic regression was performed to
compare the distribution of low response between V̇O2max response groups. A
total response score for all of the cardiometabolic risk factors was calculated for
each participant. Each risk factor classified as a low response received a score of
one, while each risk factor not classified as a low response received a score of
zero. Thus, a participant that displayed low responses for all risk factors would
receive four total points for their cardiometabolic risk factor response score. A
chi-square test was performed to compare the distribution of the total response
score between V̇O2max response groups. The threshold for statistical significance
was set at p<0.05. SAS version 9.4 was used for all statistical analyses. Data
presented as mean (SD) unless otherwise specified.
RESULTS
The overall sample (n=1,724) was comprised of 63.6% women, 29.2%
minorities, and broad ranges of age (17-75 years), BMI (18-45 kg/m2), and
cardiometabolic risk factors. Study-specific baseline characteristics of the
participants are summarized in Table 5.2.
The majority of the exercise interventions produced significant group
mean increases in V̇O2max (data not shown). All interventions except INFLAME
and DREW 4, 8, and 12 KKW produced significant group mean increases in
absolute V̇O2max (p<0.05). For relative V̇O2max, all interventions except E-
MECHANIC 8 KKW and INFLAME produced significant group mean increases
(p<0.05). Upon evaluation of individual changes in V̇O2max using the above
definitions, 34% (absolute; individual distribution shown in Figure 5.1) and 23.8%
!!
65 !
(relative; individual distribution not shown) of the total sample was considered
low responsive for V̇O2max. Within each exercise intervention group, the
prevalence of individuals with a low V̇O2max response varied greatly, ranging from
7.6% (HERITAGE) to 84% (DREW 4 KKW) based on the absolute definition of
responsiveness (Figure 5.2a). As shown in Figure 5.2b, a wide range of low
V̇O2max response prevalence was also present based on the relative definition of
responsiveness, from 7.4% (HERITAGE) to 68.2% (INFLAME).
Since the threshold for relative V̇O2max responsiveness was based upon
study-specific values, the prevalence of low V̇O2max response in relative terms
was further explored by comparing groups within studies that employed multiple
exercise interventions. Within the DREW study, exercise intensity and
intervention duration were equivalent amongst the exercise groups. As exercise
dose increased from 4 to 8 to 12 KKW, the prevalence of relative V̇O2max low
response decreased from 53.1% to 37.1% to 30.5% (p=0.001 for difference
between groups). Similarly, in the E-MECHANIC study relative V̇O2max low
response prevalence was lower in the 20 KKW group (26.3%) compared to the 8
KKW group (50%) (p=0.009). Although not statistically significant (p=0.16), the
Energy Flux study also demonstrated an inverse relationship between relative
V̇O2max low response prevalence and exercise dose (51.5% for the 17.5 KKW
group and 34.4% for the 35 KKW group). All of the STRRIDE interventions were
delivered for 35 weeks, but differed in both exercise amount and intensity. The
prevalence of low V̇O2max response followed the same trend as described above:
as exercise amount and intensity increased, prevalence of low V̇O2max response

!!
66 !
decreased (55.6% for 14 KKW at 40-55% intensity compared to 14% for 23 KKW
at 65-80% intensity, p<0.0001 for differences between groups). These results for
studies employing multiple exercise interventions are illustrated in Figure 5.3.
Table 5.3a and Table 5.3b show the average change for the selected
cardiometabolic risk factors in all exercisers combined and by V̇O2max response
groups. Overall, fasting plasma insulin, HDL-C, TG, and resting SBP changed by
-5.39 (25.71) pmol/L, 0.01 (0.17) mmol/L, -0.07 (0.45) mmol/L, and -0.55 (10.43)
mmHg, respectively. There were no differences in the mean values for exercise-
induced change in the four cardiometabolic traits between absolute or relative
V̇O2max response groups. For the combined sample, prevalence of low response
of the cardiometabolic traits ranged from 19.6% for plasma fasting insulin to
61.7% for plasma HDL-C. For absolute low V̇O2max responders, the prevalence of
low response was 7.5%, 22.9%, 8.1%, and 10.1% for plasma fasting insulin,
HDL-C, TG, and resting SBP, respectively (Table 5.3a). Evaluation of low risk
factor response on the basis of relative terms for low V̇O2max response resulted in
lower prevalence values: 5.1%, 16.3%, 5.3%, and 7.6% for plasma fasting
insulin, HDL-C, TG, and resting SBP, respectively (Table 5.3b). Figures 5.4a,
5.4b, 5.4c, and 5.4d illustrate the prevalence of low response for fasting plasma
insulin, HDL-C, TG, and resting SBP, respectively, by relative V̇O2max response
groups in the combined sample. The prevalence of low response for each
cardiometabolic risk factor did not differ based on relative V̇O2max response
groups.

!!
67 !
A total risk factor response score was calculated for 1,081 participants
with complete risk factor response data (i.e., baseline and post-training measures
for all four cardiometabolic risk factors). Overall, the prevalence of scores was
20.1%, 41.1%, 26.5%, 10.9%, and 1.5% for scores of 0, 1, 2, 3, and 4,
respectively. Figure 5.5a illustrates the distribution of total risk factor response
scores by absolute V̇O2max response groups (significantly different between
groups, p<0.01), while Figure 5.5b displays the total risk factor response score
distribution by relative V̇O2max response groups (significantly different between
groups, p<0.01). The distribution of total risk factor response score was assessed
amongst low V̇O2max responders (n=241). Based on absolute V̇O2max terms, the
prevalence of scores was 12.5%, 39.4%, 33.4%, 13.6%, and 1.1% for scores of
0, 1, 2, 3, and 4, respectively (Figure 5.6a). When assessing the distribution of
total risk factor response score amongst relative low V̇O2max responders (n=241),
only one participant received a score of 4, while 53.1% received a score of 1 or
lower (Figure 5.6b).
DISCUSSION
This study is likely the first to evaluate the prevalence of V̇O2max low
response across diverse populations and varying exercise interventions. This
study found a high prevalence of V̇O2max low response across 14 diverse
exercise interventions, which differed based on how low response was defined
(34% relative; 24% relative). We also found that the prevalence of low response
for the cardiometabolic risk factors following exercise training varied from 19.6%
for changes in fasting insulin to 61.7% for changes in HDL-C. Despite the high

!!
68 !
prevalence of low response observed across all studies, the likelihood of being a
low responder for all traits (V̇O2max, fasting insulin, HDL-C, TG, and SBP) was
extremely low, as only one participant out of 1,081 (0.1%) did not demonstrate
exercise training-induced changes below the low response threshold for these
traits. As the majority of participants demonstrated a total risk factor response
score of 1 or lower whether they were a relative low V̇O2max responder (53.1%) or
not (63.5%), our results reinforce the idea that regular exercise participation is
associated with many health benefits, regardless of the presence of a detectable
V̇O2max response.
A recent study reported on the adverse responsiveness of cardiometabolic
risk factors (plasma fasting insulin, plasma HDL-C, plasma TG, and resting SBP)
to exercise training in many of the same studies included in the present report.42
Based on reproducibility studies from HERITAGE, adverse responses were
defined as two times the TE in a direction signifying a worsening of the risk
factor. Similar to our study’s low response prevalence, Bouchard and
colleagues42 found that only a small minority of participants (<1%) exhibited
adverse responses for three or more traits. Although some participants
experienced undesirable responses for select risk factors, their results align with
the present study as the majority of participants do not demonstrate a worsening
of their cardiometabolic risk factor profile.42
The HERITAGE study demonstrated the smallest prevalence of low
V̇O2max response, which was to be expected as both the absolute and relative
cutpoints for low V̇O2max response were derived from TE and CV values from the

!!
69 !
HERITAGE reproducibility studies.37 Conversely, the DREW study demonstrated
the highest prevalence of low V̇O2max response in absolute terms (83.9%), while
the INFLAME study had the greatest relative V̇O2max low response prevalence
(68.2%). Although there was not a clear trend related to exercise dose, intensity,
or program duration when comparing low V̇O2max response across all
interventions, a trend emerged when exploring the relative V̇O2max
responsiveness within studies that employed multiple exercise
interventions/doses. As demonstrated by the DREW, E-MECHANIC, Energy
Flux, and STRRIDE studies, as exercise dose and/or intensity increased,
prevalence of low V̇O2max response decreased. This finding is comparable to a
study conducted by Ross and colleagues that was designed to assess the
separate effects of exercise intensity and amount on V̇O2max responsiveness.169
In this study, participants (n=121 middle-aged men and women) were
randomized to one of three exercise groups: low amount and low intensity, high
amount and low intensity, or high amount and high intensity. Results
demonstrated that increasing either the intensity or the amount of exercise
substantially reduced the rate of V̇O2max non-response (defined as a change
within 1xTE). When comparing exercise groups of the same intensity, the rate of
non-response was reduced by about half when the amount of exercise doubled.
Furthermore, when comparing groups with a fixed amount of exercise, there was
no apparent V̇O2max non-response when exercise intensity was at 75%
V̇O2peak.169
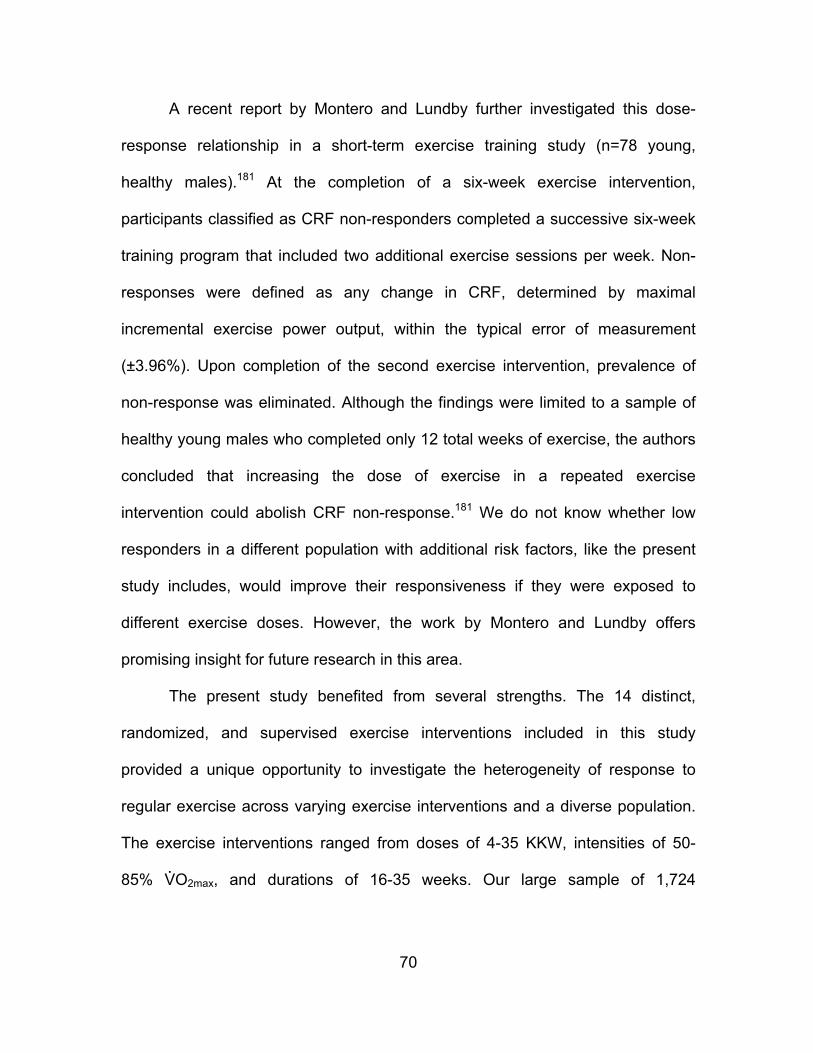
!!
70 !
A recent report by Montero and Lundby further investigated this dose-
response relationship in a short-term exercise training study (n=78 young,
healthy males).181 At the completion of a six-week exercise intervention,
participants classified as CRF non-responders completed a successive six-week
training program that included two additional exercise sessions per week. Non-
responses were defined as any change in CRF, determined by maximal
incremental exercise power output, within the typical error of measurement
(±3.96%). Upon completion of the second exercise intervention, prevalence of
non-response was eliminated. Although the findings were limited to a sample of
healthy young males who completed only 12 total weeks of exercise, the authors
concluded that increasing the dose of exercise in a repeated exercise
intervention could abolish CRF non-response.181 We do not know whether low
responders in a different population with additional risk factors, like the present
study includes, would improve their responsiveness if they were exposed to
different exercise doses. However, the work by Montero and Lundby offers
promising insight for future research in this area.
The present study benefited from several strengths. The 14 distinct,
randomized, and supervised exercise interventions included in this study
provided a unique opportunity to investigate the heterogeneity of response to
regular exercise across varying exercise interventions and a diverse population.
The exercise interventions ranged from doses of 4-35 KKW, intensities of 50-
85% V̇O2max, and durations of 16-35 weeks. Our large sample of 1,724

!!
71 !
participants included 63.6% women, 29.2% minorities, and broad ranges of age,
body weight, and cardiometabolic risk factors.
We realize our approach for establishing V̇O2max low response cutpoints
has limitations. We acknowledge that the situation becomes more complicated
when we apply the observed TE from one study (HERITAGE) to other exercise
interventions that differ in terms of population and exercise programming. We
also recognize this limitation remains consistent amongst the evaluation of low
response prevalence for each cardiometabolic risk factor. However, to calculate
study-specific TE, performing multiple measurement visits, including maximal
exercise tests and blood samples, at both baseline and post-intervention
presents a substantial burden. Thus, our results underscore the need for further
investigation to refine the process for identification of individuals who are low
responders to exercise training.
Conclusion
Our study found a substantial range of individual variability that occurred
in response to regular exercise training. This heterogeneous display of individual
responsiveness was present for all traits across all studies. Although there was
substantial prevalence of low response for V̇O2max, fasting insulin, HDL-C, TG,
and resting SBP at the study level, our findings indicated that less than 1% of
participants were low responders for all traits. Future research can aid in the
refinement of these cutpoints to establish a suitable quantification of low
response. These findings will facilitate the identification of individuals who

!!
72 !
respond unfavorably to an exercise intervention and subsequent adjustment of
their exercise prescription to maximize clinically important health outcomes.

!!
73 !
Table 5.1. Study-specific exercise intervention information
Table 5.2. Baseline characteristics by study

!!
74 !
Table 5.3a. Mean change and prevalence of low response for each cardiometabolic risk factor by absolute V̇O2max response group
a Δ V̇O2max <120 mL/min; b Δ plasma fasting insulin ≥12 pmol/L; c Δ plasma HDL-C ≤0.12 mmol/L; d Δ plasma triglycerides ≥0.21 mmol/L; e Δ systolic blood pressure ≥5 mmHg; no significant differences were found for mean changes between absolute V̇O2max response groups Table 5.3b. Mean change and prevalence of low response for each cardiometabolic risk factor by relative V̇O2max response group
a Δ <5% of study-specific baseline average V̇O2max; b Δ plasma fasting insulin ≥12 pmol/L; c Δ plasma HDL-C ≤0.12 mmol/L; d Δ plasma triglycerides ≥0.21 mmol/L; e Δ systolic blood pressure ≥5 mmHg; no significant differences were found for mean changes between relative V̇O2max response groups

!!
75 !
Figure 5.1. Distribution of absolute V̇O2max training response across studies
Figure 5.2a. Prevalence of low V̇O2max response based on absolute terms for each exercise intervention ordered by increasing dose of exercise (kcal·kg-
1·week-1; KKW)
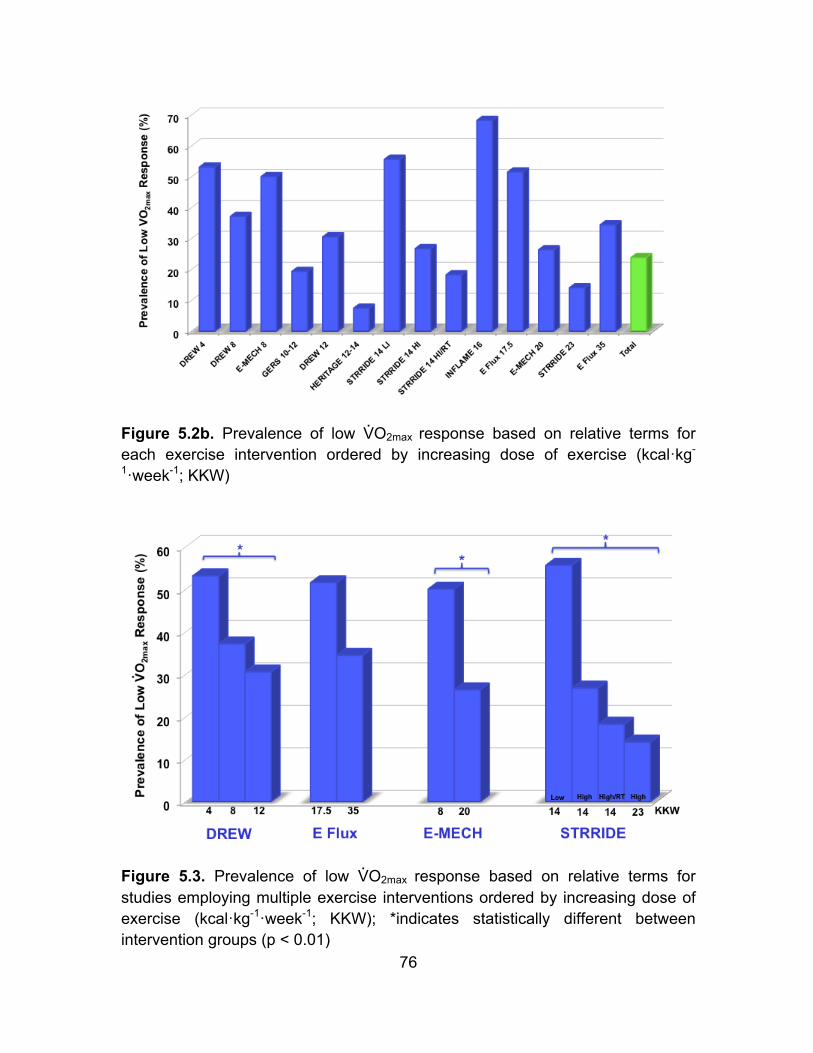
!!
76 !
Figure 5.2b. Prevalence of low V̇O2max response based on relative terms for each exercise intervention ordered by increasing dose of exercise (kcal·kg-
1·week-1; KKW)
Figure 5.3. Prevalence of low V̇O2max response based on relative terms for studies employing multiple exercise interventions ordered by increasing dose of exercise (kcal·kg-1·week-1; KKW); *indicates statistically different between intervention groups (p < 0.01)
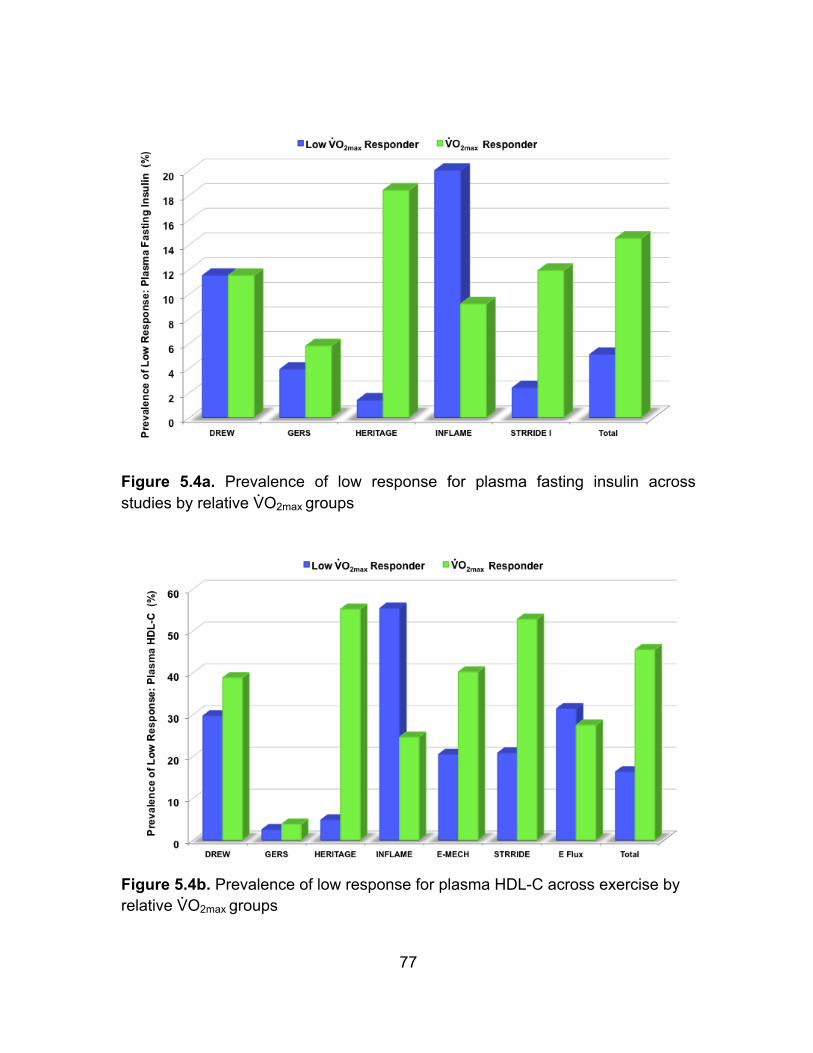
!!
77 !
Figure 5.4a. Prevalence of low response for plasma fasting insulin across studies by relative V̇O2max groups
Figure 5.4b. Prevalence of low response for plasma HDL-C across exercise by relative V̇O2max groups
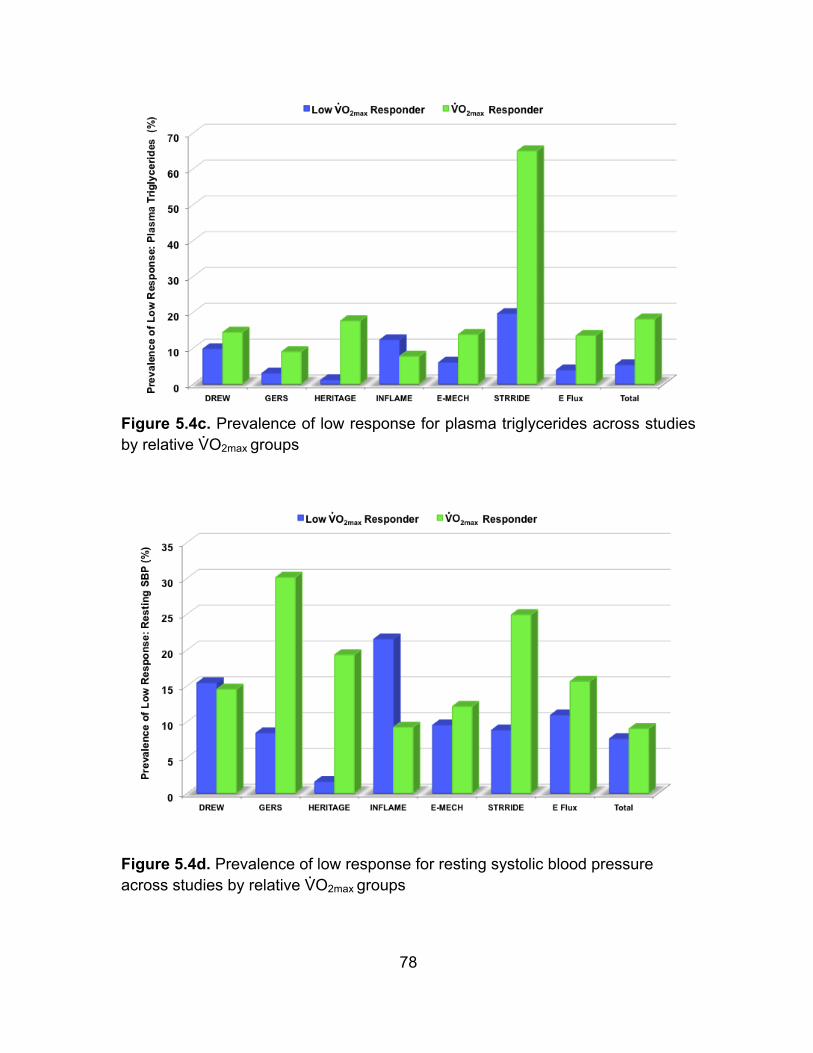
!!
78 !
Figure 5.4c. Prevalence of low response for plasma triglycerides across studies by relative V̇O2max groups
Figure 5.4d. Prevalence of low response for resting systolic blood pressure across studies by relative V̇O2max groups

!!
79 !
Figure 5.5a. Distribution of risk factor response score for all exercisers (n=1,081) by absolute V̇O2max groups
Figure 5.5b. Distribution of risk factor response score for all exercisers (n=1,081) by relative V̇O2max groups

!!
80 !
Figure 5.6a. Distribution of risk factor response score amongst absolute low V̇O2max responders (n=241)
Figure 5.6b. Distribution of risk factor response score amongst relative low V̇O2max responders (n=241)
81
CHAPTER 6
OVERALL DISCUSSION
Purpose
The purposes of this dissertation were to: 1) evaluate whether ideal CVH
is associated with CRF 2) examine the relationship between changes in CRF and
changes in ideal CVH score over time, 3) assess the prevalence of low V̇O2max
response following aerobic exercise intervention, and 4) investigate the
relationship between V̇O2max responsiveness and training-induced changes in
cardiometabolic risk factors following aerobic exercise intervention.
Methods
The first study examined the cross-sectional relationship between CRF
and ideal CVH score (n=11,590), as well as the longitudinal relationship between
changes in CRF and changes in ideal CVH score over time (n=2,555) in middle-
aged men and women from the ACLS. Participants underwent thorough medical
examination at baseline and follow-up at the Cooper Clinic in Dallas, TX. CRF
was measured as duration in minutes from a maximal treadmill test. Ideal CVH
score was calculated on a 14-point scale using data on LS7 metrics. Participants
were grouped into categories of inadequate (0-4), average (5-9), and optimum
(10-14) based on their CVH score. Three CRF groups were created based on
previously established cutpoints of treadmill time: low, moderate, and high CRF.
For longitudinal analyses, participants (n=2,555 who had at least two clinic visits)

!
82
were grouped into categories of loss, stable, or gain, by change in CRF and
change in ideal CVH score.
The second study investigated the responsiveness of V̇O2max and select
cardiometabolic risk factors following aerobic exercise intervention. The
prevalence of low V̇O2max response was examined in 1,724 previously sedentary
adults who completed one of 14 exercise interventions. The interventions ranged
from doses of 4-35 KKW; intensities of 50-85% V̇O2max; and durations of 20-35
weeks. All participants underwent multiple laboratory measures at baseline and
post-training. V̇O2max was assessed via graded maximal exercise testing with gas
exchange. Blood pressure was measured after participants sat quietly for at least
five minutes. Blood samples were obtained from venipuncture of an antecubital
vein in the morning following an overnight fast. Blood samples were analyzed for
plasma fasting insulin, HDL-C, and TG concentrations. Post-training blood
samples were obtained approximately 16-72 hours after the completion of the
final exercise session. For each of these traits, change (Δ) was calculated as the
post-training value minus the baseline value.
Low V̇O2max response was defined in both absolute (gain <120 ml/min
from baseline value) and relative (gain <5% of study-specific baseline average
V̇O2max in mL·kg-1·min-1) terms.. For the select cardiometabolic risk factors, any
value beyond 1xTE in a direction indicating a worsening of the risk factor was
considered a low response. The threshold values to assess low response were:
Δ plasma fasting insulin ≥12 pmol/L; Δ plasma HDL-C ≤0.12 mmol/L; Δ plasma
TG ≥0.21 mmol/L; and Δ resting SBP ≥5 mmHg.

!
83
Main Findings
One of the main findings from the first study was that higher levels of CRF
are strongly associated with better CVH profiles, which is demonstrated by
moderate and high fit individuals having almost 11 and 40 times greater odds of
having average or optimum CVH, respectively, compared to low fit individuals. In
addition, longitudinal analyses showed that improvements in CRF over time are
independently associated with concomitant increases in CVH scores and these
increases in CRF explained a greater amount of variance in CVH score
compared to each of the individual LS7 metrics (blood cholesterol, fasting plasma
glucose, BP, smoking, BMI, diet quality, and PA).
The second study found a high prevalence of V̇O2max low response across
14 diverse exercise interventions, which differed based on how low response
was defined (34% relative; 24% relative). The prevalence of low response for the
select cardiometabolic risk factors varied from 19.6% for changes in fasting
insulin to 61.7% for changes in HDL-C. Despite the high prevalence of low
response observed across all studies, the likelihood of being a low responder for
all traits (V̇O2max, fasting insulin, HDL-C, TG, and SBP) was extremely low, as
only one participant out of 1,081 (0.1%) did not demonstrate exercise training-
induced changes below the low response threshold for these traits.
Conclusions
Results from this dissertation support the vital role CRF plays in public
health efforts aiming to prevent the development of CVD and promote the
achievement and maintenance of ideal CVH. Although substantial inter-individual

!
84
variation in response to regular exercise exists, results from this dissertation also
show that regular exercise participation is associated with many health benefits,
regardless of the presence of a detectable V̇O2max response. Future research can
build upon these findings to refine the identification of individuals who respond
unfavorably to regular exercise and to subsequently adjust their exercise
prescription. This will enhance our ability to utilize exercise as medicine and
provide appropriate guidance to improve health and attenuate risk for CVD.

!
85
REFERENCES
1. Physical Activity Guidelines Advisory Committee. Physical Activity
Guidelines Advisory Committee Report, 2008. Washington, DC: U.S. Department
of Health and Human Services, 2008.
2. Writing Group M, Mozaffarian D, Benjamin EJ, Go AS, Arnett DK, Blaha
MJ, Cushman M, Das SR, de Ferranti S, Despres JP, Fullerton HJ, Howard VJ,
Huffman MD, Isasi CR, Jimenez MC, Judd SE, Kissela BM, Lichtman JH,
Lisabeth LD, Liu S, Mackey RH, Magid DJ, McGuire DK, Mohler ER, 3rd, Moy
CS, Muntner P, Mussolino ME, Nasir K, Neumar RW, Nichol G, Palaniappan L,
Pandey DK, Reeves MJ, Rodriguez CJ, Rosamond W, Sorlie PD, Stein J,
Towfighi A, Turan TN, Virani SS, Woo D, Yeh RW, Turner MB, American Heart
Association Statistics C and Stroke Statistics S. Executive Summary: Heart
Disease and Stroke Statistics--2016 Update: A Report From the American Heart
Association. Circulation. 2016;133:447-54.
3. Lloyd-Jones DM, Hong Y, Labarthe D, Mozaffarian D, Appel LJ, Van Horn
L, Greenlund K, Daniels S, Nichol G, Tomaselli GF, Arnett DK, Fonarow GC, Ho
PM, Lauer MS, Masoudi FA, Robertson RM, Roger V, Schwamm LH, Sorlie P,
Yancy CW, Rosamond WD, American Heart Association Strategic Planning Task
F and Statistics C. Defining and setting national goals for cardiovascular health
promotion and disease reduction: the American Heart Association's strategic
Impact Goal through 2020 and beyond. Circulation. 2010;121:586-613.
!
86
4. Dong C, Rundek T, Wright CB, Anwar Z, Elkind MS and Sacco RL. Ideal
cardiovascular health predicts lower risks of myocardial infarction, stroke, and
vascular death across whites, blacks, and hispanics: the northern Manhattan
study. Circulation. 2012;125:2975-84.
5. Fang J, Yang Q, Hong Y and Loustalot F. Status of cardiovascular health
among adult Americans in the 50 States and the District of Columbia, 2009. J Am
Heart Assoc. 2012;1:e005371.
6. Folsom AR, Yatsuya H, Nettleton JA, Lutsey PL, Cushman M, Rosamond
WD and Investigators AS. Community prevalence of ideal cardiovascular health,
by the American Heart Association definition, and relationship with
cardiovascular disease incidence. J Am Coll Cardiol. 2011;57:1690-6.
7. Ford ES, Greenlund KJ and Hong Y. Ideal cardiovascular health and
mortality from all causes and diseases of the circulatory system among adults in
the United States. Circulation. 2012;125:987-95.
8. Lachman S, Peters RJ, Lentjes MA, Mulligan AA, Luben RN, Wareham
NJ, Khaw KT and Boekholdt SM. Ideal cardiovascular health and risk of
cardiovascular events in the EPIC-Norfolk prospective population study. Eur J
Prev Cardiol. 2016;23:986-94.
9. Kulshreshtha A, Vaccarino V, Judd SE, Howard VJ, McClellan WM,
Muntner P, Hong Y, Safford MM, Goyal A and Cushman M. Life's Simple 7 and
risk of incident stroke: the reasons for geographic and racial differences in stroke
study. Stroke. 2013;44:1909-14.

!
87
10. Laitinen TT, Pahkala K, Magnussen CG, Viikari JS, Oikonen M, Taittonen
L, Mikkila V, Jokinen E, Hutri-Kahonen N, Laitinen T, Kahonen M, Lehtimaki T,
Raitakari OT and Juonala M. Ideal cardiovascular health in childhood and
cardiometabolic outcomes in adulthood: the Cardiovascular Risk in Young Finns
Study. Circulation. 2012;125:1971-8.
11. Miao C, Bao M, Xing A, Chen S, Wu Y, Cai J, Chen Y and Yang X.
Cardiovascular Health Score and the Risk of Cardiovascular Diseases. PLoS
One. 2015;10:e0131537.
12. Wu S, Huang Z, Yang X, Zhou Y, Wang A, Chen L, Zhao H, Ruan C, Wu
Y, Xin A, Li K, Jin C and Cai J. Prevalence of ideal cardiovascular health and its
relationship with the 4-year cardiovascular events in a northern Chinese
industrial city. Circ Cardiovasc Qual Outcomes. 2012;5:487-93.
13. Yang Q, Cogswell ME, Flanders WD, Hong Y, Zhang Z, Loustalot F,
Gillespie C, Merritt R and Hu FB. Trends in cardiovascular health metrics and
associations with all-cause and CVD mortality among US adults. JAMA.
2012;307:1273-83.
14. Zhang Q, Zhang S, Wang C, Gao X, Zhou Y, Zhou H, Wang A, Wu J, Bian
L, Wu S and Zhao X. Ideal cardiovascular health metrics on the prevalence of
asymptomatic intracranial artery stenosis: a cross-sectional study. PLoS One.
2013;8:e58923.
15. Zhang Q, Zhou Y, Gao X, Wang C, Zhang S, Wang A, Li N, Bian L, Wu J,
Jia Q, Wu S and Zhao X. Ideal cardiovascular health metrics and the risks of
ischemic and intracerebral hemorrhagic stroke. Stroke. 2013;44:2451-6.

!
88
16. Desai CS, Ning H, Liu K, Reis JP, Gidding SS, Armstrong A, Lima JA and
Lloyd-Jones DM. Cardiovascular Health in Young Adulthood and Association
with Left Ventricular Structure and Function Later in Life: The Coronary Artery
Risk Development in Young Adults Study. J Am Soc Echocardiogr.
2015;28:1452-61.
17. Blair SN, Kohl HW, 3rd, Paffenbarger RS, Jr., Clark DG, Cooper KH and
Gibbons LW. Physical fitness and all-cause mortality. A prospective study of
healthy men and women. JAMA. 1989;262:2395-401.
18. Huang TC, Chen CP, Raftery A and Wefler V. A Stable Reagent for
Liebermann-Burchard Reaction - Application to Rapid Serum Cholesterol
Determination. Analytical Chemistry. 1961;33:1405-&.
19. Bittner DL and Mccleary ML. Cupric-Phenanthroline Chelate in
Determination of Monosaccharides in Whole Blood. American Journal of Clinical
Pathology. 1963;40:423-&.
20. Cooper KH, Pollock ML, Martin RP, White SR, Linnerud AC and Jackson
A. Physical fitness levels vs selected coronary risk factors. A cross-sectional
study. JAMA. 1976;236:166-9.
21. Balke B and Ware RW. An experimental study of physical fitness of Air
Force personnel. U S Armed Forces Med J. 1959;10:675-88.
22. Ainsworth BE, Haskell WL, Whitt MC, Irwin ML, Swartz AM, Strath SJ,
O'Brien WL, Bassett DR, Jr., Schmitz KH, Emplaincourt PO, Jacobs DR, Jr. and
Leon AS. Compendium of physical activities: an update of activity codes and
MET intensities. Med Sci Sports Exerc. 2000;32:S498-504.

!
89
23. United States. Department of Health and Human Services. 2008 physical
activity guidelines for Americans : be active, healthy, and happy! Washington,
DC: U.S. Dept. of Health and Human Services; 2008.
24. Morss GM, Jordan AN, Skinner JS, Dunn AL, Church TS, Earnest CP,
Kampert JB, Jurca R and Blair SN. Dose Response to Exercise in Women aged
45-75 yr (DREW): design and rationale. Med Sci Sports Exerc. 2004;36:336-44.
25. Halverstadt A, Phares DA, Wilund KR, Goldberg AP and Hagberg JM.
Endurance exercise training raises high-density lipoprotein cholesterol and
lowers small low-density lipoprotein and very low-density lipoprotein independent
of body fat phenotypes in older men and women. Metabolism. 2007;56:444-50.
26. Halverstadt A, Phares DA, Ferrell RE, Wilund KR, Goldberg AP and
Hagberg JM. High-density lipoprotein-cholesterol, its subfractions, and responses
to exercise training are dependent on endothelial lipase genotype. Metabolism.
2003;52:1505-11.
27. Wilund KR, Ferrell RE, Phares DA, Goldberg AP and Hagberg JM.
Changes in high-density lipoprotein-cholesterol subfractions with exercise
training may be dependent on cholesteryl ester transfer protein (CETP)
genotype. Metabolism. 2002;51:774-8.
28. Bouchard C, Leon AS, Rao DC, Skinner JS, Wilmore JH and Gagnon J.
The HERITAGE family study. Aims, design, and measurement protocol. Med Sci
Sports Exerc. 1995;27:721-9.
!
90
29. Thompson AM, Mikus CR, Rodarte RQ, Distefano B, Priest EL, Sinclair E,
Earnest CP, Blair SN and Church TS. Inflammation and exercise (INFLAME):
study rationale, design, and methods. Contemp Clin Trials. 2008;29:418-27.
30. Myers CA, Johnson WD, Earnest CP, Rood JC, Tudor-Locke C,
Johannsen NM, Cocreham S, Harris M, Church TS and Martin CK. Examination
of mechanisms (E-MECHANIC) of exercise-induced weight compensation: study
protocol for a randomized controlled trial. Trials. 2014;15:212.
31. Kraus WE, Torgan CE, Duscha BD, Norris J, Brown SA, Cobb FR, Bales
CW, Annex BH, Samsa GP, Houmard JA and Slentz CA. Studies of a targeted
risk reduction intervention through defined exercise (STRRIDE). Med Sci Sports
Exerc. 2001;33:1774-84.
32. Bateman LA, Slentz CA, Willis LH, Shields AT, Piner LW, Bales CW,
Houmard JA and Kraus WE. Comparison of aerobic versus resistance exercise
training effects on metabolic syndrome (from the Studies of a Targeted Risk
Reduction Intervention Through Defined Exercise - STRRIDE-AT/RT). Am J
Cardiol. 2011;108:838-44.
33. Bruce RA and Hornsten TR. Exercise stress testing in evaluation of
patients with ischemic heart disease. Prog Cardiovasc Dis. 1969;11:371-90.
34. Hand GA, Shook RP, Paluch AE, Baruth M, Crowley EP, Jaggers JR,
Prasad VK, Hurley TG, Hebert JR, O'Connor DP, Archer E, Burgess S and Blair
SN. The energy balance study: the design and baseline results for a longitudinal
study of energy balance. Res Q Exerc Sport. 2013;84:275-86.

!
91
35. Church TS, Earnest CP, Thompson AM, Priest EL, Rodarte RQ, Saunders
T, Ross R and Blair SN. Exercise without weight loss does not reduce C-reactive
protein: the INFLAME study. Med Sci Sports Exerc. 2010;42:708-16.
36. Slentz CA, Bateman LA, Willis LH, Shields AT, Tanner CJ, Piner LW,
Hawk VH, Muehlbauer MJ, Samsa GP, Nelson RC, Huffman KM, Bales CW,
Houmard JA and Kraus WE. Effects of aerobic vs. resistance training on visceral
and liver fat stores, liver enzymes, and insulin resistance by HOMA in overweight
adults from STRRIDE AT/RT. Am J Physiol Endocrinol Metab. 2011;301:E1033-
9.
37. Skinner JS, Wilmore KM, Jaskolska A, Jaskolski A, Daw EW, Rice T,
Gagnon J, Leon AS, Wilmore JH, Rao DC and Bouchard C. Reproducibility of
maximal exercise test data in the HERITAGE family study. Med Sci Sports Exerc.
1999;31:1623-8.
38. Gagnon J, Province MA, Bouchard C, Leon AS, Skinner JS, Wilmore JH
and Rao DC. The HERITAGE Family Study: quality assurance and quality
control. Ann Epidemiol. 1996;6:520-9.
39. Wilmore JH, Stanforth PR, Domenick MA, Gagnon J, Daw EW, Leon AS,
Rao DC, Skinner JS and Bouchard C. Reproducibility of anthropometric and
body composition measurements: the HERITAGE Family Study. Int J Obes Relat
Metab Disord. 1997;21:297-303.
40. Wilmore JH, Stanforth PR, Turley KR, Gagnon J, Daw EW, Leon AS, Rao
DC, Skinner JS and Bouchard C. Reproducibility of cardiovascular, respiratory,

!
92
and metabolic responses to submaximal exercise: the HERITAGE Family Study.
Med Sci Sports Exerc. 1998;30:259-65.
41. Despres JP, Gagnon J, Bergeron J, Couillard C, Leon AS, Rao DC,
Skinner JS, Wilmore JH and Bouchard C. Plasma post-heparin lipase activities in
the HERITAGE Family Study: the reproducibility, gender differences, and
associations with lipoprotein levels. HEalth, RIsk factors, exercise Training and
GEnetics. Clin Biochem. 1999;32:157-65.
42. Bouchard C, Blair SN, Church TS, Earnest CP, Hagberg JM, Hakkinen K,
Jenkins NT, Karavirta L, Kraus WE, Leon AS, Rao DC, Sarzynski MA, Skinner
JS, Slentz CA and Rankinen T. Adverse metabolic response to regular exercise:
is it a rare or common occurrence? PLoS One. 2012;7:e37887.
43. Laukkanen JA, Kurl S, Salonen R, Rauramaa R and Salonen JT. The
predictive value of cardiorespiratory fitness for cardiovascular events in men with
various risk profiles: a prospective population-based cohort study. Eur Heart J.
2004;25:1428-37.
44. Sui X, LaMonte MJ and Blair SN. Cardiorespiratory fitness as a predictor
of nonfatal cardiovascular events in asymptomatic women and men. Am J
Epidemiol. 2007;165:1413-23.
45. Sawada SS, Lee IM, Naito H, Kakigi R, Goto S, Kanazawa M, Okamoto T,
Tsukamoto K, Muto T, Tanaka H and Blair SN. Cardiorespiratory fitness, body
mass index, and cancer mortality: a cohort study of Japanese men. BMC Public
Health. 2014;14:1012.
!
93
46. Lee DC, Artero EG, Sui X and Blair SN. Mortality trends in the general
population: the importance of cardiorespiratory fitness. J Psychopharmacol.
2010;24:27-35.
47. Ross R, Blair SN, Arena R, Church TS, Despres JP, Franklin BA, Haskell
WL, Kaminsky LA, Levine BD, Lavie CJ, Myers J, Niebauer J, Sallis R, Sawada
SS, Sui X, Wisloff U, American Heart Association Physical Activity Committee of
the Council on L, Cardiometabolic H, Council on Clinical C, Council on E,
Prevention, Council on C, Stroke N, Council on Functional G, Translational B and
Stroke C. Importance of Assessing Cardiorespiratory Fitness in Clinical Practice:
A Case for Fitness as a Clinical Vital Sign: A Scientific Statement From the
American Heart Association. Circulation. 2016;134:e653-e699.
48. Martin BJ, Arena R, Haykowsky M, Hauer T, Austford LD, Knudtson M,
Aggarwal S, Stone JA and Investigators A. Cardiovascular fitness and mortality
after contemporary cardiac rehabilitation. Mayo Clin Proc. 2013;88:455-63.
49. Naci H and Ioannidis JP. Comparative effectiveness of exercise and drug
interventions on mortality outcomes: metaepidemiological study. BMJ.
2013;347:f5577.
50. Myers J, Prakash M, Froelicher V, Do D, Partington S and Atwood JE.
Exercise capacity and mortality among men referred for exercise testing. N Engl
J Med. 2002;346:793-801.
51. Myers J, McAuley P, Lavie CJ, Despres JP, Arena R and Kokkinos P.
Physical activity and cardiorespiratory fitness as major markers of cardiovascular
!
94
risk: their independent and interwoven importance to health status. Prog
Cardiovasc Dis. 2015;57:306-14.
52. Blair SN. Physical inactivity: the biggest public health problem of the 21st
century. Br J Sports Med. 2009;43:1-2.
53. Kodama S, Saito K, Tanaka S, Maki M, Yachi Y, Asumi M, Sugawara A,
Totsuka K, Shimano H, Ohashi Y, Yamada N and Sone H. Cardiorespiratory
fitness as a quantitative predictor of all-cause mortality and cardiovascular events
in healthy men and women: a meta-analysis. JAMA. 2009;301:2024-35.
54. Faselis C, Doumas M, Pittaras A, Narayan P, Myers J, Tsimploulis A and
Kokkinos P. Exercise capacity and all-cause mortality in male veterans with
hypertension aged >/=70 years. Hypertension. 2014;64:30-5.
55. Kokkinos PF, Faselis C, Myers J, Panagiotakos D and Doumas M.
Interactive effects of fitness and statin treatment on mortality risk in veterans with
dyslipidaemia: a cohort study. Lancet. 2013;381:394-9.
56. Church TS, Cheng YJ, Earnest CP, Barlow CE, Gibbons LW, Priest EL
and Blair SN. Exercise capacity and body composition as predictors of mortality
among men with diabetes. Diabetes Care. 2004;27:83-8.
57. Fogelholm M. Physical activity, fitness and fatness: relations to mortality,
morbidity and disease risk factors. A systematic review. Obes Rev. 2010;11:202-
21.
58. Mark DB and Lauer MS. Exercise capacity: the prognostic variable that
doesn't get enough respect. Circulation. 2003;108:1534-6.

!
95
59. Chobanian AV, Bakris GL, Black HR, Cushman WC, Green LA, Izzo JL,
Jr., Jones DW, Materson BJ, Oparil S, Wright JT, Jr., Roccella EJ, Joint National
Committee on Prevention DE, Treatment of High Blood Pressure. National Heart
L, Blood I and National High Blood Pressure Education Program Coordinating C.
Seventh report of the Joint National Committee on Prevention, Detection,
Evaluation, and Treatment of High Blood Pressure. Hypertension. 2003;42:1206-
52.
60. Vasan RS, Larson MG, Leip EP, Kannel WB and Levy D. Assessment of
frequency of progression to hypertension in non-hypertensive participants in the
Framingham Heart Study: a cohort study. Lancet. 2001;358:1682-6.
61. Blair SN, Goodyear NN, Gibbons LW and Cooper KH. Physical fitness and
incidence of hypertension in healthy normotensive men and women. JAMA.
1984;252:487-90.
62. Sawada S, Tanaka H, Funakoshi M, Shindo M, Kono S and Ishiko T. Five
year prospective study on blood pressure and maximal oxygen uptake. Clin Exp
Pharmacol Physiol. 1993;20:483-7.
63. Carnethon MR, Gidding SS, Nehgme R, Sidney S, Jacobs DR, Jr. and Liu
K. Cardiorespiratory fitness in young adulthood and the development of
cardiovascular disease risk factors. JAMA. 2003;290:3092-100.
64. Barlow CE, LaMonte MJ, Fitzgerald SJ, Kampert JB, Perrin JL and Blair
SN. Cardiorespiratory fitness is an independent predictor of hypertension
incidence among initially normotensive healthy women. Am J Epidemiol.
2006;163:142-50.

!
96
65. Brook RD, Appel LJ, Rubenfire M, Ogedegbe G, Bisognano JD, Elliott WJ,
Fuchs FD, Hughes JW, Lackland DT, Staffileno BA, Townsend RR, Rajagopalan
S, American Heart Association Professional Education Committee of the Council
for High Blood Pressure Research CoC, Stroke Nursing CoE, Prevention and
Council on Nutrition PA. Beyond medications and diet: alternative approaches to
lowering blood pressure: a scientific statement from the american heart
association. Hypertension. 2013;61:1360-83.
66. Fagard RH. Physical fitness and blood pressure. J Hypertens Suppl.
1993;11:S47-52.
67. Fagard RH. Physical activity in the prevention and treatment of
hypertension in the obese. Med Sci Sports Exerc. 1999;31:S624-30.
68. Fagard RH. Exercise characteristics and the blood pressure response to
dynamic physical training. Med Sci Sports Exerc. 2001;33:S484-92; discussion
S493-4.
69. Halbert JA, Silagy CA, Finucane P, Withers RT, Hamdorf PA and Andrews
GR. The effectiveness of exercise training in lowering blood pressure: a meta-
analysis of randomised controlled trials of 4 weeks or longer. J Hum Hypertens.
1997;11:641-9.
70. Kelley G and McClellan P. Antihypertensive effects of aerobic exercise. A
brief meta-analytic review of randomized controlled trials. Am J Hypertens.
1994;7:115-9.
71. Kelley G and Tran ZV. Aerobic exercise and normotensive adults: a meta-
analysis. Med Sci Sports Exerc. 1995;27:1371-7.
!
97
72. Kelley GA. Effects of aerobic exercise in normotensive adults: a brief
meta-analytic review of controlled clinical trials. South Med J. 1995;88:42-6.
73. Kelley GA. Aerobic exercise and resting blood pressure among women: a
meta-analysis. Prev Med. 1999;28:264-75.
74. Kelley GA and Sharpe Kelley K. Aerobic exercise and resting blood
pressure in older adults: a meta-analytic review of randomized controlled trials. J
Gerontol A Biol Sci Med Sci. 2001;56:M298-303.
75. Kelley GA, Kelley KS and Tran ZV. Walking and resting blood pressure in
adults: a meta-analysis. Prev Med. 2001;33:120-7.
76. Kelley GA, Kelley KA and Tran ZV. Aerobic exercise and resting blood
pressure: a meta-analytic review of randomized, controlled trials. Prev Cardiol.
2001;4:73-80.
77. Whelton SP, Chin A, Xin X and He J. Effect of aerobic exercise on blood
pressure: a meta-analysis of randomized, controlled trials. Ann Intern Med.
2002;136:493-503.
78. Punia S, Kulandaivelan S, Singh V and Punia V. Effect of Aerobic
Exercise Training on Blood Pressure in Indians: Systematic Review. Int J Chronic
Dis. 2016;2016:1370148.
79. Cornelissen VA and Fagard RH. Effects of endurance training on blood
pressure, blood pressure-regulating mechanisms, and cardiovascular risk
factors. Hypertension. 2005;46:667-75.
80. Cornelissen VA and Smart NA. Exercise training for blood pressure: a
systematic review and meta-analysis. J Am Heart Assoc. 2013;2:e004473.
!
98
81. Pattyn N, Cornelissen VA, Eshghi SR and Vanhees L. The effect of
exercise on the cardiovascular risk factors constituting the metabolic syndrome: a
meta-analysis of controlled trials. Sports Med. 2013;43:121-33.
82. Chudyk A and Petrella RJ. Effects of exercise on cardiovascular risk
factors in type 2 diabetes: a meta-analysis. Diabetes Care. 2011;34:1228-37.
83. Whitworth JA and World Health Organization ISoHWG. 2003 World Health
Organization (WHO)/International Society of Hypertension (ISH) statement on
management of hypertension. J Hypertens. 2003;21:1983-92.
84. European Society of Hypertension-European Society of Cardiology
Guidelines C. 2003 European Society of Hypertension-European Society of
Cardiology guidelines for the management of arterial hypertension. J Hypertens.
2003;21:1011-53.
85. Pescatello LS, Franklin BA, Fagard R, Farquhar WB, Kelley GA, Ray CA
and American College of Sports M. American College of Sports Medicine position
stand. Exercise and hypertension. Med Sci Sports Exerc. 2004;36:533-53.
86. Whelton PK, He J, Appel LJ, Cutler JA, Havas S, Kotchen TA, Roccella
EJ, Stout R, Vallbona C, Winston MC, Karimbakas J and National High Blood
Pressure Education Program Coordinating C. Primary prevention of
hypertension: clinical and public health advisory from The National High Blood
Pressure Education Program. JAMA. 2002;288:1882-8.
87. Kokkinos P. Cardiorespiratory fitness, exercise, and blood pressure.
Hypertension. 2014;64:1160-4.

!
99
88. Kokkinos P and Myers J. Exercise and physical activity: clinical outcomes
and applications. Circulation. 2010;122:1637-48.
89. Pescatello LS, MacDonald HV, Lamberti L and Johnson BT. Exercise for
Hypertension: A Prescription Update Integrating Existing Recommendations with
Emerging Research. Curr Hypertens Rep. 2015;17:87.
90. Centers for Disease Control and Prevention. National Diabetes Fact
Sheet: national Estimates and General Information on Diabetes and Prediabetes
in the United States, 2011. Atlanta, GA: US Department of Health and Human
Services, Centers for Disease Control and Prevention; 2011.
91. Helmrich SP, Ragland DR, Leung RW and Paffenbarger RS, Jr. Physical
activity and reduced occurrence of non-insulin-dependent diabetes mellitus. N
Engl J Med. 1991;325:147-52.
92. Manson JE, Nathan DM, Krolewski AS, Stampfer MJ, Willett WC and
Hennekens CH. A prospective study of exercise and incidence of diabetes
among US male physicians. JAMA. 1992;268:63-7.
93. Hu FB, Sigal RJ, Rich-Edwards JW, Colditz GA, Solomon CG, Willett WC,
Speizer FE and Manson JE. Walking compared with vigorous physical activity
and risk of type 2 diabetes in women: a prospective study. JAMA.
1999;282:1433-9.
94. Hu FB, Stampfer MJ, Solomon C, Liu S, Colditz GA, Speizer FE, Willett
WC and Manson JE. Physical activity and risk for cardiovascular events in
diabetic women. Ann Intern Med. 2001;134:96-105.

!
100
95. Sui X, Hooker SP, Lee IM, Church TS, Colabianchi N, Lee CD and Blair
SN. A prospective study of cardiorespiratory fitness and risk of type 2 diabetes in
women. Diabetes Care. 2008;31:550-5.
96. Lee DC, Sui X, Church TS, Lee IM and Blair SN. Associations of
cardiorespiratory fitness and obesity with risks of impaired fasting glucose and
type 2 diabetes in men. Diabetes Care. 2009;32:257-62.
97. Earnest CP, Artero EG, Sui X, Lee DC, Church TS and Blair SN. Maximal
estimated cardiorespiratory fitness, cardiometabolic risk factors, and metabolic
syndrome in the aerobics center longitudinal study. Mayo Clin Proc.
2013;88:259-70.
98. Johannsen NM, Swift DL, Lavie CJ, Earnest CP, Blair SN and Church TS.
Categorical analysis of the impact of aerobic and resistance exercise training,
alone and in combination, on cardiorespiratory fitness levels in patients with type
2 diabetes: results from the HART-D study. Diabetes Care. 2013;36:3305-12.
99. Sieverdes JC, Sui X, Lee DC, Church TS, McClain A, Hand GA and Blair
SN. Physical activity, cardiorespiratory fitness and the incidence of type 2
diabetes in a prospective study of men. Br J Sports Med. 2010;44:238-44.
100. Shepherd PR and Kahn BB. Glucose transporters and insulin action--
implications for insulin resistance and diabetes mellitus. N Engl J Med.
1999;341:248-57.
101. Smutok MA, Reece C, Kokkinos PF, Farmer C, Dawson P, Shulman R,
DeVane-Bell J, Patterson J, Charabogos C, Goldberg AP and et al. Aerobic
!
101
versus strength training for risk factor intervention in middle-aged men at high
risk for coronary heart disease. Metabolism. 1993;42:177-84.
102. Miller JP, Pratley RE, Goldberg AP, Gordon P, Rubin M, Treuth MS, Ryan
AS and Hurley BF. Strength training increases insulin action in healthy 50- to 65-
yr-old men. J Appl Physiol (1985). 1994;77:1122-7.
103. Knowler WC, Barrett-Connor E, Fowler SE, Hamman RF, Lachin JM,
Walker EA, Nathan DM and Diabetes Prevention Program Research G.
Reduction in the incidence of type 2 diabetes with lifestyle intervention or
metformin. N Engl J Med. 2002;346:393-403.
104. Conn VS, Koopman RJ, Ruppar TM, Phillips LJ, Mehr DR and Hafdahl
AR. Insulin Sensitivity Following Exercise Interventions: Systematic Review and
Meta-Analysis of Outcomes Among Healthy Adults. J Prim Care Community
Health. 2014;5:211-22.
105. Bird SR and Hawley JA. Update on the effects of physical activity on
insulin sensitivity in humans. BMJ Open Sport Exerc Med. 2017;2.
106. Maron DJ. The epidemiology of low levels of high-density lipoprotein
cholesterol in patients with and without coronary artery disease. Am J Cardiol.
2000;86:11L-14L.
107. Sarzynski MA, Schuna JM, Jr., Carnethon MR, Jacobs DR, Jr., Lewis CE,
Quesenberry CP, Jr., Sidney S, Schreiner PJ and Sternfeld B. Association of
Fitness With Incident Dyslipidemias Over 25 Years in the Coronary Artery Risk
Development in Young Adults Study. Am J Prev Med. 2015;49:745-752.

!
102
108. Breneman CB, Polinski K, Sarzynski MA, Lavie CJ, Kokkinos PF, Ahmed
A and Sui X. The Impact of Cardiorespiratory Fitness Levels on the Risk of
Developing Atherogenic Dyslipidemia. Am J Med. 2016;129:1060-6.
109. Kokkinos PF and Fernhall B. Physical activity and high density lipoprotein
cholesterol levels: what is the relationship? Sports Med. 1999;28:307-14.
110. Durstine JL and Haskell WL. Effects of exercise training on plasma lipids
and lipoproteins. Exerc Sport Sci Rev. 1994;22:477-521.
111. Leon AS and Sanchez OA. Response of blood lipids to exercise training
alone or combined with dietary intervention. Med Sci Sports Exerc.
2001;33:S502-15; discussion S528-9.
112. Kraus WE, Houmard JA, Duscha BD, Knetzger KJ, Wharton MB,
McCartney JS, Bales CW, Henes S, Samsa GP, Otvos JD, Kulkarni KR and
Slentz CA. Effects of the amount and intensity of exercise on plasma
lipoproteins. N Engl J Med. 2002;347:1483-92.
113. Drygas W, Jegler A and Kunski H. Study on threshold dose of physical
activity in coronary heart disease prevention. Part I. Relationship between leisure
time physical activity and coronary risk factors. Int J Sports Med. 1988;9:275-8.
114. Kelley GA, Kelley KS, Roberts S and Haskell W. Efficacy of aerobic
exercise and a prudent diet for improving selected lipids and lipoproteins in
adults: a meta-analysis of randomized controlled trials. BMC Med. 2011;9:74.
115. Franklin BA, Durstine JL, Roberts CK and Barnard RJ. Impact of diet and
exercise on lipid management in the modern era. Best Pract Res Clin Endocrinol
Metab. 2014;28:405-21.
!
103
116. Fletcher B, Berra K, Ades P, Braun LT, Burke LE, Durstine JL, Fair JM,
Fletcher GF, Goff D, Hayman LL, Hiatt WR, Miller NH, Krauss R, Kris-Etherton P,
Stone N, Wilterdink J, Winston M, Council on Cardiovascular N, Council on
Arteriosclerosis T, Vascular B, Council on Basic Cardiovascular S, Council on
Cardiovascular Disease in the Y, Council on Clinical C, Council on E, Prevention,
Council on Nutrition PA, Metabolism, Council on S and Preventive
Cardiovascular Nurses A. Managing abnormal blood lipids: a collaborative
approach. Circulation. 2005;112:3184-209.
117. Stefanick ML, Mackey S, Sheehan M, Ellsworth N, Haskell WL and Wood
PD. Effects of diet and exercise in men and postmenopausal women with low
levels of HDL cholesterol and high levels of LDL cholesterol. N Engl J Med.
1998;339:12-20.
118. Wood PD, Stefanick ML, Williams PT and Haskell WL. The effects on
plasma lipoproteins of a prudent weight-reducing diet, with or without exercise, in
overweight men and women. N Engl J Med. 1991;325:461-6.
119. Mattson FH and Grundy SM. Comparison of effects of dietary saturated,
monounsaturated, and polyunsaturated fatty acids on plasma lipids and
lipoproteins in man. J Lipid Res. 1985;26:194-202.
120. Brinton EA, Eisenberg S and Breslow JL. A low-fat diet decreases high
density lipoprotein (HDL) cholesterol levels by decreasing HDL apolipoprotein
transport rates. J Clin Invest. 1990;85:144-51.
121. Kodama S, Tanaka S, Saito K, Shu M, Sone Y, Onitake F, Suzuki E,
Shimano H, Yamamoto S, Kondo K, Ohashi Y, Yamada N and Sone H. Effect of

!
104
aerobic exercise training on serum levels of high-density lipoprotein cholesterol:
a meta-analysis. Arch Intern Med. 2007;167:999-1008.
122. Writing Group M, Mozaffarian D, Benjamin EJ, Go AS, Arnett DK, Blaha
MJ, Cushman M, Das SR, de Ferranti S, Despres JP, Fullerton HJ, Howard VJ,
Huffman MD, Isasi CR, Jimenez MC, Judd SE, Kissela BM, Lichtman JH,
Lisabeth LD, Liu S, Mackey RH, Magid DJ, McGuire DK, Mohler ER, 3rd, Moy
CS, Muntner P, Mussolino ME, Nasir K, Neumar RW, Nichol G, Palaniappan L,
Pandey DK, Reeves MJ, Rodriguez CJ, Rosamond W, Sorlie PD, Stein J,
Towfighi A, Turan TN, Virani SS, Woo D, Yeh RW, Turner MB, American Heart
Association Statistics C and Stroke Statistics S. Heart Disease and Stroke
Statistics-2016 Update: A Report From the American Heart Association.
Circulation. 2016;133:e38-360.
123. Klein S, Burke LE, Bray GA, Blair S, Allison DB, Pi-Sunyer X, Hong Y,
Eckel RH, American Heart Association Council on Nutrition PA and Metabolism.
Clinical implications of obesity with specific focus on cardiovascular disease: a
statement for professionals from the American Heart Association Council on
Nutrition, Physical Activity, and Metabolism: endorsed by the American College
of Cardiology Foundation. Circulation. 2004;110:2952-67.
124. Poirier P, Giles TD, Bray GA, Hong Y, Stern JS, Pi-Sunyer FX, Eckel RH,
American Heart A, Obesity Committee of the Council on Nutrition PA and
Metabolism. Obesity and cardiovascular disease: pathophysiology, evaluation,
and effect of weight loss: an update of the 1997 American Heart Association
Scientific Statement on Obesity and Heart Disease from the Obesity Committee
!
105
of the Council on Nutrition, Physical Activity, and Metabolism. Circulation.
2006;113:898-918.
125. Tedrow UB, Conen D, Ridker PM, Cook NR, Koplan BA, Manson JE,
Buring JE and Albert CM. The long- and short-term impact of elevated body
mass index on the risk of new atrial fibrillation the WHS (women's health study). J
Am Coll Cardiol. 2010;55:2319-27.
126. Wattanakit K, Lutsey PL, Bell EJ, Gornik H, Cushman M, Heckbert SR,
Rosamond WD and Folsom AR. Association between cardiovascular disease risk
factors and occurrence of venous thromboembolism. A time-dependent analysis.
Thromb Haemost. 2012;108:508-15.
127. Wilson PW, D'Agostino RB, Sullivan L, Parise H and Kannel WB.
Overweight and obesity as determinants of cardiovascular risk: the Framingham
experience. Arch Intern Med. 2002;162:1867-72.
128. Kachur S, Lavie CJ, de Schutter A, Milani RV and Ventura HO. Obesity
and cardiovascular diseases. Minerva Med. 2017;108:212-228.
129. Oktay AA, Lavie CJ, Kokkinos PF, Parto P, Pandey A and Ventura HO.
The Interaction of Cardiorespiratory Fitness With Obesity and the Obesity
Paradox in Cardiovascular Disease. Prog Cardiovasc Dis. 2017.
130. Alpert MA, Lavie CJ, Agrawal H, Kumar A and Kumar SA. Cardiac Effects
of Obesity: PATHOPHYSIOLOGIC, CLINICAL, AND PROGNOSTIC
CONSEQUENCES-A REVIEW. J Cardiopulm Rehabil Prev. 2016;36:1-11.

!
106
131. Lavie CJ, De Schutter A, Parto P, Jahangir E, Kokkinos P, Ortega FB,
Arena R and Milani RV. Obesity and Prevalence of Cardiovascular Diseases and
Prognosis-The Obesity Paradox Updated. Prog Cardiovasc Dis. 2016;58:537-47.
132. Lavie CJ, Sharma A, Alpert MA, De Schutter A, Lopez-Jimenez F, Milani
RV and Ventura HO. Update on Obesity and Obesity Paradox in Heart Failure.
Prog Cardiovasc Dis. 2016;58:393-400.
133. Carbone S, Lavie CJ and Arena R. Obesity and Heart Failure: Focus on
the Obesity Paradox. Mayo Clin Proc. 2017;92:266-279.
134. Turkbey EB, McClelland RL, Kronmal RA, Burke GL, Bild DE, Tracy RP,
Arai AE, Lima JA and Bluemke DA. The impact of obesity on the left ventricle:
the Multi-Ethnic Study of Atherosclerosis (MESA). JACC Cardiovasc Imaging.
2010;3:266-74.
135. Neeland IJ, Gupta S, Ayers CR, Turer AT, Rame JE, Das SR, Berry JD,
Khera A, McGuire DK, Vega GL, Grundy SM, de Lemos JA and Drazner MH.
Relation of regional fat distribution to left ventricular structure and function. Circ
Cardiovasc Imaging. 2013;6:800-7.
136. Stritzke J, Markus MR, Duderstadt S, Lieb W, Luchner A, Doring A, Keil U,
Hense HW, Schunkert H and Investigators MK. The aging process of the heart:
obesity is the main risk factor for left atrial enlargement during aging the
MONICA/KORA (monitoring of trends and determinations in cardiovascular
disease/cooperative research in the region of Augsburg) study. J Am Coll
Cardiol. 2009;54:1982-9.

!
107
137. Chahal H, McClelland RL, Tandri H, Jain A, Turkbey EB, Hundley WG,
Barr RG, Kizer J, Lima JAC, Bluemke DA and Kawut SM. Obesity and right
ventricular structure and function: the MESA-Right Ventricle Study. Chest.
2012;141:388-395.
138. Pascual M, Pascual DA, Soria F, Vicente T, Hernandez AM, Tebar FJ and
Valdes M. Effects of isolated obesity on systolic and diastolic left ventricular
function. Heart. 2003;89:1152-6.
139. Kishi S, Armstrong AC, Gidding SS, Colangelo LA, Venkatesh BA, Jacobs
DR, Jr., Carr JJ, Terry JG, Liu K, Goff DC, Jr. and Lima JA. Association of
obesity in early adulthood and middle age with incipient left ventricular
dysfunction and structural remodeling: the CARDIA study (Coronary Artery Risk
Development in Young Adults). JACC Heart Fail. 2014;2:500-8.
140. Tadic M, Cuspidi C, Vukomanovic V, Kocijancic V, Celic V and
Stanisavljevic D. The Association between Obesity, Blood Pressure Variability,
and Right Ventricular Function and Mechanics in Hypertensive Patients. J Am
Soc Echocardiogr. 2016;29:802-11.
141. Wang YC, Liang CS, Gopal DM, Ayalon N, Donohue C, Santhanakrishnan
R, Sandhu H, Perez AJ, Downing J, Gokce N, Colucci WS and Ho JE. Preclinical
Systolic and Diastolic Dysfunctions in Metabolically Healthy and Unhealthy
Obese Individuals. Circ Heart Fail. 2015;8:897-904.
142. Kamiya K, Masuda T, Matsue Y, Inomata T, Hamazaki N, Matsuzawa R,
Tanaka S, Nozaki K, Maekawa E, Noda C, Yamaoka-Tojo M, Matsunaga A,

!
108
Izumi T and Ako J. Complementary Role of Arm Circumference to Body Mass
Index in Risk Stratification in Heart Failure. JACC Heart Fail. 2016;4:265-73.
143. Lavie CJ, Forman DE and Arena R. Bulking Up Skeletal Muscle to
Improve Heart Failure Prognosis. JACC Heart Fail. 2016;4:274-6.
144. Lavie CJ, Cahalin LP, Chase P, Myers J, Bensimhon D, Peberdy MA,
Ashley E, West E, Forman DE, Guazzi M and Arena R. Impact of
cardiorespiratory fitness on the obesity paradox in patients with heart failure.
Mayo Clin Proc. 2013;88:251-8.
145. Goel K, Thomas RJ, Squires RW, Coutinho T, Trejo-Gutierrez JF, Somers
VK, Miles JM and Lopez-Jimenez F. Combined effect of cardiorespiratory fitness
and adiposity on mortality in patients with coronary artery disease. Am Heart J.
2011;161:590-7.
146. Blair SN, Kampert JB, Kohl HW, 3rd, Barlow CE, Macera CA,
Paffenbarger RS, Jr. and Gibbons LW. Influences of cardiorespiratory fitness and
other precursors on cardiovascular disease and all-cause mortality in men and
women. JAMA. 1996;276:205-10.
147. Wessel TR, Arant CB, Olson MB, Johnson BD, Reis SE, Sharaf BL, Shaw
LJ, Handberg E, Sopko G, Kelsey SF, Pepine CJ and Merz NB. Relationship of
physical fitness vs body mass index with coronary artery disease and
cardiovascular events in women. JAMA. 2004;292:1179-87.
148. Artero EG, Lee DC, Ruiz JR, Sui X, Ortega FB, Church TS, Lavie CJ,
Castillo MJ and Blair SN. A prospective study of muscular strength and all-cause
mortality in men with hypertension. J Am Coll Cardiol. 2011;57:1831-7.

!
109
149. Church TS, LaMonte MJ, Barlow CE and Blair SN. Cardiorespiratory
fitness and body mass index as predictors of cardiovascular disease mortality
among men with diabetes. Arch Intern Med. 2005;165:2114-20.
150. Lyerly GW, Sui X, Lavie CJ, Church TS, Hand GA and Blair SN. The
association between cardiorespiratory fitness and risk of all-cause mortality
among women with impaired fasting glucose or undiagnosed diabetes mellitus.
Mayo Clin Proc. 2009;84:780-6.
151. Barry VW, Baruth M, Beets MW, Durstine JL, Liu J and Blair SN. Fitness
vs. fatness on all-cause mortality: a meta-analysis. Prog Cardiovasc Dis.
2014;56:382-90.
152. McAuley PA and Beavers KM. Contribution of cardiorespiratory fitness to
the obesity paradox. Prog Cardiovasc Dis. 2014;56:434-40.
153. Lavie CJ, McAuley PA, Church TS, Milani RV and Blair SN. Obesity and
cardiovascular diseases: implications regarding fitness, fatness, and severity in
the obesity paradox. J Am Coll Cardiol. 2014;63:1345-54.
154. Wei M, Kampert JB, Barlow CE, Nichaman MZ, Gibbons LW,
Paffenbarger RS, Jr. and Blair SN. Relationship between low cardiorespiratory
fitness and mortality in normal-weight, overweight, and obese men. JAMA.
1999;282:1547-53.
155. Lee CD, Blair SN and Jackson AS. Cardiorespiratory fitness, body
composition, and all-cause and cardiovascular disease mortality in men. Am J
Clin Nutr. 1999;69:373-80.

!
110
156. McAuley PA and Blair SN. Obesity paradoxes. J Sports Sci. 2011;29:773-
82.
157. Lee DC, Sui X, Artero EG, Lee IM, Church TS, McAuley PA, Stanford FC,
Kohl HW, 3rd and Blair SN. Long-term effects of changes in cardiorespiratory
fitness and body mass index on all-cause and cardiovascular disease mortality in
men: the Aerobics Center Longitudinal Study. Circulation. 2011;124:2483-90.
158. Despres JP. Body fat distribution and risk of cardiovascular disease: an
update. Circulation. 2012;126:1301-13.
159. Irving BA, Davis CK, Brock DW, Weltman JY, Swift D, Barrett EJ, Gaesser
GA and Weltman A. Effect of exercise training intensity on abdominal visceral fat
and body composition. Med Sci Sports Exerc. 2008;40:1863-72.
160. Ismail I, Keating SE, Baker MK and Johnson NA. A systematic review and
meta-analysis of the effect of aerobic vs. resistance exercise training on visceral
fat. Obes Rev. 2012;13:68-91.
161. Keating SE, Hackett DA, Parker HM, O'Connor HT, Gerofi JA, Sainsbury
A, Baker MK, Chuter VH, Caterson ID, George J and Johnson NA. Effect of
aerobic exercise training dose on liver fat and visceral adiposity. J Hepatol.
2015;63:174-82.
162. Vissers D, Hens W, Taeymans J, Baeyens JP, Poortmans J and Van Gaal
L. The effect of exercise on visceral adipose tissue in overweight adults: a
systematic review and meta-analysis. PLoS One. 2013;8:e56415.
!
111
163. Artero EG, Espana-Romero V, Lee DC, Sui X, Church TS, Lavie CJ and
Blair SN. Ideal cardiovascular health and mortality: Aerobics Center Longitudinal
Study. Mayo Clin Proc. 2012;87:944-52.
164. Ruiz JR, Huybrechts I, Cuenca-Garcia M, Artero EG, Labayen I,
Meirhaeghe A, Vicente-Rodriguez G, Polito A, Manios Y, Gonzalez-Gross M,
Marcos A, Widhalm K, Molnar D, Kafatos A, Sjostrom M, Moreno LA, Castillo MJ,
Ortega FB and group Hs. Cardiorespiratory fitness and ideal cardiovascular
health in European adolescents. Heart. 2015;101:766-73.
165. Myers GL, Cooper GR, Winn CL and Smith SJ. The Centers for Disease
Control-National Heart, Lung and Blood Institute Lipid Standardization Program.
An approach to accurate and precise lipid measurements. Clin Lab Med.
1989;9:105-35.
166. Bouchard C and Rankinen T. Individual differences in response to regular
physical activity. Med Sci Sports Exerc. 2001;33:S446-51; discussion S452-3.
167. Boule NG, Weisnagel SJ, Lakka TA, Tremblay A, Bergman RN, Rankinen
T, Leon AS, Skinner JS, Wilmore JH, Rao DC, Bouchard C and Study HF.
Effects of exercise training on glucose homeostasis: the HERITAGE Family
Study. Diabetes Care. 2005;28:108-14.
168. Leon AS, Gaskill SE, Rice T, Bergeron J, Gagnon J, Rao DC, Skinner JS,
Wilmore JH and Bouchard C. Variability in the response of HDL cholesterol to
exercise training in the HERITAGE Family Study. Int J Sports Med. 2002;23:1-9.
!
112
169. Ross R, de Lannoy L and Stotz PJ. Separate Effects of Intensity and
Amount of Exercise on Interindividual Cardiorespiratory Fitness Response. Mayo
Clin Proc. 2015;90:1506-14.
170. Hautala AJ, Kiviniemi AM and Tulppo MP. Individual responses to aerobic
exercise: the role of the autonomic nervous system. Neurosci Biobehav Rev.
2009;33:107-15.
171. Kohrt WM, Malley MT, Coggan AR, Spina RJ, Ogawa T, Ehsani AA,
Bourey RE, Martin WH, 3rd and Holloszy JO. Effects of gender, age, and fitness
level on response of VO2max to training in 60-71 yr olds. J Appl Physiol (1985).
1991;71:2004-11.
172. Sisson SB, Katzmarzyk PT, Earnest CP, Bouchard C, Blair SN and
Church TS. Volume of exercise and fitness nonresponse in sedentary,
postmenopausal women. Med Sci Sports Exerc. 2009;41:539-45.
173. Church TS, Earnest CP, Skinner JS and Blair SN. Effects of different
doses of physical activity on cardiorespiratory fitness among sedentary,
overweight or obese postmenopausal women with elevated blood pressure: a
randomized controlled trial. JAMA. 2007;297:2081-91.
174. Bouchard C, An P, Rice T, Skinner JS, Wilmore JH, Gagnon J, Perusse L,
Leon AS and Rao DC. Familial aggregation of VO(2max) response to exercise
training: results from the HERITAGE Family Study. J Appl Physiol (1985).
1999;87:1003-8.

!
113
175. Shephard RJ, Rankinen T and Bouchard C. Test-retest errors and the
apparent heterogeneity of training response. Eur J Appl Physiol. 2004;91:199-
203.
176. Lortie G, Simoneau JA, Hamel P, Boulay MR, Landry F and Bouchard C.
Responses of maximal aerobic power and capacity to aerobic training. Int J
Sports Med. 1984;5:232-6.
177. Bouchard C. Individual differences in the response to regular exercise. Int
J Obes Relat Metab Disord. 1995;19 Suppl 4:S5-8.
178. Hautala AJ, Kiviniemi AM, Makikallio TH, Kinnunen H, Nissila S, Huikuri
HV and Tulppo MP. Individual differences in the responses to endurance and
resistance training. Eur J Appl Physiol. 2006;96:535-42.
179. Wilmore JH, Green JS, Stanforth PR, Gagnon J, Rankinen T, Leon AS,
Rao DC, Skinner JS and Bouchard C. Relationship of changes in maximal and
submaximal aerobic fitness to changes in cardiovascular disease and non-
insulin-dependent diabetes mellitus risk factors with endurance training: the
HERITAGE Family Study. Metabolism. 2001;50:1255-63.
180. Hautala A, Martinmaki K, Kiviniemi A, Kinnunen H, Virtanen P, Jaatinen J
and Tulppo M. Effects of habitual physical activity on response to endurance
training. J Sports Sci. 2012;30:563-9.
181. Montero D and Lundby C. Refuting the myth of non-response to exercise
training: 'non-responders' do respond to higher dose of training. J Physiol.
2017;595:3377-3387.
Related Documents