The association between urinary cortisol excretion and cardiovascular risk factors, bone status and quality of life in the population Oskar Ragnarsson a,⇑ , Penelope Trimpou a , Göran Oleröd b , Kerstin Landin-Wilhelmsen a a Institute of Medicine at Sahlgrenska Academy, University of Gothenburg and Department of Endocrinology, Sahlgrenska University Hospital, Gothenburg, Sweden b Department of Clinical Chemistry, Sahlgrenska University Hospital, Gothenburg, Sweden article info Article history: Received 26 April 2015 Received in revised form 3 June 2015 Accepted 8 June 2015 Available online 16 June 2015 Keywords: Glucocorticoids Urinary free cortisol Metabolic syndrome Bone Quality of life abstract Objective: Patients with glucocorticoid excess have increased cardiovascular risk, decreased bone mineral density and impaired quality of life (QoL). The aim of this study was to evaluate the association between urinary cortisol excretion and cardiovascular risk factors, bone status and QoL in the population. We hypothesized that higher cortisol excretion was associated with adverse cardiovascular risk profile, worse skeletal health and QoL. Design, patients and methods: This was a cross-sectional study including a population sample (n = 348), aged 38–77 years. The mean age in women was 64.0 ± 8.5 years (n = 276) and 60.3 ± 10.2 years in men (n = 72). The metabolic syndrome, body composition measured with bioimpedance, calcaneal quantita- tive ultrasound, fractures and QoL evaluated with the Nottingham Health Profile, Psychological General Well-Being (PGWB) and the Short Form 36 (SF-36) were studied. Urinary free cortisol (UFC) was measured using radioimmunoassay. Results: UFC was higher in men (230 ± 120 nmol/L) compared to women (153 ± 71; P < 0.001) and decreased with increasing age (P < 0.001). In a regression analysis, after adjustment for gender, age and body mass index, higher UFC was associated with higher fat-free mass (P < 0.01), favourable cal- caneal bone measurements (P < 0.05), better general health measured with PGWB (P < 0.01) and SF-36 (P = 0.001) and tended to be negatively associated with the metabolic syndrome (P = 0.07). Conclusion: In contrast to our hypothesis, UFC in the upper physiological range was associated with a favourable cardiovascular risk profile, bone measures and QoL. Ó 2015 Elsevier Inc. All rights reserved. 1. Introduction Cortisol is the main glucocorticoid in humans. Since the gluco- corticoid receptor is found in almost all tissues, cortisol has a wide range of action in the human body [1,2]. In fact, cortisol has a major impact on protein, fat and carbohydrate-metabolism, the skeleton, the cardiovascular and immune system as well as the brain [2]. Prolonged glucocorticoid excess as seen in Cushing’s syndrome can have devastating effects on health. Patients with Cushing ´ s syn- drome have increased cardiovascular risk [3], decreased bone min- eral density, increased fracture risk [4,5], cognitive dysfunction and impaired quality of life (QoL) [6,7]. Even mildly, pathologically increased endogenous cortisol production has negative impact on QoL [8], cardiovascular [9] and skeletal health [10,11]. Studies on the relationship between urinary cortisol excretion and cardiovascular risk factors are sparse in the general popula- tion. An association between high urinary cortisol and adverse car- diovascular profile has been observed in some, but not in other, small studies of selected subjects [12–15]. Also, cortisol concentra- tion in urine in young women and healthy older men has been associated with decreased bone mineral density and increased fracture risk [16,17]. To our knowledge, the association between urinary cortisol excretion and QoL in the general population has not been studied before. http://dx.doi.org/10.1016/j.steroids.2015.06.007 0039-128X/Ó 2015 Elsevier Inc. All rights reserved. Abbreviations: BMI, body mass index; BUA, broadband ultrasound attenuation; HOMA, homeostatic model assessment; IR, insulin resistance; NHP, Nottingham Health Profile; PGWB, Psychological General Well-Being; QoL, quality of life; SF-36, Short Form 36; SOS, speed of sound; UFC, urinary free cortisol; QUS, Quantitative Ultrasound Measurement; WHO MONICA, World Health Organization MONItoring of trends and determinants in CArdiovascular disease. ⇑ Corresponding author at: Department of Endocrinology, Gröna Stråket 8, Sahlgrenska University Hospital, SE-413 45 Gothenburg, Sweden. Tel.: +46 313421000; fax: +46 31821524. E-mail address: [email protected] (O. Ragnarsson). Steroids 101 (2015) 71–77 Contents lists available at ScienceDirect Steroids journal homepage: www.elsevier.com/locate/steroids

Welcome message from author
This document is posted to help you gain knowledge. Please leave a comment to let me know what you think about it! Share it to your friends and learn new things together.
Transcript

Steroids 101 (2015) 71–77
Contents lists available at ScienceDirect
Steroids
journal homepage: www.elsevier .com/locate /s teroids
The association between urinary cortisol excretion and cardiovascularrisk factors, bone status and quality of life in the population
http://dx.doi.org/10.1016/j.steroids.2015.06.0070039-128X/� 2015 Elsevier Inc. All rights reserved.
Abbreviations: BMI, body mass index; BUA, broadband ultrasound attenuation;HOMA, homeostatic model assessment; IR, insulin resistance; NHP, NottinghamHealth Profile; PGWB, Psychological General Well-Being; QoL, quality of life; SF-36,Short Form 36; SOS, speed of sound; UFC, urinary free cortisol; QUS, QuantitativeUltrasound Measurement; WHO MONICA, World Health Organization MONItoringof trends and determinants in CArdiovascular disease.⇑ Corresponding author at: Department of Endocrinology, Gröna Stråket 8,
Sahlgrenska University Hospital, SE-413 45 Gothenburg, Sweden. Tel.: +46313421000; fax: +46 31821524.
E-mail address: [email protected] (O. Ragnarsson).
Oskar Ragnarsson a,⇑, Penelope Trimpou a, Göran Oleröd b, Kerstin Landin-Wilhelmsen a
a Institute of Medicine at Sahlgrenska Academy, University of Gothenburg and Department of Endocrinology, Sahlgrenska University Hospital, Gothenburg, Swedenb Department of Clinical Chemistry, Sahlgrenska University Hospital, Gothenburg, Sweden
a r t i c l e i n f o a b s t r a c t
Article history:Received 26 April 2015Received in revised form 3 June 2015Accepted 8 June 2015Available online 16 June 2015
Keywords:GlucocorticoidsUrinary free cortisolMetabolic syndromeBoneQuality of life
Objective: Patients with glucocorticoid excess have increased cardiovascular risk, decreased bone mineraldensity and impaired quality of life (QoL). The aim of this study was to evaluate the association betweenurinary cortisol excretion and cardiovascular risk factors, bone status and QoL in the population. Wehypothesized that higher cortisol excretion was associated with adverse cardiovascular risk profile, worseskeletal health and QoL.Design, patients and methods: This was a cross-sectional study including a population sample (n = 348),aged 38–77 years. The mean age in women was 64.0 ± 8.5 years (n = 276) and 60.3 ± 10.2 years in men(n = 72). The metabolic syndrome, body composition measured with bioimpedance, calcaneal quantita-tive ultrasound, fractures and QoL evaluated with the Nottingham Health Profile, PsychologicalGeneral Well-Being (PGWB) and the Short Form 36 (SF-36) were studied. Urinary free cortisol (UFC)was measured using radioimmunoassay.Results: UFC was higher in men (230 ± 120 nmol/L) compared to women (153 ± 71; P < 0.001) anddecreased with increasing age (P < 0.001). In a regression analysis, after adjustment for gender, ageand body mass index, higher UFC was associated with higher fat-free mass (P < 0.01), favourable cal-caneal bone measurements (P < 0.05), better general health measured with PGWB (P < 0.01) and SF-36(P = 0.001) and tended to be negatively associated with the metabolic syndrome (P = 0.07).Conclusion: In contrast to our hypothesis, UFC in the upper physiological range was associated with afavourable cardiovascular risk profile, bone measures and QoL.
� 2015 Elsevier Inc. All rights reserved.
1. Introduction
Cortisol is the main glucocorticoid in humans. Since the gluco-corticoid receptor is found in almost all tissues, cortisol has a widerange of action in the human body [1,2]. In fact, cortisol has a majorimpact on protein, fat and carbohydrate-metabolism, the skeleton,the cardiovascular and immune system as well as the brain [2].
Prolonged glucocorticoid excess as seen in Cushing’s syndromecan have devastating effects on health. Patients with Cushings syn-drome have increased cardiovascular risk [3], decreased bone min-eral density, increased fracture risk [4,5], cognitive dysfunction andimpaired quality of life (QoL) [6,7]. Even mildly, pathologicallyincreased endogenous cortisol production has negative impact onQoL [8], cardiovascular [9] and skeletal health [10,11].
Studies on the relationship between urinary cortisol excretionand cardiovascular risk factors are sparse in the general popula-tion. An association between high urinary cortisol and adverse car-diovascular profile has been observed in some, but not in other,small studies of selected subjects [12–15]. Also, cortisol concentra-tion in urine in young women and healthy older men has beenassociated with decreased bone mineral density and increasedfracture risk [16,17]. To our knowledge, the association betweenurinary cortisol excretion and QoL in the general population hasnot been studied before.
72 O. Ragnarsson et al. / Steroids 101 (2015) 71–77
The aim of this study was to analyse the association betweenurinary cortisol excretion, a surrogate measure of glucocorticoidexposure, and cardiovascular risk factors, bone measures, fracturesand QoL in a population sample. We hypothesized that higher cor-tisol excretion was associated with adverse cardiovascular riskprofile, worse skeletal health and QoL.
2. Material and methods
2.1. Study design and participants
In 1995, a random population sample of 1200 men and 1200women, aged between 25 years and 64 years, from Gothenburg,Sweden, was invited to participate in the World HealthOrganization MONItoring of trends and determinants inCArdiovascular disease (WHO MONICA), a project conducted in38 countries worldwide [18]. The participation rate was 67%, 746men and 870 women. Extended bone and body composition mea-surements and hormonal blood sampling were performed on arandomly selected subset of participants (n = 608), including everyfourth woman aged between 25– and 44 and every fourth man inall age groups, 25–64 years and all women in the age group 45–64 years. In 2008, these subjects were invited to a re-examination[19]. The participation rate was 67% (n = 412). Non-attendance wasdue to decease, travelling, living abroad, difficult family circum-stances, or unwillingness to participate.
The study group of the current analysis was the individuals whowere re-examinated in 2008 [19]. Of 412 subjects, 64 wereexcluded; 53 did not collect 24-h urine, 8 had inadequate urinesamples (<0.75 L/24-h) and three had systematic glucocorticoidtherapy. Of the remaining 348 subjects who were included in thestudy, 276 (79%) were women and 72 (21%) were men.
2.2. Anthropometry and blood pressure
Body height was measured to the nearest 0.5 cm. Body weightwas measured to the nearest 0.1 kg in the fasting state with thesubject in light clothes. Body mass index (BMI) was calculated asweight/height2 (kg/m2). Waist circumference was measured witha soft tape midway between the lowest rib margin and the iliaccrest in the standing position. The hip circumference was mea-sured over the widest part of the gluteal region and the waist/hipcircumference ratio was calculated. A single operator performed allthe anthropometric measurements.
Blood pressure was measured with a random-zero sphygmo-manometer (Hawksley & Sons) and reported as the mean of threeconsecutive measurements in a sitting position.
2.3. Body composition and bone measurement
Fat-free mass and body fat were estimated using impedancemeasurements (SEAC Multiple frequency bioimpedance meter,model SFB 2, UniQuest Ltd, Queensland, Australia), based on totalbody resistance and reactance [20].
Bone measurements were performed by using QuantitativeUltrasound Measurement (QUS; LUNAR Achilles, Madison, WI,USA) on the right calcaneus with the subject in a sitting position[19]. High-frequency ultrasound waves were used to measure thevelocity of the ultrasound signal [speed of sound (SOS)] and thefrequency attenuation [broadband ultrasound attenuation (BUA)],and stiffness index, expressed as a percentage of the result fromyoung adults, calculated. The standard error for SOS was 3.7(0.3%), 2.2 (2.2%) for BUA and 1.9 (2.8%) for stiffness [21].
2.4. Questionnaires
Self-reported health related QoL was evaluated by three ques-tionnaires; the Nottingham Health Profile (NHP) [22,23],Psychological General Well-Being (PGWB) [24] and the ShortForm 36 (SF-36) [25,26]. The NHP includes 38 statements,answered by yes or no, that are divided into six dimensions: pain,energy, sleep, emotional reactions, social isolation, and physicalmobility. The scores range between 0 and 100 where low scoreindicates a good QoL. The PGWB contains 22 items, with a six-grade response format, divided into six dimensions: anxiety,depressed mood, positive well-being, self-control, general health,and vitality. Also, all the questions are summarized into an overallwell-being score, i.e. total score. The maximum PGWB score is 132where a high score indicates a good QoL. The Short Form 36 (SF-36)includes 36 questions that are divided into eight scales; physicalfunctioning, role-physical, bodily pain, general health, vitality,social functioning, role-emotional and mental health that can besummarized further into two measures; physical and mentalhealth [25]. A high score indicates a good QoL.
Psychological stress was asked for where 1 = no stress, 2 = somestress experience at some points, 3 = some stress periods duringthe last 5 years, 4 = several stress periods during the recent 5 years,5 = continuous stress during the last year and 6 = continuous stressduring the last 5 years. Stress was defined as feeling tense, irri-tated, and anxious or having sleep disturbances due to problemsat home or at work.
Physical activity during work and leisure time, graded 1–4(low–high), were assessed with a self-administered validatedquestionnaire [27].
2.5. Other measurements
X-ray-verified fractures were retrieved from the Gothenburghospital registers and via the National Board of Health andWelfare, Stockholm, Sweden. Osteoporotic fractures were regis-tered according to ICD 10 codes S32, S42, S52, S62, S72, S82, S92and T08 (wrist, upper arm, hip, ankle, lower leg and vertebrae).
Ongoing pharmacological treatment was asked for and codedaccording to the Anatomical Therapeutic Chemical (ATC)Classification System.
Metabolic syndrome was defined according to the criteria pub-lished in 2005 by the International Diabetes Foundation [28]. Thisincluded waist circumference P80 cm for women and P94 cm formen and two of the following: (a) triglycerides P1.7 mmol/l orlipid-lowering treatment; (b) HDL-cholesterol <1.29 mmol/l forwomen, <1.03 for men; (c) blood pressure P130/85 mmHg or anti-hypertensive treatment; (d) f-glucose P5.6 mmol/L or diabetesmellitus type 2.
Insulin resistance (IR) was calculated according to the homeo-static model assessment (HOMA-IR) as: (fasting plasma insulinconcentration (mU/l) � f-plasma glucose (mmol/l))/22.5, wherethe output of the model was calibrated to give a normal IR of 1[29].
Menstruations and age at menopause (the last bleeding) wereasked for and serum follicle stimulating hormone FSH wasanalysed.
2.6. Biochemical analyses
Venous blood samples were drawn between 8 and 10 am afteran overnight fast, in menstruating women on cycle day 7–9. Formeasurement of urinary free cortisol (UFC), 24-h urine was sam-pled from 355 subjects of whom 325 had two adequate samples(>0.75 L/24-h) and 23 had one sample. For patients with two sam-plings the mean UFC was calculated.

Table 1Subject characteristics of the study population.
Women(N = 276)
Men (N = 72) P
Age 64.0 ± 8.5 60.3 ± 10.2 <0.001Age group 1 – 38–47 years, n 17 11Age group 2 – 48–57 years, n 38 16Age group 3 – 58–67 years, n 118 24Age group 4 – 68–77 years, n 103 21
Urinary free cortisol (nmol/L/24-h)* 153 ± 71 230 ± 120 <0.001Serum cortisol (nmol/L)* 421 ± 139 452 ± 113 0.2
Height (cm) 163 ± 6 177 ± 7 <0.001Weight (kg) 71 ± 13 85 ± 12 <0.001BMI (kg/m2) 26.6 ± 4.8 27.1 ± 3.3 0.2Waist (cm) 88 ± 12 99 ± 12 <0.001Smokers, n (%) 27 (10) 7 (10) 1.0
Myocardial infarction, n (%) 4 (1) 4 (6) <0.05Stroke, n (%) 14 (5) 3 (4) 0.8Metabolic syndrome, n (%) 87 (32) 28 (39) 0.2Systolic blood pressure (mmHg) 133 ± 22 137 ± 20 0.1Diastolic blood pressure (mmHg) 79 ± 10 82 ± 10 <0.01Total cholesterol (mmol/L)* 5.6 ± 1.0 5.3 ± 0.9 <0.05LDL cholesterol (mmol/L)* 3.5 ± 0.9 3.5 ± 0.8 0.5HDL cholesterol (mmol/L)* 1.8 ± 0.4 1.5 ± 0.4 <0.001Triglycerides (mmol/L)* 1.2 ± 0.6 1.3 ± 0.6 <0.01Glucose (mmol/L) * 5.2 ± 1.2 5.4 ± 1.0 <0.05Insulin (mU/L)* 6.7 (4.8–9.6) 8.5 (5.8–14.8) <0.01HOMA-IR index 1.5 (1.0–2.3) 2.1 (1.3–3.6) <0.001Fat-free mass (kg) 44 ± 5 62 ± 7 <0.001Fat mass (kg) 27 ± 10 23 ± 9 <0.01
Osteoporotic fractures, n (%) 91 (33) 12 (17) <0.01Treatment with bisphosphonates, n
(%)11 (4) 1 (1) 0.3
Treatment with calcium andvitamin D, n (%)
29 (11) 1 (1) <0.05
BUA (dB/MHz) 106 ± 11 114 ± 11 <0.001SOS (m/s) 1507 ± 29 1523 ± 32 <0.001Stiffness index (%) 72 ± 14 83 ± 15 <0.001
Nottingham Health ProfilePain (score) 0 (0–18) 0 (0–7) <0.05Energy (score) 0 (0–37) 0 (0–0) 0.4Sleep (score) 11 (0–37) 0 (0–11) <0.01Emotional reactions (score) 0 (0–15) 0 (0–8) 0.1Social isolation (score) 0 (0–0) 0 (0–0) 0.6Physical mobility (score) 0 (0–10) 0 (0–10) 0.3
Psychological General Well-BeingAnxiety (score) 25 (21–28) 27 (23–29) <0.05Depressed mood (score) 16 (15–18) 18 (15–18) <0.05Positive well-being (score) 17 (15–19) 18 (15–20) 0.06Self-control (score) 15 (16–17) 17 (15–18) 0.2General health (score) 15 (13–17) 16 (14–17) <0.05Vitality (score) 18 (15–20) 19 (15–21) 0.2
Short Form 36Physical functioning 85 (66–95) 95 (85–100) <0.001Role-physical 100 (50–100) 100 (75–100) <0.05Bodily pain 78 (56–90) 84 (68–100) <0.01General health 70 (50–85) 78 (61–94) 0.06Vitality 70 (50–85) 80 (58–90) <0.05Social functioning 100 (75–100) 100 (88–100) 0.2Role-emotional 100 (67–100) 100 (100–100) 0.1Mental health 80 (68–92) 88 (77–96) <0.05
O. Ragnarsson et al. / Steroids 101 (2015) 71–77 73
2.7. Analytical methods
UFC was measured using (SpectRia Cortisol 125I, OrionDiagnostica Oy, Finland). The coefficient of variation (CV) was6.8% at 61 nmol/L, and 5.5% at 160 and 380 nmol/L. The limit ofquantification was 20 nmol/L. Serum cortisol was measured usingcompetitive electrochemiluminescence immunoassay (CortisolElecsys, Roche Diagnostics Scandinavia AB) with CV of 5% at 500and 800 nmol/L, and 7% at 100 nmol/L.
Plasma glucose concentrations were measured using an enzy-matic hexokinase method (GLU, Roche/Hitachi; RocheDiagnostics, GmbH, Mannheim, Germany) with a 4% CV at concen-trations between 5 and 15 mmol/l, and serum insulin with animmunometric two-step sandwich method and chemilumines-cence technology (Insulin Elecsys, Roche Diagnostics GmbH,Mannheim, Germany) with a 10% CV at 6, 20 and 70 mU/l. Total-,LDL- and HDL-cholesterol and triglycerides (TG) in serum weremeasured with an enzymatic method (Boehringer, Mannheim,Germany). The CV for total-cholesterol was 3% at serum concentra-tions between 4 and 6 mmol/l, 4% for LDL at concentrationsbetween 2 and 5 mmol/l, 5% for HDL-cholesterol at concentrationsbetween 1 and 2 mmol/l and 4% for TG at concentrations between1 and 2 mmol/l.
2.8. Ethical considerations
The study was approved by the Ethics Committee of theUniversity of Gothenburg (Dnr 088/06 approved 2006-05-22) andthe National Data Inspection Board. All participants gave theirwritten informed consent. The study was conducted according tothe Declaration of Helsinki.
2.9. Statistical methods
All statistical analyses were performed with SPSS, version 22.0for windows. Data are presented as mean ± SD or median (25–75percentiles). For comparison between two groups we usedunpaired t-test for normally distributed data and Mann–WhitneyU-test for non-normally distributed data. Similarly, for comparisonbetween more than two groups we used one-way ANOVA orKruskal–Wallis tests as appropriate. For proportions, Pearson Chi-square or Fishers exact test were used. Simple correlation was cal-culated by using Pearsons method. In an unadjusted analysis thesubjects were categorised into two groups based on whether theUFC was below (low UFC) or above (high UFC) the median UFC con-centration in the study population.
The influence of UFC on cardiovascular risk factors, bone mea-surements and QoL were also analysed by multiple linear or logis-tic regression models with backward elimination after adjustmentfor age, gender and BMI. All variables that were not normally dis-tributed were log transformed before they were analysed in theregression analyses.
A P-value of <0.05 was considered statistically significant.
Data is presented as mean ± standard deviation or median (interquartile range).Abbreviations: BMI, body mass index; BUA, broadband ultrasound attenuation; HDL,high density lipoprotein; HOMA1-IR, homeostatic model assessment-insulin resis-tance; LDL, low density lipoprotein; SOS, speed of sound.
* Normal reference ranges are: Urinary free cortisol 55–215 nmol/24-h; serumcortisol 200–800 nmol/L; Total cholesterol 3.9–7.8 mmol/L; LDL cholesterol2.0–5.3 mmol/L; HDL cholesterol 0.8–2.1 mmol/L for men, 1.0–2.7 mmol/L forwomen; Triglycerides 0.45–2.6 mmol/L; Glucose 4.2–6.3 mmol/L; Insulin <20 mU/L.
3. Results
3.1. Subjects characteristics
The subject’s characteristics are presented in Table 1. Of 276women, 256 (93%) were postmenopausal. Oral contraceptivesand oestrogen hormone replacement therapy was used in 8.0% ofthe women.
Three hundred-twenty-five (92%) subjects provided two 24-hurine samples. There was a strong correlation between UFC inthe first and the second sampling (r = 0.77, P < 0.001). Men had
higher UFC (230 ± 120 nmol/L) compared to women (153 ± 71;P < 0.001). Subjects in the youngest age group had significantlyhigher UFC compared to older subjects (Fig. 1a; P < 0.001). In a

Fig. 2. The association between age and urinary free cortisol in 276 women (blackcircles) and 72 men (grey boxes).
74 O. Ragnarsson et al. / Steroids 101 (2015) 71–77
regression analysis, female sex [B �67 (95% CI �87 to �45),P < 0.001] and age [B �2.7 (95% CI �3.7 to �1.7), P < 0.001] wereindependently associated with lower UFC (Fig. 2). Weight, heightand BMI were not associated with UFC.
Serum cortisol concentrations did not differ between men(452 ± 113 nmol/L) and women (421 ± 139 nmol/L; P = 0.15).Serum cortisol in women was lower in the youngest age quartile(355 ± 126 nmol/L) compared to the oldest quartile(444 ± 142 nmol/L; P < 0.05), otherwise no difference was observedbetween age groups neither in men nor in women (Fig. 1b).
3.2. Cardiovascular status
One-hundred-fifteen subjects (33%) fulfilled the criteria for themetabolic syndrome. Fifty-six subjects (16%) were receiving med-ical treatment for dyslipidaemia, three (0.9%) for type 1 and seven(2.0%) for type 2 diabetes mellitus. Eight (2.3%) patients had previ-ously had myocardial infarction and 17 (4.9%) stroke.
Fat mass tended to be lower and fat-free mass to be higher insubjects with high UFC compared with individuals with low UFC(Table 2 and Fig. 3). In a regression analysis, after adjustment forage, gender and BMI, higher UFC concentration was associatedwith higher fat-free mass (P < 0.01), lower triglycerides (P < 0.01)and tended to be associated with lower fat mass (kg) (P = 0.07).UFC was not associated with waist circumference, systolic or dias-tolic blood pressure, total-, LDL-and HDL-cholesterol, glucose,insulin or HOMA-IR.
Sixty-five patients with UFC lower than the median had themetabolic syndrome compared to 50 of those with UFC abovethe median (Table 2, P = 0.09). In a logistic regression analysis,higher UFC concentration tended to be negatively associated themetabolic syndrome (P = 0.07).
3.3. Fractures and bone measurement
One-hundred and three (30%) individuals had previously suf-fered from an osteoporotic fracture. Thirty (8.6%) were taking cal-cium and vitamin D supplementation and 12 (3.4%) were receivingtreatment with bisphosphonates.
BUA, SOS and stiffness index were higher in subjects with highUFC, compared with individuals with low UFC (Table 2 and Fig. 4).After adjustments for age, gender and BMI, higher UFC was inde-pendently associated with higher BUA (P < 0.05), SOS (P < 0.05)
Fig. 1. Urinary free cortisol (a) and serum cortisol (b) concentrations in 276 women (blacconfidence interval.
and stiffness index (P < 0.05). The associations remained significantafter adding serum concentrations of vitamin D, calcium andparathyroid hormone, physical activity, smoking habits and theuse of oestrogen, bisphosphonate, calcium and vitamin D supple-mentation to the regression models (P < 0.01 for BUA, SOS and stiff-ness index). Previous fractures related to minimal trauma weremore common among patients with low UFC. No associationbetween fractures and UFC was found after adjustment for age,gender and BMI.
3.4. Quality of life, general well-being and stress
Patients with high UFC had a more favourable outcome on threeof six dimensions on the PGWB and four of eight scales on the SF-36 (Table 2). In a regression analysis, after adjustment for age, gen-der and BMI, higher UFC was associated with better general healthmeasured with PGWB (P < 0.01) and SF-36 (P = 0.001). UFC wasneither associated with any other domains of the PGWB and SF-36, self-perceived stress nor any of the six domains of the NHP.
k bars) and 72 men (grey bars) divided into age categories. Error bars represent 95%
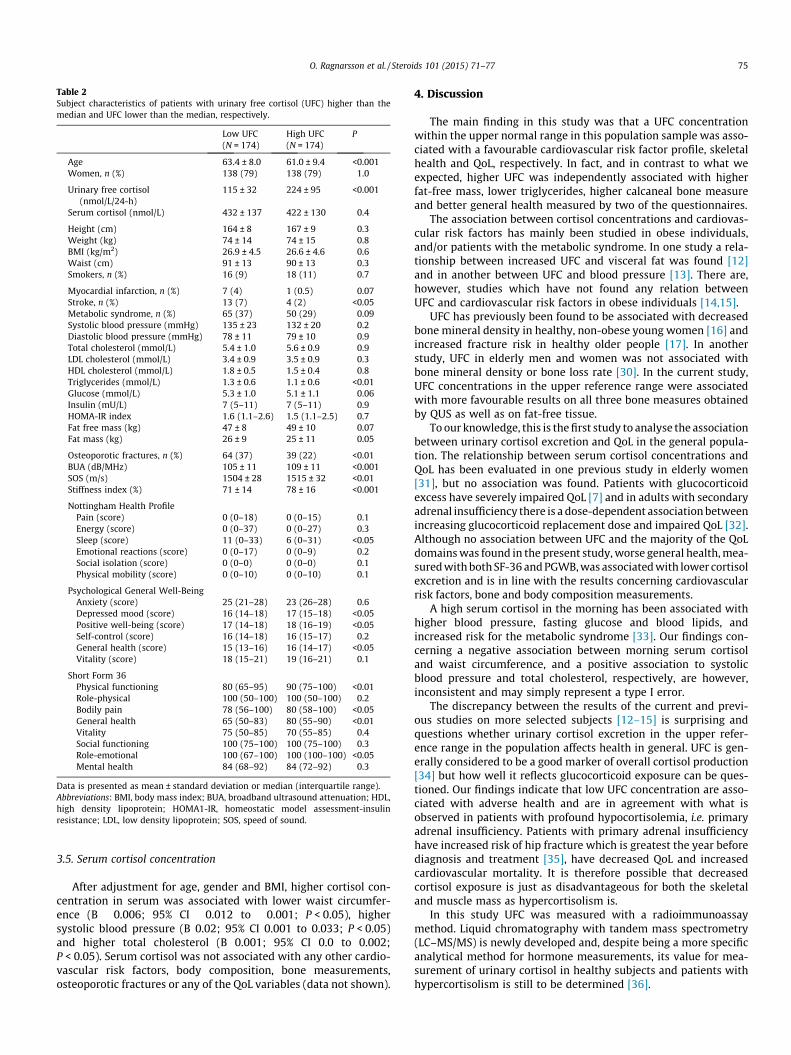
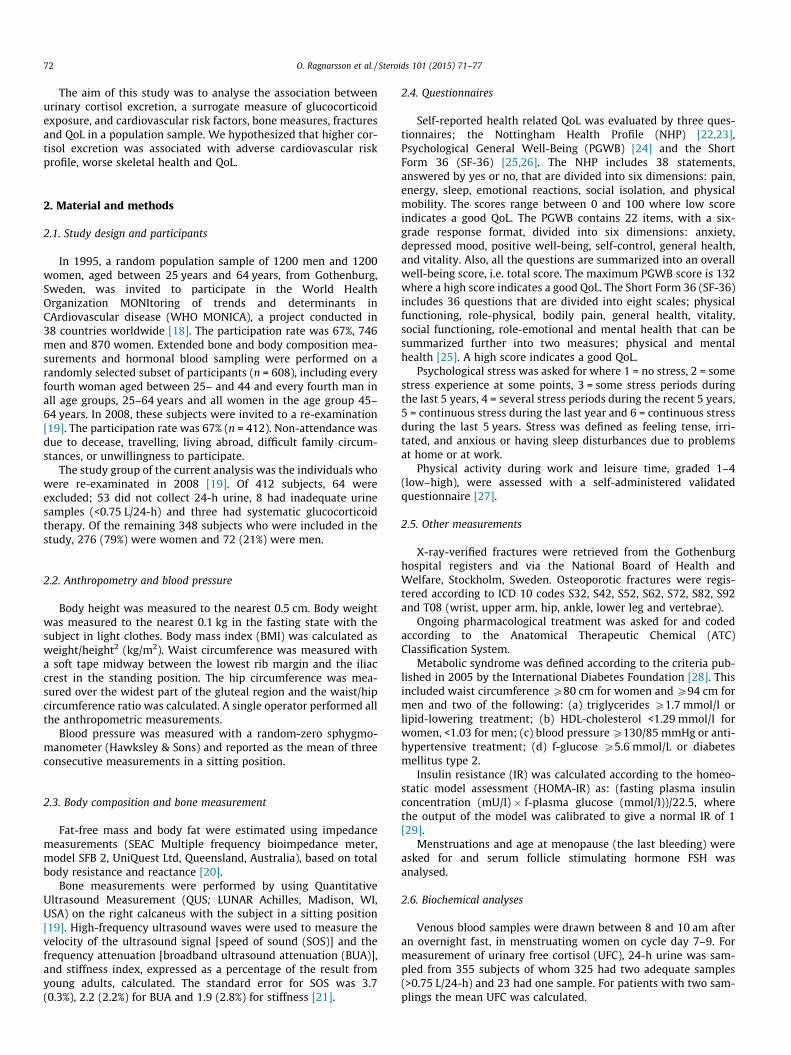
Table 2Subject characteristics of patients with urinary free cortisol (UFC) higher than themedian and UFC lower than the median, respectively.
Low UFC(N = 174)
High UFC(N = 174)
P
Age 63.4 ± 8.0 61.0 ± 9.4 <0.001Women, n (%) 138 (79) 138 (79) 1.0
Urinary free cortisol(nmol/L/24-h)
115 ± 32 224 ± 95 <0.001
Serum cortisol (nmol/L) 432 ± 137 422 ± 130 0.4
Height (cm) 164 ± 8 167 ± 9 0.3Weight (kg) 74 ± 14 74 ± 15 0.8BMI (kg/m2) 26.9 ± 4.5 26.6 ± 4.6 0.6Waist (cm) 91 ± 13 90 ± 13 0.3Smokers, n (%) 16 (9) 18 (11) 0.7
Myocardial infarction, n (%) 7 (4) 1 (0.5) 0.07Stroke, n (%) 13 (7) 4 (2) <0.05Metabolic syndrome, n (%) 65 (37) 50 (29) 0.09Systolic blood pressure (mmHg) 135 ± 23 132 ± 20 0.2Diastolic blood pressure (mmHg) 78 ± 11 79 ± 10 0.9Total cholesterol (mmol/L) 5.4 ± 1.0 5.6 ± 0.9 0.9LDL cholesterol (mmol/L) 3.4 ± 0.9 3.5 ± 0.9 0.3HDL cholesterol (mmol/L) 1.8 ± 0.5 1.5 ± 0.4 0.8Triglycerides (mmol/L) 1.3 ± 0.6 1.1 ± 0.6 <0.01Glucose (mmol/L) 5.3 ± 1.0 5.1 ± 1.1 0.06Insulin (mU/L) 7 (5–11) 7 (5–11) 0.9HOMA-IR index 1.6 (1.1–2.6) 1.5 (1.1–2.5) 0.7Fat free mass (kg) 47 ± 8 49 ± 10 0.07Fat mass (kg) 26 ± 9 25 ± 11 0.05
Osteoporotic fractures, n (%) 64 (37) 39 (22) <0.01BUA (dB/MHz) 105 ± 11 109 ± 11 <0.001SOS (m/s) 1504 ± 28 1515 ± 32 <0.01Stiffness index (%) 71 ± 14 78 ± 16 <0.001
Nottingham Health ProfilePain (score) 0 (0–18) 0 (0–15) 0.1Energy (score) 0 (0–37) 0 (0–27) 0.3Sleep (score) 11 (0–33) 6 (0–31) <0.05Emotional reactions (score) 0 (0–17) 0 (0–9) 0.2Social isolation (score) 0 (0–0) 0 (0–0) 0.1Physical mobility (score) 0 (0–10) 0 (0–10) 0.1
Psychological General Well-BeingAnxiety (score) 25 (21–28) 23 (26–28) 0.6Depressed mood (score) 16 (14–18) 17 (15–18) <0.05Positive well-being (score) 17 (14–18) 18 (16–19) <0.05Self-control (score) 16 (14–18) 16 (15–17) 0.2General health (score) 15 (13–16) 16 (14–17) <0.05Vitality (score) 18 (15–21) 19 (16–21) 0.1
Short Form 36Physical functioning 80 (65–95) 90 (75–100) <0.01Role-physical 100 (50–100) 100 (50–100) 0.2Bodily pain 78 (56–100) 80 (58–100) <0.05General health 65 (50–83) 80 (55–90) <0.01Vitality 75 (50–85) 70 (55–85) 0.4Social functioning 100 (75–100) 100 (75–100) 0.3Role-emotional 100 (67–100) 100 (100–100) <0.05Mental health 84 (68–92) 84 (72–92) 0.3
Data is presented as mean ± standard deviation or median (interquartile range).Abbreviations: BMI, body mass index; BUA, broadband ultrasound attenuation; HDL,high density lipoprotein; HOMA1-IR, homeostatic model assessment-insulinresistance; LDL, low density lipoprotein; SOS, speed of sound.
O. Ragnarsson et al. / Steroids 101 (2015) 71–77 75
3.5. Serum cortisol concentration
After adjustment for age, gender and BMI, higher cortisol con-centration in serum was associated with lower waist circumfer-ence (B �0.006; 95% CI �0.012 to �0.001; P < 0.05), highersystolic blood pressure (B 0.02; 95% CI 0.001 to 0.033; P < 0.05)and higher total cholesterol (B 0.001; 95% CI 0.0 to 0.002;P < 0.05). Serum cortisol was not associated with any other cardio-vascular risk factors, body composition, bone measurements,osteoporotic fractures or any of the QoL variables (data not shown).
4. Discussion
The main finding in this study was that a UFC concentrationwithin the upper normal range in this population sample was asso-ciated with a favourable cardiovascular risk factor profile, skeletalhealth and QoL, respectively. In fact, and in contrast to what weexpected, higher UFC was independently associated with higherfat-free mass, lower triglycerides, higher calcaneal bone measureand better general health measured by two of the questionnaires.
The association between cortisol concentrations and cardiovas-cular risk factors has mainly been studied in obese individuals,and/or patients with the metabolic syndrome. In one study a rela-tionship between increased UFC and visceral fat was found [12]and in another between UFC and blood pressure [13]. There are,however, studies which have not found any relation betweenUFC and cardiovascular risk factors in obese individuals [14,15].
UFC has previously been found to be associated with decreasedbone mineral density in healthy, non-obese young women [16] andincreased fracture risk in healthy older people [17]. In anotherstudy, UFC in elderly men and women was not associated withbone mineral density or bone loss rate [30]. In the current study,UFC concentrations in the upper reference range were associatedwith more favourable results on all three bone measures obtainedby QUS as well as on fat-free tissue.
To our knowledge, this is the first study to analyse the associationbetween urinary cortisol excretion and QoL in the general popula-tion. The relationship between serum cortisol concentrations andQoL has been evaluated in one previous study in elderly women[31], but no association was found. Patients with glucocorticoidexcess have severely impaired QoL [7] and in adults with secondaryadrenal insufficiency there is a dose-dependent association betweenincreasing glucocorticoid replacement dose and impaired QoL [32].Although no association between UFC and the majority of the QoLdomains was found in the present study, worse general health, mea-sured with both SF-36 and PGWB, was associated with lower cortisolexcretion and is in line with the results concerning cardiovascularrisk factors, bone and body composition measurements.
A high serum cortisol in the morning has been associated withhigher blood pressure, fasting glucose and blood lipids, andincreased risk for the metabolic syndrome [33]. Our findings con-cerning a negative association between morning serum cortisoland waist circumference, and a positive association to systolicblood pressure and total cholesterol, respectively, are however,inconsistent and may simply represent a type I error.
The discrepancy between the results of the current and previ-ous studies on more selected subjects [12–15] is surprising andquestions whether urinary cortisol excretion in the upper refer-ence range in the population affects health in general. UFC is gen-erally considered to be a good marker of overall cortisol production[34] but how well it reflects glucocorticoid exposure can be ques-tioned. Our findings indicate that low UFC concentration are asso-ciated with adverse health and are in agreement with what isobserved in patients with profound hypocortisolemia, i.e. primaryadrenal insufficiency. Patients with primary adrenal insufficiencyhave increased risk of hip fracture which is greatest the year beforediagnosis and treatment [35], have decreased QoL and increasedcardiovascular mortality. It is therefore possible that decreasedcortisol exposure is just as disadvantageous for both the skeletaland muscle mass as hypercortisolism is.
In this study UFC was measured with a radioimmunoassaymethod. Liquid chromatography with tandem mass spectrometry(LC–MS/MS) is newly developed and, despite being a more specificanalytical method for hormone measurements, its value for mea-surement of urinary cortisol in healthy subjects and patients withhypercortisolism is still to be determined [36].
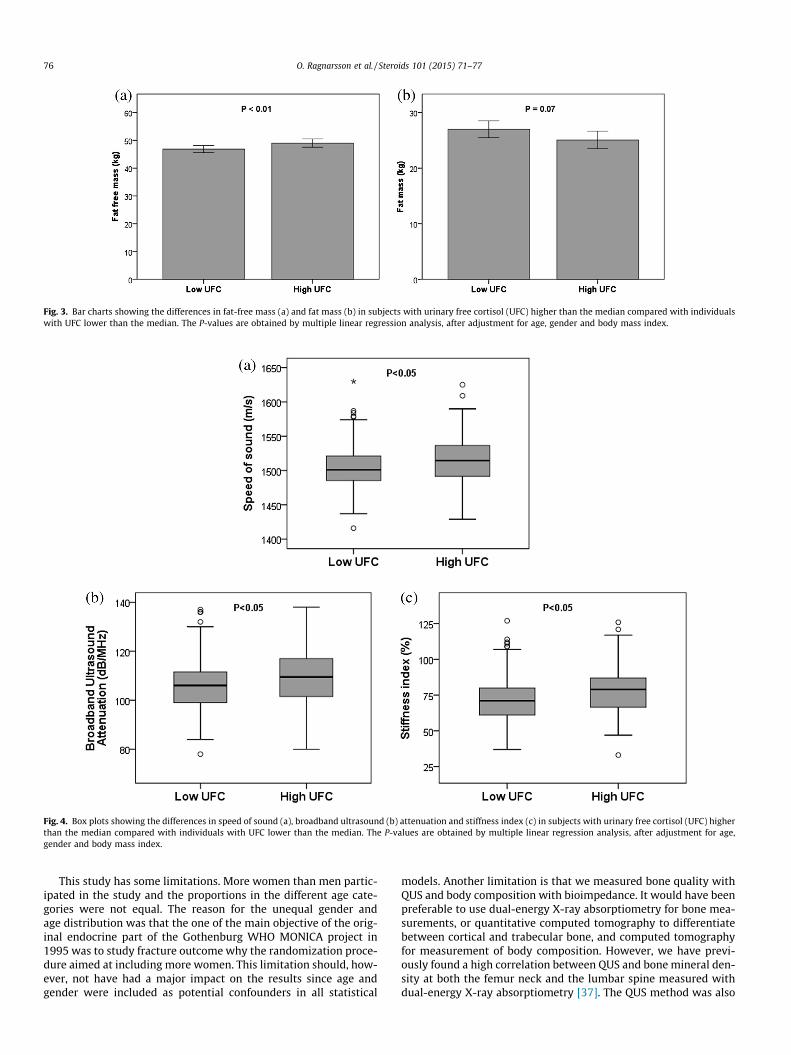
Fig. 3. Bar charts showing the differences in fat-free mass (a) and fat mass (b) in subjects with urinary free cortisol (UFC) higher than the median compared with individualswith UFC lower than the median. The P-values are obtained by multiple linear regression analysis, after adjustment for age, gender and body mass index.
Fig. 4. Box plots showing the differences in speed of sound (a), broadband ultrasound (b) attenuation and stiffness index (c) in subjects with urinary free cortisol (UFC) higherthan the median compared with individuals with UFC lower than the median. The P-values are obtained by multiple linear regression analysis, after adjustment for age,gender and body mass index.
76 O. Ragnarsson et al. / Steroids 101 (2015) 71–77
This study has some limitations. More women than men partic-ipated in the study and the proportions in the different age cate-gories were not equal. The reason for the unequal gender andage distribution was that the one of the main objective of the orig-inal endocrine part of the Gothenburg WHO MONICA project in1995 was to study fracture outcome why the randomization proce-dure aimed at including more women. This limitation should, how-ever, not have had a major impact on the results since age andgender were included as potential confounders in all statistical
models. Another limitation is that we measured bone quality withQUS and body composition with bioimpedance. It would have beenpreferable to use dual-energy X-ray absorptiometry for bone mea-surements, or quantitative computed tomography to differentiatebetween cortical and trabecular bone, and computed tomographyfor measurement of body composition. However, we have previ-ously found a high correlation between QUS and bone mineral den-sity at both the femur neck and the lumbar spine measured withdual-energy X-ray absorptiometry [37]. The QUS method was also
O. Ragnarsson et al. / Steroids 101 (2015) 71–77 77
able to identify patients at high risk for osteoporotic fractures[21,38]. Similarly, bioimpedance is generally considered a fairlyreliable method for evaluation of body composition in subjectswith stable water and electrolyte balance [39]. Finally, we analyzedthe association between UFC and several outcome variables. Someof the statistically significant associations may therefore be a find-ing by chance, i.e. a type I error.
In conclusion, in this originally random population based study,higher urinary cortisol excretion was associated with a favourablecardiovascular risk profile, bone measures and QoL, respectively.Cortisol in the physiological range may have an anabolic effectand corroborates its role as necessity of life.
Acknowledgments
The excellent help with coordinating the participants from SigridLindstrand, Stella Nakate and the whole staff at the Section forPreventive Cardiology and the Centre for Endocrinology andMetabolism is gratefully acknowledged. The laboratory help fromKristina A Johansson at the Department of Clinical Chemistry is alsogratefully acknowledged. This project has received financial supportfrom the ALF agreement at the Sahlgrenska University Hospital; theSwedish Board of Health and Welfare; the Swedish Heart-LungFoundation, and the Swedish council for working life and socialresearch.
References
[1] Zanchi NE, Filho MA, Felitti V, Nicastro H, Lorenzeti FM, Lancha Jr AH.Glucocorticoids: extensive physiological actions modulated through multiplemechanisms of gene regulation. J Cell Physiol 2010;224:311–5.
[2] Vandevyver S, Dejager L, Libert C. Comprehensive overview of the structureand regulation of the glucocorticoid receptor. Endocr Rev 2014;35:671–93.
[3] Giordano R, Picu A, Marinazzo E, D’Angelo V, Berardelli R, Karamouzis I, et al.Metabolic and cardiovascular outcomes in patients with Cushing’s syndromeof different aetiologies during active disease and 1 year after remission. ClinEndocrinol (Oxf) 2011;75:354–60.
[4] Kristo C, Jemtland R, Ueland T, Godang K, Bollerslev J. Restoration of thecoupling process and normalization of bone mass following successfultreatment of endogenous Cushing’s syndrome: a prospective, long-termstudy. Eur J Endocrinol 2006;154:109–18.
[5] Vestergaard P, Lindholm J, Jorgensen JO, Hagen C, Hoeck HC, Laurberg P, et al.Increased risk of osteoporotic fractures in patients with Cushing’s syndrome.Eur J Endocrinol 2002;146:51–6.
[6] Ragnarsson O, Johannsson G. Cushing’s syndrome: a structured short- andlong-term management plan for patients in remission. Eur J Endocrinol/EurFed Endocrine Soc 2013;169:R139–52.
[7] Lindsay JR, Nansel T, Baid S, Gumowski J, Nieman LK. Long-term impairedquality of life in Cushing’s syndrome despite initial improvement after surgicalremission. J Clin Endocrinol Metab 2006;91:447–53.
[8] Iacobone M, Citton M, Viel G, Boetto R, Bonadio I, Mondi I, et al. Adrenalectomymay improve cardiovascular and metabolic impairment and ameliorate qualityof life in patients with adrenal incidentalomas and subclinical Cushing’ssyndrome. Surgery 2012;152:991–7.
[9] Tauchmanova L, Rossi R, Biondi B, Pulcrano M, Nuzzo V, Palmieri EA, et al.Patients with subclinical Cushing’s syndrome due to adrenal adenoma haveincreased cardiovascular risk. J Clin Endocrinol Metab 2002;87:4872–8.
[10] Chiodini I, Morelli V, Masserini B, Salcuni AS, Eller-Vainicher C, Viti R, et al.Bone mineral density, prevalence of vertebral fractures, and bone quality inpatients with adrenal incidentalomas with and without subclinicalhypercortisolism: an Italian multicenter study. J Clin Endocrinol Metab2009;94:3207–14.
[11] Morelli V, Eller-Vainicher C, Salcuni AS, Coletti F, Iorio L, Muscogiuri G, et al.Risk of new vertebral fractures in patients with adrenal incidentaloma withand without subclinical hypercortisolism: a multicenter longitudinal study. JBone Miner Res 2011;26:1816–21.
[12] Marin P, Darin N, Amemiya T, Andersson B, Jern S, Bjorntorp P. Cortisolsecretion in relation to body fat distribution in obese premenopausal women.Metab, Clin Exp 1992;41:882–6.
[13] de Jongh RT, Ijzerman RG, Serne EH, van Weissenbruch MM, Voordouw JJ,Delemarre-van de Waal HA, et al. Urinary cortisol is inversely associated withcapillary recruitment in women: a potential explanation for the cortisol-bloodpressure relationship. Clin Sci 2007;113:83–91.
[14] Abraham SB, Rubino D, Sinaii N, Ramsey S, Nieman LK. Cortisol, obesity, andthe metabolic syndrome: a cross-sectional study of obese subjects and reviewof the literature. Obesity 2013;21:E105–17.
[15] Stewart PM, Boulton A, Kumar S, Clark PM, Shackleton CH. Cortisol metabolismin human obesity: impaired cortisone–cortisol conversion in subjects withcentral adiposity. J Clin Endocrinol Metab 1999;84:1022–7.
[16] Bedford JL, Barr SI. The relationship between 24-h urinary cortisol and bone inhealthy young women. Int J Behav Med 2010;17:207–15.
[17] Greendale GA, Unger JB, Rowe JW, Seeman TE. The relation between cortisolexcretion and fractures in healthy older people: results from the MacArthurstudies-Mac. J Am Geriatr Soc 1999;47:799–803.
[18] Wilhelmsen L, Johansson S, Rosengren A, Wallin I, Dotevall A, Lappas G. Riskfactors for cardiovascular disease during the period 1985–1995 in Goteborg,Sweden. The GOT-MONICA Project. J Intern Med 1997;242:199–211.
[19] Trimpou P, Lindahl A, Lindstedt G, Olerod G, Wilhelmsen L, Landin-Wilhelmsen K. Secular trends in sex hormones and fractures in men andwomen. Eur J Endocrinol/Eur Fed Endocrine Soc 2012;166:887–95.
[20] Kyle UG, Bosaeus I, De Lorenzo AD, Deurenberg P, Elia M, Gomez JM, et al.Bioelectrical impedance analysis–part I: review of principles and methods.Clin Nutr 2004;23:1226–43.
[21] Landin-Wilhelmsen K, Johansson S, Rosengren A, Dotevall A, Lappas G,Bengtsson BA, et al. Calcaneal ultrasound measurements are determined byage and physical activity. Studies in two Swedish random population samples.J Intern Med 2000;247:269–78.
[22] Hunt SM, McEwen J. The development of a subjective health indicator. SociolHealth Illn 1980;2:231–46.
[23] Wiklund I. The Nottingham Health Profile–a measure of health-related qualityof life. Scand J Prim Health Care Suppl 1990;1:15–8.
[24] Dupuy H. The Psychological General Well-being (PGWB) Index. In: Wenger NK,Mattson ME, Furburg CD, Elinson J, editors. Assessment of quality of life inclinical trials of cardiovascular therapies. New York: Le Jacq Publishing; 1984.p. 170–83.
[25] Ware Jr JE, Sherbourne CD. The MOS 36-item short-form health survey (SF-36).I. Conceptual framework and item selection. Med Care 1992;30:473–83.
[26] Sullivan M, Karlsson J, Ware Jr JE. The Swedish SF-36 Health Survey–I.Evaluation of data quality, scaling assumptions, reliability and constructvalidity across general populations in Sweden. Soc Sci Med 1995;41:1349–58.
[27] Saltin B, Grimby G. Physiological analysis of middle-aged and old formerathletes. Comparison with still active athletes of the same ages. Circulation1968;38:1104–15.
[28] Zimmet P, Magliano D, Matsuzawa Y, Alberti G, Shaw J. The metabolicsyndrome: a global public health problem and a new definition. J AtherosclerThromb 2005;12:295–300.
[29] Matthews DR, Hosker JP, Rudenski AS, Naylor BA, Treacher DF, Turner RC.Homeostasis model assessment: insulin resistance and beta-cell function fromfasting plasma glucose and insulin concentrations in man. Diabetologia1985;28:412–9.
[30] Reynolds RM, Dennison EM, Walker BR, Syddall HE, Wood PJ, Andrew R, et al.Cortisol secretion and rate of bone loss in a population-based cohort of elderlymen and women. Calcif Tissue Int 2005;77:134–8.
[31] Lebrun CE, van der Schouw YT, de Jong FH, Pols HA, Grobbee DE, Lamberts SW.Relations between body composition, functional and hormonal parametersand quality of life in healthy postmenopausal women. Maturitas2006;55:82–92.
[32] Ragnarsson O, Mattsson AF, Monson JP, Filipsson Nystrom H, Akerblad AC,Koltowska-Haggstrom M, et al. The relationship between glucocorticoidreplacement and quality of life in 2737 hypopituitary patients. Eur JEndocrinol/Eur Fed Endocrine Soc 2014;171:571–9.
[33] Park SB, Blumenthal JA, Lee SY, Georgiades A. Association of cortisol and themetabolic syndrome in Korean men and women. J Korean Med Sci2011;26:914–8.
[34] Rosmalen JG, Kema IP, Wust S, van der Ley C, Visser ST, Snieder H, et al. 24 hurinary free cortisol in large-scale epidemiological studies: short-term andlong-term stability and sources of variability. Psychoneuroendocrinology2014;47:10–6.
[35] Bjornsdottir S, Saaf M, Bensing S, Kampe O, Michaelsson K, Ludvigsson JF. Riskof hip fracture in Addison’s disease: a population-based cohort study. J InternMed 2011;270:187–95.
[36] Raff H, Auchus RJ, Findling JW, Nieman LK. Urine free cortisol in the diagnosisof Cushing’s syndrome: is it worth doing and if so, how? J Clin EndocrinolMetab 2015;100:395–7.
[37] Trimpou P, Bosaeus I, Bengtsson BA, Landin-Wilhelmsen K. High correlationbetween quantitative ultrasound and DXA during 7 years of follow-up. Eur JRadiol 2010;73:360–4.
[38] Hadji P, Imani P, Wuster C, Hars O, Albert U, Kyvernitakis I. Comparison ofdual-energy X-ray absorptiometry with six quantitative ultrasonometrydevices in women with hip fractures. Climacteric 2014:1–8.
[39] Kyle UG, Bosaeus I, De Lorenzo AD, Deurenberg P, Elia M, Manuel Gomez J,et al. Bioelectrical impedance analysis-part II: utilization in clinical practice.Clin Nutr 2004;23:1430–53.
Related Documents


