THE ASSOCIATION BETWEEN ORGANIZATIONAL CULTURE AND LEADERSHIP BEHAVIOUR AND ORGANIZATIONAL COMMITMENT, JOB SATISFACTION AND EMPLOYEE PERFORMANCE - A MALAYSIAN PERSPECTIVE. LEE HUEY YIING FACULTY OF BUSINESS AND ACCOUNTANCY UNIVERSITY OF MALAYA JULY 2008

Welcome message from author
This document is posted to help you gain knowledge. Please leave a comment to let me know what you think about it! Share it to your friends and learn new things together.
Transcript

THE ASSOCIATION BETWEEN ORGANIZATIONAL
CULTURE AND LEADERSHIP BEHAVIOUR AND
ORGANIZATIONAL COMMITMENT, JOB SATISFACTION
AND EMPLOYEE PERFORMANCE
- A MALAYSIAN PERSPECTIVE.
LEE HUEY YIING
FACULTY OF BUSINESS AND ACCOUNTANCY
UNIVERSITY OF MALAYA
JULY 2008

The Association between Organizational Culture and Leadership Behaviour and
Organizational Commitment, Job Satisfaction and Employee Performance
- A Malaysian Perspective.
Lee Huey Yiing
Submitted to the Graduate School of Business
Faculty of Business and Accountancy
University of Malaya, in partial fulfillment
of the requirements for the
Degree of Master of Business Administration
July 2008

Abstract
Purpose – This study seeks to investigate the association between different types of
organizational culture and leadership behaviours and organizational commitment, job
satisfaction and employee performance in the Malaysian setting.
Design/methodology/approach – Data was gathered from 238 Malaysian UM MBA
part-time students and the researcher’s working peers. Data on the respondents’
organizational culture and leadership behaviours, and how they affect organizational
commitment, job satisfaction and employee performance, were collected using the
OCI (Wallach, 1983), leadership behaviour questionnaire (Harris and Ogbonna,
2001), ACS (Allen and Meyer, 1990), single global rating for job satisfaction
(Robbins, 2005), and overall performance questionnaire (Motowidlo and Van Scotter,
1994), respectively. Descriptive statistics were reported, followed by factor analysis,
reliability analysis, Pearson correlation and hypotheses testing using hierarchical
multiple regression.
Findings – Generally and with a few exceptions, leadership behaviour was found to
be significantly related to organizational commitment, and organizational culture
played an important role in moderating this relationship. Organizational commitment
was found to be significantly associated with job satisfaction, but not with employee
performance. However, only supportive culture influenced the relationship between
commitment and satisfaction. Possible causes and implications for managers are
discussed.
Originality/value – This article contributes to the existing pool of knowledge on the
relationships between leadership behaviours, organizational culture, organizational
commitment, job satisfaction and employee performance. Different aspects of these
ii

variables were tested, so as to provide a wider and more comprehensive
understanding on the factors which affect organizations and employees.
Keywords – Leadership, Organizational Culture, Commitment, Satisfaction,
Performance, Malaysia.
Category – Research Paper
iii

Acknowledgements
I would like to thank Dr. Kamarul Zaman bin Ahmad for his guidance throughout this
project and for the valuable input in completing this dissertation.
I am also grateful for the concern and support from my family members and friends
during this time.
iv

Table of Contents
1. INTRODUCTION................................................................................................1
1.1. Background ...................................................................................................1
1.2. Purpose and significance of the study..........................................................2
1.3. Research Questions/Objectives of the study.................................................3
1.4. Scope of the study..........................................................................................3
1.5. Limitations of the study ................................................................................4
1.6. Organization of the study..............................................................................4
2. LITERATURE REVIEW AND THEORETICAL FRAMEWORK ..............6
2.1. Antecedents and independent variables .......................................................6
2.1.1. Leadership behaviour ............................................................................6
2.1.2. Organizational culture.........................................................................11
2.2. Dependent variables....................................................................................16
2.2.1. Organizational commitment.................................................................16
2.2.2. Job satisfaction ....................................................................................19
2.2.3. Employee performance ........................................................................20
2.3. Relationship between variables ..................................................................20
2.4. Demographics..............................................................................................23
2.5. Theoretical framework................................................................................24
3. RESEARCH METHODOLOGY .....................................................................26
3.1. Development of hypotheses.........................................................................26
3.2. Selection of instruments and measures......................................................27
3.2.1. Organizational culture.........................................................................27
3.2.2. Leadership behaviour ..........................................................................28
3.2.3. Organizational commitment.................................................................29
3.2.4. Job satisfaction ....................................................................................30
3.2.5. Employee performance ........................................................................31
3.2.6. Classification questions .......................................................................32
3.3. Sampling design and data collection..........................................................32
3.4. Data analysis techniques ............................................................................34
4. RESULTS AND DISCUSSION ........................................................................35
4.1. Summary statistics of respondents .............................................................35
4.2. Analyses of measures ..................................................................................37
v

4.2.1. Descriptive statistics ............................................................................37
4.2.2. Factor Analysis ....................................................................................38
4.2.3. Reliability Analysis ..............................................................................40
4.2.4. Correlation Analyses ...........................................................................40
4.3. Testing of hypotheses ..................................................................................43
4.3.1. Leadership behaviour, organizational culture and organizational
commitment ..........................................................................................................47
4.3.2. Organizational commitment, organizational culture, job satisfaction
and employee performance ..................................................................................49
4.4. Summary of research results ......................................................................51
5. CONCLUSION AND RECOMMENDATIONS.............................................53
5.1. Summary of findings...................................................................................53
5.2. Suggestions for future research .................................................................57
5.3. Implications.................................................................................................58
REFERENCES...........................................................................................................60
vi

List of Figures
Figure 2.1 : Theoretical Framework 25
List of Tables
Table 4.1 : Summary statistics of respondents 35
Table 4.2 : Descriptive Statistics 38
Table 4.3 : KMO and Bartlett’s Test 39
Table 4.4 : Reliability Analysis 40
Table 4.5 : Correlation 42
Table 4.6 : Results of Hierarchical Regression Analysis of Organizational
Commitment on Leadership Behaviours in Bureaucratic Culture
44
Table 4.7 : Results of Hierarchical Regression Analysis of Organizational
Commitment on Leadership Behaviours in Innovative Culture
44
Table 4.8 : Results of Hierarchical Regression Analysis of Organizational
Commitment on Leadership Behaviours in Supportive Culture
45
Table 4.9 : Results of Hierarchical Regression Analysis of Job Satisfaction and
Employee Performance on Organizational Commitment in Bureaucratic Culture
45
Table 4.10 : Results of Hierarchical Regression Analysis of Job Satisfaction and
Employee Performance on Organizational Commitment in Innovative Culture
46
Table 4.11 : Results of Hierarchical Regression Analysis of Job Satisfaction and
Employee Performance on Organizational Commitment in Supportive Culture
46
vii
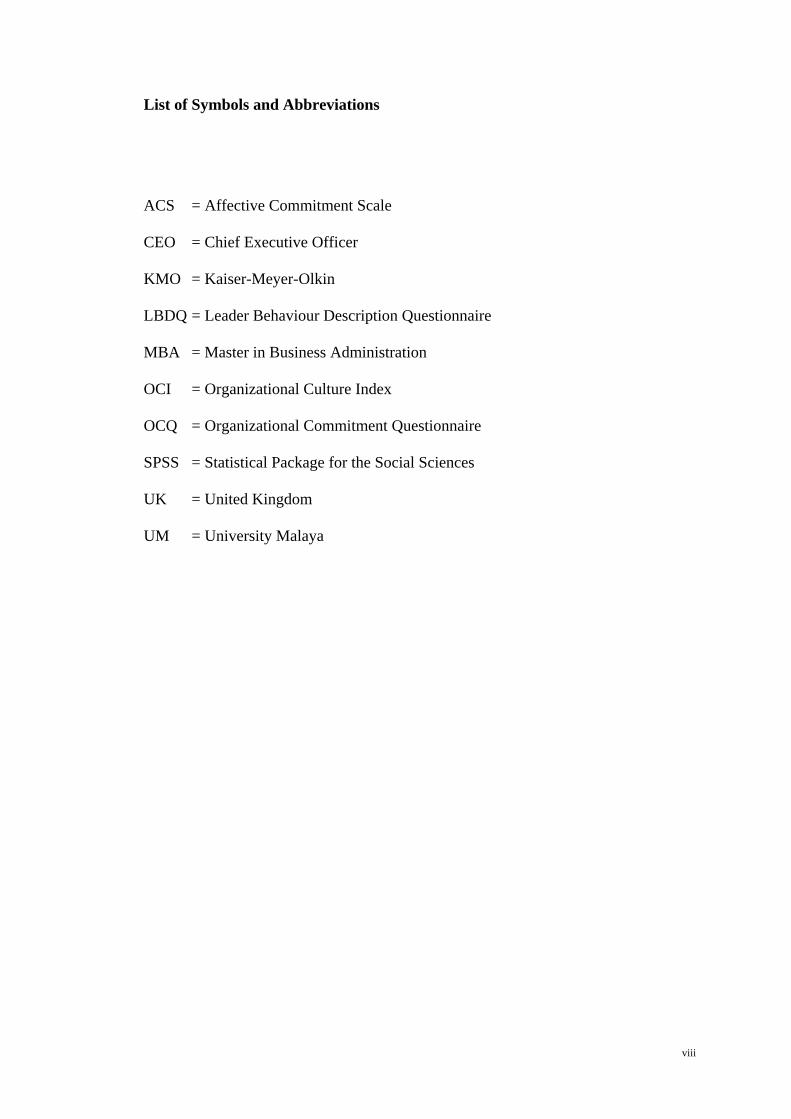
List of Symbols and Abbreviations
ACS = Affective Commitment Scale
CEO = Chief Executive Officer
KMO = Kaiser-Meyer-Olkin
LBDQ = Leader Behaviour Description Questionnaire
MBA = Master in Business Administration
OCI = Organizational Culture Index
OCQ = Organizational Commitment Questionnaire
SPSS = Statistical Package for the Social Sciences
UK = United Kingdom
UM = University Malaya
viii

1
1. INTRODUCTION
In this chapter, the background of this research project is presented, followed
by an elaboration of the purpose and significance of the study. The main research
question is stated, which is further clarified by defining the scope of the study. After
that, the limitations of the study are stated. Lastly, the organization of the rest of the
project will be described at the end of this chapter.
1.1. Background
In 1998, a survey of most admired companies conducted by Fortune indicated
CEO respondents’ belief that corporate culture was their most important lever in
enhancing their key capabilities. Given the importance of organizational culture and
its effects on organizational outcomes (such as organizational commitment, job
satisfaction and employee performance), it is currently one of the hottest business
topics in both academic research and the popular business press. Today's business
leaders are confronted with frequent unpredictable challenges, which require high
degree of flexibility on their part. Recent organizational crises have emphasized the
need for leadership and personal commitment from organizational decision makers
which, then, become more critical for organization success (Earle, 1996). Hence,
organizational culture and leadership behaviour, along with their effects on
organizational commitment, job satisfaction and employee performance are some of
the crucial elements in determining the effectiveness, competitiveness and success of
organizations in facing today’s challenges. These have practical implications for
managers and consultants in management development, and ultimately could enhance
superior performance of the managers in the organization.

1.2. Purpose and significance of the study
Organizational culture is known to have a significant effect on how employees
view their organizational responsibilities and their commitment. The pioneering work
of Deal and Kennedy (1982) incited the interest of researchers and consultants to the
concept of corporate culture, and how these values and philosophy guide the
employees’ behaviour in the organization towards greater success. Leaders affect their
subordinates both directly through their interactions and also through the
organization's culture (Li, 2004). With increasing globalization, greater knowledge of
the interaction of these factors in non-western cultures can be beneficial for assessing
the effectiveness of current theories as well as benefiting practicing leaders and
decision makers.
The commitment of the people in the organization is also essential to ensure
the successful implementation of the organizational policies and plans. It is argued,
that while shaping the appropriate values or culture that is important to the
organization, ensuring the necessary level of commitment among employees or
managers are unequivocally important so as to ensure successful implementation of
the organizational strategies and plans of actions (Rashid et al., 2003). Job satisfaction
is an important component in the field of organizational behaviour, as it is related to
critical organizational outcomes such as absenteeism, turnover and performance.
A search in major and leading business journals through databases such
ProQuest and Emerald yielded much literature and findings from past research on
antecedents and outcomes of organizational culture, leadership behaviour,
organizational commitment, job satisfaction and employee performance. Much of the
research are focused on independent relationships, such as culture performance, or
2

commitment and performance (Rashid et al., 2003). Only a handful looked into
identifying precise relationships between multiple areas of organization behaviour and
the application of such findings to the corporate firms.
It is noted that even with the literature found from various databases, there is
lesser amount that focuses on the Asian setting, and very few that are relevant or
specific to Malaysia. This study intends to contribute to the existing knowledge base,
in particular, from a Malaysian perspective.
1.3. Research Questions/Objectives of the study
The objective of the research is to examine the association between different
types of organizational culture and leadership behaviours and organizational
commitment, job satisfaction and employee performance in the Malaysian setting.
1.4. Scope of the study
It is known that there are a number of other antecedents, moderators,
mediators and/or consequents to the factors selected for this study. For example, work
ethics (Yousef, 2001), person-organization fit (Silverthorne, 2004), national culture
(Lok and Crawford, 2004), task structure and role ambiguity (Tan, 2005), and
turnover (Poh, 2002). Much of these are focused on independent relationships, such as
culture performance, or commitment and performance (Rashid et al., 2003). In fact,
only a handful of research looked into identifying precise relationships between
multiple areas of organization behaviour and the application of such findings to the
corporate firms.
3

For the purpose of this study, Li’s (2004) conceptualization of the
relationships between leadership behaviour, organizational culture, organizational
commitment, job satisfaction and employee performance is partially adapted. This is
because there is a sizable number of past researches which has demonstrated the
importance of these factors organization behaviour and performance, as reported by
Yousef (2000), Lok and Crawford (2000) and Rashid et al. (2003).
The scope of the study covers MBA students in Universiti Malaya as well as
some working peers and colleagues, which the author considers to be, although not
entirely, at least a representative of the Malaysian working population.
1.5. Limitations of the study
It is noted that the use of convenience sampling is a major limitation of this
study, as findings from the study sample cannot be confidently generalized to the
population. However, the benefits of time and cost-effectiveness, and the fact that
adequate information about the study population is not readily available for
probability sampling, are taken into account when deciding the sampling method for
this study.
1.6. Organization of the study
The remaining of this report will include a comprehensive literature review of
the independent and dependent variables that are considered in this study, which leads
to the development of hypotheses and a theoretical framework. This is followed by a
review on the research methodology, which encompasses the sub-sections of selection
of instruments and measures, sampling design and data collection, and data analysis
4

techniques. Next, the results and discussion are reported, which includes a summary
of the respondents’ statistics, analyses of measures, testing of hypotheses, and a
summary of research results. Lastly, the conclusion and recommendations based on
this study are presented, which includes a summary of findings, suggestions for future
research, and practical implications for managers.
5

2. LITERATURE REVIEW AND THEORETICAL FRAMEWORK
In this chapter, a literature review on the antecedents and/or independent
variables will be presented first, followed by that of the dependent variables. In
addition, a review of past research findings on the relationships between these
variables, and a review of literature on the effects of demographics on the variables,
are also included. Finally, the theoretical framework for this study is presented at the
end of the chapter.
2.1. Antecedents and independent variables
2.1.1. Leadership behaviour
Daft (2005) defined leadership as an influence relationship among leaders and
followers who intend real changes and outcomes that reflect their shared purposes.
Over the course of time, a number of dimensions or facets of leadership behaviour
have been developed and applied as researchers continue to discover what contributes
to leadership success and failures. These included, among others, autocratic versus
democratic, task-oriented versus people-oriented, and the contingency approaches.
The first studies on leadership behaviours, conducted by Kurt Lewin and his
associates in the early 20th century, identified the autocratic and democratic
leadership styles. An autocratic leader is one who centralizes authority and derives
power from position, control of rewards, and coercion. A democratic leader, on the
other hand, delegates authority to others, encourages participation, relies on
subordinates’ knowledge for completion of tasks, and depends on subordinate respect
for influence (Daft, 2005).
6

Subsequently, a series of studies on leadership behaviour (e.g. by Ohio State
University, University of Michigan and University of Texas) were designed and
conducted in the 1950s. This resulted in the development of reliable questionnaires
(e.g. Leader Behaviour Description Questionnaire, LBDQ) and models (e.g.
Leadership Grid by Blake and Mouton) that would, in time, dominate much of
leadership-related research and literature for years to come. Overall, the research into
the behaviour approach culminated in two major types of leadership behaviours –
people-oriented and task-oriented. People-oriented leadership, which is equivalent to
consideration (Ohio State University), employee-centered (University of Michigan)
and concern for people (University of Texas), focuses on the human needs of
subordinates, respects their ideas and feelings, and places importance on establishing
mutual trust. Task-oriented leadership, which is equivalent to initiating structure
(Ohio State University), job-centered (University of Michigan) and concern for
production (University of Texas), focuses on directing activities towards efficiency,
cost-cutting, and scheduling, with an emphasis on goal achievements and work
facilitation.
Theories of leadership then evolved to adopt a contingency approach when
researchers failed to find universal leader traits or behaviours that would determine
effective leadership. Following this school of thought, research focused on the
situation in which leadership occurred. Leadership styles can be contingent upon
situational variables, nature of the followers and the leader him- or herself. Many
theories have been put forward, including Fiedler’s contingency theory, Hersey and
Blanchard’s situational theory, the Vroom-Jago contingency model, Leader-Member
Exchange theory, and the Path-Goal theory.
7

Currently, the most influential contingency approach to leadership is the Path-
Goal theory (Robbins, 2005). This theory was developed by Robert House, and
extracts key elements from the Ohio State leadership research on initiating structure
and consideration, and the expectancy theory of motivation. The theory states that the
main goal of the leader is to help subordinates attain the subordinates' goals
effectively, and to provide them with the necessary direction and support to achieve
their own goals as well as those of the organization (Silverthorne, 2001).
In this theory, the leader increases follower motivation by either (1) clarifying
the follower’s path to the rewards that are available, or (2) increasing the rewards that
the follower values and desires. Path clarification means that the leader works with
subordinates to help them identify and learn the behaviours that will lead to successful
task accomplishment and organizational rewards. Increasing rewards means that the
leader talks with subordinates to learn which rewards are important to them, i.e.
whether they desired intrinsic rewards from the work itself, or extrinsic rewards such
as raises or promotions. The leader’s job is to increase personal payoffs to
subordinates for goal attainment and make the paths to the payoffs clear and easy to
travel.
The Path-Goal theory suggests a fourfold classification of leader behaviours :
directive, supportive, participative, and achievement-oriented styles. It is assumed that
leaders are flexible, and that the same leader can display any or all of these behaviours
depending on the situation.
Directive leadership tells subordinates exactly what they are supposed to do.
Leader behaviour includes planning, making schedules, setting performance goals and
behaviour standards, and stressing adherence to rules and regulations. Mehta et al.
(2003) added that this leadership style provides specific direction to subordinate work
8

activity by organizing and defining the task environment, assigning the necessary
functions to be performed, specifying rules, regulations and procedures to be followed
in accomplishing tasks, clarifying expectations, scheduling work to be done,
establishing communication networks, and evaluating work group performance.
Directive leadership behaviour is similar to the initiating structure or task-oriented
leadership style described earlier.
Supportive leadership shows concern for subordinates’ well-being and
personal needs. Leadership behaviour is open, friendly, and approachable, and the
leader creates a team climate and treats subordinates as equals. Mehta et al. (2003)
further elaborated that a supportive leadership style is one in which the leader creates
a facilitative task environment of psychological support, mutual trust and respect,
helpfulness, and friendliness. Supportive leadership is similar to the consideration or
people-oriented leadership described earlier.
Participative leadership consults with subordinates about decisions. Leader
behaviour includes asking for opinions and suggestions, encouraging participation in
decision making, and meeting discussion and written suggestions, similar to the
selling style in the Hersey and Blanchard model mentioned previously. Various
studies in organizational behaviour have found that allowing subordinates to
participate in decision-making leads to increased motivation (Mehta et al., 2003).
Achievement-oriented leadership sets clear and challenging goals for
subordinates. Leader behaviour stresses high-quality performance and improvement
over current performance. Achievement-oriented leaders also show confidence in
subordinates and assist them in learning how to achieve high goals.
The two situational contingencies in the Path-Goal theory are (1) the personal
characteristics of group members, and (2) the work environment. Personal
9

characteristics can include subordinates’ locus of control, experience, perceived
ability, skills, needs and motivations. Work environment contingencies can include
the degree of task structure, the nature of the formal authority system, and the work
group itself. Task structure describes the extent to which tasks are defined and have
explicit job descriptions and work procedures. The formal authority system includes
the amount of legitimate power used by leaders and the extent to which policies and
rules constrain employees’ behaviour. Work group characteristics consist of the
educational level of subordinates and the quality of relationships among them. The
outcome of matching the right leadership behaviour with the right situation, while
taking into consideration the various subordinate and work environment
contingencies, will result in favorable outcomes such as increased effort, improved
satisfaction and performance (Daft, 2005).
The study of leadership behaviours as conceptualized under the Path-Goal
theory has been applied in many types of researches. For example, in the context of
international marketing channels (Mehta et al., 2003), small and middle-sized firms
(Li, 2004), company managers (Silverthorne, 2001), steel industry (Downey et al.
1975), automotive industry (Chang et al., 2003), and market orientation of UK firms
(Harris and Ogbonna, 2001). Researchers of marketing channels in the distribution
and logistics industry have attempted to show the path-goal theory's usefulness as a
strategy to secure the compliance of channel members and have conceptually and
empirically linked it to channel related phenomena such as manifest conflict, co-
operation, channel efficiency and effectiveness, role clarity, role conflict, role
ambiguity, and channel member satisfaction (Mehta et al., 1996)
Not everyone agrees that a particular style of leadership will result in the most
effective form of organizational behaviour. Different styles were needed for different
10

situations and each leader needs to know when to exhibit a particular approach. No
one leadership style is ideal for every situation, since a leader may have knowledge
and skills to act effectively in one situation but may not emerge as effectively in a
different situation (Rad and Yarmohammadian, 2006).
Past research on corporate leadership in Malaysia frequently focused on its
unique, multi-ethnic, multi-cultural and collectivist society. No one, distinct
management style can be identified, and it is acknowledged that leadership in
Malaysia is deeply entrenched and connected to its diverse Asian culture, traditions
and values. Hence, commonly-accepted leadership theories from the west, and how it
is thought to affect other organizational behaviour factors, may not be directly
transferable to the Malaysian context.
Organizational success in obtaining its goals and objectives depends on
managers and their leadership style. By using appropriate leadership styles, managers
can affect employee job satisfaction, commitment and productivity.
2.1.2. Organizational culture
Organizational culture is generally seen as a set of key values, assumptions,
understandings, and norms that is shared by members of an organization and taught to
new members as correct (Daft, 2005). It is argued that organizational culture may be
the critical key that managers can use to direct the course of their firms (Smircich,
1993).
The organizational culture is likened to a double-edged sword. A culture
creates distinctions between one organization and others, conveys a sense of identity
for its members, facilitates commitment towards the organization’s goals, enhances
the stability of the social system, reduces ambiguity, and serves as a control
11

mechanism that guides and shapes the attitudes and behaviour of employees.
However, a culture can also become a liability when it becomes too strongly
entrenched within the norms, values and mindsets of the employees and resist changes
– a culture can become a barrier to change, diversity and other transformations
required for the organization to adapt in today’s dynamic, globalized business
environment.
The study on organizational culture can take on a multitude of aspects.
Robbins (2005) elaborated that there are seven primary characteristics that, in
aggregate, capture the essence of an organization’s culture : innovation and risk
taking, attention to detail, outcome orientation, people orientation, team orientation,
aggressiveness and stability. Each of these characteristics can exist on a continuum
from low to high. Robbins (2005) furthermore explained that the organizational
culture can be visualized as an intervening variable; employees form an overall
subjective perception of the organization based on these seven factors, and these
perceptions, favorable or otherwise, affects employee performance and satisfaction,
with the impact being greater for stronger cultures.
Daft (2005) discussed on the three levels of corporate culture, with each level
becoming less obvious, i.e. visible, expressed values and underlying assumptions and
deep beliefs. Culture can also be determined by its strength, which is the degree of
agreement among employees about the importance of specific values and ways of
doing things. A strong culture is one which core values are both intensely held and
widely shared, and hence have greater impact on employee behaviour. Research has
found that a strong culture is linked to high agreement among members, increases
12

behavioural consistency, builds cohesiveness, loyalty and organizational commitment,
and more importantly, reduces turnover (Robbins, 2005).
In addition, culture can be viewed as being adaptive or unadaptive. In adaptive
cultures, leaders are concerned with customers and those internal people, processes
and procedures that bring about useful change. Contrary to this, leaders in unadaptive
cultures are concerned with themselves or their own special projects, and their values
tend to discourage risk-taking and change. Thus, a strong culture is not enough; a
healthy, adaptive culture is also essential to encourage the organization to progress
towards the right direction (Daft, 2005).
It is widely accepted that within an organization, a dominant culture that
expresses the core values that are shared by a majority of the organization’s members
exist alongside with smaller subcultures which reflect common problems, situations,
or experiences that certain groups of members face.
Organizational cultures can be assessed along many dimensions, resulting in
conceptually different, but fundamentally similar, models and theories. Daft (2005), in
his review of a number of past research literature, presented one such model which
focuses on two specific dimensions : (1) the extent to which the competitive
environment requires flexibility or stability, and (2) the extent to which the
organization’s strategic focus and strength is internal or external. The four categories
of culture associated with these differences resulting from this type of assessment are
adaptability, achievement, clan and bureaucratic cultures. Each culture has a different
set of values – adaptability culture is characterized by values that support the
organization’s ability to interpret and translate signals from the environment into new
behaviour responses; achievement culture is characterized by a clear vision of the
organization’s goals and leaders’ focus on the achievement of specific targets; clan
13

culture has an internal focus on the involvement and participation of employees to
meet changing expectations from the external environment; and bureaucratic culture
has an internal focus and consistency orientation for a stable environment.
Several typologies for analyzing organizational culture have been proposed.
For example, the competing values model introduced by Quinn and Cameron (1983),
Quinn and Rohrbaugh (1983), and Cameron and Freeman (1991) which identified
four types of culture : clan, adhocracy, hierarchy and market cultures. Another
example was developed by Goffee and Jones (1998). Goffee and Jones (1998)
categorized organizational culture into four main types based on two dimensions:
sociability and solidarity. The four types of culture identified are communal culture,
fragmented culture, networked culture and mercenary culture.
According to Wallach (1983), an organization's culture can be a combination
of three categories – bureaucratic, innovative or supportive – to varying degrees.
Wallach’s (1983) framework is adapted for the purpose of this study. Wallach (1983)
states that the Organizational Culture Index (OCI) profiles culture on the three
stereotypical dimensions, and the "flavor" of an organization can be derived from the
combination of these three dimensions.
A bureaucratic culture is hierarchical and compartmentalized. There are clear
lines of responsibility and authority. Work is organized and systematic, and this
culture is usually based on control and power. Such organizations are stable, cautious,
usually mature, power-oriented, established, solid, regulated, ordered, structured,
procedural and hierarchical.
14

An innovative culture refers to a creative, results-oriented, challenging work
environment. It is characterized as being entrepreneurial, ambitious, stimulating,
driven and risk-taking.
A supportive culture exhibits teamwork and a people-oriented, encouraging,
trusting work environment. These places are warm, “fuzzy” places to work in, and
people are generally friendly, fair and helpful to each other. Supportive cultures are
characterized as open, harmonious, trusting, safe, equitable, sociable, relationships-
oriented, humanistic, collaborative, and likened to an extended family.
Wallach (1983) further elaborated that an employee can be more effective in
his or her current job, and realize his or her best potentials, when there is a match
between the individual’s motivation and the organizational culture. For instance, by
using McClelland’s three social motivators : a person with a high need of
achievement will thrive in an innovative culture, an affiliative person will fare well in
a supportive culture, and a power-oriented person will perform best in a bureaucratic
culture. This has significant implications in recruitment, management, motivation,
development and retention of employees.
A comprehensive background review on each of the three dimensions of
organizational culture as described by Wallach (1983) can be found in Shadur et al.
(1999).
Few published studies exist that describe the corporate culture of Malaysian
companies, which are generally are more or less similar to other fast-growing,
competitive, developing Asian countries. Government offices are generally
considered to be bureaucratic, while public-listed and private companies are more
entrepreneurial in nature. This is exemplified in a study done by Rashid et al. (2003),
15

where companies listed in the Kuala Lumpur Stock Exchange were found to be
predominantly competitive, and value risk-taking, demanding goals, and market
superiority. Another study by Rashid et al. (2004) showed that among manufacturers
in the country, many had mercenary culture, which emphasized on strategy and
winning in the marketplace. To balance this, there exists to a lesser degree consensual,
network and supportive cultures within Malaysian companies, consistent to the
cultural values of Malaysian managers. Tradition, loyalty, teamwork and personal
commitment are among some of the values prevalent in Malaysian companies.
2.2. Dependent variables
2.2.1. Organizational commitment
The topic of organizational commitment has received a great deal of interest in
the past decade and numerous studies have been directed at determining its causal
antecedents, as cited by Lok and Crawford (2001). The issue of commitment is
particularly important for managers in organizations. With the increasing speed and
scale of change in organizations, managers are constantly seeking ways to generate
employees' commitment and competitive advantage. Organizational commitment has
received substantial attention in past research due to its significant impact on work
attitudes such as job satisfaction, performance, absenteeism, and turnover intentions.
(Lok and Crawford, 2001; Yousef, 2000).
Organizational commitment has been defined differently by different scholars
depending on their backgrounds. Organizational commitment refers to an employee’s
belief in the organization’s goals and values, desire to remain a member of the
organization and loyalty to the organization (Mowday et al., 1982). Such goals and
16

value identification serves as another focus of attachment to the organization. This
identification can be enhanced by a clear specification of the rationales of
organization goals and values, sharing the rewards of organization goal attainment
and involvement in goals processes.
Robbins (2005) too, defined organizational commitment similarly, i.e. a state
in which an employee identifies with a particular organization and its goals, and
wishes to maintain membership in the organization. Research has shown that there is
a modest positive relationship between organizational commitment and job
productivity, and evidence demonstrates negative relationships between
organizational commitment and both absenteeism and turnover.
People who are committed to their organization are highly involved in their
organization and identify at its goals and values. Such employees feel a readiness to
exert considerable effect on behalf of the organization, and have a strong desire to
remain an organization member. (Hackett et al., 2001). According to Cole (2000), a
committed worker is one who is a team player, who is willing to make personal
sacrifices for the goal of the company, who believes in the company’s product, who
will recommend the company as among the best places to work, and who is prepared
to stay at the company for at least the next several years, even if offered a modest pay
increase elsewhere.
Allen and Meyer (1990) conceptualized a model of organizational
commitment and identified three components : affective, continuance, and
normative commitment.
As defined by these Allen and Meyer (1990), the affective component of
organizational commitment refers to the employee’s emotional attachment to,
17

identification with, and involvement in, the organization. Much of the research
undertaken in the area of organizational commitment focuses on affective
commitment. For example, the Brunetto and Farr-Wharton (2003) has reviewed a
sizable literature and found that influence of affective commitment has been
investigated in areas such as job satisfaction, communication, turnover, intent to leave
and stress, perceived fairness and supportiveness of managers, perceived ability to be
promoted and job performance. Studies have also been conducted under various
contexts, such as in nursing, citizen behaviours and commitment to a particular
community.
The continuance component refers to commitment based on the costs that the
employee associates with leaving the organization. In a study by Mayer and Schoorm
(1992), they defined continuance commitment as the desire to remain a member of the
organization. An individual who is high in continuance commitment is motivated to
participate. Continuance commitment and the Side-Bet Theory of Commitment were
popularized by Becker (1960). According to this theory, employees make certain
investments or side-bets in their organization, for example, tenure towards pensions,
promotions and work relationships. These investments are such costs which reduce
the attractiveness of other employment opportunities. Commitment is, therefore, an
outcome of inducements or exchanges between an individual and an organization.
The normative component refers to the employee’s feeling of obligation to
remain with the organization. Normative involvement has received less research
attention.
Many studies have revealed that the level of organizational and managerial
support an employee feels, their involvement in decision making (Porter et al., 1974;
Mowday et al., 1982) the amount of feedback received about job performance and job
18

role (Mathieu and Zajac, 1990), leadership behaviours and organizational culture
influence whether a person has high or low organizational commitment.
2.2.2. Job satisfaction
Robbins (2005) defined job satisfaction as a collection of feelings that an
individual holds towards his or her job. Numerous factors influence employee job
satisfaction, including: salaries, fringe benefits, achievement, autonomy, recognition,
communication, working conditions, job importance, co workers, degree of
professionalism, organizational climate, interpersonal relationships, working for a
reputable agency, supervisory support, positive affectivity, job security, workplace
flexibility, working within a team environment and genetic factors. Sources of low
satisfaction are associated with working with unskilled or inappropriately trained
staff, laborious tasks such as documentation, repetition of duties, tensions within role
expectations, role ambiguity, role conflict, job/patient care, feeling overloaded, the
increasing need to be available for overtime, relations with co-workers, personal
factors and organizational factors (Rad and Yarmohammadian, 2006).
In a review of past literature, Rad and Yarmohammadian (2006) justified the
need to investigate job satisfaction is exemplified in the seemingly observed
relationship between the levels of job dissatisfaction, absenteeism, grievance
expression, tardiness, low morale and high turnover. Job satisfaction is an immediate
antecedent of intention to leave the workplace and turnover. Unsatisfied workers will
leave their jobs more than their satisfied colleagues. Furthermore, more satisfied
employees have more innovative activities in continuous quality improvement and
more participation in decision-making in organizations.
19

2.2.3. Employee performance
Motowidlo and Van Scotter (1994) proposed two dimensions of employee
performance. Task performance (or technical job performance) is the behaviour
associated with maintaining and servicing an organization's technical core. Contextual
performance (or interpersonal job performance) is a function of one's interpersonal
skill knowledge that supports the broader social environment in which the technical
core must function.
2.3. Relationship between variables
Although a considerable number of researchers have argued that there is a
constant interplay between organizational culture and leadership, there are limited
empirical studies examining the relation between leadership and culture as well as
their joint effect on important organizational outcomes (Hickman and Silva, 1984;
Peters and Waterman, 1982; Schein, 1985; Sergiovanni and Corbally, 1984; Smith
and Peterson, 1988; Tichy and Cohen, 1997; Trice and Beyer, 1993). More
importantly, research has found that the harmonious combination of appropriate
leadership behaviours with certain types of organizational cultures can positively
influence employees’ performance (Harris and Ogbonna, 2000; Hickman and Silva,
1984; Lim, 1995).
According to Appelbaum et al. (2004) and Yousef (2000), the relationship
between leadership behaviour and job satisfaction has received a great deal of
attention in past research, however, findings have been mixed (Pool, 1997; Savery,
1994; Yousef, 2000). Research therefore does not directly link employee satisfaction
to a specific leadership style. Instead, many suggest that leadership style needs to
adapt to the culture or situation as it attempts to reduce employee dissatisfaction.
20

According to a comprehensive literature review by Yousef (2000), several
researchers have also looked into the relationship between leadership behaviour and
job performance. Findings were inconsistent as well. A couple of studies in the steel
industry and electronic meeting systems reported higher satisfaction and performance
levels under directive leadership style when given a highly structured task, while
supportive leadership style is preferred for unstructured problems (Downey et al.,
1975; Kahai et al., 1997).
Results from investigations of antecedents of commitment have not been
entirely consistent (Yousef, 2000). Blau (1985) and Williams and Hazer (1986)
reported that consideration leadership style had greater influence on commitment than
a structured or task-oriented one, while Kim (2002) identified a positive relationship
between participative management style and employees' job satisfaction and
commitment.
Organizational culture too, plays an important role in generating commitment
and enhancing performance (Deal and Kennedy, 1982; Lok and Crawford, 2001;
Peters and Waterman, 1982). In particular, studies in various industries and countries
showed that innovative and supportive cultures had strong positive effects on
commitment and job satisfaction, while bureaucratic cultures had a negative impact
(Brewer, 1993; Brewer, 1994; Brewer and Clippard, 2002; Kratrina, 1990; Krausz et
al., 1995; Lok and Crawford, 2000; London and Larsen, 1999; Rashid et al., 2003;
Silverthorne, 2004; Trice and Beyer, 1993; Wallach, 1983).
Yousef (2000) investigated the role of organizational commitment as a
mediator of the relationships between leadership behaviour with job satisfaction and
performance, specifically in a multicultural, non-western country. Results from
various organizations in the United Arab Emirates suggest (in support of many
21

western studies) that those who perceive their superiors as adopting consultative or
participative leadership behaviour are more committed to their organizations, more
satisfied with their jobs, and their performance is high.
When employees are dissatisfied at work, they are less committed and will
look for other opportunities to quit. If opportunities are unavailable, they may
emotionally or mentally “withdraw” from the organization. Thus, organizational
commitment and job satisfaction are important attitudes in assessing employees’
intention to quit and the overall contribution of the employee to the organization.
Many studies across different industries and geographical regions revealed strong
correlations between organizational commitment with job satisfaction (Benkhoff,
1997; Caykoylu et al., 2007; Chen, 2007; Iverson and Roy, 1994; Jernigan et al.,
2002; Leong et al., 1996; Lok and Crawford, 2001; Mathieu and Hamel, 1989;
Mathieu and Zajac, 1990; Michaels, 1994; Price and Mueller, 1981; Samad, 2005;
Taunton et al., 1989; Williams and Hazer, 1986; Yousef, 2001), and organizational
commitment with job performance (Baugh and Roberts, 1994; Brett et al., 1995;
Kalleberg and Marsden, 1995; Mathieu and Zajac, 1990; Meyer et al., 1989; Mowday
et al., 1974; Putti et al., 1990; Ward and Davis, 1995; Yousef, 2000). However,
Leong et al. (1994) found a weak correlation between the two variables, Lee and
Mowday (1989) found negligible relationship, and Wright (1997) reported a negative
relationship between the two.
Very few relevant studies in the Malaysian context have been published to
date. Samad (2005) studied 584 managerial-level of employees in Telekom Malaysia,
and reported that job satisfaction did play a positive moderating role in the
relationship between organizational commitment and job performance. Rashid et al.
(2003) surveyed over 200 companies listed in the Kuala Lumpur Stock Exchange.
22

Different types of corporate cultures were found to influence affective commitment,
but overall, corporate culture was found to significantly affect the financial
performance of these companies (return on assets, return on investment). Combining
these findings with studies from other countries, both western and non-western, it is
reasonable to expect that different types of leadership behaviour does affect
organizational commitment, which in turn, influences both job satisfaction and
employee performance. It is anticipated that these relationships are dependent on the
type of organizational culture exhibited by the companies.
In summary, there have been a number of researches devoted to the
relationship between leadership behaviour, organizational culture, organizational
commitment, job performance and/or job satisfaction. The findings are, however, not
entirely consistent. A Taiwanese study by Li (2004) confirmed that the effect of
leadership behaviours on organizational commitment is differed by organizational
culture. In addition, it was found that organizational commitment might mediate the
relationship between leadership behaviours and job satisfaction and performance;
however the presence of this mediating effect was contingent upon the type of
leadership and organizational culture.
2.4. Demographics
Demographics have been found to exert influence on organizational behaviour
constructs. For example, age (Mathieu and Zajac, 1990; Michaels, 1994; Williams
and Hazer, 1986), cultural background (Al-Meer, 1989), organizational tenure
(Mathieu and Hamel, 1989; Mathieu and Zajac, 1990), job position (McCaul et al.,
1995) and position tenure (Gregersen and Black, 1992; Mathieu and Zajac, 1990)
have been found to be positively associated with organizational commitment.
23

Kirchmeyer (1995) and Madsen et al. (2005) determined that organizational
commitment was slightly related to gender (being female) and age. However, Goulet
and Singh (2002) concluded that organizational commitment was not related to age
but was instead related to gender.
Educational level has been reported to be negatively correlated with
organizational commitment (DeCotiis and Summers, 1987; Mathieu and Zajac, 1990;
Mottaz, 1988; Mowday et al., 1982). It has been argued that this inverse relationship
is attributable to the fact that more highly educated individuals have higher
expectations. They are therefore more likely to feel that their employers are not
rewarding them adequately, and so the level of organizational commitment is
diminished (DeCotiis and Summers, 1987).
Russ and McNeilly (1995) looked into the relationship between organizational
commitment and job satisfaction using experience, gender and performance as
moderators. They discovered that experience and performance moderate the
relationship between organizational commitment and job satisfaction.
2.5. Theoretical framework
Based on the literature review, the theoretical framework is proposed as shown
in Figure 2.1. This framework is similar to that of Li’s (2004), except that the
directive, participative and supportive leadership behaviours are studied, instead of
transformational and transactional leadership styles. Organizational commitment is
considered as a dependent and independent variable, rather than a mediating factor.
24

Leadership behaviour• Directive • Participative • Supportive
Figure 2.1
Theoretical Framework
H2
H1
Organizational Culture
• Bureaucratic • Innovative • Supportive
Organizational commitment
Job satisfaction Job performance
H3
H4
Organizational commitment
25

3. RESEARCH METHODOLOGY
In this chapter, the development of hypotheses is described, followed by
selection of instruments and measures. The sampling design, data collection
procedure and data analysis techniques that are applied in this study are then
presented.
3.1. Development of hypotheses
As mixed findings are observed in prior studies as described in the literature
review, null hypotheses are proposed to test the relationships between the variables, as
shown in Figure 2.1.
H1 : Leader’s directive, participative and supportive behaviours have no significant
relationship with organizational commitment.
H2 : Organizational culture (bureaucratic, innovative and supportive) has no
significant association on the relationship between leadership behaviour and
organizational commitment.
H3 : Organizational commitment has no significant relationship with job satisfaction
and job performance.
H4 : Organizational culture (bureaucratic, innovative and supportive) has no
significant association on the relationship between organizational commitment and
job satisfaction and job performance.
26

3.2. Selection of instruments and measures
The selection of instruments differed partly from Li’s (2004) study due to
consideration for the ease and time limitation for respondents to answer the questions,
and space constraints in the questionnaire. Moreover, some of the instruments
measured different dimensions of the variables to add originality value to this
research.
3.2.1. Organizational culture
Although a number of typologies, categorizations and instruments for
measuring organizational culture exist, there is little agreement on which ones are
more appropriate or superior to the other. Hence, the popular 24-item OCI by Wallach
(1983) has been used for the purpose of this study, the reason being that it was also
used in Li’s (2004) research. Wallach (1983) classified organizational culture profiles
as bureaucratic, innovative and supportive, and each of the three profiles is assigned 8
items in the OCI. The OCI has also been used by other researchers (Koberg and
Chusmir, 1987, cited in Lok and Crawford, 2004; Lok and Crawford, 2004).
Respondents were asked about how they perceive their organization’s culture.
A four-point Likert scale was used, ranging from “does not describe my organization”
valued as a “1” to “describes my organization most of the time” valued as a “4”. The
scores were added up for every profile, and an observation was assigned to the profile
with the highest mean score.
27

3.2.2. Leadership behaviour
In this study, the 13-item measure of leadership behaviour has been adapted
from Harris and Ogbonna (2001), which was based on previous research by House
(1971), House and Dessler (1974), Fleishman (1957) and Stogdill (1963). This
measure of leadership has been widely used in the marketing and strategy literatures
and has been generally accepted as a good measure of subordinate's perceptions of
leadership style and behaviour (Harris and Ogbonna, 2001). It has been used to
identify the leadership behaviour as participative (5 items), supportive (4 items) and
directive (4 items).
Churchill (1991) argued that to determine the form of response to individual
questions is a crucial aspect of empirical data collection. Consequently, it was decided
to adopt the commonly used seven-point Likert-type scoring for all items. Past uses of
measures of perceived leadership behaviours had previously utilized five-point scales.
However, Barnes et al. (1994) argued that a switch to the seven-point scale has no
effect on principal components analysis but often improves the reliability of answers.
Thus, a seven-point scale was used for reasons of reliability and validity (Churchill
and Peter, 1984), as well as for the ease of response and administration (Malhorta,
1993). This is similar to what was done in Harris and Ogbonna’s study (2001).
Respondents were asked to describe the leadership behaviour of their
immediate supervisor. The seven-point Likert scale was used, ranging from “strongly
agree/very true” valued as a “1” to “strongly disagree/very unlikely” valued as a “7”.
The mean scores for each leadership style were obtained.
28

3.2.3. Organizational commitment
According to Mathieu and Zajac (1990) and Liu (2007), currently the most
widely used measure of organizational commitment is the Organizational
Commitment Questionnaire (OCQ) (Mowday et al., 1979). However, for the purpose
of this study, the 11-item Affective Commitment Scale (ACS) (Allen and Meyer,
1990) has been used to assess the affective orientation of employees towards the
organization. It is shorter than the OCQ, and Dunham et al. (1994) and Randall et al.
(1990) found that the OCQ converged with the ACS. The ACS also has the advantage
that its items were written to assess only affective orientation towards the organization
and not employees' behaviour or behavioural intentions (e.g. intention to exert effort
or leave the organization).
Continuance and normative components of commitment were not assessed
because : (1) employees' behaviour or behavioural intentions (e.g. intention to exert
effort or leave the organization) are either beyond the scope of the research (e.g.
turnover), or already measured as other variables (e.g. performance), and (2) there is
still a lack of confidence and validity in the Normative Commitment Scale (Allen and
Meyer, 1990; Ko et al., 1997).
Furthermore, according to Liu (2007), it is more appropriate to use affective
commitment as a measure of impressions and attitudes of new employees, because
there is little chance to develop a meaningful continuance or normative commitment
to the organization in the early employment stage. This happened to be suitable for
this study’s sample population, which was predominantly employees with less than 3
years tenure in their organizations.
Most investigations of organizational commitment have been conducted using
self-report measures, however, the veracity of self-reports is often questioned. Goffin
29

and Gellatly (2001) assessed affective commitment among public-sector
administrative staff, by using different sources of raters to test the explanations of the
factors influencing self-report measures. They found that self-report commitment
measures are affected mainly by observations or experiences of the self-reporter
rather than by systematic bias related to defensive responding. This increases
confidence that scores from self-report measures of affective commitment are
veridical.
In this study, respondents were asked to describe their affective commitment
towards their organizations. The seven-point Likert scale was used, ranging from
“strongly agree/very true” valued as a “1” to “strongly disagree/very unlikely” valued
as a “7”. A higher mean score indicated a higher level of commitment. Negative items
were reverse-coded prior to data analysis.
3.2.4. Job satisfaction
According to Robbins (2005), job satisfaction can be measured using a single
global rating by asking the question : “All things considered, how satisfied are you
with your job?”.
According to Yousef (2000), a number of researchers supported the usefulness
of a single-item measure of global job satisfaction (Scarpello and Campbell, 1983;
Begley and Czajka, 1993; Bhuian and Islam, 1996). Wanous et al. (1997) supported
the use of a single-item measure unless a study’s inquiries or circumstances direct
toward selecting a well-constructed scale. They also argued that the single-item
measure can be used if space on a questionnaire is limited.
30

Respondents were asked to describe their job satisfaction. The five-point
Likert scale was used, ranging from “not satisfied” valued as a “1” to “very satisfied”
valued as a “5”. A higher mean score indicated a higher level of job satisfaction.
3.2.5. Employee performance
To measure employee performance, the self-rating 3-item overall performance
definition developed by Motowidlo and Van Scotter (1994) has been used, as
described by Li (2004). Researchers have criticized that self-ratings tend to be
inflated, suffering from leniency and social desirability bias. In fact, it is argued that a
non-self-report or multi-rater approach would be more accurate (i.e. ratings from
supervisors, peers, etc.). This downside of self-rating is due to self-serving bias,
where people tend to ascribe their own successes to internal personal factors, and their
failures to external situational causes.
However, a self-appraisal approach for rating performance has been used for
other types of performance measurements, as done previously by Al-Gattan (1983),
Stevens et al. (1978) and Yousef (2000) with acceptable outcomes. Young and
Dulewicz (2007), in a wider study into effective performance in the British Royal
Navy, demonstrated that self-evaluation of own performance was significantly
correlated with appraised (actual) performance using different psychometric
questionnaires.
Respondents have been asked to determine: (1) their standard of job
performance as measured by self that ranged from “does not meet standard” valued as
a “1” to “exceeds standard” valued as a “5”, (2) performance as compared with others
of the same rank that ranged from “low level” valued as a “1” to “high level” valued
as a “5”, and (3) job contribution to the organization as compared to other members of
31

the work unit that ranged from “less contribution” valued as a “1” to “more
contribution” valued as a “5”. A higher mean score represented a higher level of
performance.
3.2.6. Classification questions
Classification questions have been included at the end of the questionnaires.
These were used for profiling the companies, for example, type of business, years of
establishment, number of employees, and also for profiling the respondents, for
example, age, gender, job position, education, number of years in present
organization/position.
3.3. Sampling design and data collection
Data was collected using self-administered questionnaires to examine the
preceding issues because: (i) responses could be easily quantified and summarized,
(ii) data could be collected quickly, inexpensively and efficiently, and (iii) a large
number of participants could be reached in a short span of time.
A small-scale piloting was conducted prior to distribution of the
questionnaires. Several important aspects were checked (see Oppenheim, 2004, pp.
47-50), which resulted mostly in changes in the layout of the questionnaire. For the
electronic version of the questionnaire, participants were asked to mark “x” in the
appropriate yellow-colored boxes, rather than circling the responses. This is to ease
the respondents’ work and to reduce non-response rates. Overall, the
wording/phrasing of the questions were preserved to maintain the measurements’
integrity.
32

A copy of the questionnaire (both manual and electronic versions) is appended
in Appendix 1.
Questionnaires were distributed via e-mail and personally-administered by
hand to 400 participants consisting of Malaysian UM MBA part-time students and the
researcher’s working peers. This non-probability convenience sampling was chosen
for convenience and for time- and cost-effectiveness for the research.
Approximately 70 percent of the questionnaires were distributed among MBA
students, while the remaining 30 percent were handed to the researcher’s working
peers. A total of 238 usable responses was received, giving a response rate of 59.5%.
The response rates were roughly equal among MBA students and the researcher’s
working peers.
It is anticipated that there are no differences between the responses from the
MBA students and the working peers. This is because the MBA students comprise of
working people from various career backgrounds who, in the course of their work,
encounter different leadership behaviours and organizational cultures, and experience
different states of commitment, performance and job satisfaction – which is similar to
the researcher’s own work colleagues. Hence, they are in a position to give
meaningful responses to the questionnaires as the researcher’s working peers.
Moreover, it was not the intention of this research to compare any differences
between these two groups of subjects. Therefore, any distinction between these two
groups of subjects were not identified in the questionnaires that were handed out.
A very small number of returned questionnaires had missing data in one or
more sections, but these are taken into account to make full use of the available data,
e.g. by using “exclude cases pairwise” option when assessing normality using the
SPSS program.
33

3.4. Data analysis techniques
Descriptive statistics such as frequency distributions, means, standard
deviations and tests for normality are used to develop a profile of the respondents and
to summarize the variables. Factor analyses are used to confirm that the concepts of
each variable have been correctly measured. Reliability statistics (Cronbach Alpha)
are also computed to assess the reliability of measurements for each variable.
To better understand the relationship among the variables, Pearson correlation
analysis is performed to generate the correlation matrix. And finally, to test the
research hypotheses, hierarchical multiple regression analysis is used. This method
was selected as the order in which independent variables are entered into the
regression equation were known, and were based on logical or theoretical
considerations (Kamarul Zaman Ahmad, 2001; Tabachnick and Fidell, 1983).
34

4. RESULTS AND DISCUSSION
In this chapter, a summary of the respondents’ statistics is first presented,
followed by analyses of the selected measures. The hypotheses will then be tested and
a summary of the results from the research are described.
4.1. Summary statistics of respondents
Demographic variables of the respondent sample were extracted by asking
questions on age, gender, marital status, job position, number of years worked with
current employer, type and nature of organizations, number of years of establishment
of organizations and size of organizations (number of employees). Table 4.1
summarizes the demographic information of the sample population for this study.
Table 4.1
Summary statistics of respondents
Demographic variable Percentage of sampleAge 20-29 years 43.9 30-39 years 41.4 40-49 years 11.8 50 and above 3.0 Gender Female 51.1 Male 48.9 Education level Secondary 3.8 Diploma 8.0 Degree 57.8 Postgraduate 30.4 Marital status Single 58.9 Married 41.1 Job position Administrative or clerical 6.4 Technician 3.0
35

Executives or senior executive 37.3 Assistant manager 10.6 Managers or senior manager 28.0 Others 14.8 Number of years worked with current employer Less than 3 years 45.6 3-6 years 32.9 7-10 years 11.4 More than 10 years 10.1 Type of organization Manufacturing 11.4 Service 58.6 Others 30.0 Nature of organization Private/proprietary 72.6 Government 5.1 Government-linked (GLC) 16.7 Others 5.6 Number of years of establishment of organization Less than 10 years 23.7 10-15 years 17.8 More than 15 years 58.5 Number of employees in organization Less than 100 34.5 100-300 23.4 301-700 10.6 More than 700 31.5
Majority of the respondents were single and young (aged 20-39 years), of
nearly equal gender distribution, were degree holders and working as executives or
senior executives in their organizations. Most were relatively new employees, having
worked less than 3 years with their current employer.
Many of the respondents worked in private or proprietary organizations that
had been operating for more than 15 years. Most of these organizations were service-
oriented, such as in the sales, banking, education and consultancy lines. The size of
the respondents’ organizations was predominantly small or very large (less than 100
employees, and more than 700 employees, respectively).
36

4.2. Analyses of measures
4.2.1. Descriptive statistics
Table 4.2 shows that the standard deviations, skewness and kurtosis levels are
low, thus showing that the data is robust, representative of the samples, and normal
Hence, parametric analyses techniques are therefore possible in subsequent sections.
The measures of organizational culture, job satisfaction and employee
performance all exhibit mean scores notably above their respective mid-points. In
contrast, the measures of leadership and organizational commitment are notably lower
than their mid-points. Although few inferences can be gained from this analysis,
however, it may be argued that demographics could be an important factor. As an
example, drawing from past literature, the low mean scores of organizational
commitment could be due to the majority of respondents being young, highly-
educated, and having short organizational tenures (DeCotiis and Summers, 1987;
Mathieu and Hamel, 1989; Mathieu and Zajac, 1990; Michaels, 1994; Mottaz, 1988;
Mowday et al., 1982; Williams and Hazer, 1986).
37

Table 4.2
Descriptive Statistics
Valid Cases Mean1 Std. Dev. Skewness KurtosisBureaucratic Culture 238 3.04 0.56 -0.56 0.48 Innovative Culture 238 2.92 0.59 -0.14 0.94 Supportive Culture 238 2.91 0.52 -0.33 -0.19 Participative Leadership 238 3.35 1.25 0.61 0.08 Supportive Leadership 238 3.62 1.19 0.38 0.17 Directive Leadership 237 3.31 1.28 0.25 -0.51 Organizational Commitment 238 3.65 0.75 -0.20 0.38 Job Satisfaction 235 3.33 0.83 -0.36 0.59 Employee Performance 237 3.75 0.64 -0.22 -0.11 1 The OCI was measured on a four-point scale, resulting in a mid-point of 2.5. Both job satisfaction and employee performance were measured on a five-point scale, hence a mid-point of 3. Leadership behaviour and organizational commitment were measured using seven-point scales, therefore they have a mid-point of 4.
4.2.2. Factor Analysis
From the comprehensive review of the references, it was found that factor
analysis was generally not conducted for items or dimensions in the instruments, as
they were perceived as well-established and possessed well-documented reliability
and validity.
Sampling adequacy was conducted using the Kaiser-Meyer-Olkin (KMO)
analysis for all measures. Table 4.3 summarizes the KMO measurements and shows
significant results for Bartlett’s test of sphericity (p = .000), which further supported
sampling adequacy of the data.
38

Table 4.3
KMO and Bartlett’s Test
KMO Measure of Sampling Adequacy
Bartlett’s Test of Sphericity (Sig.)
Organizational Culture 0.878 (great) 0.000 Leadership Behaviour 0.904 (superb) 0.000 Organizational Commitment 0.784 (good) 0.000 Employee Performance 0.692 (mediocre) 0.000
Factor analysis was conducted using principal axis factoring extraction
method, and factors with eigenvalues of greater than one were extracted and retained.
In analyzing matrices, factors with loadings below 0.3 were suppressed.
For organizational culture and leadership behaviour, it was expected that the
factors extracted would be independent of one another according to pre-existing
categories demonstrated in the original research by Wallach (1983) and Harris and
Ogbonna (2001), respectively. Hence orthogonal rotation (varimax) was selected to
interpret factor loadings. Analyses results described three factors which can be
extracted for each measurement, hence corresponding exactly to the structure of the
measurements used by Wallach (1983) and Harris and Ogbonna (2001).
For organizational commitment and employee performance, as items were
originally supposed to measure a single variable, therefore it was expected that the
factors extracted would be dependent of one another. Hence oblique rotation (direct
oblimin) was selected to interpret factor loadings. Analyses results showed that three
factors could be extracted for the organizational commitment measurement,
suggesting the possibility of further refinements on Allen and Meyer’s (1990) ACS.
On the other hand, only one factor could be extracted in the employee performance
measurement, which describes accurately the structure of the employee performance
instrument used by Li (2004).
39

4.2.3. Reliability Analysis
Table 4.4 shows that the results in the calculation of Cronbach Alpha
coefficients ranged from 0.709 (for organizational commitment) to 0.921 (for
participative leadership). The Cronbach Alpha coefficients obtained from this study
were found to be relatively similar to reference studies. The high coefficient scores
(more than 0.7) led to the conclusion that the scales were acceptably reliable. No
items were deleted so as to maintain the integrity of these established, original
instruments.
Table 4.4
Reliability Analysis
No. of items Cronbach Alpha (present study)
Cronbach Alpha (reference study)
Bureaucratic Culture 8 0.824 0.861 Innovative Culture 8 0.790 0.701 Supportive Culture 8 0.812 0.971 Participative Leadership 5 0.921 0.92792 Supportive Leadership 4 0.788 0.76932 Directive Leadership 4 0.860 0.66882 Organizational Commitment 11 0.709 0.873
Employee Performance 3 0.774 0.831
1 Referenced from Li (2004) 2 Referenced from Harris and Ogbonna (2001) 3 Referenced from Allen and Meyer (1990)
4.2.4. Correlation Analyses
To study the correlation between variables, Pearson coefficient was selected as
it was designed for interval level or continuous variables. The correlation patterns in
Table 4.5 only partially followed the findings from Li’s (2004) study. That is,
organizational culture was found be significantly and positively correlated to job
40

satisfaction, but not with employee performance. In addition, leadership behaviours
were found to significantly and positively correlate to organizational commitment.
However, the results differ from Li’s (2004) study in a number of aspects.
Organizational culture was found to be either not significantly or significantly
negatively correlated to leadership behaviours. Organizational culture also had
significant negative correlation with organizational commitment. Leadership
behaviours did not affect employee performance significantly, but significantly
affected job satisfaction negatively. Employee performance was found to be
significantly and positively correlated to job satisfaction.
41

42
Table 4.5
Correlation
Bureaucratic Culture
Innovative Culture
Supportive Culture
Participative Leadership
Supportive Leadership
Instrumental Leadership
Employee Performance
Organizational Commitment
Job Satisfaction
Bureaucratic Culture Pearson Correlation 1 .427(**) .307(**) .019 .006 -.125(*) -.065 -.128(*) .146(*)
Sig. (1-tailed) .000 .000 .383 .462 .027 .160 .024 .012
N 238 238 238 238 238 237 237 238 235Innovative Culture Pearson Correlation .427(**) 1 .565(**) -.126(*) -.163(**) -.105 -.020 -.375(**) .253(**)
Sig. (1-tailed) .000 .000 .026 .006 .054 .378 .000 .000
N 238 238 238 238 238 237 237 238 235Supportive Culture Pearson Correlation .307(**) .565(**) 1 -.406(**) -.401(**) -.208(**) .045 -.454(**) .300(**)
Sig. (1-tailed) .000 .000 .000 .000 .001 .244 .000 .000
N 238 238 238 238 238 237 237 238 235Participative Leadership Pearson Correlation .019 -.126(*) -.406(**) 1 .688(**) .452(**) .068 .500(**) -.259(**)
Sig. (1-tailed) .383 .026 .000 .000 .000 .150 .000 .000
N 238 238 238 238 238 237 237 238 235Supportive Leadership Pearson Correlation .006 -.163(**) -.401(**) .688(**) 1 .515(**) .088 .541(**) -.246(**)
Sig. (1-tailed) .462 .006 .000 .000 .000 .089 .000 .000
N 238 238 238 238 238 237 237 238 235Instrumental Leadership Pearson Correlation -.125(*) -.105 -.208(**) .452(**) .515(**) 1 .033 .450(**) -.147(*)
Sig. (1-tailed) .027 .054 .001 .000 .000 .306 .000 .012
N 237 237 237 237 237 237 237 237 234Employee Performance Pearson Correlation -.065 -.020 .045 .068 .088 .033 1 -.119(*) .305(**)
Sig. (1-tailed) .160 .378 .244 .150 .089 .306 .033 .000
N 237 237 237 237 237 237 237 237 234Organizational Commitment Pearson Correlation -.128(*) -.375(**) -.454(**) .500(**) .541(**) .450(**) -.119(*) 1 -.423(**)
Sig. (1-tailed) .024 .000 .000 .000 .000 .000 .033 .000
N 238 238 238 238 238 237 237 238 235Job Satisfaction Pearson Correlation .146(*) .253(**) .300(**) -.259(**) -.246(**) -.147(*) .305(**) -.423(**) 1
Sig. (1-tailed) .012 .000 .000 .000 .000 .012 .000 .000
N 235 235 235 235 235 234 234 235 235
** Correlation is significant at the 0.01 level (1-tailed). * Correlation is significant at the 0.05 level (1-tailed).

43
4.3. Testing of hypotheses
To test the hypotheses using SPSS, hierarchical multiple regression was used
following Coakes et al. (2006, pp. 140-143). This method was selected as the order in
which independent variables are entered into the regression equation were known, and
were based on logical or theoretical considerations (Kamarul Zaman Ahmad, 2001;
Tabachnick and Fidell, 1983). Tables 4.6 to 4.11 show the results of hierarchical
multiple regression analyses.

44
Table 4.6 Results of Hierarchical Regression Analysis of Organizational Commitment
on Leadership Behaviours in Bureaucratic Culture Model Summary ANOVAc Coefficientsd
Independent Variables R2 excl.
interactiona R2 incl.
interactionb ∆ R2 Sig. F change F Sig. B Beta t Sig.
Directive Leadership .203 .208 .005 .219 30.742 .000 -.098 -.072 -1.233 .219
Participative Leadership .250 .269 .019 .014 43.212 .000 -.185 -.138 -2.473 .014
Supportive Leadership .293 .310 .017 .016 52.899 .000 -.177 -.132 -2.430 .016 a R2 with Leadership Behaviour and Organizational Culture, but excluding interaction Leadership Behaviour * Organizational Culture b R2 including interaction term Leadership Behaviour * Organizational Culture c ANOVA Predictors: (Constant), Leadership Behaviour, Organizational Culture d Coefficients of Organizational Culture in the Model: (Constant), Leadership Behaviour, Organizational Culture
Table 4.7 Results of Hierarchical Regression Analysis of Organizational Commitment
on Leadership Behaviours in Innovative Culture Model Summary ANOVAc Coefficientsd Independent
Variables R2 excl. interactiona
R2 incl. interactionb ∆ R2 Sig. F change F Sig. B Beta t Sig.
Directive Leadership .203 .312 .109 .000 52.983 .000 -.421 -.332 -6.081 .000
Participative Leadership .250 .349 .099 .000 62.938 .000 -.402 -.317 -5.976 .000
Supportive Leadership .293 .378 .085 .000 71.330 .000 -.374 -.295 -5.653 .000 a R2 with Leadership Behaviour and Organizational Culture, but excluding interaction Leadership Behaviour * Organizational Culture b R2 including interaction term Leadership Behaviour * Organizational Culture c ANOVA Predictors: (Constant), Leadership Behaviour, Organizational Culture d Coefficients of Organizational Culture in the Model: (Constant), Leadership Behaviour, Organizational Culture
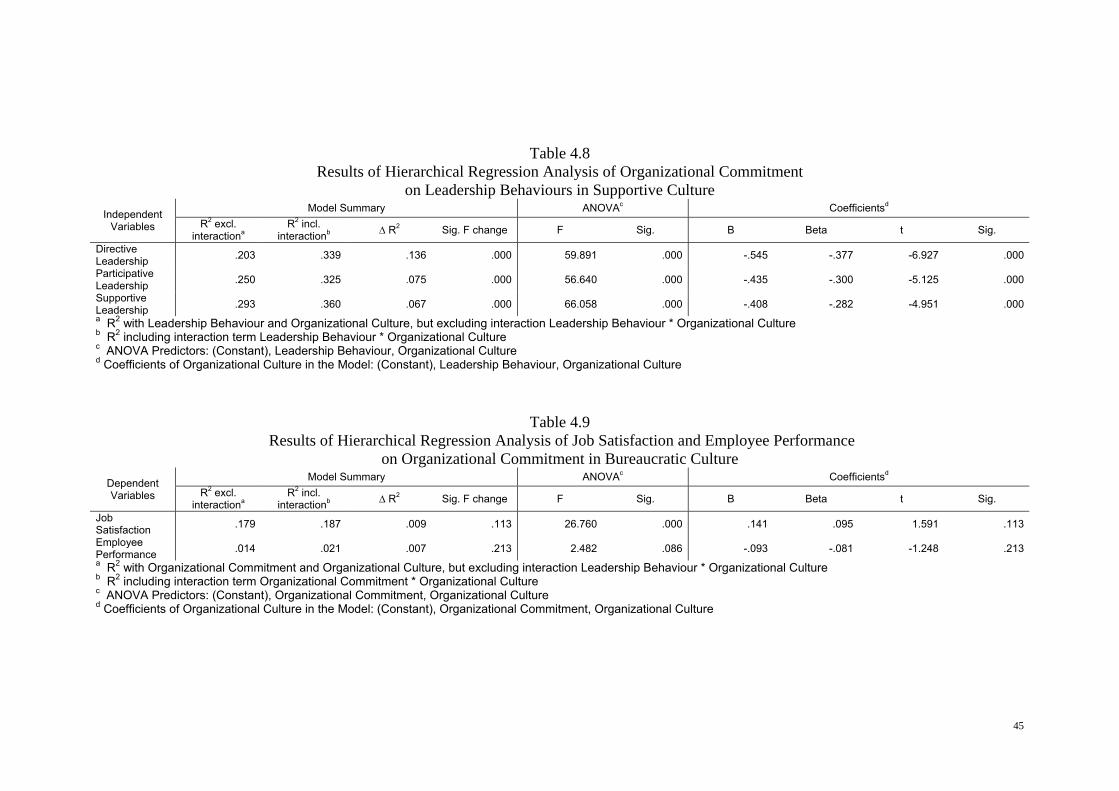
Table 4.8 Results of Hierarchical Regression Analysis of Organizational Commitment
on Leadership Behaviours in Supportive Culture Model Summary ANOVAc Coefficientsd Independent
Variables R2 excl. interactiona
R2 incl. interactionb ∆ R2 Sig. F change F Sig. B Beta t Sig.
Directive Leadership .203 .339 .136 .000 59.891 .000 -.545 -.377 -6.927 .000
Participative Leadership .250 .325 .075 .000 56.640 .000 -.435 -.300 -5.125 .000
Supportive Leadership .293 .360 .067 .000 66.058 .000 -.408 -.282 -4.951 .000 a R2 with Leadership Behaviour and Organizational Culture, but excluding interaction Leadership Behaviour * Organizational Culture b R2 including interaction term Leadership Behaviour * Organizational Culture c ANOVA Predictors: (Constant), Leadership Behaviour, Organizational Culture d Coefficients of Organizational Culture in the Model: (Constant), Leadership Behaviour, Organizational Culture
Table 4.9 Results of Hierarchical Regression Analysis of Job Satisfaction and Employee Performance
on Organizational Commitment in Bureaucratic Culture Model Summary ANOVAc Coefficientsd
Dependent Variables R2 excl.
interactiona R2 incl.
interactionb ∆ R2 Sig. F change F Sig. B Beta t Sig.
Job Satisfaction .179 .187 .009 .113 26.760 .000 .141 .095 1.591 .113
Employee Performance .014 .021 .007 .213 2.482 .086 -.093 -.081 -1.248 .213 a R2 with Organizational Commitment and Organizational Culture, but excluding interaction Leadership Behaviour * Organizational Culture b R2 including interaction term Organizational Commitment * Organizational Culture c ANOVA Predictors: (Constant), Organizational Commitment, Organizational Culture d Coefficients of Organizational Culture in the Model: (Constant), Organizational Commitment, Organizational Culture
45

Table 4.10 Results of Hierarchical Regression Analysis of Job Satisfaction and Employee Performance
on Organizational Commitment in Innovative Culture Model Summary ANOVAc Coefficientsd
Dependent Variables R2 excl.
interactiona R2 incl.
interactionb ∆ R2 Sig. F change F Sig. B Beta t Sig.
Job Satisfaction .179 .189 .011 .082 27.071 .000 .155 .111 1.744 .082
Employee Performance .014 .019 .005 .280 2.288 .104 -.081 -.076 -1.084 .280 a R2 with Organizational Commitment and Organizational Culture, but excluding interaction Leadership Behaviour * Organizational Culture b R2 including interaction term Organizational Commitment * Organizational Culture c ANOVA Predictors: (Constant), Organizational Commitment, Organizational Culture d Coefficients of Organizational Culture in the Model: (Constant), Organizational Commitment, Organizational Culture
Table 4.11 Results of Hierarchical Regression Analysis of Job Satisfaction and Employee Performance
on Organizational Commitment in Supportive Culture Model Summary ANOVAc Coefficientsd
Independent Variables R2 excl.
interactiona R2 incl.
interactionb ∆ R2 Sig. F change F Sig. B Beta t Sig.
Job Satisfaction .179 .193 .015 .041 27.793 .000 .217 .136 2.056 .041
Employee Performance .014 .014 .000 .877 1.704 .184 -.014 -.011 -.155 -877 a R2 with Organizational Commitment and Organizational Culture, but excluding interaction Leadership Behaviour * Organizational Culture b R2 including interaction term Organizational Commitment * Organizational Culture c ANOVA Predictors: (Constant), Organizational Commitment, Organizational Culture d Coefficients of Organizational Culture in the Model: (Constant), Organizational Commitment, Organizational Culture
46

47
4.3.1. Leadership behaviour, organizational culture and organizational
commitment
H1 stated that a leader’s directive, participative and supportive behaviours
have no significant relationship with organizational commitment. From the analyses,
leadership behaviours explained about 20 to 30 percent of the variance (R2) in
organizational commitment, all of which were significant as indicated by the
respective F-values (p < .05). Based on the R-values and t-values, all three types of
leadership behaviours contributed positively and significantly to the prediction of
organizational commitment (p < .05). Higher scores for each leadership behaviour led
to stronger organizational commitment in the employees. Therefore, the null
hypothesis H1 is rejected, that is, leader’s directive, participative and supportive
behaviours have positive and significant relationship with organizational
commitment.
This finding is consistent with some previous studies (Blau, 1985; Williams
and Hazer, 1986) and lends credibility to the notion that leadership does play an
influential role in generating commitment. Employees who are committed are highly
involved in their organization, and are more willing to put in considerable effort at
work, and possess a strong desire to remain in their organizations.
According to H2, the organizational culture (bureaucratic, innovative and
supportive) has no significant association on the relationship between leadership
behaviour and organizational commitment. From the R2 Change and Sig. F Change
values, both innovative and supportive cultures made significant, unique contributions
of 8.5 to 10.9 percent, and 6.7 to 13.6 percent, respectively, to the variance of
organizational commitment after leadership behaviour had been taken into account (p
< .05). The association was most pronounced with directive leadership, followed by

participative and least of all, supportive leadership styles. The association is less clear
in bureaucratic environments; it did not make any significant contributions to the
variance of organizational commitment under directive leadership, but significantly
increased the variances by nearly 2 percent under participative and supportive
leadership styles.
The negative beta values indicated that higher scores in organizational culture
was associated with lower commitment, with the exception of bureaucratic culture
with directive leadership. Hence, organizational culture was generally found to be a
significant moderator in the relationship between leadership behaviours and
organizational commitment.
Therefore, the null hypothesis H2 is partially rejected. Organizational
culture generally has significant moderating influence on the relationship between
leadership behaviour and organizational commitment, except for the relationship
between directive leadership behaviour and organizational commitment under a
bureaucratic environment.
Bureaucratic, innovative and supportive cultures have significant moderating
influence on the relationship between participative and supportive leadership
behaviours and organizational commitment. The relationship between directive
leadership behaviour and organizational commitment is significantly moderated by
both innovative and supportive cultures; however, bureaucratic culture did not
significantly moderate this relationship.
This finding is in agreement with Li’s (2004) study in that the effect of
different leadership behaviors on organizational commitment is contingent upon
organizational culture. Although all three types of organizational culture moderated
the relationships between directive, participative and supportive leadership behaviours
48

with commitment by negatively impacting them, bureaucratic culture was found to
exert the least influence. Leaders should recognize this as they seek to influence
employees and achieve their organizational goals, of which success can be contingent
upon the type of organizational culture being practiced. Regardless of conditions in
the labor market, committed employees are always a necessary and valuable
organizational resource (Li, 2004).
The finding that directive leadership style is not affected by a bureaucratic
environment in generating commitment contributes further evidence that a particular
leadership style can be effective in one culture, but may not benefit (or become
ineffective) in another culture.
4.3.2. Organizational commitment, organizational culture, job satisfaction
and employee performance
According to H3, organizational commitment is posited to have no significant
relationship with job satisfaction and job performance. From the analyses,
organizational commitment explained 17.9 percent of the variance (R2) in job
satisfaction, which was significant as indicated by the F-value (p < .05). In contrast,
organizational commitment explained 1.4 percent of the variance in employee
performance, which was not significant as indicated by the F-value (p > .05). Based
on the R-values and t-values, organizational commitment is a significant and negative
predictor of job satisfaction (p < .05), but is not a predictor for employee performance
(p > .05). The stronger the commitment, the lower the job satisfaction. Therefore, the
null hypothesis H3 is partially rejected, that is, organizational commitment has a
negative significant relationship with job satisfaction, and has an insignificant
relationship with employee performance.
49

The findings are contrary to the reviewed literature with regards to the
association between organizational commitment and job satisfaction. For instance,
Mathieu and Zajac's (1990) research suggested that affective and continuance
commitment are positively related with job satisfaction, but this was not observed in
this study. One possible reason is that the sample population consists mostly of
young, highly educated persons holding high executive or managerial positions. They
may be involved and be enthusiastic about their work professionally, however, actual
expectations and feelings about their work may differ, which may lead to
dissatisfaction. On the other hand, the findings agree to Lee and Mowday’s (1989)
study, where there is negligible relationship between commitment and employee
performance. There may be other more important factors which impacts performance
and productivity besides organizational commitment. Managers can benefit by
attempting to uncover underlying factors that are critical in determining job
satisfaction and performance levels, as organizational commitment itself may not
contribute as much as previously thought.
H4 stated that organizational culture (bureaucratic, innovative and supportive)
has no significant association on the relationship between organizational commitment
and job satisfaction and job performance. From the R2 Change and Sig. F Change
values, only supportive culture made a significant, unique (albeit weak) contribution
of 1.5 percent to the variance of job satisfaction after organizational commitment (p =
.041). The positive beta (beta = .136) indicated that higher score in supportive culture
was associated with higher job satisfaction. Hence, supportive culture was found to be
a significant moderator in the relationship between organizational commitment and
job satisfaction.
50

Organizational culture was found not to contribute significantly to the variance
of employee performance after organizational commitment (p > .05). Hence, in the
sample population, organizational culture was not a significant moderator in the
relationship between organizational commitment and employee performance.
Therefore, the null hypothesis H4 is partially rejected, that is, only
supportive culture has a significant moderating influence on the relationship between
organizational commitment and job satisfaction. Bureaucratic and innovative cultures
did not significantly influence the relationship between organizational commitment
with job satisfaction. In addition, all three types of organizational cultures did not
moderate the relationship between organizational commitment and employee
performance.
This finding is in agreement with past literature, where a trusting, encouraging
and team-oriented environment increased job satisfaction levels. In corporations
where rigid bureaucratic, or challenging, aggressive innovative cultures exist,
Malaysian managers may want to consider introducing softer and more people-
oriented elements into the working environment, so as to increase satisfaction, which
in turn, may benefit productivity, stress levels or turnover rates.
4.4. Summary of research results
The research results are summarized as follows :
Leader’s directive, participative and supportive behaviours have positive and
significant relationship with organizational commitment.
51

Organizational culture generally has significant moderating influence on the
relationship between leadership behaviour and organizational commitment, except for
the relationship between directive leadership behaviour and organizational
commitment under a bureaucratic environment.
Organizational commitment has a negative significant relationship with job
satisfaction, and has an insignificant relationship with employee performance.
Only supportive culture has a significant moderating influence on the relationship
between organizational commitment and job satisfaction. Organizational culture did
not moderate the relationship between organizational commitment and employee
performance.
52

5. CONCLUSION AND RECOMMENDATIONS
This chapter begins with the summary of findings based on the results from
this study. Suggestions for future research areas are then presented, and lastly
implications from this study are described and at the end of this chapter.
5.1. Summary of findings
The purpose of this study was to investigate the association between different
types of organizational culture and leadership behaviours and organizational
commitment, job satisfaction and employee performance in the Malaysian setting.
To date, little empirical research has been done to investigate the relationships
and organizational outcomes of these constructs. This study, therefore, is unique in
that it has helped to fill this gap in an effort to improve our understanding of the role
of leadership and organizational in the Malaysian environment and beyond. With the
advent of globalization in recent years, greater knowledge of the interactions of these
factors specifically in the multiracial and multicultural Malaysian setting can be
beneficial for assessing the effectiveness of current theory as well as benefiting
practicing leaders and decision makers. Findings from this study can help leaders and
scholars, especially those concerned with Malaysian companies.
By using questionnaires, data was gathered from 238 Malaysian UM MBA
part-time students and the researcher’s working peers. Data on the respondents’
organizational culture and leadership behaviours, and how they affect organizational
commitment, job satisfaction and employee performance, were collected using the
OCI (Wallach, 1983), leadership behaviour questionnaire (Harris and Ogbonna,
53

2001), ACS (Allen and Meyer, 1990), single global rating for job satisfaction
(Robbins, 2005), and overall performance questionnaire (Motowidlo and Van Scotter,
1994), respectively. Descriptive statistics were reported, followed by factor analysis,
reliability analysis, Pearson correlation and hypotheses testing using hierarchical
multiple regression.
In this study, although the correlations were statistically significant (p < 0.05),
the amount of correlation with each variable was relatively small. One of the reasons
could be that there are other, possibly stronger, predictors and dependents for the
variables investigated in this study. For example, there are numerous factors which
influence, or are influenced by job satisfaction, as described by Rad and
Yarmohammadian (2006).
Four hypotheses were developed based on the research objectives and from
the existing literature. The hypotheses were tested and thus, the research objectives
were achieved.
H1 stated that a leader’s directive, participative and supportive behaviours
have no significant relationship with organizational commitment. However, based on
the research results, the null hypothesis H1 is rejected. The leader’s directive,
participative and supportive behaviours were found to have positive and significant
relationship with organizational commitment. These results were consistent with the
pattern found in a number of western studies, as described by Yousef (2000). In his
research on major United Arab Emirates organizations, he found that employees can
be highly committed to their organizations when they perceive their superiors as
adopting consultative or participative leadership behaviours.
54

According to H2, the organizational culture (bureaucratic, innovative and
supportive) is not significantly associated with the relationship between leadership
behaviour and organizational commitment. From the findings, the null hypothesis H2
is partially rejected. Bureaucratic, innovative and supportive cultures have significant
moderating influence on the relationship between participative and supportive
leadership behaviours and organizational commitment. The relationship between
directive leadership behaviour and organizational commitment is significantly
moderated by both innovative and supportive cultures; however, bureaucratic culture
did not significantly moderate this relationship. This finding is somewhat reflected in
previous western studies, where innovative and supportive cultures were found to
exert stronger influence or even enhance employees’ commitment than a bureaucratic
culture (Brewer, 1993; Brewer, 1994; Kratrina, 1990; Wallach, 1983).
According to H3, organizational commitment is posited to have no significant
relationship with job satisfaction and job performance. Following the data analysis,
the null hypothesis H3 is partially rejected. Organizational commitment has a negative
significant relationship with job satisfaction, but has an insignificant relationship with
employee performance. This is contrary to findings from western studies with regards
to the association between organizational commitment and job satisfaction. For
instance, Mathieu and Zajac (1990) found that commitment is positively related with
job satisfaction, but this was not observed in this study. On the other hand, this
study’s findings agree to Lee and Mowday’s (1989), where there is negligible
relationship between commitment and employee performance. This difference could
be explained by the demographics of the study sample - young, highly-educated
workers who may be enthusiastic about their work professionally, however, actual
expectations and feelings about their work may differ, which may lead to
55

dissatisfaction. Their performance could be influenced by other factors aside from
commitment alone.
H4 stated that organizational culture (bureaucratic, innovative and supportive)
is not significantly associated with the relationship between organization commitment
and job satisfaction and job performance. From the analysis, it is concluded that the
null hypothesis H4 is partially rejected. Only supportive culture has a significant
moderating influence on the relationship between organizational commitment and job
satisfaction. Bureaucratic and innovative cultures did not significantly influence the
relationship between organizational commitment with job satisfaction. In addition, all
three types of organizational cultures did not moderate the relationship between
organizational commitment and employee performance. This finding is somewhat in
agreement with previous western studies, where supportive cultures were
predominantly associated with higher levels of job satisfaction and performance,
while bureaucratic cultures did the opposite (Brewer and Clippard, 2002; Krausz et
al., 1995; London and Larsen, 1999; Silverthorne, 2004; Trice and Beyer, 1993).
There exists very few published research work of similar nature conducted in
Malaysia. Findings from this study did not agree with Samad (2005)’s, in that
organizational commitment was found to be negatively related to job satisfaction and
unrelated to employee performance. Hence, the sampled Malaysian employees who
feel attached and involved in their companies did not feel more satisfied with their
jobs, and did not perform better either.
Although no direct comparisons could be made against findings from Rashid
et al. (2003)’s study, it can be loosely concluded that a bureaucratic environment does
not affect organizational commitment and other consequents such as satisfaction and
56

performance in the Malaysian setting. Rashid et al. (2003) found that a consensual
(supportive) culture positively influenced affective commitment, whereas an
entrepreneurial (innovative) culture did otherwise. Such findings were not observed in
this study, however.
5.2. Suggestions for future research
Sampling was one of the limitations identified in this study. The fact that
convenience sampling was used meant that results were not immediately transferable
to the general working population. In addition, the sample subjects in this study were
mostly young executives in the urban Klang Valley area, who worked less than three
years in their companies, and were mostly from the private sector; thus, findings
could not be generalized. Therefore, future research could look into extending the
study population to include collect input from more experienced business managers
and leaders who have better insight of the workings of the corporation. If samples
were drawn from a wider range of demographics, then the results may become more
meaningful. Moreover, if adequate population data can be obtained, probability
sampling methods can be used.
Future research could explore the differences in response towards the
investigated variables among different groups of people of varied backgrounds and
demographics. For example, comparisons can be made between workers from
different industries, ethnicities, or countries.
Another possible future direction is to use a more differentiated measure of job
satisfaction, such as the Job Descriptive Index or Overall Job Satisfaction
questionnaires, provided the benefits of using such lengthier measures outweigh the
57

disadvantages. Such measures can provide a more detailed analysis on the facets of
job satisfaction that are affected by organizational behaviour variables.
5.3. Implications
There can be a number of implications for Malaysian corporate leaders,
managers and supervisors from this study. Leaders need to realize the impact of their
personal leadership styles upon their employees' commitment to the workplace, and
that the success of their endeavours is dependent on the shared values and norms
within the organization. Hence, to enhance their effectiveness, leaders could consider
changing their leadership style to synergize with the organization's culture, or initiate
changes to the culture itself. In addition, this further reaffirms the use of the
contingency approach in conceptualizing leadership styles and behaviours.
For example, in Malaysia there are many bureaucratic organizations such as
government institutions, large manufacturing plants, and traditional family-owned
companies. In these organizations, directive leadership is still quite prevalent where
supervisors continue to direct and plan work for employees, and rigid rules and
policies are enforced. Such organizations continue to thrive today as demonstrated by
years of continued financial success. Working conditions in such bureaucratic cultures
may not immediately favour supportive leadership styles; where efficiency and strict
adherence to rules are valued, a manager adopting a softer, caring approach risks
losing respect from older employees, and gaining lazy workers who take advantage of
the open, friendly atmosphere. Therefore, the supportive manager needs to change his
leading style, perhaps by adopting a more directive leadership approach.
Malaysian leaders should also realize that contrary to common belief,
committed employees may not automatically equate to satisfied and high-performing
58

workers in the organization, even if a favourable environment exists for the
employees. There could be other, more significant underlying reasons for an
employee's commitment, which could subsequently affect other critical bottom-lines,
such as absenteeism, turnover, profitability and productivity. Leaders need to
investigate and find out what exactly keeps their employees happy and working hard.
As an example, in Malaysia the sales and marketing divisions of many fast-
moving industries, such as telecommunications, electronics, consumer goods and
healthcare products, employ young people who are enthusiastic, driven and possess
high-performing qualities. They are committed to their organizations, often bearing
hopes of finding an ideal working environment, rewarding salary package and
promotion opportunities, and an exciting job. However, it is also true that turnover
among new recruits in sales teams and marketing departments in such industries is
high, and targets are not always met. Managers should perhaps look into what affects
their subordinates’ job satisfaction and performance, such as too much stress or
inadequate training.
59

REFERENCES
Ahmad, K. (2001). “Corporate leadership and workplace motivation in Malaysia”,
International Journal of Commerce & Management, vol. 11, no. 1, pp. 82-101.
Al-Gattan, A. R. A (1983), “The path-goal theory of leadership: an empirical and
longitudinal analysis”, unpublished doctoral dissertation, Arizona State University.
Al-Meer, A. R. A. (1989), “Organizational commitment: A comparison of westerners,
Asians, and Saudis”, International Studies of Management & Organization, vol. 19
no. 2, pp. 74-84.
Allen, N. and Meyer, J. (1990), “The measurement and antecedents of affective,
normative and continuance commitment to the organization”, Journal of
Occupational Psychology, vol. 63, pp. 1-18.
Anonymous (1998, October 26), “What makes a company great?”, Fortune, vol. 138
no. 8, pp. 218-9.
Appelbaum, S., Bartolomucci, N., Beaumier, E., Boulanger, J., Corrigan, R., Dore, I.,
Girard, C. and Serroni, C. (2004), “Organizational citizenship behaviour: A case study
of culture, leadership and trust”, Management Decision, vol. 42 no. 1/2, pp. 13-40.
Barnes, J. H., Daswar, A. K. and Gilbert, F. W. (1994), “Number of factors obtained
by chance: a situation study”, in Wilson, K. J. and Black, W. (eds), Developments in
Marketing Science, vol. XVII, Academy of Marketing Science, Nashville, TN.
Baugh, S. G. and Roberts, R. M. (1994), “Professional and organizational
commitment among engineers: Conflicting or complementary?”, IEEE Transactions
on Engineering Management, vol. 41 no. 2, pp. 108-14.
Begley, T. M. and Czajka, J. M. (1993), “Panel analysis of the moderating effects of
commitment on job satisfaction, intent to quit, and health following organizational
change”, Journal of Applied Psychology, vol. 78 no. 4, pp. 552-6.
60

Benkhoff, B. (1997), “Disentangling organizational commitment: The changes of the
OCQ for research and policy”, Personnel Review, vol. 26 no. 1, pp. 114-20.
Bhuian, S. N. and Islam, M. S. (1996), “Continuance commitment and extrinsic job
satisfaction among a novel multicultural expatriate workforce”, The Mid-Atlantic
Journal of Business, vol. 32 no. 1, pp. 35-46.
Blau, G. (1985), “The measurement and prediction of career commitment”, Journal of
Occupational Psychology, vol. 58, pp. 277-88.
Becker, H. S. (1960), “Notes on the Concept of Commitment”, American Journal of
Sociology, 66, pp. 32-42.
Brett, J. F., Cron, W. L. and Slocum Jr, J. W. (1995), “Economic dependency on
work: a moderator of the relationship between organizational commitment and
performance”, Academy of Management Journal, vol. 38 no. 1, pp. 261-71.
Brewer, A. (1993), Managing for Employee Commitment, Longman, London.
Brewer, A. (1994), The Responsive Employee, Allen and Unwin, Sydney.
Brewer, E. W. and Clippard, L. F. (2002), “Burnout and job satisfaction among
Student Support Services personnel”, Human Resource Development Quarterly, vol.
13 no. 2, pp. 169-86.
Brunetto, Y. and Farr-Wharton, R. (2003), “The commitment and satisfaction of
lower-ranked police officers: Lessons for management”, Policing: An International
Journal of Police Strategies & Management, vol. 26 no. 1, pp. 43-63.
Cameron, K. S. and Freeman, S. J. (1991), “Cultural congruence, strength, and type:
relationships to effectiveness”, Research in Organizational Change and Development,
vol. 5, pp. 23-58.
61

Caykoylu, S., Egri, C. P. and Havlovic, S. (2007), “Organizational commitment
across different employee groups”, The Business Review, Cambridge, vol. 8 no. 1, pp.
191-7.
Chang, T. Z., Polsa, P. and Chen, S. J. (2003), “Manufacturer channel management
behaviour and retailors' performance: An empirical investigation of automotive
channel”, Supply Chain Management, vol. 8 no. 2, pp. 132-9.
Chen, Y. J. (2007),”Relationships among service orientation, job satisfaction, and
organizational commitment in the international tourist hotel industry”, Journal of
American Academy of Business, Cambridge, vol. 11 no. 2, pp. 71-82.
Churchill, G. A. (1991), Marketing Research: Methodological Foundations, The
Dryden Press, London.
Coakes, S. J., Steed, L. and Dzidic, P. (2006), SPSS version 13.0 for Windows:
analysis without anguish, John Wiley & Sons Australia, Ltd.
Cole, C. L. (2000), “Building Loyalty”, Workforce, 79 (8), pp. 42-48.
Daft, R. L. (2005), The Leadership Experience, 3rd ed., Thomson-Southwestern,
Canada.
Deal, T. E. and Kennedy, A. A. (1982), Corporate Cultures, Addison-Wesley,
Reading, MA.
DeCotiis, T., and Summers, T. (1987), “A path analysis of a model of the antecedents
and consequences of organizational commitment”, Human Relations, vol. 40 no. 7,
pp. 445-70.
Downey, H. K., Sheridan, J. E. and Slocum Jr., J. W. (1975), “Analysis of
relationships among leader behaviour, subordinate job performance and satisfaction:
A path-goal approach”, Academy of Management Journal, vol. 18 no. 2, pp. 253-62.
62

Dunham, R. B., Grube, J. A. and Castenada, M. B. (1994), “Organizational
commitment: the utility of an integrative definition”, Journal of Applied Psychology,
vol. 79 no. 3, pp. 370-80.
Earle, V. (1996, November), “Motivational leadership”, Executive Excellence, vol. 13
no. 11, pp. 16-7.
Fleishman, E. A. (1957), “A leadership behaviour description for industry”, in
Stogdill, R. M. and Coons, A.E. (eds), Leader Behaviour: Its Description and
Measurement, The Ohio State University Bureau of Business Research, Columbus,
OH.
Goffee, R. and Jones, G. (1998), The Character of a Corporation: How Your
Company’s Culture Can Make or Break Your Business, Harper Business, London.
Goffin, R. D. and Gellatly, I. E. (2001), “A multi-rater assessment of organizational
commitment: Are self-report measures biased?”, Journal of Organizational Behavior,
vol. 22 no. 4, pg. 437-51.
Goulet, L. R. and Singh, P. (2002), ”Career commitment: A reexamination and an
extension”, Journal of Vocational Behaviour, vol. 61, pp. 73–91.
Gregersen, H. B. and Black, J. S. (1992), “Antecedents to commitment to a parent
company and a foreign operation”, Academy of Managerial Journal, vol. 35 no. 1, pp.
65-90.
Hackett, R. D., Lapierre and L. M., Hausdorf, P. A. (2001), “Understanding the links
between work commitment constructs”, Journal of Vocational Behaviours, vol. 58,
pp. 392-413.
Harris, L. C. and Ogbonna, E. (2001), “Leadership style and market orientation: An
empirical study”, European Journal of Marketing, vol. 35 no. 5/6, pp. 744-64.
63

Hickman, C. and Silva, M. (1984), Creating Excellence: Managing Culture and
Change in the New Age, New American Library, New York, NY.
House, R. J. (1971), “A path-goal theory of leader effectiveness”, Administrative
Science Quarterly, vol. 16, pp. 321-38.
House, R. J. and Dessler, G. (1974), “The path-goal theory of leadership: Some post
hoc and a priori tests”, in Hunt, J. G. and Larson, L. L. (eds), Contingency
Approaches to Leadership, Southern Illinois University Press, Carbondale, IL.
Iverson, R. D. and Roy, P. (1994), “A causal model of behavioural commitment:
evidence from a study of Australian blue-collar employees”, Journal of Management,
vol. 20 no. 1, pp. 15-41.
Jernigan, I. E., Beggs, J. M. and Kohut, G. F. (2002), “Dimensions of work
satisfaction as predictors of commitment type”, Journal of Managerial Psychology,
vol. 17 no. 7, pp. 564-79.
Kahai, S. S., Sosik, J. J. and Avolio, B. J. (1997), “Effects of leadership style and
problem structure on work group process and outcomes in an electronic meeting
system environment”, Personnel Psychology, vol. 50 no. 1, pp. 121-46.
Kalleberg, A. L. and Marden, P. V. (1995), “Organizational commitment and job
performance in the US labor force”, Research in the Sociology of Work, vol. 5, pp.
235-57.
Kamarul Zaman Ahmad (2001), “The association between person, work environment,
job satisfaction and performance : a study in light manufacturing assembly plants”,
University of Manchester, Ph. D. Thesis.
Kim, S. (2002), “Participative management and job satisfaction: Lessons for
management leadership”, Public Administration Review, vol. 62 no. 2, pp. 231-41.
64

Kirchmeyer, C. (1995), “Managing the work-nonwork boundary: An assessment of
organizational responses”, Human Relations, vol. 48 no. 5, pp. 515–36.
Ko, J. W., Price, J. L. and Mueller, C. W. (1997), “Assessment of Meyer and Allen’s
3 Component Model of Organizational Commitment in South Korea”, Journal of
Applied Psychology, vol. 82 no. 6, pp. 961-73.
Kratrina, S. (1990), “Organizational culture and head nurse leadership: The
relationship to nurses' job satisfaction and turnover in hospital settings”, unpublished
PhD thesis, College of Education, Georgia State University, Atlanta, GA.
Krausz, M., Koslowsky, M., Shalon, N. and Elyakim, N. (1995), “Predictors of
intention to leave the ward, the hospital and the nursing profession: A longitudinal
study”, Journal of Organizational Behaviour, vol. 16, pp. 277-88.
Lee, T. W. and Mowday, R. T. (1989), “Voluntary leaving an organization: An
empitical investigation of Steers and Mowdays's Model of Turnover”, Academy of
Management Journal, vol. 30, pp. 721-43.
Leong, C. S., Furnham, A. and Cooper, C. L. (1996), “The moderating effect of
organizational commitment on the occupational stress outcome relationship”, Human
Relations, vol. 49 no. 10, pp. 1345-63.
Leong, S. M., Randoll, D. N. and Cote, J. A. (1994), “Exploring the organizational
commitment-performance”, Journal of Business Research, vol. 29 no. 1, pp. 57-63.
Li, Y. C. (2004), “Examining the effect of organization culture and leadership
behaviours on organizational commitment, job satisfaction, and job performance at
small and middle-sized firms of Taiwan”, Journal of American Academy of Business,
vol. 5 no. 1/2, pp. 432-8.
Lim, B. (1995), “Examining the organizational culture and organizational
performance link”, Leadership and Organization Development Journal, vol. 16, pp.
16-21.
65

Liu, C. M. (2007), “The early employment influences of sales representatives on the
development of organizational commitment”, Employee Relations, vol. 29 no. 1, pp.
5-15.
Lok, P. and Crawford, J. (1999), “The relationship between commitment and
organizational culture, subculture, leadership style and job satisfaction in
organizational change and development”, Leadership & Organization Development
Journal, vol. 20 no. 7, pp, 365-73.
Lok, P. and Crawford, J. (2001), “Antecedents of organizational commitment and the
mediating role of job satisfaction”, Journal of Managerial Psychology, vol. 16 no.
7/8, pp. 594-613.
Lok, P. and Crawford, J. (2004), “The effect of organizational culture and leadership
style on job satisfaction and organizational commitment: A cross-national
comparison”, Journal of Management Development, vol. 23 no. 4, pp. 321-38.
London, M. and Larsen, H. (1999), “Relationships between feedback and self-
development”, Group and Organization Management, vol. 24 no. 1, pp. 5-27.
Madsen, S. R., Miller, D. and John, C. R. (2005), “Readiness for organizational
change: Do organizational commitment and social relationships in the workplace
make a difference?”, Human Resource Development Quarterly, vol. 16 no. 2, pp. 213-
33.
Malhotra, N. K. (1993), Marketing Research: An Applied Orientation, Prentice-Hall
International, London.
Mathieu, J. and Hamel, D. (1989), “A cause model of the antecedents of
organizational commitment among professionals and non-professionals”, Journal of
Vocational Behaviour, vol. 34, pp. 299-317.
66

Mathieu, J. and Zajac, D. (1990), “A review of meta-analysis of the antecedents,
correlates and consequences of organizational commitment”, Psychological Bulletin,
vol. 108 no. 2, pp. 171-94.
Mayer, R. C. and Schoorm, F. C. (1992), “Predicting participation and production
outcomes through a two-dimensional model of organizational commitment”, Academy
of Management Journal, vol. 35 no. 3, pp. 671-84.
McCaul, H. S., Hinsz, V. B. and McCaul, K. D. (1995), “Assessing organizational
commitment: An employee's global attitude towards the organization”, Journal of
Applied Behavioural Science, vol. 31 no. 1, pp. 80-90.
Mehta, R., Dubinsky, A. J. and Anderson, R. E. (2003), “Leadership style, motivation
and performance in international marketing channels: An empirical investigation of
the USA, Finland and Poland”, European Journal of Marketing, vol. 37 no. 1/2, pp.
50-85.
Mehta, R., Larsen, T. and Rosenbloom, B. (1996), “The influence of leadership style
on co-operation in channels of distribution”, International Journal of Physical
Distribution & Logistics Management, vol. 26 no. 6, pg. 32.
Meyer, J. P., Paunonen, S. V., Gettatly, I. R., Goffin, R. D. and Jackson, D. N. (1989),
“Organizational commitment and job performance: it’s the nature of the commitment
that counts”, Journal of Applied Psychology, vol. 74 no. 1, pp. 152-6.
Michaels, P. (1994), “An expanded conceptual framework on organizational
commitment and job satisfaction for salesforce management”, Journal of Business
and Society, vol. 7 no. 1, pp. 42-67.
Motowidlo, S. J. and Van Scotter, J. R. (1994), “Evidence that task performance
should be distinguished from contextual performance”, Journal of Applied
Psychology, vol. 79, pp. 475-80.
67

Mottaz, C. (1988), “Determinants of organizational commitments”, Human Relations,
vol. 41 no. 6, pp. 467-82.
Mowday, R. T., Porter, L. M. and Dubin, R. (1974), “Unit performance, situational
factors and employee attitudes in spatially separated work units”, Organizational
Behaviour and Human Performance, vol. 12, pp. 231-48.
Mowday, R. T., Porter, L. M. and Steer, R. M. (1982), Employee-Organization
Linkages: The psychology of commitment, absenteeism and turnover, Academic Press,
New York.
Mowday, R. T., Steers, R. M. and Porter, L. W. (1979), The measurement of
organizational commitment, Journal of Vocational Behaviour, vol. 14, pp. 224-47.
Oppenheim, A. N. (2004), Questionnaire Design, Interviewing and Attitude
Measurement, New Edition, Continuum, New York, NY.
Peters, T. and Waterman, R. (1982), In Search of Excellence, Harper and Row, New
York, NY.
Pool, S. W. (1997), “The relationship of job satisfaction with substitutes of leadership,
leadership behaviour, and work motivation”, The Journal of Psychology, vol. 13 no.
3, pp. 271-83.
Porter, L. W., Steers, R. M., Mowday, R. T. and Boulian, P. V. (1974),
“Organisational commitment, job satisfaction and turnover among psychiatric
technicians”, Journal of Applied Psychology, vol. 59 no. 5, pp. 603-9.
Price, J. and Mueller, C. (1981), Professional Turnover: The Case of Nurses, Medical
and Scientific Books, New York, NY.
Poh, F. F. (2002), “The relationship between employee intention to leave with job
satisfaction and organizational commitment”, Faculty of Business and Accountancy,
Universiti Malaya, Dissertation (M.B.A.).
68

Putti, J. M., Aryee, S. and Phua, J. (1990), “Communication relationship satisfaction
and organizational commitment”, Group & Organization Studies, vol. 15 no. 1, pp.
44-52.
Quinn, R. E. and Cameron, K. (1983), “Organizational life cycles and sifting criteria
of effectiveness: Some preliminary evidence”, Management Science, vol. 29, pp. 33-
51.
Quinn, R. E. and Rohrbaugh, J. (1983), “A spatial model of effectiveness criteria:
Towards a competing values approach to organizational analysis”, Management
Science, vol. 29, pp. 363-77.
Rad, A. M. M. and Yarmohammadian, M. H. (2006), “A study of relationship
between managers’ leadership style and employees’ job satisfaction”, Leadership in
Health Services, vol. 19 no. 2, pp. 11-28.
Randall, D. M., Fedor, D. B. and Longenecker, C. O. (1990), “The behavioral
expression of organizational commitment”, Journal of Vocational Behavior, vol. 36
no. 2, pp. 210-24.
Rashid, M. Z. A., Sambasivan, M. and Johari, J. (2003), “The influence of corporate
culture and organizational commitment on performance”, Journal of Management
Development, vol. 22 no. 8, pp. 708-28.
Rashid, M. Z. A., Sambasivan, M. and Rahman, A. A. (2004), “The influence of
organizational culture on attitudes toward organizational change”, Leadership &
Organizational Development Journal, vol. 25 no. 2, pp. 161-79.
Robbins, S. P. (2005), Organizational Behaviour, 11th ed., Pearson Prentice Hall,
New Jersey.
69

Russ, F. A. and McNeilly, K. M. (1995), “Links among satisfaction, commitment, and
turnover intentions: The moderating effect of experience, gender and performance”,
Journal of Business Research, vol. 34 no. 1, pp. 57-65.
Samad, S. (2005), “Unraveling the organizational commitment and job performance
relationship: Exploring the moderating effect of job satisfaction”, The Business
Review, Cambridge, vol. 4 no. 2, pp. 79-84.
Savery, L. K. (1994), “Attitudes to work: The influence of perceived style of
leadership on a group of workers”, Leadership and Organization Development
Journal, vol. 15 no. 4, pp. 12-18.
Scarpello, V. and Campbell, J. P. (1983), “Job satisfaction: Are all the parts there?”,
Personal Psychology, vol. 36, pp. 557-600.
Schein, E. (1985), “How culture forms, develops and change”, in Kilman, P. H.,
Saxton, M. J., Serpa, R. and Associates (eds.), Gaining Control of the Corporate
Culture, Jossey-Bass, San Francisco, CA.
Sergiovanni, T. and Corbally, J. (1984), Leadership and Organizational Culture,
University of Chicago, Chicago, IL.
Shadur, M. A., Kienzle, R. and Rodwell, J. J. (1999), “The relationship between
organizational climate and employee perceptions of involvement: The importance of
support”, Group & Organization Management, vol. 24 no. 4, pp. 479-503.
Silverthorne, C. (2001), “A test of the path-goal leadership theory in Taiwan”,
Leadership & Organization Development Journal, vol. 22 no. 4, pp. 151-8.
Silverthorne, C. (2004), “The impact of organizational culture and person-
organization fit on organizational commitment and job satisfaction in Taiwan”, The
Leadership & Organization Development Journal, vol. 25 no. 7, pp. 592-9.
70

Smircich, L. (1983), “Concepts of culture and organizational effectiveness”,
Administrative Science Quarterly, vol. 28 no. 3, pp. 339-58.
Smith, P. B. and Peterson, M. F. (1988), Leadership, Organizations and Culture: An
Event Management Model. Sage, London.
Stevens, J. M., Beyer, J. M. and Trice, H. M. (1978), “Assessing personal role and
organizational predictors of managerial commitment”, Academy of Management
Journal, vol. 21, pp. 380-96.
Stogdill, R. M. (1963), Manual for Leadership Description Questionnaire Form XII,
The Ohio State University Bureau of Business Research, Columbus, OH.
Tabachnick, B. G. and Fidell, L. S. (1983), Using Multivariate Statistics, Harper &
Row Publishers, New York.
Tan, W. L. (2005), “A partial test of path-goal theory of leadership in the domain of
Malaysia”, Faculty of Business and Accountancy, Universiti Malaya, Dissertation
(M.B.A.).
Taunton, R., Kramptiz, S. and Wood, C. (1989), “Manager impact on retention of
hospital staff, Part 1”, Journal of Nursing Administration, vol. 19 no. 3, pp. 14-9.
Tichy, N. and Cohen, E. (1997), The Leadership Engine, Harper Business, New York,
NY.
Trice, H. and Beyer, J. M. (1993), The Cultures of Work Organization, Prentice-Hall,
Englewood Cliffs, NJ.
Wallach, E. J. (1983, February), “Individuals and organizations: The cultural match.”
Training and Development Journal, vol. 37, pp. 29-36.
Wanous, J., Reicher, A. E. and Hudy, M. (1987), “Overall job satisfaction : How good
are single-item measures?“, Journal of Applied Psychology, vol. 82, pp. 247-52.
71

Ward, E. A. and Davis, E. (1995), “The effect of benefit satisfaction on organization
commitment”, Compensation & Benefits Management, vol. 11 no. 3, pp. 35-40.
Williams, L. J. and Hazer, J. T. (1986), “Antecedents and consequences of
satisfaction and commitment in turnover models: A re-analysis using latent variable
structural equation methods”, Journal of Applied Psychology, vol. 71 no. 2, pp. 219-
31.
Wright, T. A. (1997), “Job performance and organizational commitment”, Perceptual
and Motor Skills, vol. 85 no. 2, pp. 447-50.
Young, M. and Dulewicz, V. (2007), “Relationships between emotional and
congruent self-awareness and performance in the British Royal Navy”, Journal of
Managerial Psychology, vol. 22 no. 5, pp. 465-78.
Yousef, D. A. (2000), “Organizational commitment: A mediator of the relationships
of leadership behaviour with job satisfaction and performance in a non-western
country”, Journal of Managerial Psychology, vol. 15 no. 1, pp. 6-28.
Yousef, D. A. (2001), “Islamic work ethic: A moderator between organizational
commitment and job satisfaction in a cross-cultural context”, Personnel Review, vol.
30 no. 2, pp. 152-69.
72

1
APPENDIX 1

UNIVERSITY OF MALAYA
The Faculty of Business and Accountancy Master of Business Administration
Examining the association between organization culture and leadership behaviour and organizational commitment, job satisfaction and employee performance – a Malaysian perspective.
Dear Sir/Madam, This survey is conducted as part of an MBA Research Project, which shall be submitted in part completion of the Master of Business Administration degree from the University of Malaya. The general purpose of this study is to examine the association between organization culture and leadership behaviour and organizational commitment, job satisfaction and employee performance from a Malaysian perspective. I would like to invite your participation in this survey by filling up the attached questionnaire. The said questionnaire is constructed in a straightforward manner and easy to answer, which should take not more than 10 minutes of your valuable time. Please be assured that all information will be treated with the strictest confidentiality and only the aggregate data will be analyzed. Please answer all the questions in the worksheet and return the completed questionnaire. Thank you for your valuable assistance in participating in the survey. Yours sincerely, Lee Huey Yiing Supervised by, Dr. Kamarul Zaman bin Ahmad Department of Business Strategy and Policy Faculty of Business & Accountancy University of Malaya
1

1. ORGANIZATION CULTURE Please circle the score which most closely corresponds with how you see your organization : Does not
describe my organization
Describe my organization a little
Describes my organization a fair amount
Describes my organization most of the time
a) risk taking 1 2 3 4
b) collaborative 1 2 3 4
c) hierarchical 1 2 3 4
d) procedural 1 2 3 4
e) relationships-oriented 1 2 3 4
f) results-oriented 1 2 3 4
g) creative 1 2 3 4
h) encouraging 1 2 3 4
i) sociable 1 2 3 4
j) structured 1 2 3 4
k) pressurized 1 2 3 4
l) ordered 1 2 3 4
m) stimulating 1 2 3 4
n) regulated 1 2 3 4
o) personal freedom 1 2 3 4
p) equitable 1 2 3 4
q) safe 1 2 3 4
r) challenging 1 2 3 4
s) enterprising 1 2 3 4
t) established, solid 1 2 3 4
u) cautious 1 2 3 4
v) trusting 1 2 3 4
w) driving 1 2 3 4
x) power-oriented 1 2 3 4
2. JOB SATISFACTION Please circle the score that most describes yourself : All things considered, how satisfied are you with your job?
1 2 3 4 5 Not
satisfied Moderately
satisfied Very
satisfied
2

3. LEADERSHIP BEHAVIOUR Please circle the score which most closely describes your immediate supervisor : Strongly agree
Very true Strongly disagree
Very unlikely
1) Before making decisions, he/she considers what his/her subordinates have to say
1 2 3 4 5 6 7
2) Before taking action he/she consults with subordinates
1 2 3 4 5 6 7
3) When faced with a problem, he/she consults with subordinates
1 2 3 4 5 6 7
4) He/she asks subordinates for their suggestions 1 2 3 4 5 6 7
5) He/she listens to subordinate's advice on which assignments should be made
1 2 3 4 5 6 7
6) He/she helps people to make working on their tasks more pleasant
1 2 3 4 5 6 7
7) He/she looks out for the personal welfare of group members
1 2 3 4 5 6 7
8) He/she does little things to make things pleasant 1 2 3 4 5 6 7
9) He/she treats all group members as equals 1 2 3 4 5 6 7
10) He/she explains the way tasks should be carried out 1 2 3 4 5 6 7
11) He/she decides what and how things shall be done 1 2 3 4 5 6 7
12) He/she maintains definite standards of performance 1 2 3 4 5 6 7
13) He/she schedules the work to be done 1 2 3 4 5 6 7
4. PERFORMANCE Please circle the score that most describes yourself : 1) My standard of job performance :
1 2 3 4 5 Does not meet
standard Meets standard Exceeds standard
2) Compared to another person of the same rank, I would rate my performance as :
1 2 3 4 5 Low level Moderate level High level
3) Compared to other members of my department/team, I would rate my contribution to the organization as :
1 2 3 4 5 Less contribution Enough contribution More contribution
3

5. ORGANIZATIONAL COMMITMENT Please circle the score that most describes yourself and your opinions of your organization : Strongly agree
Very true Strongly disagree
Very unlikely
1) In general, the work I am given to do at my organization is challenging and exciting
1 2 3 4 5 6 7
2) This organization always makes clear what is expected of me
1 2 3 4 5 6 7
3) In my organization, I often find myself working on assignments without a clear understanding of what it is I am supposed to be doing
1 2 3 4 5 6 7
4) The requirements of my job are not particularly demanding
1 2 3 4 5 6 7
5) The top management people in my organization pay attention to ideas brought to them by other employees
1 2 3 4 5 6 7
6) Among the people in this organization there are few close relationships
1 2 3 4 5 6 7
7) I feel I can trust this organization to do what it says it will do
1 2 3 4 5 6 7
8) There are people in this organization who are getting much more than they deserve and others who are getting much less
1 2 3 4 5 6 7
9) In this organization you are encouraged to feel that the work you do makes important contributions to the larger aims of the organization
1 2 3 4 5 6 7
10) I am rarely given feedback concerning my performance on the job
1 2 3 4 5 6 7
11) In my organization, I am allowed to participate in decisions regarding my workload and performance standards
1 2 3 4 5 6 7
4

6. DEMOGRAPHIC INFORMATION Please tick the response that describes yourself and your organization : 1. Age:
20 – 29 years 30 – 39 years
40 – 49 years 50 and above
2. Gender:
Female Male
3. Education level:
Secondary Diploma Degree Post Graduate
4. Marital status:
Single Married
5. Current job position:
Administrative/Clerical Assistant Manager
Technician Manager/Senior Manager
Executive/Senior Exec Other – please specify
6. How many years have you worked for your current employer?
Less than 3 years 3 – 6 years
7 – 10 years More than 10 years
7. What is the type of business of your organization?
Manufacturing (e.g. production, assembly, etc.)
Service (e.g. sales, banking, education, consultancy, etc.)
Other – please specify
8. What is the nature of your organization?
Private/Proprietary Government
Government-linked (GLC) Other – please specify
9. How many years of establishment is your organization?
Less than 10 years 10 – 15 years More than 15 years
10. How many employees work in your organization?
Less than 100 100 – 300
301 - 700 More than 700
5

UNIVERSITY OF MALAYA
The Faculty of Business and Accountancy Master of Business Administration
Examining the association between organization culture and leadership behaviour and organizational commitment, job satisfaction and employee performance – a Malaysian perspective.
Dear Sir/Madam, This survey is conducted as part of an MBA Research Project, which shall be submitted in part completion of the Master of Business Administration degree from the University of Malaya. The general purpose of this study is to examine the association between organization culture and leadership behaviour and organizational commitment, job satisfaction and employee performance from a Malaysian perspective. I would like to invite your participation in this survey by filling up the attached questionnaire. The said questionnaire is constructed in a straightforward manner and easy to answer, which should take not more than 10 minutes of your valuable time. Please be assured that all information will be treated with the strictest confidentiality and only the aggregate data will be analyzed. Please answer all the questions by typing “x” in the yellow boxes that correspond to your responses. I would really appreciate if you could return the completed questionnaire to [email protected] Thank you for your valuable assistance in participating in the survey. Yours sincerely, Lee Huey Yiing Supervised by, Dr. Kamarul Zaman bin Ahmad Department of Business Strategy and Policy Faculty of Business & Accountancy University of Malaya
1

2
1. ORGANIZATION CULTURE Please type “x” in the box that most closely corresponds with how you see your organization : Does not
describe my organization
Describe my organization a little
Describes my organization a fair amount
Describes my organization most of the time
a) risk taking
b) collaborative
c) hierarchical
d) procedural
e) relationships-oriented
f) results-oriented
g) creative
h) encouraging
i) sociable
j) structured
k) pressurized
l) ordered
m) stimulating
n) regulated
o) personal freedom
p) equitable
q) safe
r) challenging
s) enterprising
t) established, solid
u) cautious
v) trusting
w) driving
x) power-oriented
2. JOB SATISFACTION Please type “x” in the box which that most describes yourself : All things considered, how satisfied are you with your job?
Not
satisfied Moderately
satisfied Very
satisfied

3
3. LEADERSHIP BEHAVIOUR Please type “x” in the box which most closely describes your immediate supervisor : Strongly agree
Very true Strongly disagree
Very unlikely
1) Before making decisions, he/she considers what his/her subordinates have to say
2) Before taking action he/she consults with subordinates
3) When faced with a problem, he/she consults with subordinates
4) He/she asks subordinates for their suggestions
5) He/she listens to subordinate's advice on which assignments should be made
6) He/she helps people to make working on their tasks more pleasant
7) He/she looks out for the personal welfare of group members
8) He/she does little things to make things pleasant
9) He/she treats all group members as equals
10) He/she explains the way tasks should be carried out
11) He/she decides what and how things shall be done
12) He/she maintains definite standards of performance
13) He/she schedules the work to be done
4. PERFORMANCE Please type “x” in the box that most describes yourself : 1) My standard of job performance :
Does not meet standard Meets standard Exceeds standard 2) Compared to another person of the same rank, I would rate my performance as :
Low level Moderate level High level 3) Compared to other members of my department/team, I would rate my contribution to the organization as :
Less contribution Enough contribution More contribution

4
5. ORGANIZATIONAL COMMITMENT Please type “x” in the box that most describes yourself and your opinions of your organization : Strongly agree
Very true Strongly disagree
Very unlikely
1) In general, the work I am given to do at my organization is challenging and exciting
2) This organization always makes clear what is expected of me
3) In my organization, I often find myself working on assignments without a clear understanding of what it is I am supposed to be doing
4) The requirements of my job are not particularly demanding
5) The top management people in my organization pay attention to ideas brought to them by other employees
6) Among the people in this organization there are few close relationships
7) I feel I can trust this organization to do what it says it will do
8) There are people in this organization who are getting much more than they deserve and others who are getting much less
9) In this organization you are encouraged to feel that the work you do makes important contributions to the larger aims of the organization
10) I am rarely given feedback concerning my performance on the job
11) In my organization, I am allowed to participate in decisions regarding my workload and performance standards

6. DEMOGRAPHIC INFORMATION Please type “x” in the box that describes yourself and your organization : 1. Age:
20 – 29 years 30 – 39 years 40 – 49 years 50 and above
2. Gender: Female Male
3. Education level: Secondary Diploma Degree Post Graduate
4. Marital status: Single Married
5. Current job position: Administrative/Clerical Assistant Manager Technician Manager/Senior Manager Executive/Senior Exec Other – please specify
6. How many years have you worked for your current employer? Less than 3 years 3 – 6 years 7 – 10 years More than 10 years
7. What is the type of business of your organization? Manufacturing (e.g. production, assembly, etc.) Service (e.g. sales, banking, education, consultancy, etc.) Other – please specify
8. What is the nature of your organization? Private/Proprietary Government Government-linked (GLC) Other – please specify
9. How many years of establishment is your organization? Less than 10 years 10 – 15 years More than 15 years
10. How many employees work in your organization? Less than 100 100 – 300 301 - 700 More than 700
5
Related Documents