promoting access to White Rose research papers White Rose Research Online Universities of Leeds, Sheffield and York http://eprints.whiterose.ac.uk/ White Rose Research Online URL for this paper: http://eprints.whiterose.ac.uk/2575/ Published work Toms, S. Salama, A. Nguyen, D.T. (2005) The Association between Accounting and Market-Based Risk Measures. Working Paper. Department of Management Studies, University of York, York. [email protected]

Welcome message from author
This document is posted to help you gain knowledge. Please leave a comment to let me know what you think about it! Share it to your friends and learn new things together.
Transcript
promoting access to White Rose research papers
White Rose Research Online
Universities of Leeds, Sheffield and York http://eprints.whiterose.ac.uk/
White Rose Research Online URL for this paper: http://eprints.whiterose.ac.uk/2575/
Published work Toms, S. Salama, A. Nguyen, D.T. (2005) The Association between Accounting and Market-Based Risk Measures. Working Paper. Department of Management Studies, University of York, York.
University of York Department of Management Studies
Working Paper 15 December 2005
ISSN Number: 1743-4041
The Association between Accounting and Market-Based Risk Measures
Steven Toms Department of Management Studies
Aly Salama (University of Sunderland)
and Duc Tuan Nguyen
This paper is circulated for discussion purposes only and its contents should be
considered preliminary.
Abstract
The paper derives operating and financial measures of leverage and tests their
association with market based measures of equity risk. It is the first such study to use
purely accounting-based data to derive the leverage measures. In line with previous
literature it conducts a new test on the relative importance of operating and financial
leverage. The results suggest that operating costs have a greater impact.
Keywords: Systematic risk, Operating Leverage, Financial Leverage, Beta, Risk
Premium, United Kingdom
1
The Association between Accounting and Market-Based Risk Measures
1. INTRODUCTION
The paper examines the proposition that the underlying cost structure of the firm
explains the systematic risk of its cash flow and the consequent behaviour of the
firm’s stock price. Whilst the intuition of this relationship may seem self-evident, it
has been the subject of relatively little empirical research. Systematic risk arises
because the firm is the subject of fixed claims but faces variable revenues (Huffman,
1983). The fixed claims associated with debt finance have attracted the attention of
the majority of research into the nature of leverage based adjustments of systematic
risk. For Modigliani and Miller, (1963) and Miller, (1977) the underlying asset beta or
risk class of the all equity firm is specified in advance. In the standard corporate
finance text, the asset beta is computed from the market-based equity beta adjusting
for leverage effects (Watson and Head, 1998). A likely much larger class of fixed
claims however arises from the general operating costs of the business and this has
attracted relatively little attention (an exception is Rosett, 2003). A possible important
reason for these biases in the research agenda is the dominance of finance over
accounting based perspectives in the analysis of systematic risk. Theoretical analyses
use financial market data in conjunction with accounting data to develop operating
leverage variables (Gahlon and Gentry, 1982, Huffman, 1983). Similarly empirical
studies using operating leverage have unanimously incorporated market numbers in
their measures of operating leverage (for example, Hamada, 1972, Mandelker and
Rhee, 1984, Huffman, 1989, Rosett, 2003). Instead, this paper uses exclusively
accounting data, using company accounts and national income statistics.
It then presents an empirical test examining the relative impact on market
based systematic risk of operating and financial leverage variables derived using
comparable profit and loss account data. An important empirical question is the
relative impact of different cost categories on total systematic risk. If, by extension of
Modigliani and Miller (1958), variance in total cash flow is a function of the presence
of not just interest based, but all fixed charges, it would seem logical to expect
operating leverage to account the more strongly for the firm’s systematic risk. Of the
small number of studies that have examined the joint and complementary effects of
operating and financial leverage, few have examined the quantitative impacts of
2
differing categories of fixed costs on a systematic basis. An exception is Lord (1996)
whose empirical study focuses on three sectors and ends with a call for further
research in wider contexts. Moreover, in the international context, including the focus
of this study, the United Kingdom, recent evidence is particularly limited.
The examination of operating leverage in the UK and international context is
particularly interesting for a number of reasons. First, it provides a mechanism for
linking the stock price return to the underlying short-run cost structure of the firm.
The presence of certain costs, such as knowledge-based labour, research or capital
intensive activities, and scale based production, which have been linked to
competitive advantage (Grant, 1996, Lazonick, 1991) may also lead to the creation of
fixed cost structures that promote shareholder risk. A further rationale has emerged
from recent changes in corporate behaviour, associated with the rise of the notions of
the flexible firm and flexible labour markets and their impact on underlying cost
behaviour (Armstrong, 2002), which may be expected to attenuate stock market risk.
All previous studies predate the major impacts of these changes in the 1990s and the
final reason is therefore that earlier empirical findings might be open to question. This
is particularly the case in the United Kingdom, where the impact of these ideas has
been at least as great if not greater than in the United States. Further work is of
particular value given the major direction of institutional reforms in the UK recently
with the objectives of de-regulation and the creation of more flexible markets.
Consequently a related reason is that theories of competitive advantage suggest a
degree of managerial discretion in asset acquisition and that operating leverage does
not merely reflect industry membership (Brigham and Gapenski, 1994). A third
reason is that where managers are committed to high fixed cost investment, they
might exercise greater caution in the borrowing decision. Interactions between
operating and financial leverage are therefore potentially important.
To examine these issues in more detail, the remainder of the paper is organised
as follows. The next section introduces an alternative perspective on accounting based
risk measurement and then reviews the prior literature, particularly concentrating on
previous empirical analyses of operating leverage. Subsequent sections describe the
hypotheses, data, and results. A final section draws conclusions.
3
2. ACCOUNTING NUMBERS AND MARKETS RISK: THEORETICAL AND
EMPIRICAL APPROACHES
Accounting based measures of financial risk
Because the variability of the firm’s profits is a function of the firm’s underlying cost
structure, systematic shareholder risk depends on the ratio of fixed to total cost. At the
aggregate this relationship is captured through gearing or leverage. It has two major
components, the degree of financial leverage (DFL) and the degree of operating
leverage (DOL). DFL depends on the degree of fixed interest charges that must be
paid irrespective of the level of profit. For the purposes of this analysis, it is defined
as the rate of change in profit after interest divided by the rate of change in profit
before interest. DOL is defined as the rate of change in profits before interest divided
by the rate of change in sales. DOL can be used to compute an ‘operating’ or ‘asset’
beta by relating the proportion of fixed cost to total cost for one particular firm to the
proportion of fixed cost to total cost for all firms.
The intuition of this approach is exactly the same as the adjustment of the cost
of capital for the presence of fixed interest charges (Modigliani and Miller (1958,
Hamada, 1972). Further analytical models (Lev, 1974, Gahlon and Gentry, 1982,
Huffman, 1983 and Mandelker and Rhee, 1984) extend this relationship to include
risk measures that depend jointly on underlying accounting and market numbers. In
one view financial managers facing high DOL risk can deliberately adopt financial
plans that involve low DFL to achieve an appropriate level of total stock risk. The
hypothesis implies that changes in DOL and DFL are independent of each other and
that total leverage is a product of DOL and DFL. The DOL and DFL non-interaction
view is criticised by Huffman (1983), emphasising the endogenous nature of the
capacity decision of the firm. Using an option pricing approach, she assumed that the
commitment to fixed capacity investment depends on the ex ante debt level. Therefore
the capacity decision attenuates the increase in equity risk caused by an increase in
business risk but that the attenuating ability decreases as either revenue declines or the
level of outstanding debt increases. Also the capacity decision partially offsets the
effect of a debt increase on stock risk insofar as the debt is below a critical level.
Huffman’s approach seems correct as far as total risk is concerned and is confirmed
by empirical tests (Li and Henderson, 1991), but less appealing as far as systematic
risk is concerned. Debt increases themselves appear exogeneous in Huffman’s
4
formulation, but are more likely in reality to be associated with decisions to increase
capacity. Moreover, capacity alterations, where endogenous, are the subject of
intermittent decisions difficult to observe by market analysts, and are more likely to
be attributable to unsystematic changes. On the other hand variables that are more
likely to be systematically endogeneous include structural supply and labour market
conditions, which can be fixed or varied in response to the ex ante debt level.
The accounting Beta (βac) as derived from global OG decomposes into specific
betas by Cost (C) type C1…n and a Sales Beta (βs):
βac = βc1 * βc2 * βs (1)
Interest costs arising from financial gearing comprise one of these cost categories. The
formulation in (1) is similar to the reconciliation of real asset risk and market risk by
Gahlon and Gentry (1982, p.17):
CV(π) = DOL * DFL *CV(REV) (2)
Where CV(π) and CV(REV) are respectively the co-efficients of variation of profit and
revenue. Equations (1) and (2) are consistent because the classes of beta in (1) are
defined as DOL(C)i/DOL(C)m, (etc) where i = the firm and m = all firms.1
In contrast to prior literature, the argument in the present paper is that equation
(1) wholly and exclusively accounts for ex post systematic risk. Ex ante systematic
risk depends on the forecast expectations of relative rates of change in cost and
revenue categories by firm insiders and market participants. Where firms use rational
planning such expectations will be built into budget forecasts.
The relationship between global systematic risk and individual cost categories
suggests that the weight of each category relative to total cost will have a
proportionate impact on the overall beta. The empirical section of the paper tests this
intuition by examining the relative aggregate impact of interest based and other fixed
costs. Using data obtained from the National Accounts (UKNA, 2005, 3.1.1 and 3.1.3,
pp.121-22) suggests of total costs of £1003bn deducted from total resources to arrive
at operating surplus for non-financial corporations, the estimated proportionate fixed
cost in 2002 is £158bn (16%).2 Interest charges for 2002 were £37bn. In short, it is
5
possible that non-interest related fixed costs are approximately four times the level of
interest based fixed costs. Such an estimate may seem reasonable if it is borne in mind
that other fixed costs include for example wages and salaries, which are often both
material and fixed in contractual terms at least in the relatively short run and are more
often based on time rates than piece rates. Nonetheless the relative impact of these
categories is a currently unanswered empirical question and is addressed below in the
review of prior empirical literature and in the subsequent tests.
Prior empirical literature
Prior empirical studies have concentrated mainly on financial leverage. In the
minority of empirical studies that have considered both operating and financial
leverage elements, it has been assumed and to some extent proven that they have
equal or complementary effect on total risk. The evidence, albeit limited, shows that
where their effects are compared, operating leverage has equal or greater importance
compared to financial leverage (Lev, 1974, Mandelker and Rhee, 1984, Li and
Henderson (1991). Evidence from these studies is based on a wide variety of methods
for estimating operating and financial leverage and predates many structural changes
affecting the US, UK and other economies.
There is limited and contradictory empirical evidence on the relationship
between financial leverage and beta. Hamada (1972) found that approximately a
quarter of the observed cross-sectional variation in a stock’s beta could be explained
by the DFL of the underlying firm. Further empirical evidence of the association
between the DFL and beta was also reported by several other studies that applied and
extended the risk-decomposition method (Hill and Stone 1980; Chance, 1982, and
Mohr, 1985). However, a few researchers have failed to detect a significant positive
effect of DFL on beta (Thompson, 1976; Chung, 1989). These equivocal results may
be the result of the relatively small proportion of fixed costs accounted for by interest
charges or the variation in methods used to estimate financial leverage.
Early studies examining the role of accounting beta found considerable
support for a positive relationship between operating leverage and systematic risk
(Beaver, Kettler and Scholes, 1970, Beaver and Manegold, 1975, Gonedes 1973, 1975
6
Hill and Stone, 1980). Lev (1974) also found empirical support for his model from a
sample of firms in electric utility, steel, and oil industries. As noted by Chung (1989),
there are limitations in Lev’s approach and conclusion because the method of cost
decomposition employed may suffer serious measurement problems. Moreover, Lev
(1974) included interest expenses in his definition of fixed costs, which made it
difficult to separate the pure effect of the DOL. More recently, Rosett (2003) found
only a weak relationship between total market risk and operating leverage, finding
instead that labour cost leverage was a more important variable. Although these
results are interesting, and form the basis for further research using decompositions of
operating leverage, the purpose of the present paper is to examine the impact purely
the accounting derived measures of operating and financial leverage on systematic
market risk.
In other studies, variation in the operating risk component has been typically
explained in terms of the diversification of business activities across segments which
themselves have differing levels of industry risk. Underlying asset betas are estimated
with reference to stock market returns for the appropriate industry segment
(Rubinstein, 1973, Fuller and Kerr, 1981), which are then adjusted or not to take
account of the impact of firm specific debt (Butler et al, 1991). A problem with this
approach is that underlying operating risk is derived from observable market risk.
Where betas are particularly useful to corporate managers, for example in evaluating
divisional investment opportunities, it is intuitively more appealing to begin with an
analysis of the underlying cost structure and its variation.
Several other studies have examined the joint impact of the operating leverage
ratio on aggregate beta, usually in conjunction with the financial leverage ratio
(Gahlon and Gentry, 1982, Mandelker and Rhee, 1984, Huffman, 1989, Darrat and
Mukherjee 1995, Li and Henderson 1991, Lord, 1996). These studies have confirmed
the importance of operating leverage relative to financial leverage. At the same time
their empirical focus is quite narrow (US-based, industry and time specific) and is
suggestive of the value of new studies in the wider international and UK context.
Also the interpretation of their results has been problematic. In their empirical
test of the explanatory power of the DOL and DFL, Mandelker and Rhee (1984)
found the two variables explained a considerable proportion of the variation in beta at
portfolio level. Especially when instrumental variables were used for portfolio
7
grouping, DOL and DFL accounted for 38 to 48% of cross-sectional variation of
betas. Further, there was significant correlation between DOL and DFL, suggesting
that firms trade-off between DOL and DFL. Although the hypothesised positive
relationships between DOL and DFL and stock risk are theoretically sound more
recent evidence questions the robustness of these relationships. Huffman (1989)
discovered negative relationship between systematic risk and DOL (the opposite of
Mandelker and Rhee’s findings). Also, he found no support for the negative
correlation between DOL and DFL observed by Mandelker and Rhee (1984). Li and
Henderson (1991) found that while DOL was significant, only a weak positive beta-
DFL relationship was detected. An interaction term between the two leverage
measures, included to test Huffman’s (1983) hypothesis, was found to be significantly
related to total risk at the 90% confidence level, but not to beta. Darrat and Mukherjee
(1995), employing a causality approach that differs from the common correlation
technique, also found support for Huffman’s (1983) model. By contrast, Lord’s
(1996) study did not confirm the impact of an interrelationship between DOL and
DFL on total, unsystematic and systematic risk, as implied by Huffman (1983). Lord
(1996) also reported significant positive correlation between DOL and the three risk
measures. DFL, however, was significantly related to total and unsystematic risk, but
not systematic risk.
One important reason for the inconsistency in empirical evidence of the
relationship between DOL and DFL and stock risk may be the problem in finding the
correct measurements of the two types of leverage. The most commonly used proxy
for DOL is the ratio of the percentage change in earning before interest and tax
(EBIT) to the percentage change in sales, estimated by regressing EBIT on sales
through time. However where sales are growing, simple time-series regression
techniques capture growth rather than leverage (O’Brien and Vanderheiden, 1987). As
an alternative, they suggest a two-stage time-series regression technique to eliminate
the pattern in the growth of sales. The regression techniques require lengthy
estimation periods for reliability and at the same time must assume that underlying
assumption is nonetheless that DOL and DFL stay unchanged during the estimation
period.3 Furthermore, as Dugan et al. (1994) observed, the assumption of constant
leverage causes the test of the DOL-DFL trade-off hypothesis to be inconsistent in
8
itself because this hypothesis implies that the two measures can change as corporate
managers attempt to create a balanced total risk.
To avoid these problems, the current paper uses the point-to-point estimates of
DOL and DFL averaged out over the same period as the beta estimation period. Lord
(1996) is one of a few authors who employed the point-to-point estimate approach but
he did not state whether or not the estimates are averaged out over the same period for
beta estimation. However, like other estimate techniques, the point to point approach
still has possible problems arising from price effects (i.e. using sales rather than
output figures) and discrepancies in accounting methods as suggested by Huffman
(1989). However the major advantage as far as the current study is concerned is that it
can be applied consistently with the cost category decomposition approach discussed
above. Such an approach is also consistent with equation (2) above, so that DOL is
based on changes in EBIT and sales and DFL is based on changes in Earnings before
tax (EBT) and EBIT. Total leverage is therefore change in EBT divided by change in
sales.
Overall the literature suggests that theoretically, DOL and DFL are strongly
related to beta and total risk but empirically the leverage-risk relationship is not so
strong. The difficulty in identifying the true measures of DOL and DFL is probably
one important reason for such inconsistency. The theoretical review has stressed the
possibility of using purely accounting data to gain further insight into the nature of
systematic risk. The expectation is that DOL will be of greater relative importance to
DFL as a determinant of beta. Consistent use of accounting data also helps to
overcome inconsistencies in the empirical literature, which have not used precise
accounting based point to point estimates. In addition the different UK context has the
potential to provide further insight into the leverage-risk relationship.
3. HYPOTHESES AND DATA
3.1 Model and variable definition
In this section the models to be tested are introduced based on the discussion above.
The general model follows from equation (2) above with the addition of appropriate
control variables:
9
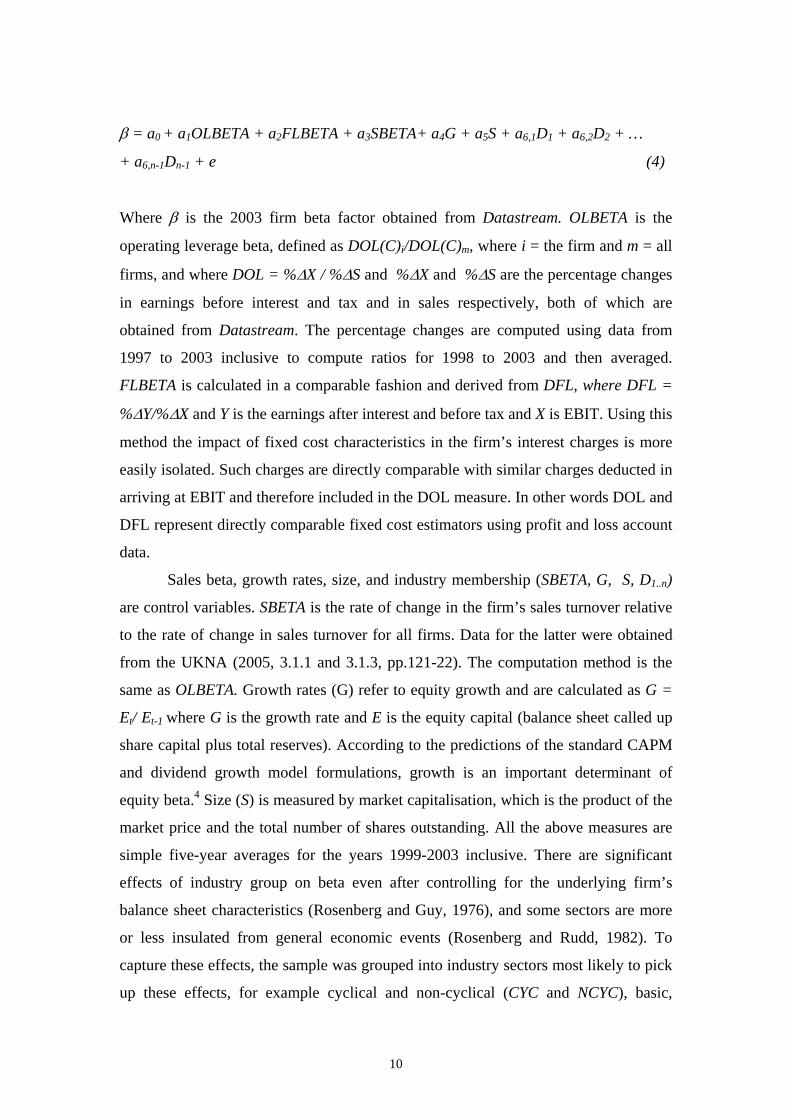
β = a0 + a1OLBETA + a2FLBETA + a3SBETA+ a4G + a5S + a6,1D1 + a6,2D2 + …
+ a6,n-1Dn-1 + e (4)
Where β is the 2003 firm beta factor obtained from Datastream. OLBETA is the
operating leverage beta, defined as DOL(C)i/DOL(C)m, where i = the firm and m = all
firms, and where DOL = %∆X / %∆S and %∆X and %∆S are the percentage changes
in earnings before interest and tax and in sales respectively, both of which are
obtained from Datastream. The percentage changes are computed using data from
1997 to 2003 inclusive to compute ratios for 1998 to 2003 and then averaged.
FLBETA is calculated in a comparable fashion and derived from DFL, where DFL =
%∆Y/%∆X and Y is the earnings after interest and before tax and X is EBIT. Using this
method the impact of fixed cost characteristics in the firm’s interest charges is more
easily isolated. Such charges are directly comparable with similar charges deducted in
arriving at EBIT and therefore included in the DOL measure. In other words DOL and
DFL represent directly comparable fixed cost estimators using profit and loss account
data.
Sales beta, growth rates, size, and industry membership (SBETA, G, S, D1..n)
are control variables. SBETA is the rate of change in the firm’s sales turnover relative
to the rate of change in sales turnover for all firms. Data for the latter were obtained
from the UKNA (2005, 3.1.1 and 3.1.3, pp.121-22). The computation method is the
same as OLBETA. Growth rates (G) refer to equity growth and are calculated as G =
Et/ Et-1 where G is the growth rate and E is the equity capital (balance sheet called up
share capital plus total reserves). According to the predictions of the standard CAPM
and dividend growth model formulations, growth is an important determinant of
equity beta.4 Size (S) is measured by market capitalisation, which is the product of the
market price and the total number of shares outstanding. All the above measures are
simple five-year averages for the years 1999-2003 inclusive. There are significant
effects of industry group on beta even after controlling for the underlying firm’s
balance sheet characteristics (Rosenberg and Guy, 1976), and some sectors are more
or less insulated from general economic events (Rosenberg and Rudd, 1982). To
capture these effects, the sample was grouped into industry sectors most likely to pick
up these effects, for example cyclical and non-cyclical (CYC and NCYC), basic,
10
utilities and resources (BASIC, UTIL, RESOR) and information technology (ITECH).
Taken together the control variables coupled with FLBETA provide a parallel test of
the conventional view of the CAPM determinants of beta.
The interpretation of the OLBETA and FLBETA co-efficients is a test of the
principal proposition of the paper; that DOL will have greater positive impact on beta
relative to DFL. In terms of formal hypotheses:
HI: The degree of operating leverage is positively related to beta (a1 > 0)
HII: The degree of financial leverage is positively related to beta (a2 > 0)
HIII: The degree of operating leverage has a greater impact on beta relative to the
degree of financial leverage (a1 > a2)
3.2. Sample and data
To be included in the initial sample, a company was required to satisfy several
selection criteria. It must be in the FTSE all share index throughout the period of
study. It must have data for beta, industry code, market value, sales, EBIT, profit after
interest before tax, and equity,5 available for the entire period from 1998 – 2003 so
that DOL, DFL, growth and size can be computed. Firms with negative DOL and DFL
values were excluded from the sample. Table 1 summarises the sampling process.
Table 1 about here
Once the initial sample was obtained for the firms satisfying the above criteria, each
variable was examined for normality. All variables except beta and industry dummies
were log transformed to achieve closer proximity to normality. The sample
accommodated some firms with negative growth rates by indexing growth to 1, but in
a minority of cases where growth rates were greater than minus 100% they were
necessarily excluded from the log transformed variable. Descriptive statistics for the
sample firms are shown in table 2.
11
Table 2 about here
As table 2 panel A shows, the distribution of most of the variables remained
problematic, even once these transformations were accommodated. Non-normality of
individual variables is not necessarily problematic for the ordinary least-squares
(OLS) model, provided the residuals are normal. Shapiro-Wilk tests were conducted
on the residuals of all relevant models and in general these showed approximation to
normality (table 3). All OLS regression models incorporated White’s (1980)
heteroscedasticity consistent matrix for standard errors and all models were re-tested
using non-parametric quantile regressions. The final model tested, taking into account
the log (LN) transformations was:
β = a0 + a1OLBETA + a2FLBETA +a3SBETA + a4LNG + a5LNS + a6,1D1 + a6,2D2 +
… + a6,n-1Dn-1 + e
(4)
Table 2 panel B shows significant cross correlations between a minority of variables,
most notably between the cyclical and other industry groupings. To deal with the
effects of potential multi-collinearity the CYC variable was dropped from the model
and the remaining co-efficients analysed in its absence. A similar procedure was
adopted to assess the impact of interactions between LNOLBETA, LNG and LNS.
Mean VIFs for all models tested were <1.5.
Finally, to test the possible interrelationship between the two types of
leverage, an interaction term (LNOLBETA*LNFLBETA) was added to the model. This
method has been used by Li and Henderson (1991) and Lord (1996) and provides a
supplementary test of Huffman’s (1983) interaction hypothesis.
Table 3 about here
12
4. DISCUSSION
The results of the regressions are reported in table 3. These show the full model set
out in equation (4) above and variations in models A-D illustrating the specific
impacts of variables important to the above hypothesis. As a robustness check, models
E and F report the impact of these key variables using a non-parametric quantile
regression specification.
Overall the models explained between 35% and 40% of cross sectional
variation in beta, which is consistent with previous similar studies (Mandelker and
Rhee, 1984). The LNOLBETA variable was significant in all models tested, whereas
LNFLBETA is not. The evidence therefore supports hypotheses I and III but not
hypothesis II. The significance of LNOLBETA was robust when non-parametric model
specification was used in models (e) and (f). LNOLBETA was significant at only the
5% level in the absence of the SBETA variable. In contrast, LNFLBETA had a
negative sign and was insignificant regardless of model specification. The interaction
term (LNOLBETA*LNFLBETA) was also insignificant and with a negative sign,
confirming the results of prior studies. However, if this variable is treated as a direct
test of Huffman’s (1983) negative interaction hypothesis, it is supported at the 5%
significance level.
To examine the reasons for the apparent insignificance of LNFLBETA, further
sensitivity tests were conducted. A possibility, again suggested by Huffman (1983)
and Li and Henderson (1991) is that financial leverage is only important if debt
exceeds a certain critical level. To test this hypothesis the sample was split at the
median point and the models re-tested on a sub-sample of firms with above average
financial leverage (n=78). The notable differences in these tests were that LNFLBETA
was positive and significant at the 5% level in a simple regression model. It was also
significant at that level when SBETA and LNS were added to the model. In the
presence of LNOLBETA*LNFLBETA significance reduced to 10% and disappeared
altogether when industry dummies were added. Overall, the evidence therefore
constitutes only very weak support for hypothesis II, suggesting that financial
leverage only affects beta in very specific circumstances.
SBETA was significant in all models tested, and in general added to the
significance of the LNOLBETA variable when used in conjunction. So although the
conjunction of fixed costs and sales revenue variation are important, they need to be
13
flexed to account for the variation in revenue relative to changes in aggregate demand.
Of the other control variables, growth was insignificant in all the models tested,
whereas size was always strongly and positively significant. Of the industry variables,
only ITECH, NCYC and UTIL were consistently influential. ITECH was positive and
significant suggesting this sector of relatively new firms had higher betas, but also
cross sectional variation in the sector is also important regardless of industry norms.
This would also seem to be the case for NCYC and UTIL, although in these cases
betas are significantly below average.
5. CONCLUSIONS
The results confirm the importance of operating leverage in the determination of
systematic risk. In this respect the analysis confirms the consensus from similar
previous empirical studies (Mandelker and Rhee, 1984, Huffman, 1989, Darrat and
Mukherjee 1995, Li and Henderson 1991, Lord, 1996). Financial leverage was not
important although there is some evidence in support of the notion of capacity trade
off and, in very specific circumstances, critical levels of financial leverage (Huffman,
1983). So whereas operating fixed costs have the bigger impact on systematic risk,
interest costs arising from financial leverage contribute towards the mitigation of
managerial commitment to those fixed costs.
The role of operating leverage in the theoretical and empirical analysis has
important implications for risk management and asset allocation within the firm and
for the pricing of risk financial markets. The suggestion arising from the alternative
approach in this paper is that the ‘conventional’ method, which identifies a quoted
company already engaged in the proposed line of business and adjusts its beta by
ungearing and regearing (Watson and Head, p.254), is the wrong approach. There are
well known several problems such as the reliance on historical share price variation
(usually over a five year period), the empirical question marks over the performance
of stock market beta in explaining returns (Fama and French, 1992,1996). Empirical
research shows that equity beta does not substantially explain the cross section of
stock market returns, whereas these alternative factors might. Moreover, one might
question the logic of management accounting, which in using market-based betas in
14

cost of capital calculations, ignores the beta values implied by its own budgeting
assumptions.
The linear relationship between operating cost and stock market beta suggest
there is a security market line equivalent representing the underlying fixed costs of the
business. Corporate managers committing their firms to high fixed cost investment,
therefore face a higher cost of capital. Insofar as competitive advantage depends on
making such investments, there is a clear trade-off in terms of higher expected returns
and the alternative strategy of flexibility.
15
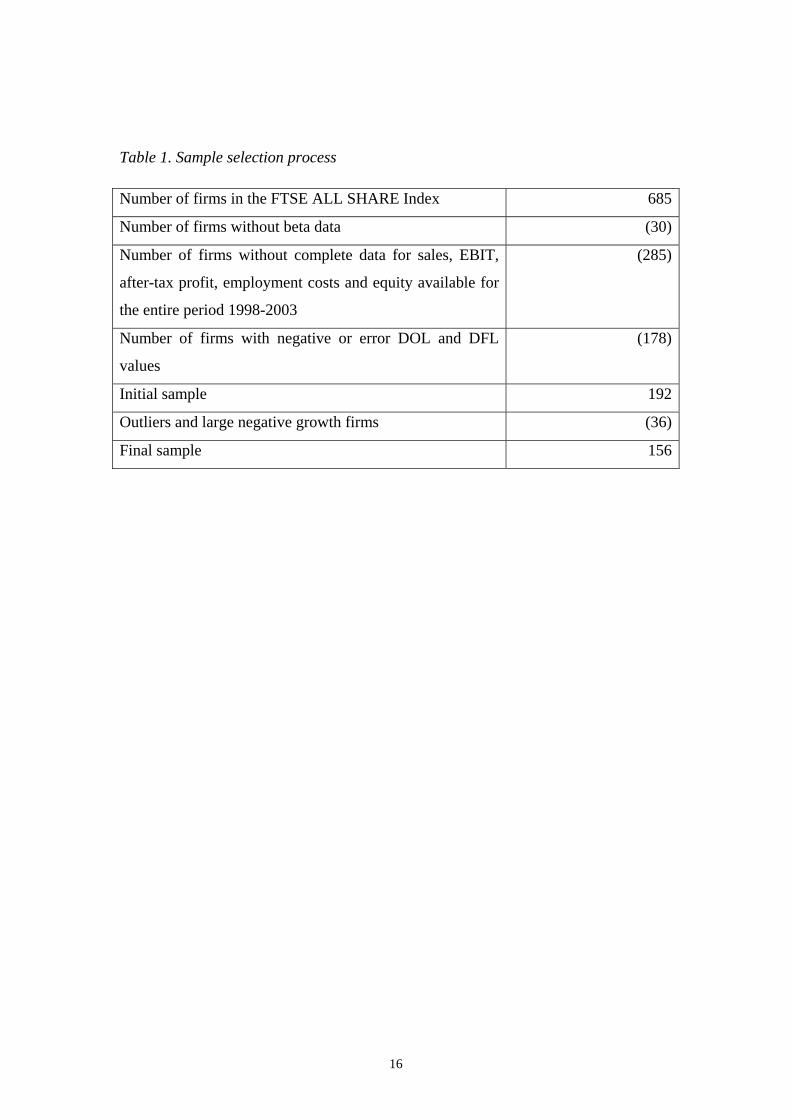
Table 1. Sample selection process Number of firms in the FTSE ALL SHARE Index 685
Number of firms without beta data (30)
Number of firms without complete data for sales, EBIT,
after-tax profit, employment costs and equity available for
the entire period 1998-2003
(285)
Number of firms with negative or error DOL and DFL
values
(178)
Initial sample 192
Outliers and large negative growth firms (36)
Final sample 156
16
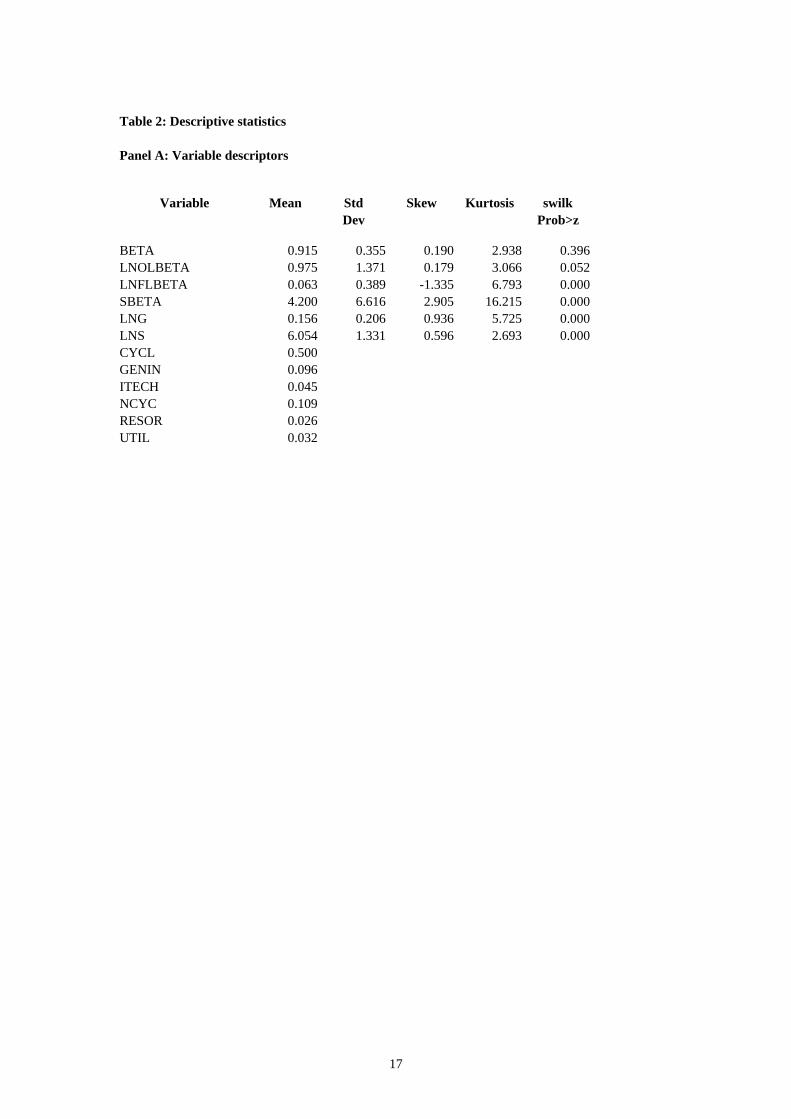
Table 2: Descriptive statistics
Panel A: Variable descriptors
Variable Mean Std Skew Kurtosis swilk
Dev Prob>z
BETA 0.915 0.355 0.190 2.938 0.396 LNOLBETA 0.975 1.371 0.179 3.066 0.052 LNFLBETA 0.063 0.389 -1.335 6.793 0.000 SBETA 4.200 6.616 2.905 16.215 0.000 LNG 0.156 0.206 0.936 5.725 0.000 LNS 6.054 1.331 0.596 2.693 0.000 CYCL 0.500 GENIN 0.096 ITECH 0.045 NCYC 0.109 RESOR 0.026 UTIL 0.032
17
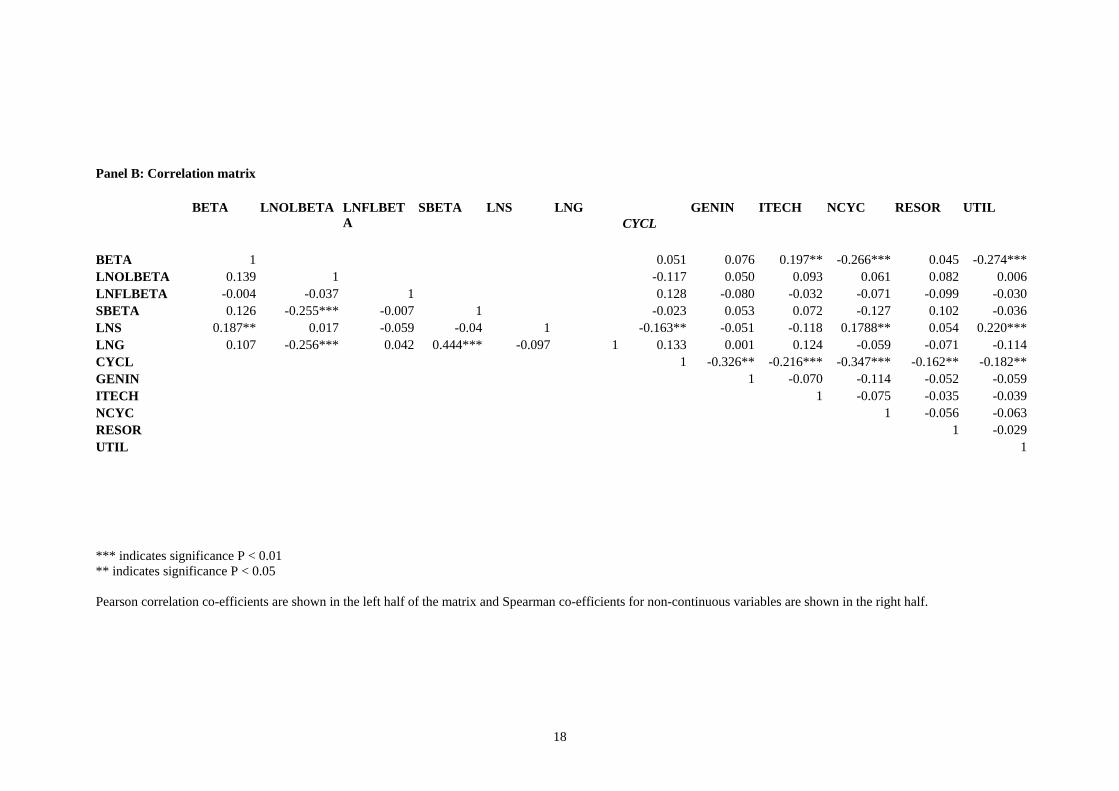
Panel B: Correlation matrix
BETA LNOLBETA LNFLBETA
SBETA LNS LNGCYCL
GENIN ITECH NCYC RESOR UTIL
BETA 1 0.197**0.051 0.076 -0.266*** 0.045 -0.274***LNOLBETA 0.139 1 -0.117 0.050 0.093 0.061 0.082 0.006LNFLBETA -0.004 -0.037 1 0.128 -0.080 -0.032 -0.071 -0.099 -0.030 SBETA 0.126 -0.255*** -0.007 1 -0.023 0.053 0.072 -0.127 0.102 -0.036LNS 0.187** 0.017 -0.059 -0.04 1 -0.163** -0.051 -0.118 0.1788** 0.054 0.220***LNG 0.107 -0.256*** 0.042 0.444***
-0.097 1 0.133 0.001 0.124 -0.059 -0.071 -0.114
CYCL -0.216***1 -0.326** -0.347*** -0.162** -0.182**GENIN -0.070
1 -0.114 -0.052 -0.059
ITECH 1 -0.075 -0.035 -0.039NCYC 1 -0.056 -0.063RESOR 1 -0.029UTIL 1 *** indicates significance P < 0.01 ** indicates significance P < 0.05 Pearson correlation co-efficients are shown in the left half of the matrix and Spearman co-efficients for non-continuous variables are shown in the right half.
18
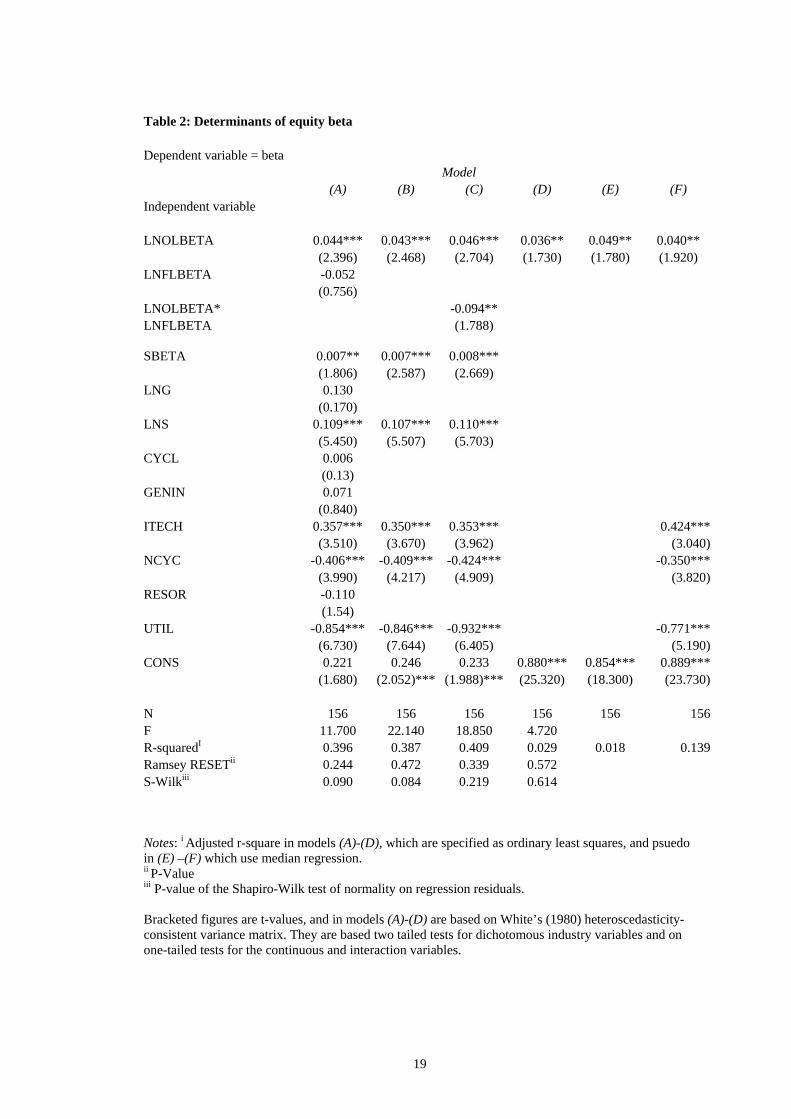
Table 2: Determinants of equity beta
Dependent variable = beta
Model (A) (B) (C) (D) (E) (F)
Independent variable
LNOLBETA 0.044*** 0.043*** 0.046*** 0.036** 0.049** 0.040** (2.396) (2.468) (2.704) (1.730) (1.780) (1.920)
LNFLBETA -0.052 (0.756)
LNOLBETA* -0.094** LNFLBETA (1.788)
SBETA 0.007** 0.007*** 0.008*** (1.806) (2.587) (2.669) LNG 0.130
(0.170) LNS 0.109*** 0.107*** 0.110***
(5.450) (5.507) (5.703) CYCL 0.006
(0.13) GENIN 0.071
(0.840) ITECH 0.357*** 0.350*** 0.353*** 0.424***
(3.510) (3.670) (3.962) (3.040)NCYC -0.406*** -0.409*** -0.424*** -0.350***
(3.990) (4.217) (4.909) (3.820)RESOR -0.110
(1.54) UTIL -0.854*** -0.846*** -0.932*** -0.771***
(6.730) (7.644) (6.405) (5.190)CONS 0.221 0.246 0.233 0.880*** 0.854*** 0.889***
(1.680) (2.052)*** (1.988)*** (25.320) (18.300) (23.730)
N 156 156 156 156 156 156F 11.700 22.140 18.850 4.720 R-squaredI 0.396 0.387 0.409 0.029 0.018 0.139Ramsey RESETii 0.244 0.472 0.339 0.572 S-Wilkiii
0.090 0.084 0.219 0.614
Notes: i Adjusted r-square in models (A)-(D), which are specified as ordinary least squares, and psuedo in (E) –(F) which use median regression. ii P-Value iii P-value of the Shapiro-Wilk test of normality on regression residuals. Bracketed figures are t-values, and in models (A)-(D) are based on White’s (1980) heteroscedasticity-consistent variance matrix. They are based two tailed tests for dichotomous industry variables and on one-tailed tests for the continuous and interaction variables.
19
REFERENCES Armstrong, P. (2002), ‘The costs of activity-based management’, Accounting
Organizations and Society, 27(1/2), pp. 99-120.
Beaver, W.H., Kettler, P., and Scholes, M., (1970), “The Association Between Market
Determined and Accounting Determined Risk Measures,” Accounting Review
45, 654-82.
Beaver, W. and Manegold, J, (1975), “The association between market-Determined
and Accounting-Determined Measures of Systematic Risk: Some Further
Evidence,” Journal of Financial and Quantitative Analysis, 231-284.
Brearley, R. and Myers, S. (1996) Principles of Corporate Finance, McGraw Hill. 5th
Ed.
Brenner, M. and Smidt, S., (1978), “Asset Characteristics and Systematic Risk,”
Financial Management, 33-39.
Brigham, E.F. and Gapenski, L.C. (1994), Financial Management: Theory and
Practice, 7th edition, Dryden Press Fuller, R.J and Kerr, H.S. (1981),
‘Estimating the divisional cost of capital: the pure-play technique, Journal of
Finance, pp.997-1009.
Butler, K.C. Mohr, R. M and Simonds, R.R. (1991), ‘The Hamada and Conine
leverage adjustments and the estimation of systematic risk,’ Journal of
Business Finance and Accounting, 18, pp.885-902.
Chance, D., (1982), “Evidence on a Simplified Model of Systematic Risk,” Financial
Management 11, 53-63.
Chung, K.H., (1989), “The Impact of the Demand Volatility and Leverages on the
Systematic Risk of Common Stocks,” Journal of Finance and Accounting
16(3), 343-360.
20
Claus, J. and Thomas, J. (2001), ‘Equity Premia as Low as Three Percent? Evidence
from Analysts’ Earnings Forecasts for Domestic and International Stock
Markets’, Journal of Finance, Vol. 55, No. 5, 1629-66.
Dugan, M.T., Minyard, D.H., and Shriver, K.A., (1994), “A Re-Examinantion of the
Operating Leverage-Financial Leverage Tradeoff Hypothesis,” Quarterly
Review of Economics and Finance 34(3), 327-334
Fama, Eugene F., and Kenneth R. French, (1996), Multifactor explanations of Asset
Pricing Anomalies, Journal of Finance, 51, 55-84.
Fuller, R.J. and Kerr H.S. (1981), ‘Estimating the divisional cost of capital: an
analysis of the pure play technique, Journal of Finance, 36,5, 997-210.
Gahlon, J.M. and Gentry, J.A., (1982), “On the Relationship Between Systematic
Risk and the Degrees of Operating and Financial Leverage,” Financial
Management 11, 15-23.
Grant, R. (1996), ‘Toward a knowledge based view of the firm’, Strategic
Management Journal, 17, pp.109-122.
Gonedes, N.J. (1973), ‘Evidence on the information content of accounting numbers:
Accounting-based and market-based estimates of systematic risk, Journal of
Financial and Quantitative Analysis, 8(3), pp.407-433.
Gonedes, N.J. (1975), ‘A note on accounting-based and market-based estimates of
systematic risk’, Journal of Financial and Quantitative Analysis, 10(2),
pp.355-365.
Hamada, R.S. (1969), ‘Portfolio analysis, market equilibrium and corporation
finance’, Journal of Finance, pp.13-31.
Hamada, R.S. (1972), ‘The effect of the firm’s capital structure on the systematic risk
of common stocks, Journal of Finance, pp.435-452.
21
Hill, N. and Stone, B., (1980), “Accounting Beta, Systematic Operating Risk, and
Financial Leverage: A Risk-Composition Approach to the Determinants of
Systematic Risk,” Journal of Financial and Quantitative Analysis 15, 595-
637.
Huffman, L., (1983), “Operating Leverage, Financial Leverage and Equity Risk,”
Journal of Banking & Finance 7 (2), 197-212.
Huffman, S.P., (1989), “The Impact of the Degrees of Operating and Financial
Leverage on the Systematic Risk of Common Stocks: Another Look,”
Quarterly Journal of Business and Economics. 28(1); 83-100.
Koutsoyiannis, A., (1987), Non-Price Decisions the Firm in a Modern Context,
Hongkong: MacMillan Education Ltd
Lazonick, W. (1991) Business Organization and the myth of the market economy,
Cambridge: Cambridge University Press.
Lev, B., (1974), “On the Association Between Operating Leverage and Risk,” Journal
of Financial and Quantitative Analysis 9, 627-641.
Li, R-J and Henderson, G. (1991), ‘Combined Leverage and Stock Risk’, Quarterly
Journal of Business and Economics, Vol.30, No.1, pp.18-40.
Lord. R.A., (1996), “The Impact of Operating and Financial Risk on Equity Risk,”
Journal of Economic and Finance 20 (3), 27-38.
Mandelker, G.N. and Rhee, S.G., (1984), The Impact of the Degrees of Operating and
Financial Leverage on Systematic Risk of Common Stock” Journal of
Financial and Quantitative Analysis Vol.19, No.1, pp.45-57.
Miller, M., 1977, “Debt and Taxes,” Journal of Finance 32, 266-68.
22
Modigliani, F. and Miller, M. (1958), ‘The cost of capital, corporation finance and the
theory of investment, American Economic Review, pp.261-297.
Modigliani, F., and Miller, M., (1963), “Corporate Income Taxes and the Cost of
Capital: A Correction,” American Economic Review 53, 433-43.
Mohr, R., 1985, “The Operating Beta of a U.S. Multi-Activity Firm: An Empirical
Investigation,” Journal of Business Finance and Accounting, 575-593
O’Hanlon, J. and Steele, A. (2000), ‘Estimating the equity risk premium using
accounting fundamentals’, Journal of Business Finance and Accounting,
Vol.27, pp.1051-1083.
O’Brien, T.J. and Vanderheiden, P.A., 1987, “Empirical Measurement of Operating
Leverage for Growing Firms,” Financial Management 16 (2), 45-53.
Prezas, A.P., 1987, “The Effect of Debt on the Degrees of Operating and Financial
Leverage,” Financial Management 16(2), 39-44.
Rosenberg, B. and Guy, J., (1976), “Prediction of Beta from Investment
Fundamentals,” Financial Analysts Journal (July/August 1976)
Rosenberg. B and Rudd, A., (1982), “The Corporate Uses of Beta,” Chase Financial
Quarterly 1 (4).
Rubinstein, M.E. (1973), ‘A mean-variance synthesis of corporation finance theory’,
Journal of Finance, pp.167-181.
Thompson, J.D., 1976, “Sources of Systematic Risk in Common Stocks,” Journal of
Business 49, 173-188.
UKNA (United Kingdom National Accounts), (2005), Blue Book, London: HMSO.
23

Watson, D. and Head, A. (1998) Corporate Finance: Principles and Practice,
London: Pitman.
White, H. (1980), ‘A heteroscedasticity-consistent covariance estimator and a direct
test for heteroscedasticity, Econometrica, Vol. 48, pp.817-38.
24
1 Because the denominator is the same for all firms DOL(C)i and βci can be used inter-changeably in cross sectional analysis. 2 These figures imply leverage from operating fixed costs of 1.60, computed as the ratio of change in profit to change in sales. Variable cost (VC) = Sales – (DOL x ∏). Fixed cost = total cost – VC. 3 This period may also differ from or be constrained by the estimation period for financial betas. DataStream’s and LBS’s betas are estimated over a 5-year period. 4 β = DY + G/ (Rm – Rf) where DY is dividend yield. 5 In Datastream, items Earned for ordinary (625) and Total share capital and reserves (307) are used as measures for profits after tax and equity respectively.
25
Related Documents