The Assessment of Sonic Waves and Tracer Gases as Non-Destructive Testing (NDT) Methods for In-Situ Underground Mine Seals Kyle T. Brashear Thesis submitted to the faculty of the Virginia Polytechnic Institute and State University in partial fulfillment of the requirements for the degree of Master of Science In Mining Engineering Erik C. Westman Kramer D. Luxbacher Nino S. Ripepi July 8 th , 2014 Blacksburg, VA Keywords: mine seals, non-destructive testing, sonic waves, tracer gases

Welcome message from author
This document is posted to help you gain knowledge. Please leave a comment to let me know what you think about it! Share it to your friends and learn new things together.
Transcript

The Assessment of Sonic Waves and Tracer Gases as Non-Destructive Testing (NDT)
Methods for In-Situ Underground Mine Seals
Kyle T. Brashear
Thesis submitted to the faculty of the Virginia Polytechnic Institute and State University
in partial fulfillment of the requirements for the degree of
Master of Science
In
Mining Engineering
Erik C. Westman
Kramer D. Luxbacher
Nino S. Ripepi
July 8th, 2014
Blacksburg, VA
Keywords: mine seals, non-destructive testing, sonic waves, tracer gases
The Assessment of Sonic Waves and Tracer Gases as Non-Destructive Testing (NDT) Methods
for In-Situ Underground Mine Seals
Kyle T. Brashear
ABSTRACT
In 2006, two tragic mining incidents occurred in the United States, resulting in the loss of
life for 17 coal miners from explosions in underground coal mines. As a result, legislators passed
the MINER Act of 2006. In addition to the numerous new regulatory requirements, the strength
requirement of both monitored and unmonitored in-situ seals were increased to 50 and 120 psig,
respectively. The new strength requirements of these seals serve an important safety purpose, but
there is currently no mandatory monitoring or testing program for the structural condition of the
seal themselves. Civil and structural engineers have been using non-destructive testing (NDT)
methods for nearly a century to evaluate the condition of both concrete and non-concrete
structures. The NDT work with concrete has allowed engineers to measure the thickness of
structures, detect flaws, delaminations (or voids in the subsurface), measure the corrosion of
metal reinforcements that may be part of the structure, and even characterize the physical
properties of the structure, all without having to disturb or damage the specimen. One of these
NDT methods, the impact-echo method, has been widely used in concrete evaluation and has the
potential to assess the structural condition of in-situ mine seals. While the impact-echo method
has been successfully used for nearly 30 years in evaluating civil structures, the concept of
tracking the movement and concentrations of tracer gases is a previously untested NDT concept
for both seals and concrete structures. Tracer gases, specifically sulfur hexafluoride and
perfluorinated tracer compounds, have been used to map the ventilation characteristic of
underground mines. A novel NDT method can potentially combine the two methods, where the
injection of a tracer, and the flow of the tracer through the seal material may provide information
on the structural condition of the seal. This paper details the development and assessment of these
two potential NDT methods for the evaluation of in-situ underground mine seals. The assessment
was carried out through a series of small, laboratory experiments and transitioned to both large
and full scale experiments located in working underground mines, accompanied with
supplemental computer modeling to assist in confirmation of perfluorinated tracers moving
through the seal material.
iii
Acknowledgements
Firstly, I would like to thank both of my advisors, Dr. Erik Westman and Dr. Kray Luxbacher, for
taking a chance on me and inviting me to join to the graduate students here in the Mining and
Mineral Engineering Department. Both Dr. Westman and Luxbacher placed a lot of faith in me
by allowing me to work, fairly independently, on an extremely important investigation and
assessment in underground coal mine safety, and it is my hope that, at the end of this year and
half experience, their faith has been well-placed. Dr. Westman has provided me invaluable advice
and expertise in terms of geotechnical concepts and recommendations. Dr. Luxbacher has also
been extremely influential as both an engineer and guide in the field of ventilation and tracer
gases. I hope to keep both of them as colleagues as my career continues, something I could not
have done without their assistance.
I would also like to thank my other committee member Nino Ripepi for his support and guidance
as my project has progressed. Other faculty members who I would like to thanks for their support
and assistant in various capacities are Dr. Mario Karfakis and Dr. Harold McNair. Whether it was
borrowing lab space, reminding me of basic rock properties, or providing me both the
fundamentals and a one-of-a-kind experiences in field gas chromatography, both Dr. Karfakis and
Dr. McNair have been a great help to me during my graduate studies.
I would like to acknowledge the assistance I received on this project from the Dr. Karl Zipf, who
supervised this project on behalf of the federal government, and also Cary Hardwood and John
Feddock of Cardno Marshall Miller and Associates who contracted out the work in this paper to
me and Virginia Tech. I would also like to thank Dr. Braden Lusk and his researchers at the
University of Kentucky for allowing me to use their underground facilities for a large portion of
my experiments, as well as Mark Luxbacher and the Lhoist North America Kimballton mine for
providing me experimental access and space. Finally, this project would not be possible without
the support and assistance from both Strata Worldwide and Orica (Minova) who provided this
project the seal material needed to conduct experiments with the same material seen in working
underground coal mines.
I would not have been able to complete this project and thesis without the help of my fellow
graduate students and the staff of the Mining and Minerals Engineering Department. Thank you
all for your help over the past year and a half. Specifically, I would like to especially thank Dr.
Edmund Jong for his assistance, guidance, allowing me to participate in his studies, and being a
great mentor and friend to me in the field of mining related research.
Finally, I want to thank my friends, girlfriend, and family for their continual love, patience, and
support as I completed my last stage of academia and my transition into industry.
This publication was developed under Contract No. 200- 2012-52497, awarded by the National
Institute for Occupational Safety and Health (NIOSH). The following thesis entitled “The
Assessment of Sonic Waves and Tracer Gases as Non-Destructive Testing (NDT) Methods for
In-Situ Underground Mine Seals” © 2014 was written by Kyle T. Brashear and permission is
given to copy this work provided credit is given and copies are not intended for sale. The findings
and conclusions in this report are those of the authors and do not reflect the official policies of the
Department of Health and Human Services; nor does mention of trade names, commercial
practices, or organizations imply endorsement by the U.S. Government.

iv
Attribution
The following thesis would not be possible without the attribution and help from numerous
people. Below is of those who assisted me with co-authorship for Chapter 3: Assessment of Sonic
Waves and Tracer Gases as Non-Destructive Testing Methods to Evaluate the Condition and
Integrity of In-Situ Underground Mine Seals, as well as Chapter 6: Technical Note: Modeling the
Movement of Perfluoromethylcyclohexane (PMCH) through Underground Mine Seal material
with PCF3D and Avizo®.
Chapter 3 Co-Authors:
Kray Luxbacher Virginia Polytechnic Institute
and State University
Sponsored me for project, oversaw
experiment design and analysis, and
edited chapter
Erik Westman Virginia Polytechnic Institute
and State University
Sponsored me for project, oversaw
experiment design and analysis, and
edited chapter
Cary Harwood Cardno Marshall Miller &
Associates
Supervisor who oversaw project, provided
small scale sonic wave experiment
samples, and material for tracer gas
experiments
Braden Lusk University of Kentucky Provided underground lab space in
Georgetown, KY
William Weitzel University of Kentucky Poured small scale sonic wave samples
Chapter 6 Contributors:
Drew Hobert Virginia Polytechnic Institute
and State University
Assisted in writing and developing
PFC3D code
Joseph Amante Virginia Polytechnic Institute
and State University
Assisted in SkyScan data collection and
Avizo® simulation
v
Table of Contents Chapter 1: Introduction ................................................................................................................... 1
Chapter 2: Literature Review .......................................................................................................... 3
2.1 Mine Seals ............................................................................................................................. 3
2.1.1 Ventilation and Seal Purpose .......................................................................................... 3
2.1.2 Explosions and Seals ...................................................................................................... 5
2.1.3 History of Explosions in Sealed Areas (U.S.) ................................................................ 5
2.1.4 Early History of Seal Standards ..................................................................................... 8
2.1.5 MINER Act and New Seal Standards ............................................................................. 8
2.1.6 Current Approved Seals ................................................................................................. 9
2.2 Non-Destructive Testing Methods ...................................................................................... 10
2.2.1 NDT assessment of concrete structures ........................................................................ 10
2.2.2 NDT methods ............................................................................................................... 10
2.2.3 Other methods .............................................................................................................. 12
2.3 Impact-Echo Sonic Waves .................................................................................................. 13
2.3.1 Theory .......................................................................................................................... 13
2.3.2 Impact-Echo and FFT ................................................................................................... 14
2.3.3 Fourier transform .......................................................................................................... 15
2.4 Tracer Gases ........................................................................................................................ 16
2.4.1 Support of Ventilation Characterization ....................................................................... 16
2.4.2 Sulfur Hexafluoride (SF6) ............................................................................................. 17
2.4.3 Perfluorinated Tracer Compounds (PFTs) ................................................................... 18
2.4.4 Basic Chromatography Techniques .............................................................................. 19
2.4.5 Basics of Mass Spectrometry ....................................................................................... 22
Chapter 3: Assessment of Sonic Waves and Tracer Gases as Non-Destructive Testing Methods to
Evaluate the Condition and Integrity of In-Situ Underground Mine Seals ................................... 24
3.1 Abstract ............................................................................................................................... 24
3.2 Introduction ......................................................................................................................... 24
3.3 Background ......................................................................................................................... 24
3.4 Sonic Wave Experiments .................................................................................................... 26
3.5 Tracer Gas Experiments ...................................................................................................... 29
3.6 Future Experiments ............................................................................................................. 33
3.7 Conclusion ........................................................................................................................... 33
3.8 Acknowledgements ............................................................................................................. 33
Chapter 4: Use of Perfluoromethylcyclohexane (PMCH) as a Novel Non-Destructive Testing
(NDT) Method to Evaluate In-Situ Underground Mine Seals ...................................................... 34

vi
4.1 Background ......................................................................................................................... 34
4.2 Virginia large-scale experiment design ............................................................................... 35
4.3 Virginia large-scale experiment results ............................................................................... 37
4.4 Kentucky full-scale experiment deign ................................................................................. 41
4.5 Kentucky full-scale experiment results ............................................................................... 42
4.6 Discussion ........................................................................................................................... 43
4.7 Acknowledgement ............................................................................................................... 43
Chapter 5: Technical Note: Use of the Sonic Wave Impact-Echo Non-Destructive Testing (NDT)
Method on Mine Seals in a Kentucky Underground Limestone Mine .......................................... 44
5.1 Background ......................................................................................................................... 44
5.2 Experimental Design ........................................................................................................... 45
5.3 Large Scale Results ............................................................................................................. 47
5.4 Full Scale Results ................................................................................................................ 50
5.5 Discussion ........................................................................................................................... 52
Chapter 6: Technical Note: Modeling the Movement of Perfluoromethylcyclohexane (PMCH)
through Underground Mine Seal material with PCF3D and Avizo® ........................................... 53
6.1 Abstract ............................................................................................................................... 53
6.2 Introduction ......................................................................................................................... 53
6.3 PFC3D Simulation Procedure for PMCH Movement within the Mine Seal ....................... 55
6.4 PFC3D Results .................................................................................................................... 56
6.5 Avizo® Simulation Procedure for PMCH Movement within the Mine Seal ...................... 58
6.6 Avizo® Results ................................................................................................................... 60
6.7 Conclusions ......................................................................................................................... 61
6.8 Acknowledgements ............................................................................................................. 61
Chapter 7: Summary and Conclusions .......................................................................................... 62
Chapter 8: Future Works ............................................................................................................... 64
References ..................................................................................................................................... 65
Appendix A: Small Scale Tracer Gas Results and Calibration Curve ........................................... 71
Appendix B: Large and Full Scale Tracer Gas Results and Calibration Curve ............................. 78

vii
List of Figures Figure 2-1. Seal placement in a typical room and pillar underground coal mine ............................ 4 Figure 2-2. Seal placement in a typical longwall underground coal mine ...................................... 4 Figure 2-3. General layout and frequency response of solid (left) and voided (right) concrete
samples using impact-echo NDT ................................................................................................... 14 Figure 2-4. Typical gas chromatograph layout as described by McNair and Miller ..................... 20 Figure 2-5. Visual representation of the separation of compounds from a sample in an open
tubular column ............................................................................................................................... 21 Figure 2-6. Typical GC-MS layout ............................................................................................... 22 Figure 3-1. Average frequency bands for manufacture A small scale samples, and the
corresponding correlations between sample sets. .......................................................................... 28 Figure 3-2. Average frequency bands for manufacture B small scale samples, and the
corresponding correlations between sample sets. .......................................................................... 28 Figure 3-3. Tracer gas small scale experiment vessel used to determine which gas will move
through the seal material sample. Photo by author, 2013 .............................................................. 29 Figure 3-4. Relative concentration of SF6 in the core of the seal material .................................... 30 Figure 3-5. Relative concentration of PMCH in the core of the seal material .............................. 30 Figure 3-6. Tracer gas small scale experiment vessel used to monitor small release of PMCH
through seal material. Photo by author, 2013 ................................................................................ 31 Figure 3-7. Concentration of PMCH released from the PPRS that move through the seal material
to occupy the atmosphere of the vessel ......................................................................................... 32 Figure 3-8. Calibration curve used to determine the concentration of PMCH for each peak area
count reported by the GC 2014 ..................................................................................................... 32 Figure 4-1. Filling of one of the pipes used in the large-scale experiment in Virginia. Photo by
author, 2013 ................................................................................................................................... 36 Figure 4-2. Experimental layout of the large-scale samples. Photo by author, 2013 .................... 36 Figure 4-3. Mass spectrum result from PMCH standard run using 2010 GC-MS and method file
in Table 4-2 ................................................................................................................................... 38 Figure 4-4. Calibration curve for the large-scale samples ............................................................. 38 Figure 4-5. Visual depiction of the concentration of PMCH on 11/25/13 through both
mnaufacturer B (top two) and manufacturer A (bottom two) samples: faulted samples proceed the
control samples for each group (concentration in ppb) ................................................................. 40 Figure 4-6. Graphical comparison of the four samples, showing concentration of the tracer vs. the
distance from the capped PPRS ..................................................................................................... 40 Figure 4-7. Layout of the Kentucky full-scale experiment seal .................................................... 41 Figure 4-8. Model of approximate PMCH concentrations found within the full scale seal (Note:
the left side of the model is oriented towards the center of the mine entry) .................................. 43 Figure 5-1. Example from McCann and Forde demonstrating the impact-echo system ............... 45 Figure 5-2. Grinding smooth surface for geophone placement on top of the large scale samples.
Photo by author, 2014 ................................................................................................................... 46 Figure 5-3. Researchers from VT and UK holding the geophone in place and applying the energy
source on the full scale seal. Photo by author, 2014...................................................................... 47 Figure 5-4. Frequency ranges for correctly mixed Orica samples................................................. 48 Figure 5-5. Frequency ranges comparing correct and improper mixed as well as UCS differences
....................................................................................................................................................... 48 Figure 5-6. Fractured samples compared to small voids and a regular sample of Orica material, all
improperly mixed .......................................................................................................................... 49 Figure 5-7. Manufacturer A material frequency ranges for regular samples, voided sampled, and
rebarred samples ............................................................................................................................ 49 Figure 5-8. Frequency ranges for the full scale sample showing distances of 1.5 to 7.5 feet ....... 50

viii
Figure 5-9. Frequency ranges for the full scale sample showing distances of 9 to 15 feet ........... 51 Figure 5-10. Expected and observed response curves of the amplitude of the frequency ranges
versus the distance between the geophone and energy source ...................................................... 51 Figure 6-1.Three-dimensional geometry of PMCH (C7F14) (grey=Carbon and green=Fluorine) . 54 Figure 6-2. Seal material samples during effective porosity test. Photo by author, 2013 ............. 55 Figure 6-3. Geometry of the PFC3D model from front (left) and angled (right) views ................ 56 Figure 6-4. Graph of the position of the PMCH particles from all heights, 10 nm (blue), 30 nm
(red), and 50 nm (green) ................................................................................................................ 57 Figure 6-5. Graph of the velocity of the PMCH particles from all heights, 10 nm (blue), 30 nm
(red), and 50 nm (green) ................................................................................................................ 58 Figure 6-6. Detailed movement of a PMCH particle through the seal material ............................ 58 Figure 6-7. Seal sample in the SkyScan 1172. Photo by author, 2014 .......................................... 59 Figure 6-8. TIF images collected from the SkyScan 1172. The diameter of samples shown is 1.44
cm. ................................................................................................................................................. 59 Figure 6-9. Avizo® model constructed from micro-CT image files.
http://www.vsg3d.com/avizo/fire. Used under Fair Use, 2014 ................................................... 60 Figure 6-10. Permeability test in the Avizo® model. http://www.vsg3d.com/avizo/fire. Used
under Fair Use, 2014 ..................................................................................................................... 61

ix
List of Tables Table 1-1. Fatality data for U.S. underground bituminous coal mines between 2003-2012 ........... 1 Table 2-1. Explosion history in U.S. underground coal mines related to mine seals (starting in
1986) ................................................................................................................................................ 7 Table 2-2. Approved 50 psi and 120 psi seals by the Mine Safety and Health Administration ...... 9 Table 3-1. Sonic wave specimens used in small scale experiments at VT .................................... 26
Table 3-2. Density of seal materials and other materials present in small scale sonic wave
experiments……………………………………………………………………………………….28
Table 4-1. Summary of labeling and condition of the large-scale pipe samples ........................... 35 Table 4-2. Summary of GC-MS method file used for large-scale samples ................................... 37 Table 4-3. Summary of large-scale sample results ........................................................................ 39 Table 4-4. Kentucky full-scale sample results (concentrations reported in ppb) .......................... 42 Table 5-1. Seal material samples present at the Georgetown mine ............................................... 45 Table 6-1. Avizo® permeability simulation inputs and results ..................................................... 61 Table A-1. Data from tracer gas selection experiments outlined and discussed in Chapter 3 ....... 71
Table A-2. Calibration curve data from tracer gas selection experiments outlined and discussed in
Chapter 3 75
Table A-3. Data from the PPRS experiments outlined and discussed in Chapter 3 76
Table B-1. Data from Virginia large-scale experiments outlined and discussed in Chapter 4 ...... 78 Table B-2. Data from Kentucky full-scale experiments outlined and discussed in Chapter 4 ...... 81 Table B-3. Calibration curve used for both the large and full-scale experiments outlined and
discussed in Chapter 4 ................................................................................................................... 85

1
Chapter 1: Introduction
In 2011, coal mines in the United States produced a total of 1,096 million short tons of coal in
both surface and underground mines. Of the over a billion tons of coal produced, 31.5% was mined in
underground coal mines. Of all coal producing mines, 38.3% are classified as underground operations
(U.S. Energy Information Administration, 2012). While underground mines may not represent a majority
of the coal mining industry, it is likely that the number of underground coal operations will increase as the
surface reserves are mined out and environmental and as social impacts of surface mines continue to face
legislative and public struggles. Often, when comparing between surface and underground mine
development, apart from the economic concerns, underground mines have less environmental impacts and
reclamation costs associated with them than surface mines. Although surface mining is generally cheaper,
the reduced cost of surface mining may not be enough to overcome the social costs of operating on the
surface (Hartman & Mutmansky, Intoductory Mining Engineering, 2002). Looking forward, the coal
industry will eventually have to invest more into the underground sector, as 57.3% of the estimated
recoverable coal reserves in the United States are specified as underground coal reserves (U.S. Energy
Information Administration, 2012). During the same 2011 time period, coal use was responsible for
20.1% of the United States’ total energy consumption, and 28.4% of the total energy production of 97.301
and 78.096 quadrillion Btu’s, respectively (U.S. Energy Information Administration, 2012). The 2011
Annual Energy Outlook projects the production of coal and domestic energy consumption increasing
steadily through 2035 (U.S. Energy Information Administration, 2012), leaving a need for the
development of more underground mines in the United States.
Despite the recent increased popularity and funding in sustainable energy solutions, coal mining
in the United States is projected to continue to be one of the major factors in the U.S. energy distribution
and consumption. As previously mentioned, an increasing number coal mines in the U.S. will need to
become underground operations in order to access the underground coal reserves, totaling 148,084
million short tons (U.S. Energy Information Administration, 2012). According to United States Bureau of
Labor Statistics (BLS), between 2003 and 2012, an average of about 17 deaths occurred annually in U.S.
underground bituminous coal mines. Only two times during that span did the overall number of fatalities
rise above 20 (2006 and 2010). During those two years three major mine explosions/fires occurred in
underground coal mines in West Virginia and Kentucky. Below, in Table 1-1, the BLS data can be seen.
Table 1-1. Fatality data for U.S. underground bituminous coal mines between 2003-2012
Year Total Fatalities Fatalities Caused by Fire
and/or Explosions
2003 19 0
2004 14 0
2005 7 0
2006 33 17
2007 20 0
2008 9 0
2009 5 0
2010 38 29
2011 11 0
2012 12 0

2
While the obvious goal is to eliminate all fatalities in U.S. coal mines, and while the high
numbers in 2006 and 2010 are from single events, a sound conclusion from Table 1.1 is the need to
prevention of explosions and fire propagation in underground coal mines. Coal mine explosions are a
constant concern for operators, as methane and other combustible gases naturally occur and emit from the
coal. With the addition of machinery and electric components, there are numerous scenarios and
possibilities for ignition to occur. While the actual explosion and fire can be devastating to personnel,
equipment, and support structures in the mine, it is the loss of oxygen and inhalation of toxic gases, such
as carbon monoxide, that are typically the cause of fatalities in underground coal explosions or fire
disasters. Ignitions in coal mines can be caused by many different factors, such as misuse or poor
maintenance of mechanical or electric equipment, frictional ignition caused by mining machinery,
welding, underground blasting, and even lightning strikes on the surface. Even when fires occur in areas
away from personnel and equipment, open fires in underground mines and the expansion of air due to
heating from the fires causes a “choke,” or extension of air in the opposing direction of the engineered
ventilation, as well as the reduction of the density of air, resulting in potentially hazardous effects on the
overall ventilation plan of the mine. These effects can be countered by increasing the overall airflow in
the mine, but doing so will also increase the propagation rate of the fire (McPherson M. J., 1993).
It is widely agreed that the best mitigation against fire and explosion is a well-designed
ventilation program and maintenance of the friction-inducing equipment. One of the most commonly used
ventilation engineering designs to prevent the propagation of fires and explosions in underground coal
mines and also provide adequate airflow to the working sections of the mine without extraneous demand
on the main fan(s) is the construction of underground mine seals. These structures fit across the
dimensions of mine entries and isolate the working section of the mine from the non-working section
(Weiss, Slivensky, Schultz, Stephan, & Jackson, 1996). While the placement of these seals are important
for the proper ventilation and safety of the mine, the proper construction of these seals is equally as
important. Improper construction of these structures can lead to air leakage, exposing the working section
of the mine to the hazardous and potentially combustible atmosphere typically found behind the seals.
Improper construction can also result in the structural failure of these seals if an explosion, and resulting
force, was to occur within the sealed area (Mine Safety and Health Administration, 2008). Because of the
need to maintain the structural condition of the seals, it became necessary to develop and assess methods
to evaluate the condition of the structures. The assessment of these methods required a series of small-
scale, large-scale, and, eventually, full-scale experiments in functioning underground mine environments.
3
Chapter 2: Literature Review
2.1 Mine Seals
2.1.1 Ventilation and Seal Purpose Unquestionably, the most important auxiliary operation in any underground mining operation is
the ventilation of the mine. Ventilation has been an invaluable mining operation, for over two millennia,
from early B.C. mining in England and Greece to the writing of De Re Metallica in 1556 by Georgius
Agricola (McPherson M. J., 1993). Today, ventilation is required for three main components in order to
efficiently and safely work in underground mining conditions — air quantity, air quality, and temperature
control. When looking at the air quality control concern, it is important to note that in every mine, both
coal and metal/no-metal mines, dust and gases naturally exist in either the local geology or result from
industrial equipment used in underground mines (Hartman & Mutmansky, 2002). In previous years, the
quantity and quality of air entering and leaving the mine was the primary concern of ventilation
engineers, but now the comfort and tolerance of the human workers has become a more significant
priority (McPherson M. J., 1993). While prevention of these hazards is a primary goal, dilution of
contaminants to safe levels can be accomplished by supplying the mine with an appropriate quantity of
air. Air quantity controls exist to supply the mine and mine workers with a continuous flow of fresh air to
facilitate normal respiratory functions and disperse chemical and physical contaminates (heat, dust,
humidity, etc.). Temperature controls also play an important part in ventilating deep underground mines,
where the geothermal gradient of the local geology increases with depth. Chilled water is prepared at the
surface; , then in heat exchangers, this water can be used to cool and dehumidify the air going into the
mine (Hartman & Mutmansky, Intoductory Mining Engineering, 2002). As mining progresses, more air is
needed to provide adequate ventilation to the workings, as well as to continue to dilute and remove hazard
contaminates that increase as more surface area is exposed in the mine.
In order to avoid moving more air though the mine to provide appropriate quantity and quality
controls, mines often seal abandoned areas or portions of the mine that are no longer working sections.
The seals allow proper ventilation to affect the working sections of the mine, while not being wasted in
the abandoned sections and eliminate exposure of personnel. Continuing to ventilate abandoned mine
sections can become a costly enterprise that involves continuously increasing the total air quantity
entering the mine (Zipf, Sapko, & Brune, 2007). Abandoned areas are sectioned off by constructing seals
at the entrances of the connecting airways (McPherson M. J., 1993). Historically, seals were two walls 16
to 48 inches thick (reinforced concrete seals) made with a variety of materials across entry dimensions of
up to 288 square feet. The area between the walls were filled with run-of-mine and other fill material to
make a barrier with a total thickness of about 12 to 20 feet. Modern seals are made with variety of solid
incombustible materials such as poured concrete, concrete blocks, cementitous foams, and other novel
materials with thickness of about 12 to 20 feet. (Kallu J. R., 2009). According to MSHA, there are over
14,000 seals installed in active U.S. coal mines, with multiple applications associated with them. The two
most common types of seals used in underground coal applications are panel and district seals. As the
name indicates, panel seals are typically constructed parallel with panels in both longwall and room and
pillar mines. Once a panel or group of panels has been mined-out, panel seals are constructed to restrict
the ventilation away from the mined-out area. District seals are used once a mining district (made up of
multiple panels) is mined-out and are usually designed for higher strength parameters because of the large
volume behind them. An example of these two types of seals can be seen in Figures 2-1 and 2-2 below,
for both room and pillar mining and longwall mining applications (Zipf, Sapko, & Brune, 2007).
4
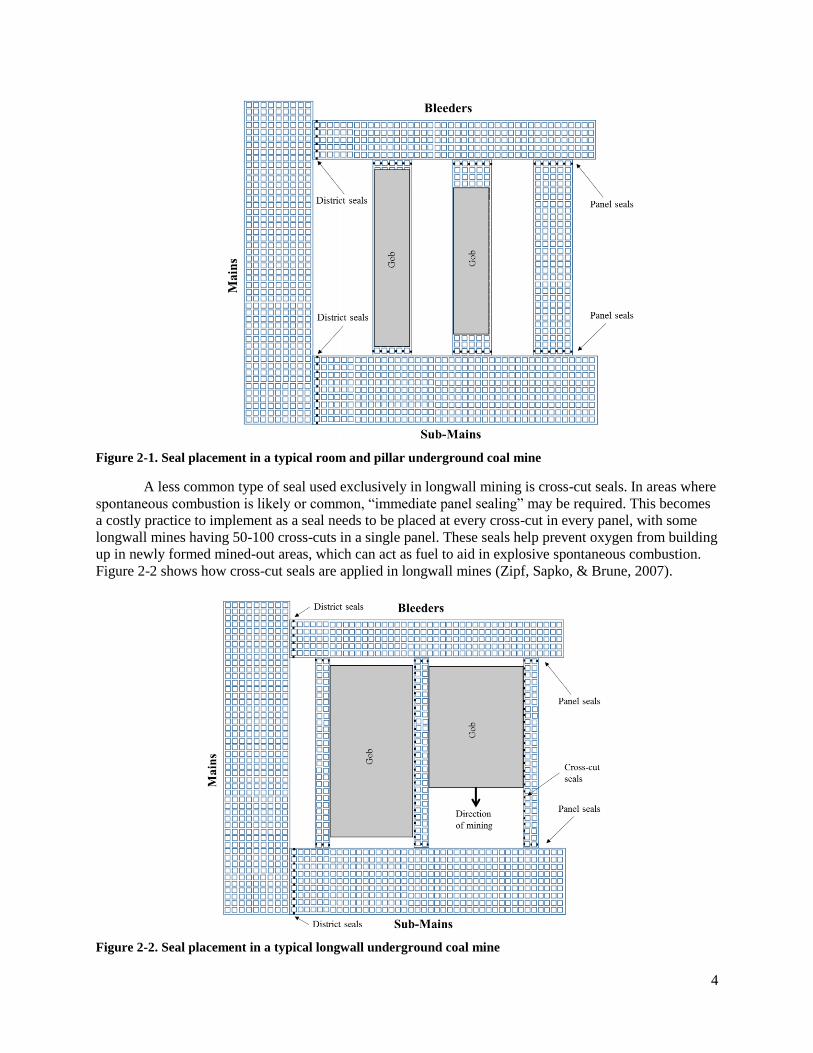
Figure 2-1. Seal placement in a typical room and pillar underground coal mine
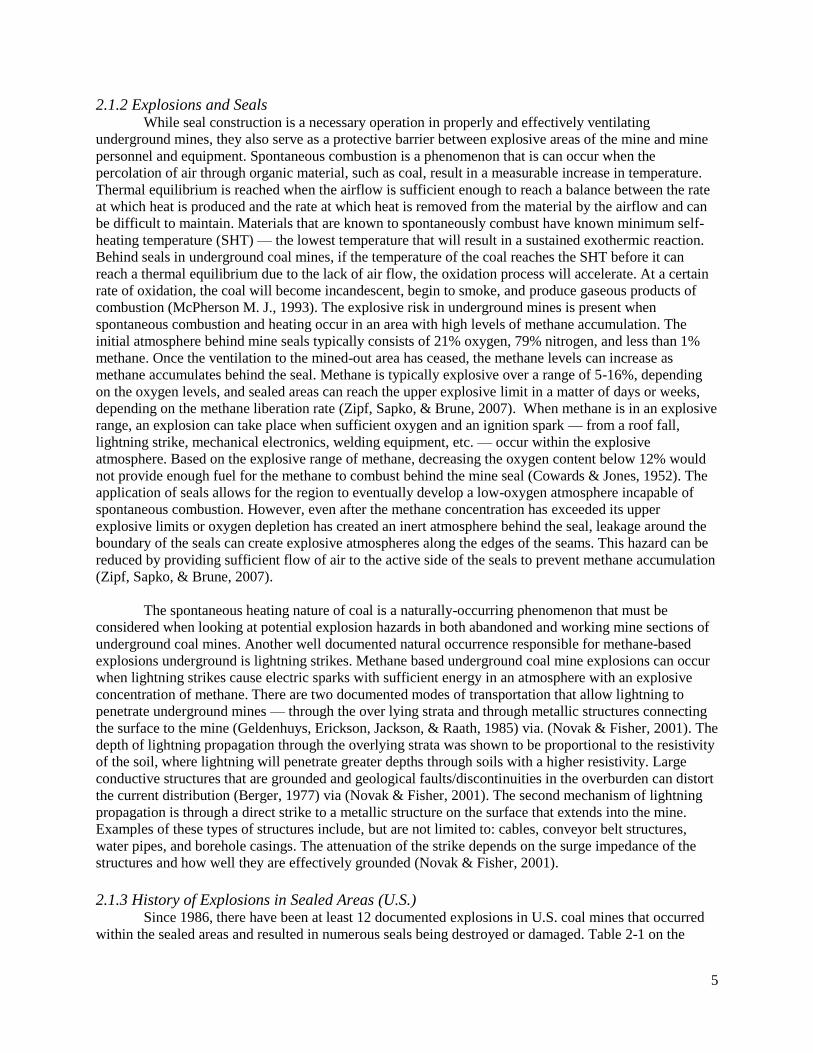
A less common type of seal used exclusively in longwall mining is cross-cut seals. In areas where
spontaneous combustion is likely or common, “immediate panel sealing” may be required. This becomes
a costly practice to implement as a seal needs to be placed at every cross-cut in every panel, with some
longwall mines having 50-100 cross-cuts in a single panel. These seals help prevent oxygen from building
up in newly formed mined-out areas, which can act as fuel to aid in explosive spontaneous combustion.
Figure 2-2 shows how cross-cut seals are applied in longwall mines (Zipf, Sapko, & Brune, 2007).
Figure 2-2. Seal placement in a typical longwall underground coal mine
5
2.1.2 Explosions and Seals While seal construction is a necessary operation in properly and effectively ventilating
underground mines, they also serve as a protective barrier between explosive areas of the mine and mine
personnel and equipment. Spontaneous combustion is a phenomenon that is can occur when the
percolation of air through organic material, such as coal, result in a measurable increase in temperature.
Thermal equilibrium is reached when the airflow is sufficient enough to reach a balance between the rate
at which heat is produced and the rate at which heat is removed from the material by the airflow and can
be difficult to maintain. Materials that are known to spontaneously combust have known minimum self-
heating temperature (SHT) — the lowest temperature that will result in a sustained exothermic reaction.
Behind seals in underground coal mines, if the temperature of the coal reaches the SHT before it can
reach a thermal equilibrium due to the lack of air flow, the oxidation process will accelerate. At a certain
rate of oxidation, the coal will become incandescent, begin to smoke, and produce gaseous products of
combustion (McPherson M. J., 1993). The explosive risk in underground mines is present when
spontaneous combustion and heating occur in an area with high levels of methane accumulation. The
initial atmosphere behind mine seals typically consists of 21% oxygen, 79% nitrogen, and less than 1%
methane. Once the ventilation to the mined-out area has ceased, the methane levels can increase as
methane accumulates behind the seal. Methane is typically explosive over a range of 5-16%, depending
on the oxygen levels, and sealed areas can reach the upper explosive limit in a matter of days or weeks,
depending on the methane liberation rate (Zipf, Sapko, & Brune, 2007). When methane is in an explosive
range, an explosion can take place when sufficient oxygen and an ignition spark — from a roof fall,
lightning strike, mechanical electronics, welding equipment, etc. — occur within the explosive
atmosphere. Based on the explosive range of methane, decreasing the oxygen content below 12% would
not provide enough fuel for the methane to combust behind the mine seal (Cowards & Jones, 1952). The
application of seals allows for the region to eventually develop a low-oxygen atmosphere incapable of
spontaneous combustion. However, even after the methane concentration has exceeded its upper
explosive limits or oxygen depletion has created an inert atmosphere behind the seal, leakage around the
boundary of the seals can create explosive atmospheres along the edges of the seams. This hazard can be
reduced by providing sufficient flow of air to the active side of the seals to prevent methane accumulation
(Zipf, Sapko, & Brune, 2007).
The spontaneous heating nature of coal is a naturally-occurring phenomenon that must be
considered when looking at potential explosion hazards in both abandoned and working mine sections of
underground coal mines. Another well documented natural occurrence responsible for methane-based
explosions underground is lightning strikes. Methane based underground coal mine explosions can occur
when lightning strikes cause electric sparks with sufficient energy in an atmosphere with an explosive
concentration of methane. There are two documented modes of transportation that allow lightning to
penetrate underground mines — through the over lying strata and through metallic structures connecting
the surface to the mine (Geldenhuys, Erickson, Jackson, & Raath, 1985) via. (Novak & Fisher, 2001). The
depth of lightning propagation through the overlying strata was shown to be proportional to the resistivity
of the soil, where lightning will penetrate greater depths through soils with a higher resistivity. Large
conductive structures that are grounded and geological faults/discontinuities in the overburden can distort
the current distribution (Berger, 1977) via (Novak & Fisher, 2001). The second mechanism of lightning
propagation is through a direct strike to a metallic structure on the surface that extends into the mine.
Examples of these types of structures include, but are not limited to: cables, conveyor belt structures,
water pipes, and borehole casings. The attenuation of the strike depends on the surge impedance of the
structures and how well they are effectively grounded (Novak & Fisher, 2001).
2.1.3 History of Explosions in Sealed Areas (U.S.) Since 1986, there have been at least 12 documented explosions in U.S. coal mines that occurred
within the sealed areas and resulted in numerous seals being destroyed or damaged. Table 2-1 on the

6
following page shows a summary of these incidents. Three of these documented seal explosions resulted
in fatalities — the Blacksville No. 1 mine, Sago mine, and Darby mine. It should be noted that in the
Blacksville No.1 mine, which occurred in 1992, the explosion and resulting explosive forces occurred
during the closure of the mine site and the capping of the production shaft. Because the opening of the
production shaft had been reduced to approximately 22 inches in diameter this greatly increasing the
explosive pressure present at the time of the explosion. The production shaft had initially been partially
capped, and the incident occurred during the installation of dewatering castings. The partial capping
allowed for a buildup of methane and a decreased amount of fresh air ventilating the shaft area below the
cap. The sparks produced by welding on the top of the cap caused an explosion to occur directly beneath
the cap and working personnel, resulting in the deaths of four miners (Rutherford, Painter, Urosek,
Stephan, & Dupree Jr, 1993). In the case of the 2006 Sago mine explosion, ten seals (constructed 22 days
prior to the incident) were destroyed in an explosion involving approximately 400,000 cubic feet of
methane gas. While the cause of the explosion was determined to be the result of lightning strikes in the
area, the seals within the mine were designed to withstand explosive forces of 20 psi, far below the actual
explosive force caused by the explosion. The newly constructed seals allowed for methane to build to
explosive levels behind the seals, and the subsequent explosion resulted in the death of 12 miners (Gates,
et al., 2006). Less than five months later, another five miners lost their lives in a similar explosion at the
Darby mine. The three seals that failed in the Darby explosion were constructed approximately two
months prior to the explosion event and were again built to withstand 20 psi explosive pressures. Prior to
the explosion, metal roof straps were being cut in the vicinity of the three seals. These straps had
originally been used to provide roof support during the seal construction and had yet to be removed from
the area. An acetylene cylinder and cutting torch were being used to cut the metal straps, but the
investigation found that continuous monitoring of methane levels in the area was not being practiced by
the mine personnel. This torch was determined to be the ignition source of the explosion, although the
explosion occurred behind one of the mine seals (Light, et al., 2007).

7
Table 2-1. Explosion history in U.S. underground coal mines related to mine seals (starting in 1986)
Mine Location Date Discovered
General Size of Sealed Area
Seal Type Damage from Explosion
Cause of Explosive Mix
Ignition Source
Estimated Explosion Pressure
Source
Roadfork No. 1
Pike County, KY
Oct. 7, 1986 Several room-and-pillar panels
16 inches think (masonry blocks)
4 destroyed and 4 damaged seals
Recently sealed area
Spark from roof fall
Unknown (South, 1986)
Blacksville No. 1
Monongalia County, WV
Mar. 19, 1992 Production shaft area
Shaft cap (steel) Shaft cap destroyed Recently sealed area
Welding activities
6900 kPa (1000 psi) (Rutherford, Painter, Urosek, Stephan, & Dupree Jr, 1993)
Oak Grove Jefferson County, Al
1994 Several square miles Unknown 3 destroyed seals Leakage Unknown Unknown (Zipf, Sapko, & Brune, 2007)
Mary Lee No.1
Walker County, AL
April, 1994 Several square miles Unknown 1 destroyed and 2 damaged seals
Leakage Lightning 34 kPa (5 psi) (Checca & Zuchelli, 1995)
Gary No. 50
Wyoming County, WV
Jun. 16, 1995 Several square miles 4 feet think (Tekseal)
1 damaged seal Leakage Lightning or roof fall
35-85 kPa (5-7 psi) (Sumpter, et al., 1995)
Oasis Boone County, WV
May 15, 1996 Several square miles 2.3 feet thick (Micon 550)
3 destroyed and 1 damaged seal
Leakage Lightning or roof fall
Less than 138 kPa (20 psi)
(Ross Jr & Shultz, 1996)
Oasis Boone County, WV
Jun. 22, 1996 Several square miles 2.3 feet thick (Micon 550)
Unknown Leakage Lightning or roof fall
Unknown (Ross Jr & Shultz, 1996)
Oak Grove Jefferson County, Al
Jul. 9, 1997 Several square miles 6 feet think (Tekseal)
5 destroyed seals Leakage Lightning Exceeded 138 kPa (20 psi)
(Scott & Stephan, 1997)
Big Ridge Saline, IL Feb. 1, 2002 Several square miles 4 feet thick (Fosroc)
1 seal destroyed Recently sealed area
Unknown Unknown (Kattenbraker, 2002)
Sago Upshur County, WV
Jan. 2, 2006 1 room and pillar panel
40 inches thick (Omega Blocks)
10 seals destroyed Recently sealed area
Lightning Exceeded 642 kPa (93 psi)
(Gates, et al., 2006)
Darby Harlan County, WV
May 20, 2006 1 room and pillar panel
16 inches thick (Omega)
3 seals destroyed Recently sealed area
Oxygen/ acetylene torch
Exceeded 152 kPa (22 psi)
(Light, et al., 2007)
Pleasant1 Hill
Randolph County, WV
Jul. 1, 2012 Unknown Unknown Water traps blown out from seals
Recently seal area Unknown Unknown (Mine Safety and Health Administration, 2012)
1 On-going investigation. Full Report unavailable.

8
2.1.4 Early History of Seal Standards The earliest history of seal regulation in the United States occurred with the approval of an
amendment to the Mineral Leasing Act of 1920, on April 30th 1921. This amendment (Sec. 104. (a))
required that “all connections with adjacent mines, if not used for haulage, escapeways, exits, or airways,
shall be sealed with stoppings which shall be fireproof and built to withstand a pressure of 50 pounds per
square inch (345 kPa) on either side…”. At the time, the biggest concern and reasoning of the law was to
prevent an explosion in one mine from propagating into a neighboring mine. The 50 psi standard written
into the law was determined by the “general opinion of men experienced in mine-explosion
investigations.” In 1931, George Rice, along with the Bureau of Mines and the Bureau of Standards,
examined typical concrete seals used in underground coal mines. These typical seals were 2 feet thick and
are constructed of reinforced concrete anchored into the roof and ribs of the mine. These “typical seals”
were tested over a wide range of heights and widths, while keeping the thickness to width ratio similar.
The test also included evaluating the use of coal as buttresses for the seals (Rice, Greenwald, Howarth, &
Avins, 1931).
For nearly 50 years, 50 psi seals and Rice’s work were accepted practice in the mining industry.
In 1969, the Federal Coal Mine Health and Safety Act was approved, and required that abandoned areas
of a coal mine had to be either ventilated or sealed with explosion-proof bulk heads. However, as of 1969,
no one had adequately defined “explosion-proof” or determined what type of forces would be exerted on
a bulkhead during an explosion. In 1971, D.W. Mitchell, of the Pittsburgh Mine and Safety Research
Center (Bureau of Mines) examined the forces that could be expected from explosions behind mine seals,
at developing a design standard for this explosive force, and at examining the effect of seal leakage.
Mitchel concluded, based on looking at test explosion results from the Bruceton Experimental Mine in
Pittsburgh and from international testing, that explosive pressure seldom exceed 20 psi (Mitchell, 1971).
However, this conclusion was based on the assumption that the explosion was limited to the amount of
explosive atmosphere on the active side of the seal. Mitchell’s assumption did not consider the
containment of an explosion within the sealed area. In addition to recommending 20 psi seals, Mitchell
also looked into the leakage of methane from seal material into the active mine and the potential hazards
that could occur. Again, Mitchell did not consider the effect of air leaking into the sealed area to form an
explosive mix behind the seal (Zipf, Sapko, & Brune, 2007).
Testing on different types of seals and seal materials continued following 1971, but it wasn’t until
1992 that the Code of Federal Regulations had a definitive design specification for explosion-proof seals.
In 1991 the U.S. Bureau of Mines reviewed the design and testing of seals made from concrete blocks and
a cementitous foam to meet the 20 psi standards. In 1991, N.B. Greninger and a team from the Bureau of
Mines formally approved designs for cement block seals and cementitous foam seals (Greninger, Weiss,
Luzik, & Stephan, 1991). Later, in 1997, C.R. Stephan reported on additional types of seals — Omega
384 blocks, Crib blocks (wooden), and Micron 550 — that also passed the 20 psi strength requirements
(Stephan & Schultz, 1997).
2.1.5 MINER Act and New Seal Standards The 20 psi seal strength requirements remained in place until 2006, when both the Sago and
Darby mines experienced a total of 17 fatalities. The cause of both of these disasters was determined to be
a build up an explosive atmosphere behind recently built seals mixed with an ignition source (lightning
and an oxygen/acetylene torch). When the explosions occurred, the 20 psi seals failed causing the
explosions to propagate into mine. In both cases, the failed seals were built to approved 20 psi standards
and the estimated explosive forces behind the sealed area was estimated to be 93 psi at the Sago mine and
22 psi at the Darby mine. Following these two incidents, MSHA acknowledged that explosive magnitudes
greater than 20 psi can develop in sealed areas due to methane or coal dust explosions (Gates, et al., 2006)
and (Light, et al., 2007). Two months after the Darby explosion, MSHA posted Program Information
Bulletin (PIB) No. P06-16. This bulletin formally increased the minimum seal strength requirement to 50

9
psi. The same bulletin also required new alternative seals to be designed and certified by a professional
engineer. On May 22, 2007, MSHA published Emergency Temporary Standards (ETS) concerning the
sealing of abandoned mine areas. These standards were made based on NIOSH recommendations, mine
explosion investigations, in-mine seal evaluations, and other reports and established a three-tiered
approach for minimum seal strength based on explosive overpressure: 50 psi, 120 psi, and greater than
120 psi (Kallu, 2009). On April 18, 2008, MSHA published its final ruling on sealing abandoned mine
areas, and can be found in the 30 Code of Federal Regulations Part 75 Section 335(a) (30 CFR
§75.335(a)).
The three-tiered approach of seal strength found in 30 CFR §75.335(a) is also divided into
general sealed areas and longwall crosscut seals. In monitored and inertly maintained sealed areas, a
minimum overpressure of 50 psi must be maintained for four seconds and then instantaneously released
for general sealed areas. For longwall crosscut seals, this overpressure must be maintained for 0.1
seconds. Most commonly, the sealed area is not monitored and does not remained inert. In these cases, the
seals must be built to maintain a minimum overpressure of 120 psi for 4 seconds for general seals and 0.1
seconds for crosscut seals. There are an additional three circumstances where the seal strength must be
designed to withstand overpressures greater than 120 psi: the sealed area is likely to contain a
homogenous mixture of methane between 4.5 and 17.0% and oxygen exceeding 17.0%, pressure piling
could result in overpressures greater than 120 psi, or other conditions are encountered, such as the
likelihood of a detonation in the area to be sealed (Mine Safety and Health Administration, 2011).
2.1.6 Current Approved Seals Currently, there are 20 MSHA approved mine seals that have been submitted and accepted for
both 50 psi and 120 psi pressures. The approval process required by MSHA requires manufactures of seal
materials to provide specific designs on not only the physical properties of the material, but also the
construction specifications, quality control, and full testing design and results for the submitted seals (30
CFR § 75.335b). A list of the currently approved mine seals in the U.S. can be seen below in Table 2-2.
Table 2-2. Approved 50 psi and 120 psi seals by the Mine Safety and Health Administration
Manufacturer Seal Type
Maximum Entry
Dimensions (height by
width)
Overpressure of 50 psi
Strata Plug Seal 16' by 40'
Minova Main Line Tekseal® 30' by 30'
MICON Gob Seal 20' by 28'
MICON Main Line Seal 20' by 28'
JennChem Gob Isolation J-Seal 30' by 30'
Overpressure of 120 psi
Strata Plug Seal 16' to 100'
Orica Main Line Tekseal® 30' by 30'
BHP Billiton Main Line Plug Seal 20' by 26'
Precision Mine Repair 8x40 Concrete Seal 8' by 40'
Minova Gob Isolation Tekseal® 30' by 30'
MICON Mainline Hybrid Seal 20' by 28'
Precision Mine Repair Concrete Seal 6' by 40'
10
Precision Mine Repair Concrete Seal 10' by 40'
Precision Mine Repair Concrete Seal 12' by 40'
Minova Main Line Tekseal® 30' by 40'
MICON Mainline Hybrid II Seal 20' to 28'
MICON
Gob Isolation Hybrid II
Seal 20' to 28'
MICON Mainline Hyrbid III Seal 20' to 28'
Strata StrataCrete Seal 12' to 40'
JennChem Mainline J-Seal 30' to 30'
Out of the list of approved mine seals, 70% involve some form of pumpable cement or shotcrete
to the support the structural integrity of the seal. Pumping of both high-density cement and aerated
cellular cement can produce possible integrity issues after the original mixing, due to the velocity of the
pump and shearing effects. These issues can be seen in the form of voids, microstructural fractures, and
density changes (Narayanan, Ramamurthy, & K., 2000) (Ramamuthy, Nambiar, & Ranjani, 2009) (Rio,
Rodriguez, Nabulsi, & Alvarez, 2011). Factors such as temperature and pumping distance also have the
possibility of effecting the predictability of the flow of cement (Rio, Rodriguez, Nabulsi, & Alvarez,
2011). Some of the factors that affect the rheology, or flow of “soft solids” are the mixer type, the mixing
sequence, the mixing duration, temperature, distance pumped, and composition of the mix (Ferraris, de
Larrard, & Martys, 2001). All of these compounded factors make the variability and potential for
structural issues for seals made with pumpable cement fairly high.
2.2 Non-Destructive Testing Methods
2.2.1 NDT assessment of concrete structures Non-destructive testing (NDT) is a term generally applied to the evaluation of a structure or
material without intrusive measures. While visual inspections have been common place in evaluating the
condition of concrete structures, NDT techniques have become the preferred method for evaluating the
condition of the material beneath the surface of a structure. One of the unique qualities of the NDT field is
that many of the techniques used in the evaluation of concrete structures originate from other disciplines:
health physics, medicine, geophysics, laser technology, nuclear power, and process control (Mix, 1987).
One of the first uses of an NDT method to look at the integrity of concrete was the invention of the
Schmidt hammer by Swiss engineer Ernst Schmidt. The Scmidt hammer is used to evaluate the surface
hardness of cement structures but struggles to evaluate the cement type or content (Bungey & Millard,
1996), two factors important in the integrity of the structure. Other factors that influence the Schmidt
hammer’s ability to evaluate the strength of concrete are smoothness, carbonation, and moisture condition
(Cantor, 1984). While the Schmidt hammer is far from a robust NDT technique for evaluating cement and
concrete structures, it was one of the first patented NDT technique for concrete (United States of America
Patent No. US 2664743 A, 1951).
2.2.2 NDT methods From the mid-1940’s to today, there have been many advancements in the field and new NDT
methods that have become commonly used in the evaluation of concrete structures, along with other civil
structures such a pipes, coatings, and welds (Cantor, 1984). Halmshaw has separated NDT testing
methods into five distinct or major methods, radiology, ultrasonic, magnetic, electrical, and penetrate, and
within each of these groups there are many different testing method that can be used for a wide variety of
structures (Halmshaw, 1987).

11
2.2.2.1 Radiology
In terms of testing the integrity and condition of concrete structures, radiology has been
developed into three different methods: X-ray radiography, gamma ray radiography, and gamma ray
radiometry (Bungey & Millard, 1996). X-ray radiography, an NDT method most commonly associated
with the medical field (Mix, 1987), has been used in laboratory tests primarily to examine the internal
structure and condition of concrete, but has rarely been used in field tests due to the high risk of
backscatter radiation from X-rays reflected off the surface. Gamma ray radiology is similar to X-ray
radiography in that an internal picture of the structure is created by the straight-line passage of rays
through the structure and onto a photography layer. Any void space or high density particle within the
material will be seen on the photographic layer or radiograph (Halmshaw, 1987). Gamma ray radiometry
measures the backscatter of gamma radiation as it passed from one side of the structure to another. As the
gamma rays pass through the concrete, some rays are absorbed, some pass through completely, and other
are scattered by the concrete. The backscatter is the measure of the amount of radiation scatted by the
structure, and can be used to measure the thickness and density of concrete structures (Bungey & Millard,
1996).
2.2.2.2 Ultrasonic
Ultrasonic waves are commonly used to evaluate the uniformity of structures and to estimate
strength (Malhotra, 1984). Ultrasonic waves (greater than 20 kHz) are electronically generated and
applied to the sample. The time of travel and reflective nature of the waves as they travel through the
structure are measured using a circuit consisting of a pulser/receiver connected through cables to the
transmitting transducer, which is placed on the surface of the object in question. A receiving transducer is
then placed on the same surface and is connected back to the pulser/receiver through another series of
cables, and recorded using a data system (Schmerr Jr. & Song, 2007). The measured velocities of these
waves are primarily dependent on the elastic properties of the material, which, in concrete typically runs
between 3.5 and 4.8 km/s (Bungey & Millard, 1996). Areas within the material that contain fractures and
discontinuities often reflect some of the ultrasonic energy back to the receiver, resulting in a quicker
travel time than waves reflected from the opposing side of the sample. Small voids and reinforcement
material with elastic properties different from the concrete structure can also be detected using a pulse
ultrasonic NDT method (Halmshaw, 1987) (Schickert & Krause, 2010).
2.2.2.3 Magnetic
Magnetic NDT methods are primarily focused at evaluating materials that possess large amounts
of iron, nickel, and cobalt (ferromagnetic materials) that are strongly attracted to one another when
magnetized. When a specimen containing a large amount of ferromagnetic materials becomes
magnetized, both surface and subsurface flaws can be observed by the distortion of the magnetic flux
field. These fields can be detected by magnetic tape and field-sensitive detector probes (Halmshaw,
1987). Eddy current and leak flux are the two main magnetic NDT methods. Eddy current testing involves
using alternating magnetic fields to create eddy current that, if any flaw is present in the structure to affect
the conductivity, can be detected. Flux leakage uses either permanent magnets or DC electromagnetic
fields to create flux fields to detect discontinuities or cracks in the structure that cause leakage of the flux.
Both dry and wet magnetic particles are also used to detect structural issues and flaws. By applying these
particles to ferromagnetic structures, one can observe surface cracks based on the presence of these
particles in cracks following their removal from the surface of the structure (Mix, 1987). Typically
magnetic NDT methods are used to identify the location and condition of metal used in reinforced
concrete structures (Malhotra, 1984).
2.2.2.4 Electrical
Eddy current monitoring is a cross-over technique that applies to both magnetic and electrical
NDT methods. As previously mentioned, the resultant currents created by generating eddy currents

12
through alternating current through coils on the surface of the structure can be affected by many structural
variables. These variables include flaws, size of the specimen, electrical conductivity of the structure, and
magnetic permeability. Other electrical methods include the measurement of electrical resistivity (which
can determine cracks, porosity, sample dimensions, and lattice structure of the material), electrostatic
field generation (for detection of cracks in porcelain coatings), and triboelectric testing (for detection of
variation in metal composition based on the voltage produced by friction effects between two metals)
(Halmshaw, 1987). In terms of concrete evaluation, electrical NDT methods can be used to determine
concrete thickness, location and condition of metal reinforcements, and the moisture content of the
structures (Malhotra, 1984).
2.2.2.5 Penetrate
One of the oldest NDT techniques, penetrant flaw detection is also one of the easiest methods to
detect surface-breaking discontinuities. The earliest example of penetrant flaw detection was referred to
as the oil and whiting technique. Oil would be applied to the surface of a specimen and allowed to soak
in. After removing the excess oil from the surface, calcium carbonate powder would be applied to the
surface of the structure. Any surface cracks or discontinues would become visible as oil would migrate to
the powder or whiting, leaving a reduction in whiteness on the surface of the cracked area (Halmshaw,
1987). In 1941 fluorescent and visible dyes were added to the penetrant by Robert and Joseph Switzer,
greatly improving the technique (Mix, 1987). Today oils have widely been replaced with fluorescent
penetrants, which become visible under ultraviolet (UV) light (DiMambro, Ashbaugh, Nelson, &
Spencer, 2007). Penetrant testing can be used on a wide range of materials, but typically metals, alloys,
ceramics, and plastics. A reputation of being unreliable has often been associated with this method but is
frequently attributed to improper pre-cleaning processes (Halmshaw, 1987).
2.2.3 Other methods
Another electromagnetic NDT method, ground penetrating radar (GPR) or electromagnetic
reflection can also be used to evaluate concrete structures. However, unlike magnetic NDT methods, the
materials that are ferromagnetic cannot be investigated using GPR. Electromagnetic pulses are admitted
from a transmitter antenna and then recorded by a receiver antenna. As the electromagnetic energy travels
through the structure, and when it comes in contact with an interface part of the energy, it will be
transmitted and part will be reflected. Flaws are typically detected by comparing the resistance of the
electromagnetic energy or permittivity from one material to another. Flaws such as cracks and voids will
contain air pockets that will have different permittivity values than the concrete. GPR can be used to
determine the thickness of concrete structures and the location of reinforcement material and void spaces,
as well as measure material properties such as humidity and air content (Hygenschmidt, 2010). Because
water is a good absorber of electromagnetic energy, GPR is also well suited for determining water content
of concrete structures (Cantor, 1984).
As stresses are applied to certain structures, elastic acoustic waves are discretely produced within
the structure, hence this NDT method referred to as the acoustic wave method. These acoustic wave
events can be measured on the surface of the structure by transducers and these transducers can be used to
locate regional cracks or sliding planes within the structure and predict failure of the structure if high
stresses are present. Similar to the study of earthquakes, the acoustic energy produced by these structures
can range from 0.001-10 Hz, and can be continuously monitored (Halmshaw, 1987). One consideration
with the acoustic emission NDT method is that structures that experience a specific load will often
produce acoustic energy, but will then cease emitting energy until the specific load is exceeded, even if
the structure is unloaded and the original stress is reapplied. This phenomena is referred to as the “Kaiser
effect” and makes acoustic emission an ideal NDT method for determining and predicting failure criteria
of structures (Mix, 1987). For concrete structures the Kaiser effect has been observed over unloading

13
durations of approximately two hours, and predicted that over long time periods it is possible that the
autogenic “healing” of concrete structures will negate the Kaiser effect (Bungey & Millard, 1996).
Another NDT method that is specific to concrete and cement structures is the measurement of air-
permeability through the structure. While the main property being measured is the permeability of the
structure, other properties, such as microcracks and porosity, can also be determined (Hansen, Ottosen, &
Peterson, 1987). Permeability is determined within the structure (usually through laboratory tests) by
injecting an inert gas such as nitrogen at a steady flow rate into the sample and measuring the pressure
differential and flow rate of the gas. Findings from Choinska, Khelidj, Charzigergiou, and Pijaudier-
Cabot saw the air permeability of concrete samples decrease with the original loading of stresses to the
samples. However, as micro-cracking begins to take place in the sample the permeability increases and
increases further after the sample is unloaded. Temperature has also been seen to affect the permeability
of concrete and, due to the thermal expansion of air within the pore space of the structure as the
temperature increases in a sample, so does the permeability (Choinska, Khelidj, Chatzigeorgious, &
Pijaudier-Cabot, 2007). Permeability of concrete structures has also been used to characterize the
moisture condition of the sample (Abbas, Carcasses, & Olliver, 1999) as well as the additive components
that might be part of a cerementous mix, such as fly ash, silica fume, limestone filter, and granulated blast
furnace slag (Hui-sheng, Bi-wan, & Xiao-chen, 2009).
2.3 Impact-Echo Sonic Waves
2.3.1 Theory Like the ultrasonic NDT testing method, the impact-echo NDT method relies on the movement of
energy waves through a structure. The impact-echo method was recently developed in the mid 1980’s by
what is now the National Institute for Standards and Technology (NIST), specifically as a NDT method
for concrete. This method evaluates the vibrational response of the concrete structure, as some physical
impact is applied to the surface. Waves propagate through the structure after impact (usually with a
hammer or metal device) and are reflected off the boundaries between the top and bottom of the sample,
and also multiple reflection occur, a resonance phenomenon occurs that, through the resulting frequency
spectrum of the sample, can be used to determine the thickness of the sample (Abraham & Popovics,
2010). The frequency of the sample is usually measured by accelerometers or geophones that record the
vibrations of the sample in the form of voltage. A Fourier transform (see next sub-section) is then needed
to produce the frequency spectrum of the resonance in the sample. The basic layout and sample frequency
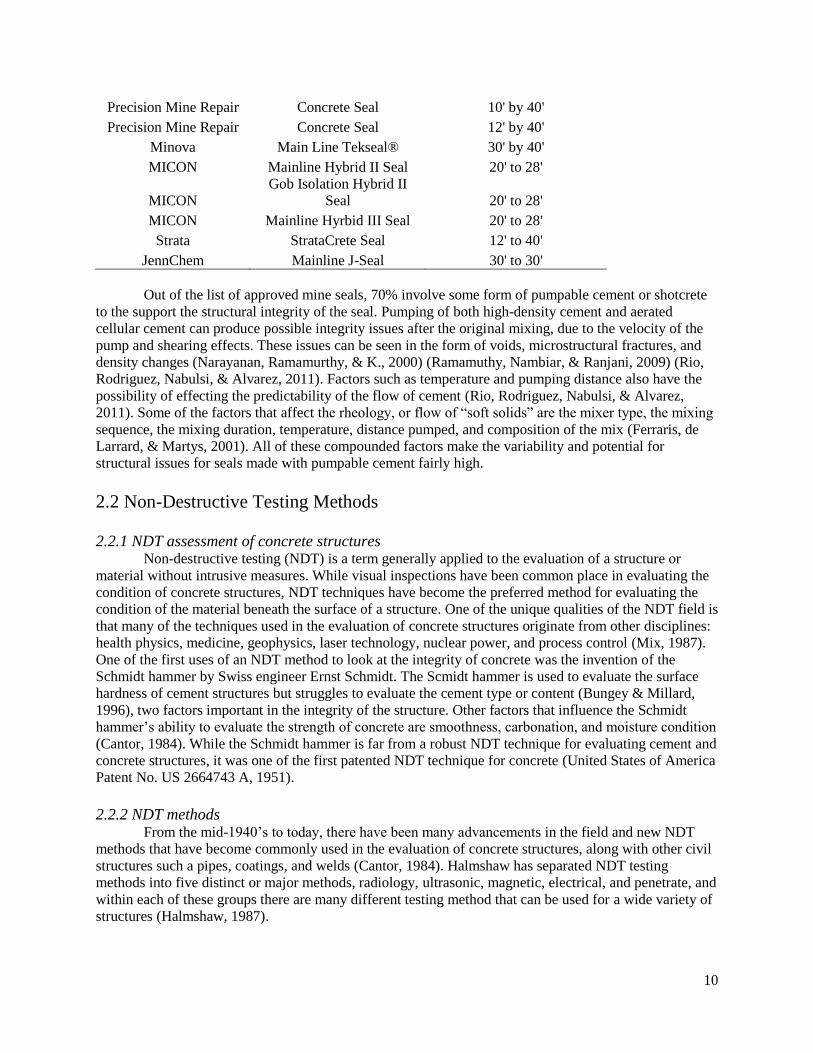
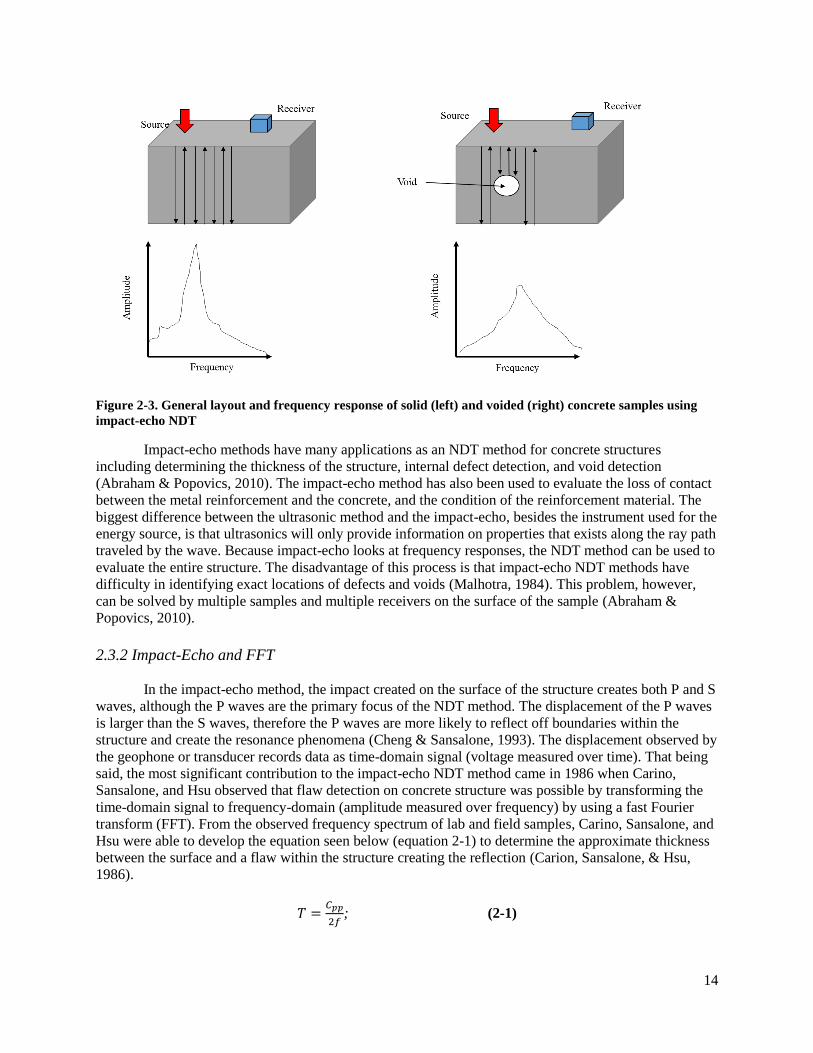
spectrum of the impact-echo test can be seen below in Figure 2-3.
14
Figure 2-3. General layout and frequency response of solid (left) and voided (right) concrete samples using
impact-echo NDT
Impact-echo methods have many applications as an NDT method for concrete structures
including determining the thickness of the structure, internal defect detection, and void detection
(Abraham & Popovics, 2010). The impact-echo method has also been used to evaluate the loss of contact
between the metal reinforcement and the concrete, and the condition of the reinforcement material. The
biggest difference between the ultrasonic method and the impact-echo, besides the instrument used for the
energy source, is that ultrasonics will only provide information on properties that exists along the ray path
traveled by the wave. Because impact-echo looks at frequency responses, the NDT method can be used to
evaluate the entire structure. The disadvantage of this process is that impact-echo NDT methods have
difficulty in identifying exact locations of defects and voids (Malhotra, 1984). This problem, however,
can be solved by multiple samples and multiple receivers on the surface of the sample (Abraham &
Popovics, 2010).
2.3.2 Impact-Echo and FFT
In the impact-echo method, the impact created on the surface of the structure creates both P and S
waves, although the P waves are the primary focus of the NDT method. The displacement of the P waves
is larger than the S waves, therefore the P waves are more likely to reflect off boundaries within the
structure and create the resonance phenomena (Cheng & Sansalone, 1993). The displacement observed by
the geophone or transducer records data as time-domain signal (voltage measured over time). That being
said, the most significant contribution to the impact-echo NDT method came in 1986 when Carino,
Sansalone, and Hsu observed that flaw detection on concrete structure was possible by transforming the
time-domain signal to frequency-domain (amplitude measured over frequency) by using a fast Fourier
transform (FFT). From the observed frequency spectrum of lab and field samples, Carino, Sansalone, and
Hsu were able to develop the equation seen below (equation 2-1) to determine the approximate thickness
between the surface and a flaw within the structure creating the reflection (Carion, Sansalone, & Hsu,
1986).
𝑇 =𝐶𝑝𝑝
2𝑓; (2-1)

15
where T is the depth of the reflection (bottom of structure or flaw),
Cpp is the natural P wave speed through the thickness of the concrete structure, and
f is the frequency observed of the P wave reflection
The use of FFT analysis for the impact-echo NDT method has been the standard since 1986 and
has been used in both laboratory and field tests to observe delaminations in the concrete structure
(McCann & Forde, 2001), correlate the frequency spectrum with the strength characteristics of concrete
(Cho, 2003), and even the corrosion damage of rebar found in reinforced concrete structures (Laing & Su,
2001). It has also been commented that the impact-echo may determine the porosity and water content of
structures (Carino, 2001). When compared to other NDT methods, Krause, et al. commented that the
impact-echo method has shown similar ability to detect flaws within the subsurface of concrete structures,
as well as the thickness of the structure itself. Some of the other NDT methods used by Krause, et al.
included radar and ultrasonics (which used six different processing techniques) (Krause, et al., 1997).
Overall, the impact-echo NDT method, specifically with the development of the FFT analysis, provides a
cheap, efficient, and fairly accurate method to evaluate the location of boundaries with a concrete
structure, as well as other physical properties necessary for structural integrity.
2.3.3 Fourier transform A Fourier analysis is often referred to as “frequency analysis” and is the mathematical science of
transforming any given function as a super position of sinusoid, each possessing a distinct frequency. A
sinusoid is the linear combination of the functions cos 2𝜋𝑠𝑥 and sin 2𝜋𝑠𝑥, where x is a real variable and s
is a nonnegative, real constant, or the frequency of the sinusoid. The rough equation for most Fourier
analyses can be seen below in equation 2-2.
𝑓(𝑥) = ∑ (𝐴𝑠(𝑓) cos 2𝜋𝑠𝑥 + 𝐵𝑠(𝑓) sin 2𝜋𝑠𝑥)𝑠∈𝐹𝑓; (2-2)
where Ff is a naturally occurring set
As(f) and Bs(f) are the coefficients of function F
The equation above represents the most reduced, general function of a Fourier analysis (Stade,
2005). In order to take a series of data and evaluate the frequency spectrum of the data, a Fourier
transform must take place, of which there are many. Primary, a form of discrete Fourier transform (DFT)
is used to take data and continually produce the corresponding frequency spectrum of the data. This is
called a fast Fourier transform (FFT). DFT analysis and FFT analysis produce the same results, but with
the advancements of computational computer power in recent years, the FFT can reduce computational
time by a factor of 200 when the number of data points is only 1024. Because of this, FFT is primarily
used for larger data sets or continuous data (Walker, 1996). By taking the basic equation in 2-1 and re-
expressing the function in exponential form using equations 2-3 and 2-4, it can eventually be reduced to
final Fourier transform (𝑋(𝑓)) equation seen below in equation 2-5 (Stade, 2005).
cos 2𝜋𝑠𝑥 =𝑒𝑗2𝜋𝑠𝑥+𝑒−𝑗2𝜋𝑠𝑥
2 (2-3)
sin 2𝜋𝑠𝑥 =𝑒𝑗2𝜋𝑠𝑥−𝑒−𝑗2𝜋𝑠𝑥
2𝑗 (2-4)
where e is the base of the natural logarithmic,
j is the imaginary complex number of √−1
𝑋(𝑓) = ∫ 𝑓(𝑥)𝑒−𝑗2𝜋𝑠𝑥𝑑𝑥∞
−∞ (2-5)

16
FFT analysis has been used in a wide array of fields, from mathematics to finances, and even in
vibration analysis of mechanical structures. A series of displacement, velocity, and acceleration
transduced has been used to evaluate the vibrations of parts to help with the prediction of mechanical
failure (Ramierz, 1985). Chakrabarti, in 1987, rewrote the FFT equation to better apply to wave energy
spectral density. This equation, 2-6, can be seen below and serves as an analog to the total energy of the
elastic waves through concrete as part of the impact-echo method. To evaluate the entire spectrum (𝑆(𝑤))
of wave energy, the equation 2-7 is derived. The resulting spectrum is used to evaluate energy density
along different frequencies for the data set (Rahman, 2011).
𝐸 =1
2𝜌𝑔 ∫ |𝜂(𝑡)|2𝑑𝑡
∞
−∞ (2-6)
where E is the total energy of the wave (per unit surface area)
ρ is the density
g is the acceleration due to gravity
ηt is the wave elevation
𝑆(𝑤) =1
𝑇𝑠|∑ 𝜂(𝑛∆𝑡)𝑒𝑖2𝜋𝑓(𝑛∆𝑡)∆𝑡𝑁
𝑛=1 |2 (2-7)
where Ts is the total data length
N is a subsection of the total data points
Δt is a constant time increment over N
2.4 Tracer Gases
2.4.1 Support of Ventilation Characterization The ventilation design and support of underground mining activities is perhaps the most
important operation that takes place in an underground mine. While the initial design of these airways is
important, constant surveys are necessary to ensure the quantity and quality of air in the mine is up to
mandatory requirements. These surveys typical address the quantity, pressure, temperature, and mixture
of gases present in the mine, using a variety of methods. Quantity surveys are typically completed by
measuring the cross-sectional area of mine airways, and then corresponding velocity moving through the
airway using anemometers, pilot static tubes, or velometers (Roberts, 1960). Pressure surveys are
completed by using a combination of pilot tubes and pressure gages, or barometers, and are done to
determine the pressure drop in airways due to friction, shock, and increase in kinetic energy (Hall, 1981).
Temperature surveys take place in order to determine the density of the air, the humidity, and also the
cooling power of the ventilation system. Both dry and wet bulb (dry temperature plus the evaporative rate
of air) temperatures are measured in underground mines by using sling psychrometers or whirling
hygrometers (Hartman, Mutmansky, Ramani, & Wang, 1997). Air quality surveys typically concern the
composition of the air underground, specially methane, carbon dioxide, carbon monoxide, and other gases
and dust. The quantification of these gases can be done underground using portable devices such as stain
tube chemical sensors or infrared sensors, but are typically done by taking samples underground and
transporting to a laboratory station or portable gas chromatograph (Timko & Derick). Methane is one
underground gas that must be monitored almost continuously as it is the most commonly occurring
combustible gas found in underground mines. The monitoring is done by using methanometers that can
accurately monitor methane level to ±0.1% (Hall, 1981).
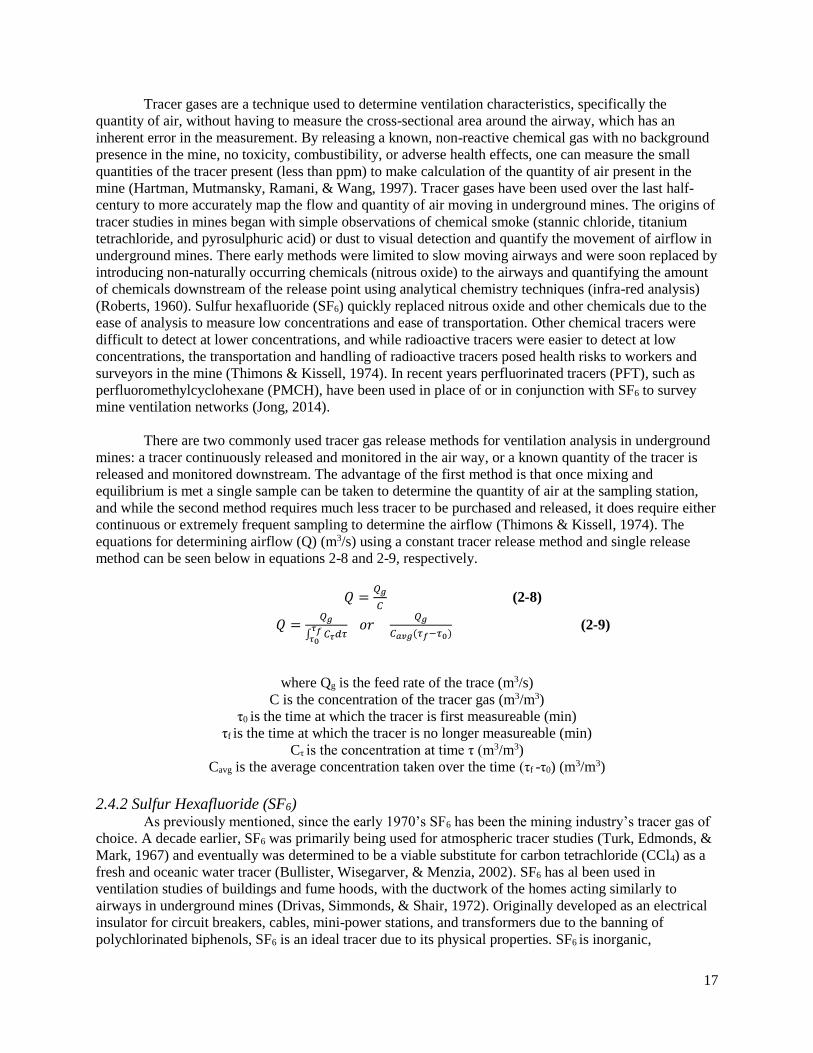
17
Tracer gases are a technique used to determine ventilation characteristics, specifically the
quantity of air, without having to measure the cross-sectional area around the airway, which has an
inherent error in the measurement. By releasing a known, non-reactive chemical gas with no background
presence in the mine, no toxicity, combustibility, or adverse health effects, one can measure the small
quantities of the tracer present (less than ppm) to make calculation of the quantity of air present in the
mine (Hartman, Mutmansky, Ramani, & Wang, 1997). Tracer gases have been used over the last half-
century to more accurately map the flow and quantity of air moving in underground mines. The origins of
tracer studies in mines began with simple observations of chemical smoke (stannic chloride, titanium
tetrachloride, and pyrosulphuric acid) or dust to visual detection and quantify the movement of airflow in
underground mines. There early methods were limited to slow moving airways and were soon replaced by
introducing non-naturally occurring chemicals (nitrous oxide) to the airways and quantifying the amount
of chemicals downstream of the release point using analytical chemistry techniques (infra-red analysis)
(Roberts, 1960). Sulfur hexafluoride (SF6) quickly replaced nitrous oxide and other chemicals due to the
ease of analysis to measure low concentrations and ease of transportation. Other chemical tracers were
difficult to detect at lower concentrations, and while radioactive tracers were easier to detect at low
concentrations, the transportation and handling of radioactive tracers posed health risks to workers and
surveyors in the mine (Thimons & Kissell, 1974). In recent years perfluorinated tracers (PFT), such as
perfluoromethylcyclohexane (PMCH), have been used in place of or in conjunction with SF6 to survey
mine ventilation networks (Jong, 2014).
There are two commonly used tracer gas release methods for ventilation analysis in underground
mines: a tracer continuously released and monitored in the air way, or a known quantity of the tracer is
released and monitored downstream. The advantage of the first method is that once mixing and
equilibrium is met a single sample can be taken to determine the quantity of air at the sampling station,
and while the second method requires much less tracer to be purchased and released, it does require either
continuous or extremely frequent sampling to determine the airflow (Thimons & Kissell, 1974). The
equations for determining airflow (Q) (m3/s) using a constant tracer release method and single release
method can be seen below in equations 2-8 and 2-9, respectively.
𝑄 =𝑄𝑔
𝐶 (2-8)
𝑄 =𝑄𝑔
∫ 𝐶𝜏𝜏𝑓
𝜏0𝑑𝜏
𝑜𝑟 𝑄𝑔
𝐶𝑎𝑣𝑔(𝜏𝑓−𝜏0) (2-9)
where Qg is the feed rate of the trace (m3/s)
C is the concentration of the tracer gas (m3/m3)
τ0 is the time at which the tracer is first measureable (min)
τf is the time at which the tracer is no longer measureable (min)
Cτ is the concentration at time τ (m3/m3)
Cavg is the average concentration taken over the time (τf -τ0) (m3/m3)
2.4.2 Sulfur Hexafluoride (SF6) As previously mentioned, since the early 1970’s SF6 has been the mining industry’s tracer gas of
choice. A decade earlier, SF6 was primarily being used for atmospheric tracer studies (Turk, Edmonds, &
Mark, 1967) and eventually was determined to be a viable substitute for carbon tetrachloride (CCl4) as a
fresh and oceanic water tracer (Bullister, Wisegarver, & Menzia, 2002). SF6 has al been used in
ventilation studies of buildings and fume hoods, with the ductwork of the homes acting similarly to
airways in underground mines (Drivas, Simmonds, & Shair, 1972). Originally developed as an electrical
insulator for circuit breakers, cables, mini-power stations, and transformers due to the banning of
polychlorinated biphenols, SF6 is an ideal tracer due to its physical properties. SF6 is inorganic,

18
nonflammable, odorless, colorless, and nontoxic gas, typically described as inert. SF6 is capable of being
detected at low concentration levels due to its nature as a good electron scavenger and high breakdown
strength. SF6, due to the shielding of the sulfur atom by the six fluorine atoms, is impeded from having
kinematic reactions to water, alkali hydroxides, ammonia, or strong acids, making it a fairly unreactive
gas (Nakajima, Zemva, & Tressaud, 2000).
In the mining industry, SF6 has been used in both coal and metal/non-metal underground mines to
look at airflow patterns, leakage rates, diffusion rates, and even been used to confirm physical survey
tools, as Stokes, Kennedy, and Hardcastle proved by calculating the volume of a single stope in Ontario,
Canada by quantifying the amount of airflow through the stope and average residence time, both observed
by continuous SF6 monitoring (Stokes, Kennedy, & Hardcastle, 1987). The 1974 U.S. Bureau of Mine’s
report on the gaseous tracer in ventilation surveys using SF6 was one of the first documented reports of
SF6 successfully being used and indorsed by a government body in the U.S. The report showed how
releasing SF6 in the Bureau’s Safety and Research Mine in Bruceton, PA and monitoring of the
concentration could be used to determine the airflow moving through the airways. The report also
documented a field test conducted in an underground limestone mine where air velocity was measured
using SF6 tracer techniques and compared to traditional smoke tests and anemometers. The tracer gas
technique compared favorably (Thimons, Bielicki, & Kissell, 1974). SF6, as a tracer, has been used to
monitor leakage through and around permanent mine stoppings (seals) at lower levels (less than 20
ft3/min) than observed before (Matta, Maksimovic, & Kissell, 1978). By sampling for SF6 across different
areas of an airway, it is also possible to determine how well air is being mixed or if there are any stagnant
or eddy zones located along the airway (Kissell & Bielicki, 1974). SF6 has been an invaluable tool used in
the mining industry over the last 40 years for its ease of use, sensitivity, ability to provide information in
traditionally inaccessible regions of the mine, and the amount of information that can come from
monitoring SF6 concentrations.
2.4.3 Perfluorinated Tracer Compounds (PFTs) While SF6 has been the standard mine-related tracer gas since the early 1970’s another group of
tracers have become more commonplace in terms of structural ventilation studies— perfluorocarbon
tracers (PFTs) (Leaderer, Schaap, & Dietz, 1985). Perfluorocarbon tracers have been predominantly used
in atmospheric tracer studies, where a small amount of tracer is released in the atmosphere and monitored
to help confirm atmospheric dispersion models that have been created to simulate air pollutant behavior
(Ferber, et al., 1980). Perfluorocarbon tracers are stable, non-toxic, organic compounds that typically
consist of an alkane group of six carbon atoms, surrounded by a combination of fluorine atoms and more
carbon atoms in the form of trifluoromethyl groups (Kirsch, 2004). One of the advantages of PFTs
compared to SF6 is that, due to the ever increasing sensitivity of tracer detection and natural background
abundance of tracers, most PFTs have a much lower background than SF6. For example, when compared
to perfluoromethylcyclohexane (PMCH) (C7F14) SF6 is approximately 250 times more abundant than
PMCH (Ferber, et al., 1980). PMCH, along with many other PFT tracers, is liquid at standard temperature
and pressure, yet volatile. To use this property as an advantage, Brookhaven Nation Lab (BNL) developed
passive release sources that house a small amount of liquid PFT, which then becomes a vapor and is
slowly released into the ventilation network through a permeable silicone rubber plug. This produced a
constant, temperature dependent release of the PFT into the network. Using multiple tracers, BNL was
able to map complex ventilation networks found in modern HVAC (heating, ventilation, and air-
condition) systems (Dietz, Goodrich, Cote, & Wieser, 1986). It is worth noting, as Sherman did, that the
while PFTs are extremely useful and applicable, there is a certain amount of uncertainty and error that
comes with using integrated PFTs for building air flow calculations, compared to real-time measurement
systems (Sherman, 1989).

19
There has been virtually no wide use of PFTs to assist in mine ventilation surveys, but novel work
has recently been completed by a research group at Virginia Tech who used PMCH along with SF6 to
characterize the airflow around a longwall panel, across the face, and through the gob of a western U.S.
underground coal mine (Jong, 2014). Also, BNL and the New York City police department recently
completed an airflow study of the New York subway system using PFTs (Frazier, 2013). Based on the
subway study, and series of building ventilation BNL has conducted, it is relatively safe to assume there
is room for the use for PFTs in underground mine ventilation studies.
Another interesting use of PFTs is in the field of carbon sequestration and CO2 leakage
monitoring. In recent studies, PFTs have been injected along with CO2 in sequestration studies in coal
seams (Ripepi, 2009), saline aquifers (Pruess, et al., 2005), and depleted oil reservoirs (Wells A. W., et
al., 2007). In many of these studies PFTs are monitored at offset wells nearby the injection well of the
CO2, but soil testing is also done monitor for PFTs indicating potential CO2 leaks through the overburden.
This movement of PFTs through long distances and through solid layers of material, indicates the
potential for these tracers to move through solid structures, similar to SF6 through underground mine seals
(Matta, Maksimovic, & Kissell, 1978).
2.4.4 Basic Chromatography Techniques The sampling of tracer gases from mine airways is an important component of a tracer gas
analysis, but the actual detection and quantification of the tracers require the use of analytical chemistry
in order to both separate the desired tracer from the rest of the compounds present in the air sample and
quantify the amount of tracer present. Both of these operations are made possible using an analytical
technique known as gas chromatography. While the foundation for the field began in the mid-1800’s with
observations from Prussian doctor Friedrich Runge, who observed procession of different compounds on
filter paper (Szabandvary, 1966), modern gas chromatography (GC) took root in the 1952 when Martin
and James separated and quantified ammonia from methylamines using what was referred to as gas-liquid
partition chromatography (Martin, James, & Smith, 1952). The rudimentary yet revolutionary device used
by Martin and James involved the use of a homemade microcolumn packed with Celite (or silica SiO2), a
micrometer burette, and a titration cell to separate the compounds has been replaced with housed
instruments that contain the hardware and software to separate and quantify compounds that can be
injected both manually and automatically. Compounds can be identified by the order in which they are
separated in the columns used for GC, and then quantified using the detector systems used.
The basic set-up for a modern GC instrument consist of three major regions: the injector port, the
column oven, and the detector. Seen in Figure 2-4 below, the basic layout of a gas chromatograph
involves injecting a small (less than a milliliter) amount of sample into the heated injector port, which
vaporizes the sample. The carrier gas, a high purity, inert gas, is used not only to transport the sample
through the chromatograph, but also serves as a matrix for the detector to measure the compounds of the
sample. As the vapors of the sample travel with the carrier gas through the column of the chromatograph,
certain compounds begin to interact with the stationary phase found within the column (McNair & Miller,
1997).
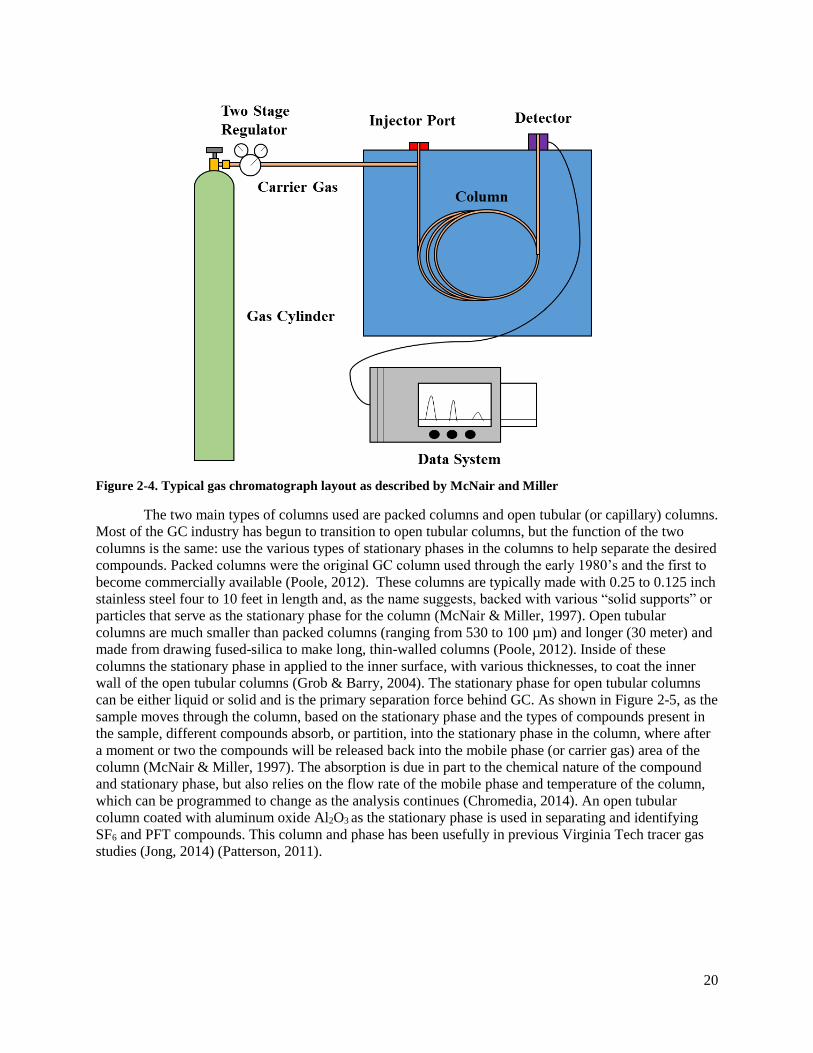
20
Figure 2-4. Typical gas chromatograph layout as described by McNair and Miller
The two main types of columns used are packed columns and open tubular (or capillary) columns.
Most of the GC industry has begun to transition to open tubular columns, but the function of the two
columns is the same: use the various types of stationary phases in the columns to help separate the desired
compounds. Packed columns were the original GC column used through the early 1980’s and the first to
become commercially available (Poole, 2012). These columns are typically made with 0.25 to 0.125 inch
stainless steel four to 10 feet in length and, as the name suggests, backed with various “solid supports” or
particles that serve as the stationary phase for the column (McNair & Miller, 1997). Open tubular
columns are much smaller than packed columns (ranging from 530 to 100 µm) and longer (30 meter) and
made from drawing fused-silica to make long, thin-walled columns (Poole, 2012). Inside of these
columns the stationary phase in applied to the inner surface, with various thicknesses, to coat the inner
wall of the open tubular columns (Grob & Barry, 2004). The stationary phase for open tubular columns
can be either liquid or solid and is the primary separation force behind GC. As shown in Figure 2-5, as the
sample moves through the column, based on the stationary phase and the types of compounds present in
the sample, different compounds absorb, or partition, into the stationary phase in the column, where after
a moment or two the compounds will be released back into the mobile phase (or carrier gas) area of the
column (McNair & Miller, 1997). The absorption is due in part to the chemical nature of the compound
and stationary phase, but also relies on the flow rate of the mobile phase and temperature of the column,
which can be programmed to change as the analysis continues (Chromedia, 2014). An open tubular
column coated with aluminum oxide Al2O3 as the stationary phase is used in separating and identifying
SF6 and PFT compounds. This column and phase has been usefully in previous Virginia Tech tracer gas
studies (Jong, 2014) (Patterson, 2011).

21
Figure 2-5. Visual representation of the separation of compounds from a sample in an open tubular column
The third region of importance in the chromatograph is the detector. There are three main detector
types commonly found in GC — thermal conductivity (TCD), flame ionization (FID), and electron
capture (ECD). It is in the detectors that the separated compounds produce some form of electrical
response that can be recorded by the data system of the chromatograph. The response of the detector is
then reported in the forms of magnitude, or peaks, of the signal compared to the background noise. The
resulting graph is referred to as a chromatogram and consist of a baseline and series of peaks, each
representing a different compound and the amount present, although the magnitude of the peak and
amount of compound (response factor) vary from compound to cc and the reference gas (carrier gas).
Typically the carrier gases (helium or hydrogen) have high thermal conductivity (watts per meter kelvin)
values, and the presence of the analyses in the carrier reduce this value, producing a response on the data
collection system for the TCD. The thermal conductivity is measured by either using heated filaments or
thermistors in a Wheatstone bridge in most TCDs (Sevcik, 1976). FID is one of the most widely used
detectors but is limited to organic compounds due to the nature of the detector. The FID functions by
running the sample through an ignited flame source, and the resulting ions (Jorgnsen & Stamoudis, 1990).
The ions from the combusted sample create a signal in an electrode stationed above the flame (Harvey,
2014). For the tracer gas studies at Virginia Tech and analysis that requires the detection of
electronegative functional groups such as fluorine, chloride, and bromine groups, the ECD is typically
considered the best detector. The ECD detector houses a radioactive source (63Ni) that emits beta particles
into the make-up gas stream coming out of the column (nitrogen). The beta particles and N2 then react to
form N2+ with two free electrons (Hill & McMinn, 1992 ). What eventually is created by the constant flow
gas and emission of beta particles is the creation of an “electron cloud.” Prior to the separated compounds
entering this cloud, the ECD response is measured by a cathode. When electronegative compounds enter
the cloud, the available electrons become attached and leave the cloud with the compounds. This
produces a reduction in the cloud’s signal, or negative signal, that is then related to the presence of certain
compounds (McNair & Miller, 1997).
Regardless of the detector, the response is reported by the data system in the units of peak area
counts. These units reflect the response of the detector to the type of compound present and the amount
present. In order to determine the concentration of a specific compound within a sample, it is necessary to
develop and build a calibration curve. By injecting known concentrations of the compound in question,
one can construct a graph plotting the peak area response versus the known concentration injected. A
curve, typically linear, can then be applied to the plot to determine an equation capable of calculating the
concentration (typically in ppm or ppb) of a compound, based on the peak area counts reported by the
data system and detector (Thompson, 1977). It is important that the sample points of interest fall within
the range of points used for creating the calibration curve. Although most curves behave linearly over a

22
small range of peak area counts, the curve begins to form a power or quadratic function as the range of
points increases. Due to this, it is important that points lay along the interpolated calibration curve, and
not the extrapolated function (McNair & Miller, 1997).
2.4.5 Basics of Mass Spectrometry Many of the fundamentals from gas chromatography are also carried over to mass spectrometry,
which is often called gas chromatography mass spectrometry (GC-MS). The injection of samples and
separation using a packed or open tubular column in a heated zone remain the same as in a typical GC
analysis, however the separated compounds travel to the mass spectrometer (MS) portion of the
instrument rather than a detector. Once entering the MS the analytes are ionized. The compounds are then
detected and identified by the mass analyzer (Niessen, 2001). The basic layout of a GC-MS instrument
can be seen below in Figure 2-6. All of the components of the MS are under a high vacuum, due to the
fact that gas continuously flows into the MS, and must also be removed at a rate that maintains the desires
operating pressure (Sparkman, Penton, & Kitson, 2011). There are many forms of ionization techniques
and mass analyzers that are used in GC-MS, but the overall result, and biggest advantage of GC-MS to
GC is that the compounds can be successful identified by mass spectrum (Niessen, 2001). The
identification of compounds in GC is based on the order in which the responses, or peaks, appear on the
chromatogram. By sampling known compounds and looking at the retention time (the time from injection
to peak) one can identify unknown compounds by the retention time. There are, however, many
compounds that can potentially share retentions times (McNair & Miller, 1997), which is why GC-MS
provides a large advantage to typical GC.
Figure 2-6. Typical GC-MS layout
In the ion source region there are three basic types of ionization that can take place: electron
ionization; chemical ionization; and negative chemical ionization. Ionization takes place because for each
molecule of the same compound, ionized under the same conditions, the same pattern and quantity of ions
will be formed. This provides a “fingerprint” unique to each compound by which the compound can be
identified and quantified (McMaster & McMaster, 1998). Electron ionization is an ionization technique
that exposes the sample analytes to a stream of electrons from heated tungsten or rhenium filaments in the
source. The stream of electrons contains enough energy that, when coming in contact with a neutral
charge compound, the electrons interact with the valance electrons of the sample and remove one to
create a positively charged ion (Chromedia, 2014). Due to this interaction and removal of electrons, this
ionization method is sometimes referred to as electron impact. Chemical ionization relies on the
interaction between the analytes’ molecules and a reagent gas. Reagent gases used in chemical ionization
can be various, but the most common type are methane, ammonia, or isobutene. Like in electron
ionization, the reagent gas is bombarded with electrons. The ions created from the reagent gas then go to
ionize the analytes (Niessen, 2001). This ionization is referred to as “soft” ionization rather than “hard” as
the ionization takes place by the analytes interaction with ions rather than be impacted by electrons as in
electron ionization (Chromedia, 2014). Chemical ionization can produce either positive or negative ions.
23
When negative ions are created, the process is them referred to as negative chemical ionization or electron
capture negative ionization (Sparkman, Penton, & Kitson, 2011). Electron ionization is considered the
most reproducible of the methods, while chemical ionization is more likely to produce the molecular ion
(molecular weight of the compound, plus a single electron) rather than fragments, and negative chemical
ionization is more efficient and sensitive than chemical ionization, but with poor reproducibility
(University of Kentucky, 2014).
While the ionization, and creation of ionization fragemnts, is an important step in GC-MS, the
quatification and indentification of the compounds in the sample takes place in the mass analyzer. To
move the fragments into the mass analyzer, a repelling plate located in the ion source is provided with a
charge of the same sign as the ions. This plate propels the fragments through a series of electronic
focusing leneses into the mass analyzer, which is under a higher, secondary vaccuum than the ion source
region of the MS (McMaster & McMaster, 1998). There are a few different types of mass analyzers used,
but the most widely used type is the quadrupole mass filter. As the name implies, this analyzer consists of
four poles, two parallel in the x-axis and two in the y-axis (assuming the z-axis is the path of the ionizaed
fragments moving through the MS), and alternating direct and alternating currents in the form of an
elctrical field created by radio frequnecies. The alternation currents, and the mass to charge ratio (m/z)
value dictate which fragments are allowed to enter the detector. If the specific m/z is created in the
quadrupole, only the correcsponding fragment with the same m/z value will remain in the ion beam
(Sparkman, Penton, & Kitson, 2011). Due to the small amount of ions avalible in the MS, the ion stream,
after being filtered by the mass analyzer, enters a continuous-dynode electron mutiplier to increase the
number of electrons entering the detector (Niessen, 2001). The detector tycally used for GC-MS is a
microchannel plate, which is a circular plate consisting of a series of hollow tubes. The electrons from the
electron mutiplier enter these tubes that continue to mutiply the amount of electrons and create an elctrical
output that is then digitized and recorded (Sparkman, Penton, & Kitson, 2011).
For the GC-MS analysis of the sulfur hexafluoride and perflourinated compounds, there are many
possible configurations of instrumentation cabable separating the SF6 and PFTs from other compounds.
SF6 separation and identification has been successful, and repeatedly documented using ECD detectors
(Harnisch & Borchers, 1996) (Harnisch & Eisenhauer, 1998) for GC and quadrupole mass analyzers
(Sausers, Ellis, & Christophorou, 1986). For the tracer gas studies conducted with the use of PFTs
analysis can also be completed using open tubular columns and an ECD in a GC instrument (Dietz &
Cote, 1982) (Cooke, Simmonds, Nickless, & Makepeace, 2001). Recently, the sentivity of PFT analysis
has been greatly improved with the use of GC-MS, specifically with negative chemical ionization
(Straume, Dietz, Koffi, & Nodop, 1998) (Simmonds, et al., 2002). Negative chemical ionization and GC-
MS have been able to qunaitify PFTs at concentrations approximately ten times lower than traditional
ECD methods (16 femotograms) (Begely, Foulgr, & Simmonds, 1988) (Galdiga & Greibrokk, 2000).
24
Chapter 3: Assessment of Sonic Waves and Tracer Gases as Non-
Destructive Testing Methods to Evaluate the Condition and
Integrity of In-Situ Underground Mine Seals
*Note: The following chapter was published as part of the pre-prints of the 2014 Society of Mining,
Metallurgy, and Exploration (SME) Annual Conference held February 23-26th in Salt Lake City, UT, and
also presented there. This chapter is listed as Preprint 14-048 with authors K. T. Brashear, K. Luxbacher,
E. Westman, C. Harwood, B. Lusk, and W. Weitzel.
3.1 Abstract Since the MINER Act of 2006, the minimum static load of in-situ underground mine seals has
been increased from 20-psi to either 50-psi if monitoring is conducted or 120-psi if left unmonitored.
These minimum strength requirements in seals must be designed, built, and maintained throughout the
lifetime of the seal. Due to this, it has become necessary to assess the effectiveness of non-destructive
testing (NDT) technologies to determine seal integrity, which in this case, are explored using sonic waves
and tracer gases. Through both small and large scale testing, two NDT methods will be evaluated for their
abilities to determine integrity of the seal: a sonic wave technique to observe a change in wave velocity to
identify faults within the seal material, and a tracer gas As a NDT method, tracer gases may be used as a
potential indicator of a connection between both sides of the seal material through a series of faults and
cracks within the material itself. This paper reviews the history of underground mine seals and discusses
the overall assessment of sonic waves and tracer gases to serve as NDT methods for estimating the
integrity of these seals.
3.2 Introduction According to the U.S. Energy Information Administration’s 2011 Annual Energy Review,
approximately 32% of all coal mined in the United States came from an underground coal mine. This
same report also estimated that nearly 58% of all recoverable coal reserves in the United States are
located underground (U.S. Energy Information Administration, 2012). This trend indicates a shift towards
more underground coal mines in the U.S. Why is this fact important? As a larger percentage of coal
reserves begin to move underground, better technologies are going to be required to effectively and safely
produce coal. One of the primary concerns for safety in underground U.S. coal mines is the
implementation of high-strength underground mine seals. Generally speaking, there are two primary roles
for underground mine seals: ventilation and safety. In order to mitigate the ventilation requirements for
the active mining portion of an underground coal mine, that continues increase the overall size of the
active mining area, seals are used to separate the active mining areas from previously mined areas.
Inactive areas are sectioned off by constructing seals at the areas of converging airways (McPherson,
1993). According to a 2007 report, there are over 14,000 active mine seals in the U.S., in both room-and-
pillar and longwall coal mines (Zipf, Sapko, & Brune, 2007). Recent regulations concerning the
compressive strength the material used in underground mine seals have increased (Mine Safety and
Health Administration, 2011) making it important for operators to comply and maintain these standards
without disturbing the integrity of the seal. The following paper will detail and comment on two
prospective methods that may be used to evaluate the condition of these seals, without damaging the
structures.
3.3 Background When looking at the history of underground mine seals in the U.S. three distinct eras come into
consideration based on recommended and required strength: 50-psi; 20-psi; and 120-psi. The first

25
regulations concerning underground mine seals in the U.S. appeared in the Mineral Leasing Act of 1920.
As written, the amendment (Sec. 104(a)) requires that all inactive areas of the mine be sealed with
explosion-proof and fire-proof stoppings. These stoppings were required to withstand a pressure of 50-psi
on either side of the stopping. The 50-psi strength standard came from “the general opinion of men
experienced in mine explosion investigations” rather than any laboratory tests or reported field
measurements. At the time, the primary design of the seals was typically around two feet in thickness and
were made of reinforced concrete anchored into the roof, floor, and ribs of the mine (Rice, Greenwald,
Howarth, & Avins, 1931). The 50-psi standard for seal strength remained unchanged until 1969, when a
more detailed definition of “explosion-proof” was necessary as part of the Federal Coal Mine Health and
Safety Act. Testing was conducted by B.W. Mitchell of the U.S. Bureau of Mines, at the Pittsburgh Mine
and Safety Research Center, he determined that rarely, do pressures caused by explosions exceed more
than 20-psi on a mine seal. However, a few inaccurate assumptions prevented Mitchell from realistically
representing an explosion caused by the mixing and confining of an explosive atmosphere behind amine
seal (Zipf, Sapko, & Brune, 2007). Testing continued on seal materials, but it was not until 1992 that a
firm set of design criteria were installed into the Code of Federal Regulations. In 1991, the Bureau of
Mines looked at the designs of both pumpable cementitous foam seals and concrete blocks, both of which
met to the 20-psi requirements (Greninger, Weiss, Luzik, & Stephan, 1991). Several years later, another
report was published commenting on three additional seal designs that met 20-psi strength requirements
(Stephan & Schultz, 1997).
Despite the increase in design criteria, the 20-psi seal standard remained in place until 2007. In
2007, the MINER Act was enacted, as a direct result of the Sago and Darby mine incidents (Zipf, Sapko,
& Brune, 2007). At both mines, the accumulation of an explosive atmosphere behind newly-constructed
mine seals, and an ignition source caused explosions to occur in both mines within a five month span. At
the Sago Mine, 12 miners were killed as a result of the explosive atmosphere behind the mine seal being
ignited by lightning strikes in the area entering the seal area through cables, bolts, or the strata above the
area (Gates, et al., 2006). At the Darby Mine, five miners were killed due to welding taking place near the
surface of a recently constructed mine seal, igniting the atmosphere behind the seal (Light, et al., 2007).
The seals used in both of these mines were 20-psi designed concrete blocks that, due to the explosive
force behind the sealed area, caused a total of 13 seals to be destroyed. Due to these incidents in early
2006, new seal strength requirements were developed. Between the two incidents, the Sago explosion was
back-calculated to have generated an explosive force of 93-psi, and the Darby explosion to be 22-psi.
Because of this, the new requirements for unmonitored mine seals were divided into a three-tiered
approach, as laid out in 30 CFR §75.335(a) — 50-psi seals, 120-psi seals, and greater than 120-psi seals
(Kallu, 2009).
The minimum pressure required by the new standards is 50-psi, in monitored sealed areas where
the potentially explosive atmosphere can be observed, must be designed to maintain the pressure for 4.0
seconds and then instantaneously released. In longwall mines, if the seal is used as a crosscut seal
(constructed with the retreating longwall face in the crosscut nearest the gob area in the headgate (Zipf,
Sapko, & Brune, 2007)) the 50-psi pressure only needs to be maintained for 0.1 seconds. If the sealed area
remained unmonitored, the seal strength must meet 120-psi strength. 120-psi of pressure is applied to the
seal for 4.0 seconds and then released instantaneously — for a seal to pass strength standards it must not
fail under those conditions. Again, if the unmonitored seal is also a crosscut seal, the strength must only
be held for 0.1 seconds. There are three circumstances where seals must be designed to strengths greater
than 120-psi: the sealed area is likely to contain a homogenous mixture of methane between 4.5 and
17.0% and oxygen exceeding 17.0%; pressure piling could result in overpressures greater than 120-psi; or
other conditions are encountered, such as the likelihood of a detonation in the area to be sealed (Mine
Safety and Health Administration, 2011). These new seal requirements are not only more sophisticated,
but more stringent than at any other point in the history of coal mining in the U.S. As previously
mentioned, due to these regulations, certain tests need to be conducted to ensure that the active seals in
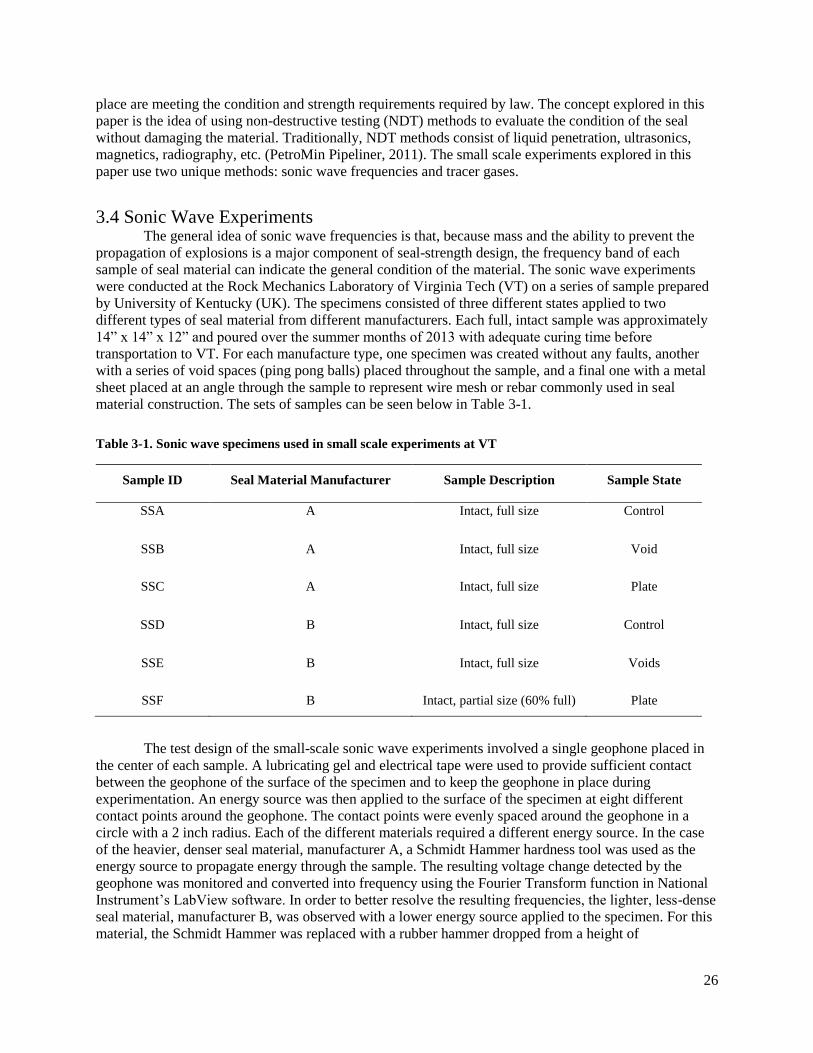
26
place are meeting the condition and strength requirements required by law. The concept explored in this
paper is the idea of using non-destructive testing (NDT) methods to evaluate the condition of the seal
without damaging the material. Traditionally, NDT methods consist of liquid penetration, ultrasonics,
magnetics, radiography, etc. (PetroMin Pipeliner, 2011). The small scale experiments explored in this
paper use two unique methods: sonic wave frequencies and tracer gases.
3.4 Sonic Wave Experiments The general idea of sonic wave frequencies is that, because mass and the ability to prevent the
propagation of explosions is a major component of seal-strength design, the frequency band of each
sample of seal material can indicate the general condition of the material. The sonic wave experiments
were conducted at the Rock Mechanics Laboratory of Virginia Tech (VT) on a series of sample prepared
by University of Kentucky (UK). The specimens consisted of three different states applied to two
different types of seal material from different manufacturers. Each full, intact sample was approximately
14” x 14” x 12” and poured over the summer months of 2013 with adequate curing time before
transportation to VT. For each manufacture type, one specimen was created without any faults, another
with a series of void spaces (ping pong balls) placed throughout the sample, and a final one with a metal
sheet placed at an angle through the sample to represent wire mesh or rebar commonly used in seal
material construction. The sets of samples can be seen below in Table 3-1.
Table 3-1. Sonic wave specimens used in small scale experiments at VT
Sample ID Seal Material Manufacturer Sample Description Sample State
SSA A Intact, full size Control
SSB A Intact, full size Void
SSC A Intact, full size Plate
SSD B Intact, full size Control
SSE B Intact, full size Voids
SSF B Intact, partial size (60% full) Plate
The test design of the small-scale sonic wave experiments involved a single geophone placed in
the center of each sample. A lubricating gel and electrical tape were used to provide sufficient contact
between the geophone of the surface of the specimen and to keep the geophone in place during
experimentation. An energy source was then applied to the surface of the specimen at eight different
contact points around the geophone. The contact points were evenly spaced around the geophone in a
circle with a 2 inch radius. Each of the different materials required a different energy source. In the case
of the heavier, denser seal material, manufacturer A, a Schmidt Hammer hardness tool was used as the
energy source to propagate energy through the sample. The resulting voltage change detected by the
geophone was monitored and converted into frequency using the Fourier Transform function in National
Instrument’s LabView software. In order to better resolve the resulting frequencies, the lighter, less-dense
seal material, manufacturer B, was observed with a lower energy source applied to the specimen. For this
material, the Schmidt Hammer was replaced with a rubber hammer dropped from a height of

27
approximately four inches. For sample SSF, because the sample was only 60% full, the specimen was
turned on its side to allow for the thickness of the sample to be the same as the other samples. However,
by rotating the sample and keeping the radius of contact points the same, the number of contact points
was reduced from eight to five for sample SSF.
In order to determine the reproducibility of the energy source and monitoring from the geophone,
the energy source was applied to each contact point eight times, for a total of 64 data records for each
specimen. Due to the nature of the energy sources being applied, while relatively consistent, each strike
was different enough to prevent conducting an analysis of percent difference, between the two frequency
spectrums, as a quantitative tool to compare the difference in the frequency spans was not practice for the
NDT application. To solve this issue the two record were correlated in order to compare two frequency
ranges to one another. If the qualitative comparison (signal shape) of the two different records similar, a
higher correlation value will be provided.
Another issue to be considered in the analysis was the idea of compiling the records and creating
an average frequency range for each contact point and for each specimen. To determine if using averages
produced better results, all data records for each manufacture’s specimens were compared to their
respective averages using correlation. For all specimens, from both manufacturers, the use of averages
increased the correlation values by approximately 5%. Therefore, for the comparison of the specimens,
specifically within each manufacture group, the cumulative average frequency band (derived from the
average band from each contact point) was used.
The results from the analysis mentioned above can be seen in Figures 3-1 and 3-2 below. As these
figures show, the correlation between the control specimens, SSA and SSD, and the void specimens, SSB
and SSE, were significantly more pronounced in the manufacturer A material, rather than the
manufacturer B material. For manufacturer A, the correlation between SSA and SSC was 0.994,
indicating almost no difference between the two samples. This is most likely attributed the similarity in
densities between the two materials, which explains why the correlations between SSB and SSA and SSC
were both below 0.50. The lower correlation between the sets compared to void space specimen is most
likely caused by the difference in density between the air in the void material and the seal material/steel
plate.
The comparison between SSE, SSD, and SSF produced different results. The correlation between
SSE and SSF was the lowest correlation between all of the B manufacturer materials at 0.892.
Coincidentally, the values between the SSE and SSF samples, indicated that the void sample and the plate
sample, had the highest correlation out of the group. This contradicts the findings of the samples from
manufacturer A. The most likely cause of this was the overall smaller size of specimen SSF. As the
material of manufacturer B oxidizes, the material becomes more brittle and soft. In full-scale mine seals,
this is mitigated by wrapping the seal in a plastic liner, which was not available for the small scale
experiments. Because sample SSF was generally smaller, a larger percentage of the volume had oxidized
and would be more similar to the void sample SSE than the controlled, less oxidized sample SSD.
Similarly, this rational explains why the correlation between SSD and SSE was significantly more similar
to the correlations of SSD and SSF then the counterparts from manufacturer A. Another factor that
affected the correlation differences between manufacturers A and B is the natural densities of the
material. Manufacturer A provided better distinction between the control and voided samples, because the
density between the material and air is significantly greater than the density between air and manufacturer
B’s material. These density values, and values from other materials can be seen below in Table 3-2.
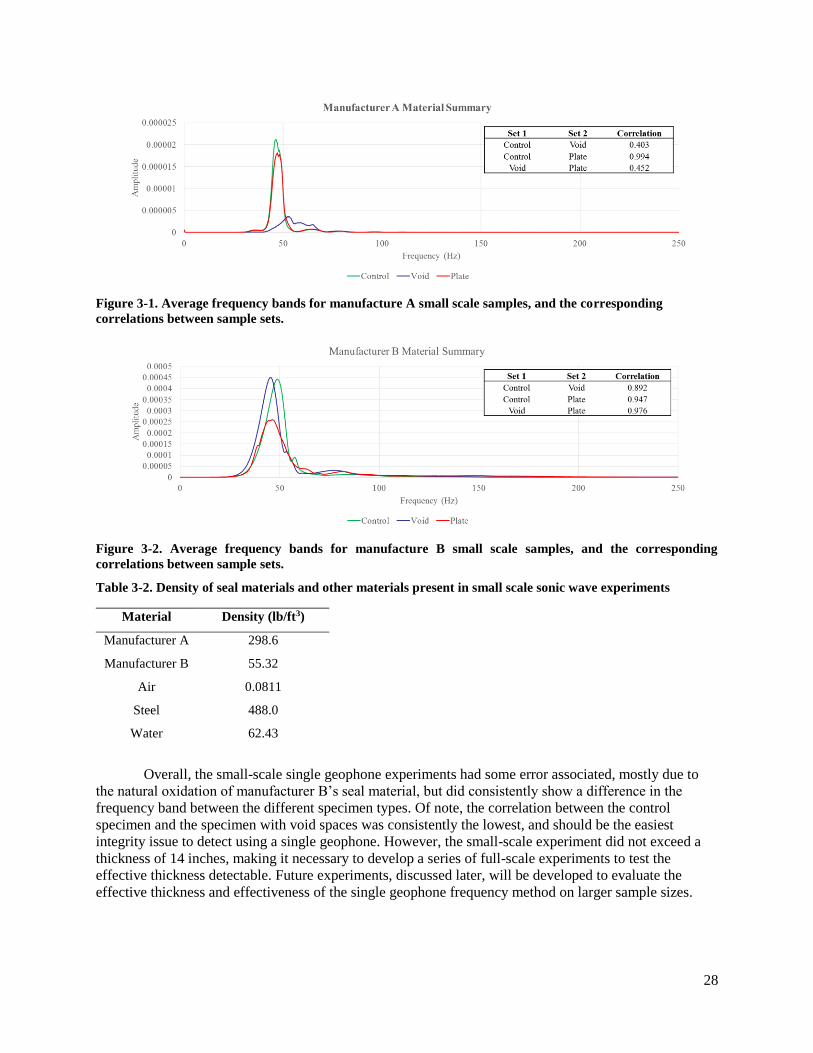
28
Figure 3-1. Average frequency bands for manufacture A small scale samples, and the corresponding
correlations between sample sets.
Figure 3-2. Average frequency bands for manufacture B small scale samples, and the corresponding
correlations between sample sets.
Table 3-2. Density of seal materials and other materials present in small scale sonic wave experiments
Material Density (lb/ft3)
Manufacturer A 298.6
Manufacturer B 55.32
Air 0.0811
Steel 488.0
Water 62.43
Overall, the small-scale single geophone experiments had some error associated, mostly due to
the natural oxidation of manufacturer B’s seal material, but did consistently show a difference in the
frequency band between the different specimen types. Of note, the correlation between the control
specimen and the specimen with void spaces was consistently the lowest, and should be the easiest
integrity issue to detect using a single geophone. However, the small-scale experiment did not exceed a
thickness of 14 inches, making it necessary to develop a series of full-scale experiments to test the
effective thickness detectable. Future experiments, discussed later, will be developed to evaluate the
effective thickness and effectiveness of the single geophone frequency method on larger sample sizes.
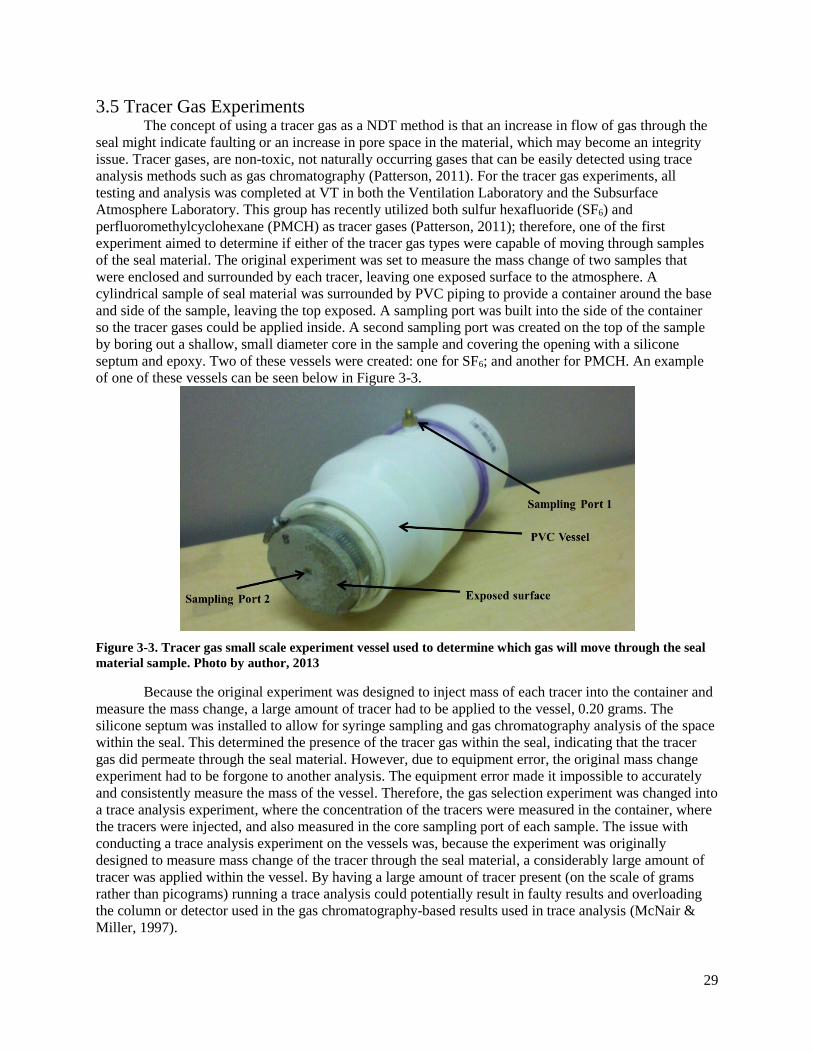
29
3.5 Tracer Gas Experiments The concept of using a tracer gas as a NDT method is that an increase in flow of gas through the
seal might indicate faulting or an increase in pore space in the material, which may become an integrity
issue. Tracer gases, are non-toxic, not naturally occurring gases that can be easily detected using trace
analysis methods such as gas chromatography (Patterson, 2011). For the tracer gas experiments, all
testing and analysis was completed at VT in both the Ventilation Laboratory and the Subsurface
Atmosphere Laboratory. This group has recently utilized both sulfur hexafluoride (SF6) and
perfluoromethylcyclohexane (PMCH) as tracer gases (Patterson, 2011); therefore, one of the first
experiment aimed to determine if either of the tracer gas types were capable of moving through samples
of the seal material. The original experiment was set to measure the mass change of two samples that
were enclosed and surrounded by each tracer, leaving one exposed surface to the atmosphere. A
cylindrical sample of seal material was surrounded by PVC piping to provide a container around the base
and side of the sample, leaving the top exposed. A sampling port was built into the side of the container
so the tracer gases could be applied inside. A second sampling port was created on the top of the sample
by boring out a shallow, small diameter core in the sample and covering the opening with a silicone
septum and epoxy. Two of these vessels were created: one for SF6; and another for PMCH. An example
of one of these vessels can be seen below in Figure 3-3.
Figure 3-3. Tracer gas small scale experiment vessel used to determine which gas will move through the seal
material sample. Photo by author, 2013
Because the original experiment was designed to inject mass of each tracer into the container and
measure the mass change, a large amount of tracer had to be applied to the vessel, 0.20 grams. The
silicone septum was installed to allow for syringe sampling and gas chromatography analysis of the space
within the seal. This determined the presence of the tracer gas within the seal, indicating that the tracer
gas did permeate through the seal material. However, due to equipment error, the original mass change
experiment had to be forgone to another analysis. The equipment error made it impossible to accurately
and consistently measure the mass of the vessel. Therefore, the gas selection experiment was changed into
a trace analysis experiment, where the concentration of the tracers were measured in the container, where
the tracers were injected, and also measured in the core sampling port of each sample. The issue with
conducting a trace analysis experiment on the vessels was, because the experiment was originally
designed to measure mass change of the tracer through the seal material, a considerably large amount of
tracer was applied within the vessel. By having a large amount of tracer present (on the scale of grams
rather than picograms) running a trace analysis could potentially result in faulty results and overloading
the column or detector used in the gas chromatography-based results used in trace analysis (McNair &
Miller, 1997).

30
Below, the results of the trace analysis can be seen in Figures 3-4 and 3-5. The SF6 tracer samples
taken from both the container and the core of the vessel were acquired from a syringe in 2.5-µL volumes
and then injected into the gas chromatograph. The PMCH trace analysis, because of the increased
response to the electron capture detector (ECD) used in the gas chromatograph, was injected in 1-µL
amounts. Figure 3-4, the SF6 analysis, shows a very consistent decrease in the amount of tracer within the
core of the sample. It does demonstrate that within a single day of applying the tracer to the outside of the
sample, the tracer moved approximately two to three inches through the seal material. Over the next two
weeks, the amount continued to decrease, but the presence of the tracer was still easily detectable. Figure
3-5, the PMCH analysis, shows the concentration of the PMCH tracer within the core of the vessel. The
PMCH tracer, while less consistent that the SF6 results, continues to show the general decrease in the
concentration of the tracer within the core, and detectable presence of the tracer at least two weeks after
the original application of the tracer. The most likely cause of variation in PMCH results is the small
sample size. For gas samples, the smallest sample size that produced consistent results is approximately
5-µL. Because the needle of the syringe contains a head space of about 0.5-µL, smaller samples are easily
affected by the error caused by this amount of head space. Regardless of the potential error and variations
in the samples, both tracer gases showed the potential for movement through the seal material, even when
obvious structural defects were not present.
Figure 3-4. Relative concentration of SF6 in the core of the seal material
Figure 3-5. Relative concentration of PMCH in the core of the seal material
The final small-scale tracer gas experiment was conducted after the gas selection experiments to
determine if a significant reduction in the amount of tracer would still penetrate through the seal material.
For this experiment, another cylinder of seal material was drilled to make a hallow core, this time to the
center of the sample. Inside this core, a PMCH passive release source (PPRS) developed by researchers at
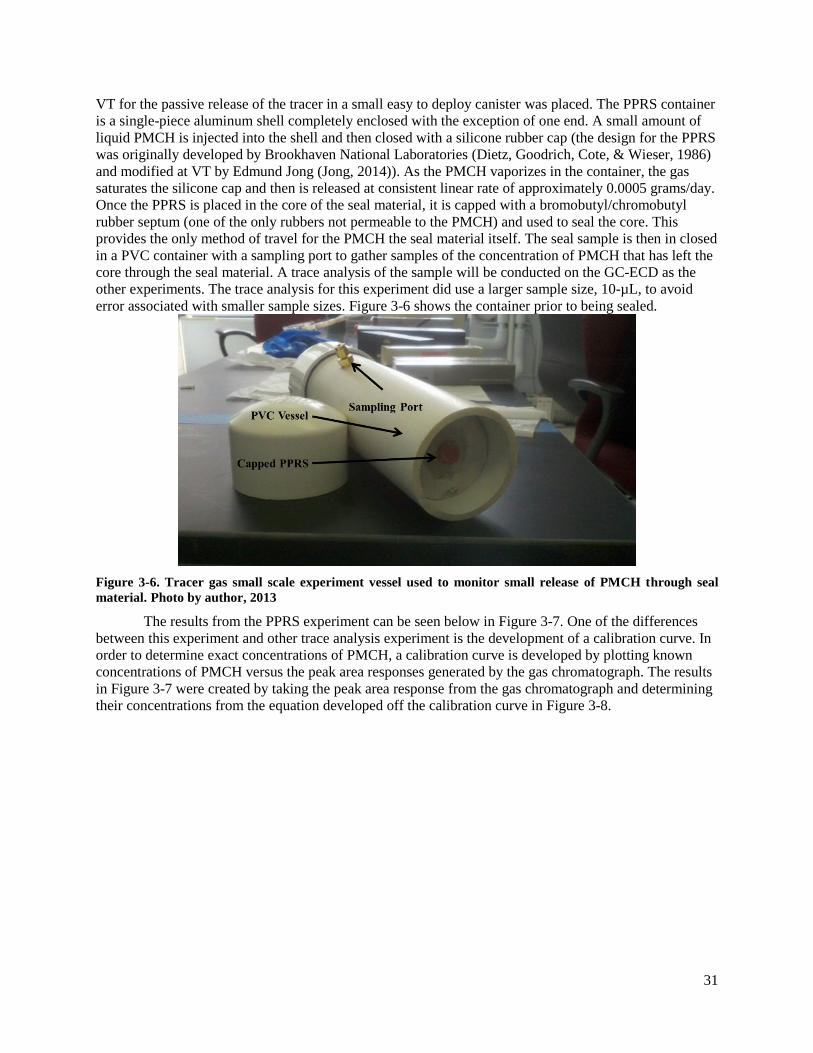
31
VT for the passive release of the tracer in a small easy to deploy canister was placed. The PPRS container
is a single-piece aluminum shell completely enclosed with the exception of one end. A small amount of
liquid PMCH is injected into the shell and then closed with a silicone rubber cap (the design for the PPRS
was originally developed by Brookhaven National Laboratories (Dietz, Goodrich, Cote, & Wieser, 1986)
and modified at VT by Edmund Jong (Jong, 2014)). As the PMCH vaporizes in the container, the gas
saturates the silicone cap and then is released at consistent linear rate of approximately 0.0005 grams/day.
Once the PPRS is placed in the core of the seal material, it is capped with a bromobutyl/chromobutyl
rubber septum (one of the only rubbers not permeable to the PMCH) and used to seal the core. This
provides the only method of travel for the PMCH the seal material itself. The seal sample is then in closed
in a PVC container with a sampling port to gather samples of the concentration of PMCH that has left the
core through the seal material. A trace analysis of the sample will be conducted on the GC-ECD as the
other experiments. The trace analysis for this experiment did use a larger sample size, 10-µL, to avoid
error associated with smaller sample sizes. Figure 3-6 shows the container prior to being sealed.
Figure 3-6. Tracer gas small scale experiment vessel used to monitor small release of PMCH through seal
material. Photo by author, 2013
The results from the PPRS experiment can be seen below in Figure 3-7. One of the differences
between this experiment and other trace analysis experiment is the development of a calibration curve. In
order to determine exact concentrations of PMCH, a calibration curve is developed by plotting known
concentrations of PMCH versus the peak area responses generated by the gas chromatograph. The results
in Figure 3-7 were created by taking the peak area response from the gas chromatograph and determining
their concentrations from the equation developed off the calibration curve in Figure 3-8.

32
Figure 3-7. Concentration of PMCH released from the PPRS that move through the seal material to occupy
the atmosphere of the vessel
Figure 3-8. Calibration curve used to determine the concentration of PMCH for each peak area count
reported by the GC 2014
As seen in Figure 3-7, there is a strong correlation between the hours of release and the
concentration of PMCH within the PVC container. After only four hours, the concentration of PMCH had
already reached approximately 30.7 ppb and peaked at almost 2,800,000 in the atmosphere within the
vessel after about ten days. This demonstrates that even after only a few days and a small amount of
PMCH released from inside the seal material, the atmosphere inside the PVC container reached nearly
0.28% pure PMCH. Note, data points after approximately 75 hours fall outside of the calibration curve.
However, due to the high RSD seen in Figure 3-8, and the goal of observing a general trend, data point
after 75 hours were extrapolated using the equation gathered from the calibration curve. Collectively, both

33
the gas selection and PPRS experiments showed that the seal material did little to inhibit the movement of
the tracer, at least for small sized samples and distances (less than six inches). Future experiments,
discussed below, will be designed to determine the effective thickness of seal material that the PMCH can
penetrate. All data from the gas selection experiment and PPRS experiment can be found in Appendix A.
3.6 Future Experiments The future experiments in assessing the NDT technologies as they are applied to in-situ
underground mine seals are focused on: the effective thickness each NDT method can be applied to, the
movement of PMCH tracer gas through full scale seals, and the reliability of sonic frequencies to
determine densities and conditions of full scale samples. The full scale experiments will be conducted in
underground mines to provide similar conditions to those experienced by active mine seals in
underground mines. These experiments will take place during a three-month span and will potentially
provide a better assessment of the technologies and their level of detection of flaws in active mine seals.
3.7 Conclusion Both the tracer gases and sonic wave frequency NDT methods have shown, on a small scale, the
potential to identify both density irregularities and faulting/passageways found in underground mine
seals, both of which can affect the strength and integrity of the seals. The small-scale tracer gas
experiments showed a consistent and quick movement of tracer gas through small distances of the seal
material from both direct tracer injection and a passive release of a small amount of PMCH and indicating
that permeability of the material is an important variable to consider. The small-scale sonic wave
experiments showed that a single geophone generated frequency band can potentially be used to observe
density differences in seal material. Full-scale experimentation is being developed to assist in
transitioning small-scale results to full-scale outcomes. The results of the future experiments could show
that either one or a combination of both NDT methods can be used to identify integrity issues in mine
seals.
3.8 Acknowledgements
This publication was developed under Contract No. 200-2012-52497, awarded by the National
Institute for Occupational Safety and Health (NIOSH). The findings and conclusions in this report are
those of the authors and do not reflect the official policies of the Department of Health and Human
Services; nor does mention of trade names, commercial practices, or organizations imply endorsement by
the US Government.

34
Chapter 4: Use of Perfluoromethylcyclohexane (PMCH) as a Novel
Non-Destructive Testing (NDT) Method to Evaluate In-Situ
Underground Mine Seals *Note: Contents from this chapter were submitted (along with small-scale related work) for publication
from the International Journal of Mining and Mineral Engineering under the title “Assessing the Use of
Perfluoromethylcyclohexane as a Novel Non-Destructive Testing Method to Evaluate In-Situ
Underground Mine Seals” by Kyle Brashear.
4.1 Background Non-destructive testing (NDT) technologies are important evaluation tools used to interpret
integrity issues in structures throughout the world. Structural integrity is difficult to measure in-situ and
can compromise the safety and function of many built structures. A 1990 National Science Foundation
(NSF) project found that 42% of U.S. bridges were inadequate for their current needs, mostly due to the
age and degradation of the concrete used during construction of these bridges. Similar integrity issues
have been reported in numerous structures throughout the U.S. (Chong, Scalzi, & Dillon, 1990). The
purpose of an NDT method is to “detect and locate the anomalies within an optically opaque medium
through appropriate imaging techniques.” In the case of concrete and similar structures, NDT methods are
often used to examine bodies for voids, cracks, delaminations, and deterioration zones (Buyukozturk,
1998).
In underground coal operations, concrete-like structures are utilized to isolate certain portions of
the mine. These structures, known as seals, are used to minimize the volume of workings requiring
ventilation, reduce maintenance and inspection requirements, as well as to prevent the propagation of
explosions in the sealed areas to the working areas. By definition, seals, as opposed to stoppings (another
form of underground ventilation and safety control) must be explosion-proof (McPherson M. J., 1993)
and withstand explosive pressures of 50 or 120 psig (Title 30 Code of Federal Regulations Part 75.335-8).
One of the most widely used seal materials employed in underground mines is pumpable cement which
can be mixed on the surface or in the mine, and then pumped into a form to create the seal. These seals
range from up to 30 feet tall and 100 feet wide to a few feet to 12 feet in thickness (Mine Safety and
Health Administration, 2014). While the U.S. Mine Safety and Health Administration (MSHA) has a
rigorous application and approval process for approving the strength and quality material to be used in
underground mine seals (30 CFR § 75.335 (b)) there are no current suggestions on how to monitor the
actual seals material once it has been installed. Implementation of NDT methods can allow for evaluation
of seals post installation.
Perfluorocarbon tracer (PFT) studies are experiments conducted typically to quantify and map
ventilation patterns in buildings and structures. These objectives are completed by monitoring the
movement of an anthropogenic inert gas that is introduced into the airflow (Sandberg & Blomqvist,
1985). Since the early 1980’s, PFT studies have almost exclusively been used to map the movement of air
in large openings (hallways, ventilation ducts, mine entries, etc.) (D'Ottavio, Senum, & Dietz, 1988).
Currently, little to no work has been done on the movement of PFTs though solid, porous media, such as
concrete and pumpable mine seals. However, PFT studies have been performed to measure the
breakthrough of geologically sequestered CO2 in brine-baring sandstones in Texas (Phelps, McCallum,
Cole, Kharaka, & Hovorka, 2006) and to monitor CO2 leakage in a sequestration and storage project in
the San Juan Basin (Wells, Diehl, Strazisar, Wilson, & Stanko, 2013). These two projects, and many
more, show that it is possible to monitor perfluorocarbons that have moved long distances and through
solid media such as sandstone, shale, and soil.
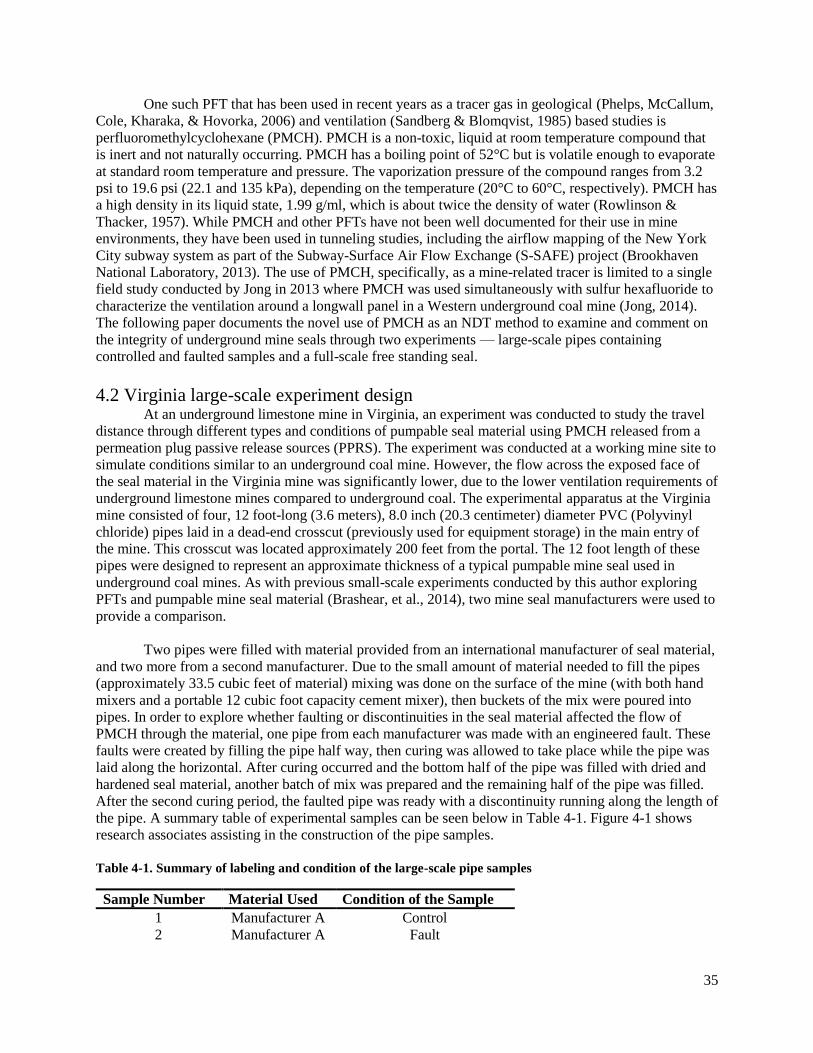
35
One such PFT that has been used in recent years as a tracer gas in geological (Phelps, McCallum,
Cole, Kharaka, & Hovorka, 2006) and ventilation (Sandberg & Blomqvist, 1985) based studies is
perfluoromethylcyclohexane (PMCH). PMCH is a non-toxic, liquid at room temperature compound that
is inert and not naturally occurring. PMCH has a boiling point of 52°C but is volatile enough to evaporate
at standard room temperature and pressure. The vaporization pressure of the compound ranges from 3.2
psi to 19.6 psi (22.1 and 135 kPa), depending on the temperature (20°C to 60°C, respectively). PMCH has
a high density in its liquid state, 1.99 g/ml, which is about twice the density of water (Rowlinson &
Thacker, 1957). While PMCH and other PFTs have not been well documented for their use in mine
environments, they have been used in tunneling studies, including the airflow mapping of the New York
City subway system as part of the Subway-Surface Air Flow Exchange (S-SAFE) project (Brookhaven
National Laboratory, 2013). The use of PMCH, specifically, as a mine-related tracer is limited to a single
field study conducted by Jong in 2013 where PMCH was used simultaneously with sulfur hexafluoride to
characterize the ventilation around a longwall panel in a Western underground coal mine (Jong, 2014).
The following paper documents the novel use of PMCH as an NDT method to examine and comment on
the integrity of underground mine seals through two experiments — large-scale pipes containing
controlled and faulted samples and a full-scale free standing seal.
4.2 Virginia large-scale experiment design At an underground limestone mine in Virginia, an experiment was conducted to study the travel
distance through different types and conditions of pumpable seal material using PMCH released from a
permeation plug passive release sources (PPRS). The experiment was conducted at a working mine site to
simulate conditions similar to an underground coal mine. However, the flow across the exposed face of
the seal material in the Virginia mine was significantly lower, due to the lower ventilation requirements of
underground limestone mines compared to underground coal. The experimental apparatus at the Virginia
mine consisted of four, 12 foot-long (3.6 meters), 8.0 inch (20.3 centimeter) diameter PVC (Polyvinyl
chloride) pipes laid in a dead-end crosscut (previously used for equipment storage) in the main entry of
the mine. This crosscut was located approximately 200 feet from the portal. The 12 foot length of these
pipes were designed to represent an approximate thickness of a typical pumpable mine seal used in
underground coal mines. As with previous small-scale experiments conducted by this author exploring
PFTs and pumpable mine seal material (Brashear, et al., 2014), two mine seal manufacturers were used to
provide a comparison.
Two pipes were filled with material provided from an international manufacturer of seal material,
and two more from a second manufacturer. Due to the small amount of material needed to fill the pipes
(approximately 33.5 cubic feet of material) mixing was done on the surface of the mine (with both hand
mixers and a portable 12 cubic foot capacity cement mixer), then buckets of the mix were poured into
pipes. In order to explore whether faulting or discontinuities in the seal material affected the flow of
PMCH through the material, one pipe from each manufacturer was made with an engineered fault. These
faults were created by filling the pipe half way, then curing was allowed to take place while the pipe was
laid along the horizontal. After curing occurred and the bottom half of the pipe was filled with dried and
hardened seal material, another batch of mix was prepared and the remaining half of the pipe was filled.
After the second curing period, the faulted pipe was ready with a discontinuity running along the length of
the pipe. A summary table of experimental samples can be seen below in Table 4-1. Figure 4-1 shows
research associates assisting in the construction of the pipe samples.
Table 4-1. Summary of labeling and condition of the large-scale pipe samples
Sample Number Material Used Condition of the Sample
1 Manufacturer A Control
2 Manufacturer A Fault

36
3 Manufacturer B Control
4 Manufacturer B Fault
Figure 4-1. Filling of one of the pipes used in the large-scale experiment in Virginia. Photo by author, 2013
Upon the final completion and curing of all four pipe samples, the samples were transported to
the mine site and placed in the previously described area of the mine. Once on the mine floor, sampling
ports were drilled into all four pipes at 1.5 foot (.46 meters) intervals. These ports were drilled with a ¼
inch (0.64 cm) diameter diamond-tipped drill bit. The ports were drilled to the approximate center of the
sample (4 inches, excluding the thickness of the PVC pipe). Seven total ports were drilled into each
sample. In each hole, a 5 to 6 inch long piece of abrasion resistant Tygon® tubing was placed and sealed
in place with a quick drying epoxy resin. The top of the tubing was covered with a Supelco
Thermogreen™ LB-2 septa to separate the atmosphere within the tubing and the seal material from the
mine atmosphere. Upon completion of the sampling ports installation, the last step in construction of the
four large-scale mine seal pipes was to apply the tracer to one end of the sample. This was achieved by
placing three PPRS vessels into one side of the pipe, and then sealing the face with PVC cement and
appropriate PVC cap. The other side of the sample remained open, exposed to the mine environment and
atmosphere. Figure 4-2 shows a diagram of the experimental design and the actual sample in place at the
mine.
Figure 4-2. Experimental layout of the large-scale samples— (A) schematic of the tracer release and sampling
ports, (B) pipes in-situ, and (C) the sampling port. Photo by author, 2013

37
The test sampling procedures consisted of collecting the atmosphere within the cored seal
material and Tygon® tubing. These samples were collected with 10.0 milliliter vacutainers. Vacutainers
typically ship with at least partial vacuum, and were further vacuumed in the laboratory to ensure
consistency and minimal sample dilution. The sample is introduced to the container with a double-ended
needle. One end of the needle was inserted in the septa cap on the Tygon® tube, and then the prepared
vacutainer was applied to the other needle end to pull the atmosphere from within tube into the
vacutainer. Samples were collected in separate vacutainers from each of the seven ports from each of the
four sample pipes over a series of six trips to the mine. The duration of the experiment from enclosing the
PPRSs within the sample to the final collection date was seven weeks. Six total sample dates were
included as part of the experiments, with the seven samples from each pipe and four total pipes, a total of
168 vacutainer samples were collected from the large-scale mine and returned to the laboratory.
4.3 Virginia large-scale experiment results Once the large-scale sampling was completed, method development began using a Shimadzu
2010 GC-MS (gas chromatograph-mass spectrometry) to confirm the presence of PMCH within the
samples and to quantify the amount of PMCH within each of the vacutainer samples. The method file
developed and used throughout the large scale experiments is shown below in Table 4-2.
Table 4-2. Summary of GC-MS method file used for large-scale samples
PMCH GC-MS Method File Conditions
Column Length
Inner diameter
Film thickness
Stationary phase
30 m
.25 mm
5 µm
HP-PLOT Al2O3
Linear velocity 45 cm/s
Total flow 72.4 mL/min
Column temperature/time 185 °C (isothermal)
3.5 min
Carrier gas Helium
Injector port temperature 150 °C
Ion source temperature 200 °C
Interface temperature 185 °C
Sample volume 50 µL
SIM 350 m/z
Event time 0.15 min
The 168 samples were analyzed under the method displayed in Table 4-2, in triplicate, and the
average value was reported. Analyzing the samples in triplicate and reporting the relative standard
deviation (RSD) allows for monitoring of precision when manually injecting a sample. While some
samples were below detection limits for PMCH, 127 of the 168 samples contained PMCH ranging in peak
area counts (electrical response from GC integrated over time) of 65 to 9,626,870.

38
Figure 4-3. Mass spectrum result from PMCH standard run using 2010 GC-MS and method file in Table 4-2
After the method file had been properly optimized, the calibration curve and PMCH confirmation
process commenced. The confirmation was achieved by injecting diluted (to approximately 100 ppm with
a hexane base) samples of technical grade PMCH. The resulting mass spectrum, seen in Figure 3,
confirmed a large spike at the mole to charge ratio of 350 M/z, which matched the response of the PMCH
samples. This sample of PMCH was also used for the calibration curve developed to determine the
relationship between known concentration of PMCH in a sample and the response seen from the GC-MS.
Based on the observed range of peak area counts (65 to 9,626,870) a calibration curve was
developed. Data points used for the calibration curve were determined by preparing standards with a
known concentration of PMCH and analyzing these standards in the GC-MS via the same method as the
mine pipe samples. The graph of those data points can be seen below in Figure 4-4. Concentration is
reported in ppb (parts per billion by volume). A correlation of 0.9972 indicates a strong relationship
between the observed data and the equation seen in Equation 4-1. By using Equation 4-1, the exact
concentration for each of the large-scale samples can be determined.
Figure 4-4. Calibration curve for the large-scale samples

39
𝒚 = 𝟏 × 𝟏𝟎−𝟗(𝒙)𝟐 + 𝟎. 𝟎𝟎𝟕𝟔 (𝒙); (4-1)
where y is the concentration in parts per billion (ppb)
and x is the peak area count generated from the GC-MS (unitless)
Table 4-3 shows the concentration of PMCH within each of the four samples from one of the six
sampling dates (11/25/13). For simplicity, the other five sample dates are not shown but included in the
later figures (Figure 4-6). Additionally, RSD was not shown in Table 4-3 but remained under 5% for a
majority of the samples throughout the experiment (161 of the 168). The seven samples with higher RSD
values than 5% were typically caused by vacutainers that retained some vacuum which made manual
injections difficult to extract from the vacutainer. Figure 4-5 shows a visual interpretation of the data seen
in Table 4-3. The PMCH was released and capped on the left most side of the figures, and the right side
remained open to the mine atmosphere and ventilation. Like in large-scale samples, the visual
interpretations are based on a length of 12 feet. As one can see, assuming the release of PMCH is
consistent between the samples, the concentration is significantly higher in the pipe containing engineered
faults. The manufacturer A faulted sample even shows a “pocket” of high PMCH 4.5 feet (1.4 meters)
away from the release source.
Table 4-3. Summary of large-scale sample results
Sample Distance from
Release Source
(ft)
Peak Area Concentration
(ppb)
Sample Distance
from
Release
Source (ft)
Peak Area Concentration
(ppb)
Manufacturer
B Fau1t
1/25/13
1.5 7,810,404.67 120,361.50
Manufacturer
B Control
11/25/13
1.5 1,710,175.33 15,922.03
3 1,911,481.67 18,181.02 3 406,074.33 3,251.06
4.5 262,979.00 2,067.80 4.5 27,487.33 209.66
6 66,698.67 511.36 6 7,100.67 54.02
7.5 4,002.67 30.44 7.5 1,252.00 9.52
9 1,654.33 12.58 9 - -
10.5 - - 10.5 - -
Manufacturer
A Fault 11/25/13
1.5 4,254,002.33 50,426.95
Manufacturer
A Control 11/25/13
1.5 63,690.00 488.10
3 75,847.00 582.19 3 1,392.67 10.59
4.5 2,423,355.67 24,290.16 4.5 1,650.00 12.54
6 807,790.00 6,791.73 6 - -
7.5 163,226.67 1,267.17 7.5 - -
9 125,946.00 973.05 9 - -
10.5 69,893.00 536.07 10.5 - -

40
Figure 4-5. Visual depiction of the concentration of PMCH on 11/25/13 through both manufacturer B (top
two) and manufacturer A (bottom two) samples: faulted samples proceed the control samples for each group
(concentration in ppb)
The overall results from the large-scale experiments show a general increase in the amount of
PMCH in the atmosphere within the seal material as the experiment progressed. The trend also showed a
noticeable increase in not only the magnitude, but also in the progression of the tracer within the faulted
samples. Figure 4-6 shows graphs of the four different samples through the duration of the experiment.
Figure 4-6. Graphical comparison of the four samples, showing concentration of the tracer vs. the distance
from the capped PPRS

41
4.4 Kentucky full-scale experiment deign The second set of experiments conducted with the PMCH tracer gases took place at the
University of Kentucky underground research area in an underground quarry in Georgetown, KY. On site
two large, free-standing, full-scale mine seals were constructed with Manufacturer B seal material under
best capable standard seal construction procedures. These seals had dimensions of approximately 20 feet
by 12 feet, with a height of six feet (6.1 meters by 3.7 meters by 1.8 meters). One of the samples was
chosen for the full-scale tracer experiment. In this sample, a ½ inch diameter diamond-tipped drill bit was
used to core holes into the top of sample. Five locations on the top of the sample contained two cores, one
drilled at three feet (0.9 meters) and an adjacent core drilled one and half feet (0.46 meters). Within these
cores, different lengths of Tygon® tubing were installed to the bottom of the hole and then run to the top
of the sample, where they were sealed with a quick-drying foam epoxy. The tops of these tubes, like the
large-scale samples, were covered by septa to keep the atmosphere within the tube separate from the mine
atmosphere. At the center of these five locations, a single core was drilled to a depth of three feet. At this
hole, three PPRS were wrapped in coarse dry-wall tape and then placed at the bottom of this hole. The
dry-wall tape was used to provide some air pockets and pore space around the release sources. After the
three PPRS were placed into the core, the remaining space above the sources was backfilled with newly-
mixed seal material to seal these sources within the approximate center of the full-scale samples. Figure
4-7 shows the basic layout of the sample, the release point, and the 10 sampling locations.
Figure 4-7. Layout of the Kentucky full-scale experiment seal
After the curing of the backfilled seal material over the PPRS, sampling took place similar to the
procedures followed for the large-scale samples. Empty vacutainers were used to collect the atmospheric
sample from within the Tygon® tubing. Samples were taken 23 days after the PPRSs were installed and
again, 82 days after the original sealing of the PPRS. Because of the length of Tygon® tubing compared
to the tubing used in the large-scale samples, an aspirator was used to move the “pocket” of air at the
bottom of the tubing and in surrounding material to the intersection of the septa and the sampling needled
to be collected by the vacutainer. A sample was taken from both the three foot and one and a half foot
depths at each of the five sampling locations (A through E) on each sampling day. On the second sample
collection date, a group of three extra vacutainer samplers were collected above the seal itself to look for
trace PMCH in the atmosphere above the seal.

42
4.5 Kentucky full-scale experiment results The GC-MS method developed for the large-scale sample was also used for the samples collected
from Kentucky. The 23 samples were run in triplicate and RSD values were all less than 4.9%. The
results can be seen below in Table 4-4. The reported concentration values in Table 4-4 were attained by
using the peak area counts from the GC-MS and Equation 4-1 from the Virginia experiments.
Table 4-4. Kentucky full-scale sample results (concentrations reported in ppb)
Sampling
Location
Time After Sealing PPRS
23 Days 59 Days
A 1.5 6.75 5.87
A 3 5.42 5.77
B 1.5 7.44 6.79
B 3 3.10 4.51
D 1.5 2.93 13.99
D 3 3.34 21.42
E 1.5 27.84 6.55
E 3 8.07 26.95
F 1.5 2.89 3.59
F 3 -- 10.26
Air
Samples
N/A 1.31
N/A
N/A
1.46
--
It is worth noting that sample locations A and B were situated along the wall of the mine entry at
the mine, and the concentration remained fairly constant between the two sample dates. However, the
sample points D, E, and F (with the exception of one point) show an increase in the concentration
between the two dates. This increase is most likely attributed to the more turbulent flow of air seen in the
center of the entryway. It is also worth noting all three air samples were below 2.0 ppb, and all but one
sample from the full-scale seal was greater than 3.5 ppb. Figure 4-8 shows a three-dimensional
representation of the concentration expected to be found within the portion of the seal tested. The data
used for Figure 4-8 corresponds with the peak area counts, not the concentration derived from Equation 4-
1. (Note: an arbitrary concentration of 5,000 peak area counts was used in the model to be the
concentration at the release point of the PMCH tracer at the center of the seal). It is important to note that
in the full-scale experiments PMCH was seen moving through large distances in a full-scale seal, with not
opportunity for movement along a seal-PVC boundary as seen in the large-scale experiments. It is also
noteworthy that the drilling of the sampling ports could have induced microcracking and enhanced the
permeability of the tracer through the seal material. However, as the model in Figure 4-8 indicates, the
movement of the tracer is fairly consistent and variations are most likely attributed to the ventilation
profile across the airway more so than any microcracking or fractures that formed in the drilling process.
All data from both the large and full scale experiments can be found in Appendix B.

43
Figure 4-8. Model of approximate PMCH concentrations (in peak area counts) found within the full scale seal
(Note: the left side of the model is oriented towards the center of the mine entry)
4.6 Discussion The large-scale experiments were designed to determine multiple factors: if PMCH tracer gas
(approximately 1.5 mg/day) can move through solid seal material of distances similar to those seen in in-
situ underground seals (12 feet), and if the tracer movement is accelerated and/or concentration of the
tracer is higher as it moves through known discontinuities. By the last two sample dates, all four of the
samples had traces of PMCH at 10.5 feet away from the release source. Given enough time, it is possible
that the entire volume of the seal material would become saturated and PMCH would release, fairly
linearly, from the exposed face of the seal material. The second component of the large-scale experiments
indicated a general increase in the concentration of PMCH moving down the length of the faulted samples
for both manufacturers when compared to the control samples. This result indicates that PMCH can be
utilized to demonstrate an increased fracture network or faulting within in-situ mine seals that may
indicate potential integrity issues. The primary concern with the large-scale experiment was that the
observed PMCH may have been traveling along the boundary between the PVC pipe and seal material.
To address that possibility, the second set of experiments — in a full-scale, freestanding seal — were
designed. The results of the second set of experiments show that PMCH can move large distances
(between four and nine feet) in seal material with no boundary interface and minimal pressure differential.
The full-scale experiments also demonstrated that the turbulence of the airflow across the exposed face of
a seal (containing a PMCH release vessel) can potentially affect the direction of flow within the seal. The
air samples from the second full-scale sampling date also support the theory that, given enough time, a
mine seal with a tracer release source within it may eventually reach some equilibrium and begin
releasing fairly constant concentrations into the surrounding atmosphere. In summary, both the large-scale
and full-scale experiments have provided significant data and results confirming the movement of tracers
through well-mixed seal material samples and an increase in that movement can potentially be seen in
faulted or damaged material.
4.7 Acknowledgement This publication was developed under Contract No. 200-2012-52497, awarded by the National
Institute for Occupational Safety and Health (NIOSH). The findings and conclusions in this report are
those of the authors and do not reflect the official policies of the Department of Health and Human
Services; nor does mention of trade names, commercial practices, or organizations imply endorsement by
the US Government.

44
Chapter 5: Technical Note: Use of the Sonic Wave Impact-Echo
Non-Destructive Testing (NDT) Method on Mine Seals in a
Kentucky Underground Limestone Mine
5.1 Background In underground mines, specifically underground coal, as mining progresses through the coal seam
mined-out areas or abandoned areas must be isolated from the working sections of the mine. This practice
minimizes ventilation requirements in active areas of the mine and separates active areas from areas likely
to contain explosive atmospheres. The structures used for this purpose are called seals and are required to
be explosion proof to prevent the propagation of an explosion, if one was to occur in the sealed regions of
the mine, to the working areas. For years, seals were constructed by building two or more barriers,
typically made with cement blocks or timbers that covered the entire cross sectional area of the mine
airway, with five to 10 meters of spacing between the barriers. The space between these barriers was
filled with inert material, and sometimes grouting was placed in the strata around the seal to improve
structural integrity (McPherson, 1993). Currently, one of the most popular seal construction techniques
involves using pumpable cement to fill the area between the two barriers, or filling wooden molds or
flexible bags with the cement. The pumpable cement can be mixed in suitable areas, whether in the main
entries or even from the surface of the mine, and then pumped to the seal site to form a tight seal along
the top, bottom and ribs of the airway (United Stated of America Patent No. US5401120 A, 1993).
Following the Sago and Darby mine disasters of 2006, NIOSH (National Institute for
Occupational Safety and Heath) made formal recommendations to increase the explosive pressure
strength of seals installed in underground coal mines from 20 psig (pound per square inch gauge) to either
50 psig or 120 psig, depending on whether the atmosphere behind the seal is monitored. The
recommendations made by NIOSH were eventually incorporated into Title 30 Code of Federal
Regulations (30 CFR § 75.335-338) as part of the Mine Improvement and New Emergency Response Act
(MINER Act) of 2006. While it is legally required for all manufacturers of seals and seal material to
submit applications to the Mine Safety and Health Administration (MSHA) and pass simulated explosion
testing before becoming approved (Zipf Jr., Sapko, & Brune, 2007), there has yet to be any requirements
for testing the integrity and retained strength of these seals after they are installed. The practice of
examining concrete and concrete-like structures without damaging the structures is known as Non-
Destructive Testing (NDT) or Evaluation (NDE) and is used to examine the internal condition of
structures beneath the exterior surface, even when only a single surface is accessible (Krause, et al.,
1997).
There are many different techniques and methods used to produce information about the physical
properties and condition, of civil structures including sonic/ultrasonic methods, electromagnetic methods,
electronic methods, and radiography methods (McCann & Forde, 2001). This paper will specifically
discuss the use of sonic waves, at low frequencies (<400 Hz), to assess the condition of both large-scale
and full-scale mine seals using an impact-echo method. The impact-echo method involves the use of an
impact-based energy source being applied to the surface of the structure in question and recorded by
velocity or vibrating transducers (or other form of frequency measurement) (Davis & Dunn, 1974). The
resulting signal then goes through either a Fourier transform or frequency response function to generate a
frequency range that can be used to observe resonant frequencies of flaws in the structure. The general
design of the NDT equipment and example frequency spectrums can be seen below in Figure 5-1
(McCann & Forde, 2001).
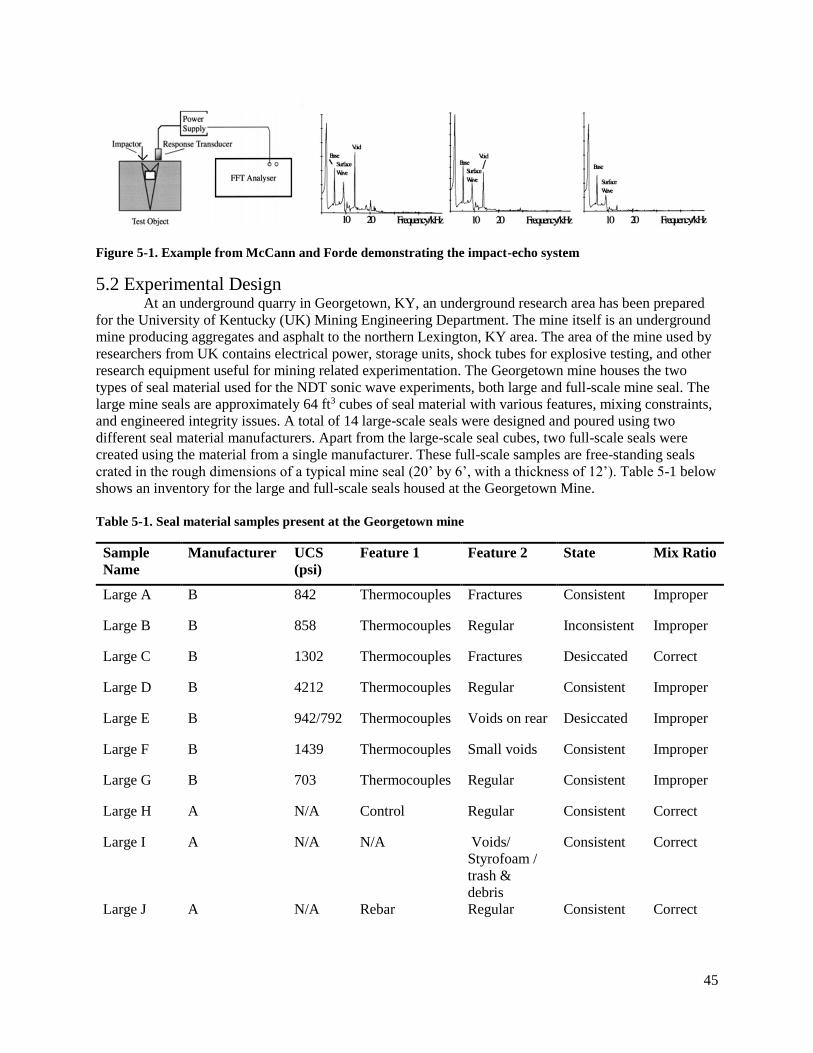
45
Figure 5-1. Example from McCann and Forde demonstrating the impact-echo system
5.2 Experimental Design At an underground quarry in Georgetown, KY, an underground research area has been prepared
for the University of Kentucky (UK) Mining Engineering Department. The mine itself is an underground
mine producing aggregates and asphalt to the northern Lexington, KY area. The area of the mine used by
researchers from UK contains electrical power, storage units, shock tubes for explosive testing, and other
research equipment useful for mining related experimentation. The Georgetown mine houses the two
types of seal material used for the NDT sonic wave experiments, both large and full-scale mine seal. The
large mine seals are approximately 64 ft3 cubes of seal material with various features, mixing constraints,
and engineered integrity issues. A total of 14 large-scale seals were designed and poured using two
different seal material manufacturers. Apart from the large-scale seal cubes, two full-scale seals were
created using the material from a single manufacturer. These full-scale samples are free-standing seals
crated in the rough dimensions of a typical mine seal (20’ by 6’, with a thickness of 12’). Table 5-1 below
shows an inventory for the large and full-scale seals housed at the Georgetown Mine.
Table 5-1. Seal material samples present at the Georgetown mine
Sample
Name
Manufacturer UCS
(psi)
Feature 1
Feature 2
State Mix Ratio
Large A B 842 Thermocouples Fractures Consistent Improper
Large B B 858 Thermocouples Regular Inconsistent Improper
Large C B 1302 Thermocouples Fractures Desiccated Correct
Large D B 4212 Thermocouples Regular Consistent Improper
Large E B 942/792 Thermocouples Voids on rear Desiccated Improper
Large F B 1439 Thermocouples Small voids Consistent Improper
Large G B 703 Thermocouples Regular Consistent Improper
Large H A N/A Control Regular Consistent Correct
Large I A N/A N/A Voids/
Styrofoam /
trash &
debris
Consistent Correct
Large J A N/A Rebar Regular Consistent Correct
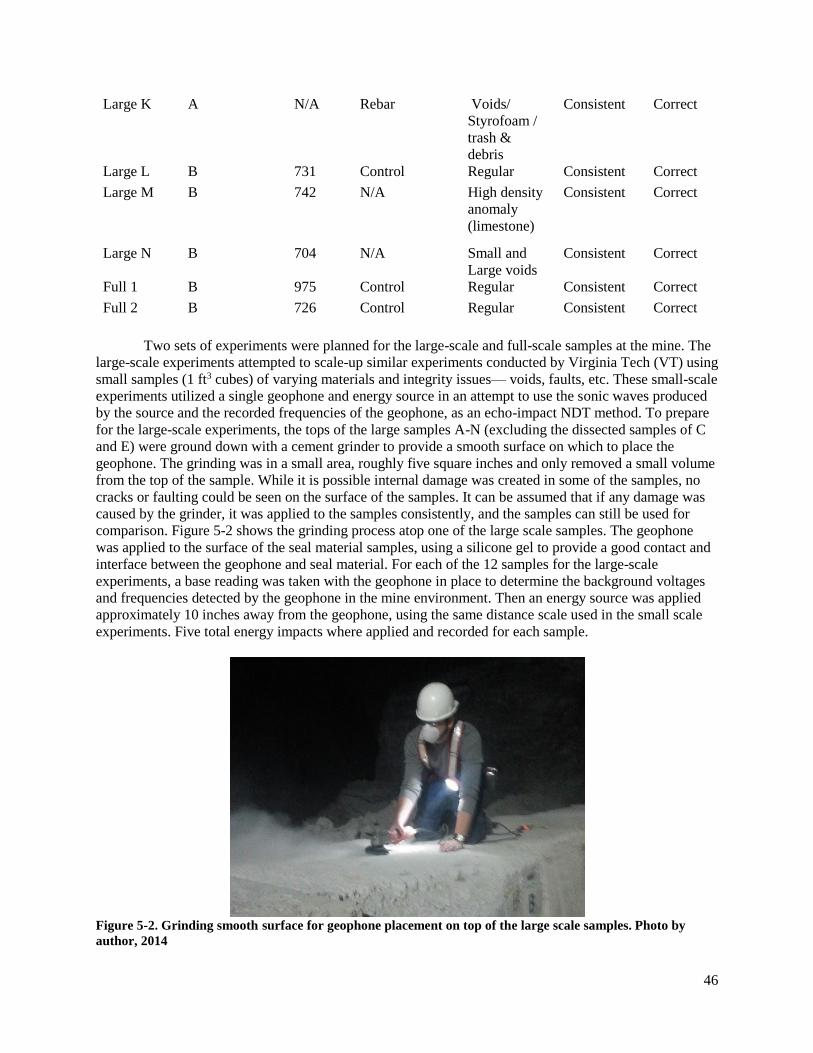
46
Large K A N/A Rebar Voids/
Styrofoam /
trash &
debris
Consistent Correct
Large L B 731 Control Regular Consistent Correct
Large M B 742 N/A High density
anomaly
(limestone)
Consistent Correct
Large N B 704 N/A Small and
Large voids
Consistent Correct
Full 1 B 975 Control Regular Consistent Correct
Full 2 B 726 Control Regular Consistent Correct
Two sets of experiments were planned for the large-scale and full-scale samples at the mine. The
large-scale experiments attempted to scale-up similar experiments conducted by Virginia Tech (VT) using
small samples (1 ft3 cubes) of varying materials and integrity issues— voids, faults, etc. These small-scale
experiments utilized a single geophone and energy source in an attempt to use the sonic waves produced
by the source and the recorded frequencies of the geophone, as an echo-impact NDT method. To prepare
for the large-scale experiments, the tops of the large samples A-N (excluding the dissected samples of C
and E) were ground down with a cement grinder to provide a smooth surface on which to place the
geophone. The grinding was in a small area, roughly five square inches and only removed a small volume
from the top of the sample. While it is possible internal damage was created in some of the samples, no
cracks or faulting could be seen on the surface of the samples. It can be assumed that if any damage was
caused by the grinder, it was applied to the samples consistently, and the samples can still be used for
comparison. Figure 5-2 shows the grinding process atop one of the large scale samples. The geophone
was applied to the surface of the seal material samples, using a silicone gel to provide a good contact and
interface between the geophone and seal material. For each of the 12 samples for the large-scale
experiments, a base reading was taken with the geophone in place to determine the background voltages
and frequencies detected by the geophone in the mine environment. Then an energy source was applied
approximately 10 inches away from the geophone, using the same distance scale used in the small scale
experiments. Five total energy impacts where applied and recorded for each sample.
Figure 5-2. Grinding smooth surface for geophone placement on top of the large scale samples. Photo by
author, 2014

47
The full scale experimentation conducted in the Georgetown mine involved only one of the full-
scale samples (Full 1). The goal of the full-scale experiment was to determine the ideal distance for which
the geophone and energy source should be placed from one another. To do this, the geophone was placed
on one of the vertical sides of the seal, approximately three feet from the edge. This provided
approximately 17 feet on the other side of the geophone to provide the energy source at every 1.5 foot
interval. First, the background voltage and frequencies from the geophone were recorded to get a baseline.
Then, starting at 1.5 feet away from the geophone, an energy source was applied, and the response was
recorded by the geophone. This process was repeated three times at each location, ranging from 1.5 feet
from the geophone to 15 feet away. A total of 10 locations were collected to compare to one another and
to the background baseline collected earlier. Figure 5-3 shows researched participating in the full-scale
experiments.
Figure 5-3. Researchers from VT and UK holding the geophone in place and applying the energy source on
the full scale seal. Photo by author, 2014
5.3 Large Scale Results The large-scale experiments were divided into groups based on the seal material manufacturer.
The five frequency ranges collected at each sample were then averaged and graphed to see if samples
with different integrity issues can be distinguished from control samples by reviewing the frequency
ranges. First, looking at the correctly mixed Manufacturer B material, samples L, M, and N were
compared. The resulting comparison can be seen in Figure 5-4. It can be determined that with the correct
mixes, the sample containing large void spaces (deflated dodgeballs) can be distinguished from the other
two samples with a high peak around 50 Hz, most likely due to the movement of the energy through air
pockets in the void spaces. Secondly, sample L was compared with two regular, improperly mixed
samples with different USC psi values of 4212 and 703 for samples D and G, respectively. This
comparison can be seen in Figure 5-5. Even with the difference in USC values, the shape of the improper
mixes was nearly identical to the correct mix, although the amplitude of the frequency range was smaller.
The final Manufacturer B comparison looked at potential differences between fractures in sample A, an
inconsistent but regular seal in sample B, and sample F, which contained some small voids. Figure 5-6
shows the frequency range of these samples, and it is noticeable that the fractured sample behaved very
similarly to the background noise, and produced no distinguishable peaks, while the small voids and
regular, improperly mixed sample are fairly similar. Out of the Manufacturer B comparison, only the
large voided sample that was correctly mix was noticeably different when compared to other samples.
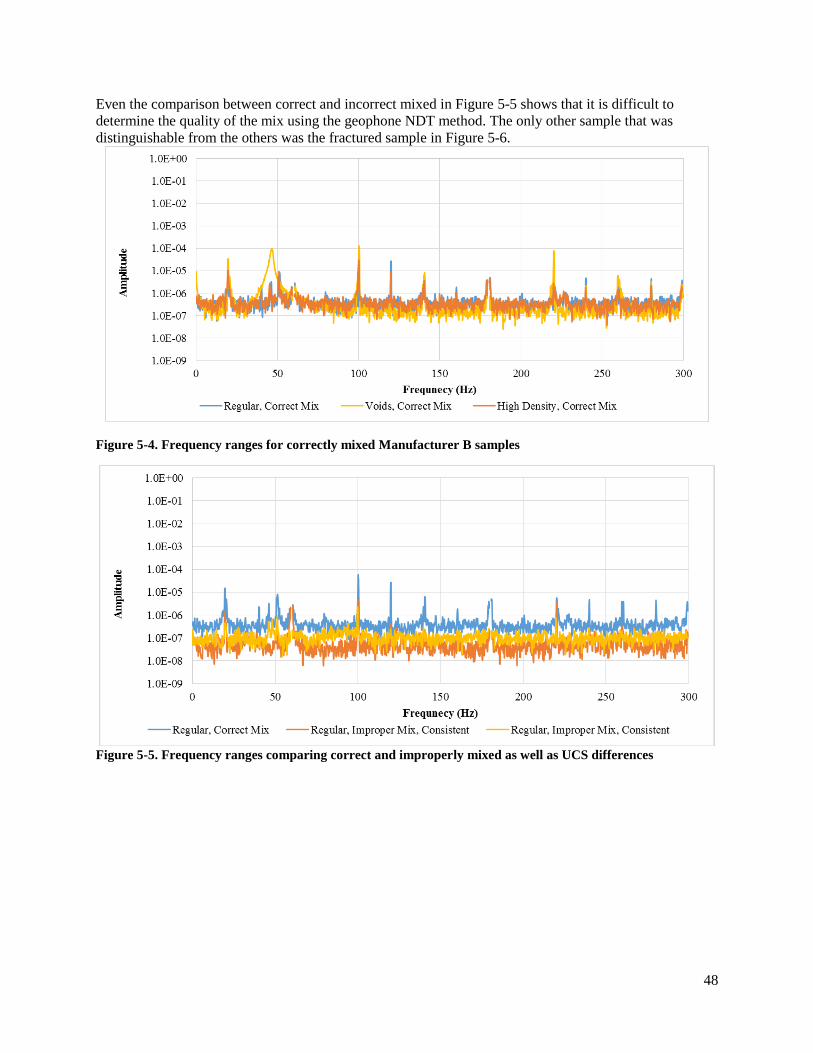
48
Even the comparison between correct and incorrect mixed in Figure 5-5 shows that it is difficult to
determine the quality of the mix using the geophone NDT method. The only other sample that was
distinguishable from the others was the fractured sample in Figure 5-6.
Figure 5-4. Frequency ranges for correctly mixed Manufacturer B samples
Figure 5-5. Frequency ranges comparing correct and improperly mixed as well as UCS differences
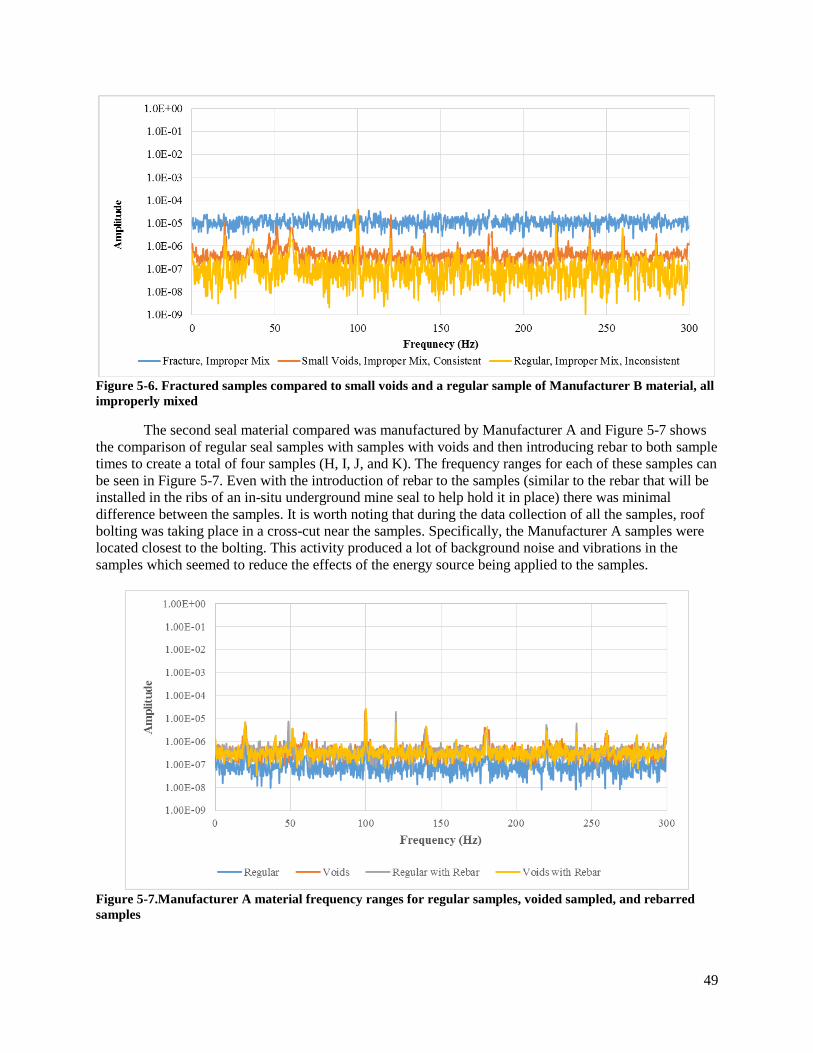
49
Figure 5-6. Fractured samples compared to small voids and a regular sample of Manufacturer B material, all
improperly mixed
The second seal material compared was manufactured by Manufacturer A and Figure 5-7 shows
the comparison of regular seal samples with samples with voids and then introducing rebar to both sample
times to create a total of four samples (H, I, J, and K). The frequency ranges for each of these samples can
be seen in Figure 5-7. Even with the introduction of rebar to the samples (similar to the rebar that will be
installed in the ribs of an in-situ underground mine seal to help hold it in place) there was minimal
difference between the samples. It is worth noting that during the data collection of all the samples, roof
bolting was taking place in a cross-cut near the samples. Specifically, the Manufacturer A samples were
located closest to the bolting. This activity produced a lot of background noise and vibrations in the
samples which seemed to reduce the effects of the energy source being applied to the samples.
Figure 5-7.Manufacturer A material frequency ranges for regular samples, voided sampled, and rebarred
samples

50
5.4 Full Scale Results The full-scale experiment collected three sets of frequency ranges for each distance interval. The
average of these ranges at each interval was then graphed to determine how the energy source and
geophone response is affected by the distance between the two in a seal with a thickness of 12 feet. Each
frequency range recorded by the geophones was averaged, and the resulting average frequency was used
to represent the response for each energy source and each of the 10 locations. The average frequency was
graphed between 0 and 500 Hz for each of the 10 distances. Figure 5-8 shows these average frequencies
for distances of 1.5, 3, 4.5, 6, and 7.5 feet, while Figure 5-9 shows the remaining distances (9, 10.5, 12,
13.5, and 15 feet). While Figures 5-8 and -9 show the frequency range of interest for the full scale
experiment, it also necessary to comment on the variance of amplitudes at different distances. This is
most likely due to frequency changes through the seal material as the distance between the energy source
and geophone increases, and the random nature occurred by having to hold the geophone in-place by
hand. To simulate a single available face for seals found in functioning mines, the geophone was held
along the vertical face. To reduce some of the error found in the full-scale experiments it may become
necessary to develop a device to hold the geophone in place without drilling into or anchoring it into the
seal face. Another option might be to install a geophone in the face of the seal during construction and
allow curing to occur and hold the geophone in place.
Figure 5-8. Frequency ranges for the full scale sample showing distances of 1.5 to 7.5 feet

51
Figure 5-9. Frequency ranges for the full scale sample showing distances of 9 to 15 feet
In addition to Figures 5-8 and 5-9, the sum of the amplitudes for each distance’s frequency range
was graphed against the distance. It was expected that at the distance increased, the sum of the amplitudes
would decrease. This expectation was due to the commonly observed nature of elastic energy versus
distance behaving in a logarithmic nature, similar to the Richter scale (Boore, 1988). The resulting
amplitude versus distance curve can be seen in Figure 10. Also graphed is the expected (general shape,
not actual values) shape of the curve. While the expected amplitude of the energy source was expected to
decrease significantly as the experiment progressed and the distance between the source and geophone
increased, the experiment resulted in a fairly consistent energy distribution. While this is not expected, it
can potentially indicate that the distance between the geophone and energy source is fairly independent,
and a fairly reliable frequency range created at any location along the seal’s face.
Figure 5-10. Expected and observed response curves of the amplitude of the frequency ranges versus the
distance between the geophone and energy source

52
5.5 Discussion Both the full-scale and large-experiments conducted at the Georgetown mine fell short of some of
the expected results based on previous small-scale experiments led by researchers at Virginia Tech. Some
of the short-comings that occurred could have been related to the roof bolting and maintenance
procedures around the samples during the day data collection occurred. This background noise made it
difficult for the energy source to provide a unique and distinguishable presence in the frequency response
range. For some of the samples, eight of the 12 total samples, the correlation between the background
reading originally taken with no induced energy source and the average frequency range for the sample
was great than 0.95, indicating nearly identical shapes in the frequency ranges, making distinguishing
features difficult to identify. Specifically, of the Manufacturer A samples, all four samples corresponded
to the background frequency with correlation values greater than 0.85. It is believed that the noise
commonly associated with mine activity was responsible for some of these high correlation values and
some of the inconclusive findings. This interference is likely to occur at nearly every underground mine
making the single sonic wave NDT method difficult to use outside of laboratory conditions experienced
by the small-scale samples. The full-scale experiment did show that if the energy traveling through the
full-scale seal seemed be independent of the distance between the energy source and the geophone. It is
also worth considering expanding the observed frequency range of the geophone to look at frequencies
higher than 400 Hz. If resolution can be reached where frequency ranges can be used to distinguish
differences between different seal material types and conditions the distance between the energy source
and geophone will have little effect. Overall, the large-scale experiments did not reproduce some of the
results seen in smaller samples in laboratory settings, but the full-scale experiment did show that a
constant and large amount of energy can be applied to full-scale mine seals and measured by a single
geophone.
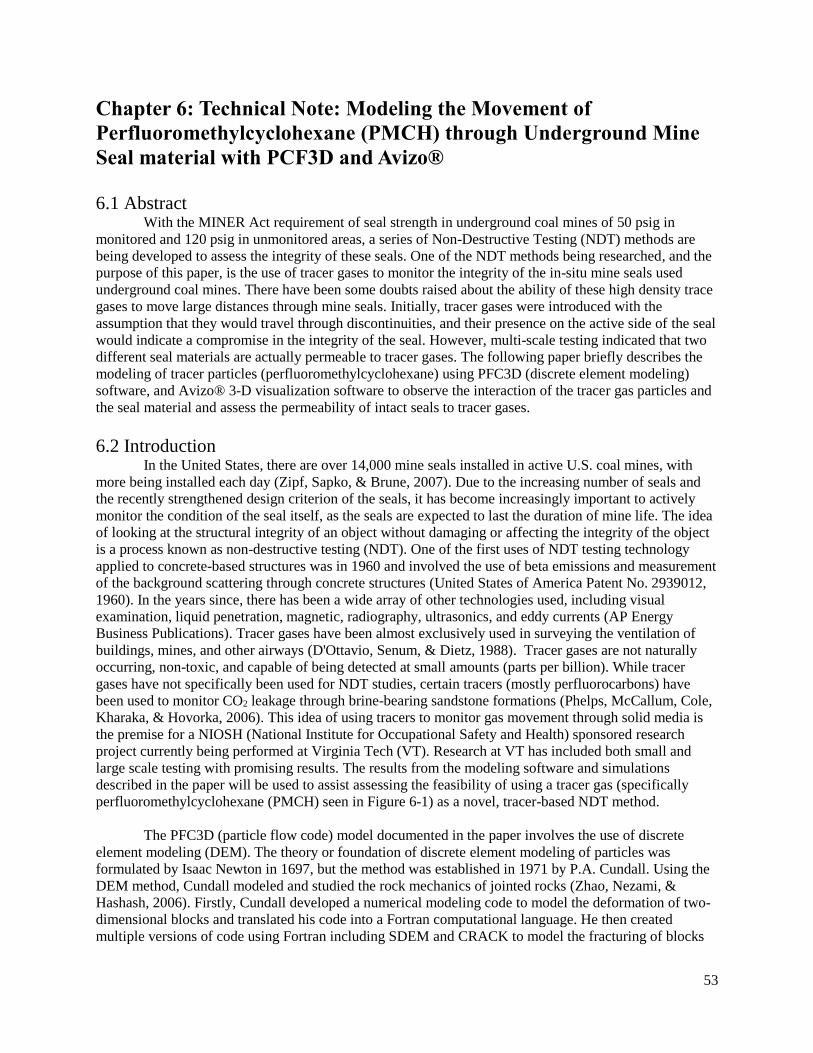
53
Chapter 6: Technical Note: Modeling the Movement of
Perfluoromethylcyclohexane (PMCH) through Underground Mine
Seal material with PCF3D and Avizo®
6.1 Abstract With the MINER Act requirement of seal strength in underground coal mines of 50 psig in
monitored and 120 psig in unmonitored areas, a series of Non-Destructive Testing (NDT) methods are
being developed to assess the integrity of these seals. One of the NDT methods being researched, and the
purpose of this paper, is the use of tracer gases to monitor the integrity of the in-situ mine seals used
underground coal mines. There have been some doubts raised about the ability of these high density trace
gases to move large distances through mine seals. Initially, tracer gases were introduced with the
assumption that they would travel through discontinuities, and their presence on the active side of the seal
would indicate a compromise in the integrity of the seal. However, multi-scale testing indicated that two
different seal materials are actually permeable to tracer gases. The following paper briefly describes the
modeling of tracer particles (perfluoromethylcyclohexane) using PFC3D (discrete element modeling)
software, and Avizo® 3-D visualization software to observe the interaction of the tracer gas particles and
the seal material and assess the permeability of intact seals to tracer gases.
6.2 Introduction In the United States, there are over 14,000 mine seals installed in active U.S. coal mines, with
more being installed each day (Zipf, Sapko, & Brune, 2007). Due to the increasing number of seals and
the recently strengthened design criterion of the seals, it has become increasingly important to actively
monitor the condition of the seal itself, as the seals are expected to last the duration of mine life. The idea
of looking at the structural integrity of an object without damaging or affecting the integrity of the object
is a process known as non-destructive testing (NDT). One of the first uses of NDT testing technology
applied to concrete-based structures was in 1960 and involved the use of beta emissions and measurement
of the background scattering through concrete structures (United States of America Patent No. 2939012,
1960). In the years since, there has been a wide array of other technologies used, including visual
examination, liquid penetration, magnetic, radiography, ultrasonics, and eddy currents (AP Energy
Business Publications). Tracer gases have been almost exclusively used in surveying the ventilation of
buildings, mines, and other airways (D'Ottavio, Senum, & Dietz, 1988). Tracer gases are not naturally
occurring, non-toxic, and capable of being detected at small amounts (parts per billion). While tracer
gases have not specifically been used for NDT studies, certain tracers (mostly perfluorocarbons) have
been used to monitor CO2 leakage through brine-bearing sandstone formations (Phelps, McCallum, Cole,
Kharaka, & Hovorka, 2006). This idea of using tracers to monitor gas movement through solid media is
the premise for a NIOSH (National Institute for Occupational Safety and Health) sponsored research
project currently being performed at Virginia Tech (VT). Research at VT has included both small and
large scale testing with promising results. The results from the modeling software and simulations
described in the paper will be used to assist assessing the feasibility of using a tracer gas (specifically
perfluoromethylcyclohexane (PMCH) seen in Figure 6-1) as a novel, tracer-based NDT method.
The PFC3D (particle flow code) model documented in the paper involves the use of discrete
element modeling (DEM). The theory or foundation of discrete element modeling of particles was
formulated by Isaac Newton in 1697, but the method was established in 1971 by P.A. Cundall. Using the
DEM method, Cundall modeled and studied the rock mechanics of jointed rocks (Zhao, Nezami, &
Hashash, 2006). Firstly, Cundall developed a numerical modeling code to model the deformation of two-
dimensional blocks and translated his code into a Fortran computational language. He then created
multiple versions of code using Fortran including SDEM and CRACK to model the fracturing of blocks
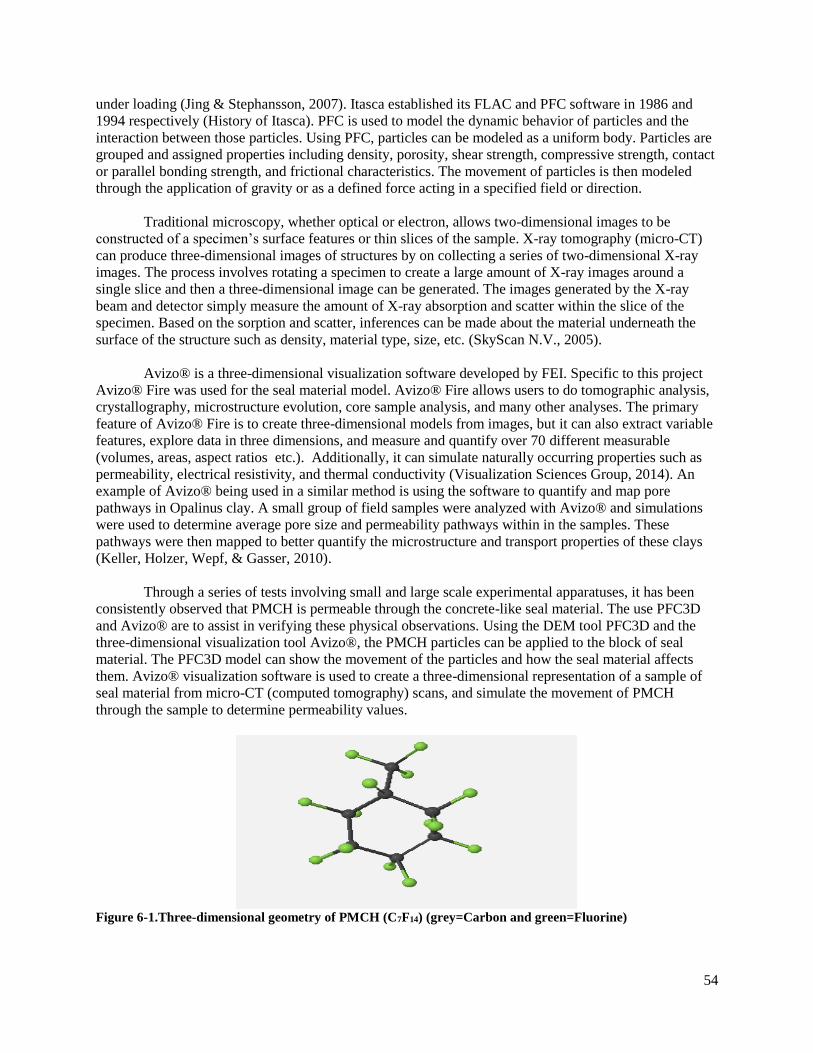
54
under loading (Jing & Stephansson, 2007). Itasca established its FLAC and PFC software in 1986 and
1994 respectively (History of Itasca). PFC is used to model the dynamic behavior of particles and the
interaction between those particles. Using PFC, particles can be modeled as a uniform body. Particles are
grouped and assigned properties including density, porosity, shear strength, compressive strength, contact
or parallel bonding strength, and frictional characteristics. The movement of particles is then modeled
through the application of gravity or as a defined force acting in a specified field or direction.
Traditional microscopy, whether optical or electron, allows two-dimensional images to be
constructed of a specimen’s surface features or thin slices of the sample. X-ray tomography (micro-CT)
can produce three-dimensional images of structures by on collecting a series of two-dimensional X-ray
images. The process involves rotating a specimen to create a large amount of X-ray images around a
single slice and then a three-dimensional image can be generated. The images generated by the X-ray
beam and detector simply measure the amount of X-ray absorption and scatter within the slice of the
specimen. Based on the sorption and scatter, inferences can be made about the material underneath the
surface of the structure such as density, material type, size, etc. (SkyScan N.V., 2005).
Avizo® is a three-dimensional visualization software developed by FEI. Specific to this project
Avizo® Fire was used for the seal material model. Avizo® Fire allows users to do tomographic analysis,
crystallography, microstructure evolution, core sample analysis, and many other analyses. The primary
feature of Avizo® Fire is to create three-dimensional models from images, but it can also extract variable
features, explore data in three dimensions, and measure and quantify over 70 different measurable
(volumes, areas, aspect ratios etc.). Additionally, it can simulate naturally occurring properties such as
permeability, electrical resistivity, and thermal conductivity (Visualization Sciences Group, 2014). An
example of Avizo® being used in a similar method is using the software to quantify and map pore
pathways in Opalinus clay. A small group of field samples were analyzed with Avizo® and simulations
were used to determine average pore size and permeability pathways within in the samples. These
pathways were then mapped to better quantify the microstructure and transport properties of these clays
(Keller, Holzer, Wepf, & Gasser, 2010).
Through a series of tests involving small and large scale experimental apparatuses, it has been
consistently observed that PMCH is permeable through the concrete-like seal material. The use PFC3D
and Avizo® are to assist in verifying these physical observations. Using the DEM tool PFC3D and the
three-dimensional visualization tool Avizo®, the PMCH particles can be applied to the block of seal
material. The PFC3D model can show the movement of the particles and how the seal material affects
them. Avizo® visualization software is used to create a three-dimensional representation of a sample of
seal material from micro-CT (computed tomography) scans, and simulate the movement of PMCH
through the sample to determine permeability values.
Figure 6-1.Three-dimensional geometry of PMCH (C7F14) (grey=Carbon and green=Fluorine)
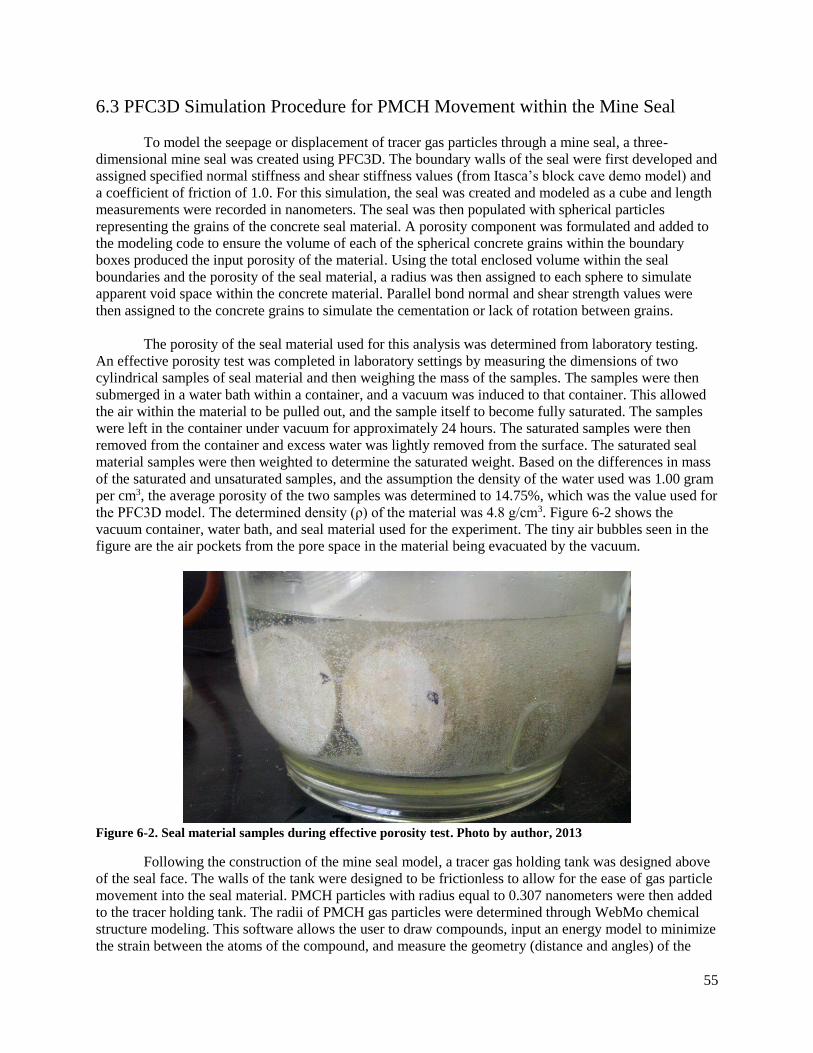
55
6.3 PFC3D Simulation Procedure for PMCH Movement within the Mine Seal
To model the seepage or displacement of tracer gas particles through a mine seal, a three-
dimensional mine seal was created using PFC3D. The boundary walls of the seal were first developed and
assigned specified normal stiffness and shear stiffness values (from Itasca’s block cave demo model) and
a coefficient of friction of 1.0. For this simulation, the seal was created and modeled as a cube and length
measurements were recorded in nanometers. The seal was then populated with spherical particles
representing the grains of the concrete seal material. A porosity component was formulated and added to
the modeling code to ensure the volume of each of the spherical concrete grains within the boundary
boxes produced the input porosity of the material. Using the total enclosed volume within the seal
boundaries and the porosity of the seal material, a radius was then assigned to each sphere to simulate
apparent void space within the concrete material. Parallel bond normal and shear strength values were
then assigned to the concrete grains to simulate the cementation or lack of rotation between grains.
The porosity of the seal material used for this analysis was determined from laboratory testing.
An effective porosity test was completed in laboratory settings by measuring the dimensions of two
cylindrical samples of seal material and then weighing the mass of the samples. The samples were then
submerged in a water bath within a container, and a vacuum was induced to that container. This allowed
the air within the material to be pulled out, and the sample itself to become fully saturated. The samples
were left in the container under vacuum for approximately 24 hours. The saturated samples were then
removed from the container and excess water was lightly removed from the surface. The saturated seal
material samples were then weighted to determine the saturated weight. Based on the differences in mass
of the saturated and unsaturated samples, and the assumption the density of the water used was 1.00 gram
per cm3, the average porosity of the two samples was determined to 14.75%, which was the value used for
the PFC3D model. The determined density (ρ) of the material was 4.8 g/cm3. Figure 6-2 shows the
vacuum container, water bath, and seal material used for the experiment. The tiny air bubbles seen in the
figure are the air pockets from the pore space in the material being evacuated by the vacuum.
Figure 6-2. Seal material samples during effective porosity test. Photo by author, 2013
Following the construction of the mine seal model, a tracer gas holding tank was designed above
of the seal face. The walls of the tank were designed to be frictionless to allow for the ease of gas particle
movement into the seal material. PMCH particles with radius equal to 0.307 nanometers were then added
to the tracer holding tank. The radii of PMCH gas particles were determined through WebMo chemical
structure modeling. This software allows the user to draw compounds, input an energy model to minimize
the strain between the atoms of the compound, and measure the geometry (distance and angles) of the
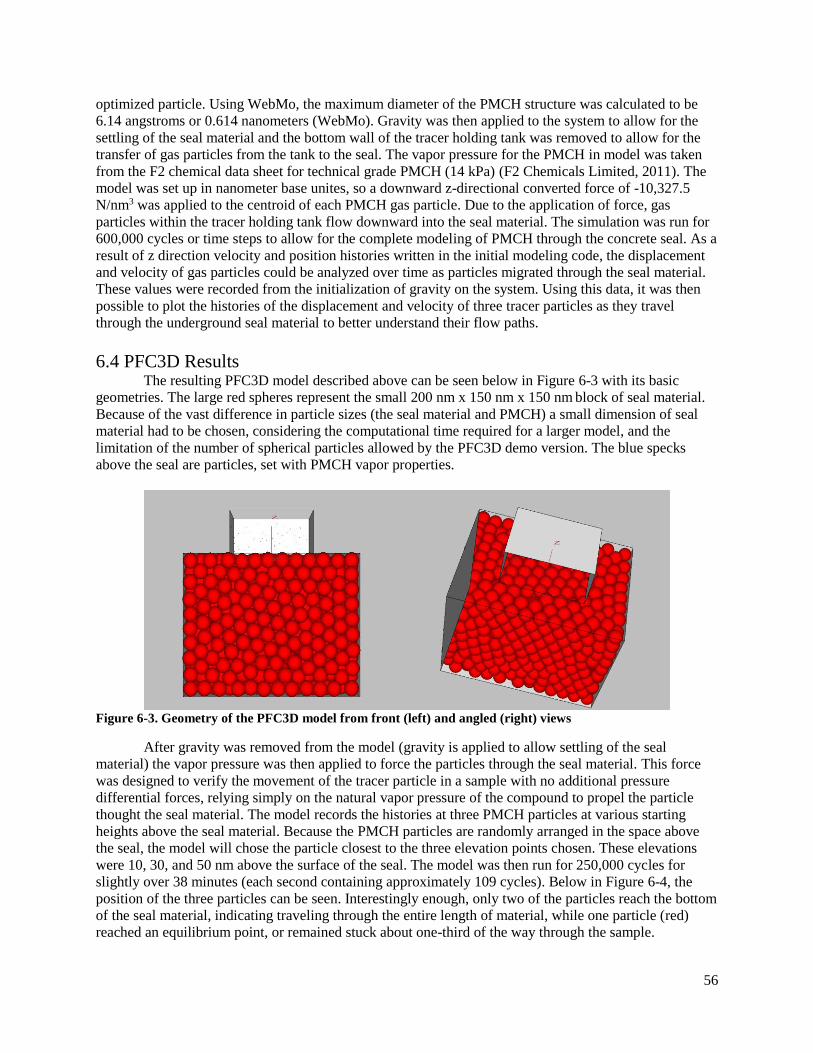
56
optimized particle. Using WebMo, the maximum diameter of the PMCH structure was calculated to be
6.14 angstroms or 0.614 nanometers (WebMo). Gravity was then applied to the system to allow for the
settling of the seal material and the bottom wall of the tracer holding tank was removed to allow for the
transfer of gas particles from the tank to the seal. The vapor pressure for the PMCH in model was taken
from the F2 chemical data sheet for technical grade PMCH (14 kPa) (F2 Chemicals Limited, 2011). The
model was set up in nanometer base unites, so a downward z-directional converted force of -10,327.5
N/nm3 was applied to the centroid of each PMCH gas particle. Due to the application of force, gas
particles within the tracer holding tank flow downward into the seal material. The simulation was run for
600,000 cycles or time steps to allow for the complete modeling of PMCH through the concrete seal. As a
result of z direction velocity and position histories written in the initial modeling code, the displacement
and velocity of gas particles could be analyzed over time as particles migrated through the seal material.
These values were recorded from the initialization of gravity on the system. Using this data, it was then
possible to plot the histories of the displacement and velocity of three tracer particles as they travel
through the underground seal material to better understand their flow paths.
6.4 PFC3D Results The resulting PFC3D model described above can be seen below in Figure 6-3 with its basic
geometries. The large red spheres represent the small 200 nm x 150 nm x 150 nm block of seal material.
Because of the vast difference in particle sizes (the seal material and PMCH) a small dimension of seal
material had to be chosen, considering the computational time required for a larger model, and the
limitation of the number of spherical particles allowed by the PFC3D demo version. The blue specks
above the seal are particles, set with PMCH vapor properties.
Figure 6-3. Geometry of the PFC3D model from front (left) and angled (right) views
After gravity was removed from the model (gravity is applied to allow settling of the seal
material) the vapor pressure was then applied to force the particles through the seal material. This force
was designed to verify the movement of the tracer particle in a sample with no additional pressure
differential forces, relying simply on the natural vapor pressure of the compound to propel the particle
thought the seal material. The model records the histories at three PMCH particles at various starting
heights above the seal material. Because the PMCH particles are randomly arranged in the space above
the seal, the model will chose the particle closest to the three elevation points chosen. These elevations
were 10, 30, and 50 nm above the surface of the seal. The model was then run for 250,000 cycles for
slightly over 38 minutes (each second containing approximately 109 cycles). Below in Figure 6-4, the
position of the three particles can be seen. Interestingly enough, only two of the particles reach the bottom
of the seal material, indicating traveling through the entire length of material, while one particle (red)
reached an equilibrium point, or remained stuck about one-third of the way through the sample.
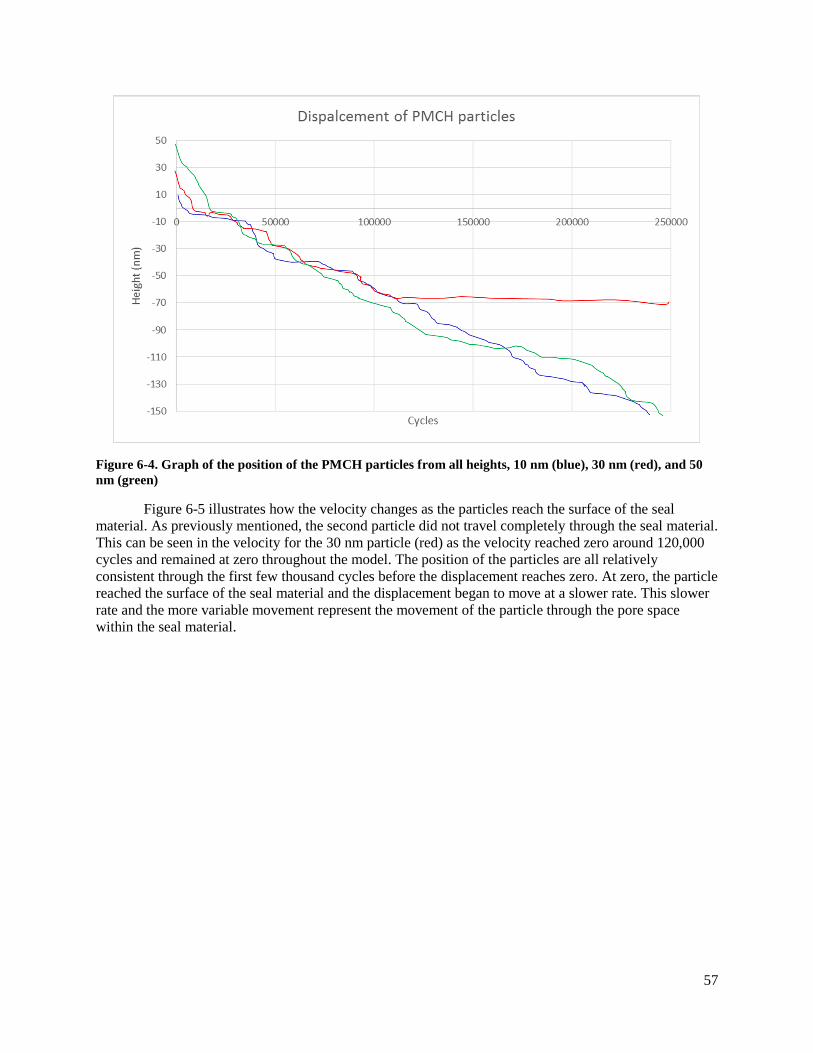
57
Figure 6-4. Graph of the position of the PMCH particles from all heights, 10 nm (blue), 30 nm (red), and 50
nm (green)
Figure 6-5 illustrates how the velocity changes as the particles reach the surface of the seal
material. As previously mentioned, the second particle did not travel completely through the seal material.
This can be seen in the velocity for the 30 nm particle (red) as the velocity reached zero around 120,000
cycles and remained at zero throughout the model. The position of the particles are all relatively
consistent through the first few thousand cycles before the displacement reaches zero. At zero, the particle
reached the surface of the seal material and the displacement began to move at a slower rate. This slower
rate and the more variable movement represent the movement of the particle through the pore space
within the seal material.

58
Figure 6-5. Graph of the velocity of the PMCH particles from all heights above the surface of the seal
material, 10 nm (blue), 30 nm (red), and 50 nm (green)
Looking at the velocities in Figure 6-5, the maximum absolute velocity occurs prior to the particle
reaching the surface of the seal material. Specifically when looking at the sample particle that travels
from the 50 nm point (green in Figures 6-4 and 6-5) and travels through the material, the movement of the
particle is drastically impeded by the seal material. This can be seen in detail below in Figure 6-6. Figure
6-6 also shows the raw PFC3D histories.
Figure 6-6. Detailed movement of a PMCH particle through the seal material
6.5 Avizo® Simulation Procedure for PMCH Movement within the Mine Seal In order to supply the Avizo® 3-D Visualization software with the model needed to simulate and
measure the permeability of PMCH through the seal material, it was necessary to conduct a Micro-CT, or
x-ray microtomography, scan of some of the seal material. A small (approximately 0.9 cubic inches)
amount of seal material sample was mixed and then placed in a plastic test tube vial to allow curing to
take place. After a week of curing, the plastic around the sample was broken, and the seal material sample
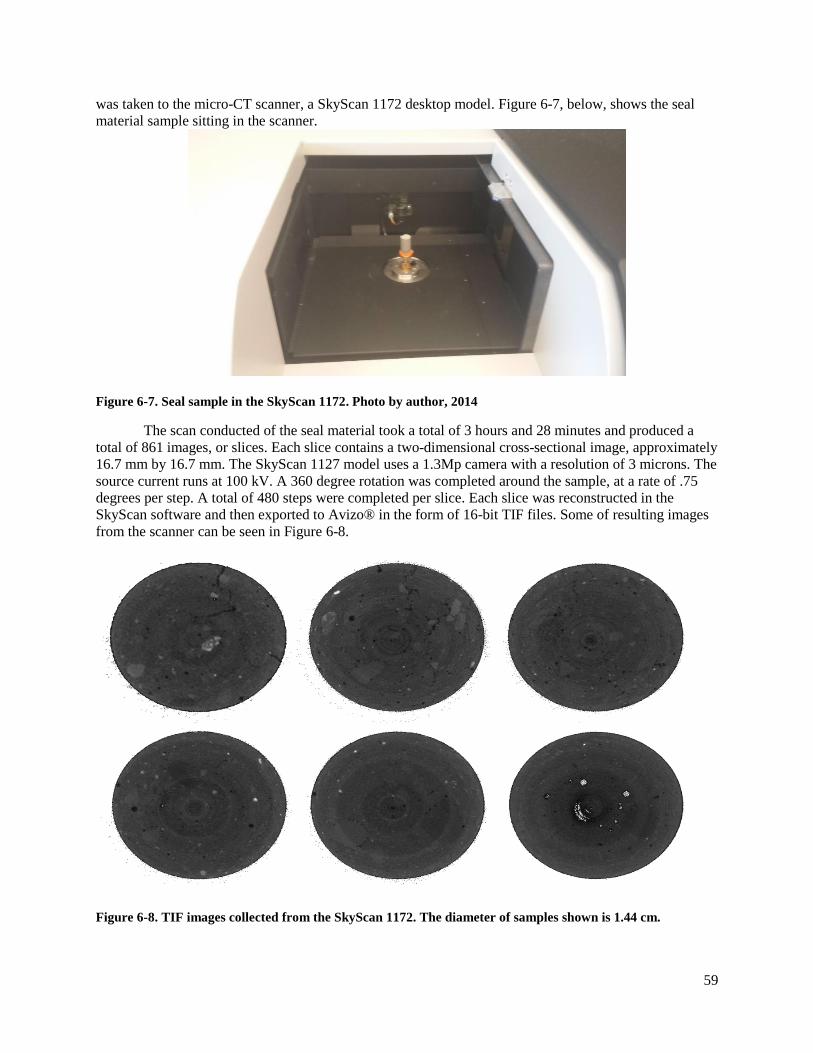
59
was taken to the micro-CT scanner, a SkyScan 1172 desktop model. Figure 6-7, below, shows the seal
material sample sitting in the scanner.
Figure 6-7. Seal sample in the SkyScan 1172. Photo by author, 2014
The scan conducted of the seal material took a total of 3 hours and 28 minutes and produced a
total of 861 images, or slices. Each slice contains a two-dimensional cross-sectional image, approximately
16.7 mm by 16.7 mm. The SkyScan 1127 model uses a 1.3Mp camera with a resolution of 3 microns. The
source current runs at 100 kV. A 360 degree rotation was completed around the sample, at a rate of .75
degrees per step. A total of 480 steps were completed per slice. Each slice was reconstructed in the
SkyScan software and then exported to Avizo® in the form of 16-bit TIF files. Some of resulting images
from the scanner can be seen in Figure 6-8.
Figure 6-8. TIF images collected from the SkyScan 1172. The diameter of samples shown is 1.44 cm.

60
The resulting image files were then imported into the Avizo® software and used to create a three-
dimensional model representing the seal material. The 861 16-bit TIF files were imported into the
Avizo® software, and from there a three-dimensional model was constructed (Figure 6-9). To test for
permeability, a few filters had to be applied to the model. Firstly, a median filter was used to delineate the
boundary conditions for the model. The Avizo® “Despeckle” command was then used to remove some of
the naturally occurring and artificially created randomness from the pixels. Based on the color of the
pixels located throughout the model, different material was labeled or assigned to the pixels. The three
major materials labeled in the model were — air or pore space, solid material, and high-density (lighter)
material. Then the pore network could be rendered and a skeleton network could be created. The
permeability test run in Avizo® was then applied, where the inputs are the inlet and outlet pressure, the
density, and viscosity of the fluid (it is assumed tracer gas behaves as a liquid in the model).
Figure 6-9. Avizo® model constructed from micro-CT image files. http://www.vsg3d.com/avizo/fire. Used
under Fair Use, 2014
6.6 Avizo® Results The simple Avizo® model was used to determine if permeability would be possible between the
PMCH tracer and the seal material. Unlike the PFC3D model, the Avizo® model used solid elements to
simulate the seal, rather than particles. Avizo® created a sub sample from the Micro-CT scan files, and
tested for permeability, assuming the sample and PMCH are isothermal, the sample has a singular
porosity and permeability, and flow occurs under the governance of Dary’s Law. Also, the PMCH
through the Avizo® model will be based on kinematic viscosity rather than vapor pressure as a force and
particle size. Instead, the Avizo® model uses the vapor pressure as a pressure differential between the
pressures applied to both the inlet and outlet side of the seal sample. The other four side of the Avizo®
seal model are bounded by walls that provide no pressure, but are impermeable to flow. A vapor density
(0.0543 lb/ft3 at Standard Pressure and Temperature) and kinematic viscosity (0.873 mm2/s) was found
from a chemical data sheet for technical grade PMCH (F2 Chemicals Limited, 2011). The resulting
permeability values from the simulation can be seen below in Table 6-1. Figure 6-10, shows some of the
permeability simulation generated by the Avizo® software.
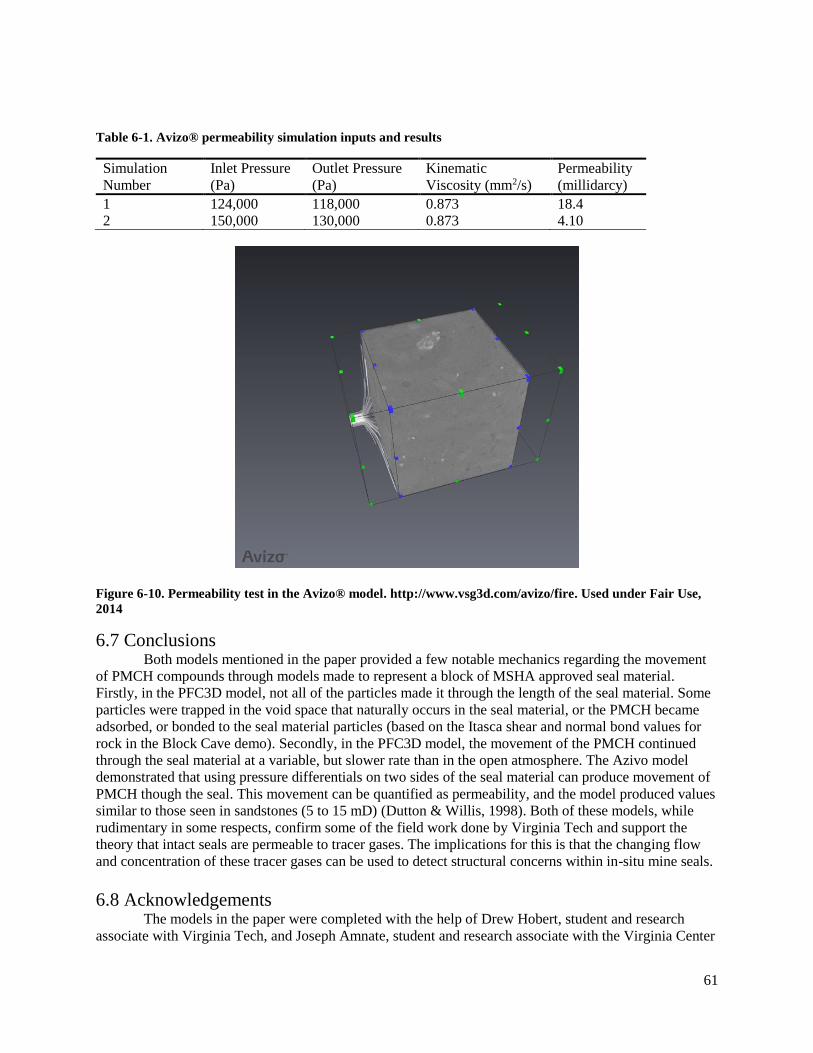
61
Table 6-1. Avizo® permeability simulation inputs and results
Simulation
Number
Inlet Pressure
(Pa)
Outlet Pressure
(Pa)
Kinematic
Viscosity (mm2/s)
Permeability
(millidarcy)
1 124,000 118,000 0.873 18.4
2 150,000 130,000 0.873 4.10
Figure 6-10. Permeability test in the Avizo® model. http://www.vsg3d.com/avizo/fire. Used under Fair Use,
2014
6.7 Conclusions Both models mentioned in the paper provided a few notable mechanics regarding the movement
of PMCH compounds through models made to represent a block of MSHA approved seal material.
Firstly, in the PFC3D model, not all of the particles made it through the length of the seal material. Some
particles were trapped in the void space that naturally occurs in the seal material, or the PMCH became
adsorbed, or bonded to the seal material particles (based on the Itasca shear and normal bond values for
rock in the Block Cave demo). Secondly, in the PFC3D model, the movement of the PMCH continued
through the seal material at a variable, but slower rate than in the open atmosphere. The Azivo model
demonstrated that using pressure differentials on two sides of the seal material can produce movement of
PMCH though the seal. This movement can be quantified as permeability, and the model produced values
similar to those seen in sandstones (5 to 15 mD) (Dutton & Willis, 1998). Both of these models, while
rudimentary in some respects, confirm some of the field work done by Virginia Tech and support the
theory that intact seals are permeable to tracer gases. The implications for this is that the changing flow
and concentration of these tracer gases can be used to detect structural concerns within in-situ mine seals.
6.8 Acknowledgements The models in the paper were completed with the help of Drew Hobert, student and research
associate with Virginia Tech, and Joseph Amnate, student and research associate with the Virginia Center
62
for Coal and Energy Research. The material used for both the porosity test and CT-scan were provided by
Mike Fabio of Strata Material Worldwide. Without their help, this paper would not be possible.
Chapter 7: Summary and Conclusions
This thesis describes the need for underground mine seals in coal mines, the need to assess the
integrity of the structures using non-destructive (NDT) methods, and provides assessment of two methods
that can potentially be used to identify issues within the seal — sonic waves in an impact-echo method
and perfluorinated tracer gases moving through the seal material. The two methods described in this paper
include one proven method (sonic waves) and another novel method (tracer gases) that has not been used
as a NDT tool for cement –like structures.
For the sonic wave experiments, the small-scale laboratory experiments described in Chapter 3
outlined how a single geophone can be used to identify structural differences in small blocks of seal
material designed to have engineered issues such as void spaces and fracture planes by applying a single
impact-based energy source to the surface of the sample. By looking at correlation differences between
the frequency ranges, it was possible to identify differences in the condition of the samples. The issue
with the single geophone impact-echo NDT method became apparent in the large and full-scale
experiments detailed in Chapter 5. When transitioning the experimental design from the laboratory setting
at Virginia Tech to the large samples in Kentucky, the background noise present in the underground mine
environment became too large to distinguish the energy pulse from the impact source. The movement of
equipment, movement of the rock mass as mining progresses, and structural maintenance of the mine
(roof bolting, scaling, blasting, etc.) are all potential sources of background noise that are almost
unavoidable when working in underground mines. One of the good technical notes taken from the full-
scale experiment is that it appears as if the distance between of the geophone and energy source is fairly
independent of the amplitude of energy propagating through the seal. Overall, the trouble with
background noise in mining environments appears to be the largest factor preventing successful use of the
sonic wave impact-echo NDT method.
For the novel NDT method used for experimentation and confirmations in Chapters 3, 4, and 6
there are several important findings from the small, large, and full-scale experiments and modeling. The
small-scale experiments confirmed that perfluoromethylcyclohexane (PMCH) would be an appropriate
tracer gas to use for the experiments, compared with a traditional tracer, sulfur hexafluoride. The small-
scale experiments of Chapter 3 also confirmed that, on the small-scale, it is possible for the heavy
molecular weight of the PMCH to move through solid seal material without interaction or escape paths
with any boundaries. This was confirmed through two separate computer modeling examples in Chapter
6, and while no quantified values were taken from the models, the simulations did confirm that it is
possible for PMCH compounds to move through solid seal material structures. Perhaps one of the
significant chapters in this paper, Chapter 4 provided both large and full-scale experiments to support that
claim that PMCH can successfully be used as a tracer gas to indicate an increase in the discontinuities or
fracture network found within the seal material. The full-scale Kentucky experiments also helped confirm
the movement of the compound through solid seal material, and also the potential installation of PMCH
Passive Release Source (PPRS) within the seal material itself to release the tracer at the center of the seal.
Overall, the tracer NDT method experiments, although novel, proved to be a valid potential option for
monitoring the integrity of these mine seals in terms of fractures and discontinues forming within the seal
as the life of the structure progresses. It is yet to be seen how the present of void space or an improper
density mixture of the material may affect movement, as well as how samples should be collected and
monitored from in-situ underground seals, but the trace method does show significant promise and
support for further research. Since intact seals are permeable to tracer gas movement, presence of the
tracer alone does not indicate a compromised seal, complicating the use of tracer gases as a NDT method.

63
Nonetheless, a significant change in the concentration over time could indicate a structural change within
the seal.

64
Chapter 8: Future Works While the findings of this project documented do not lend conclusive support to some of the NDT
methods, there are some additional experiments and projects might further the application of both
methods. Both the sonic wave and tracer gas non-destructive testing (NDT) method experiment have
indicated potential success in evaluating the condition and integrity of underground mine seals, and
additional testing may help prove that the sonic wave method is feasible in mine environments, and the
tracer gas method may be ready to install in an in-situ mine seal.
The background noise present in the Kentucky underground mine prohibited the advancement of
the sonic wave impact-echo method, although the method has been documented in civil studies. Some of
the possible improvement or modifications to the experiment that might help are the replacement of the
geophone with a sensitive MEMS (microelectricalmechanical system) accelerometer, adjusting the energy
source to a range of frequencies, or explore additional NDT methods for evaluating the seals.
It terms of continuing tracer gas NDT method research, the next step seems to be the design of
some sampling system, whether that be Tygon® tubing, solid phase micro extraction (SPME) fibers, or
taking vacutainer samples from the face of the seal. Introducing a series of sampling tubes with the seal
might be a potential integrity issue for the seal, and seeing as maintaining the required overpressure
strength is one of main concerns of these seals, it may be necessary to test the integrity and failure criteria
of a full-scale seal equipped with sampling tubes and ports. Further study of the permeability of seals to
tracer could allow for assessment of integrity based on the rate of tracer movement or concentration, as
long as the atmosphere conditions as the seal are well understood.
One of the interesting findings from this project that may become groundwork for additional
research is the movement of high molecular weight perfluoromethylcyclohexane through the seal
material. It is generally assumed that mine seals prevent the area of high methane from migrating to the
working sections of the mine. Methane (CH4) is a much lighter, smaller molecule than PMCH (C7F14) and
could possibly travel through the seal material. It is possible that future investigation should explore
whether or not pockets of methane found at the face of mine seals are products of leaking around the
boundaries (as always assumed). It has long been observed that mine seals “breathe” with pressure
changes and assumed that the exchange occurs at the boundary of the seal and strata. While it is likely
that this is the primary mechanism, seal permeability may also be a contributor.

65
References
(n.d.). Retrieved from WebMo: http://www.webmo.net/ Abbas, A., Carcasses, M., & Olliver, J. -P. (1999). Gas permeability of concrete in relation to its degree of
saturation. Materials and Structures, 3-8.
Abraham, O., & Popovics, J. (2010). Impact-echo techniques for evaluation of concrete structures. In C.
Maierhofer, H.-W. Reinhardt, & G. Dobmann, Non-detsructive evaluation of reinforced concrete
structures (pp. 466-488). Woodhead Publisting Limited.
AP Energy Business Publications. (2011). Non-Destructive Testing: Development and Use. PetroMin
Pipeliner.
Begely, P., Foulgr, B., & Simmonds, P. (1988). Femtogram Detection of Perfluorocarbon Tracers Using
Capillary Gas Chromatography-Electron Capute Negative Ion Chemical Ionization Mass
Spectrometry. Journal of Chromatography, 119-128.
Berger, K. (1977). Protection of Underground Blasting Operations. London, U.K.: R.H. Golde
Academic.
Boore, D. M. (1988). The Richter scale: its development and use for determining . Technophysics, 1-14.
Brashear, K. T., Luxbacher, K., Westman, E., Harwood, C., Lusk, B., & Weitzel, W. (2014). Assessment
of Sonic Waves and Tracer Gases and Non-Destructive Testing Methods to Evaluate the
Condition and Integrity of In-Situ Underground Mine Seals. 2014 SME Preprints.
Brookhaven National Laboratory. (2013, July 25). S-SAFAE Study: Protecting Our Subways and Streets.
Retrieved from www.bnl.gov: http://www.bnl.gov/s-safe/
Bullister, J. L., Wisegarver, D. P., & Menzia, F. A. (2002). The solubility ofsulfur hexafluoride in water
and seawater. Deep Sea Research, 175-187.
Bungey, J., & Millard, S. (1996). Testing of Concrete in Structures. London: Blackie Academic &
Professional.
Buyukozturk, O. (1998). Imaging of concrete structures. NDT & E International, 233-243.
Cantor, T. R. (1984). Review of Penetrating Radar as Applied to Nondestructive Evaluation of Concrete.
In V. Malhotra, In Situ/Nondestructive Testing of Concrete (pp. 581-601). Detroit: American
Concrete Institute.
Carino, N. J. (2001). THE IMPACT-ECHO METHOD: AN OVERVIEW. 2001 Structures Congress &
Exposition, (pp. 1-18). Washington D.C.
Carion, N. J., Sansalone, M., & Hsu, N. N. (1986). Flaw Detection in Concrete by Frequnecy Spectrum
Analysis of Impact-Echo Waveforms. INternational Advances in Nondestructive Testing, 117-
146.
Checca, E. L., & Zuchelli, D. R. (1995). Lightning Strikes and Mine Explosions. Seventh U.S. Mine
Ventilation Symposium (pp. 245-250). Lexington, KY: University of Kentucky.
Cheng, C., & Sansalone, M. (1993). The impact-echo response of concrete plates containing
delaminations: numerical, experimental and field studies. Materials and Structures, 274-285.
Cho, Y. S. (2003). Non-destructive testing of high strength concrete using spectral analysis of surface
waves. NDT & E International, 229-235.
Choinska, M., Khelidj, A., Chatzigeorgious, G., & Pijaudier-Cabot, G. (2007). Effects and interactions of
temperature and stress-level related damage on permeability of conrete. Cemement and COncrete
Research, 79-88.
Chong, K. P., Scalzi, J. B., & Dillon, O. (1990). Overview of Nondestructive Evaluation Projects and
Initiative at NSF. Journal of Intelligent Material Systems and Structures.
Chromedia. (2014, June 16 ). Chemical Ionization. Retrieved from Chromedia.org:
http://www.chromedia.org/chromedia?waxtrapp=thcseDsHqnOxmOlIEcCvB&subNav=nibelDsH
qnOxmOlIEcCvBE

66
Chromedia. (2014, June 2014). Electron Ionization. Retrieved from Chromedia.org:
http://www.chromedia.org/chromedia?waxtrapp=thcseDsHqnOxmOlIEcCvB&subNav=nibelDsH
qnOxmOlIEcCvBE
Chromedia. (2014, June 16). The Stationary Phase. Retrieved from Chromedia:
http://www.chromedia.org/chromedia?waxtrapp=odcseDsHqnOxmOlIEcCpBkFhF&caller=pdoxf
DsHqnOxmOlIEsGvG&zoekres=yes&scrv=subodcseDsHqnOxmOlIEcCpBkFhF
Cooke, K. M., Simmonds, P. G., Nickless, G., & Makepeace, A. (2001). Use of Capillary Gas
Chromatography with Negative Ion-Chemical Ionization Mass Spectrometry for the
Determination of Perfluorocarbon Tracers in the Atmosphere. Analytical Chemistry, 4295-4300.
Cowards, H., & Jones, G. (1952). Limits of Flammability of Gases and Vapors. Washington D.C.: U.S.
Department of the Interior.
Davis, A., & Dunn, C. (1974). From theory to feild experience with the non-destructive vibration testing
of piles. Proc. Institute of Civil Engineers, 571-593.
Dietz, R. N., & Cote, E. A. (1982). Air Infiltration Measurement in a Home Using a Convenient
Perfluorocarbon Tracer Technique. Envrionment International , 419-433.
Dietz, R. N., Goodrich, R. W., Cote, E. A., & Wieser, R. F. (1986). Detailed Description and Performance
of a Passive Perfluorocarbon Tracer System for Building Ventilation and Air Exchange
Measurements. In H. Trechsel, & P. Lagus, Measured Air Leakage of Buildings (pp. 203-264).
Philadelphia: American SOciety for Testing and Materials.
DiMambro, J., Ashbaugh, D., Nelson, C., & Spencer, F. (2007). Sonic Infrared (IR) Imaging and
Fluorescent Penetrant Inspection Probability of Detection (POD) Comparison. AIP Conference
Proceedings.
D'Ottavio, T. W., Senum, G. I., & Dietz, R. N. (1988). Error Analysis Techniues for Perfluorocarbon
Tracer Derived Miltizone Ventilation Rates. Building and Envinronment, 187-194.
Drivas, P. J., Simmonds, P. G., & Shair, F. H. (1972). Experimental Characterization of Ventilation
Systems in Buildings. Environmental Science and Technology, 609-614.
Dutton, S. P., & Willis, B. J. (1998). COMPARISON OF OUTCROP AND SUBSURFACE
SANDSTONE PERMEABILITY DISTRIBUTION, LOWER CRETACEOUS FALL RIVER
FORMATION, SOUTH DAKOTA AND WYOMING. Journal of Sedimentary Research.
F2 Chemicals Limited. (2011, July 27). Safety Data Sheet Flutec TG PMCH. Retrieved from
f2chemicals.com: http://f2chemicals.com/pdf/sds/FLUTEC%20TG%20PMCH%20-
%20SDS20125%20-%20ENG.pdf
Ferber, G. J., Telegadas, K., Heffter, J. L., Dickson, C. R., Dietz, R. N., & Krey, P. W. (1980).
Demonstartion of a Long-Range ATmospheric Tracer System Using Perfluorocarbons. National
Oceanic and Atmospheric Administration.
Ferraris, C., de Larrard, R., & Martys, N. (2001). Fresh Concrete Rheology: Recent Developments.
Materials Science of Concrete, 215-241.
Frazier, C. (2013, September 2). Brookhaven and NYPD conduct airflow study, but will not divulge
results. Columbia Journalist.
Galdiga, C. U., & Greibrokk, T. (2000). Ultra trace detection of perfluorocarbon tracers in reservoir gases
by adsorption/thermal desorption in combination with NICI-GC/MS. Fresenius Journal of
Analyrical Chemistry, 43-50.
Gates, R., Phillips, R., Urosek, J., Stephan, C., Stoltz, R., & Swentosky, D. (2006). Report of
Investigation into the Sago Mine Explosion which occured January 2, 2006. Charleston, WV:
West Virginia Office of Miners' Health, Safety, and Training.
Geldenhuys, H., Erickson, A., Jackson, W., & Raath, J. (1985). Research into lightning-related incidencts
in shallow South African coal mines. 21st International Conference Safety in Mines Research
Institute, (pp. 775-782). Sydney, Australia.
Greninger, N., Weiss, E., Luzik, S., & Stephan, C. (1991). Evaluation of Solid Block and Cementitous
Foam Seals. U.S. Bureau of Mines.

67
Greninger, N., Weiss, E., Luzik, S., & Stephan, C. (1991). Evaluation of Solid-Block and Cementitous
Foam Seals. U.S. Bureau of Mines.
Grob, R. L., & Barry, E. F. (2004). Modern Practice of Gas Chromatrography. Hoboken: John Wiley &
Sons, Inc.
Hall, C. (1981). Mine Ventilation Engineering. New York: Society of Mining Engineers.
Halmshaw, R. (1987). Non-destructive Testing. Baltimore: Edaward Arnold.
Hansen, A. J., Ottosen, N. S., & Peterson, C. G. (1987). Gas-Permeability in Concrete In Situ: Theory and
Practice. In V. M. Malhotra, In Situ/ Nondestructive Testing of Concrete (pp. 543-557). Detroit:
American Concrete Institute.
Harnisch, J., & Borchers, R. (1996). Tropospheric trends for CF4 and C2F6 since 1982 derived from SF6
dated stratospheric air . Geophysical Research Letters, 1099-1102.
Harnisch, J., & Eisenhauer, A. (1998). Natural CF4 and on Earth. Geophysical Research Letter, 2401-
2404.
Hartman, H. L., & Mutmansky, J. M. (2002). Intoductory Mining Engineering. Hoboken, NJ: John Wiley
& Sons, Inc.
Hartman, H. L., Mutmansky, J. M., Ramani, R., & Wang, Y. (1997). Mine Ventilation and Air
Conditioning. New York: John Wiley & Sons, Inc. .
Harvey, D. (2014, June 16). Gas Chromatography. Retrieved from UC Dvis Chemwiki: 2014
Hill, H. H., & McMinn, D. G. (1992 ). Detectors for Capillary Chromatography. Toronto: John Wiley &
Sons, Inc.
History of Itasca. (n.d.). Retrieved from Itasca Consulting Group, Inc.:
http://www.itascacg.com/about/history-of-itasca
Hui-sheng, S., Bi-wan, X., & Xiao-chen, Z. (2009). Influence of mineral admixtures on compressive
strength, gas permeability and carbonation of high performance concrete. Construction and
Building Materials, 1980-1985.
Hussey, D. A., & Semethy Jr., W. R. (1993). United Stated of America Patent No. US5401120 A.
Hygenschmidt, J. (2010). Group penetrating radar for the evaluation of concrete structures. In C.
Maierhofer, H.-W. Reinhardt, & G. Dobmann, Non-destructive evaluation of reinforced concrete
structures (pp. 317-333). Oxford: Woodhead Publishing Limited.
Jing, L., & Stephansson, O. (2007). Fundamentals of Discrete Element Methods for Rock Engineering.
Jordan Hill, Oxford: Elsevier.
Jong, E. (2014). Field test of a perfluoromethylcyclohexane (PMCH) permeation plug release vessel
(PPRV) using a dual tracer deployment in an underground longwall mine .
Jorgnsen, A. D., & Stamoudis, V. C. (1990). Prediction of Gac Chromotography Flame Ionization Dector
Response Factors from Molecular Sctructures. Analytical Chemistry, 683-689.
Kallu, J. R. (2009). Design of Reinforced Concrete Seals for Underground Coal Mines. Morgantown,
WV: West Virginia University.
Kattenbraker, S. (2002, Feburary 2). Explosion at Big Ridge Mine Portal #2. Memorandum. Pittsburgh,
PA: The Record.
Keller, L. M., Holzer, L., Wepf, R., & Gasser, P. (2010). 3D geometry and topology of pore pathways in
Opalinus clay: Implications for. Applied Clay Science.
Kirsch, P. (2004). Modern Fluoroorganic Chemistry. Weinheim: Wiley-VCH.
Kissell, F. N., & Bielicki, R. J. (1974). Ventilation Eddy Zones at a Model Coal Mine Working Face .
U.S. Bureau of Mines.
Krause, M., Bazrmann, M., Frielinghaus, R., Kretzschmar, F., Kroggle, O., Lanhenberg, K. J., . . .
Wollbold, F. (1997). Comparison of pulse-echo methods for testing concrete. NDT & E
Inter997national, 195-204.
Laing, M.-T., & Su, P.-J. (2001). Detection of the corrosion damage of rebar in concrete using impact-
echo method. Cement and Concrete Research, 1427-1436.

68
Leaderer, B. P., Schaap, L., & Dietz, R. N. (1985). Evaluation of the Perfluorocarbon Tracer Technique
for Determining Infiltration Rates in Residences. Environmental Science and Technology, 1225-
1232 .
Light, T., Herndon, R., Guley Jr., A., Cook, G., Odum, M., & Bates Jr., R. (2007). Report of
Investigation, fatal underground mine explosion, May 20, 2006. Darby mine No. 1, ID No. 15-
18185. Arlington, WV: Mine Safety and Health Adminsitration.
Malhotra, V. M. (1984). In SItu/Nondestructive Testing of Concrete- A Global Review. In V. M.
Malhotra, In Situ/ Nondestructive Testing of Concrete (pp. 1-16). Detroit: American Concrete
Institute.
Martin, J., James, A., & Smith, G. H. (1952). Gas-liquid Partition Chromatography: The Separation and
Micro-estimation of Ammonia and the Methylamines. Biochemistry Journal, 238-242.
Matta, J., Maksimovic, S., & Kissell, F. N. (1978). Tracer Gas Method for Measuring Leakage Through
Mine Stoppings. U.S. Bureau of Mines.
McCann, D., & Forde, M. (2001). Review of NDT methods in the assessment of concrete and masonry
structures. NDT & E International, 71-84.
McMaster, M., & McMaster, C. (1998). GC/MS: A Practical User's Guide. Toronto: Wiley-VCH.
McNair, H. M., & Miller, J. M. (1997). Basic Gas Chromatography. Hoboken, NJ: John Wiley & Sons,
Inc.
McPherson, M. (1993). Subsurface Ventilation and Environmental Engineering. London: Chapman &
Hall.
Mine Safety and Health Administration. (2008). Regulatory Economic Analysis for Seal of Abandoned
Areas in Underground Coal Mines Final Rule. U.S. Department of Labor.
Mine Safety and Health Administration. (2011). 30 Code of Federal Regulations. National Archives and
Records Administration .
Mine Safety and Health Administration. (2012). Preliminary Report of Accident. No Injuries. Ignition or
Explosion of Gas or Dust. July 1st, 2012. Pleasant Hill Mine.
Mine Safety and Health Administration. (2014, May 15). Final Rule on Sealing of Abandoned Areas
Single Source Page. Retrieved from www.msha.gov:
http://www.msha.gov/Seals/SealsSingleSource2007.asp#.U3SrvvldXyi
Mitchell, D. (1971). Explosion-Proof Bulkheads: Present Practices. Pittsburgh, PA: U.S. Bureau of
Mines.
Mix, P. E. (1987). Introduction to Nondestructive Testing. New York: John Wiley & Sons, Inc.
Nakajima, T., Zemva, B., & Tressaud, A. (2000). Advanced Inorganic Fluorides. Lausanne, Switzerland:
Elsevier Science .
Narayanan, N., Ramamurthy, & K. (2000). Structure and properties of aerated concrete: a review. Cement
& Concrete Composites, 231-329.
Niessen, W. (2001). Current Practice of Gas Chromatography-Mass Secptrometry. New York: Marcel
Dekker, Inc.
Novak, T., & Fisher, T. J. (2001). Lightning Propagation Through the Earth and Its Potential for Methane
Ignitions in Abandoned Areas of Underground Coal Mines. IEEE Transcations on Industry
Applications, 1555-1562.
Patterson, R. R. (2011). Determineation of a novel mine tracer gas and development of a methodology for
sampling and analysis of mutiple tracer gases for characterization of ventilation systems.
Blacksburg, VA: Virginia Polytechnic Institute and State University .
PetroMin Pipeliner. (2011). Non-Destructive Testing- Development and Uses. Safan.
Phelps, T., McCallum, S., Cole, D., Kharaka, Y., & Hovorka, S. (2006). Monitoring Geological CO2
Sequestration using Perfluorocarbon Gas Tracers and Isotopes. Carbon Sequestration (p. Poster).
Alexandria: DOE/NETL.
Poole, C. F. (2012). Gas Chromatograpgy. Waltham, MA: Elsevier.

69
Pruess, K., Freifeld, B., M., K., Oldenburg, C., Phelps, T., & van Soest, M. (2005). Use of Gas Phase
Tracers for Monitoring CO2 Injection at the Frio Test Site. Alexandia, VA: National Energy
Technology Laboratory.
Rahman, M. (2011). Applications of Fourier Transforms to Generalized Functions. Boston: WIT Press.
Ramamuthy, K., Nambiar, E. K., & Ranjani, G. I. (2009). A classification of studies on properties of foam
concrete. Cement & Concrete Composites, 388-396.
Ramierz, R. W. (1985). The FFT: Fundamentals and Concepts. Englewood Cliffs, NJ: Prentice-Hall, Inc.
Rice, G. S., Greenwald, H., Howarth, H., & Avins, a. S. (1931). Concrete Stoppings in Coal mines for
Resisting Explosions: Detailed Test of Typical Stoppings and Strength of Coal as a Buttress.
Pittsburgh, PA: U.S. Bureau of Mines.
Rice, G., Greenwald, H., Howarth, H., & Avins, A. (1931). Concrete Stoppings in Coal Mines for
Resisting Explosions: Detailed Test of Typical Stoppings and Stregnth of Coal as a Buttress.
Pittsburgh: U.S. Bureau of Mines.
Rio, O., Rodriguez, A., Nabulsi, S., & Alvarez, M. (2011). Pumping Quality Control Method Based on
Online Concrete Pumpability Assessment. ACI Materials Journal, 423-431.
Ripepi, N. S. (2009). Carbon Dioxide Storage in Coal Seams with Enhanced Coalbed Methane Recovery:
Geologic Evaluation, Capacity Assessment and Field Validation of the Central Appalachian
Basin .
Roberts, A. (1960). Ventilation Surveys. In H. Bunt, B. Metcalf, B. Pursall, A. Roberts, & F. Williams,
Mine Ventilation (pp. 229-245). London: Cleaver-Hume.
Ross Jr, E., & Shultz, M. J. (1996). Report of investigation (underground coal mine). Noninjury coal mine
explosion. Mine No. 1 (I.D. No. 46-07273). MSHA.
Rowlinson, J., & Thacker, R. (1957). The Physical Properties of Some Fluorine Compounds and Their
Solutions: Part 3- Perfluorocyclohexane and Perfluromethylcyclohexane. Transactions of the
Farday Society.
Rutherford, J., Painter, R., Urosek, J., Stephan, C., & Dupree Jr, W. (1993). Report of investigation,
underground coal mine explosion, Blacksville No. 1 mine, I.D. No. 46-01867. Arlington, WV:
MSHA.
Sandberg, M., & Blomqvist, C. (1985). A Quantitative Estimate of the Accuracy of Tracer Gas Methods
for the Determination of the Ventilation Flow Rate in Buildings . Building and Environment, 139-
150.
Sausers, I., Ellis, H., & Christophorou, L. (1986). Neutral Decomposition Products in Spark Breakdown
of SF6. Electrical Insulation, 111-120.
Scherbatskoy, S. A. (1960). United States of America Patent No. 2939012.
Schickert, M., & Krause, M. (2010). Ultrasonic techniques for evaluation fo reinforced concrete
structures. In C. Maierhofer, H.-W. Reinhardt, & G. Dobmann, Non-destructive evaluation of
reinforced concrete structures (pp. 490-531). Oxford: Woodhead Publishing Limited.
Schmerr Jr., L. W., & Song, S.-J. (2007). Ultrasonic Nondestuctive Evaluation Systems. New York:
Springer Science+Business Media, LLC.
Schmidt, E. (1951). United States of America Patent No. US 2664743 A.
Scott, D. S., & Stephan, C. R. (1997). Accident investigation report (underground coal mine). Noninjury
methane explosion. Oak Grove mine (I.D. No. 01-00851). Birmingham, AL: MSHA.
Sevcik, J. (1976). Detectors in Gas Chromatography. Amsterdam: Elsevier.
Sherman, M. (1989). Uncertainty in Air Flow Calculations Using Tracer Gas Measurements . Building
and Environment, 347-354.
Simmonds, P., Greally, B., Olivier, S., Nickless, G., Cooke, K., & Dietz, R. (2002). The
backgroundatmospheric concentrations of cyclic perfluorocarbon tracers determined by negative
ion-chemical onization mass spectrometry. Atmospheric Envinroment, 2147-2156.
SkyScan N.V. (2005). Introduction in X-ray microtomography. In S. N.V., SkyScan 1172 Instruction
Manual. Belgium: SkyScan.

70
South, J. (1986). Report of Investigation (undeerground coal mine). Non-injury methane explosion.
Roadfork No. 1 mine (I.D. 15-10753). Pikeville, KY: MSHA.
Sparkman, O. D., Penton, Z. E., & Kitson, F. G. (2011). Gas Chromatography and Mass Spectrometry
Pratical Guide. New York: Elsevier.
Stade, E. (2005). Fourier Analysis. Hoboken, NJ: Jon Wiley & Sons, Inc.
Stephan, C., & Schultz, M. (1997). Constructions of Explosion Resistant Seals. Pittsburgh: Mine Safety
and Health Administration.
Stephan, C., & Schultz, M. (1997). Constructions of Explosion Resistant Seals. Pittsburgh, PA: MSHA.
Stokes, A., Kennedy, D., & Hardcastle, S. (1987). A Real-Time Trace Gas Analyzer- An Investigational
Tool for Mine Ventilation Syudies. Mining Science and Technology, 187-196.
Straume, A. G., Dietz, R. N., Koffi, E. N., & Nodop, K. (1998). Perfluorocarbon Background
Concentrations in Europe. Atmospheric Environment, 4109-4122.
Sumpter, J. E., Hudak, M. J., Kalich, M. G., Cook, L. E., Dupree Jr, W. A., & Schultz, M. J. (1995).
Report of investigation (underground coal mine). Noninjury coal mine explosion. Gary No. 50.
Mount Hope, WV: MSHA.
Szabandvary, F. (1966). History of Analytical Chemistry. Budapest: Pergamon Press.
Thimons, E., & Kissell, F. (1974). Tracer Gas as an Aid in Mine Ventilation Analysis. United States
Buearu of Mines.
Thimons, E., Bielicki, R., & Kissell, F. (1974). Using Sulfur Hexaflouride as a Gaseous Tracer to Study
Ventilation Systems in Mines. U.S. Bureau of Mines.
Thompson, B. (1977). Fundamentals of Gas Anlaysis by Gas Chromatography. Palo Alto, CA: Varian
Associates, Inc.
Timko, R., & Derick, R. (n.d.). Methods to Determine the Status of Mine Atmospheres – An Overiew.
Turk, A., Edmonds, S. M., & Mark, H. L. (1967). Sulfur Hexafluoride as a Gas-Air Tracer.
Environmental Science and Technology, 44-48.
U.S. Energy Information Administration. (2012). Annual Coal Report 2011. Washington D.C.:
Indpendent Statistics and Anlysis.
U.S. Energy Information Administration. (2012). Annual Energy Outlook 2011 with Projections to 2035.
Washington D.C.: Independent Statistics and Analysis.
University of Kentucky. (2014, June 17). Ionization Methods in Organic Mass Spectrometry. Retrieved
from University of Kentucky Mass Spectrometry Facility:
http://www.research.uky.edu/core/massspec/jeolioniz.pdf
Visualization Sciences Group. (2014, May 21). Avizo Fire. Retrieved from vsg3d.com:
http://www.vsg3d.com/avizo/fire
Walker, J. S. (1996). Fast Fourier Transforms. New York: CRC Press.
Weiss, E. S., Slivensky, W. A., Schultz, M. J., Stephan, C. R., & Jackson, K. W. (1996). Evaluation of
Polymer Construction Material and Water Trap Designs for Underground Coal Mine Seals.
Pittsburgh: United States Department of Energy.
Wells, A. W., Diehl, J. R., Bromhal, G., Strazisar, B. R., Wilson, T. H., & White, C. M. (2007). The use
of tracers to assess leakage from the sequestration of CO2 in a depleted oil reservoir, New
Mexico, USA. Applied Geochemistry, 996-1016.
Wells, A. W., Diehl, J. R., Strazisar, B. R., Wilson, T. H., & Stanko, D. C. (2013). Atmospheric and soil-
gas monitoring for surface leakage at the San Juan Basin CO2 pilot test site at Pump Canyon New
Mexico, using perfluorocarbon tracers, CO2 soil-gas flux and soil-gas hydrocarbons.
International Journal of Greenhouse Gas Control, 227-238.
Zhao, D., Nezami, E., & Hashash, Y. (2006). Three-Dimensional Discrete Element Simulation for
Granular Materials. Emerald Insight, 750-751.
Zipf Jr., R. K., Sapko, M. J., & Brune, J. F. (2007). Explosion Pressure Design Critera for New Seals in
U.S. Coal Mines. Pittsburgh: Department of Healhth and Human Services.
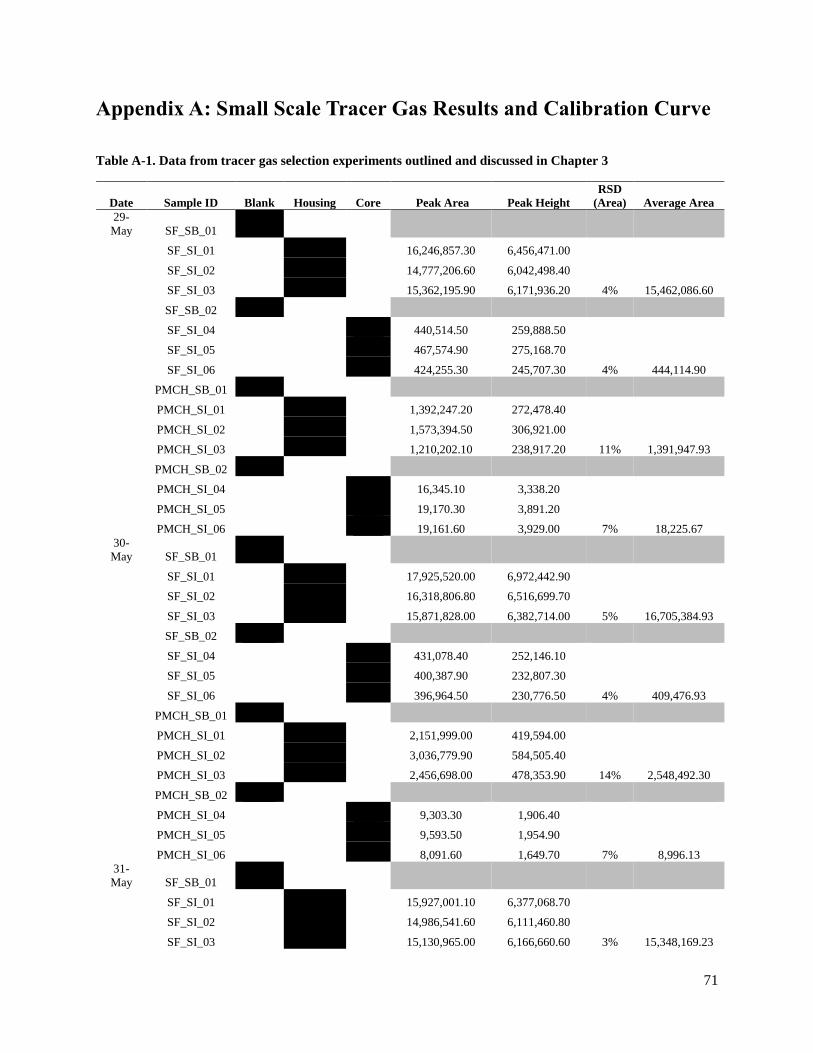
71
Appendix A: Small Scale Tracer Gas Results and Calibration Curve
Table A-1. Data from tracer gas selection experiments outlined and discussed in Chapter 3
Date Sample ID Blank Housing Core Peak Area Peak Height
RSD
(Area) Average Area
29-
May SF_SB_01
SF_SI_01 16,246,857.30 6,456,471.00
4% 15,462,086.60
SF_SI_02 14,777,206.60 6,042,498.40
SF_SI_03 15,362,195.90 6,171,936.20
SF_SB_02
SF_SI_04 440,514.50 259,888.50
4% 444,114.90
SF_SI_05 467,574.90 275,168.70
SF_SI_06 424,255.30 245,707.30
PMCH_SB_01
PMCH_SI_01 1,392,247.20 272,478.40
11% 1,391,947.93
PMCH_SI_02 1,573,394.50 306,921.00
PMCH_SI_03 1,210,202.10 238,917.20
PMCH_SB_02
PMCH_SI_04 16,345.10 3,338.20
7% 18,225.67
PMCH_SI_05 19,170.30 3,891.20
PMCH_SI_06 19,161.60 3,929.00
30-
May SF_SB_01
SF_SI_01 17,925,520.00 6,972,442.90
5% 16,705,384.93
SF_SI_02 16,318,806.80 6,516,699.70
SF_SI_03 15,871,828.00 6,382,714.00
SF_SB_02
SF_SI_04 431,078.40 252,146.10
4% 409,476.93
SF_SI_05 400,387.90 232,807.30
SF_SI_06 396,964.50 230,776.50
PMCH_SB_01
PMCH_SI_01 2,151,999.00 419,594.00
14% 2,548,492.30
PMCH_SI_02 3,036,779.90 584,505.40
PMCH_SI_03 2,456,698.00 478,353.90
PMCH_SB_02
PMCH_SI_04 9,303.30 1,906.40
7% 8,996.13
PMCH_SI_05 9,593.50 1,954.90
PMCH_SI_06 8,091.60 1,649.70
31-
May SF_SB_01
SF_SI_01 15,927,001.10 6,377,068.70
3% 15,348,169.23
SF_SI_02 14,986,541.60 6,111,460.80
SF_SI_03 15,130,965.00 6,166,660.60
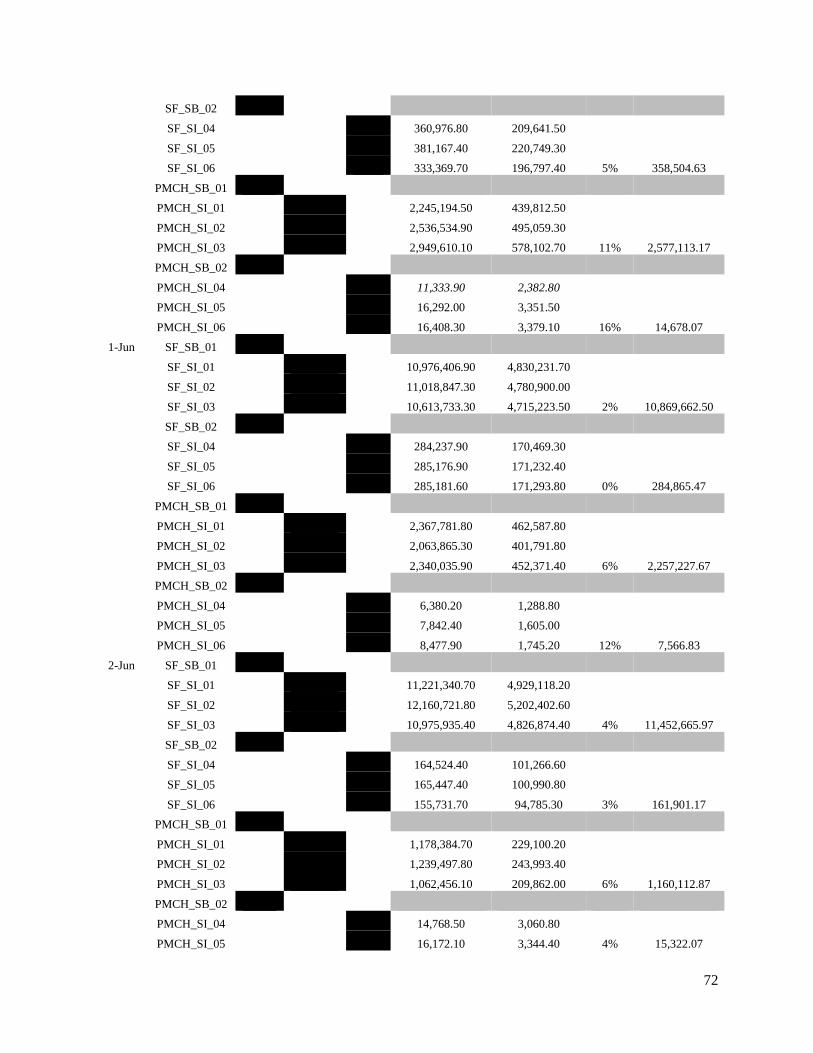
72
SF_SB_02
SF_SI_04 360,976.80 209,641.50
5% 358,504.63
SF_SI_05 381,167.40 220,749.30
SF_SI_06 333,369.70 196,797.40
PMCH_SB_01
PMCH_SI_01 2,245,194.50 439,812.50
11% 2,577,113.17
PMCH_SI_02 2,536,534.90 495,059.30
PMCH_SI_03 2,949,610.10 578,102.70
PMCH_SB_02
PMCH_SI_04 11,333.90 2,382.80
16% 14,678.07
PMCH_SI_05 16,292.00 3,351.50
PMCH_SI_06 16,408.30 3,379.10
1-Jun SF_SB_01
SF_SI_01 10,976,406.90 4,830,231.70
2% 10,869,662.50
SF_SI_02 11,018,847.30 4,780,900.00
SF_SI_03 10,613,733.30 4,715,223.50
SF_SB_02
SF_SI_04 284,237.90 170,469.30
0% 284,865.47
SF_SI_05 285,176.90 171,232.40
SF_SI_06 285,181.60 171,293.80
PMCH_SB_01
PMCH_SI_01 2,367,781.80 462,587.80
6% 2,257,227.67
PMCH_SI_02 2,063,865.30 401,791.80
PMCH_SI_03 2,340,035.90 452,371.40
PMCH_SB_02
PMCH_SI_04 6,380.20 1,288.80
12% 7,566.83
PMCH_SI_05 7,842.40 1,605.00
PMCH_SI_06 8,477.90 1,745.20
2-Jun SF_SB_01
SF_SI_01 11,221,340.70 4,929,118.20
4% 11,452,665.97
SF_SI_02 12,160,721.80 5,202,402.60
SF_SI_03 10,975,935.40 4,826,874.40
SF_SB_02
SF_SI_04 164,524.40 101,266.60
3% 161,901.17
SF_SI_05 165,447.40 100,990.80
SF_SI_06 155,731.70 94,785.30
PMCH_SB_01
PMCH_SI_01 1,178,384.70 229,100.20
6% 1,160,112.87
PMCH_SI_02 1,239,497.80 243,993.40
PMCH_SI_03 1,062,456.10 209,862.00
PMCH_SB_02
PMCH_SI_04 14,768.50 3,060.80
4% 15,322.07 PMCH_SI_05 16,172.10 3,344.40

73
PMCH_SI_06 15,025.60 3,097.10
3-Jun SF_SB_01
SF_SI_01 8,055,304.20 3,810,349.80
5% 8,494,951.20
SF_SI_02 9,109,501.80 4,147,626.70
SF_SI_03 8,320,047.60 3,895,756.60
SF_SB_02
SF_SI_04 119,676.00 73,859.70
5% 126,803.33
SF_SI_05 126,002.40 77,144.20
SF_SI_06 134,731.60 83,455.30
PMCH_SB_01
PMCH_SI_01 969,402.30 189,490.10
8% 915,976.33
PMCH_SI_02 970,208.60 189,008.50
PMCH_SI_03 808,318.10 158,839.10
PMCH_SB_02
PMCH_SI_04 7,495.70 1,534.40
14% 6,319.17
PMCH_SI_05 6,092.20 1,253.60
PMCH_SI_06 5,369.60 1,115.50
4-Jun SF_SB_01
SF_SI_01 8,160,850.20 3,820,671.70
4% 7,708,446.20
SF_SI_02 7,485,769.20 3,530,525.40
SF_SI_03 7,478,719.20 3,532,687.40
SF_SB_02
SF_SI_04 136,965.20 85,975.20
2% 139,028.67
SF_SI_05 136,832.20 85,425.80
SF_SI_06 143,288.60 89,204.40
PMCH_SB_01
PMCH_SI_01 770,500.90 150,285.50
4% 736,347.37
PMCH_SI_02 706,561.20 136,298.10
PMCH_SI_03 731,980.00 142,873.30
PMCH_SB_02
PMCH_SI_04 7,396.00 1,509.60
18% 6,336.03
PMCH_SI_05 6,834.50 1,415.80
PMCH_SI_06 4,777.60 975.30
5-Jun SF_SB_01
SF_SI_01 6,360,525.40 3,147,232.60
8% 6,410,231.20
SF_SI_02 5,846,412.60 2,908,872.50
SF_SI_03 7,023,755.60 3,420,175.60
SF_SB_02
SF_SI_04 102,636.00 63,846.90
2% 101,853.27
SF_SI_05 103,437.60 65,575.10
SF_SI_06 99,486.20 61,783.10
PMCH_SB_01
PMCH_SI_01 462,762.70 91,435.80 9% 501,165.83

74
PMCH_SI_02 478,136.80 94,237.30
PMCH_SI_03 562,598.00 110,530.20
PMCH_SB_02
PMCH_SI_04 6,048.50 1,256.70
15% 4,990.37
PMCH_SI_05 4,232.20 872.90
PMCH_SI_06 4,690.40 963.20
6-Jun SF_SB_01
SF_SI_01 6,698,393.50 3,269,293.00
2% 6,837,879.00
SF_SI_02 6,949,815.50 3,363,157.50
SF_SI_03 6,865,428.00 3,334,153.40
SF_SB_02
SF_SI_04 62,325.20 40,199.30
5% 67,118.00
SF_SI_05 70,643.40 44,450.30
SF_SI_06 68,385.40 43,867.80
PMCH_SB_01
PMCH_SI_01 347,211.40 68,820.50
23% 507,747.23
PMCH_SI_02 569,263.70 110,318.60
PMCH_SI_03 606,766.60 117,119.60
PMCH_SB_02
PMCH_SI_04 1,812.80 377.50
27% 2,437.90
PMCH_SI_05 3,334.30 685.80
PMCH_SI_06 2,166.60 441.60
7-Jun SF_SB_01
SF_SI_01 4,540,866.90 2,329,748.70
1% 4,485,263.47
SF_SI_02 4,432,060.10 2,277,980.90
SF_SI_03 4,482,863.40 2,310,310.40
SF_SB_02
SF_SI_04 58,413.50 37,022.10
5% 61,918.07
SF_SI_05 66,441.40 42,557.90
SF_SI_06 60,899.30 38,589.80
PMCH_SB_01
PMCH_SI_01 1,391,064.30 267,415.30
9% 1,293,358.53
PMCH_SI_02 1,350,769.30 259,944.40
PMCH_SI_03 1,138,242.00 219,055.60
PMCH_SB_02
PMCH_SI_04 6,380.20 1,288.80
7% 7,033.83
PMCH_SI_05 7,236.10 1,475.20
PMCH_SI_06 7,485.20 1,506.70
10-Jun SF_SB_01
SF_SI_01 2,898,384.80 1,559,595.90
9% 2,689,212.87
SF_SI_02 2,806,063.20 1,516,660.00
SF_SI_03 2,363,190.60 1,288,114.30
SF_SB_02

75
SF_SI_04 34,876.50 21,839.00
1% 34,421.00
SF_SI_05 34,624.20 22,344.10
SF_SI_06 33,762.30 21,973.20
PMCH_SB_01
PMCH_SI_01 1,142,767.00 217,438.90
3% 1,177,452.53
PMCH_SI_02 1,168,037.20 221,939.90
PMCH_SI_03 1,221,553.40 231,116.00
PMCH_SB_02
PMCH_SI_04 4,125.80 837.40
8% 4,638.97
PMCH_SI_05 5,065.90 1,033.40
PMCH_SI_06 4,725.20 959.10
11-Jun SF_SB_01
SF_SI_01 2,440,994.20 1,311,638.10
2% 2,512,114.13
SF_SI_02 2,545,952.30 1,357,762.30
SF_SI_03 2,549,395.90 1,366,384.90
SF_SB_02
SF_SI_04 33,137.60 21,123.20
7% 30,672.10
SF_SI_05 30,676.90 19,247.40
SF_SI_06 28,201.80 18,094.00
PMCH_SB_01
PMCH_SI_01 1,441,327.80 283,542.00
8% 1,300,634.00
PMCH_SI_02 1,243,568.20 247,274.90
PMCH_SI_03 1,217,006.00 239,177.20
PMCH_SB_02
PMCH_SI_04 6,152.20 1,303.20
9% 6,120.33
PMCH_SI_05 6,750.80 1,419.10
PMCH_SI_06 5,458.00 1,146.60
12-Jun SF_SB_01
SF_SI_01 2,179,176.00 1,188,690.80
2% 2,216,220.73
SF_SI_02 2,205,295.60 1,202,947.40
SF_SI_03 2,264,190.60 1,231,567.30
SF_SB_02
SF_SI_04 31,802.00 19,914.10
2% 30,792.17
SF_SI_05 30,241.70 19,644.60
SF_SI_06 30,332.80 18,989.10
PMCH_SB_01
PMCH_SI_01 1,211,737.90 241,199.60
5% 1,140,493.30
PMCH_SI_02 1,136,860.80 226,145.40
PMCH_SI_03 1,072,881.20 212,222.80
PMCH_SB_02
PMCH_SI_04 3,854.60 820.90
12% 3,292.63
PMCH_SI_05 3,061.00 643.10
PMCH_SI_06 2,962.30 630.20

76
Table A-2. Calibration curve data from tracer gas selection experiments outlined and discussed in Chapter 3
Known PPM Peak Area Peak Height RSD Average
0.10
251.7 61.2
5.52 256.47 275.7 65.6
242 50.4
6.34
641.1 146.6
11.35 730.13 708.7 153.4
840.6 192.4
15.84
1,252.4 281.4
0.89 1,265.00 1,262.9 280.6
1,279.7 282.2
274.47
8,454.40 1,853.80
5.60 8,240.50 8,668.00 1,908.70
7,599.10 1662.2
989.90
27,586.60 5991.2
5.66 25,807.30 25,828.10 5559.6
24,007.20 5242.3
63,353.54
668,204.00 138,112.30
1.92 685,381.57 687,707.00 142,880.50
700,233.70 145,544.30
320,727.27
1,531,909.40 320,204.3
3.24 1,593,606.43 1,590,657.30 333,242.7
1,658,252.60 338,639.2
890,909.09
2,948,979.60 632,749.6
2.70 2,841,812.20 2,772,832.20 594,878.1
2,803,624.80 586,505.6
1,247,272.73
3,551,163.4 763,334.00
0.94 3,541,095.03 3,496,137.20 751,545.50
3,575,984.50 757,621.90
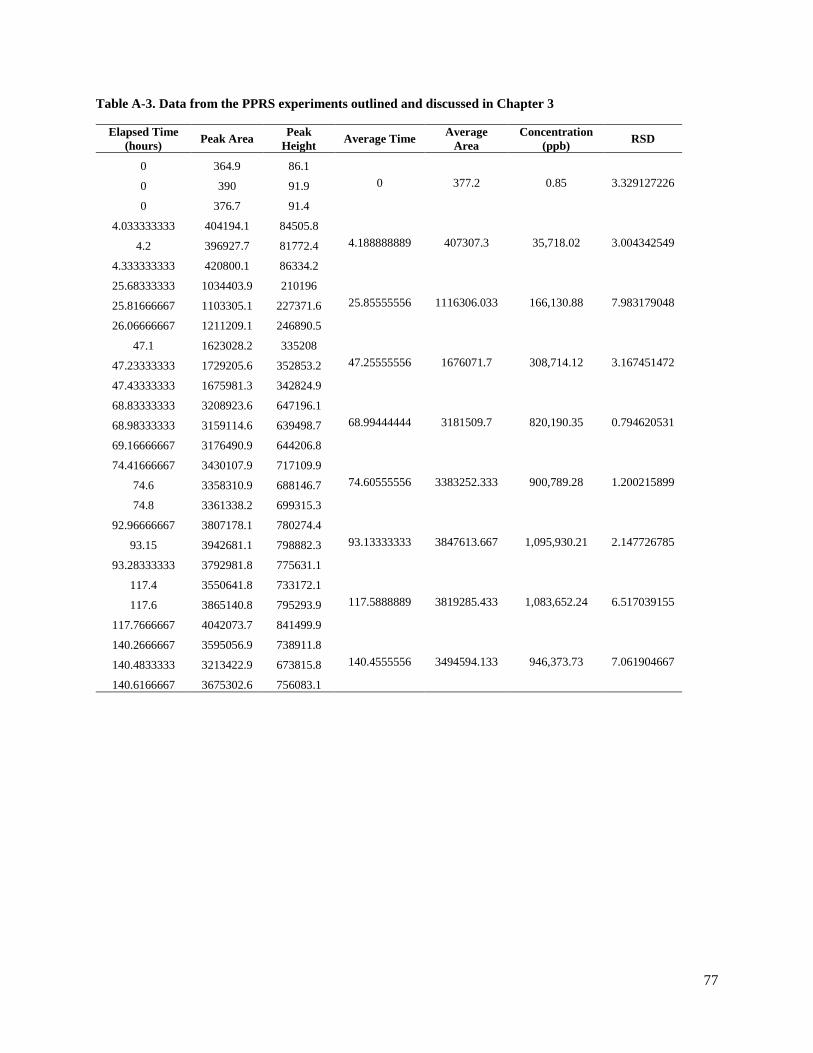
77
Table A-3. Data from the PPRS experiments outlined and discussed in Chapter 3
Elapsed Time
(hours) Peak Area
Peak
Height Average Time
Average
Area
Concentration
(ppb) RSD
0 364.9 86.1
0 377.2 0.85 3.329127226 0 390 91.9
0 376.7 91.4
4.033333333 404194.1 84505.8
4.188888889 407307.3 35,718.02 3.004342549 4.2 396927.7 81772.4
4.333333333 420800.1 86334.2
25.68333333 1034403.9 210196
25.85555556 1116306.033 166,130.88 7.983179048 25.81666667 1103305.1 227371.6
26.06666667 1211209.1 246890.5
47.1 1623028.2 335208
47.25555556 1676071.7 308,714.12 3.167451472 47.23333333 1729205.6 352853.2
47.43333333 1675981.3 342824.9
68.83333333 3208923.6 647196.1
68.99444444 3181509.7 820,190.35 0.794620531 68.98333333 3159114.6 639498.7
69.16666667 3176490.9 644206.8
74.41666667 3430107.9 717109.9
74.60555556 3383252.333 900,789.28 1.200215899 74.6 3358310.9 688146.7
74.8 3361338.2 699315.3
92.96666667 3807178.1 780274.4
93.13333333 3847613.667 1,095,930.21 2.147726785 93.15 3942681.1 798882.3
93.28333333 3792981.8 775631.1
117.4 3550641.8 733172.1
117.5888889 3819285.433 1,083,652.24 6.517039155 117.6 3865140.8 795293.9
117.7666667 4042073.7 841499.9
140.2666667 3595056.9 738911.8
140.4555556 3494594.133 946,373.73 7.061904667 140.4833333 3213422.9 673815.8
140.6166667 3675302.6 756083.1

78
Appendix B: Large and Full Scale Tracer Gas Results and
Calibration Curve
Table B-1. Data from Virginia large-scale experiments outlined and discussed in Chapter 4
Sample
Distance
from
Release
Source (ft)
Peak Area Concentration
(ppb) Sample
Distance
from
Release
Source (ft)
Peak Area Concentration
(ppb)
B Fault
10/24/13
1.5 21,358.00 162.78
B
Control
10/24/13
1.5 279,215.33 2,200.00
3 11,491.00 87.46 3 2,158.00 16.41
4.5 1,146.67 8.72 4.5 - -
6 576.00 4.38 6 - -
7.5 69.67 0.53 7.5 - -
9 - - 9 - -
10.5 - - 10.5 - -
A Fault
10/24/13
1.5 1,321,887.33 11,793.73
A
Control
10/24/13
1.5 4,670.33 35.52
3 94,506.00 727.18 3 - -
4.5 382,865.00 3,056.36 4.5 - -
6 24,282.33 185.14 6 - -
7.5 1,279.00 9.72 7.5 - -
9 242.00 1.84 9 - -
10.5 70.33 0.53 10.5 - -
B Fault
10/31/13
1.5 1,570,189.00 14,398.93
B
Control
10/31/13
1.5 1,317,088.33 11,744.59
3 101,583.00 782.35 3 131,733.67 1,018.53
4.5 16,235.67 123.65 4.5 4,738.33 36.03
6 992.67 7.55 6 198.67 1.51
7.5 114.33 0.87 7.5 - -
9 - - 9 - -
10.5 - - 10.5 - -
A Fault
10/31/13
1.5 3,935,716.00 45,401.30
A
Control
10/31/13
1.5 33,667.67 257.01
3 321,581.67 2,547.44 3 432.33 3.29
4.5 2,588,887.00 26,377.88 4.5 164.67 1.25
6 587,418.33 4,809.44 6 - -
7.5 91,317.33 702.35 7.5 - -
9 47,191.67 360.88 9 - -
10.5 20,245.00 154.27 10.5 - -
B Fault
11/11/13
1.5 5,348,483.67 69,254.75
B
Control
11/11/13
1.5 4,609,714.00 56,283.29
3 958,255.33 8,200.99 3 938,329.33 8,011.76
4.5 159,130.33 1,234.71 4.5 74,328.00 570.42
6 35,776.33 273.18 6 3,572.67 27.17
7.5 5,319.33 40.46 7.5 1,853.00 14.09
9 1,769.00 13.45 9 - -
10.5 337.00 2.56 10.5 - -

79
A Fault
11/11/13
1.5 2,951,860.00 31,147.61
A
Control
11/11/13
1.5 51,513.00 394.15
3 3,667.00 27.88 3 829.00 6.30
4.5 2,189,842.33 21,438.21 4.5 742.67 5.64
6 762,276.33 6,374.37 6 - -
7.5 26,931.67 205.41 7.5 - -
9 28,769.00 219.47 9 - -
10.5 59,462.33 455.45 10.5 - -
B Fault
11/20/13
1.5 7,389,237.67 110,759.04
B
Control
11/20/13
1.5 4,831,513.67 60,063.03
3 1,694,042.00 15,744.50 3 1,589,684.67 14,608.70
4.5 119,820.33 924.99 4.5 286,189.67 2,256.95
6 73,838.33 566.62 6 21,115.00 160.92
7.5 19,000.67 144.77 7.5 3,454.33 26.26
9 6,321.00 48.08 9 299.00 2.27
10.5 932.67 7.09 10.5 136.33 1.04
A Fault
11/20/13
1.5 1,869,104.67 17,698.75
A
Control
11/20/13
1.5 86,098.67 661.76
3 225,900.00 1,767.87 3 1,479.00 11.24
4.5 2,308,131.33 22,869.27 4.5 1,679.67 12.77
6 1,122,496.33 9,790.97 6 - -
7.5 204,941.00 1,599.55 7.5 - -
9 129,401.00 1,000.19 9 - -
10.5 68,147.00 522.56 10.5 - -
B Fault
11/25/13
1.5 7,810,404.67 120,361.50
B
Control
11/25/13
1.5 1,710,175.33 15,922.03
3 1,911,481.67 18,181.02 3 406,074.33 3,251.06
4.5 262,979.00 2,067.80 4.5 27,487.33 209.66
6 66,698.67 511.36 6 7,100.67 54.02
7.5 4,002.67 30.44 7.5 1,252.00 9.52
9 1,654.33 12.58 9 - -
10.5 - - 10.5 - -
A Fault
11/25/13
1.5 4,254,002.33 50,426.95
A
Control
11/25/13
1.5 63,690.00 488.10
3 75,847.00 582.19 3 1,392.67 10.59
4.5 2,423,355.67 24,290.16 4.5 1,650.00 12.54
6 807,790.00 6,791.73 6 - -
7.5 163,226.67 1,267.17 7.5 - -
9 125,946.00 973.05 9 - -
10.5 69,893.00 536.07 10.5 - -
B Fault
12/10/13
1.5 9,626,869.67 165,840.83
B
Control
12/10/13
1.5 8,394,285.00 134,260.59
3 4,872,984.00 60,780.65 3 295,272.67 2,331.26
4.5 1,914,899.33 18,220.07 4.5 98,980.67 762.05
6 367,002.67 2,923.91 6 96,783.33 744.92
7.5 195,146.67 1,521.20 7.5 11,019.00 83.87
9 191,484.67 1,491.95 9 2,976.67 22.63
10.5 4,785.33 36.39 10.5 434.00 3.30
1.5 3,795,763.00 43,255.62 1.5 7,346.33 55.89
3 107,020.67 824.81 3 2,100.00 15.96

80
A Fault
12/10/13 4.5 2,477,651.67 24,968.91
A
Control
12/10/13
4.5 5,901.00 44.88
6 1,384,365.00 12,437.64 6 233.33 1.77
7.5 771,492.75 6,458.55 7.5 146.00 1.11
9 220,830.00 1,727.07 9 - -
10.5 138,846.33 1,074.51 10.5 - -

81
Table B-2. Data from Kentucky full-scale experiments outlined and discussed in Chapter 4
Sample
Date
Sample
Name Description Retention Time Peak Area Mean Std. Dev
18-Apr Air_04
First Air
vaccutainer
taking from
the
atmosphere
above the seal 3.428 169
173 4.114481022
Air_02 3.43 167
Air_03 3.428 183
Air_05
Second Air
vaccutainer
taking from
the
atmosphere
above the seal -- -- -- --
Air_06 -- -- -- --
Air_07
Third Air
vaccutainer
taking from
the
atmosphere
above the seal -- -- -- --
Air_08 -- -- -- --
Air_09
Fourth Air
vaccutainer
taking from
the
atmosphere
above the seal -- -- -- --
Air_10 -- -- -- --
Air_11
Fifth Air
vaccutainer
taking from
the
atmosphere
above the seal -- -- -- --
Air_12 -- -- -- --
Air_13
Sixth Air
vaccutainer
taking from
the
atmosphere
above the seal 3.43 200
191.666667 3.623072462
Air_14 3.431 183
Air_15 3.43 192
Air_16
Seventh Air
vaccutainer
taking from
the
atmosphere
above the seal -- -- -- --
Air_17 -- -- -- --
A1.5_03
Sample taken
from A1.5
vaccutainer 3.432 796
772 2.710939059

82
A1.5_04 3.433 745
A1.5_05 3.433 775
A3_03
Sample taken
from A3
vaccutainer 3.435 725 759.333333 4.897350402
A3_04 3.433 742
A3_05 3.432 811
B1.5_01
Sample taken
from B1.5
vaccutainer 3.436 857 893.333333 3.004136897
B1.5_02 3.432 902
B1.5_03 3.435 921
B3_01
Sample taken
from B3
vaccutainer 3.435 614 593.333333 2.497315817
B3_02 3.437 580
B3_03 3.437 586
D1.5_01
Sample taken
from D1.5
vaccutainer 3.435 1846 1840 1.701934664
D1.5_02 3.436 1799
D1.5_03 3.438 1875
D3_01
Sample taken
from D3
vaccutainer 3.438 2755 2817.66667 1.610635034
D3_02 3.438 2861
D3_03 3.434 2837
E1.5_01
Sample taken
from E1.5
vaccutainer 3.439 853 862 2.077397683
E1.5_02 3.438 887
E1.5_03 3.437 846
E3_01
Sample taken
from E3
vaccutainer 3.434 3557 3544.66667 0.658131586
E3_02 3.437 3512
E3_03 3.439 3565
F1.5_01
Sample taken
from F1.5
vaccutainer 3.437 461 472.666667 1.847080515
F1.5_02 3.437 475
F1.5_03 3.436 482
F3_01
Sample taken
from F3
vaccutainer 3.437 1306 1349.33333 3.064237056
F3_02 3.439 1405
F3_03 3.441 1337
3/14/2014 A1.5_01
Sample taken
from A1.5
vaccutainer 3.406 890 888.666667 0.212185081
A1.5_02 3.409 886
A1.5_03 3.404 890

83
A3_01
Sample taken
from A3
vaccutainer 3.405 724 713 2.083429636
A3_02 3.402 723
A3_05 3.408 692
B1.5_01
Sample taken
from B1.5
vaccutainer 3.41 990 978.333333 1.544159345
B1.5_04 3.41 988
B1.5_03 3.409 957
B3_01
Sample taken
from B3
vaccutainer 3.405 399 408 1.801095399
B3_05 3.412 408
B3_04 3.413 417
D1.5_01
Sample taken
from D1.5
vaccutainer 3.419 396 386 1.844054966
D1.5_02 3.421 380
D1.5_03 3.421 382
D3_05
Sample taken
from D3
vaccutainer 3.417 448 439.333333 1.502199535
D3_02 3.421 438
D3_03 3.421 432
E1.5_04
Sample taken
from E1.5
vaccutainer 3.422 3637 3662 0.482861358
E1.5_02 3.42 3674
E1.5_03 3.416 3675
E3_01
Sample taken
from E3
vaccutainer 3.421 1064 1061.33333 0.193605967
E3_02 3.422 1061
E3_03 3.422 1059
F1.5_01
Sample taken
from F1.5
vaccutainer 3.418 378 380.333333 0.690097097
F1.5_04 3.425 384
F1.5_03 3.424 379
F3_01
Sample taken
from F3
vaccutainer -- -- -- --
F3_02 -- -- -- --
3/28/2014 A1.5_01
Sample taken
from A1.5
vaccutainer -- -- -- --
A1.5_02 -- -- -- --
A3_01
Sample taken
from A3
vaccutainer -- -- -- --
A3_02 -- -- -- --

84
B1.5_01
Sample taken
from B1.5
vaccutainer -- -- -- --
B1.5_02 -- -- -- --
B3_01
Sample taken
from B3
vaccutainer 3.435 432 431.333333 1.141021875
B3_02 3.435 437
B3_05 3.437 425
D1.5_01
Sample taken
from D1.5
vaccutainer -- -- -- --
D1.5_02 -- -- -- --
D3_01
Sample taken
from D3
vaccutainer -- -- -- --
D3_02 -- -- -- --
E1.5_01
Sample taken
from E1.5
vaccutainer -- -- -- --
E1.5_02 -- -- -- --
F1.5_01
Sample taken
from F1.5
vaccutainer -- -- -- --
F1.5_02 -- -- -- --
F3_01
Sample taken
from F3
vaccutainer -- -- -- --
F3_02 -- -- -- --
F3_01
Sample taken
from F3
vaccutainer -- -- -- --
F3_02 -- -- -- --
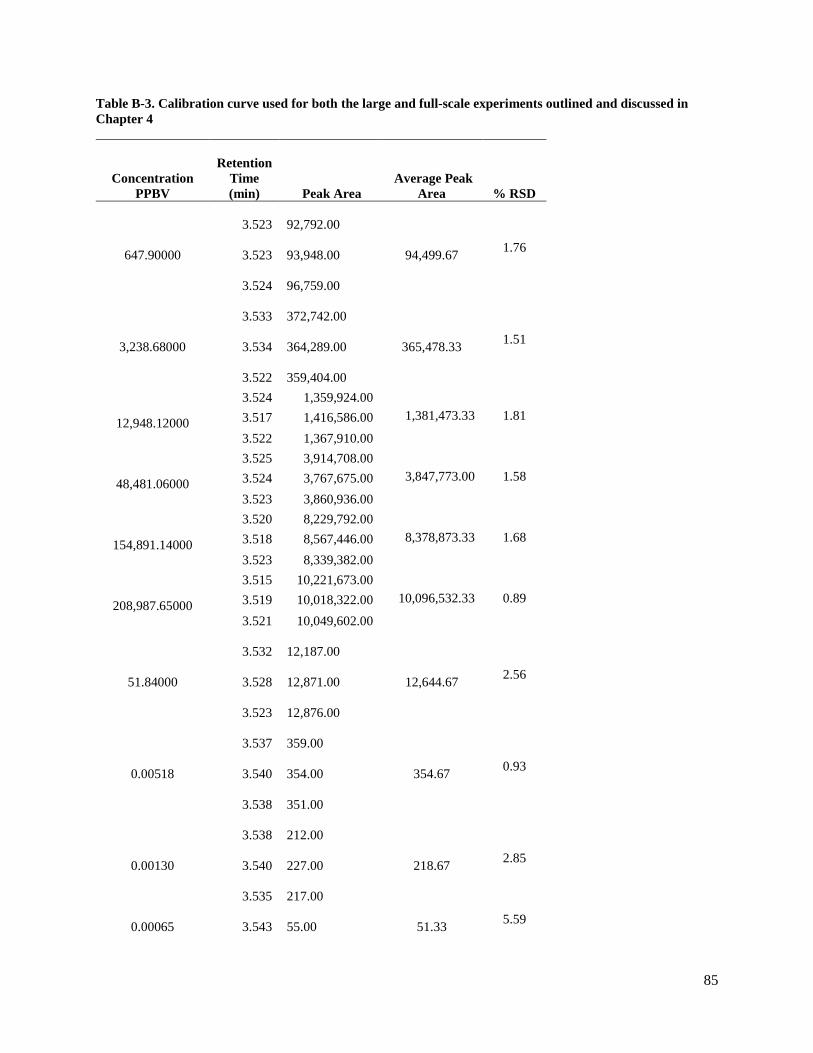
85
Table B-3. Calibration curve used for both the large and full-scale experiments outlined and discussed in
Chapter 4
Concentration
PPBV
Retention
Time
(min) Peak Area
Average Peak
Area % RSD
647.90000
3.523
92,792.00
94,499.67 1.76
3.523
93,948.00
3.524
96,759.00
3,238.68000
3.533
372,742.00
365,478.33 1.51
3.534
364,289.00
3.522
359,404.00
12,948.12000
3.524 1,359,924.00
1,381,473.33 1.81 3.517 1,416,586.00
3.522 1,367,910.00
48,481.06000
3.525 3,914,708.00
3,847,773.00 1.58 3.524 3,767,675.00
3.523 3,860,936.00
154,891.14000
3.520 8,229,792.00
8,378,873.33 1.68 3.518 8,567,446.00
3.523 8,339,382.00
208,987.65000
3.515 10,221,673.00
10,096,532.33 0.89 3.519 10,018,322.00
3.521 10,049,602.00
51.84000
3.532
12,187.00
12,644.67 2.56
3.528
12,871.00
3.523
12,876.00
0.00518
3.537
359.00
354.67 0.93
3.540
354.00
3.538
351.00
0.00130
3.538
212.00
218.67 2.85
3.540
227.00
3.535
217.00
0.00065 3.543
55.00
51.33 5.59

86
3.543
48.00
3.541
51.00
Related Documents