Welcome message from author
This document is posted to help you gain knowledge. Please leave a comment to let me know what you think about it! Share it to your friends and learn new things together.
Transcript
The aspects of Total Quality Management in
higher education institutions
Milad Abdelnabi Salem
1
Community College of Qatar – Sebha University
Fekri Shawtari2
Community College of Qatar
Hafezali Bin Iqbal Hussain3
Taylor’s University, Business School, Kuala Lumpur, Malaysia
Mohd Farid Shamsudin4
University Kuala Lumpur, Business School, Level 3, 1016, Jalan Sultan
Ismail, Kuala Lumpur, Malaysia
Abstract
This study aims to identify the most important aspects of total
quality management in the Community College of Qatar (CCQ) and
attention paid by decision-makers to these aspects. The study adopted
a quantitative approach using a self-reported questionnaire for
collecting the data from both academician and administrative staff at
CCQ (Critical Care Quarterly). The results revealed that TQM (Total
Quality Management) at CCQ could be classified into four dimensions
named quality management system recognition, stakeholders focus,
leadership and vision, and measuring and continues improvement. In
conclusion, the descriptive statistics of the data shows that these
aspects have gained good attention from the management of CCQ.
Keywords: Total Quality Management, Education, Statistics.
Opción, Año 34, Especial No.16 (2018): 638-652
ISSN 1012-1587/ISSNe: 2477-9385
Recibido: 04-12--2017 Aceptado: 10-03-2018
Los aspectos de la Gestión de Calidad Total en
instituciones de educación superior
Resumen
Este estudio tiene como objetivo identificar los aspectos más
importantes de la gestión de la calidad total en el Community College
of Qatar (CCQ) y la atención que los responsables de la toma de
decisiones prestan a estos aspectos. El estudio adoptó un enfoque
cuantitativo utilizando un cuestionario autoinformado para recopilar
datos tanto del personal académico como del personal administrativo
en CCQ (Cuidados Trimestrales). Los resultados revelaron que la
TQM (Gestión de calidad total) en CCQ podría clasificarse en cuatro
dimensiones denominadas reconocimiento del sistema de gestión de
calidad, enfoque de los interesados, liderazgo y visión, y medición y
mejora continua. En conclusión, las estadísticas descriptivas de los
datos muestran que estos aspectos han recibido una buena atención por
parte de la gerencia de CCQ.
Palabras clave: Gestión de la Calidad Total, Educación,
Estadística.
1. INTRODUCTION
The concept of quality in education is quite new and until now not
a well-developed field of study. There is no unified terminology and the
term quality of education is understood in different ways by different
authors (Shauchenka & Busłowska, 2010). TQM is a systematic quality
improvement approach for firm-wide management for the purpose of
improving performance in terms of quality, productivity, customer
satisfaction, and profitability (Sadikoglu & Zehir, 2010). Thus, the
concept has attracted the attention of many researchers from different
639 Abdelnabi Salem et al.
Opción, Año 34, Especial No.16(2018):638-652
areas. The focus of these researches was on using TQM as a tool for
maintaining competitive advantage and ensuring the overall effectiveness
in the manufacturing sector (Alsughayir, 2014). However, there was still a
call for its applicability to work in educational institutions. The literature
indicates that there is a need for using TQM in educational institutions
(Asad et al., 2018). Consequently, the concept has made its way into
higher education institutions (HEIs) in many developed countries.
The success of several significant companies in applying TQM
principles as a way out of the crisis, stimulated higher educational
institutions to follow similar management strategies (Adedoyin and
Okere, 2017; Yanga & Yenb, 2016). For example, in the US, the success
of implementing TQM in large industrial corporations has influenced
higher educational institutions to adopt it. They were influenced by the
critical state of education in the 1980s in terms of student grades, funding,
and complaints from employers and parents. Thus, many higher
educational institutions started implementing TQM in the early 1990s and
have been successful. In UK higher education, the progress of TQM is
rather slow, with examples represented by only a few new universities.
However, these institutions have benefited from a TQM process similar to
their counterparts in the US, such as improved student performance, better
services, reduced costs and customer satisfaction (Alhawiti and
Abdelhamid, 2017). Additionally, the empirical studies of investigating
the role of TQM in both educational and industrial sectors have mainly
been conducted in industrialized countries such as Western Europe, USA,
and Australia. Less attention has been given to the developing countries,
in particular to the Arab region. Therefore, this study helps in providing a
The aspects of Total Quality Management 640
in higher education institutions
picture of the actual practices at one of the fastest economies in the Arabic
region. Thus, the paper aims to answer the following questions.
Q1: what are the main aspects of TQM in the community college
of Qatar?
Q2: what are the levels of implementing the practices of TQM in
the community college of Qatar?
2. EDUCATIONAL INSTITUTIONS IN QATAR
Qatar is considered one of the fast developing regions, which are
quickly growing commercial and industrial hubs within emerging
economies that have achieved high economic growth rate. The
government of Qatar published in 2008 Qatar National Vision 2030,
which reflect the agenda of transforming the state into an advanced
country. Human capital development was a part of the economic progress
of the vision. The Human Development Index (HDI) for Qatar rose by
0.64% annually and is recorded at 0.910 by 2009, which gives Qatar a
rank of 33rd out of 182 countries (Klugman, 2009). the literacy rate of the
country rose from 80.80 % in 2004 to 93.1% in 2009, and the country per
capita education expenditure rose from $66 in 2004 to $3460 in 2009
(Khodr, 2011). The sector of higher education in Qatar has experienced
significant reforms to establish itself as a regional hub and prepare its own
citizens for higher education. These reforms reflect Qatar’s desire to
641 Abdelnabi Salem et al.
Opción, Año 34, Especial No.16(2018):638-652
harness its present and significant economic wealth and global orientation
to drive a future knowledge-based economy (Qureshi et al., 2017).
3. METHODOLOGY
The study adopts a survey questionnaire design using an email
survey. The email survey requires that the respondents have e-mail access
and the researcher has access to the targeted network (Hair, et al., 2007).
Interestingly, all CCQ staff have vialed and accessible email addresses.
Therefore, the email survey is an appropriate for this study. The
questionnaire is adopted from previous related literature to measure the
variables of this study. It contains two sections, the first section represents
the sample characteristics (Gender, position, experience and
qualification), while the second section covers the items of TQM. Total
quality management implementation will be measured using 64 items
adapted from (Almurshidee, 2017). The respondents are asked to rate the
extent to which they agree/disagree with the statements of the
questionnaire on five-point Likert scale ranged from 1 (Strongly disagree),
2 (Disagree), 3 (Neutral), 4 (Agree) and 5 (Strongly agree). Additionally,
the study uses exploratory factor analysis to identify the most important
factors that create the TQM practices. Factor analysis is the most
commonly used test to determine the construct validity of the data
(Bhattacherjee, 2012). It takes a large set of variables and looks for a way
the data may be reduced or summarized using a smaller set of factors or
components (Pallant, 2011).
The aspects of Total Quality Management 642
in higher education institutions
4. RESULTS
Analyzing the data requires the data should be detected to
ensure its ability to reflect the phenomena under study. Screening the
data considers aspects such as the response rate, non-response bias,
and outliers. All previous tests have conducted and data validity and
reliability are confirmed. The following sections discuss the results of
analyzing the data.
4.1. Factor analysis for TMQ practices
Table 1 below illustrates the results of factor analysis. For the
purpose of determining whether factor analysis was appropriate for
TQM, KMO and Bartlett tests were first applied. The results in Table
1 indicate that the KMO measure for the items has a value of 0.850
which indicated a meritorious adequacy Hair et al. (2010), and thus
was appropriate for using factor analysis. Moreover, the value of
Bartlett sphericity was also very large (3438.500) and its associated
significance level is very low (0.000). Both the KMO measure and the
Bartlett test of sphericity results showed that the items used in the
instrument obviously met the conditions for factor analysis. This
meant that factor analysis could be applied for the independent
variable (Watson, 1998).
643 Abdelnabi Salem et al.
Opción, Año 34, Especial No.16(2018):638-652
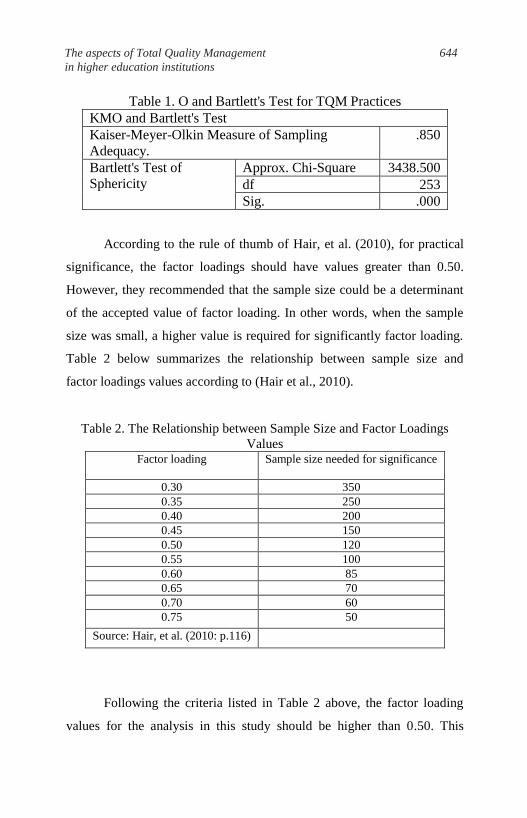
Table 1. O and Bartlett's Test for TQM Practices
KMO and Bartlett's Test
Kaiser-Meyer-Olkin Measure of Sampling
Adequacy.
.850
Bartlett's Test of
Sphericity
Approx. Chi-Square 3438.500
df 253
Sig. .000
According to the rule of thumb of Hair, et al. (2010), for practical
significance, the factor loadings should have values greater than 0.50.
However, they recommended that the sample size could be a determinant
of the accepted value of factor loading. In other words, when the sample
size was small, a higher value is required for significantly factor loading.
Table 2 below summarizes the relationship between sample size and
factor loadings values according to (Hair et al., 2010).
Table 2. The Relationship between Sample Size and Factor Loadings
Values Factor loading Sample size needed for significance
0.30 350
0.35 250
0.40 200
0.45 150
0.50 120
0.55 100
0.60 85
0.65 70
0.70 60
0.75 50
Source: Hair, et al. (2010: p.116)
Following the criteria listed in Table 2 above, the factor loading
values for the analysis in this study should be higher than 0.50. This
The aspects of Total Quality Management 644
in higher education institutions
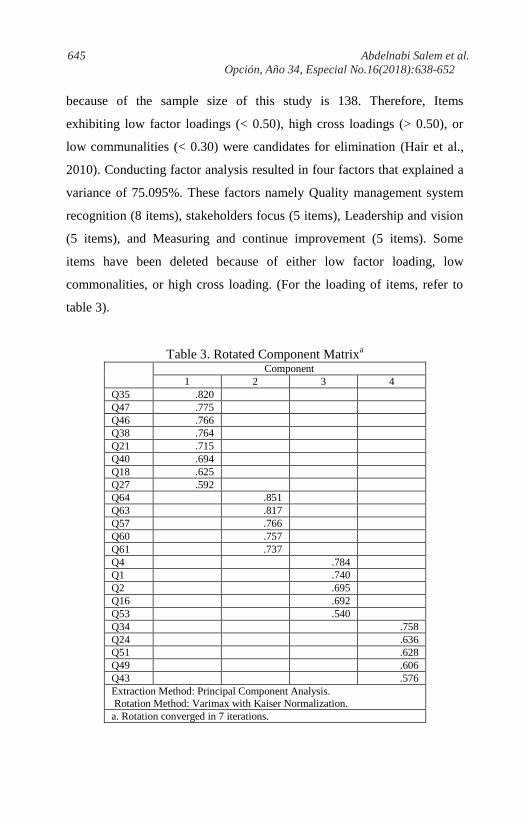
because of the sample size of this study is 138. Therefore, Items
exhibiting low factor loadings (< 0.50), high cross loadings (> 0.50), or
low communalities (< 0.30) were candidates for elimination (Hair et al.,
2010). Conducting factor analysis resulted in four factors that explained a
variance of 75.095%. These factors namely Quality management system
recognition (8 items), stakeholders focus (5 items), Leadership and vision
(5 items), and Measuring and continue improvement (5 items). Some
items have been deleted because of either low factor loading, low
commonalities, or high cross loading. (For the loading of items, refer to
table 3).
Table 3. Rotated Component Matrixa
Component
1 2 3 4
Q35 .820
Q47 .775
Q46 .766
Q38 .764
Q21 .715
Q40 .694
Q18 .625
Q27 .592
Q64 .851
Q63 .817
Q57 .766
Q60 .757
Q61 .737
Q4 .784
Q1 .740
Q2 .695
Q16 .692
Q53 .540
Q34 .758
Q24 .636
Q51 .628
Q49 .606
Q43 .576
Extraction Method: Principal Component Analysis.
Rotation Method: Varimax with Kaiser Normalization.
a. Rotation converged in 7 iterations.
645 Abdelnabi Salem et al.
Opción, Año 34, Especial No.16(2018):638-652
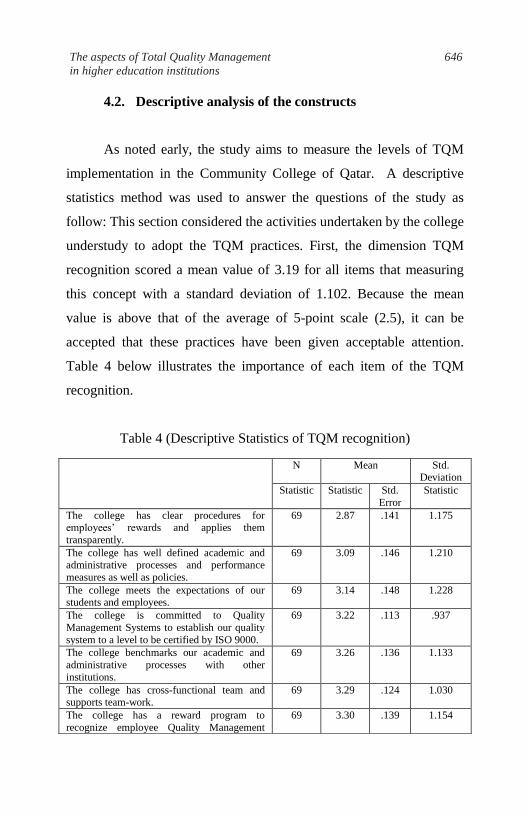
4.2. Descriptive analysis of the constructs
As noted early, the study aims to measure the levels of TQM
implementation in the Community College of Qatar. A descriptive
statistics method was used to answer the questions of the study as
follow: This section considered the activities undertaken by the college
understudy to adopt the TQM practices. First, the dimension TQM
recognition scored a mean value of 3.19 for all items that measuring
this concept with a standard deviation of 1.102. Because the mean
value is above that of the average of 5-point scale (2.5), it can be
accepted that these practices have been given acceptable attention.
Table 4 below illustrates the importance of each item of the TQM
recognition.
Table 4 (Descriptive Statistics of TQM recognition)
N Mean Std. Deviation
Statistic Statistic Std.
Error
Statistic
The college has clear procedures for employees’ rewards and applies them
transparently.
69 2.87 .141 1.175
The college has well defined academic and administrative processes and performance
measures as well as policies.
69 3.09 .146 1.210
The college meets the expectations of our students and employees.
69 3.14 .148 1.228
The college is committed to Quality
Management Systems to establish our quality
system to a level to be certified by ISO 9000.
69 3.22 .113 .937
The college benchmarks our academic and
administrative processes with other
institutions.
69 3.26 .136 1.133
The college has cross-functional team and supports team-work.
69 3.29 .124 1.030
The college has a reward program to
recognize employee Quality Management
69 3.30 .139 1.154
The aspects of Total Quality Management 646
in higher education institutions
n = 69. Five -point Likert scale, in which 1 means strongly disagree,
and 5 means strongly agree
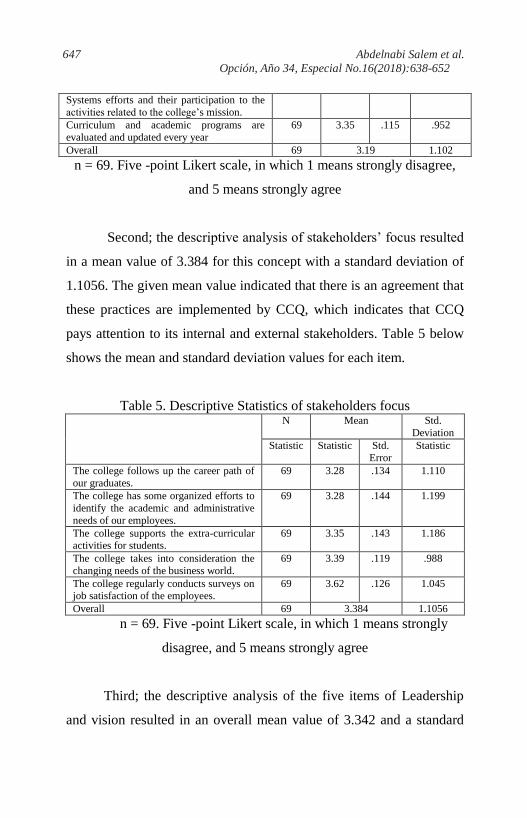
Second; the descriptive analysis of stakeholders’ focus resulted
in a mean value of 3.384 for this concept with a standard deviation of
1.1056. The given mean value indicated that there is an agreement that
these practices are implemented by CCQ, which indicates that CCQ
pays attention to its internal and external stakeholders. Table 5 below
shows the mean and standard deviation values for each item.
Table 5. Descriptive Statistics of stakeholders focus N Mean Std.
Deviation
Statistic Statistic Std.
Error
Statistic
The college follows up the career path of
our graduates.
69 3.28 .134 1.110
The college has some organized efforts to
identify the academic and administrative
needs of our employees.
69 3.28 .144 1.199
The college supports the extra-curricular activities for students.
69 3.35 .143 1.186
The college takes into consideration the
changing needs of the business world.
69 3.39 .119 .988
The college regularly conducts surveys on job satisfaction of the employees.
69 3.62 .126 1.045
Overall 69 3.384 1.1056
n = 69. Five -point Likert scale, in which 1 means strongly
disagree, and 5 means strongly agree
Third; the descriptive analysis of the five items of Leadership
and vision resulted in an overall mean value of 3.342 and a standard
Systems efforts and their participation to the
activities related to the college’s mission.
Curriculum and academic programs are
evaluated and updated every year
69 3.35 .115 .952
Overall 69 3.19 1.102
647 Abdelnabi Salem et al.
Opción, Año 34, Especial No.16(2018):638-652
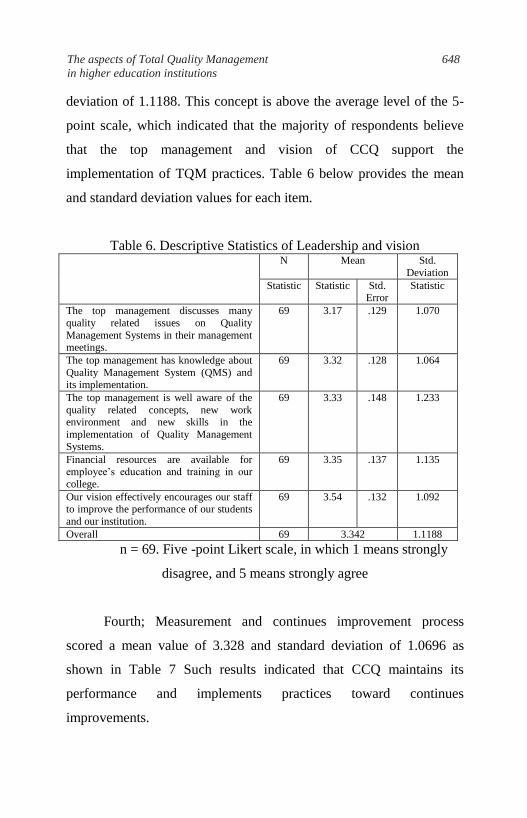
deviation of 1.1188. This concept is above the average level of the 5-
point scale, which indicated that the majority of respondents believe
that the top management and vision of CCQ support the
implementation of TQM practices. Table 6 below provides the mean
and standard deviation values for each item.
Table 6. Descriptive Statistics of Leadership and vision N Mean Std.
Deviation
Statistic Statistic Std. Error
Statistic
The top management discusses many
quality related issues on Quality
Management Systems in their management meetings.
69 3.17 .129 1.070
The top management has knowledge about
Quality Management System (QMS) and its implementation.
69 3.32 .128 1.064
The top management is well aware of the
quality related concepts, new work environment and new skills in the
implementation of Quality Management
Systems.
69 3.33 .148 1.233
Financial resources are available for employee’s education and training in our
college.
69 3.35 .137 1.135
Our vision effectively encourages our staff to improve the performance of our students
and our institution.
69 3.54 .132 1.092
Overall 69 3.342 1.1188
n = 69. Five -point Likert scale, in which 1 means strongly
disagree, and 5 means strongly agree
Fourth; Measurement and continues improvement process
scored a mean value of 3.328 and standard deviation of 1.0696 as
shown in Table 7 Such results indicated that CCQ maintains its
performance and implements practices toward continues
improvements.
The aspects of Total Quality Management 648
in higher education institutions
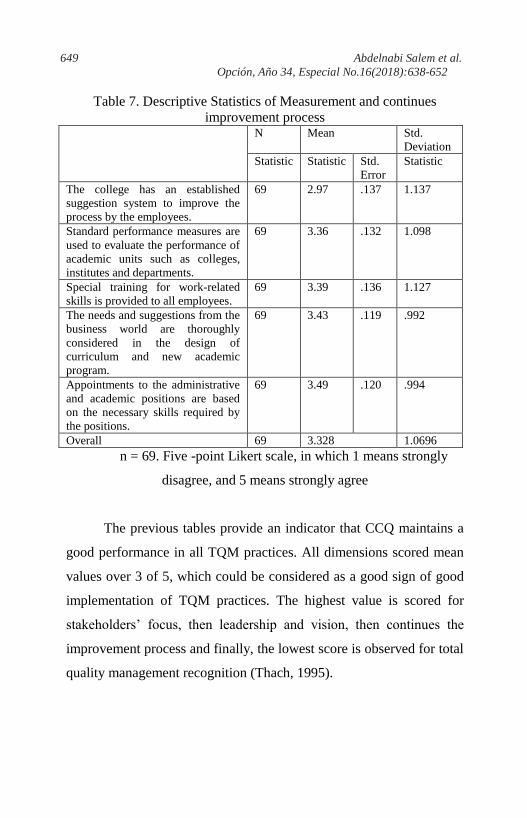
Table 7. Descriptive Statistics of Measurement and continues
improvement process N Mean Std.
Deviation
Statistic Statistic Std.
Error
Statistic
The college has an established
suggestion system to improve the
process by the employees.
69 2.97 .137 1.137
Standard performance measures are
used to evaluate the performance of
academic units such as colleges,
institutes and departments.
69 3.36 .132 1.098
Special training for work-related
skills is provided to all employees.
69 3.39 .136 1.127
The needs and suggestions from the
business world are thoroughly
considered in the design of
curriculum and new academic
program.
69 3.43 .119 .992
Appointments to the administrative
and academic positions are based
on the necessary skills required by
the positions.
69 3.49 .120 .994
Overall 69 3.328 1.0696
n = 69. Five -point Likert scale, in which 1 means strongly
disagree, and 5 means strongly agree
The previous tables provide an indicator that CCQ maintains a
good performance in all TQM practices. All dimensions scored mean
values over 3 of 5, which could be considered as a good sign of good
implementation of TQM practices. The highest value is scored for
stakeholders’ focus, then leadership and vision, then continues the
improvement process and finally, the lowest score is observed for total
quality management recognition (Thach, 1995).
649 Abdelnabi Salem et al.
Opción, Año 34, Especial No.16(2018):638-652
5. CONCLUSION
This paper studied the current practices of TQM in Community
College of Qatar. The previous literature showed that there is a lack of
studies consider the practices of TQM in an educational field.
Although there are few studies, these studies focus mainly on
developed countries. There is no evidence on the actual practices of
TQM in educational institutions in Qatar. Therefore, this study
represents the first study consider this issue in Qatar. The study
concluded that the main practices implemented in CCQ regarding
TQM management are quality management system recognition,
stakeholders focus, Leadership and vision, and Measuring and
continues improvement. The descriptive statistics show that these
practices have received a considerable attention from the decision
makers of CCQ. Therefore, it provides a good sign of the educational
system adopted by the college. This could be an indicator that CCQ
might gain good advantages from implementing such practices.
Although previous contributions of this paper, it suffers from some
limitations. First, the study used self-reported questionnaire which
might lead to desirability bias. Second, it focuses on only one
institution, which makes it difficult to generalize the results of the
study. In addition to the contributions, the researchers recommended
future studies to compare the result of this study with other studies in a
similar context. Additionally, there is a need to study the effects of
implementing TQM practices on aspects such as moral motivations,
satisfaction and individual and organizational performance.
The aspects of Total Quality Management 650
in higher education institutions
REFERENCES
ADEDOYIN, O., & OKERE, E. 2017. The Significance of Inclusion
Concept in the Educational System as Perceived by Junior
Secondary School Teachers: Implications for Teacher Training
Programmes in Botswana. Global Journal of Social Sciences
Studies, Vol. 3, No 1: 13-28. South Africa.
ALHAWITI, M., & ABDELHAMID, Y. 2017. A Personalized e-
Learning Framework. Journal of Education and e-Learning
Research, Vol. 4, No 1: 15-21. USA.
ALMURSHIDEE, K. 2017. The Implementation of TQM in Higher
Education Institutions in Saudi Arabia: Marketing
Prospective. Global Journal of Management and Business
Research. USA.
ALSUGHAYIR, A. 2014. Does practicing total quality management
affect employee job satisfaction in Saudi Arabian
organizations? European Journal of Business and Management,
Vol. 6, No 3: 169-75. USA.
ASAD, M., AHMAD, I., HAIDER, S., & SALMAN, R. 2018. A Crital
Review of Islamic and Conventional Banking in Digital Era: A
Case of Pakistan. International Journal of Engineering &
Technology, Vol. 7, pp. 57-59. UAE.
BHATTACHERJEE, A. 2012. Social Science Research: Principles,
Methods, and Practices. USF Open Access Textbooks Collection.
Germany.
HAIR, J., JR., BLACK, W., BABIN, B., ANDERSEN, R., & TATHAM,
R. 2010. Mutilvariate data analysis (7th Ed.). Upper Saddle
River, NJ: Pearson Prentice Hall. USA.
HAIR, J., MONEY, A., SAMOUEL, P., & PAGE, M. 2007. Research
Methods for Business. WestSussex: John Wiley & Sons Ltd.
USA.
KHODR, H. 2011. The dynamics of international education in Qatar:
Exploring the policy drivers behind the development of
Education City. Journal of Emerging Trends in Educational
Research and Policy Studies, Vol. 2, No 6: 514-525. USA.
KLUGMAN, J. 2009. Human development report 2009. Overcoming
barriers: Human mobility and development. USA.
651 Abdelnabi Salem et al.
Opción, Año 34, Especial No.16(2018):638-652
PALLANT, J. 2011. SPSS Survival Manual: A Step by Step Guide to
Data Analysis Using SPSS for Windows (4rd Ed.). England:
Maidenhead: Open University Press. UK.
QURESHI, S., VISHNUMOLAKALA, V., SOUTHAM, D., &
TREAGUST, D. 2017. Inquiry-based chemistry education in a
high-context culture: a Qatari case study. International Journal
of Science and Mathematics Education, Vol. 15, No 6: 1017-1038.
USA.
SADIKOGLU, E., & ZEHIR, C. 2010. Investigating the effects of
innovation and employee performance on the relationship
between total quality management practices and firm
performance: An empirical study of Turkish firms. International journal of production economics, Vol. 127, N
o 1: 13-
26. Germany.
SHAUCHENKA, H., & BUSŁOWSKA, E. 2010. Methods and tools for
higher education service quality assessment (survey). Zeszyty
Naukowe Politechniki Białostockiej. Informatics, pp. 87-102.
Poland.
THACH, L. 1995. Using electronic mail to conduct survey research.
Educational Technology, Vol. 35, No 2: 27-31. USA.
WATSON, S. 1998. A primer in survey research. Journal of Continuing
Higher Education, Vol. 46, No 1: 31-40. UK.
YANGA, J., & YENB, Y. 2016. College Students' Perspectives of E-
Learning System Use in High Education. Asian Journal of
Education and Training, Vol. 2, No 2: 53-62. USA.
The aspects of Total Quality Management 652
in higher education institutions
UNIVERSIDAD
DEL ZULIA
Revista de Ciencias Humanas y Sociales
Año 34, Especial N° 16, 2018
Esta revista fue editada en formato digital por el personal de la Oficina de
Publicaciones Científicas de la Facultad Experimental de Ciencias,
Universidad del Zulia.
Maracaibo - Venezuela
www.luz.edu.ve
www.serbi.luz.edu.ve
produccioncientifica.luz.edu.ve
Related Documents