2006 © All Rights Reserved to CSIS. Center for Strategic and International Studies Arleigh A. Burke Chair in Strategy 1800 K Street, N.W. • Suite 400 • Washington, DC 20006 Phone: 1 (202) 775-3270 • Fax: 1 (202) 457-8746 Web: http://www.csis.org/burke The Asian Conventional Military Balance in 2006: Total and Sub-Regional Balances: Northeast Asia, Southeast Asia, and South Asia Anthony H. Cordesman Martin Kleiber Arleigh A. Burke Chair in Strategy Researcher [email protected] [email protected] Working Draft for Review and Comment Revised, June 26, 2006

Welcome message from author
This document is posted to help you gain knowledge. Please leave a comment to let me know what you think about it! Share it to your friends and learn new things together.
Transcript

2006 © All Rights Reserved to CSIS.
Center for Strategic and International StudiesArleigh A. Burke Chair in Strategy1800 K Street, N.W. • Suite 400 • Washington, DC 20006
Phone: 1 (202) 775-3270 • Fax: 1 (202) 457-8746Web: http://www.csis.org/burke
The Asian Conventional MilitaryBalance in 2006:
Total and Sub-Regional Balances: Northeast Asia,Southeast Asia, and South Asia
Anthony H. Cordesman Martin KleiberArleigh A. Burke Chair in Strategy Researcher
[email protected] [email protected]
Working Draft for Review and CommentRevised, June 26, 2006

Cordesman & Kleiber: The Asian Military Balance 6/26/06 Page ii
2006 © All Rights Reserved to CSIS.
Introduction
The rise of China as a major power has triggered a new debate over the military balance in Asia,but it is only one of the trends shaping regional military forces. Taiwan’s faltering militarydevelopment has helped destabilize the Taiwan Straits. Japan is reasserting its strategic role inthe region, causing tension with both China and South Korea. North Korea’s persistence increating nuclear forces is changing the balance on the Korean Peninsula, as are cuts in US forces.The shift in US forces from Okinawa to Guam, and increased US reliance on long-range strikeforces is also affecting the balance.
There are fewer signs of significant shifts in the balance in Southeast Asia. The major change inthe threat has been the emergence of transnational threats from neo-Salafi Islamist extremists,and continuing internal ethnic, sectarian, and tribal tensions. The main concern is internalsecurity and not the military balance.
In the case of South Asia, Indian and Pakistan continue to build-up their nuclear and missileforces, and India is seeking to expand its strategic reach in the Indian Ocean area. Kashmirremains a potential military fault line. Once again, however, the emergence of transnationalthreats from neo-Salafi Islamist extremists, and continuing internal ethnic, sectarian, and tribaltensions dominates the security problems in the region. Like the rest of Asia, internal securityhas become a dominant concern.
The following analysis of quantitative force strength and trends can only address some of theseissues. It focuses on conventional and nuclear forces, military spending, and other quantifiableaspects of the military balance. As such, it can only touch on a few aspects of force quality, andcannot begin to address the problem of internal security. There is no way to portray the relativestrength of ideology and religion, and counts of the manpower strength of non-state actors arevirtually meaningless.
It is important, however, to look beyond debates over strategy and possible intentions and toconsider those facts that can actually be measured. Far too often analysts pick key trends out ofcontext, and exaggerate the overall presence or build-up of opposing military forces. Data onmilitary spending are taken out of context, as are arms purchases that may introduce importantnew military technologies and capabilities but only have a limited impact on overall forcemodernization.
Accordingly, the tables and charts that follow are not intended to provide a comprehensivepicture of military capability or effort. They are only intended to be a tool that providesperspective. It is also important to recognize that they do have significant uncertainties. Thesources they are drawn from are unclassified, and have many gaps and contradictions. Theauthors have had to extrapolate in some cases, and use a mix of sources in others. The data andtrends shown are almost certainly broadly correct, but there is no way to create such an analysisthat is precise and certain.
Cordesman & Kleiber: The Asian Military Balance 6/26/06 Page iii
2006 © All Rights Reserved to CSIS.
List of Tables and Charts
TRENDS IN MILITARY EXPENDITURES............................................................................................................6
Figure 1: World Military Expenditures: 1999-2005...................................................................................................7Figure 2: World Military Expenditures: 1999-2005...................................................................................................8Figure 3: Asian Military Expenditures: 1999-2005 ..................................................................................................9Figure 4: Asian Military Expenditures: 1999-2005 ................................................................................................10Figure 5: Military Expenditures by the Major Asian Powers: 1999-2005 ...............................................................11Figure 6: Military Expenditures by the Major Asian Powers: 1999-2005 ..............................................................12
THE OVERALL REGIONAL MILITARY BALANCE .......................................................................................13
Force Quantity versus Force Quality: The Advantages of New Tactics, Technology, and Training in ConventionalWarfare ....................................................................................................................................................................13The Vulnerabilities of Less Advanced Powers ........................................................................................................15Limits to Conventional Military Forces and the Challenge of Asymmetric Warfare ..............................................18Threat of Asymmetric Innovation............................................................................................................................20The Meaning of Quantitative Comparisons .............................................................................................................23Figure 7: Asian Military Forces in 2006: Part 1......................................................................................................25Figure 7: Asian Military Forces in 2006: Part 2.......................................................................................................26Figure 8: US Forces in the Pacific in 2006: Part 1...................................................................................................27Figure 8: US Forces in the Pacific in 2006: Part 2..................................................................................................28Figure 9: The Nuclear Dimension: Part 1 ...............................................................................................................29Figure 9: The Nuclear Dimension: Part 2 ...............................................................................................................30
THE MAJOR ASIAN POWERS..............................................................................................................................31
Figure 10: Comparative Military Strength of Major Asian Powers and Global Power Blocs in 2006 ....................32Figure 11: Total Military Manpower in Selected Major Military Powers: 2006.....................................................33Figure 12: Asian Military Manpower by Service: 2006..........................................................................................34Figure 13: Asian Military Manpower in Key Powers by Service: 2006 .................................................................35Figure 14: Manpower in Key Asian Powers: 1999-2006.........................................................................................36Figure 15: Asian Main Battle Tanks: 2006 ..............................................................................................................37Figure 16: Main Battle Tanks in Key Asian Powers: 1999-2006.............................................................................38Figure 17: Asian Armored Fighting Vehicles: 2006 ................................................................................................39Figure 18: Asian Land Weapons in Key Powers: 2006 ...........................................................................................40Figure 19: Asian Artillery Strength: 2006...............................................................................................................41Figure 20: Asian Fixed and Rotary Wing Combat Aircraft: 2006 ..........................................................................42Figure 21: Asian Fixed Wing Combat Aircraft: 2006.............................................................................................43Figure 22: Asian Rotary Wing Combat Aircraft: 2006 ...........................................................................................44Figure 23: Fixed Winged Combat Aircraft* in Key Asian Powers: 1999-2006 .....................................................45Figure 24: Asian Naval Combat Ships: 2006..........................................................................................................46Figure 25: Asian Naval Combat Ships in Key Powers: 2006 .................................................................................47Figure 26: Western Naval Combat Ships Affecting the Asian Balance: 2006........................................................48
NORTHEAST ASIAN MILITARY BALANCE.....................................................................................................49
Figure 27: Northeast Asian Military Forces in 2006: Part 1 ...................................................................................50Figure 27: Northeast Asian Military Forces in 2006: Part 2 ...................................................................................51Figure 28: Northeast Asian Military Manpower in Key Powers: 2006...................................................................52Figure 29: Northeast Asian Main Battle Tanks: 2006.............................................................................................53Figure 30: Northeast Asian Modern Main Battle Tanks versus Total Holdings: 2006 ...........................................54Figure 31: Northeast Asian Armored Fighting Vehicles: 2006...............................................................................55Figure 32: Northeast Asian Modern AFVs (MBTs, APCs, AIFVs) versus Total Holdings of Other ArmoredVehicles: 2006 ........................................................................................................................................................56Figure 33: Northeast Asian Artillery Weapons in Key Powers: 2006 ....................................................................57

Cordesman & Kleiber: The Asian Military Balance 6/26/06 Page iv
2006 © All Rights Reserved to CSIS.
Figure 34: Northeast Asian Artillery Strength: 2006 ..............................................................................................58Figure 35: Northeast Asian Modern Self-Propelled Artillery versus Total Holdings: 2006 ...................................59Figure 36: Northeast Asian Fixed and Rotary Wing Combat Aircraft: 2006..........................................................60Figure 37: Northeast Asian Fixed Wing Combat Aircraft: 2006 ............................................................................61Figure 38: Northeast Asian Modern Air Force Combat Aircraft versus Total Combat Aircraft: 2006...................62Figure 39: Northeast Asian Rotary Wing Combat Aircraft: 2006............................................................................63Figure 40: Northeast Asian Modern Attack and Armed Helicopters by Type: 2006 ..............................................64Figure 41: Northeast Asian Naval Combat Ships: 2006 ..........................................................................................65Figure 42: Northeast Asian Major Naval Combat Ships in Key Powers: 2006 ......................................................66Figure 43: Northeast Asian Modern Major Missile and ASW Surface Vessels by Type: 2006 .............................67Figure 43: Northeast Asian Modern Major Missile and ASW Surface Vessels by Type: 2006 (continued) ..........68Figure 44: Northeast Asian Submarines by Type: 2006 .........................................................................................69Figure 45: Western Naval Combat Ships Affecting the Asian Balance: 2006........................................................70
SOUTHEAST ASIAN MILITARY BALANCE .....................................................................................................71
Figure 46: Southeast Asian Military Forces in 2006: Part 1 ...................................................................................72Figure 46: Southeast Asian Military Forces in 2006: Part 2 ...................................................................................73Figure 46: Southeast Asian Military Forces in 2006: Part 3 ...................................................................................74Figure 46: Southeast Asian Military Forces in 2006: Part 4 ...................................................................................75Figure 47: Southeast Asian Military Manpower in Key Powers: 2006....................................................................76Figure 48: Southeast Asian Main Battle Tanks: 2006..............................................................................................77Figure 49: Southeast Asian Modern Main Battle Tanks versus Total Holdings: 2006 ...........................................78Figure 50: Southeast Asian Armored Fighting Vehicles: 2006...............................................................................79Figure 51: Southeast Asian Modern AFVs (MBTs, APCs, AIFVs) versus Total Holdings of Other ArmoredVehicles: 2006 ........................................................................................................................................................80Figure 52: Southeast Asian Artillery Weapons in Key Powers: 2006 ....................................................................81Figure 53: Southeast Asian Artillery Strength: 2006 ..............................................................................................82Figure 54: Southeast Asian Modern Self-Propelled Artillery versus Total Holdings: 2006 ...................................83Figure 55: Southeast Asian Fixed And Rotary Wing Combat Aircraft: 2006.........................................................84Figure 56: Southeast Asian Fixed Wing Combat Aircraft: 2006 ............................................................................85Figure 57: Southeast Asian Modern Air Force Combat Aircraft versus Total Combat Aircraft: 2006...................86Figure 58: Southeast Asian Rotary Wing Combat Aircraft: 2006...........................................................................87Figure 59: Southeast Asian Modern Attack and Armed Helicopters by Type: 2006 ..............................................88Figure 60: Southeast Asian Naval Combat Ships: 2006 .........................................................................................89Figure 61: Southeast Asian Major Naval Combat Ships in Key Powers: 2006 ......................................................90Figure 62: Southeast Asian Modern Major Missile and ASW Surface Vessels by Type: 2006 .............................91Figure 62: Southeast Asian Modern Major Missile and ASW Surface Vessels by Type: 2006 (continued) ..........92Figure 63: Southeast Asian Submarines by Type: 2006 .........................................................................................93Figure 64: Western Naval Combat Ships Affecting the Asian Balance: 2006........................................................94
THE SOUTH ASIAN MILITARY BALANCE ......................................................................................................95
Figure 65: South Asian Military Forces in 2006: Part 1 .........................................................................................96Figure 65: South Asian Military Forces in 2006: Part 2 .........................................................................................97Figure 66: South Asian Military Manpower in Key Powers: 2006.........................................................................98Figure 67: South Asian Main Battle Tanks: 2006...................................................................................................99Figure 68: South Asian Modern Main Battle Tanks versus Total Holdings: 2006 ...............................................100Figure 69: South Asian Armored Fighting Vehicles: 2006...................................................................................101Figure 70: South Asian Modern AFVs versus Total Holdings of Other Armored Vehicles: 2006.......................102Figure 71: South Asian Artillery Weapons in Key Powers: 2006.........................................................................103Figure 72: South Asian Artillery Strength: 2006 ...................................................................................................104Figure 73: South Asian Modern Self-Propelled Artillery versus Total Holdings: 2006 .......................................105Figure 74: South Asian Fixed and Rotary Wing Combat Aircraft: 2006..............................................................106Figure 75: South Asian Fixed Wing Combat Aircraft: 2006 ................................................................................107Figure 76: South Asian Modern Air Force Combat Aircraft versus Total Combat Aircraft: 2006.......................108Figure 77: South Asian Rotary Wing Combat Aircraft: 2006...............................................................................109Figure 78: South Asian Modern Attack and Armed Helicopters by Type: 2006 ..................................................110
Cordesman & Kleiber: The Asian Military Balance 6/26/06 Page v
2006 © All Rights Reserved to CSIS.
Figure 79: South Asian Naval Combat Ships: 2006..............................................................................................111Figure 80: South Asian Major Naval Combat Ships in Key Powers: 2006...........................................................112Figure 81: South Asian Modern Major Missile and ASW Surface Vessels by Type: 2006..................................113Figure 82: South Asian Submarines by Type: 2006..............................................................................................114Figure 83: Western Naval Combat Ships Affecting the Asian Balance: 2006.......................................................115
Cordesman & Kleiber: The Asian Conventional Military Balance 6/26/06 Page 6
2006 © All Rights Reserved to CSIS.
Trends in Military Expenditures
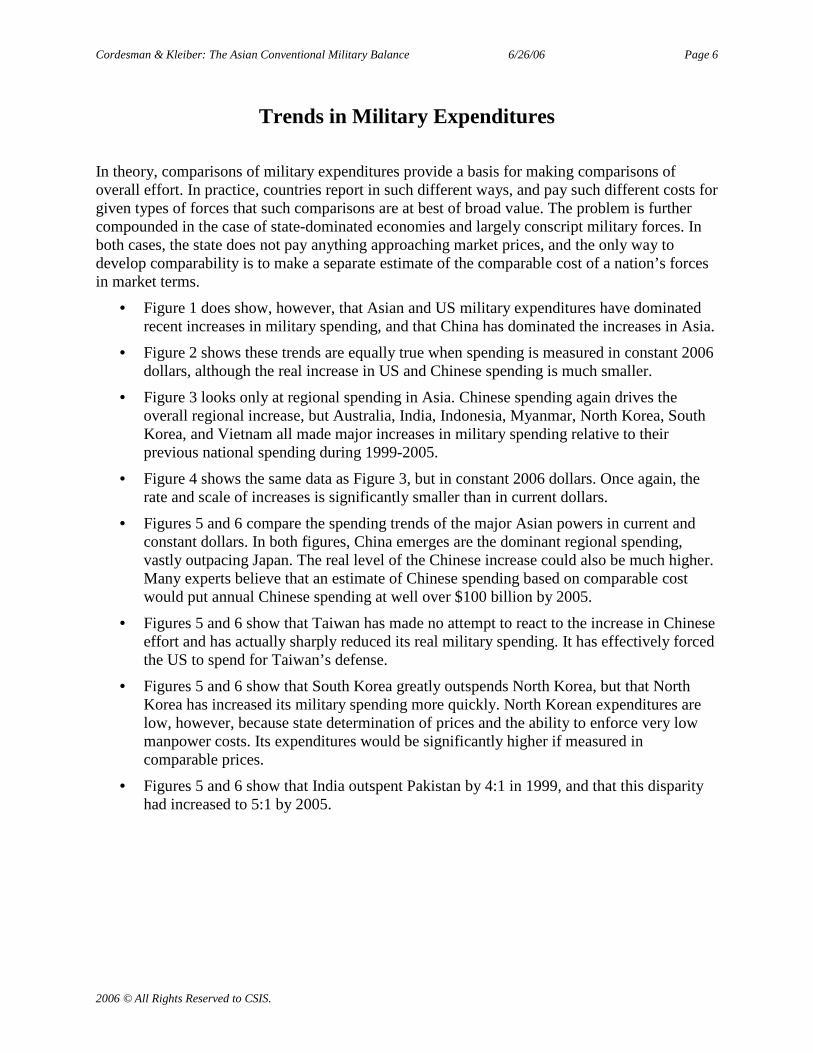
In theory, comparisons of military expenditures provide a basis for making comparisons ofoverall effort. In practice, countries report in such different ways, and pay such different costs forgiven types of forces that such comparisons are at best of broad value. The problem is furthercompounded in the case of state-dominated economies and largely conscript military forces. Inboth cases, the state does not pay anything approaching market prices, and the only way todevelop comparability is to make a separate estimate of the comparable cost of a nation’s forcesin market terms.
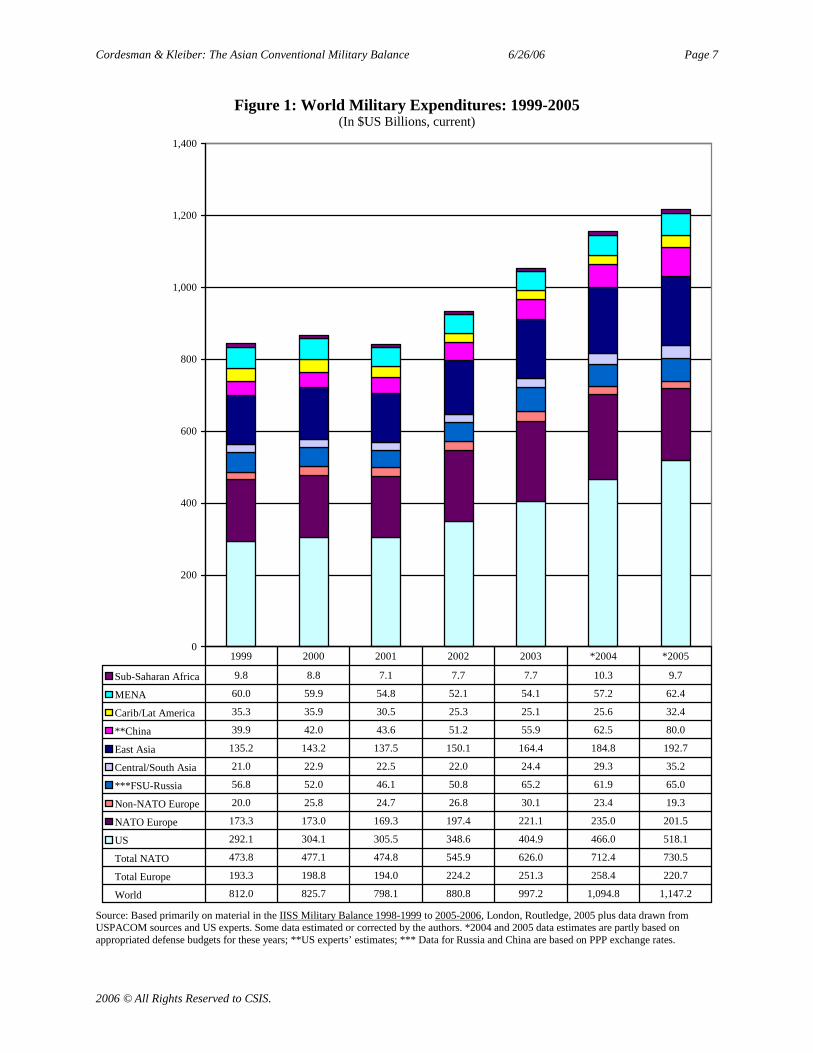
• Figure 1 does show, however, that Asian and US military expenditures have dominatedrecent increases in military spending, and that China has dominated the increases in Asia.
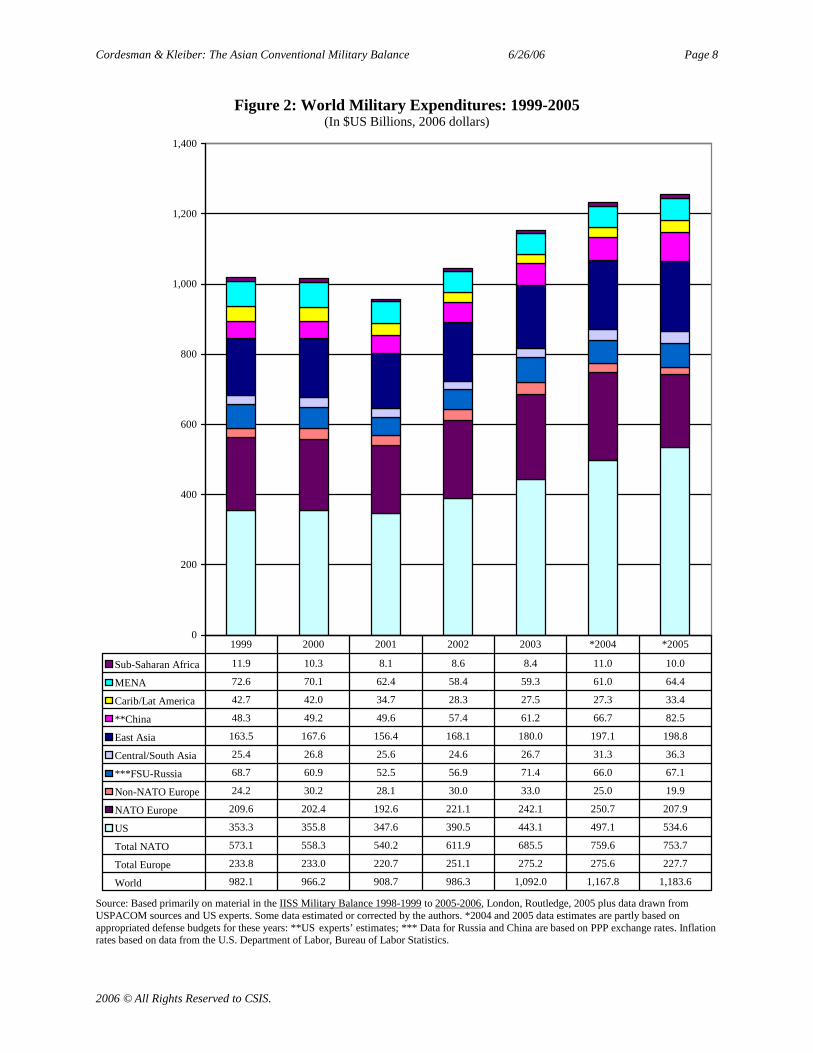
• Figure 2 shows these trends are equally true when spending is measured in constant 2006dollars, although the real increase in US and Chinese spending is much smaller.
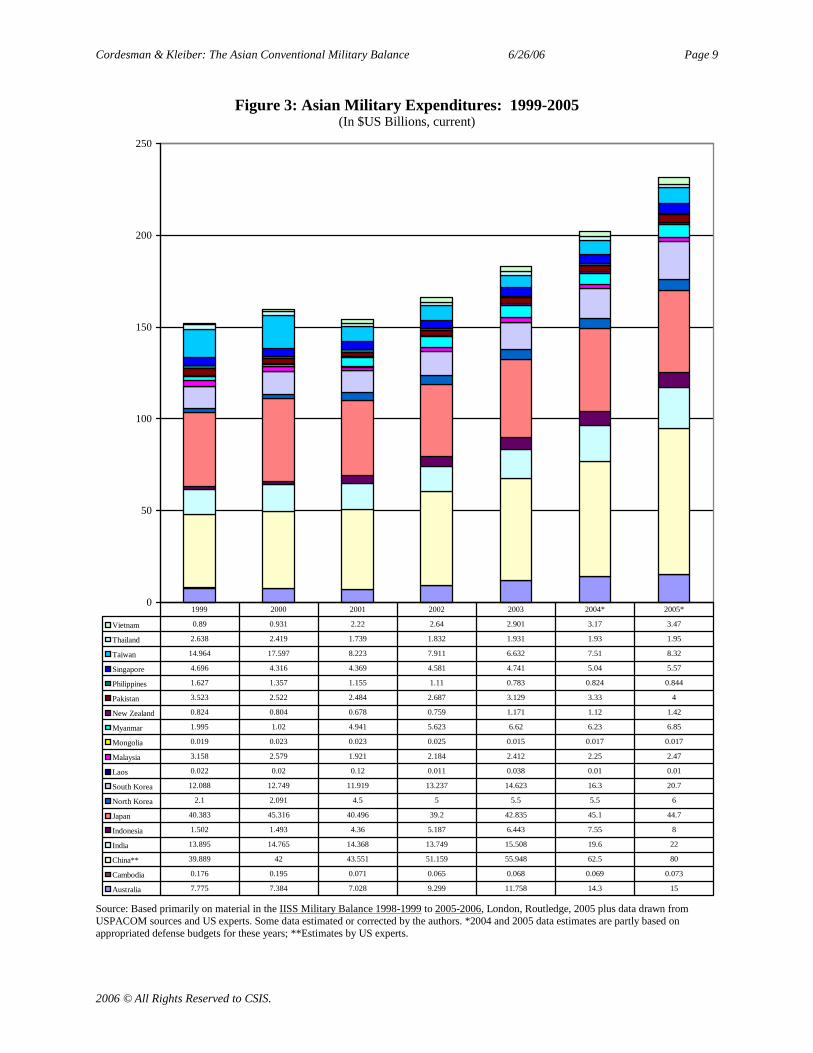
• Figure 3 looks only at regional spending in Asia. Chinese spending again drives theoverall regional increase, but Australia, India, Indonesia, Myanmar, North Korea, SouthKorea, and Vietnam all made major increases in military spending relative to theirprevious national spending during 1999-2005.
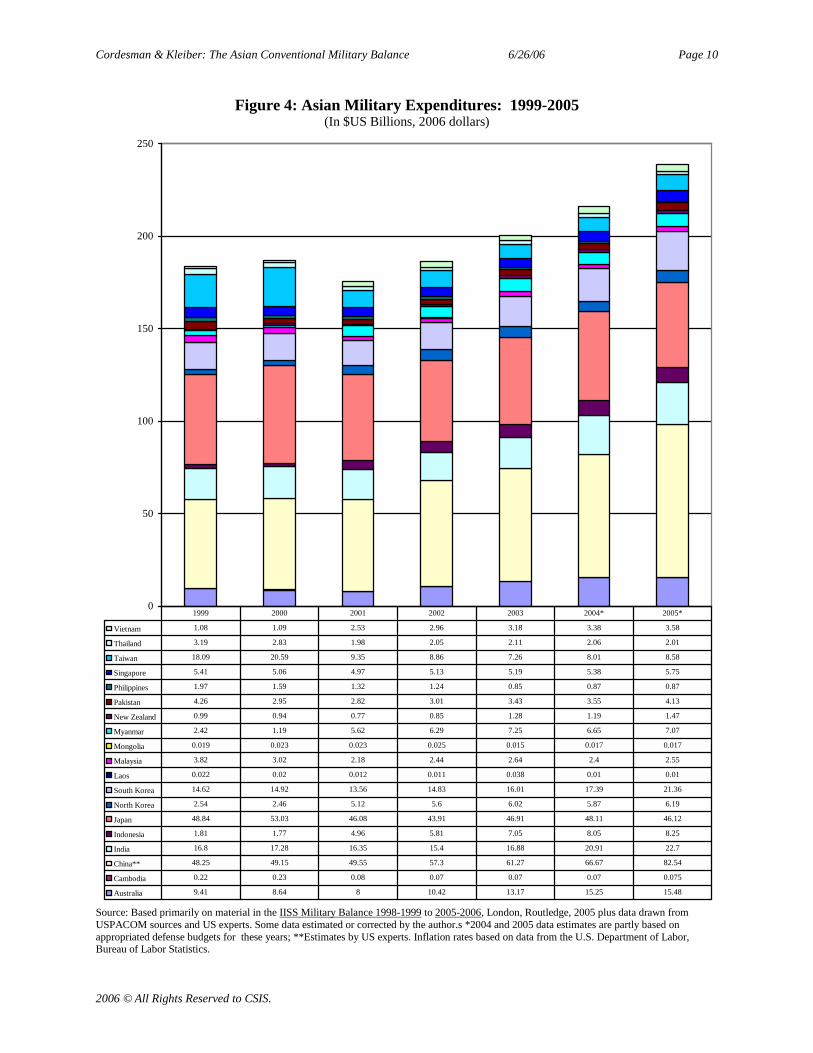
• Figure 4 shows the same data as Figure 3, but in constant 2006 dollars. Once again, therate and scale of increases is significantly smaller than in current dollars.
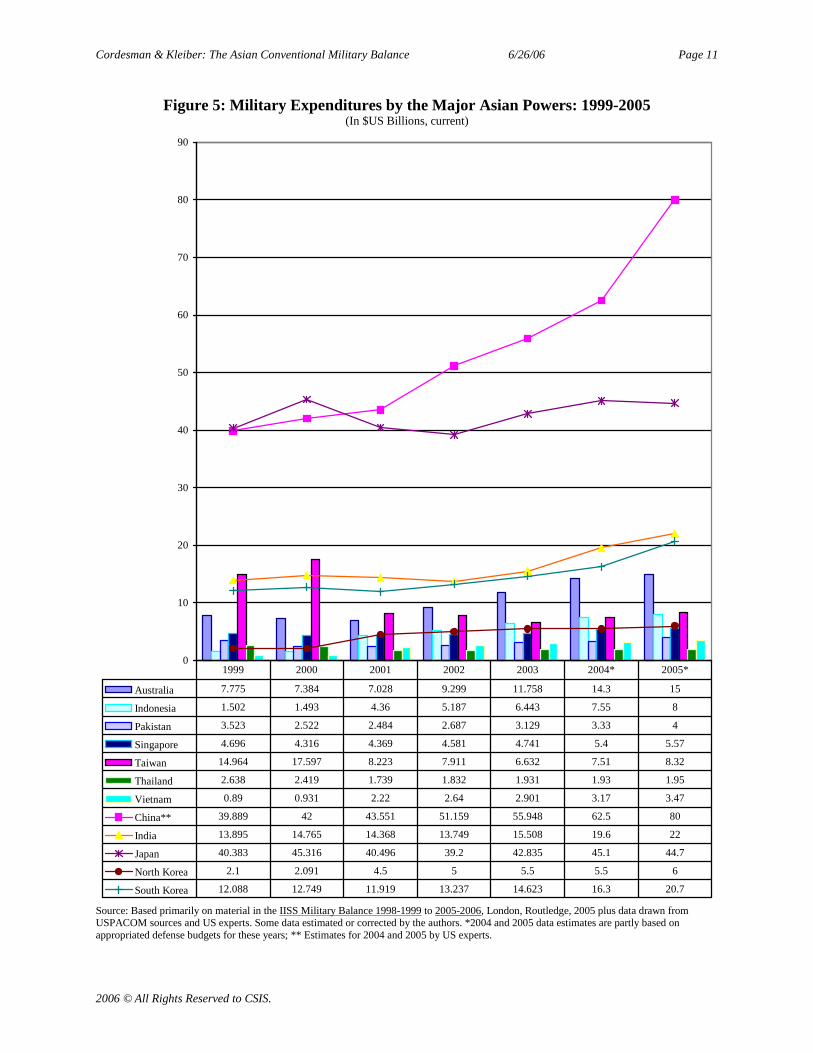
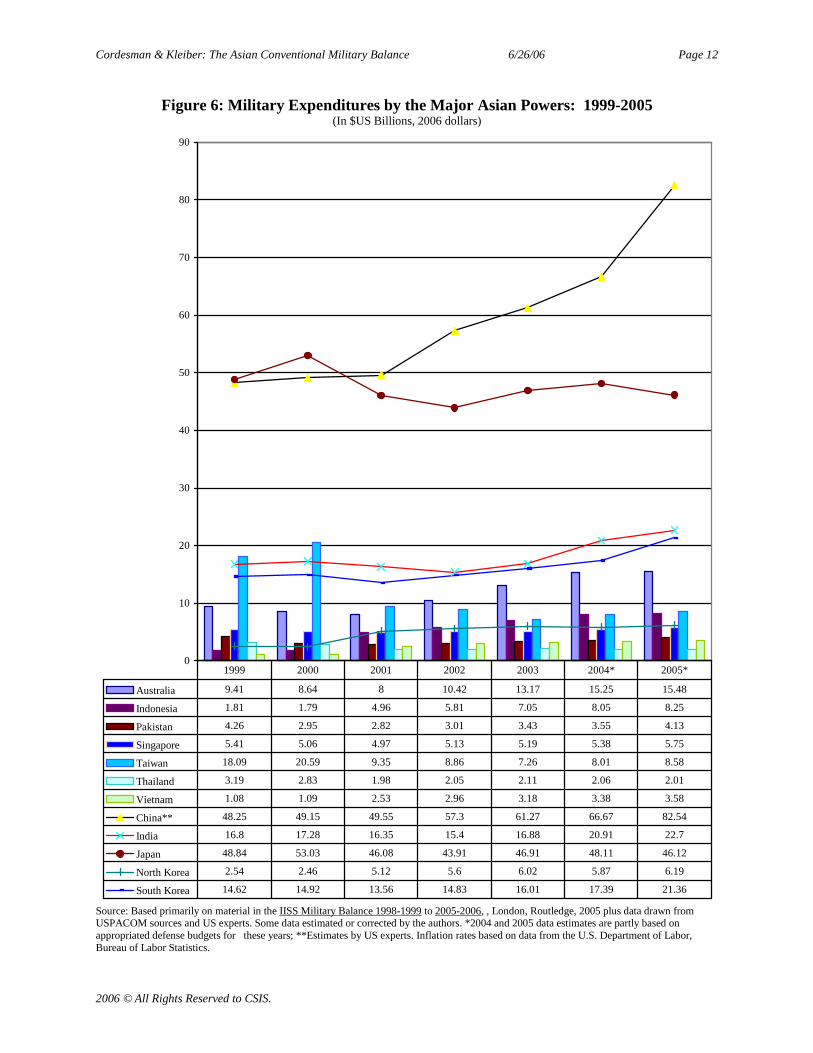
• Figures 5 and 6 compare the spending trends of the major Asian powers in current andconstant dollars. In both figures, China emerges are the dominant regional spending,vastly outpacing Japan. The real level of the Chinese increase could also be much higher.Many experts believe that an estimate of Chinese spending based on comparable costwould put annual Chinese spending at well over $100 billion by 2005.
• Figures 5 and 6 show that Taiwan has made no attempt to react to the increase in Chineseeffort and has actually sharply reduced its real military spending. It has effectively forcedthe US to spend for Taiwan’s defense.
• Figures 5 and 6 show that South Korea greatly outspends North Korea, but that NorthKorea has increased its military spending more quickly. North Korean expenditures arelow, however, because state determination of prices and the ability to enforce very lowmanpower costs. Its expenditures would be significantly higher if measured incomparable prices.
• Figures 5 and 6 show that India outspent Pakistan by 4:1 in 1999, and that this disparityhad increased to 5:1 by 2005.
Cordesman & Kleiber: The Asian Conventional Military Balance 6/26/06 Page 7
2006 © All Rights Reserved to CSIS.
Figure 1: World Military Expenditures: 1999-2005(In $US Billions, current)
0
200
400
600
800
1,000
1,200
1,400
Sub-Saharan Africa 9.8 8.8 7.1 7.7 7.7 10.3 9.7
MENA 60.0 59.9 54.8 52.1 54.1 57.2 62.4
Carib/Lat America 35.3 35.9 30.5 25.3 25.1 25.6 32.4
**China 39.9 42.0 43.6 51.2 55.9 62.5 80.0
East Asia 135.2 143.2 137.5 150.1 164.4 184.8 192.7
Central/South Asia 21.0 22.9 22.5 22.0 24.4 29.3 35.2
***FSU-Russia 56.8 52.0 46.1 50.8 65.2 61.9 65.0
Non-NATO Europe 20.0 25.8 24.7 26.8 30.1 23.4 19.3
NATO Europe 173.3 173.0 169.3 197.4 221.1 235.0 201.5
US 292.1 304.1 305.5 348.6 404.9 466.0 518.1
Total NATO 473.8 477.1 474.8 545.9 626.0 712.4 730.5
Total Europe 193.3 198.8 194.0 224.2 251.3 258.4 220.7
World 812.0 825.7 798.1 880.8 997.2 1,094.8 1,147.2
1999 2000 2001 2002 2003 *2004 *2005
Source: Based primarily on material in the IISS Military Balance 1998-1999 to 2005-2006, London, Routledge, 2005 plus data drawn fromUSPACOM sources and US experts. Some data estimated or corrected by the authors. *2004 and 2005 data estimates are partly based onappropriated defense budgets for these years; **US experts’ estimates; *** Data for Russia and China are based on PPP exchange rates.
Cordesman & Kleiber: The Asian Conventional Military Balance 6/26/06 Page 8
2006 © All Rights Reserved to CSIS.
Figure 2: World Military Expenditures: 1999-2005(In $US Billions, 2006 dollars)
0
200
400
600
800
1,000
1,200
1,400
Sub-Saharan Africa 11.9 10.3 8.1 8.6 8.4 11.0 10.0
MENA 72.6 70.1 62.4 58.4 59.3 61.0 64.4
Carib/Lat America 42.7 42.0 34.7 28.3 27.5 27.3 33.4
**China 48.3 49.2 49.6 57.4 61.2 66.7 82.5
East Asia 163.5 167.6 156.4 168.1 180.0 197.1 198.8
Central/South Asia 25.4 26.8 25.6 24.6 26.7 31.3 36.3
***FSU-Russia 68.7 60.9 52.5 56.9 71.4 66.0 67.1
Non-NATO Europe 24.2 30.2 28.1 30.0 33.0 25.0 19.9
NATO Europe 209.6 202.4 192.6 221.1 242.1 250.7 207.9
US 353.3 355.8 347.6 390.5 443.1 497.1 534.6
Total NATO 573.1 558.3 540.2 611.9 685.5 759.6 753.7
Total Europe 233.8 233.0 220.7 251.1 275.2 275.6 227.7
World 982.1 966.2 908.7 986.3 1,092.0 1,167.8 1,183.6
1999 2000 2001 2002 2003 *2004 *2005
Source: Based primarily on material in the IISS Military Balance 1998-1999 to 2005-2006, London, Routledge, 2005 plus data drawn fromUSPACOM sources and US experts. Some data estimated or corrected by the authors. *2004 and 2005 data estimates are partly based onappropriated defense budgets for these years: **US experts’ estimates; *** Data for Russia and China are based on PPP exchange rates. Inflationrates based on data from the U.S. Department of Labor, Bureau of Labor Statistics.
Cordesman & Kleiber: The Asian Conventional Military Balance 6/26/06 Page 9
2006 © All Rights Reserved to CSIS.
Figure 3: Asian Military Expenditures: 1999-2005(In $US Billions, current)
0
50
100
150
200
250
Vietnam 0.89 0.931 2.22 2.64 2.901 3.17 3.47
Thailand 2.638 2.419 1.739 1.832 1.931 1.93 1.95
Taiwan 14.964 17.597 8.223 7.911 6.632 7.51 8.32
Singapore 4.696 4.316 4.369 4.581 4.741 5.04 5.57
Philippines 1.627 1.357 1.155 1.11 0.783 0.824 0.844
Pakistan 3.523 2.522 2.484 2.687 3.129 3.33 4
New Zealand 0.824 0.804 0.678 0.759 1.171 1.12 1.42
Myanmar 1.995 1.02 4.941 5.623 6.62 6.23 6.85
Mongolia 0.019 0.023 0.023 0.025 0.015 0.017 0.017
Malaysia 3.158 2.579 1.921 2.184 2.412 2.25 2.47
Laos 0.022 0.02 0.12 0.011 0.038 0.01 0.01
South Korea 12.088 12.749 11.919 13.237 14.623 16.3 20.7
North Korea 2.1 2.091 4.5 5 5.5 5.5 6
Japan 40.383 45.316 40.496 39.2 42.835 45.1 44.7
Indonesia 1.502 1.493 4.36 5.187 6.443 7.55 8
India 13.895 14.765 14.368 13.749 15.508 19.6 22
China** 39.889 42 43.551 51.159 55.948 62.5 80
Cambodia 0.176 0.195 0.071 0.065 0.068 0.069 0.073
Australia 7.775 7.384 7.028 9.299 11.758 14.3 15
1999 2000 2001 2002 2003 2004* 2005*
Source: Based primarily on material in the IISS Military Balance 1998-1999 to 2005-2006, London, Routledge, 2005 plus data drawn fromUSPACOM sources and US experts. Some data estimated or corrected by the authors. *2004 and 2005 data estimates are partly based onappropriated defense budgets for these years; **Estimates by US experts.
Cordesman & Kleiber: The Asian Conventional Military Balance 6/26/06 Page 10
2006 © All Rights Reserved to CSIS.
Figure 4: Asian Military Expenditures: 1999-2005(In $US Billions, 2006 dollars)
0
50
100
150
200
250
Vietnam 1.08 1.09 2.53 2.96 3.18 3.38 3.58
Thailand 3.19 2.83 1.98 2.05 2.11 2.06 2.01
Taiwan 18.09 20.59 9.35 8.86 7.26 8.01 8.58
Singapore 5.41 5.06 4.97 5.13 5.19 5.38 5.75
Philippines 1.97 1.59 1.32 1.24 0.85 0.87 0.87
Pakistan 4.26 2.95 2.82 3.01 3.43 3.55 4.13
New Zealand 0.99 0.94 0.77 0.85 1.28 1.19 1.47
Myanmar 2.42 1.19 5.62 6.29 7.25 6.65 7.07
Mongolia 0.019 0.023 0.023 0.025 0.015 0.017 0.017
Malaysia 3.82 3.02 2.18 2.44 2.64 2.4 2.55
Laos 0.022 0.02 0.012 0.011 0.038 0.01 0.01
South Korea 14.62 14.92 13.56 14.83 16.01 17.39 21.36
North Korea 2.54 2.46 5.12 5.6 6.02 5.87 6.19
Japan 48.84 53.03 46.08 43.91 46.91 48.11 46.12
Indonesia 1.81 1.77 4.96 5.81 7.05 8.05 8.25
India 16.8 17.28 16.35 15.4 16.88 20.91 22.7
China** 48.25 49.15 49.55 57.3 61.27 66.67 82.54
Cambodia 0.22 0.23 0.08 0.07 0.07 0.07 0.075
Australia 9.41 8.64 8 10.42 13.17 15.25 15.48
1999 2000 2001 2002 2003 2004* 2005*
Source: Based primarily on material in the IISS Military Balance 1998-1999 to 2005-2006, London, Routledge, 2005 plus data drawn fromUSPACOM sources and US experts. Some data estimated or corrected by the author.s *2004 and 2005 data estimates are partly based onappropriated defense budgets for these years; **Estimates by US experts. Inflation rates based on data from the U.S. Department of Labor,Bureau of Labor Statistics.
Cordesman & Kleiber: The Asian Conventional Military Balance 6/26/06 Page 11
2006 © All Rights Reserved to CSIS.
Figure 5: Military Expenditures by the Major Asian Powers: 1999-2005(In $US Billions, current)
0
10
20
30
40
50
60
70
80
90
Australia 7.775 7.384 7.028 9.299 11.758 14.3 15
Indonesia 1.502 1.493 4.36 5.187 6.443 7.55 8
Pakistan 3.523 2.522 2.484 2.687 3.129 3.33 4
Singapore 4.696 4.316 4.369 4.581 4.741 5.4 5.57
Taiwan 14.964 17.597 8.223 7.911 6.632 7.51 8.32
Thailand 2.638 2.419 1.739 1.832 1.931 1.93 1.95
Vietnam 0.89 0.931 2.22 2.64 2.901 3.17 3.47
China** 39.889 42 43.551 51.159 55.948 62.5 80
India 13.895 14.765 14.368 13.749 15.508 19.6 22
Japan 40.383 45.316 40.496 39.2 42.835 45.1 44.7
North Korea 2.1 2.091 4.5 5 5.5 5.5 6
South Korea 12.088 12.749 11.919 13.237 14.623 16.3 20.7
1999 2000 2001 2002 2003 2004* 2005*
Source: Based primarily on material in the IISS Military Balance 1998-1999 to 2005-2006, London, Routledge, 2005 plus data drawn fromUSPACOM sources and US experts. Some data estimated or corrected by the authors. *2004 and 2005 data estimates are partly based onappropriated defense budgets for these years; ** Estimates for 2004 and 2005 by US experts.
Cordesman & Kleiber: The Asian Conventional Military Balance 6/26/06 Page 12
2006 © All Rights Reserved to CSIS.
Figure 6: Military Expenditures by the Major Asian Powers: 1999-2005(In $US Billions, 2006 dollars)
0
10
20
30
40
50
60
70
80
90
Australia 9.41 8.64 8 10.42 13.17 15.25 15.48
Indonesia 1.81 1.79 4.96 5.81 7.05 8.05 8.25
Pakistan 4.26 2.95 2.82 3.01 3.43 3.55 4.13
Singapore 5.41 5.06 4.97 5.13 5.19 5.38 5.75
Taiwan 18.09 20.59 9.35 8.86 7.26 8.01 8.58
Thailand 3.19 2.83 1.98 2.05 2.11 2.06 2.01
Vietnam 1.08 1.09 2.53 2.96 3.18 3.38 3.58
China** 48.25 49.15 49.55 57.3 61.27 66.67 82.54
India 16.8 17.28 16.35 15.4 16.88 20.91 22.7
Japan 48.84 53.03 46.08 43.91 46.91 48.11 46.12
North Korea 2.54 2.46 5.12 5.6 6.02 5.87 6.19
South Korea 14.62 14.92 13.56 14.83 16.01 17.39 21.36
1999 2000 2001 2002 2003 2004* 2005*
Source: Based primarily on material in the IISS Military Balance 1998-1999 to 2005-2006, , London, Routledge, 2005 plus data drawn fromUSPACOM sources and US experts. Some data estimated or corrected by the authors. *2004 and 2005 data estimates are partly based onappropriated defense budgets for these years; **Estimates by US experts. Inflation rates based on data from the U.S. Department of Labor,Bureau of Labor Statistics.
Cordesman & Kleiber: The Asian Conventional Military Balance 6/26/06 Page 13
2006 © All Rights Reserved to CSIS.
The Overall Regional Military BalanceThe following figures provide a summary comparison of the forces of the major Asian powers,organized in ways that show both comparative force size on a regional basis, and thecomparative strength of the states most likely to go to war.
It is important to understand that such numbers do not portray capability against internal securitythreats or transnational threats like Islamist extremism. In many cases, the key threat is not onethat either conventional or nuclear military forces can deal with. Moreover, even if it werepossible to make useful quantified comparisons of internal security forces, intelligence forces,and counterterrorism forces, they would not provide a clear picture of the strength of anynation’s internal security. Political and social reform, and economic growth and modernization,are often far more important. So is the ability to create meaningful political, religious, cultural,and economic bridges across ethnic and sectarian divisions.
Furthermore, Asian nations differ sharply in the extent to which they have modernized andreorganized their forces to deal with radical changes in military tactics, technology, and training;and in their ability to deploy and sustain given portions of their total forces in actual combat.Many of the countries involved are unlikely to ever fight each other, and could only deploy asmall portion of the total forces shown if they tried to do so.
Force Quantity versus Force Quality: The Advantages of New Tactics, Technology, andTraining in Conventional Warfare
It may be decades before it is clear just how far changes in technology and tactics are changingthe nature of warfare, or whether such changes will slow to the point where they bring anystability. Recent conflicts like the Gulf, Afghan, and Iraq Wars have shown, however, thatseveral areas of military innovation have created a virtual “revolution in military affairs” andgreatly enhanced the value of force quality over force quantity in conventional warfighting fornations like the US that transform their forces to use them:
• Unity of command: The level of unity of command, and "fusion," achieved during the Gulf War wasscarcely perfect, but it was far more effective than that possible in most states. Advanced powers haveimproved its unity of command and ability to conduct joint operations.
• Jointness, Combined operations, combined arms, and the "AirLand Battle": Advanced powers can usetechnology to train and integrate in ways that allow far more effective approaches to jointness, combinedarms and combined operations. They have developed tactics that closely integrated air and land operations.
• Emphasis on maneuver: The US had firepower and attrition warfare until the end of the Vietnam War. Inthe years that followed, it converted its force structure to place an equal emphasis on maneuver anddeception. This emphasis has been adopted by Britain and France and other advanced states.
• Emphasis on deception and strategic/tactical innovation: No country has a monopoly on the use ofdeception and strategic/tactical innovation. High technology powers with advanced battle management andinformation systems will, however, be able to penetrate the enemy’s decision-making system and react soquickly that the opponent cannot compete.
• "24 hour war" - Superior night, all-weather, and beyond-visual-range warfare: "Visibility" is alwaysrelative in combat. There is no such thing as a perfect night vision or all-weather combat system, or way ofacquiring perfect information at long-ranges. Advanced technology air and land forces, however, have farbetter training and technology for such combat than they ever had in the past, and are designed to wagewarfare continuously at night and in poor weather. Equally important, they are far more capable of takingadvantage of the margin of extra range and tactical information provided by superior technology.
Cordesman & Kleiber: The Asian Conventional Military Balance 6/26/06 Page 14
2006 © All Rights Reserved to CSIS.
• Near Real-Time Integration of C4I/BM/T/BDA: New C4I/BM/T/BDA organization, technology, andsoftware systems make it possible to integrate various aspects of command, control, communications,
computers, and intelligence (C4I); battle management (BM); targeting (T); and battle damage assessment(BDA) to achieve a near real time integration and decision making-execution cycle.
• A new tempo of operations: Superiority in virtually every aspect of targeting, intelligence gathering anddissemination, integration of combined arms, multi-service forces, and night and all-weather warfare makeit possible to achieve both a new tempo of operations and one far superior to that of the enemy.
• A new tempo of sustainability: Advanced forces will have maintainability, reliability, reparability, and thespeed and overall mobility of logistic, service support, and combat support force activity that broadly matchtheir maneuver and firepower capabilities. The benefits of these new capabilities are already reflected insuch critical areas as the extraordinarily high operational availability and sortie rates of Western combataircraft, and the ability to support the movement of heliborne and armored forces.
• Rapidly moving, armed, computerized supply and logistics: Rather than steadily occupy and secure rearareas, and create large logistic and rear area supply forces, focus on creating computerized logistic systemscapable of tracing the location of supplies and the needs of forward combat units. Send supplies andservice support units forward to meet demand on a near real-time basis. Send supply, logistics,maintenance, and recovery units forward to meet demand using air power and long-range firepower tosecure the lines of communication and flanks of land forces. Arm and train logistic and service supportunits to defend themselves against insurgents and light attacking forces. Ensure that armor, rotary wing,and fixed wing combat units can move forward as quickly as possible.
• Beyond-visual-range air combat, air defense suppression, air base attacks, and airborne C4I/BM: TheCoalition in the Gulf had a decisive advantage in air combat training, beyond-visual-range air combatcapability, anti-radiation missiles, electronic warfare, air base and shelter and kill capability, stealth and
unmanned long-range strike systems, IFF and air control capability, and airborne C4I/BM systems like theE-3 and ABCCC. These advantages allowed the Coalition to win early and decisive air supremacy in theGulf and Kosovo conflicts, and paralyze the Iraqi Air Force in the Iraq War. Advanced forces will steadilyimprove the individual capability of these systems and their integration into “net-centric” warfare.
• Focused and effective interdiction bombing: Advanced forces organize effectively to use deep strikecapabilities to carry out a rapid and effective pattern of focus strategic bombing where planning issufficiently well coupled to intelligence and meaningful strategic objectives so that such strikes achieve themajor military objectives that the planner sets. At the same time, targeting, force allocation, and precisionkill capabilities have advanced to the point where interdiction bombing and strikes are far more lethal andstrategically useful than in previous conflicts.
• Expansion of the battle field: "Deep Strike": As part of its effort to offset the Warsaw Pact's numericalsuperiority, US tactics and technology emphasized using AirLand battle capabilities to extend thebattlefield far beyond the immediate forward “edge” of the battle area (FEBA) using advanced near-realtime targeting systems, precision weapons, and area munitions. The UN Coalition exploited the resultingmix of targeting capability, improved air strike capabilities, and land force capabilities in ways during theGulf War that played an important role in degrading Iraqi ground forces during the air phase of the war,and which helped the Coalition break through Iraqi defenses and exploit the breakthrough. In Kosovo, theUS and NATO began to employ more advanced "deep strike" targeting technologies and precision strikesystems. These capabilities made striking further advances in the Iraq War, and far more advanced systemsare in development.
• Technological superiority in many critical areas of weaponry: The West and some moderate regional stateshave a critical “edge” in key weapons like tanks, other armored fighting vehicles, artillery systems, long-range strike systems, attack aircraft, air defense aircraft, surface-to-air missiles, space, attack helicopters,naval systems, sensors, battle management, and a host of other areas. This superiority goes far beyond thetechnical "edge" revealed by "weapon on weapon" comparisons. Coalition forces exploited technology in"systems" that integrated mixes of different weapons into other aspects of force capability and into theoverall force structure.
Cordesman & Kleiber: The Asian Conventional Military Balance 6/26/06 Page 15
2006 © All Rights Reserved to CSIS.
• Integration of precision-guided weapons into tactics and force structures: Advanced forces exploit atechnical “edge” in the ability to use precision-guided weapons coupled to far more realistic training inusing such weapons, and the ability to link their employment to far superior reconnaissance and targetingcapability.
• Realistic combat training and use of technology and simulation: During the Gulf and Iraq Wars, the USand Britain took advantage of training methods based on realistic combined arms and AirLand training,large-scale training, and adversary training. These efforts proved far superior to previous methods and werecoupled to a far more realistic and demanding system for ensuring the readiness of the forces involved.They show the value of kinds of training that allow forces to rapidly adapt to the special and changingconditions of war.
• Emphasis on forward leadership and delegation: Technology, tactics, and training all support aggressiveand innovative leadership.
• Heavy reliance on NCOs and highly skilled enlisted personnel: Advanced forces place heavy reliance onthe technical skills, leadership quality, and initiative of non-commissioned officers (NCOs) andexperienced enlisted personnel.
• High degree of overall readiness: Military readiness is a difficult term to define since it involves so manyaspects of force capability. RMA forces, however, will have more realistic standards for measuringreadiness and ensuring proper reporting, and adequate funding over a sustained period of time.
The Vulnerabilities of Less Advanced Powers
Put differently, nations that make such changes are able to exploit weaknesses in theconventional warfighting capabilities of less advanced powers in ways the military forces of suchpowers have little near-term hope of countering. Regardless of the numbers shown in thefollowing Figures, the countries that fail to reform have the following vulnerabilities:
• Authoritarianism and over-centralization of the effective command structure: The high command of many
countries is dependent on compartmentalized, over-centralized C4I/BM systems that do not support hightempo warfare, combined arms, or combined operations and lack tactical and technical sophistication.
Many forces or force elements report through a separate chain of command. C4I/BM systems often arestructured to separate the activity of regular forces from elite, regime security, and ideological forces.Systems often ensure major sectors and corps commanders report to the political leadership, andseparations occur within the branches of a given service. Intelligence is compartmentalized and poorlydisseminated. Air force command systems are small, unit oriented and unsuited for large-scale forcemanagement. Coordination of land-based air defense and strike systems is poorly integrated, vulnerable,and/or limited in volume handing capability. Combined operations and combined arms coordination arepoor, and command interference at the political level is common.
• Lack of strategic assessment capability: Many nations lack sufficient understanding of Western warfighting capabilities to understand the impact of the revolution in military affairs, the role of hightechnology systems, and the impact of the new tempo of war. Other countries have important gaps in theirassessment capabilities reflecting national traditions or prejudices.
• Major Weaknesses in battle management, command, control, communications, intelligence, targeting, andbattle damage assessment: No Middle Eastern country except Israel has meaningful access to space-basedsystems, or advanced theater reconnaissance and intelligence systems unless data are provided by statesoutside the region. Most lack sophisticated reconnaissance, intelligence, and targeting assets at the nationallevel or in their individual military services. Beyond-visual-range imagery and targeting is restricted tolargely vulnerable and easily detectable reconnaissance aircraft or low performance UAVs. Many rely onphoto data for imagery, and have cumbersome download and analysis cycles in interpreting intelligence.Many have exploitable vulnerabilities to information warfare. Most are limited in the sophistication of theirelectronic warfare, SIGINT, and COMINT systems. Their communications security is little better, orworse, than commercial communications security. They have severe communications interconnectivity,
Cordesman & Kleiber: The Asian Conventional Military Balance 6/26/06 Page 16
2006 © All Rights Reserved to CSIS.
volume handling, and dissemination problems. Additionally, they cannot provide the software andconnectivity necessary to fully exploit even commercial or ordinary military systems. They lack the
C4I/BM capability to manage complex deep strikes, complex large-scale armor and artillery operations,effective electronic intelligence, and rapid cycles of reaction in decision-making.
• Lack of cohesive force quality: Most countries’ forces have major land combat units and squadrons withvery different levels of proficiency. Political, historical, and equipment supply factors often mean that mostunits have much lower levels of real-world combat effectiveness than the best units. Further, imbalances incombat support, service support, and logistic support create significant additional imbalances insustainability and operational effectiveness. Many states add to these problems, as well as lack of forcecohesion, by creating politicized or ideological divisions within their forces.
• Shallow offensive battlefields: Most states face severe limits in extending the depth of the battlefieldbecause they lack the survivable platforms and sensors, communications, and data processing to do so.These problems are particularly severe in wars of maneuver, in wars involving the extensive use of strikeaircraft, and in battles where a growing strain is placed on force cohesion.
• Manpower quality: Many states rely on the mass use of poorly trained conscripts. They fail to provideadequate status, pay, training, and career management for NCOs and technicians. Many forces fail toprovide professional career development for officers and joint and combined arms training. Promotionoften occurs for political reasons or out of nepotism and favoritism.
• Slow tempo of operations: Most military forces have not fought a high-intensity air or armored battle. Theyare at best capable of medium tempo operations, and their pace of operations is often dependent on thesurvival of some critical mix of facilities or capabilities.
• Lack of Sustainability, Recovery, and Repair: These initial problems in the tempo of operations are oftenexacerbated by a failure to provide for sustained air operations and high sortie rates, long-range sustainedmaneuver, and battlefield/combat unit recovery and repair. Most forces are heavily dependent on re-supplyto deal with combat attrition whereas Western forces can use field recovery, maintenance, and repair.
• Inability to prevent air superiority: Many states have far greater air defense capability on paper than theydo in practice. Most have not fought in any kind of meaningful air action in the last decade, and many have
never fought any significant air action in their history. C4
I/BM problems are critical in this near real-timeenvironment. Most countries lack sophisticated air combat and land-based air defense simulation andtraining systems, and do not conduct effective aggressor and large-scale operations training. Efforts totransfer technology, organization, and training methods from other nations on a patchwork basis oftenleaves critical gaps in national capability, even where other capabilities are effective.
• Problems in air-to-air combat: Air combat training levels are often low and the training unrealistic. Pilotand other crew training standards are insufficient, or initial training is not followed up with sustainedtraining. There is little effective aggressor training. AWACS and ABCCC capabilities are lacking. EWcapabilities are modified commercial grade capabilities. Most aircraft lack effective air battle managementsystems, and have limited beyond-visual-range and look down shoot down capability. Most air forcessupplied primarily by Russia or Eastern European states depend heavily on obsolete ground-controlledvectoring for intercepts. Key radar and control centers are static and vulnerable to corridor blasting.
• Problems in land-based air defense: Many states lack anything approaching an integrated land-based airdefense system, and rely on outdated or obsolete radars, missile units, and other equipment. Other statesmust borrow or adapt air defense battle management capabilities from supplier states, and have limitedindependent capability for systems integration — particularly at the software level. They lack the mix ofheavy surface-to-air missile systems to cover broad areas, or must rely on obsolete systems that can bekilled, countered by EW, and/or bypassed. Most Middle Eastern short-range air defense systems do notprotect against attacks with stand-off precision weapons or using stealth.
• Lack of effective survivable long-range strike systems: Many nations have the capability to launch long-range effective air and missile strikes, but have severe operational problems in using them. Refuelingcapabilities do not exist or are in such small numbers as to be highly vulnerable. Long-range targeting and
Cordesman & Kleiber: The Asian Conventional Military Balance 6/26/06 Page 17
2006 © All Rights Reserved to CSIS.
battle damage assessment capabilities are lacking. Training is limited and unrealistic in terms of penetratingeffective air defenses. Platforms are export systems without the full range of supplier avionics or missilewarheads. Assets are not survivable, or lose much of their effective strike capability once dispersed.
• Combined (Joint) Operations, Combined Arms, and Interoperability: Many states fail to emphasize the keyadvances in the integration of warfighting capabilities from the last decade. They have not developedcombined arms capabilities within each service, much less inter-service joint warfare capabilities. Whenthey do emphasize combined arms and joint operations, they usually leave serious gaps in some aspects ofnational warfighting capability. There is little or no emphasis on interoperability with neighboring powers.
• Rough/Special terrain warfare: Although many forces have armed helicopters, large numbers of trackedvehicles, and can create effective rough terrain defenses if given time, they have problems in conductinghigh tempo operations. Many tend to be road-bound for critical support and combined arms functions, andlack training for long-range, high-intensity engagements in rough terrain. Many are not properly trained toexploit the potential advantages of their own region. They are either garrison forces, or forces that rely onrelatively static operations in pre-determined field positions. These problems are often compounded by alack of combat engineering and barrier crossing equipment.
• Night and All-Weather Warfare: Most forces lack adequate equipment for night and poor weather warfare,and particularly for long-range direct and indirect fire engagement, and cohesive, sustainable, large-scalemaneuver.
• Armored operations: Most countries have sharply different levels of armored warfare proficiency withintheir armored and mechanized forces. Few units have advanced training and simulation facilities. Most landforces have interoperability and standardization problems within their force structure — particularly in thecase of other armored fighting vehicles where they often deploy a very wide range of types. Many are verytank heavy, without the mix of other land force capabilities necessary to deploy infantry, supportingartillery, and anti-tank capabilities at the same speed and maneuver proficiency as tank units. Most forceshave poor training in conducting rapid, large-scale armored and combined operations at night and in poorweather. Effective battle management declines sharply at the force-wide level — as distinguished from themajor combat unit level — and sometimes even in coordinating brigade or division-sized operations.
• Artillery operations: Many states have large numbers of artillery weapons, but serious problems in trainingand tactics. They lack long-range targeting capability and the ability to rapidly shift and effectively allocatefire. Many rely on towed weapons with limited mobility, or lack off-road support vehicles. Combined armscapabilities are limited. Many units are only effective in using mass fire against enemies that maneuvermore slowly than they do.
• Attack and combat helicopter units: Some countries do have elite elements, but many do not properly traintheir helicopter units, or integrate them into combined or joint operations.
• Commando, paratroop, and Special Forces: Many countries have elite combat units that are high qualityforces at the individual combat unit level. In many cases, however, they are not trained or organized foreffective combined and joint warfare, or for sustained combat. This seriously weakens their effectivenessin anything but limited combat missions.
• Combat training: Training generally has serious problems and gaps, which vary by country. Units or forceelements differ sharply in training quality. Training problems are complicated by conversion andexpansion, conscript turnover, and a lack of advanced technical support for realistic armored, artillery, air-to-air, surface-to-air, and offensive air training. Mass sometimes compensates, but major weaknessesremain.
• Inability to use weapons of mass destruction effectively: Any state can use weapons of mass destruction tothreaten or intimidate another or to attack population centers and fixed area targets. At the same time, thisis not the same as having an effective capability and doctrine to obtain maximum use of such weapons, orto manage attacks in ways that result in effective tactical outcomes and conflict termination. Many statesare acquiring long-range missiles and weapons of mass destruction with very limited exercise and test andevaluation capabilities. This does not deny them the ability to target large populated areas, economiccenters, and fixed military targets, potentially inflicting massive damage. At the same time, it does present
Cordesman & Kleiber: The Asian Conventional Military Balance 6/26/06 Page 18
2006 © All Rights Reserved to CSIS.
problems in more sophisticated military operations. Many will have to improvise deployments, doctrine,and war fighting capabilities. In many cases, weaknesses and vulnerabilities will persist and they will onlybe able to exploit a limited amount of the potential lethality of such systems.
Limits to Conventional Military Forces and the Challenge of Asymmetric Warfare
The practical problem with even the most advanced efforts at “transformation,” however, is thatthey still leave major gaps in the capabilities of all conventional forces that current and potentialenemies can exploit.
Conventional combat is only one way of waging war or exerting military power. The fighting inIraq and Afghanistan has made it clear that even US preeminence in conventional warfightingdoes not mean the US has any lead in counterterrorism or counterinsurgency, or that the hasmastered conflict termination, or that it is effective in stability operations and nation building.
Depending on the nation, culture, and conflict both the quality and quantity of the forces shownin the following Figures may be offset by nations and transnational forces that use asymmetricwarfare, terrorism, and insurgency to exploit the following vulnerabilities in regular militaryforces:
Sudden or surprise attack: Power projection is dependent on strategic warning, timely decision making,and effective mobilization and redeployment for much of its military effectiveness.
Saturation and the use of mass to create a defensive or deterrent morass: There is no precise way todetermine the point at which mass, or force quantity, overcomes superior effectiveness, or force quality —historically, efforts to emphasize mass have been far less successful than military experts predicted at the time. Even
the best force, however, reaches the point where it cannot maintain its “edge” in C4I/battle management, air combat,
or maneuver warfare in the face of superior numbers or multiple threats. Further, saturation may produce a suddencatalytic collapse of effectiveness, rather than a gradual degeneration from which the Israeli Defense Force couldrecover. This affects forward deployment, reliance on mobilization and reliance on defensive land tactics versuspreemption and “offensive defense.”
Limited capability to take casualties: War fighting is not measured simply in terms of whether a given sidecan win a battle or conflict, but how well it can absorb the damage inflicted upon it. Many powers are highlysensitive to casualties and losses. This sensitivity may limit its operational flexibility in taking risks, and insustaining some kinds of combat if casualties become serious relative to the apparent value of the immediateobjective.
Limited ability to Inflict casualties and collateral damage: Dependence on world opinion and outsidesupport means some nations increasingly must plan to fight at least low and mid-intensity conflicts in ways that limitenemy casualties and collateral damage to its opponents.
Low-intensity and infantry/insurgent dominated combat: Low-intensity conflict makes it much harder toutilize most technical advantages in combat — because low-intensity wars are largely fought against people, notthings. Low-intensity wars are also highly political. The battle for public opinion is as much a condition of victory askilling the enemy. The outcome of such a battle will be highly dependent on the specific political conditions underwhich it is fought, rather than RMA-like capabilities.
Hostage-taking, kidnapping, executions, and terrorism: Like low-intensity warfare, hostage-taking,kidnapping, executions, and terrorism present the problem that advanced technology powers cannot exploit theirconventional strengths, and must fight a low-level battle primarily on the basis of infantry combat. HUMINT ismore important than conventional military intelligence, and much of the fight against terrorism may take place inurban or heavily populated areas.
Urban and Built-Up Area Warfare: Advanced military powers are still challenged by the problems of urbanwarfare. In spite of the performance of US forces in the Iraq War, cases like Fallujah and Sadr’s urban operationshave shown that truly pacifying a hostile city or built-up area can be extremely difficult. It also is not clear whatwould happen if a more popular regime – such as the government of Iran – tried to create an urban redoubt.

Cordesman & Kleiber: The Asian Conventional Military Balance 6/26/06 Page 19
2006 © All Rights Reserved to CSIS.
Moreover, most western forces are not trained or equipped to deal with sustained urban warfare in populated areasduring regional combat — particularly when the fighting may affect large civilian populations on friendly soil.
Extended conflict and occupation warfare: Not all wars can be quickly terminated, and many forms ofwarfare — particularly those involving peacekeeping and peace-enforcement — require prolonged militaryoccupations. The result imposes major strains on the US politically, economically, and militarily.
Weapons of mass destruction: The threat or actual use of such weapons can compensate for conventionalweakness in some cases and deter military action in others.
Proxy warfare and false flags: As the Lockerbie case demonstrated, states can successfully carry out majoracts of terrorism through proxies without having their identity quickly established or suffering major militaryretaliation. Al Khobar is a more recent case where Iran’s full role still remains uncertain and no retaliation hasoccurred. Similarly, the various charges that Iraq was the source of the first World Trade Center attack, and theconspiracy theories that follow, indicate that false flag operations are feasible. So do the number of terroristincidents where unknown groups or multiple groups have claimed responsibility, but the true cause has never beenfirmly established.
HUMINT, area expertise, and language skills: US and Western capabilities to conduct operations requiringextensive area knowledge and language skills are inherently limited. Similarly, high technology IS&R assets havenot proved to be a substitute for HUMINT sources and analytic skills, although they can often aid HUMINT at boththe operational and analytic level.
Attack rear areas and lines of communication: The US talks about “swarm theory” and discontinuousbattlefields, but Iraqi regular and irregular forces quickly learned—as Iraqi insurgents did later—that US rear area,support, and logistic forces are far more vulnerable than US combat elements. Such “swarming” may be slow, ifirregular forces are not in place, but potential opponents understand this and can fight discontinuous battles of theirown.
Political, ideological, and psychological warfare: As has been discussed earlier, the US is vulnerable tosuch attacks on the grounds of ethnicity, religion, its status as a superpower active in the region, and its ties to Israel,Ironically, some can exploit its ties to moderate and conservative regimes on the grounds it fails to support reform,while others can exploit its efforts to advance secular political and economic reforms on the grounds they are anti-Islamic.

Cordesman & Kleiber: The Asian Conventional Military Balance 6/26/06 Page 20
2006 © All Rights Reserved to CSIS.
Threat of Asymmetric Innovation
Guerilla, terrorist, and insurgent movements have repeatedly shown in conflicts ranging fromAfghanistan and Iraq to Sri Lanka and Kashmir that they can exploit such vulnerabilities. Theyare able to draw on the history of past successes, adopt new tactics proven by other movementsand actors on a near real-time basis, and innovate on their own.
Recent conflicts provide so many case examples of “lessons” that mix innovation with historicalexperience that it is only possible to touch upon some of the more specific “innovations” thatinsurgents have used, but even a short list is impressive:
• Attack the structures of governance and security by ideological, political, and violent means: Useideological and political means to attack the legitimacy of the government and nation building process.Intimidate and subvert the military and security forces. Intimidate and attack government officials andinstitutions at the national, regional, and local levels. Strike at infrastructure, utilities, and services in waysthat appear to show the government cannot provide essential economic services or personal security.
• Create alliances of convenience and informal networks with other groups to attack the US, moderateregional governments, or efforts at nation building. The informal common fronts operate on the principalthat the “enemy of my enemy” is my temporary friend. At the same time, movements “franchise” to createindividual cells and independent units, creating diverse mixes of enemies that are difficult to attack.
• Link asymmetric warfare to crime and looting; exploit poverty and economic desperation. Use criminals tosupport attacks on infrastructure and nation building activity; raise funds, and undermine security. Exploitunemployment to strengthen dedicated insurgent and terrorist cells. Blur the lines between threat forces,criminal elements, and part time forces.
• Co-opt the middle; create links to more moderate and popular causes: Linking extremist action to popularcauses, like the Israeli-Palestinian conflict has become a more common tactic in large part because theconflict has continued to escalate and has had such visibility. Many movements, however, have foundadditional ways to broaden their base. These include creating humanitarian and political wings; claiming tobe pro-democracy and reform, attacking failed governance and corruption; calling opponents anti-Islamic;or invoking terms like Crusader, Zionist, imperialist, etc.
• Maintain a strategy of constant attrition, but strike hard according to a calendar of turning points and/orat targets with high political, social, and economic impact: Insurgents and Islamists in Afghanistan andIraq (and in the Israeli-Palestinian conflict and other regional struggles) have learned the importance of aconstant low-level body count and creating a steady climate of violence. This forces the US into aconstant, large-scale security effort and ensures constant media coverage. At the same time, insurgents andIslamists have shown a steadily more sophisticated capability to exploit holidays, elections and otherpolitical events, and sensitive targets both inside the countries that are the scene of their primary operationsand in the US and the West. Attacks on Kurdish and Shi’ite religious festivals, and the Madrid bombingsare cases in point. Terrorists and insurgents know that such targeted and well timed attacks can successfullyundermine the Israeli-Palestinian peace process and can help drive the Israeli-Palestinian conflict. Ahandful of terrorists in Hamas and the PIJ, and the Israeli who killed Rabin, effectively defeated both Israeland the Palestinian Authority. Dramatic incidents of violence in Beirut and Somalia have also createdpolitical and psychological conditions that have helped catalyze US withdrawal.
• Push “hot buttons.” Try to find forms of attack that provoke disproportionate fear and “terror” force theUS and its allies into costly, drastic, and sometimes provocative responses: Terrorists and insurgents havefound that attacks planned for maximum political and psychological effects often have the additionalbenefit of provoking over-reaction. Hamas and the PIJ exploited such tactics throughout the peace process.The US response to the attacks on the World Trade Center and Pentagon led to US over-reactions—particularly at the media and Congressional level—that helped alienate the Arab and Islamic worlds fromthe US. At a different level, a limited Anthrax attack had a massive psychological impact in the US,inflicted direct and indirect costs exceeding a billion dollars, drew immense publicity, and affected theoperations of a key element of the US government for several weeks.

Cordesman & Kleiber: The Asian Conventional Military Balance 6/26/06 Page 21
2006 © All Rights Reserved to CSIS.
• Use media as an intelligence and communication system and for information warfare: Islamist movements,Palestinian groups, and many others, have learned how to capture maximum exposure in regional media,use the Internet, and above all exploit the new Arab satellite news channels. In contrast, US officials oftenconfuse their occasional presence with successful impact.
• “Game” and manipulate regional, Western, and other outside media: Use interview access, tapes,journalist hostage takings and killings, politically-led and motivated crowds, drivers and assistant tojournalists, and timed and targeted attacks to attempt to manipulate Western and outside media. ManipulateUS official briefings with planted questions.
• Externalize the struggle: Bring the struggle home to the US and its allies as in the cases of the World TradeCenter, Pentagon, and Madrid. Get maximum media and political impact. Encourage a “clash betweencivilizations.” Avoid killing fellow Muslims and collateral damage. Appear to be attacking Israel indirectly.Undermine US ties to friendly Arab states.
• Use Americans and other foreigners as proxies: There is nothing new about using Americans and otherforeigners as proxies for local regimes, or attacking them to win support for ideological positions andcauses. There has, however, been steadily growing sophistication in the timing and nature of such attacks,and in exploiting softer targets such as American businessmen in the country of operations, on striking atUS and allied targets in other countries, or in striking at targets in the US. It is also clear that such attacksreceive maximum political and media attention in the US.
• Attack UN, NGO, Embassies, aid personnel, and foreign contractor business operations: Attacking suchtargets greatly reduces the ability to carry out nation building and stability operations to win hearts andminds. Attacking the “innocent,” and curtailing their operations or driving organizations out of country hasbecome an important focus of insurgents and Islamist extremist attacks.
• “Horror” attacks, atrocities, and alienation: Whether or not the tactics were initially deliberate, insurgentsin Iraq have found that atrocities like desecrating corpses and beheadings are effective political andpsychological weapons for those Islamist extremists whose goal is to divide the West from the Islamicworld, and create an unbridgeable “clash of civilizations.” Experts have long pointed out that one of the keydifferences between Islamist extremist terrorism and previous forms of terrorism is that they are notseeking to negotiate with those they terrorize, but rather to create conditions that can drive the West away,undermine secular and moderate regimes in the Arab and Islamic worlds, and create the conditions underwhich they can create “Islamic” states according to their own ideas of “Puritanism.” This is why it servesthe purposes of Islamist extremists, as well as some of the more focused opponents of the US and the West,to create massive casualties and carry out major strikes, or carry out executions and beheadings, even if theresult is to provoke hostility and anger.
The goal of Bin Laden and those like him is not to persuade the US or the West, it is rather to so alienatethem from the Islamic and Arab world that the forces of secularism in the region will be sharplyundermined, and Western secular influence can be controlled or eliminated. The goal of most Iraqiinsurgents is narrower – drive the US and its allies out of Iraq – but involves many of the same methods.Seen in this context, the more horrifying the attack, or incident, the better. Simple casualties do not receivethe same media attention. They are a reality of war. Killing (or sometimes releasing) innocent hostagesdoes grab the attention of the world media. Large bombs in crowds do the same, as does picking targetswhose innocence or media impact grabs headlines. Desecrating corpses, beheadings, and similar acts ofviolence get even more media attention -- at least for a while.
Such actions also breed anger and alienation in the US and the West and to provoke excessive political andmedia reactions, more stringent security measures, violent responses and all of the other actions that helpprovoke a “clash of civilizations.” The US and the West are often provoked into playing into the hands ofsuch attackers. At the same time, any attack or incident that provokes massive media coverage and politicalreactions, appears to be a “victory” to those who support Islamist extremism or those who are truly angry atthe US – even though the actual body count is often low, and victory does not mean creating strongerforces or winning political control. Each such incident can be used to damage the US and Western view ofthe Arab and Islamic worlds.
Cordesman & Kleiber: The Asian Conventional Military Balance 6/26/06 Page 22
2006 © All Rights Reserved to CSIS.
• Keep “failed states” failed and/or deprive local governments and nation building efforts of legitimacy.Attack nation building and stability targets: There is nothing new about attacking key economic targets,infrastructure, and aspects of governance critical to the functioning of the state in an effort to disrupt itseconomy, undermine law enforcement and security, and encourage instability. The Al Qa’ida and Talibanattacks on road works and aid workers; Iraqi insurgent and Islamist attacks on aid workers and projects; andtheir role in encouraging looting, sabotage, and theft does, however, demonstrate a growing sophisticationin attacking stability efforts and tangible progress in aid and governance. These tactics also interactsynergistically with the above tactics.
• Confuse the identity of the attacker; exploit conspiracy theories: Insurgents and Islamists have learned thata mix of silence, multiple claims to be the attacker, new names for attacking organizations, and uncertainlevels of affiliation both make it harder for the US to respond. They also produce more media coverage andspeculation. As of yet, the number of true false flag operations has been limited. However, in Iraq andelsewhere, attacks have often accompanied by what seem to be deliberate efforts to advance conspiracytheories to confuse the identity of the attacker or to find ways to blame defenders of the US for beingattacked. In addition, conspiracy theories charging the US with deliberately or carelessly failing to providean adequate defense have been particularly effective.
• Shelter in Mosques, Shrines, high value targets, and targets with high cultural impact: Again, exploitingfacilities of religious, cultural, and political sensitivity is not a new tactic. However, as operations againstSadr and in Fallujah have shown, the tactics raise the media profile, create a defensive deterrent, and can beexploited to make the US seem anti-Islamic or to be attacking a culture and not a movement.
• Exploit, exaggerate, and falsify US attacks that cause civilian casualties and collateral damage, friendlyfire against local allies, and incidents where the US can be blamed for being anti-Arab and anti-Islam:Terrorists and insurgents have found they can use the media, rumor, and conspiracy theories to exploit thefact the US often fights a military battle without proper regard to the fact it is also fighting a political,ideological, and psychological war.
Real incidents of US misconduct such as the careless treatment of detainees and prisoners, and careless andexcessive security measures are cases in point. So too are careless political and media rhetoric by USofficials and military officers. Bin Laden, the Iraqi insurgents, etc., all benefit from every Western actionthat unnecessarily angers or frustrates the Arab and Islamic worlds. They are not fighting to influenceWestern or world opinion; they are fighting a political and psychological war to dominate Iraq and the Araband Islamic worlds.
• Mix Crude and sophisticated IEDs: Hezbollah should be given credit for having first perfected the use ofexplosives in well structured ambushes, although there is nothing new about such tactics -- the Afghansused them extensively against the Soviets. Iraq has, however, provided a unique opportunity for insurgentsand Islamist extremists to make extensive use of IEDs by exploiting its mass stocks of arms. The Iraqiattackers have also learned to combine the extensive use of low grade IEDs, more carefully targetedsophisticated IEDs, and very large car bombs and other devices to create a mix of threats and methods thatis much more difficult to counter than reliance on more consistent types of bombs and target sets.
• Suicide bombs, car bombs, and mass bombings: The use of such tactics has increased steadily since 1999,in part due to the high success rate relative to alternative methods of attack. It is not always clear thatsuicide bombing techniques are tactically necessary outside struggles like the Israel-Palestinian conflict,where one side can enforce a very tight area and perimeter, and point target security. In many cases, timeddevices might produce the same damage.
Cordesman & Kleiber: The Asian Conventional Military Balance 6/26/06 Page 23
2006 © All Rights Reserved to CSIS.
Events in Iraq have shown, however, that suicide bombers still have a major psychological impact and gainexceptional media attention. They also serve as symbols of dedication and commitment, can be portrayedas a form of Islamic martyrdom, and attract more political support and attention among those sympatheticto the cause involved.
At the same time, regional experts must be very careful about perceiving such methods of attack as either arecent development or as Islamic in character. For instance, Hezbollah used suicide bombings in the 1980s,with an attack on the US Embassy in Beirut in 1981 and in six attacks in 1983 killing 384 people–including 241 US Marines. Moreover, Hindu terrorists and the Tamil Tigers made extensive use of suicidebombings long before the Palestinians. In fact, Hindu terrorists still lead in the amount of suicide bombingscommitted by a particular group. The Tamil tigers have carried out 168 such attacks since 1987 versus 16for the Hezbollah versus Israel (1983-1985), 44 for the Palestinians (1999-2004), and 28 for Al Qa’ida(1999-2004. A profiling of the attackers in some 168 attacks also found that only a comparative few couldin any sense be called religious fanatics rather than believers in a cause.1
• Attack LOCs, rear area, and support activity: Iran and Afghanistan have shown that dispersed attacks onlogistics and support forces often offer a higher chance of success than attacks on combat forces anddefended sites, and makes the fight wars based on “deep support” rather than “deep strikes” beyond theFEBA.
• Better use of light weapons and more advanced types; attack from remote locations or use timed devices:While much will depend on the level of insurgent and Islamist extremist access to arms, Iraq andAfghanistan have seen a steady improvement in the use of systems like mortars and anti-tank weapons, andefforts to acquire Manpads, ATGMs, mortars, rockets, and timed explosives. The quality of urban and roadambushes has improved strikingly in Iraq, as has the ability to set up rapid attacks, and exploit thevulnerability of soft skinned vehicles.
• Create informal distributed networks for command, control, communications, computer/battle management(C4IBM), and intelligence, surveillance, and reconnaissance (IS&R)—deliberately or accidentally: Likedrug dealers before them, Islamist extremists and insurgents have learned enough about communicationsintelligence (COMINT) and signals intelligence (SIGINT) to stop using most vulnerable communicationsassets, and to bypass many – if not most – of the efforts to control cash flow and money transfers.
The use of messengers, direct human contact, and more random methods of electronic communication areall cases in point. At the broader level, however, insurgents in Iraq seem to have adapted to having cellsand elements operate with considerable autonomy, and by loosely linking their operations by using themedia and reporting on the overall pattern of attacks to help determine the best methods and targets.
Smuggling, drug sales, theft and looting, and direct fund transfers also largely bypass efforts to limitoperations through controls on banking systems, charities, etc. Under these conditions, a lack of centralcontrol and cohesive structure may actually be an asset, allowing highly flexible operations with minimalvulnerability to roll-up and attack.
The existence of parallel, and not conflicting, groups of hostile non-state actors provides similar advantagesand has the same impact. The fact that insurgent and Islamist extremist groups operate largelyindependently, and use different tactics and target sets, greatly complicates US operations and probablyactually increases overall effectiveness.
The Meaning of Quantitative Comparisons
Given this background, the figures that follow have serious limitations in measuring militarypower that at best can be offset by full-scale war gaming and simulation that take all majorqualitative and quantitative factors into account. Even then, much of the analysis would have tobe highly speculative. Many Asian nations have never fought a modern war, and their militaryhave no real world experience with serious combat. Many have evolved force structures that owemore to historical momentum than any meaningful rationale for force development, and manypreserve a total force structure for internal political purposes that they cannot afford to“transform,” modernize, or recapitalize.
Cordesman & Kleiber: The Asian Conventional Military Balance 6/26/06 Page 24
2006 © All Rights Reserved to CSIS.
The detailed figures on force structures that follow also reflect very different mixes of equipmentin terms of basic physical capability to fight combined arms and joint warfare, and deploy andsustain given force elements. In many cases, nations maintain a mix of units with very differentforce structures, training levels, and modernization. There is no consistency within a givenservice or even force element within a given type of force within a service. This makes itimpossible for even the most sophisticated war game or simulation to model conflicts in morethan broad terms. That said, there are still some aspects of force quantity that do have meaning:
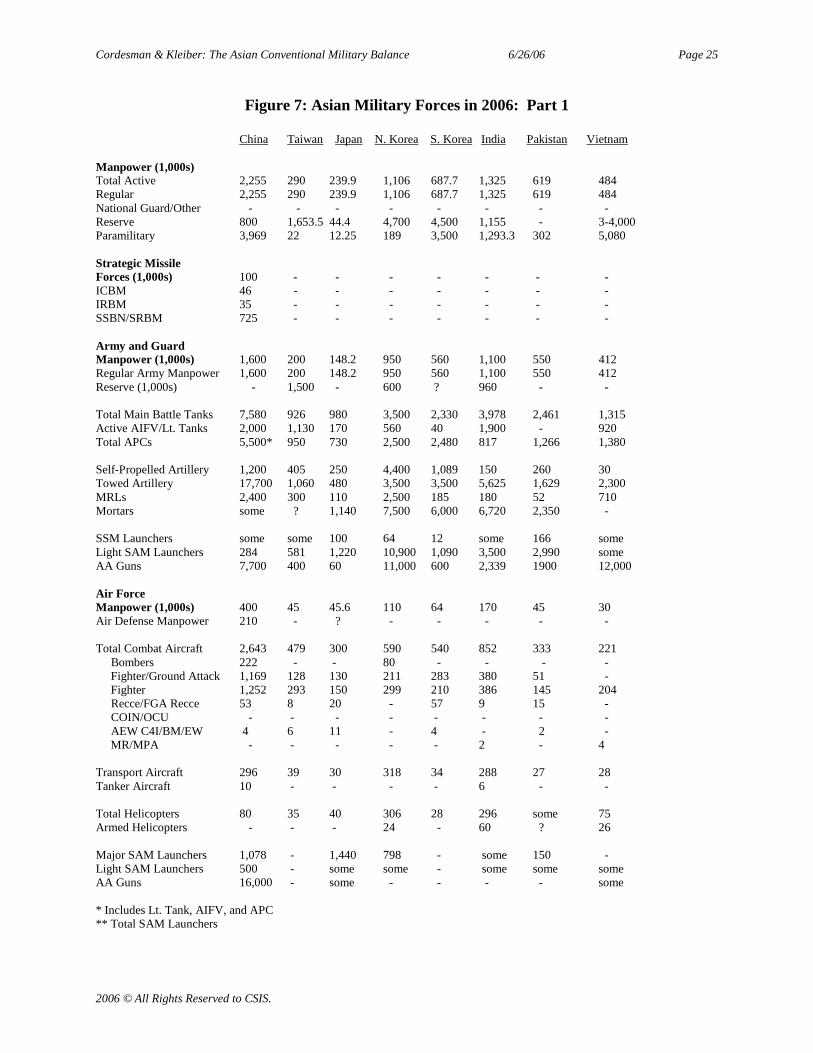
Cordesman & Kleiber: The Asian Conventional Military Balance 6/26/06 Page 25
2006 © All Rights Reserved to CSIS.
Figure 7: Asian Military Forces in 2006: Part 1
China Taiwan Japan N. Korea S. Korea India Pakistan Vietnam
Manpower (1,000s)Total Active 2,255 290 239.9 1,106 687.7 1,325 619 484Regular 2,255 290 239.9 1,106 687.7 1,325 619 484National Guard/Other - - - - - - - -Reserve 800 1,653.5 44.4 4,700 4,500 1,155 - 3-4,000Paramilitary 3,969 22 12.25 189 3,500 1,293.3 302 5,080
Strategic MissileForces (1,000s) 100 - - - - - - -ICBM 46 - - - - - - -IRBM 35 - - - - - - -SSBN/SRBM 725 - - - - - - -
Army and GuardManpower (1,000s) 1,600 200 148.2 950 560 1,100 550 412Regular Army Manpower 1,600 200 148.2 950 560 1,100 550 412Reserve (1,000s) - 1,500 - 600 ? 960 - -
Total Main Battle Tanks 7,580 926 980 3,500 2,330 3,978 2,461 1,315Active AIFV/Lt. Tanks 2,000 1,130 170 560 40 1,900 - 920Total APCs 5,500* 950 730 2,500 2,480 817 1,266 1,380
Self-Propelled Artillery 1,200 405 250 4,400 1,089 150 260 30Towed Artillery 17,700 1,060 480 3,500 3,500 5,625 1,629 2,300MRLs 2,400 300 110 2,500 185 180 52 710Mortars some ? 1,140 7,500 6,000 6,720 2,350 -
SSM Launchers some some 100 64 12 some 166 someLight SAM Launchers 284 581 1,220 10,900 1,090 3,500 2,990 someAA Guns 7,700 400 60 11,000 600 2,339 1900 12,000
Air ForceManpower (1,000s) 400 45 45.6 110 64 170 45 30Air Defense Manpower 210 - ? - - - - -
Total Combat Aircraft 2,643 479 300 590 540 852 333 221Bombers 222 - - 80 - - - -Fighter/Ground Attack 1,169 128 130 211 283 380 51 -Fighter 1,252 293 150 299 210 386 145 204Recce/FGA Recce 53 8 20 - 57 9 15 -COIN/OCU - - - - - - - -AEW C4I/BM/EW 4 6 11 - 4 - 2 -MR/MPA - - - - - 2 - 4
Transport Aircraft 296 39 30 318 34 288 27 28Tanker Aircraft 10 - - - - 6 - -
Total Helicopters 80 35 40 306 28 296 some 75Armed Helicopters - - - 24 - 60 ? 26
Major SAM Launchers 1,078 - 1,440 798 - some 150 -Light SAM Launchers 500 - some some - some some someAA Guns 16,000 - some - - - - some
* Includes Lt. Tank, AIFV, and APC** Total SAM Launchers
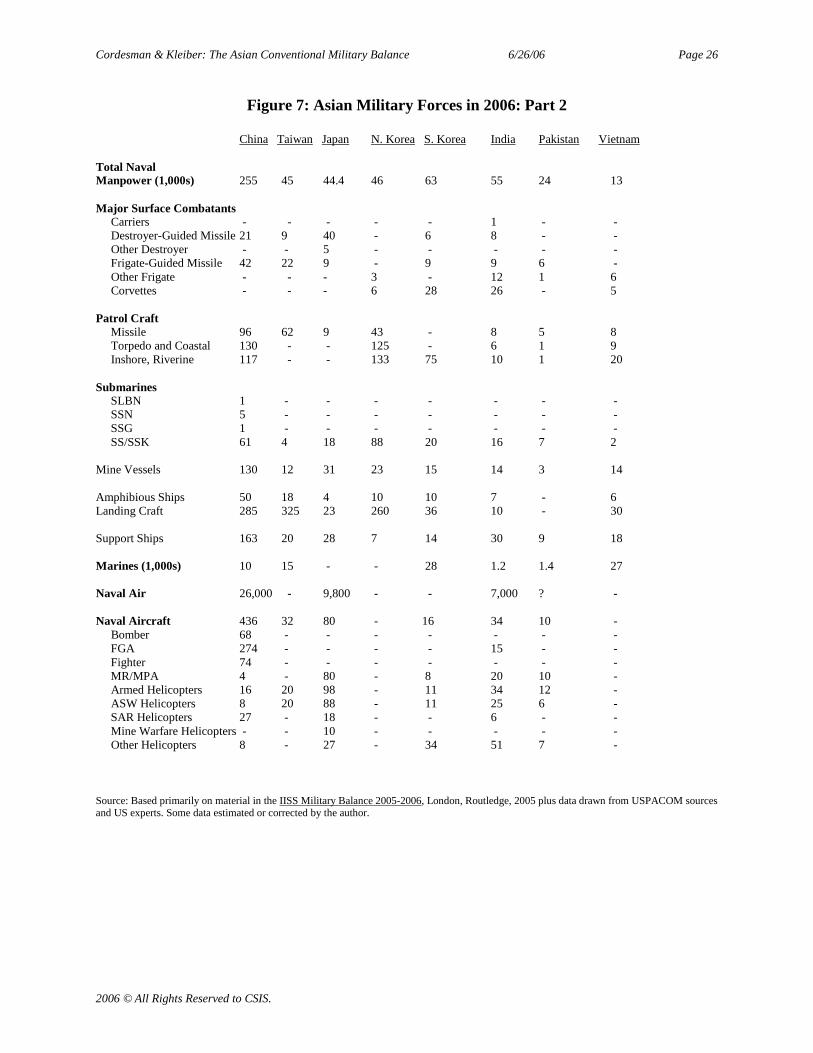
Cordesman & Kleiber: The Asian Conventional Military Balance 6/26/06 Page 26
2006 © All Rights Reserved to CSIS.
Figure 7: Asian Military Forces in 2006: Part 2
China Taiwan Japan N. Korea S. Korea India Pakistan Vietnam
Total NavalManpower (1,000s) 255 45 44.4 46 63 55 24 13
Major Surface CombatantsCarriers - - - - - 1 - -Destroyer-Guided Missile 21 9 40 - 6 8 - -Other Destroyer - - 5 - - - - -Frigate-Guided Missile 42 22 9 - 9 9 6 -Other Frigate - - - 3 - 12 1 6Corvettes - - - 6 28 26 - 5
Patrol CraftMissile 96 62 9 43 - 8 5 8Torpedo and Coastal 130 - - 125 - 6 1 9Inshore, Riverine 117 - - 133 75 10 1 20
SubmarinesSLBN 1 - - - - - - -SSN 5 - - - - - - -SSG 1 - - - - - - -SS/SSK 61 4 18 88 20 16 7 2
Mine Vessels 130 12 31 23 15 14 3 14
Amphibious Ships 50 18 4 10 10 7 - 6Landing Craft 285 325 23 260 36 10 - 30
Support Ships 163 20 28 7 14 30 9 18
Marines (1,000s) 10 15 - - 28 1.2 1.4 27
Naval Air 26,000 - 9,800 - - 7,000 ? -
Naval Aircraft 436 32 80 - 16 34 10 -Bomber 68 - - - - - - -FGA 274 - - - - 15 - -Fighter 74 - - - - - - -MR/MPA 4 - 80 - 8 20 10 -Armed Helicopters 16 20 98 - 11 34 12 -ASW Helicopters 8 20 88 - 11 25 6 -SAR Helicopters 27 - 18 - - 6 - -Mine Warfare Helicopters - - 10 - - - - -Other Helicopters 8 - 27 - 34 51 7 -
Source: Based primarily on material in the IISS Military Balance 2005-2006, London, Routledge, 2005 plus data drawn from USPACOM sourcesand US experts. Some data estimated or corrected by the author.
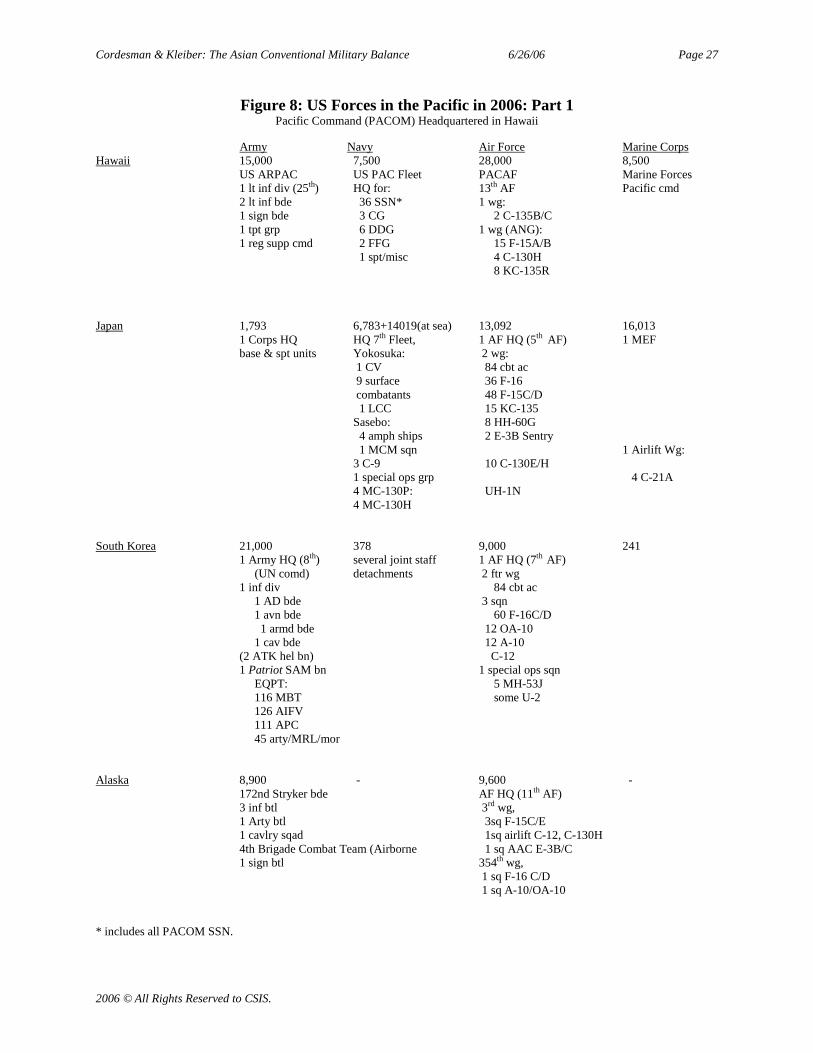
Cordesman & Kleiber: The Asian Conventional Military Balance 6/26/06 Page 27
2006 © All Rights Reserved to CSIS.
Figure 8: US Forces in the Pacific in 2006: Part 1Pacific Command (PACOM) Headquartered in Hawaii
Army Navy Air Force Marine CorpsHawaii 15,000 7,500 28,000 8,500
US ARPAC US PAC Fleet PACAF Marine Forces1 lt inf div (25th) HQ for: 13th AF Pacific cmd2 lt inf bde 36 SSN* 1 wg:1 sign bde 3 CG 2 C-135B/C1 tpt grp 6 DDG 1 wg (ANG):1 reg supp cmd 2 FFG 15 F-15A/B
1 spt/misc 4 C-130H8 KC-135R
Japan 1,793 6,783+14019(at sea) 13,092 16,0131 Corps HQ HQ 7th Fleet, 1 AF HQ (5th AF) 1 MEFbase & spt units Yokosuka: 2 wg:
1 CV 84 cbt ac9 surface 36 F-16combatants 48 F-15C/D1 LCC 15 KC-135
Sasebo: 8 HH-60G4 amph ships 2 E-3B Sentry1 MCM sqn 1 Airlift Wg:
3 C-9 10 C-130E/H1 special ops grp 4 C-21A4 MC-130P: UH-1N4 MC-130H
South Korea 21,000 378 9,000 2411 Army HQ (8th) several joint staff 1 AF HQ (7th AF)
(UN comd) detachments 2 ftr wg1 inf div 84 cbt ac
1 AD bde 3 sqn1 avn bde 60 F-16C/D
1 armd bde 12 OA-101 cav bde 12 A-10
(2 ATK hel bn) C-121 Patriot SAM bn 1 special ops sqn
EQPT: 5 MH-53J116 MBT some U-2
126 AIFV111 APC45 arty/MRL/mor
Alaska 8,900 - 9,600 -172nd Stryker bde AF HQ (11th AF)3 inf btl 3rd wg,1 Arty btl 3sq F-15C/E1 cavlry sqad 1sq airlift C-12, C-130H4th Brigade Combat Team (Airborne 1 sq AAC E-3B/C1 sign btl 354th wg,
1 sq F-16 C/D1 sq A-10/OA-10
* includes all PACOM SSN.
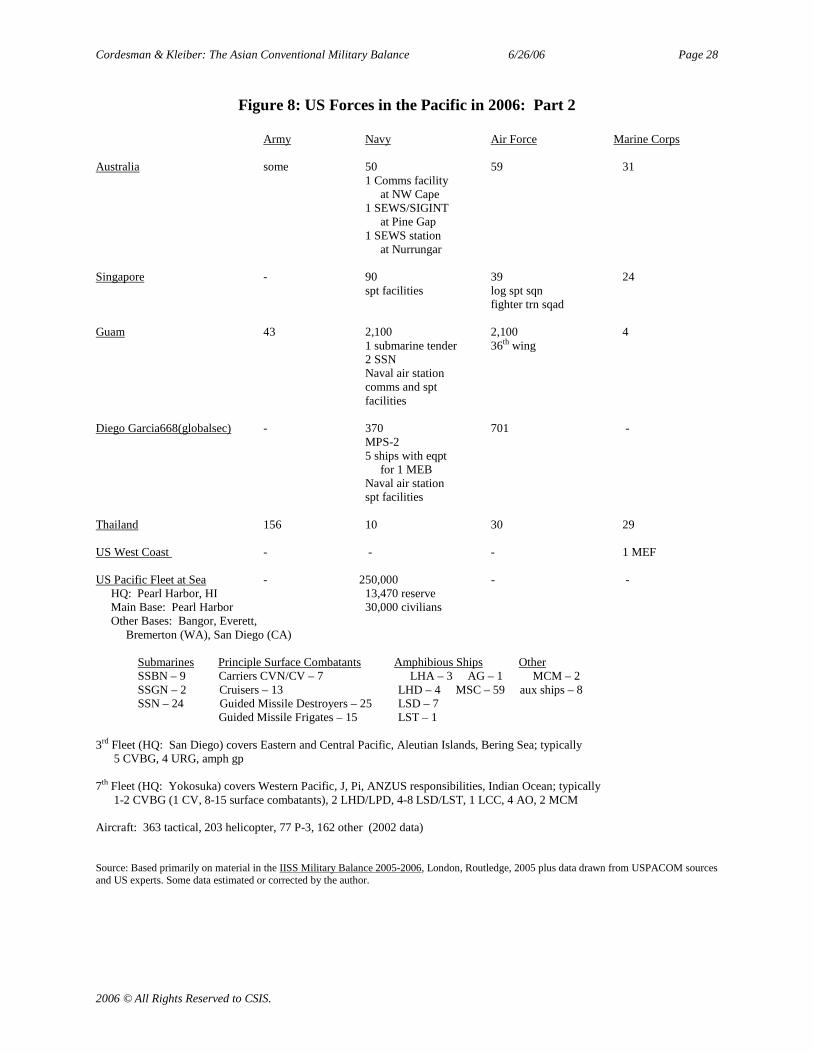
Cordesman & Kleiber: The Asian Conventional Military Balance 6/26/06 Page 28
2006 © All Rights Reserved to CSIS.
Figure 8: US Forces in the Pacific in 2006: Part 2
Army Navy Air Force Marine Corps
Australia some 50 59 311 Comms facility
at NW Cape1 SEWS/SIGINT
at Pine Gap1 SEWS station
at Nurrungar
Singapore - 90 39 24spt facilities log spt sqn
fighter trn sqad
Guam 43 2,100 2,100 41 submarine tender 36th wing2 SSNNaval air stationcomms and sptfacilities
Diego Garcia668(globalsec) - 370 701 -MPS-2
5 ships with eqptfor 1 MEB
Naval air stationspt facilities
Thailand 156 10 30 29
US West Coast - - - 1 MEF
US Pacific Fleet at Sea - 250,000 - -HQ: Pearl Harbor, HI 13,470 reserveMain Base: Pearl Harbor 30,000 civiliansOther Bases: Bangor, Everett,
Bremerton (WA), San Diego (CA)
Submarines Principle Surface Combatants Amphibious Ships OtherSSBN – 9 Carriers CVN/CV – 7 LHA – 3 AG – 1 MCM – 2SSGN – 2 Cruisers – 13 LHD – 4 MSC – 59 aux ships – 8SSN – 24 Guided Missile Destroyers – 25 LSD – 7
Guided Missile Frigates – 15 LST – 1
3rd Fleet (HQ: San Diego) covers Eastern and Central Pacific, Aleutian Islands, Bering Sea; typically5 CVBG, 4 URG, amph gp
7th Fleet (HQ: Yokosuka) covers Western Pacific, J, Pi, ANZUS responsibilities, Indian Ocean; typically1-2 CVBG (1 CV, 8-15 surface combatants), 2 LHD/LPD, 4-8 LSD/LST, 1 LCC, 4 AO, 2 MCM
Aircraft: 363 tactical, 203 helicopter, 77 P-3, 162 other (2002 data)
Source: Based primarily on material in the IISS Military Balance 2005-2006, London, Routledge, 2005 plus data drawn from USPACOM sourcesand US experts. Some data estimated or corrected by the author.
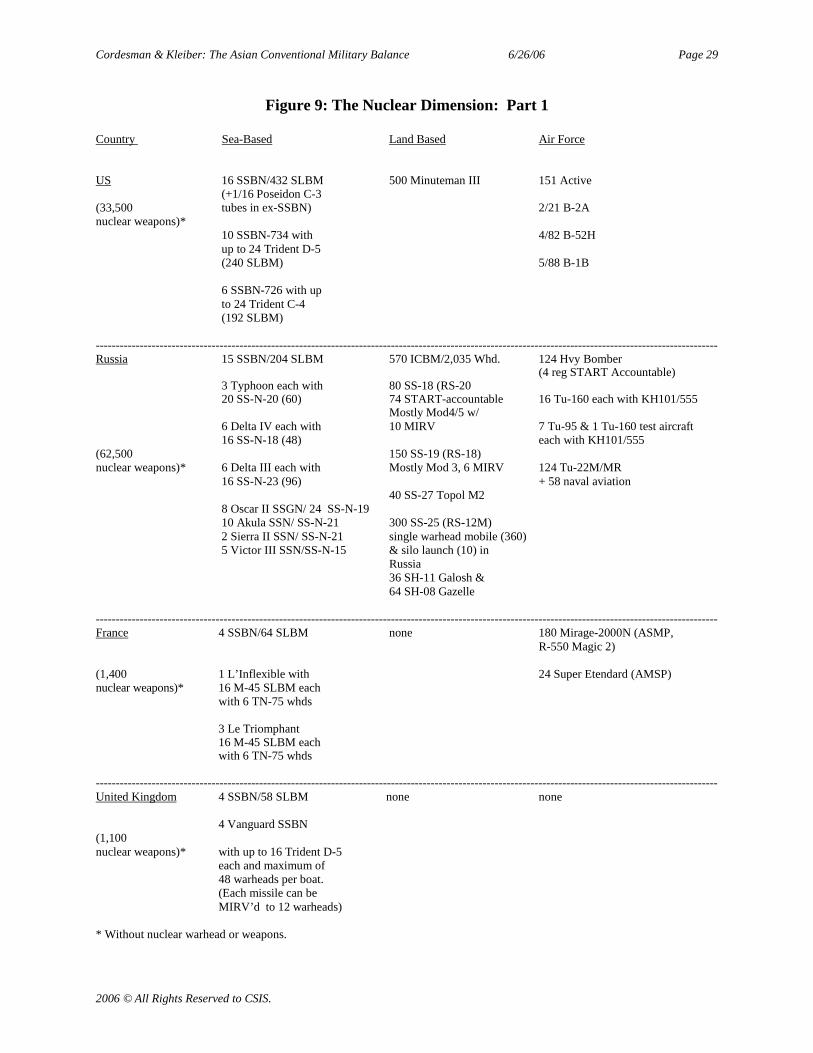
Cordesman & Kleiber: The Asian Conventional Military Balance 6/26/06 Page 29
2006 © All Rights Reserved to CSIS.
Figure 9: The Nuclear Dimension: Part 1
Country Sea-Based Land Based Air Force
US 16 SSBN/432 SLBM 500 Minuteman III 151 Active(+1/16 Poseidon C-3
(33,500 tubes in ex-SSBN) 2/21 B-2Anuclear weapons)*
10 SSBN-734 with 4/82 B-52Hup to 24 Trident D-5
(240 SLBM) 5/88 B-1B
6 SSBN-726 with upto 24 Trident C-4(192 SLBM)
------------------------------------------------------------------------------------------------------------------------------------------------------------Russia 15 SSBN/204 SLBM 570 ICBM/2,035 Whd. 124 Hvy Bomber
(4 reg START Accountable)3 Typhoon each with 80 SS-18 (RS-2020 SS-N-20 (60) 74 START-accountable 16 Tu-160 each with KH101/555
Mostly Mod4/5 w/6 Delta IV each with 10 MIRV 7 Tu-95 & 1 Tu-160 test aircraft16 SS-N-18 (48) each with KH101/555
(62,500 150 SS-19 (RS-18)nuclear weapons)* 6 Delta III each with Mostly Mod 3, 6 MIRV 124 Tu-22M/MR
16 SS-N-23 (96) + 58 naval aviation40 SS-27 Topol M2
8 Oscar II SSGN/ 24 SS-N-1910 Akula SSN/ SS-N-21 300 SS-25 (RS-12M)2 Sierra II SSN/ SS-N-21 single warhead mobile (360)5 Victor III SSN/SS-N-15 & silo launch (10) in
Russia36 SH-11 Galosh &64 SH-08 Gazelle
------------------------------------------------------------------------------------------------------------------------------------------------------------France 4 SSBN/64 SLBM none 180 Mirage-2000N (ASMP,
R-550 Magic 2)
(1,400 1 L’Inflexible with 24 Super Etendard (AMSP)nuclear weapons)* 16 M-45 SLBM each
with 6 TN-75 whds
3 Le Triomphant16 M-45 SLBM eachwith 6 TN-75 whds
------------------------------------------------------------------------------------------------------------------------------------------------------------United Kingdom 4 SSBN/58 SLBM none none
4 Vanguard SSBN(1,100nuclear weapons)* with up to 16 Trident D-5 each and maximum of
48 warheads per boat.(Each missile can beMIRV’d to 12 warheads)
* Without nuclear warhead or weapons.

Cordesman & Kleiber: The Asian Conventional Military Balance 6/26/06 Page 30
2006 © All Rights Reserved to CSIS.
Figure 9: The Nuclear Dimension: Part 2
Country Sea-Based Land Based Air Force
China 1 Xia SSBN with 20 CSS-4 (DF-5A) 76 H-6/H-6E/F/H,12 CSS-N-3 (J-1) MIRV ICBM 20 nuclear capable
(500-1,300nuclear weapons)* 1 mod Romeo SSGN 20 CSS-3 (DF-4) some H-5 with 6 CSS-N-4 ICBM
2 CSS-2 (DF-3A) IRBM33 CSS-5 (DF-21) IRBM
17 DDG each with2-4 quads CSS-N-4 25L/200M DF-15 CSS-6/M-9
(YJ-1) SRBM (600 km)
15 FFG each with 500 DF-11 CSS-7/M-111-8 quads CSS-N-4 SRBM (120-300 KM)(YJ-1)
------------------------------------------------------------------------------------------------------------------------------------------------------------North Korea none some Taep’o Dong 1/2 none
MRBM/ICBM
(550 nuclear weapons)** 10 No Dong (est. 90+ msl)
30+ Scud B/Scud C (200+ msl)------------------------------------------------------------------------------------------------------------------------------------------------------------India none 24 IRBM: 12 Agni-2; 8-12 none
Agni-3 (55-90 nuclear weapons)*** 45 SRBM: SS-150 Prithvi/SS-250
Prithvi/SS-350 Prithvi------------------------------------------------------------------------------------------------------------------------------------------------------------Pakistan none up to 20 Hatf 5 Ghauri none
6 Hatf 4 Shaheen(55-90 nuclear weapons)***
50 Hatf 3 (PRC –M-11)
* Estimate by Sergei Rogov in 2002.** Federation of American Scientists, North Korea Special Weapons Guide, December 2005, available athttp://www.fas.org/nuke/guide/dprk/missile/index.html.*** K. Alan Kronstadt, “Pakistan-U.S. Relations”, Congressional Research Report 67139, May 9, 2006.
Source: Adapted by Anthony H. Cordesman from the IISS Military Balance 2005-2006, London, Routledge, 2005; James Foley, “Koreanreconciliation still a distant dream,” Jane’s Intelligence Review, February 1, 2002.
Cordesman & Kleiber: The Asian Conventional Military Balance 6/26/06 Page 31
2006 © All Rights Reserved to CSIS.
The Major Asian Powers
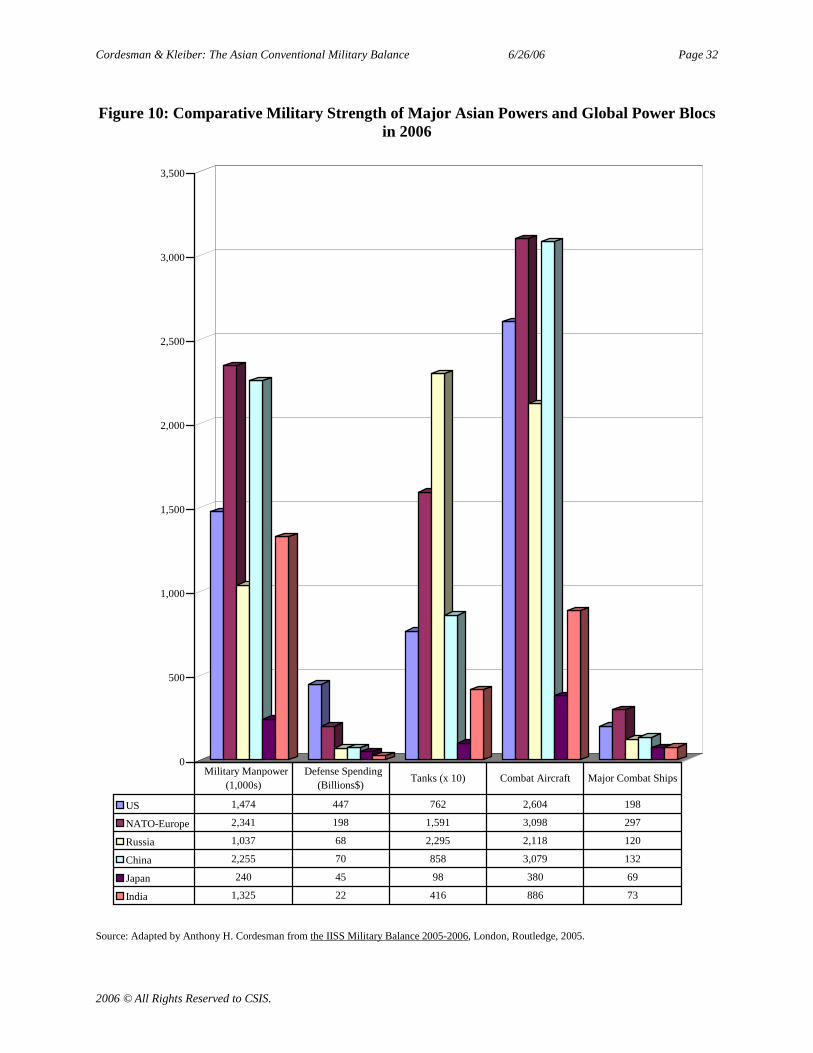
Cordesman & Kleiber: The Asian Conventional Military Balance 6/26/06 Page 32
2006 © All Rights Reserved to CSIS.
Figure 10: Comparative Military Strength of Major Asian Powers and Global Power Blocsin 2006
0
500
1,000
1,500
2,000
2,500
3,000
3,500
US 1,474 447 762 2,604 198
NATO-Europe 2,341 198 1,591 3,098 297
Russia 1,037 68 2,295 2,118 120
China 2,255 70 858 3,079 132
Japan 240 45 98 380 69
India 1,325 22 416 886 73
Military Manpower(1,000s)
Defense Spending(Billions$)
Tanks (x 10) Combat Aircraft Major Combat Ships
Source: Adapted by Anthony H. Cordesman from the IISS Military Balance 2005-2006, London, Routledge, 2005.
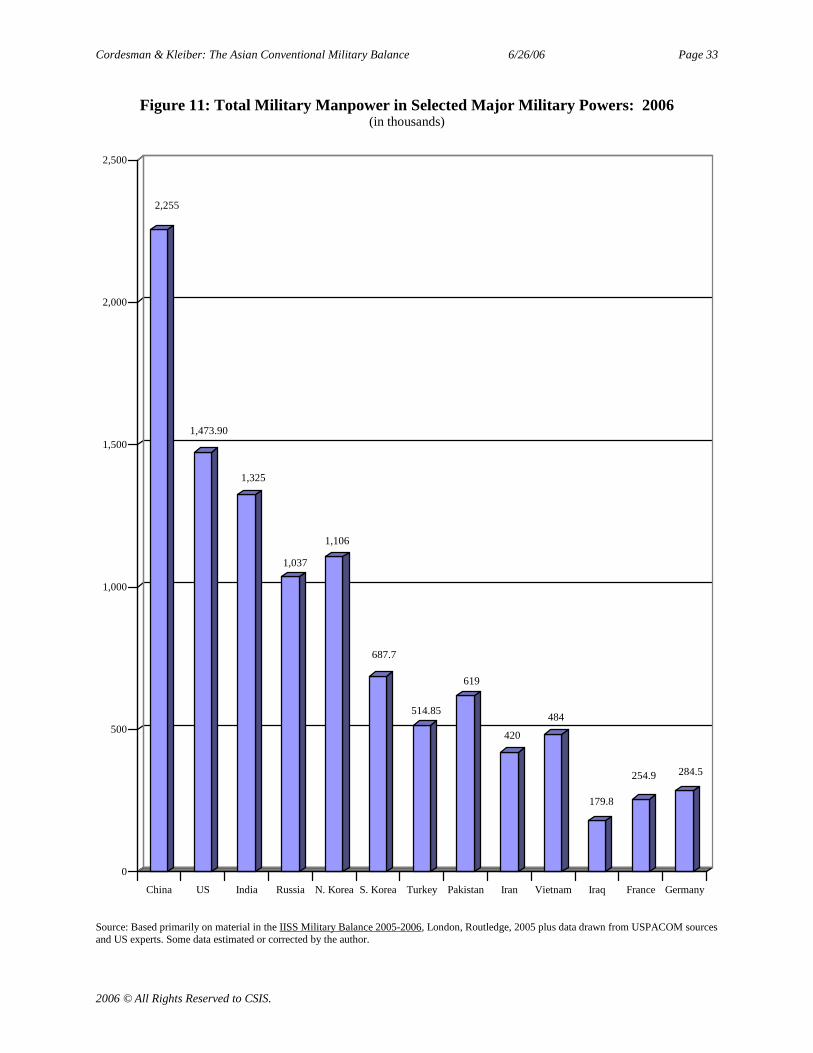
Cordesman & Kleiber: The Asian Conventional Military Balance 6/26/06 Page 33
2006 © All Rights Reserved to CSIS.
Figure 11: Total Military Manpower in Selected Major Military Powers: 2006(in thousands)
2,255
1,473.90
1,325
1,037
1,106
687.7
514.85
619
420
484
179.8
254.9 284.5
0
500
1,000
1,500
2,000
2,500
China US India Russia N. Korea S. Korea Turkey Pakistan Iran Vietnam Iraq France Germany
Source: Based primarily on material in the IISS Military Balance 2005-2006, London, Routledge, 2005 plus data drawn from USPACOM sourcesand US experts. Some data estimated or corrected by the author.
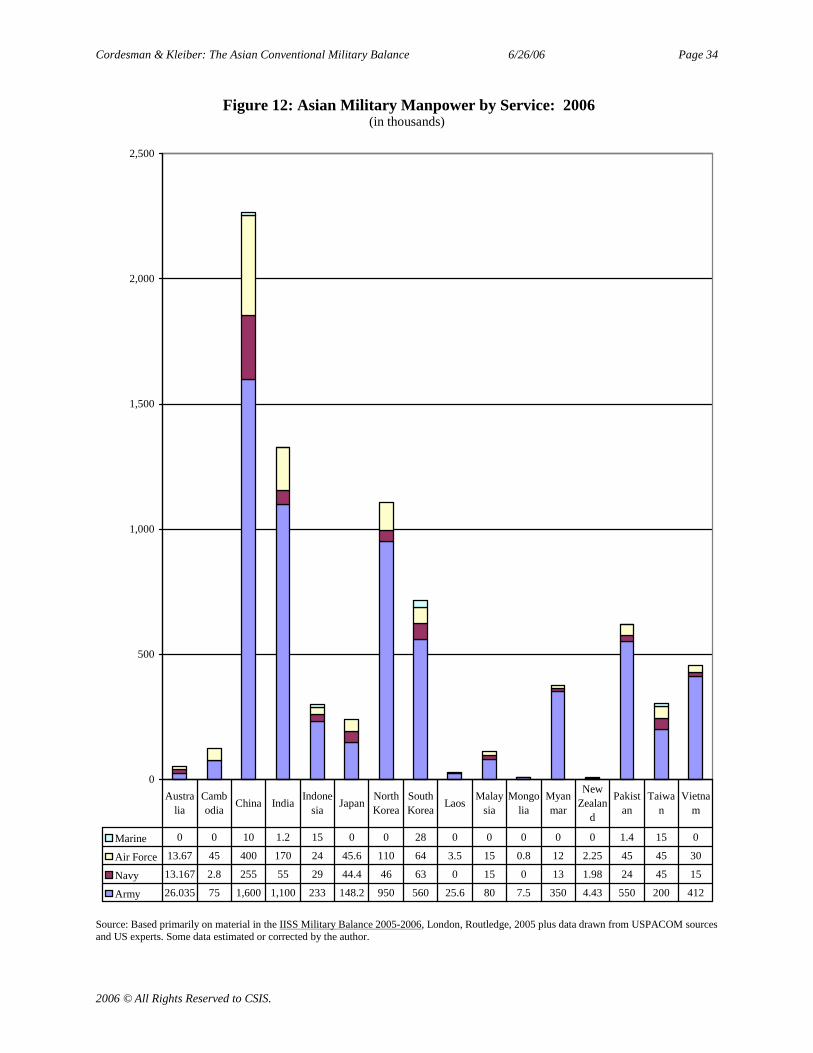
Cordesman & Kleiber: The Asian Conventional Military Balance 6/26/06 Page 34
2006 © All Rights Reserved to CSIS.
Figure 12: Asian Military Manpower by Service: 2006(in thousands)
0
500
1,000
1,500
2,000
2,500
Marine 0 0 10 1.2 15 0 0 28 0 0 0 0 0 1.4 15 0
Air Force 13.67 45 400 170 24 45.6 110 64 3.5 15 0.8 12 2.25 45 45 30
Navy 13.167 2.8 255 55 29 44.4 46 63 0 15 0 13 1.98 24 45 15
Army 26.035 75 1,600 1,100 233 148.2 950 560 25.6 80 7.5 350 4.43 550 200 412
Australia
Cambodia
China IndiaIndone
siaJapan
NorthKorea
SouthKorea
LaosMalay
siaMongo
liaMyanmar
NewZealan
d
Pakistan
Taiwan
Vietnam
Source: Based primarily on material in the IISS Military Balance 2005-2006, London, Routledge, 2005 plus data drawn from USPACOM sourcesand US experts. Some data estimated or corrected by the author.
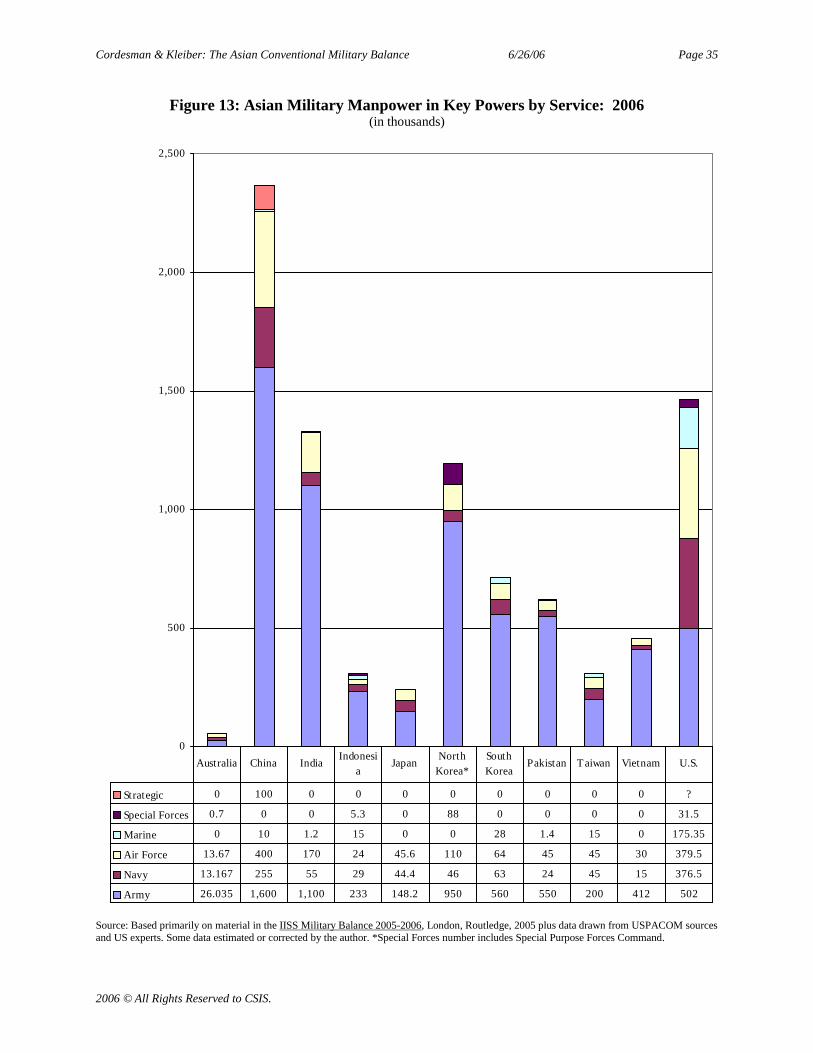
Cordesman & Kleiber: The Asian Conventional Military Balance 6/26/06 Page 35
2006 © All Rights Reserved to CSIS.
Figure 13: Asian Military Manpower in Key Powers by Service: 2006(in thousands)
0
500
1,000
1,500
2,000
2,500
Strategic 0 100 0 0 0 0 0 0 0 0 ?
Special Forces 0.7 0 0 5.3 0 88 0 0 0 0 31.5
Marine 0 10 1.2 15 0 0 28 1.4 15 0 175.35
Air Force 13.67 400 170 24 45.6 110 64 45 45 30 379.5
Navy 13.167 255 55 29 44.4 46 63 24 45 15 376.5
Army 26.035 1,600 1,100 233 148.2 950 560 550 200 412 502
Australia China IndiaIndonesi
aJapan
NorthKorea*
SouthKorea
Pakistan Taiwan Vietnam U.S.
Source: Based primarily on material in the IISS Military Balance 2005-2006, London, Routledge, 2005 plus data drawn from USPACOM sourcesand US experts. Some data estimated or corrected by the author. *Special Forces number includes Special Purpose Forces Command.
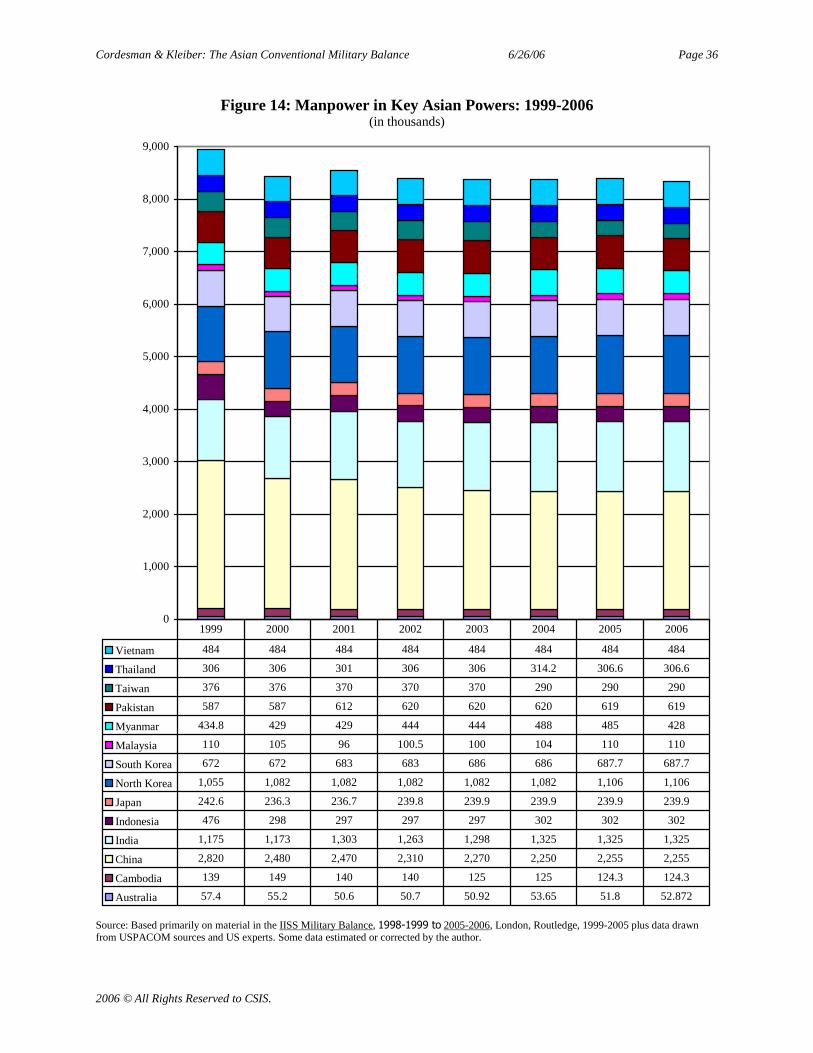
Cordesman & Kleiber: The Asian Conventional Military Balance 6/26/06 Page 36
2006 © All Rights Reserved to CSIS.
Figure 14: Manpower in Key Asian Powers: 1999-2006(in thousands)
0
1,000
2,000
3,000
4,000
5,000
6,000
7,000
8,000
9,000
Vietnam 484 484 484 484 484 484 484 484
Thailand 306 306 301 306 306 314.2 306.6 306.6
Taiwan 376 376 370 370 370 290 290 290
Pakistan 587 587 612 620 620 620 619 619
Myanmar 434.8 429 429 444 444 488 485 428
Malaysia 110 105 96 100.5 100 104 110 110
South Korea 672 672 683 683 686 686 687.7 687.7
North Korea 1,055 1,082 1,082 1,082 1,082 1,082 1,106 1,106
Japan 242.6 236.3 236.7 239.8 239.9 239.9 239.9 239.9
Indonesia 476 298 297 297 297 302 302 302
India 1,175 1,173 1,303 1,263 1,298 1,325 1,325 1,325
China 2,820 2,480 2,470 2,310 2,270 2,250 2,255 2,255
Cambodia 139 149 140 140 125 125 124.3 124.3
Australia 57.4 55.2 50.6 50.7 50.92 53.65 51.8 52.872
1999 2000 2001 2002 2003 2004 2005 2006
Source: Based primarily on material in the IISS Military Balance, 1998-1999 to 2005-2006, London, Routledge, 1999-2005 plus data drawnfrom USPACOM sources and US experts. Some data estimated or corrected by the author.

Cordesman & Kleiber: The Asian Conventional Military Balance 6/26/06 Page 37
2006 © All Rights Reserved to CSIS.
Figure 15: Asian Main Battle Tanks: 2006(Number in active service)
101
150
3,978
0
980
3,500
2,330
25
0
370
150
0
2,461
0
100
926
333
1,315
7,580
0 1,000 2,000 3,000 4,000 5,000 6,000 7,000 8,000
Australia
Cambodia
China
India
Indonesia
Japan
North Korea
South Korea
Laos
Malaysia
Mongolia
Myanmar
New Zealand
Pakistan
Philippines
Singapore
Taiwan
Thailand
Vietnam
Source: Based primarily on material in the IISS Military Balance 2005-2006, London, Routledge, 2005 plus data drawn from USPACOM sourcesand US experts. Some data estimated or corrected by the author.

Cordesman & Kleiber: The Asian Conventional Military Balance 6/26/06 Page 38
2006 © All Rights Reserved to CSIS.
Figure 16: Main Battle Tanks in Key Asian Powers: 1999-2006(in thousands)
0
5,000
10,000
15,000
20,000
25,000
Vietnam 1,315 1,315 1,315 1,315 1,315 1,315 1,315 1,315
Thailand 277 289 282 333 333 333 333 333
Taiwan 719 719 639 926 926 926 926 926
Pakistan 2,120 2,320 2,285 2,300 2,357 2,368 2,461 2,461
Myanmar 126 100 100 100 100 100 150 150
Malaysia 0 0 0 0 0 0 0 0
South Korea 2,130 2,130 2,330 2,330 2,330 2,330 2,250 2,330
North Korea 3,000 3,500 3,500 3,500 3,500 3,500 3,500 3,500
Japan 1,090 1,080 1,070 1,050 1,040 1,020 700 980
Indonesia 0 0 0 0 0 0 0 0
India 3,414 3,414 3,414 3,414 3,898 3,898 3,898 3,978
China 8,800 8,300 7,060 8,000 7,010 7,180 7,580 7,580
Cambodia 150 150 150 150 150 150 150 150
Australia 71 71 71 71 71 71 71 101
1999 2000 2001 2002 2003 2004 2005 2006
Source: Based primarily on material in the IISS Military Balance 1998-1999 to 2005-2006, London, Routledge, 1999-2005 plus data drawn fromUSPACOM sources and US experts. Some data estimated or corrected by the author.
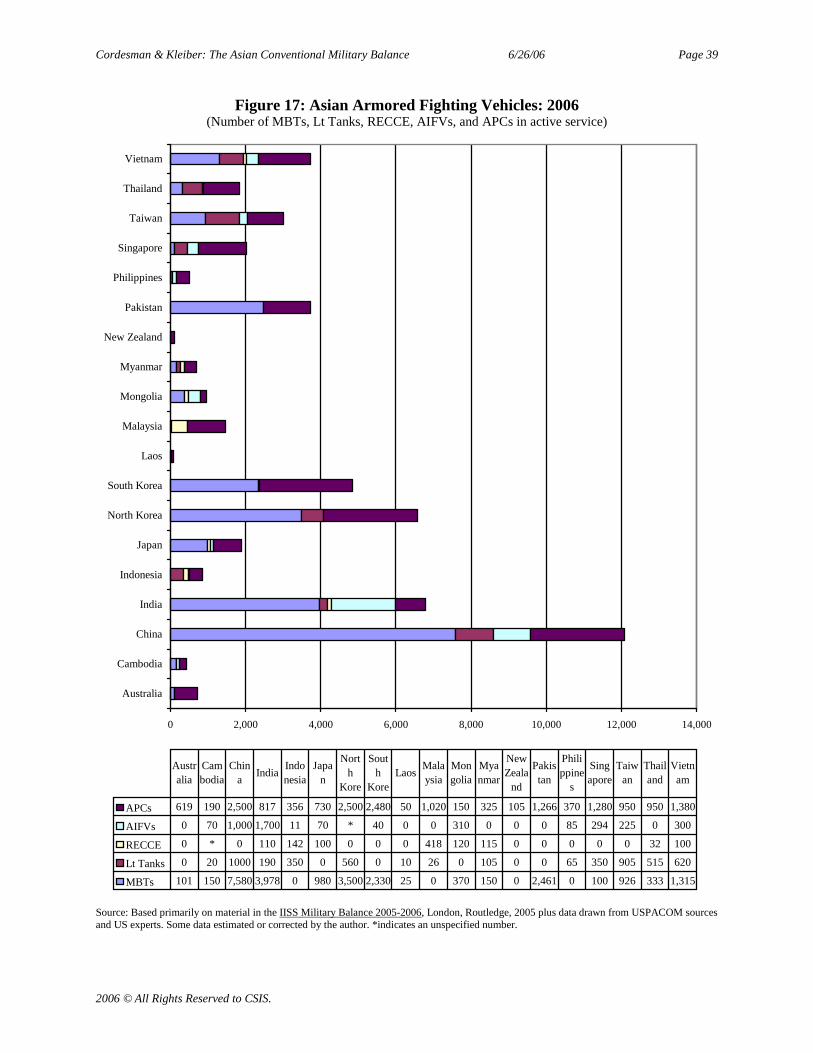
Cordesman & Kleiber: The Asian Conventional Military Balance 6/26/06 Page 39
2006 © All Rights Reserved to CSIS.
Figure 17: Asian Armored Fighting Vehicles: 2006(Number of MBTs, Lt Tanks, RECCE, AIFVs, and APCs in active service)
0 2,000 4,000 6,000 8,000 10,000 12,000 14,000
Australia
Cambodia
China
India
Indonesia
Japan
North Korea
South Korea
Laos
Malaysia
Mongolia
Myanmar
New Zealand
Pakistan
Philippines
Singapore
Taiwan
Thailand
Vietnam
APCs 619 190 2,500 817 356 730 2,500 2,480 50 1,020 150 325 105 1,266 370 1,280 950 950 1,380
AIFVs 0 70 1,000 1,700 11 70 * 40 0 0 310 0 0 0 85 294 225 0 300
RECCE 0 * 0 110 142 100 0 0 0 418 120 115 0 0 0 0 0 32 100
Lt Tanks 0 20 1000 190 350 0 560 0 10 26 0 105 0 0 65 350 905 515 620
MBTs 101 150 7,580 3,978 0 980 3,500 2,330 25 0 370 150 0 2,461 0 100 926 333 1,315
Australia
Cambodia
China
IndiaIndonesia
Japan
North
Kore
South
KoreLaos
Malaysia
Mongolia
Myanmar
NewZeala
nd
Pakistan
Philippine
s
Singapore
Taiwan
Thailand
Vietnam
Source: Based primarily on material in the IISS Military Balance 2005-2006, London, Routledge, 2005 plus data drawn from USPACOM sourcesand US experts. Some data estimated or corrected by the author. *indicates an unspecified number.

Cordesman & Kleiber: The Asian Conventional Military Balance 6/26/06 Page 40
2006 © All Rights Reserved to CSIS.
Figure 18: Asian Land Weapons in Key Powers: 2006(Number in active service)
0 5,000 10,000 15,000 20,000 25,000 30,000
Australia
China
India
Indonesia
Japan
North Korea
South Korea
Pakistan
Vietnam
MLRS 0 2,400 180 0 110 2,500 185 52 710
Towed Arty 270 14,000 5,625 185 480 3,500 3,500 1,629 2,300
SP Arty 0 1,200 150 0 250 4,400 1,089 260 31
APCs 619 2,500 817 356 730 2,500 2,480 1,266 1,380
OAFVs 0 2,000 2,000 503 170 560 40 0 1,020
MBTs 101 7,580 3,978 0 980 3,500 2,330 2,461 1,315
Australia China India Indonesia Japan North Korea South Korea Pakistan Vietnam
Source: Based primarily on material in the IISS Military Balance 2005-2006, London, Routledge, 2005 plus data drawn from USPACOM sourcesand US experts. Some data estimated or corrected by the author.
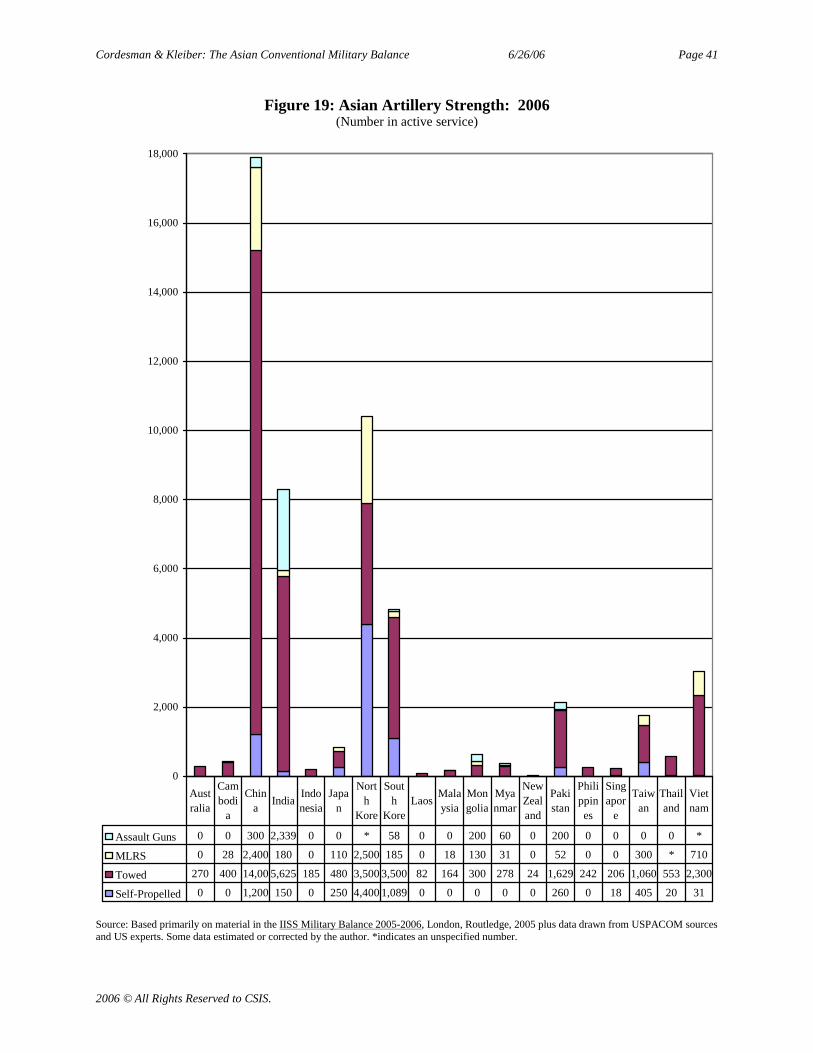
Cordesman & Kleiber: The Asian Conventional Military Balance 6/26/06 Page 41
2006 © All Rights Reserved to CSIS.
Figure 19: Asian Artillery Strength: 2006(Number in active service)
0
2,000
4,000
6,000
8,000
10,000
12,000
14,000
16,000
18,000
Assault Guns 0 0 300 2,339 0 0 * 58 0 0 200 60 0 200 0 0 0 0 *
MLRS 0 28 2,400 180 0 110 2,500 185 0 18 130 31 0 52 0 0 300 * 710
Towed 270 400 14,00 5,625 185 480 3,500 3,500 82 164 300 278 24 1,629 242 206 1,060 553 2,300
Self-Propelled 0 0 1,200 150 0 250 4,400 1,089 0 0 0 0 0 260 0 18 405 20 31
Australia
Cambodi
a
China
IndiaIndonesia
Japan
North
Kore
South
KoreLaos
Malaysia
Mongolia
Myanmar
NewZealand
Pakistan
Philippines
Singapor
e
Taiwan
Thailand
Vietnam
Source: Based primarily on material in the IISS Military Balance 2005-2006, London, Routledge, 2005 plus data drawn from USPACOM sourcesand US experts. Some data estimated or corrected by the author. *indicates an unspecified number.

Cordesman & Kleiber: The Asian Conventional Military Balance 6/26/06 Page 42
2006 © All Rights Reserved to CSIS.
Figure 20: Asian Fixed and Rotary Wing Combat Aircraft: 2006(Number in active service)
0 500 1,000 1,500 2,000 2,500 3,000 3,500
Australia
Cambodia
China
India
Indonesia
Japan
North Korea
South Korea
Laos
Malaysia
Mongolia
Myanmar
New Zealand
Pakistan
Philippines
Singapore
Taiwan
Thailand
Vietnam
Air Force Hel * 18 80 296 38 40 306 28 27 53 13 66 19 * 80 110 35 47 75
Navy Hel 35 0 0 109 37 143 0 45 0 6 0 0 5 0 4 0 20 23 0
Army Hel 117 0 375 162 51 433 0 424 0 9 0 0 0 153 0 0 220 212 0
Air Force Fixed Wing 140 24 2,64 852 94 300 590 540 22 63 9 125 6 331 21 111 479 165 221
Navy Fixed Wing 0 0 436 34 48 80 0 16 0 0 0 0 0 0 6 0 32 18 0
Army Fixed Wing 6 0 0 0 11 20 0 0 0 0 0 0 0 124 4 0 0 93 0
Australia
Cambodi
a
China
India
Indonesi
a
Japan
North
Kore
South
KoreLaos
Malaysi
a
Mongolia
Myanma
r
NewZealand
Pakistan
Philippines
Singapor
e
Taiwan
Thailand
Vietnam
Source: Based primarily on material in the IISS Military Balance 2005-2006, London, Routledge, 2005 plus data drawn from USPACOM sourcesand US experts. Some data estimated or corrected by the author. *indicates an unspecified number.
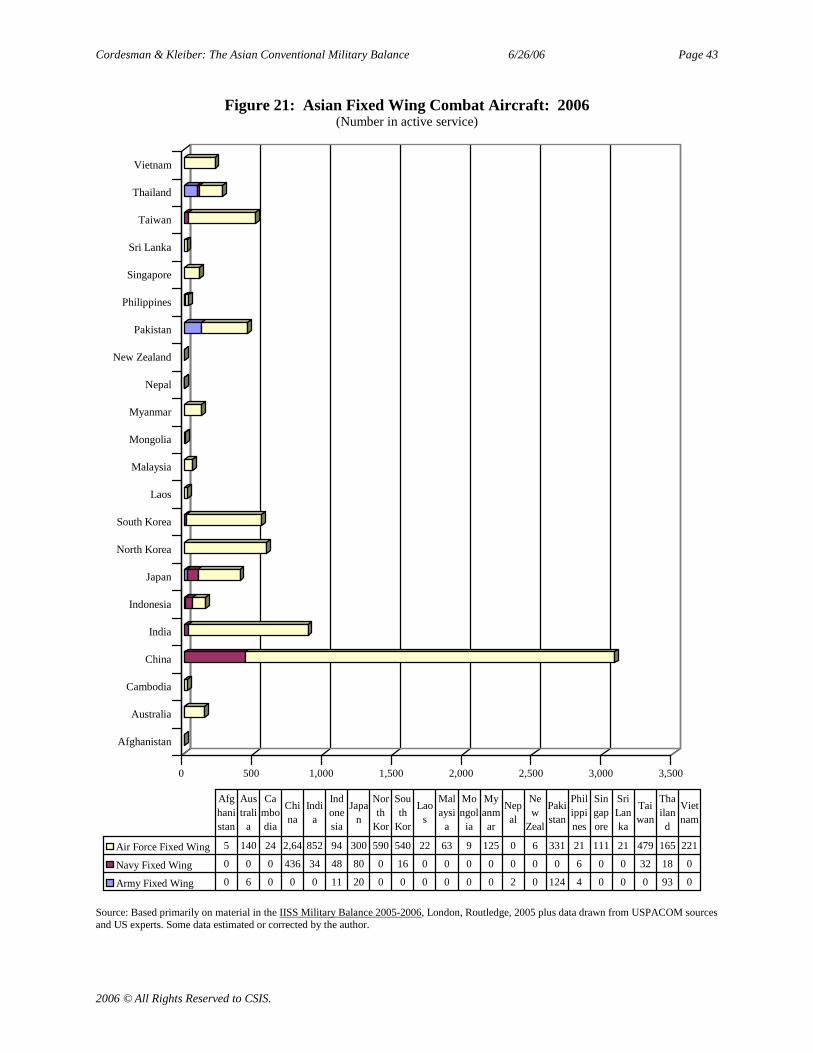
Cordesman & Kleiber: The Asian Conventional Military Balance 6/26/06 Page 43
2006 © All Rights Reserved to CSIS.
Figure 21: Asian Fixed Wing Combat Aircraft: 2006(Number in active service)
0 500 1,000 1,500 2,000 2,500 3,000 3,500
Afghanistan
Australia
Cambodia
China
India
Indonesia
Japan
North Korea
South Korea
Laos
Malaysia
Mongolia
Myanmar
Nepal
New Zealand
Pakistan
Philippines
Singapore
Sri Lanka
Taiwan
Thailand
Vietnam
Air Force Fixed Wing 5 140 24 2,64 852 94 300 590 540 22 63 9 125 0 6 331 21 111 21 479 165 221
Navy Fixed Wing 0 0 0 436 34 48 80 0 16 0 0 0 0 0 0 0 6 0 0 32 18 0
Army Fixed Wing 0 6 0 0 0 11 20 0 0 0 0 0 0 2 0 124 4 0 0 0 93 0
Afghanistan
Australi
a
Cambodia
China
India
Indonesia
Japan
North
Kor
South
Kor
Laos
Malaysi
a
Mongol
ia
Myanmar
Nepal
New
Zeal
Pakistan
Philippines
Singapore
SriLanka
Taiwan
Thailand
Vietnam
Source: Based primarily on material in the IISS Military Balance 2005-2006, London, Routledge, 2005 plus data drawn from USPACOM sourcesand US experts. Some data estimated or corrected by the author.

Cordesman & Kleiber: The Asian Conventional Military Balance 6/26/06 Page 44
2006 © All Rights Reserved to CSIS.
Figure 22: Asian Rotary Wing Combat Aircraft: 2006(Number in active service)
0 100 200 300 400 500 600 700
Afghanistan
Australia
Cambodia
China
India
Indonesia
Japan
North Korea
South Korea
Laos
Malaysia
Mongolia
Myanmar
Nepal
New Zealand
Pakistan
Philippines
Singapore
Sri Lanka
Taiwan
Thailand
Vietnam
Air Force Hel 0 * 18 80 296 38 40 306 28 27 53 13 66 0 19 * 80 110 49 35 47 75
Navy Hel 0 35 0 0 109 37 143 0 45 0 6 0 0 0 5 0 4 0 0 20 23 0
Army Hel 13 117 0 375 162 51 433 0 424 0 9 0 0 12 0 153 0 0 0 220 212 0
Afghanistan
Australi
a
Cambodia
China
India
Indonesia
Japan
North
Kor
South
Kor
Laos
Malaysi
a
Mongol
ia
Myanm
ar
Nepal
NewZealand
Pakistan
Philippines
Singapore
SriLanka
Taiwan
Thailan
d
Vietnam
Source: Based primarily on material in the IISS Military Balance 2005-2006, London, Routledge, 2005 plus data drawn from USPACOM sourcesand US experts. Some data estimated or corrected by the author. *indicates an unspecified number.
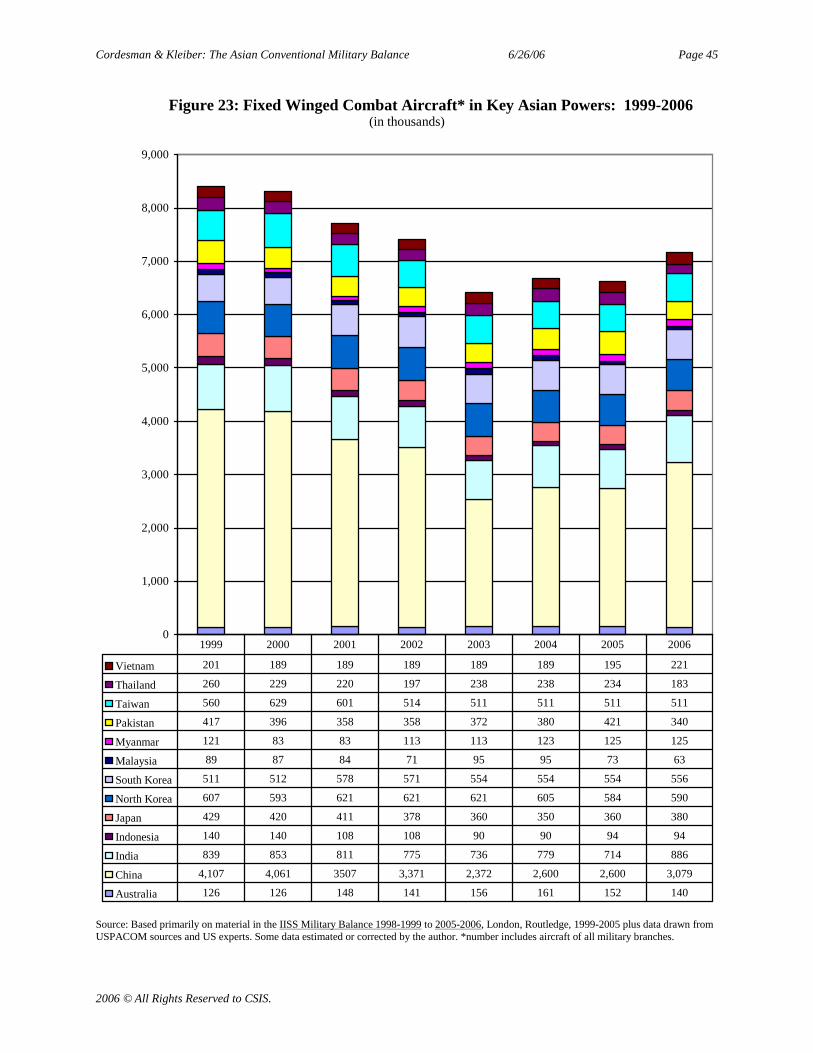
Cordesman & Kleiber: The Asian Conventional Military Balance 6/26/06 Page 45
2006 © All Rights Reserved to CSIS.
Figure 23: Fixed Winged Combat Aircraft* in Key Asian Powers: 1999-2006(in thousands)
0
1,000
2,000
3,000
4,000
5,000
6,000
7,000
8,000
9,000
Vietnam 201 189 189 189 189 189 195 221
Thailand 260 229 220 197 238 238 234 183
Taiwan 560 629 601 514 511 511 511 511
Pakistan 417 396 358 358 372 380 421 340
Myanmar 121 83 83 113 113 123 125 125
Malaysia 89 87 84 71 95 95 73 63
South Korea 511 512 578 571 554 554 554 556
North Korea 607 593 621 621 621 605 584 590
Japan 429 420 411 378 360 350 360 380
Indonesia 140 140 108 108 90 90 94 94
India 839 853 811 775 736 779 714 886
China 4,107 4,061 3507 3,371 2,372 2,600 2,600 3,079
Australia 126 126 148 141 156 161 152 140
1999 2000 2001 2002 2003 2004 2005 2006
Source: Based primarily on material in the IISS Military Balance 1998-1999 to 2005-2006, London, Routledge, 1999-2005 plus data drawn fromUSPACOM sources and US experts. Some data estimated or corrected by the author. *number includes aircraft of all military branches.

Cordesman & Kleiber: The Asian Conventional Military Balance 6/26/06 Page 46
2006 © All Rights Reserved to CSIS.
Figure 24: Asian Naval Combat Ships: 2006(Number in active service)
0
100
200
300
400
500
600
700
800
900
1,000
Amphibious 0 23 0 335 17 91 27 270 48 4 3 0 11 0 0 0 46 40 9 343 62 36
Mine 0 9 0 130 18 11 31 23 15 0 4 0 0 0 0 3 0 4 0 12 20 15
Other Patrol 0 15 10 235 33 19 0 279 75 40 27 0 60 0 4 4 58 11 111 0 104 29
Missile Patrol 0 0 0 96 8 4 9 22 5 0 8 0 11 0 0 6 0 6 2 59 6 8
Corvettes 0 0 0 0 28 16 0 6 28 0 6 0 4 0 0 0 0 6 0 0 5 5
Frigates 0 10 0 42 17 13 9 3 9 0 4 0 0 0 2 7 1 0 0 21 12 6
Destroyers 0 0 0 21 8 0 44 0 6 0 0 0 0 0 0 0 0 0 0 11 0 0
Carriers 0 0 0 0 1 0 0 0 0 0 0 0 0 0 0 0 0 0 0 0 1 0
Submarines 0 6 0 69 19 2 16 88 20 0 0 0 0 0 0 11 0 3 0 4 0 2
SSNs 0 0 0 6 0 0 0 0 0 0 0 0 0 0 0 0 0 0 0 0 0 0
Afghanistan
Australi
a
Cambodia
China
India
Indonesia
Japan
North
Kor
South
Kor
Laos
Malaysi
a
Mongol
ia
Myanm
ar
Nepal
NewZealand
Pakistan
Philippines
Singapore
SriLanka
Taiwan
Thailan
d
Vietnam
Source: Based primarily on material in the IISS Military Balance 2005-2006, London, Routledge, 2005 plus data drawn from USPACOM sourcesand US experts. Some data estimated or corrected by the author.

Cordesman & Kleiber: The Asian Conventional Military Balance 6/26/06 Page 47
2006 © All Rights Reserved to CSIS.
Figure 25: Asian Naval Combat Ships in Key Powers: 2006(Number in active service)
0
100
200
300
400
500
600
700
Amphibious 23 335 17 91 27 270 48 0 343 12 36
Mine 9 130 18 11 31 23 15 3 12 4 15
Major Surface 10 63 54 29 53 9 43 7 32 58 11
Missile Patrol 0 96 8 4 9 22 5 6 59 21 8
Carriers 0 0 1 0 0 0 0 0 0 6 0
Submarines 6 69 19 2 16 88 20 11 4 34 2
Australia China India Indonesia JapanNorthKorea
SouthKorea
Pakistan TaiwanUS
PACOM*Vietnam
Source: Based primarily on material in the IISS Military Balance 2005-2006, London, Routledge, 2005 plus data drawn from USPACOM sourcesand US experts. Some data estimated or corrected by the author. *”Missile Patrol” includes all patrol craft.
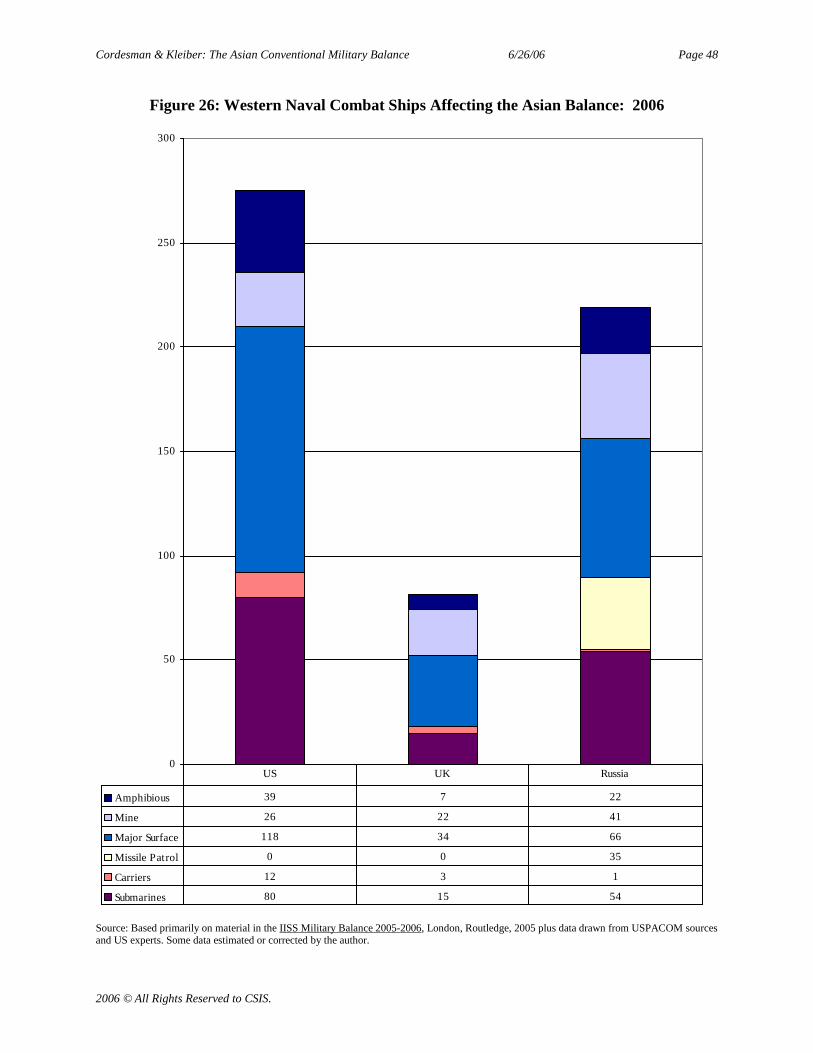
Cordesman & Kleiber: The Asian Conventional Military Balance 6/26/06 Page 48
2006 © All Rights Reserved to CSIS.
Figure 26: Western Naval Combat Ships Affecting the Asian Balance: 2006
0
50
100
150
200
250
300
Amphibious 39 7 22
Mine 26 22 41
Major Surface 118 34 66
Missile Patrol 0 0 35
Carriers 12 3 1
Submarines 80 15 54
US UK Russia
Source: Based primarily on material in the IISS Military Balance 2005-2006, London, Routledge, 2005 plus data drawn from USPACOM sourcesand US experts. Some data estimated or corrected by the author.
Cordesman & Kleiber: The Asian Conventional Military Balance 6/26/06 Page 49
2006 © All Rights Reserved to CSIS.
Northeast Asian Military Balance
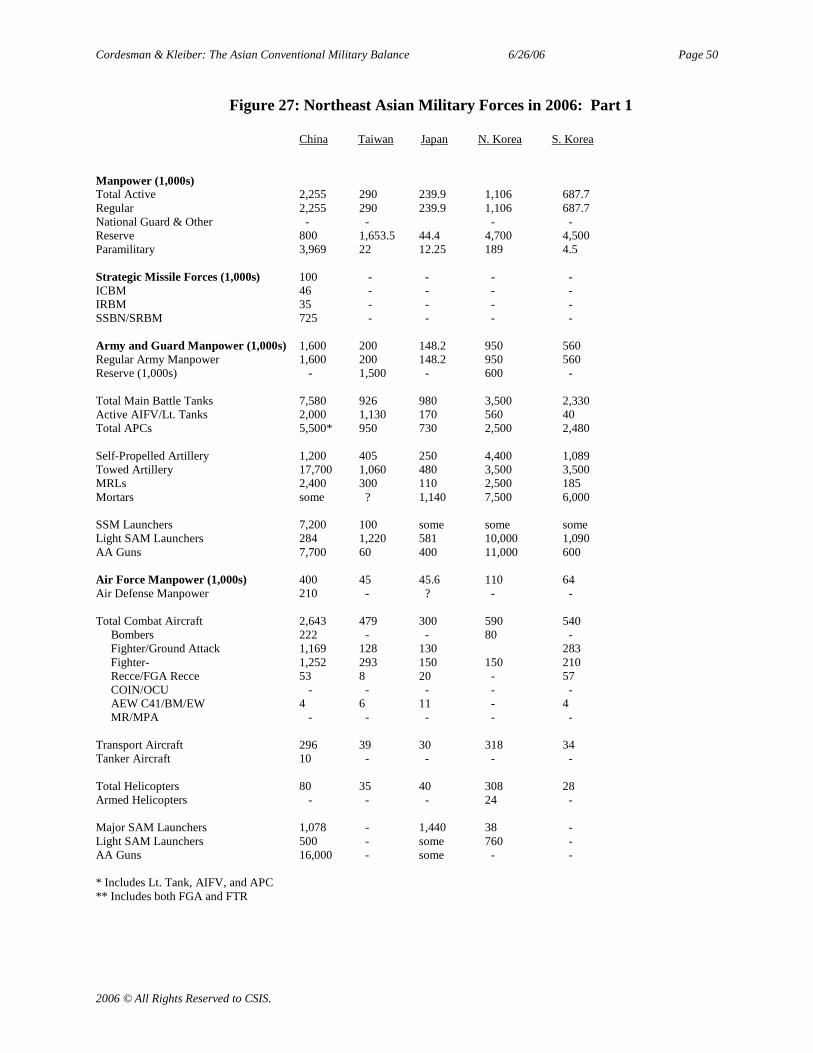
Cordesman & Kleiber: The Asian Conventional Military Balance 6/26/06 Page 50
2006 © All Rights Reserved to CSIS.
Figure 27: Northeast Asian Military Forces in 2006: Part 1
China Taiwan Japan N. Korea S. Korea
Manpower (1,000s)Total Active 2,255 290 239.9 1,106 687.7Regular 2,255 290 239.9 1,106 687.7National Guard & Other - - - -Reserve 800 1,653.5 44.4 4,700 4,500Paramilitary 3,969 22 12.25 189 4.5
Strategic Missile Forces (1,000s) 100 - - - -ICBM 46 - - - -IRBM 35 - - - -SSBN/SRBM 725 - - - -
Army and Guard Manpower (1,000s) 1,600 200 148.2 950 560Regular Army Manpower 1,600 200 148.2 950 560Reserve (1,000s) - 1,500 - 600 -
Total Main Battle Tanks 7,580 926 980 3,500 2,330Active AIFV/Lt. Tanks 2,000 1,130 170 560 40Total APCs 5,500* 950 730 2,500 2,480
Self-Propelled Artillery 1,200 405 250 4,400 1,089Towed Artillery 17,700 1,060 480 3,500 3,500MRLs 2,400 300 110 2,500 185Mortars some ? 1,140 7,500 6,000
SSM Launchers 7,200 100 some some someLight SAM Launchers 284 1,220 581 10,000 1,090AA Guns 7,700 60 400 11,000 600
Air Force Manpower (1,000s) 400 45 45.6 110 64Air Defense Manpower 210 - ? - -
Total Combat Aircraft 2,643 479 300 590 540Bombers 222 - - 80 -Fighter/Ground Attack 1,169 128 130 283Fighter- 1,252 293 150 150 210Recce/FGA Recce 53 8 20 - 57COIN/OCU - - - - -AEW C41/BM/EW 4 6 11 - 4MR/MPA - - - - -
Transport Aircraft 296 39 30 318 34Tanker Aircraft 10 - - - -
Total Helicopters 80 35 40 308 28Armed Helicopters - - - 24 -
Major SAM Launchers 1,078 - 1,440 38 -Light SAM Launchers 500 - some 760 -AA Guns 16,000 - some - -
* Includes Lt. Tank, AIFV, and APC** Includes both FGA and FTR

Cordesman & Kleiber: The Asian Conventional Military Balance 6/26/06 Page 51
2006 © All Rights Reserved to CSIS.
Figure 27: Northeast Asian Military Forces in 2006: Part 2
China Taiwan Japan N. Korea S. Korea
Total Naval Manpower (1,000s) 255 45 44.4 46 63
Major Surface CombatantsCarriers - - - - -Destroyer-Guided Missile 21 9 40 - 6Other Destroyer - - 5 - -Frigate-Guided Missile 42 22 9 - 9Other Frigate - - - 3 -Corvettes - - - 6 28
Patrol CraftMissile 96 62 9 43 -Torpedo and Coastal 130 - - 125 -Inshore, Riverine 117 - - 133 75
SubmarinesSLBN 1 - - - -SSN 5 - - - -SSG 1 - - - -SS/SSK 61 4 18 88 20
Mine Vessels 130 12 31 23 15
Amphibious Ships 50 18 4 10 10Landing Craft 285 325 23 260 36
Support Ships 163 20 28 7 14
Marines (1,000s) 10 15 - - 28
Naval Air 26,000 - 9,800 - -
Naval Aircraft 436 32 80 - 16Bomber 68 - - - -FGA 274 - - - -Fighter 74 - - - -MR/MPA 4 - 80 - 8Armed Helicopters 16 20 98 - 11ASW Helicopters 8 20 88 - 11SAR Helicopters 27 - 18 - -Mine Warfare Helicopters - - 10 - -Other Helicopters 8 - 27 - 34
Source: Based primarily on material in the IISS Military Balance 2005-2006, London, Routledge, 2005 plus data drawn from USPACOMsources and US experts. Some data estimated or corrected by the author.

Cordesman & Kleiber: The Asian Conventional Military Balance 6/26/06 Page 52
2006 © All Rights Reserved to CSIS.
Figure 28: Northeast Asian Military Manpower in Key Powers: 2006(in thousands)
0
500
1,000
1,500
2,000
2,500
3,000
3,500
Strategic 100 0 0 0 0 ?
Air Defense 210 0 0 0 0 ?
Marine 10 0 0 28 15 25
Air Force 200 45.6 110 64 45 35
Navy 250 44.4 46 63 45 150
Army 2,255 239.9 1106 687.7 290 48
China Japan North Korea South Korea Taiwan US PACOM
Source: Based primarily on material in the IISS Military Balance 2005-2006, London, Routledge, 2005 plus data drawn from USPACOMsources and US experts. Some data estimated or corrected by the author.
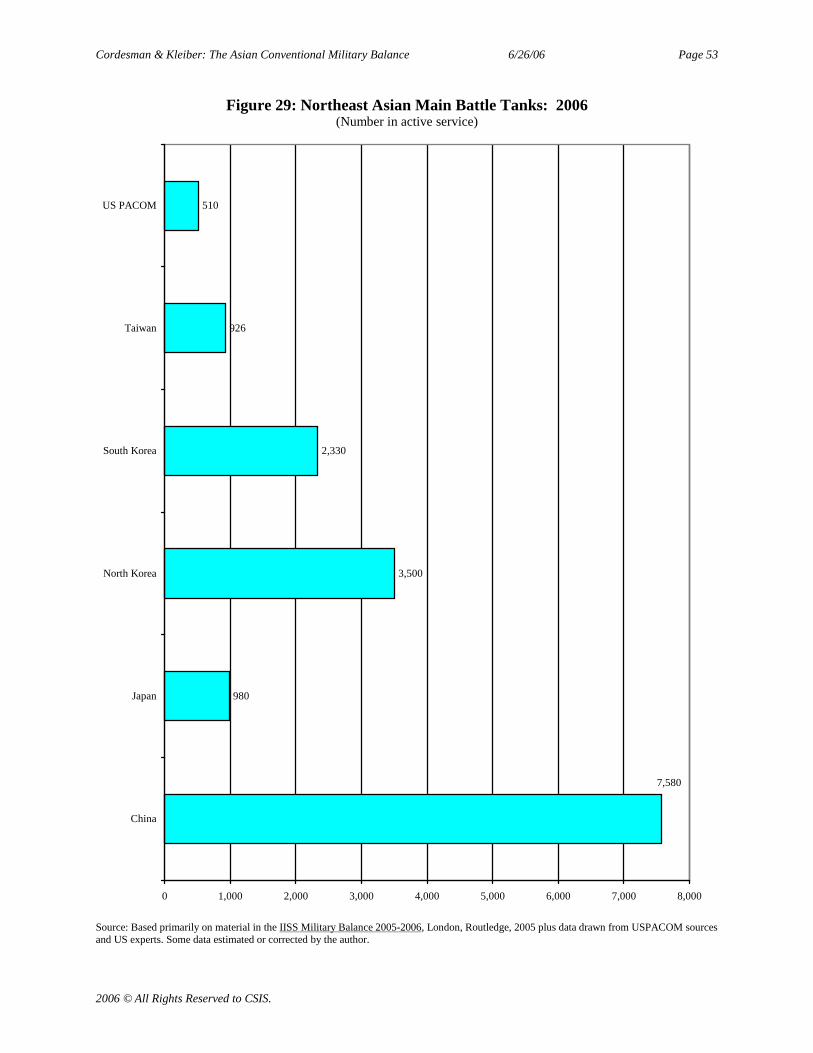
Cordesman & Kleiber: The Asian Conventional Military Balance 6/26/06 Page 53
2006 © All Rights Reserved to CSIS.
Figure 29: Northeast Asian Main Battle Tanks: 2006(Number in active service)
980
3,500
2,330
926
510
7,580
0 1,000 2,000 3,000 4,000 5,000 6,000 7,000 8,000
China
Japan
North Korea
South Korea
Taiwan
US PACOM
Source: Based primarily on material in the IISS Military Balance 2005-2006, London, Routledge, 2005 plus data drawn from USPACOM sourcesand US experts. Some data estimated or corrected by the author.
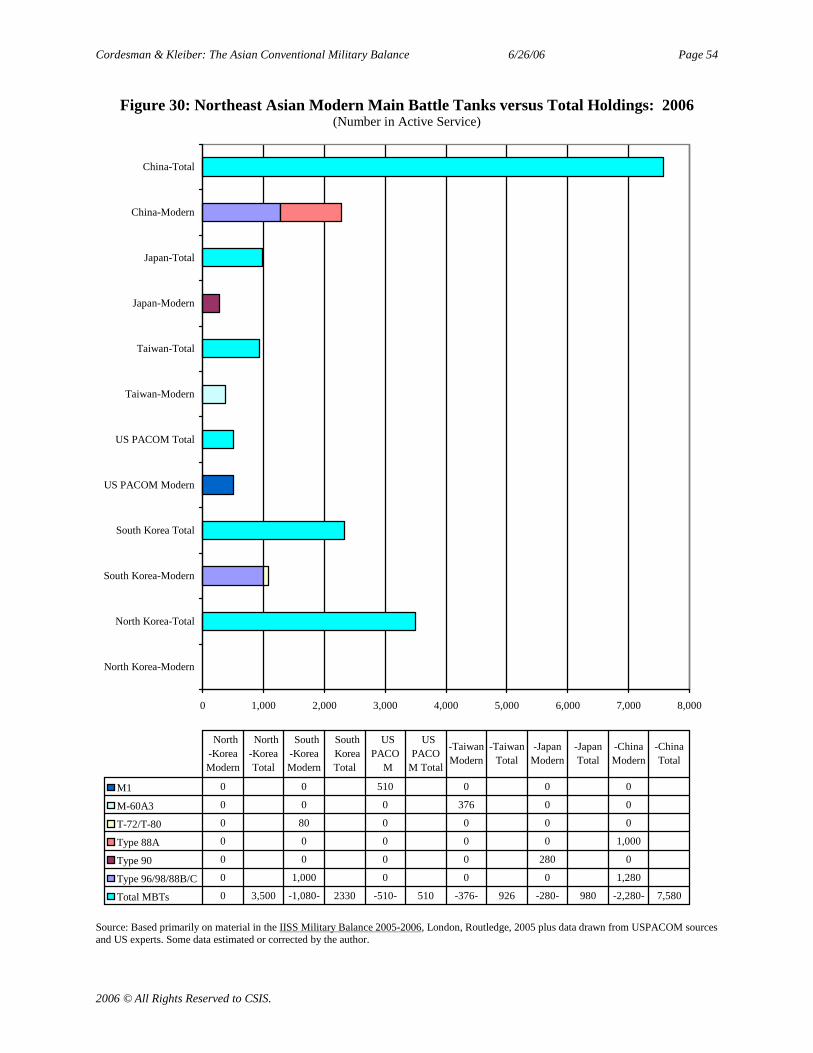
Cordesman & Kleiber: The Asian Conventional Military Balance 6/26/06 Page 54
2006 © All Rights Reserved to CSIS.
Figure 30: Northeast Asian Modern Main Battle Tanks versus Total Holdings: 2006(Number in Active Service)
0 1,000 2,000 3,000 4,000 5,000 6,000 7,000 8,000
North Korea-Modern
North Korea-Total
South Korea-Modern
South Korea Total
US PACOM Modern
US PACOM Total
Taiwan-Modern
Taiwan-Total
Japan-Modern
Japan-Total
China-Modern
China-Total
M1 0 0 510 0 0 0
M-60A3 0 0 0 376 0 0
T-72/T-80 0 80 0 0 0 0
Type 88A 0 0 0 0 0 1,000
Type 90 0 0 0 0 280 0
Type 96/98/88B/C 0 1,000 0 0 0 1,280
Total MBTs 0 3,500 -1,080- 2330 -510- 510 -376- 926 -280- 980 -2,280- 7,580
North-KoreaModern
North-KoreaTotal
South-KoreaModern
SouthKoreaTotal
USPACO
M
USPACO
M Total
-TaiwanModern
-TaiwanTotal
-JapanModern
-JapanTotal
-ChinaModern
-ChinaTotal
Source: Based primarily on material in the IISS Military Balance 2005-2006, London, Routledge, 2005 plus data drawn from USPACOM sourcesand US experts. Some data estimated or corrected by the author.
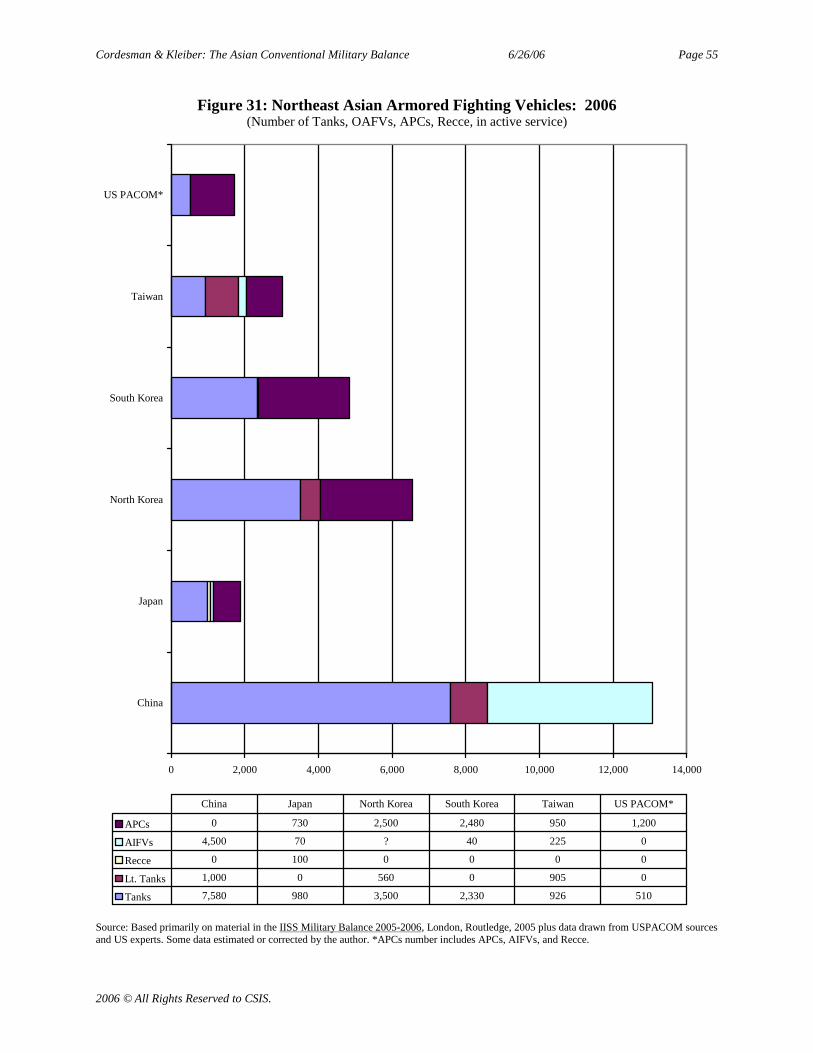
Cordesman & Kleiber: The Asian Conventional Military Balance 6/26/06 Page 55
2006 © All Rights Reserved to CSIS.
Figure 31: Northeast Asian Armored Fighting Vehicles: 2006(Number of Tanks, OAFVs, APCs, Recce, in active service)
0 2,000 4,000 6,000 8,000 10,000 12,000 14,000
China
Japan
North Korea
South Korea
Taiwan
US PACOM*
APCs 0 730 2,500 2,480 950 1,200
AIFVs 4,500 70 ? 40 225 0
Recce 0 100 0 0 0 0
Lt. Tanks 1,000 0 560 0 905 0
Tanks 7,580 980 3,500 2,330 926 510
China Japan North Korea South Korea Taiwan US PACOM*
Source: Based primarily on material in the IISS Military Balance 2005-2006, London, Routledge, 2005 plus data drawn from USPACOM sourcesand US experts. Some data estimated or corrected by the author. *APCs number includes APCs, AIFVs, and Recce.

Cordesman & Kleiber: The Asian Conventional Military Balance 6/26/06 Page 56
2006 © All Rights Reserved to CSIS.
Figure 32: Northeast Asian Modern AFVs (MBTs, APCs, AIFVs) versus Total Holdings ofOther Armored Vehicles: 2006
(Number in active service)
0 2,000 4,000 6,000 8,000 10,000 12,000
North Korea-Modern
North Korea-Total
South Korea-Modern
South Korea Total
*US PACOM Modern
US PACOM Total
Taiwan-Modern
Taiwan-Total
Japan-Modern
Japan-Total
China-Modern
China-Total
BMP-3 0 40 0 0 0 0
KIFV APC 0 1,700 0 0 0 0
Type-96 APC 0 0 0 0 160 0
Type-89 (JP) AIFV 0 0 0 0 70 0
Type-87 Recce 0 0 0 376 100 0
Type-89I APC 0 80 0 0 0 300
WZ-551 AIFV 0 0 0 0 280 1,000
Total MBT (modern( 0 1,000 510 376 280 2,280
Total AFVs 0 6,000 -2,820- 4,850 -510- 1710 -376- 3,006 -890- 1,880 -3,580- 10,580
North-KoreaModern
North-KoreaTotal
South-KoreaModern
SouthKoreaTotal
US*PACO
M
USPACO
M Total
-TaiwanModern
-TaiwanTotal
-JapanModern
-JapanTotal
-ChinaModern
-ChinaTotal
Source: Based primarily on material in the IISS Military Balance 2005-2006, London, Routledge, 2005 plus data drawn from USPACOM sourcesand US experts. Some data estimated or corrected by the author. *Detailed numbers of modern AIFVs holdings are not available. It must beassumed that a great majority of total USPACOM AIFVs meets modern standards.

Cordesman & Kleiber: The Asian Conventional Military Balance 6/26/06 Page 57
2006 © All Rights Reserved to CSIS.
Figure 33: Northeast Asian Artillery Weapons in Key Powers: 2006(Number in active service)
0
5,000
10,000
15,000
20,000
25,000
30,000
35,000
MRLs 2,400 110 2,500 185 300 105
APCs 4,500 730 2,500 2,480 950 1,200
SP Arty 1,200 250 4,400 1,089 405 330
Towed Arty 14,000 480 3,500 3,500 1,060 0
OAFVs 2,000 170 560 40 1,130 0
Tanks 7,580 980 3,500 2,330 926 510
China Japan North Korea South Korea Taiwan US PACOM*
Source: Based primarily on material in the IISS Military Balance 2005-2006, Routledge, 2005 plus data drawn from USPACOM sources and USexperts. Some data estimated or corrected by the author. *SP Arty number includes both towed and Arty.
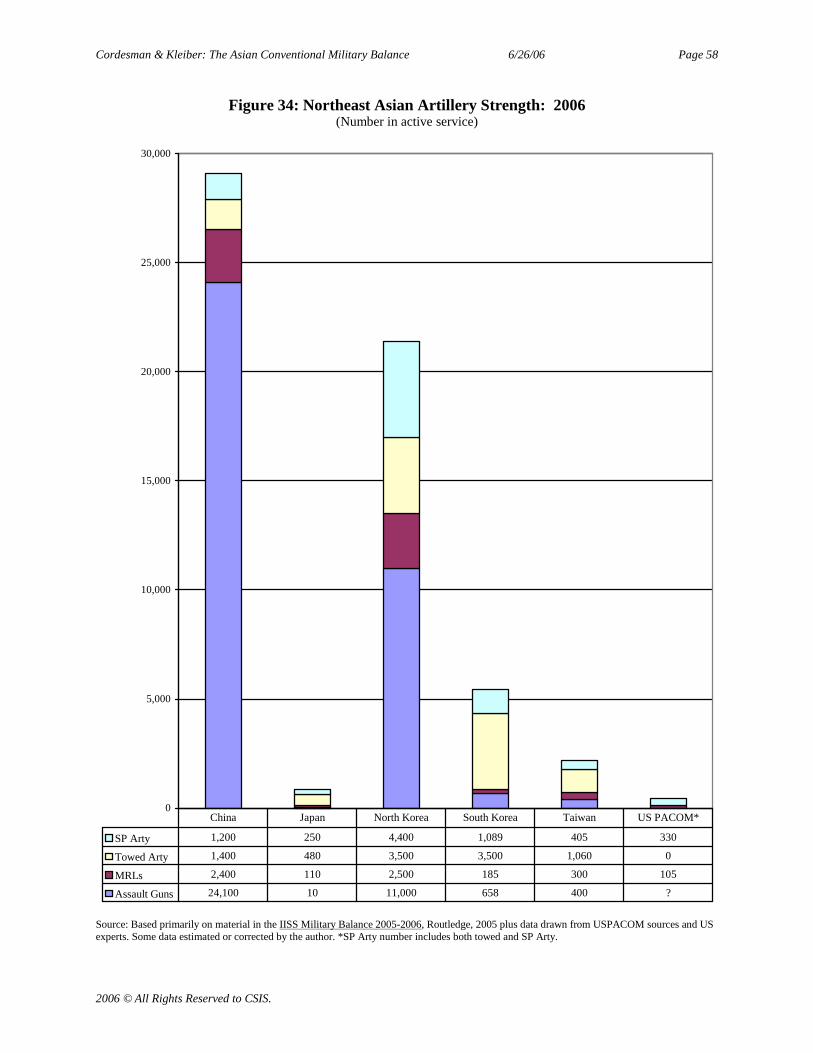
Cordesman & Kleiber: The Asian Conventional Military Balance 6/26/06 Page 58
2006 © All Rights Reserved to CSIS.
Figure 34: Northeast Asian Artillery Strength: 2006(Number in active service)
0
5,000
10,000
15,000
20,000
25,000
30,000
SP Arty 1,200 250 4,400 1,089 405 330
Towed Arty 1,400 480 3,500 3,500 1,060 0
MRLs 2,400 110 2,500 185 300 105
Assault Guns 24,100 10 11,000 658 400 ?
China Japan North Korea South Korea Taiwan US PACOM*
Source: Based primarily on material in the IISS Military Balance 2005-2006, Routledge, 2005 plus data drawn from USPACOM sources and USexperts. Some data estimated or corrected by the author. *SP Arty number includes both towed and SP Arty.
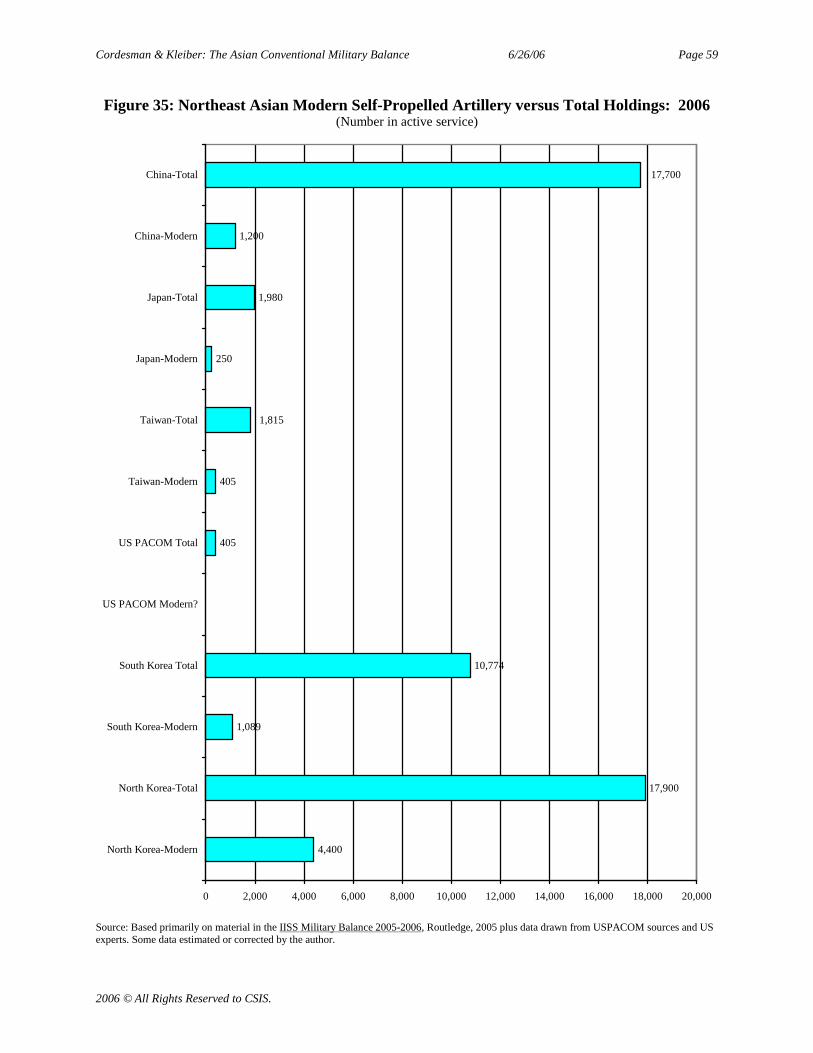
Cordesman & Kleiber: The Asian Conventional Military Balance 6/26/06 Page 59
2006 © All Rights Reserved to CSIS.
Figure 35: Northeast Asian Modern Self-Propelled Artillery versus Total Holdings: 2006(Number in active service)
4,400
17,900
1,089
10,774
405
405
250
1,980
1,200
1,815
17,700
0 2,000 4,000 6,000 8,000 10,000 12,000 14,000 16,000 18,000 20,000
North Korea-Modern
North Korea-Total
South Korea-Modern
South Korea Total
US PACOM Modern?
US PACOM Total
Taiwan-Modern
Taiwan-Total
Japan-Modern
Japan-Total
China-Modern
China-Total
Source: Based primarily on material in the IISS Military Balance 2005-2006, Routledge, 2005 plus data drawn from USPACOM sources and USexperts. Some data estimated or corrected by the author.
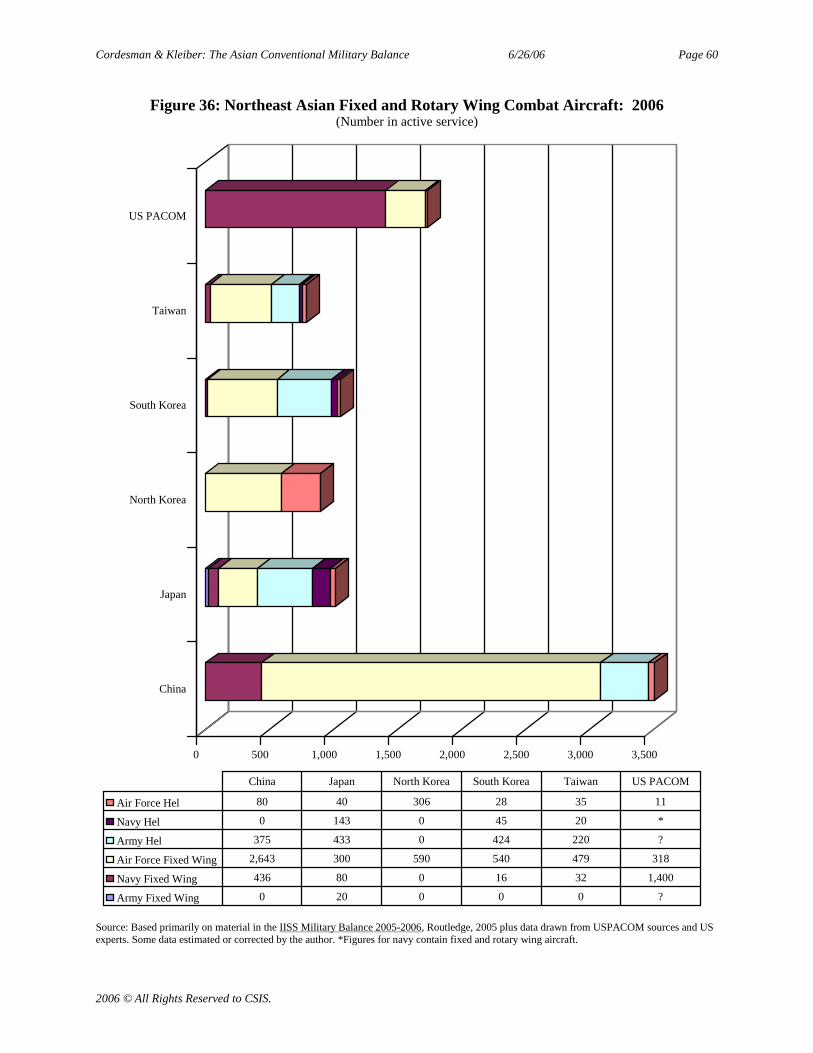
Cordesman & Kleiber: The Asian Conventional Military Balance 6/26/06 Page 60
2006 © All Rights Reserved to CSIS.
Figure 36: Northeast Asian Fixed and Rotary Wing Combat Aircraft: 2006(Number in active service)
0 500 1,000 1,500 2,000 2,500 3,000 3,500
China
Japan
North Korea
South Korea
Taiwan
US PACOM
Air Force Hel 80 40 306 28 35 11
Navy Hel 0 143 0 45 20 *
Army Hel 375 433 0 424 220 ?
Air Force Fixed Wing 2,643 300 590 540 479 318
Navy Fixed Wing 436 80 0 16 32 1,400
Army Fixed Wing 0 20 0 0 0 ?
China Japan North Korea South Korea Taiwan US PACOM
Source: Based primarily on material in the IISS Military Balance 2005-2006, Routledge, 2005 plus data drawn from USPACOM sources and USexperts. Some data estimated or corrected by the author. *Figures for navy contain fixed and rotary wing aircraft.
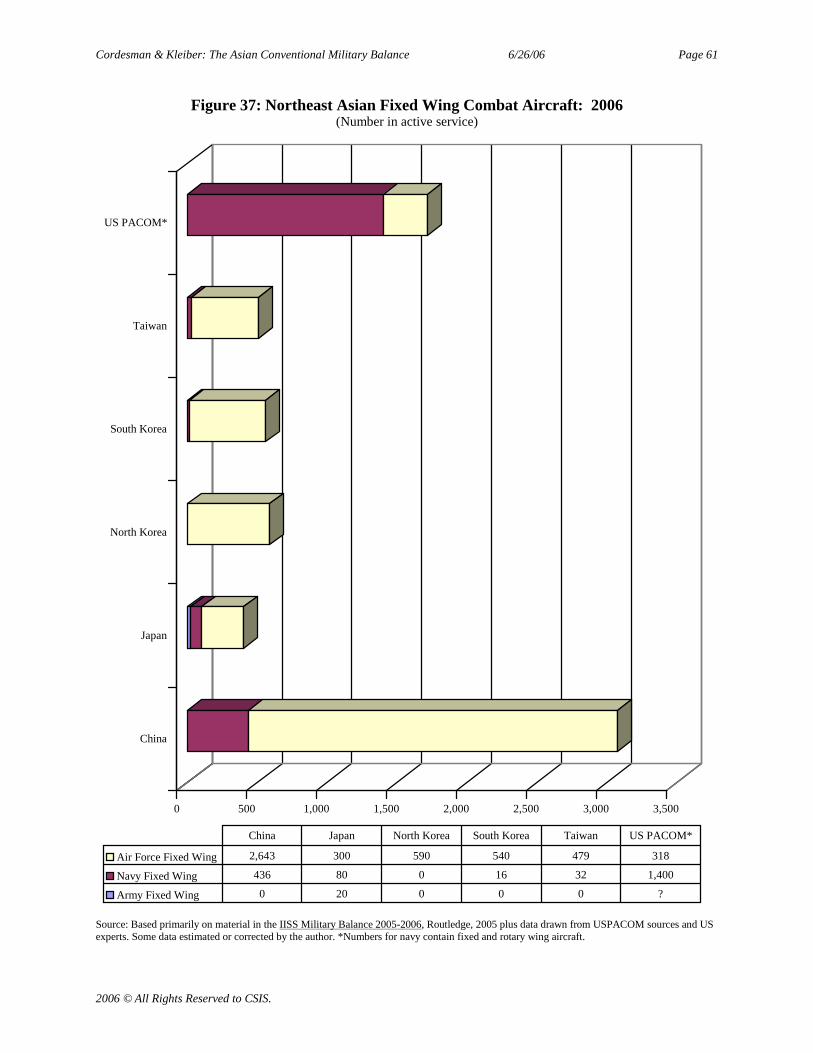
Cordesman & Kleiber: The Asian Conventional Military Balance 6/26/06 Page 61
2006 © All Rights Reserved to CSIS.
Figure 37: Northeast Asian Fixed Wing Combat Aircraft: 2006(Number in active service)
0 500 1,000 1,500 2,000 2,500 3,000 3,500
China
Japan
North Korea
South Korea
Taiwan
US PACOM*
Air Force Fixed Wing 2,643 300 590 540 479 318
Navy Fixed Wing 436 80 0 16 32 1,400
Army Fixed Wing 0 20 0 0 0 ?
China Japan North Korea South Korea Taiwan US PACOM*
Source: Based primarily on material in the IISS Military Balance 2005-2006, Routledge, 2005 plus data drawn from USPACOM sources and USexperts. Some data estimated or corrected by the author. *Numbers for navy contain fixed and rotary wing aircraft.
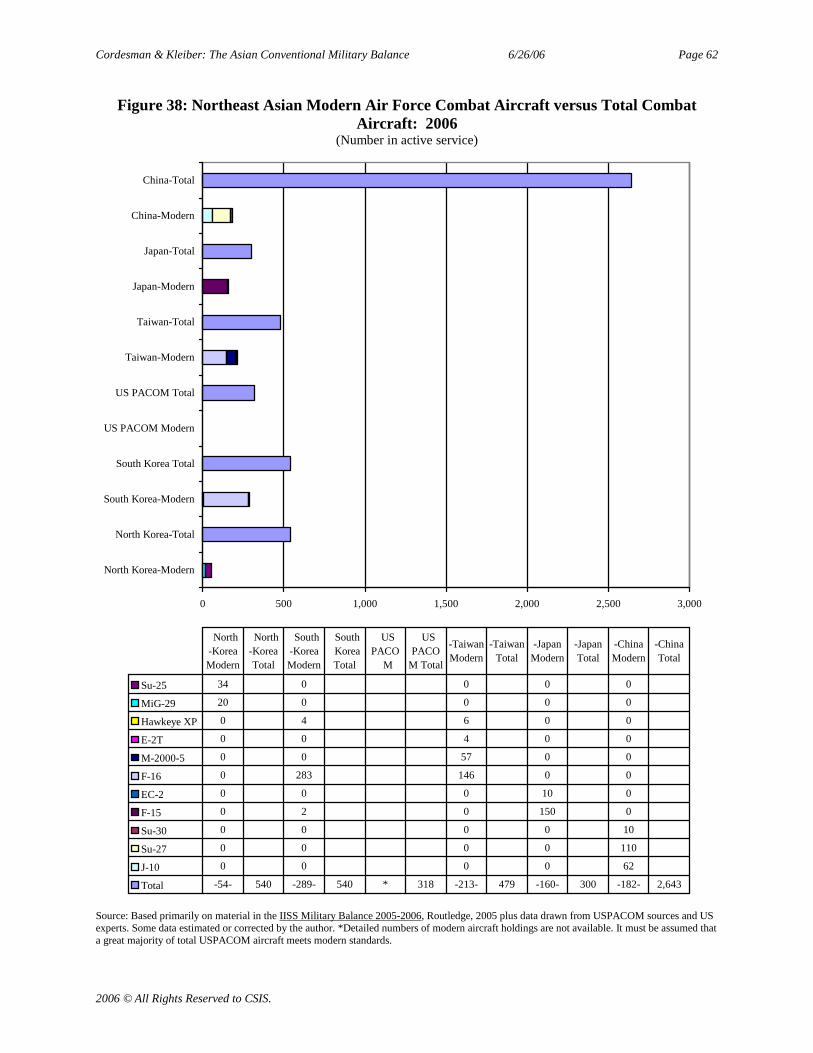
Cordesman & Kleiber: The Asian Conventional Military Balance 6/26/06 Page 62
2006 © All Rights Reserved to CSIS.
Figure 38: Northeast Asian Modern Air Force Combat Aircraft versus Total CombatAircraft: 2006
(Number in active service)
0 500 1,000 1,500 2,000 2,500 3,000
North Korea-Modern
North Korea-Total
South Korea-Modern
South Korea Total
US PACOM Modern
US PACOM Total
Taiwan-Modern
Taiwan-Total
Japan-Modern
Japan-Total
China-Modern
China-Total
Su-25 34 0 0 0 0
MiG-29 20 0 0 0 0
Hawkeye XP 0 4 6 0 0
E-2T 0 0 4 0 0
M-2000-5 0 0 57 0 0
F-16 0 283 146 0 0
EC-2 0 0 0 10 0
F-15 0 2 0 150 0
Su-30 0 0 0 0 10
Su-27 0 0 0 0 110
J-10 0 0 0 0 62
Total -54- 540 -289- 540 * 318 -213- 479 -160- 300 -182- 2,643
North-KoreaModern
North-KoreaTotal
South-KoreaModern
SouthKoreaTotal
USPACO
M
USPACO
M Total
-TaiwanModern
-TaiwanTotal
-JapanModern
-JapanTotal
-ChinaModern
-ChinaTotal
Source: Based primarily on material in the IISS Military Balance 2005-2006, Routledge, 2005 plus data drawn from USPACOM sources and USexperts. Some data estimated or corrected by the author. *Detailed numbers of modern aircraft holdings are not available. It must be assumed thata great majority of total USPACOM aircraft meets modern standards.
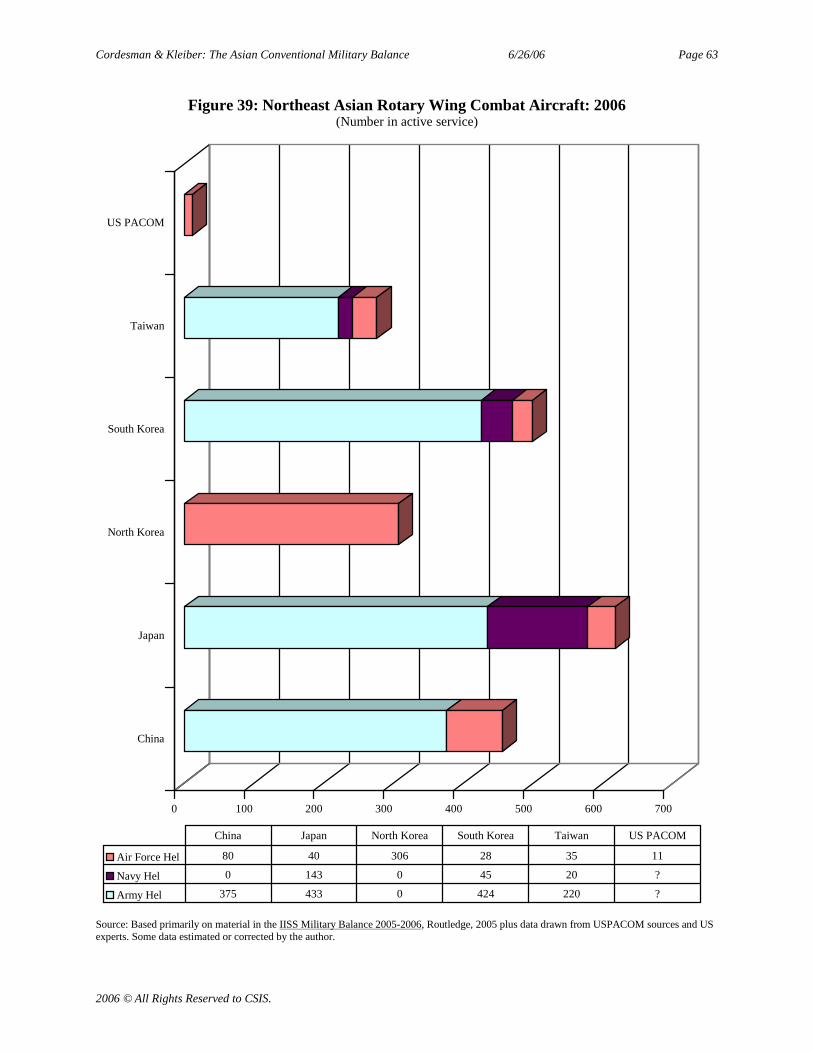
Cordesman & Kleiber: The Asian Conventional Military Balance 6/26/06 Page 63
2006 © All Rights Reserved to CSIS.
Figure 39: Northeast Asian Rotary Wing Combat Aircraft: 2006(Number in active service)
0 100 200 300 400 500 600 700
China
Japan
North Korea
South Korea
Taiwan
US PACOM
Air Force Hel 80 40 306 28 35 11
Navy Hel 0 143 0 45 20 ?
Army Hel 375 433 0 424 220 ?
China Japan North Korea South Korea Taiwan US PACOM
Source: Based primarily on material in the IISS Military Balance 2005-2006, Routledge, 2005 plus data drawn from USPACOM sources and USexperts. Some data estimated or corrected by the author.

Cordesman & Kleiber: The Asian Conventional Military Balance 6/26/06 Page 64
2006 © All Rights Reserved to CSIS.
Figure 40: Northeast Asian Modern Attack and Armed Helicopters by Type: 2006(Number in active service)
0 20 40 60 80 100 120 140 160 180 200
North Korea
South Korea
*US PACOM
Taiwan
Japan
China
OH-58D 0 0 39 0 0
AH-1W 0 0 62 0 0
Lynx 0 11 0 0 0
AH-1F 0 60 0 0 0
Mi-24 24 0 0 0 0
S-61 0 0 0 3 0
SH-60J 0 0 0 85 0
MH-53 0 0 0 10 0
AH-1S 0 0 0 90 0
KA-27 0 0 0 0 8
SA-321 0 0 0 0 8
AS565 0 0 0 0 7
WZ-9 0 0 0 0 31
North Korea South Korea US PACOM* Taiwan Japan China
Source: Based primarily on material in the IISS Military Balance 2005-2006, Routledge, 2005 plus data drawn from USPACOM sources and USexperts. Some data estimated or corrected by the author. *Detailed numbers of modern helicopter holdings are not available.

Cordesman & Kleiber: The Asian Conventional Military Balance 6/26/06 Page 65
2006 © All Rights Reserved to CSIS.
Figure 41: Northeast Asian Naval Combat Ships: 2006(Number in active service)
0
100
200
300
400
500
600
700
800
900
1,000
Landing Craft 285 23 260 36 325 ?
Amphibious 69 4 10 12 18 15
Mine 130 31 23 15 12 2
Other Patrol 235 0 279 75 0 21
Missile Patrol 96 9 22 5 59 ?
Frigates 42 9 3 9 21 15
Corvettes 0 0 6 28 0 13
Destroyers 21 44 0 6 11 32
Carriers 0 0 0 0 0 7
Submarines 69 16 88 20 4 37
SSNs 6 0 0 0 0 24
China Japan North Korea South Korea Taiwan US PACOM*
Source: Based primarily on material in the IISS Military Balance 2005-2006, Routledge, 2005 plus data drawn from USPACOM sources and USexperts. Some data estimated or corrected by the author. *Missile Patrol numbers includes all patrol craft.
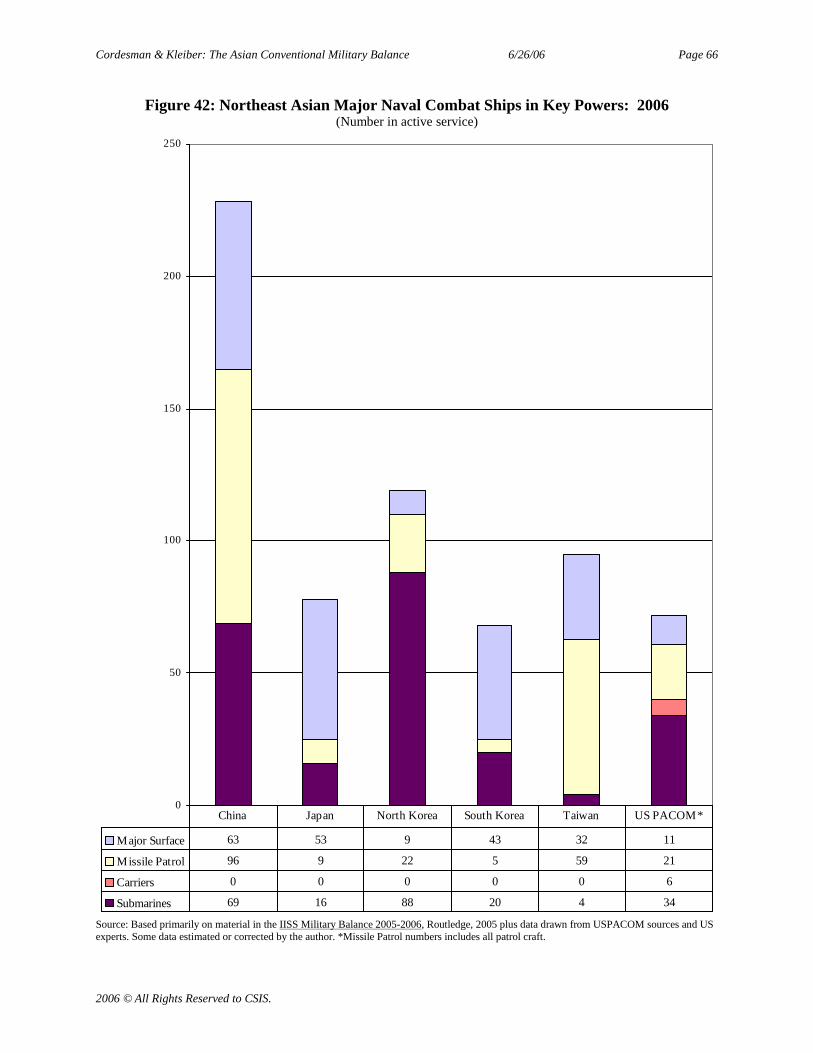
Cordesman & Kleiber: The Asian Conventional Military Balance 6/26/06 Page 66
2006 © All Rights Reserved to CSIS.
Figure 42: Northeast Asian Major Naval Combat Ships in Key Powers: 2006(Number in active service)
0
50
100
150
200
250
Major Surface 63 53 9 43 32 11
Missile Patrol 96 9 22 5 59 21
Carriers 0 0 0 0 0 6
Submarines 69 16 88 20 4 34
China Japan North Korea South Korea Taiwan US PACOM*
Source: Based primarily on material in the IISS Military Balance 2005-2006, Routledge, 2005 plus data drawn from USPACOM sources and USexperts. Some data estimated or corrected by the author. *Missile Patrol numbers includes all patrol craft.
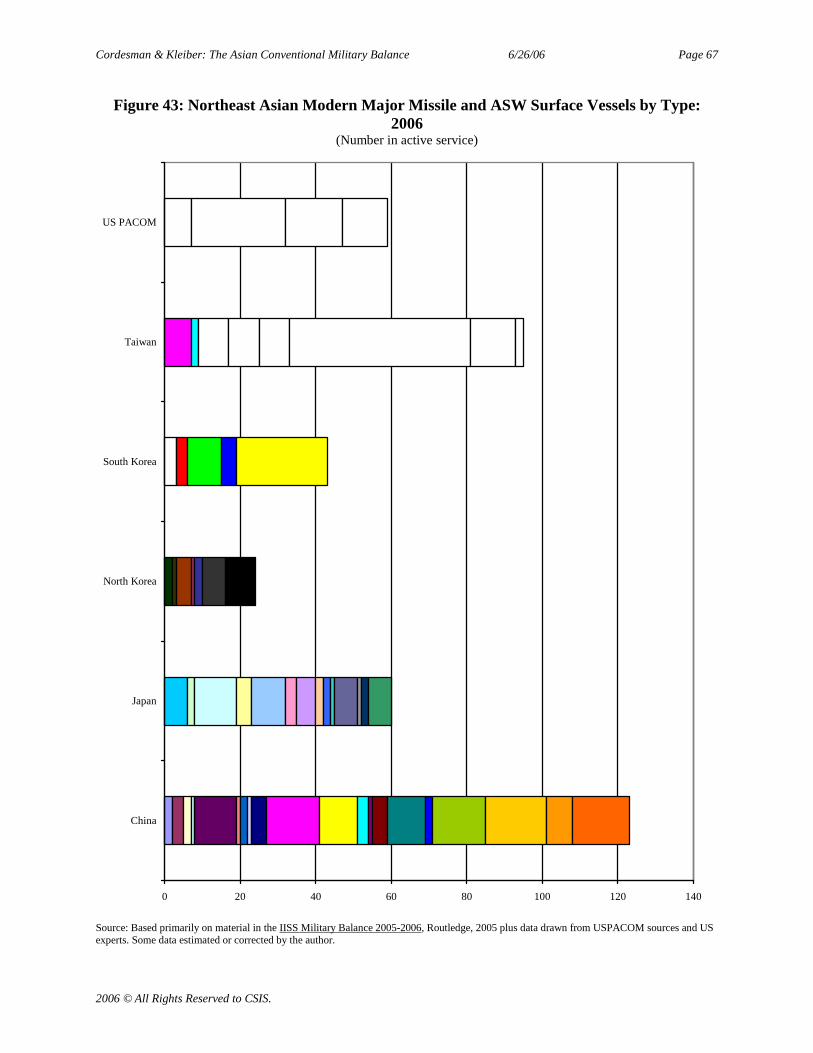
Cordesman & Kleiber: The Asian Conventional Military Balance 6/26/06 Page 67
2006 © All Rights Reserved to CSIS.
Figure 43: Northeast Asian Modern Major Missile and ASW Surface Vessels by Type:2006
(Number in active service)
0 20 40 60 80 100 120 140
China
Japan
North Korea
South Korea
Taiwan
US PACOM
Source: Based primarily on material in the IISS Military Balance 2005-2006, Routledge, 2005 plus data drawn from USPACOM sources and USexperts. Some data estimated or corrected by the author.
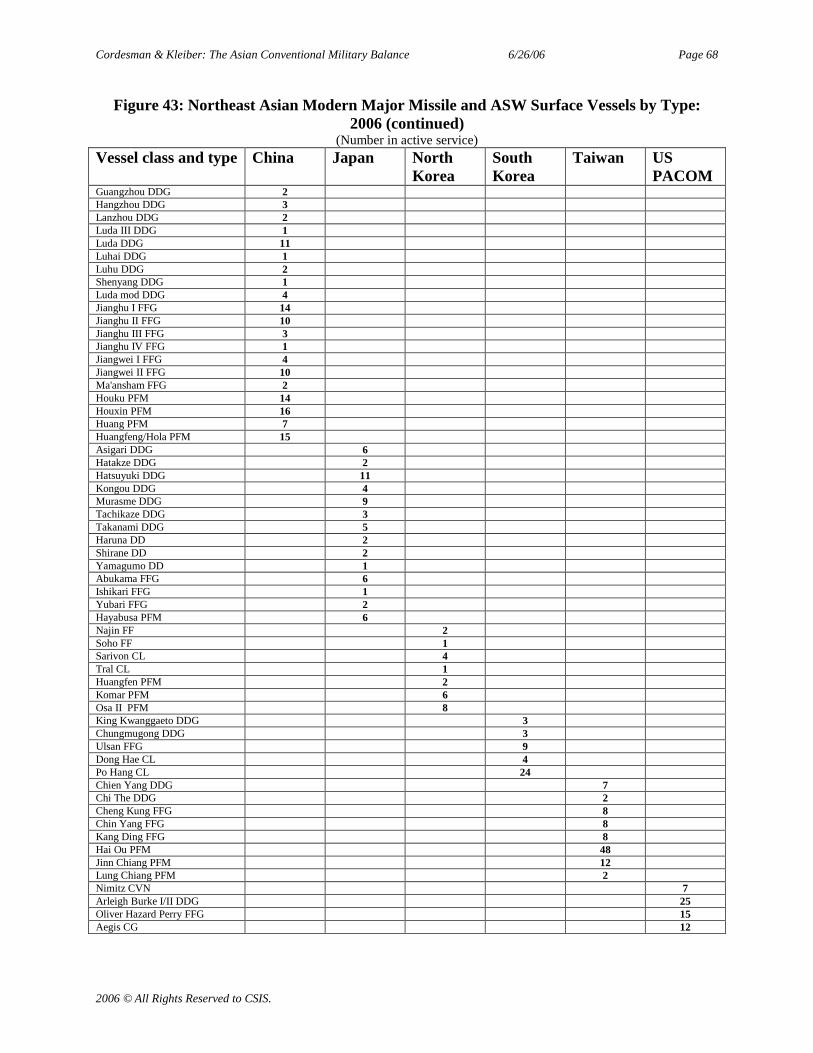
Cordesman & Kleiber: The Asian Conventional Military Balance 6/26/06 Page 68
2006 © All Rights Reserved to CSIS.
Figure 43: Northeast Asian Modern Major Missile and ASW Surface Vessels by Type:2006 (continued)
(Number in active service)
Vessel class and type China Japan NorthKorea
SouthKorea
Taiwan USPACOM
Guangzhou DDG 2Hangzhou DDG 3Lanzhou DDG 2Luda III DDG 1Luda DDG 11Luhai DDG 1Luhu DDG 2Shenyang DDG 1Luda mod DDG 4Jianghu I FFG 14Jianghu II FFG 10Jianghu III FFG 3Jianghu IV FFG 1Jiangwei I FFG 4Jiangwei II FFG 10Ma'ansham FFG 2Houku PFM 14Houxin PFM 16Huang PFM 7Huangfeng/Hola PFM 15Asigari DDG 6Hatakze DDG 2Hatsuyuki DDG 11Kongou DDG 4Murasme DDG 9Tachikaze DDG 3Takanami DDG 5Haruna DD 2Shirane DD 2Yamagumo DD 1Abukama FFG 6Ishikari FFG 1Yubari FFG 2Hayabusa PFM 6Najin FF 2Soho FF 1Sarivon CL 4Tral CL 1Huangfen PFM 2Komar PFM 6Osa II PFM 8King Kwanggaeto DDG 3Chungmugong DDG 3Ulsan FFG 9Dong Hae CL 4Po Hang CL 24Chien Yang DDG 7Chi The DDG 2Cheng Kung FFG 8Chin Yang FFG 8Kang Ding FFG 8Hai Ou PFM 48Jinn Chiang PFM 12Lung Chiang PFM 2Nimitz CVN 7Arleigh Burke I/II DDG 25Oliver Hazard Perry FFG 15Aegis CG 12
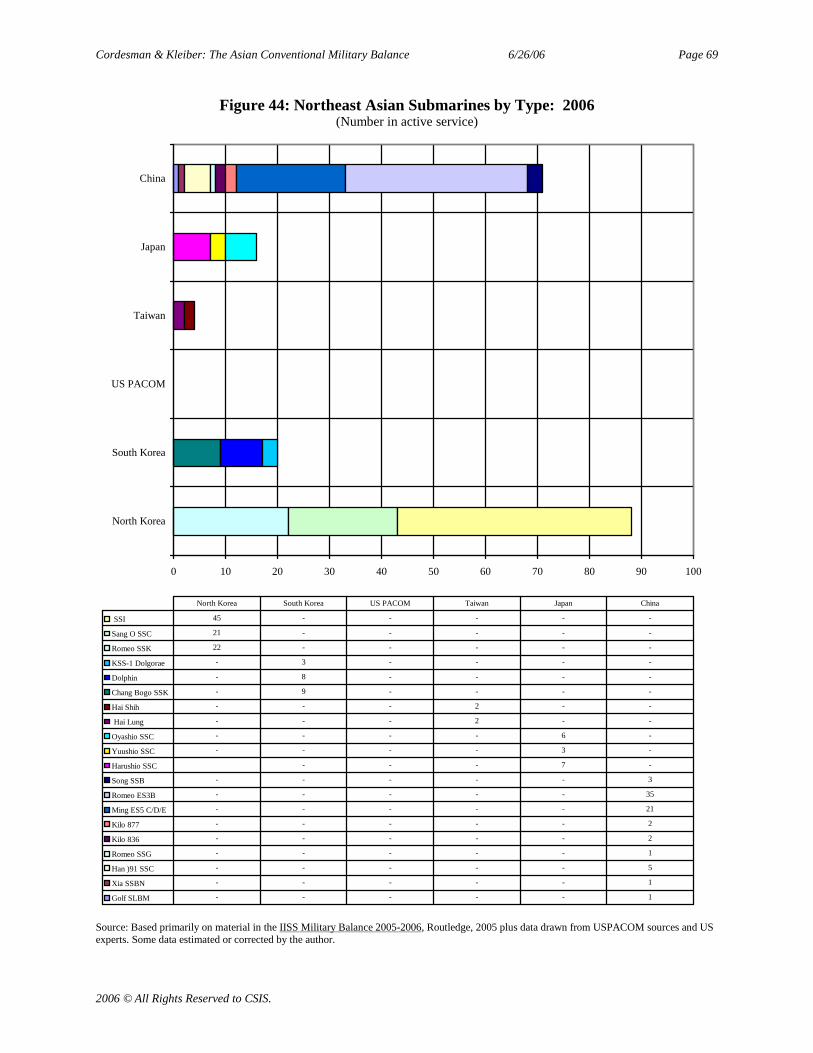
Cordesman & Kleiber: The Asian Conventional Military Balance 6/26/06 Page 69
2006 © All Rights Reserved to CSIS.
Figure 44: Northeast Asian Submarines by Type: 2006(Number in active service)
0 10 20 30 40 50 60 70 80 90 100
North Korea
South Korea
US PACOM
Taiwan
Japan
China
SSI 45 - - - - -
Sang O SSC 21 - - - - -
Romeo SSK 22 - - - - -
KSS-1 Dolgorae - 3 - - - -
Dolphin - 8 - - - -
Chang Bogo SSK - 9 - - - -
Hai Shih - - - 2 - -
Hai Lung - - - 2 - -
Oyashio SSC - - - - 6 -
Yuushio SSC - - - - 3 -
Harushio SSC - - - 7 -
Song SSB - - - - - 3
Romeo ES3B - - - - - 35
Ming ES5 C/D/E - - - - - 21
Kilo 877 - - - - - 2
Kilo 836 - - - - - 2
Romeo SSG - - - - - 1
Han )91 SSC - - - - - 5
Xia SSBN - - - - - 1
Golf SLBM - - - - - 1
North Korea South Korea US PACOM Taiwan Japan China
Source: Based primarily on material in the IISS Military Balance 2005-2006, Routledge, 2005 plus data drawn from USPACOM sources and USexperts. Some data estimated or corrected by the author.
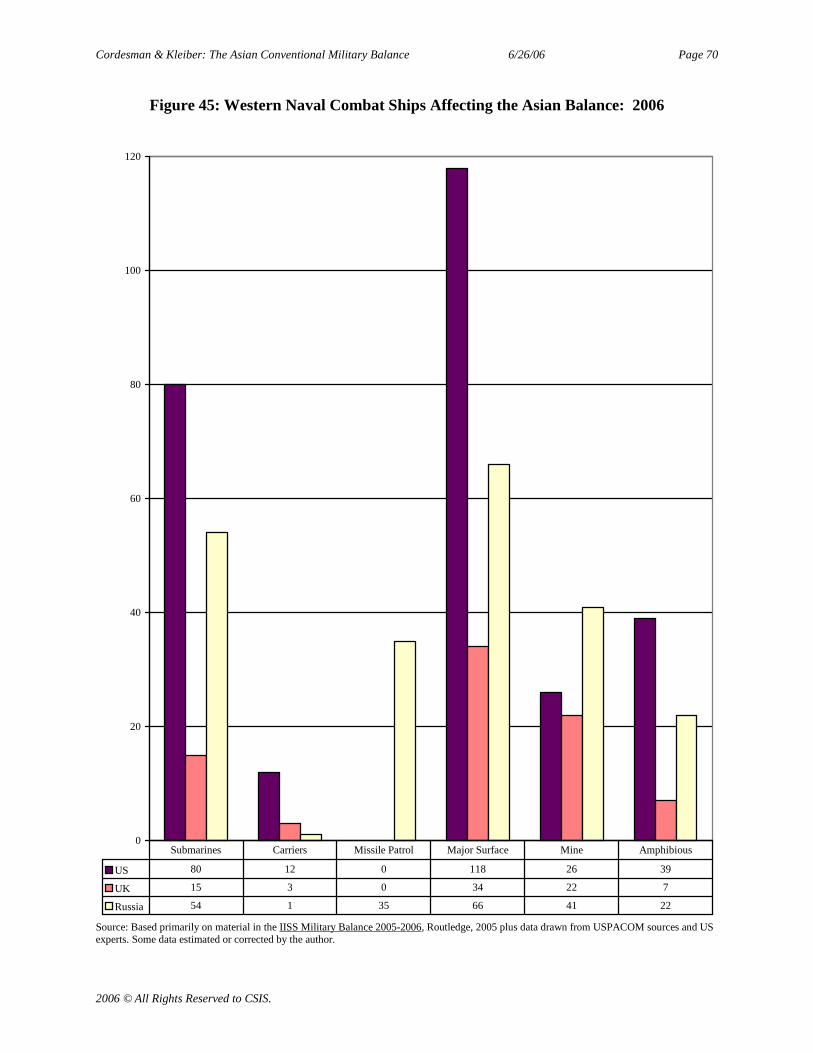
Cordesman & Kleiber: The Asian Conventional Military Balance 6/26/06 Page 70
2006 © All Rights Reserved to CSIS.
Figure 45: Western Naval Combat Ships Affecting the Asian Balance: 2006
0
20
40
60
80
100
120
US 80 12 0 118 26 39
UK 15 3 0 34 22 7
Russia 54 1 35 66 41 22
Submarines Carriers Missile Patrol Major Surface Mine Amphibious
Source: Based primarily on material in the IISS Military Balance 2005-2006, Routledge, 2005 plus data drawn from USPACOM sources and USexperts. Some data estimated or corrected by the author.
Cordesman & Kleiber: The Asian Conventional Military Balance 6/26/06 Page 71
2006 © All Rights Reserved to CSIS.
Southeast Asian Military Balance
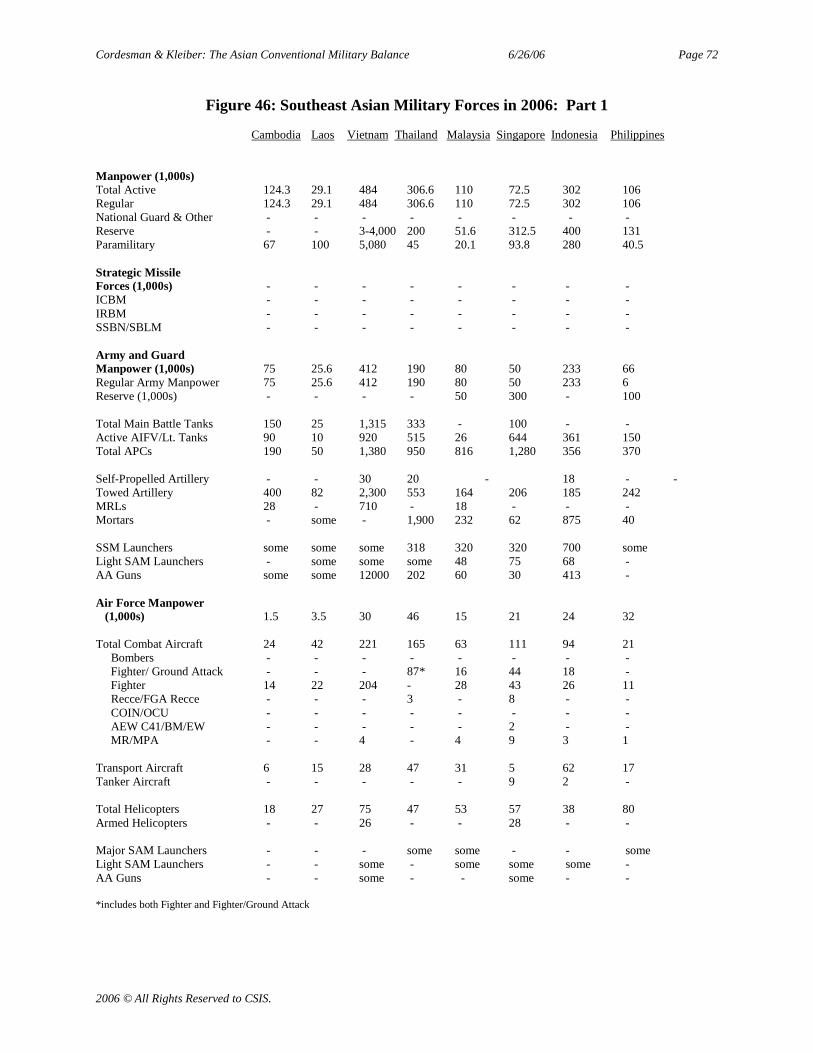
Cordesman & Kleiber: The Asian Conventional Military Balance 6/26/06 Page 72
2006 © All Rights Reserved to CSIS.
Figure 46: Southeast Asian Military Forces in 2006: Part 1
Cambodia Laos Vietnam Thailand Malaysia Singapore Indonesia Philippines
Manpower (1,000s)Total Active 124.3 29.1 484 306.6 110 72.5 302 106Regular 124.3 29.1 484 306.6 110 72.5 302 106National Guard & Other - - - - - - - -Reserve - - 3-4,000 200 51.6 312.5 400 131Paramilitary 67 100 5,080 45 20.1 93.8 280 40.5
Strategic MissileForces (1,000s) - - - - - - - -ICBM - - - - - - - -IRBM - - - - - - - -SSBN/SBLM - - - - - - - -
Army and GuardManpower (1,000s) 75 25.6 412 190 80 50 233 66Regular Army Manpower 75 25.6 412 190 80 50 233 6Reserve (1,000s) - - - - 50 300 - 100
Total Main Battle Tanks 150 25 1,315 333 - 100 - -Active AIFV/Lt. Tanks 90 10 920 515 26 644 361 150Total APCs 190 50 1,380 950 816 1,280 356 370
Self-Propelled Artillery - - 30 20 - 18 - -Towed Artillery 400 82 2,300 553 164 206 185 242MRLs 28 - 710 - 18 - - -Mortars - some - 1,900 232 62 875 40
SSM Launchers some some some 318 320 320 700 someLight SAM Launchers - some some some 48 75 68 -AA Guns some some 12000 202 60 30 413 -
Air Force Manpower(1,000s) 1.5 3.5 30 46 15 21 24 32
Total Combat Aircraft 24 42 221 165 63 111 94 21Bombers - - - - - - - -Fighter/ Ground Attack - - - 87* 16 44 18 -Fighter 14 22 204 - 28 43 26 11Recce/FGA Recce - - - 3 - 8 - -COIN/OCU - - - - - - - -AEW C41/BM/EW - - - - - 2 - -MR/MPA - - 4 - 4 9 3 1
Transport Aircraft 6 15 28 47 31 5 62 17Tanker Aircraft - - - - - 9 2 -
Total Helicopters 18 27 75 47 53 57 38 80Armed Helicopters - - 26 - - 28 - -
Major SAM Launchers - - - some some - - someLight SAM Launchers - - some - some some some -AA Guns - - some - - some - -
*includes both Fighter and Fighter/Ground Attack
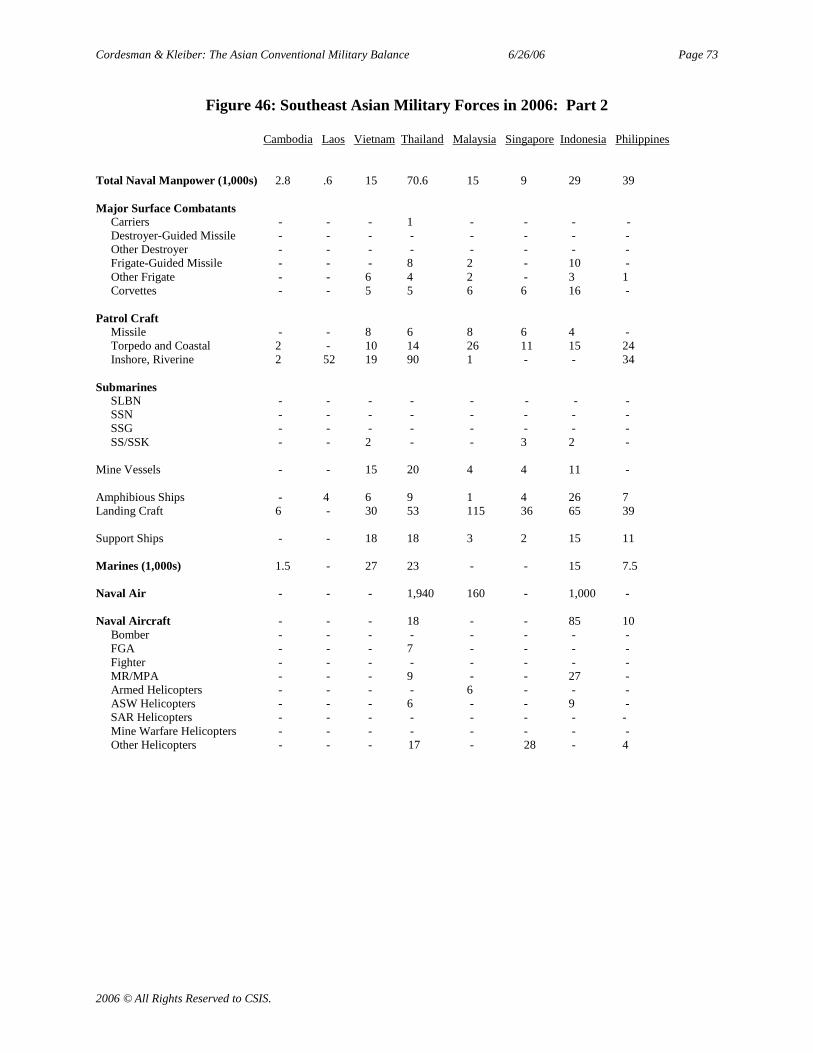
Cordesman & Kleiber: The Asian Conventional Military Balance 6/26/06 Page 73
2006 © All Rights Reserved to CSIS.
Figure 46: Southeast Asian Military Forces in 2006: Part 2
Cambodia Laos Vietnam Thailand Malaysia Singapore Indonesia Philippines
Total Naval Manpower (1,000s) 2.8 .6 15 70.6 15 9 29 39
Major Surface CombatantsCarriers - - - 1 - - - -Destroyer-Guided Missile - - - - - - - -Other Destroyer - - - - - - - -Frigate-Guided Missile - - - 8 2 - 10 -Other Frigate - - 6 4 2 - 3 1Corvettes - - 5 5 6 6 16 -
Patrol CraftMissile - - 8 6 8 6 4 -Torpedo and Coastal 2 - 10 14 26 11 15 24Inshore, Riverine 2 52 19 90 1 - - 34
SubmarinesSLBN - - - - - - - -SSN - - - - - - - -SSG - - - - - - - -SS/SSK - - 2 - - 3 2 -
Mine Vessels - - 15 20 4 4 11 -
Amphibious Ships - 4 6 9 1 4 26 7Landing Craft 6 - 30 53 115 36 65 39
Support Ships - - 18 18 3 2 15 11
Marines (1,000s) 1.5 - 27 23 - - 15 7.5
Naval Air - - - 1,940 160 - 1,000 -
Naval Aircraft - - - 18 - - 85 10Bomber - - - - - - - -FGA - - - 7 - - - -Fighter - - - - - - - -MR/MPA - - - 9 - - 27 -Armed Helicopters - - - - 6 - - -ASW Helicopters - - - 6 - - 9 -SAR Helicopters - - - - - - - -Mine Warfare Helicopters - - - - - - - -Other Helicopters - - - 17 - 28 - 4
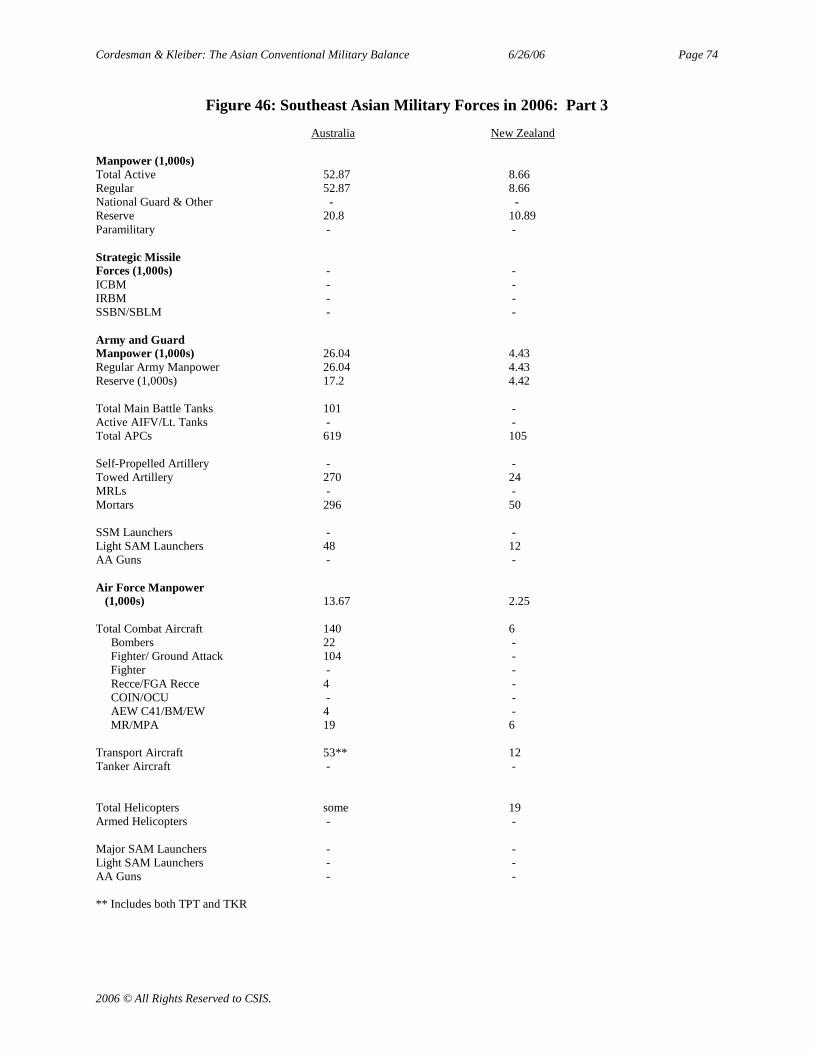
Cordesman & Kleiber: The Asian Conventional Military Balance 6/26/06 Page 74
2006 © All Rights Reserved to CSIS.
Figure 46: Southeast Asian Military Forces in 2006: Part 3
Australia New Zealand
Manpower (1,000s)Total Active 52.87 8.66Regular 52.87 8.66National Guard & Other - -Reserve 20.8 10.89Paramilitary - -
Strategic MissileForces (1,000s) - -ICBM - -IRBM - -SSBN/SBLM - -
Army and GuardManpower (1,000s) 26.04 4.43Regular Army Manpower 26.04 4.43Reserve (1,000s) 17.2 4.42
Total Main Battle Tanks 101 -Active AIFV/Lt. Tanks - -Total APCs 619 105
Self-Propelled Artillery - -Towed Artillery 270 24MRLs - -Mortars 296 50
SSM Launchers - -Light SAM Launchers 48 12AA Guns - -
Air Force Manpower(1,000s) 13.67 2.25
Total Combat Aircraft 140 6Bombers 22 -Fighter/ Ground Attack 104 -Fighter - -Recce/FGA Recce 4 -COIN/OCU - -AEW C41/BM/EW 4 -MR/MPA 19 6
Transport Aircraft 53** 12Tanker Aircraft - -
Total Helicopters some 19Armed Helicopters - -
Major SAM Launchers - -Light SAM Launchers - -AA Guns - -
** Includes both TPT and TKR

Cordesman & Kleiber: The Asian Conventional Military Balance 6/26/06 Page 75
2006 © All Rights Reserved to CSIS.
Figure 46: Southeast Asian Military Forces in 2006: Part 4
Australia New Zealand
Total Naval Manpower (1,000s) 14.77 1.98
Major Surface CombatantsCarriers - -Destroyer-Guided Missile - -Other Destroyer - -Frigate-Guided Missile 6 -Other Frigate 4 2Corvettes - -
Patrol CraftMissile - -Torpedo and Coastal 15 -Inshore, Riverine - 4
SubmarinesSLBN - -SSN - -SSG - -SS/SSK 6 -
Mine Vessels 9 -
Amphibious Ships 2 -Landing Craft 20 -
Support Ships 18 5
Marines (1,000s) - -
Naval Air 990 -
Naval AircraftBomber - -FGA - -Fighter - -MR/MPA - -Armed Helicopters - -ASW Helicopters 23 5SAR Helicopters - -Mine Warfare Helicopters - -Other Helicopters 12 -
Source: Based primarily on material in the IISS Military Balance 2005-2006, Routledge, 2005 plus data drawn from USPACOM sources and USexperts. Some data estimated or corrected by the author.
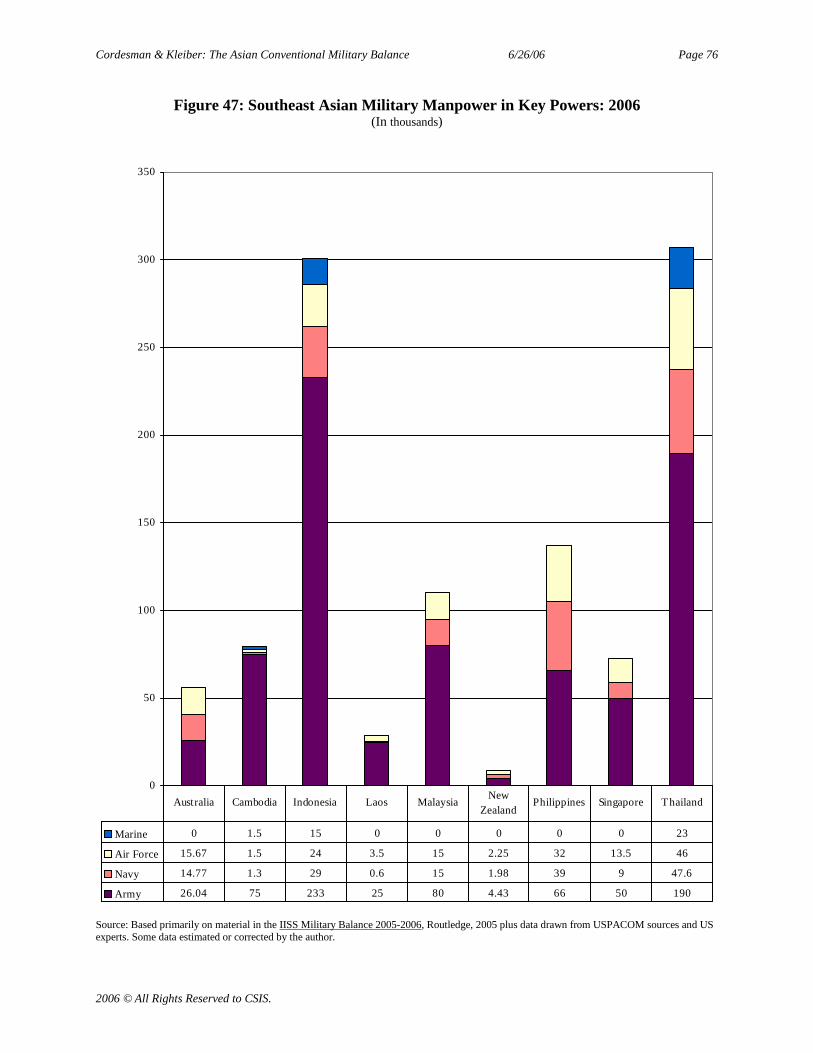
Cordesman & Kleiber: The Asian Conventional Military Balance 6/26/06 Page 76
2006 © All Rights Reserved to CSIS.
Figure 47: Southeast Asian Military Manpower in Key Powers: 2006(In thousands)
0
50
100
150
200
250
300
350
Marine 0 1.5 15 0 0 0 0 0 23
Air Force 15.67 1.5 24 3.5 15 2.25 32 13.5 46
Navy 14.77 1.3 29 0.6 15 1.98 39 9 47.6
Army 26.04 75 233 25 80 4.43 66 50 190
Australia Cambodia Indonesia Laos MalaysiaNew
ZealandPhilippines Singapore Thailand
Source: Based primarily on material in the IISS Military Balance 2005-2006, Routledge, 2005 plus data drawn from USPACOM sources and USexperts. Some data estimated or corrected by the author.
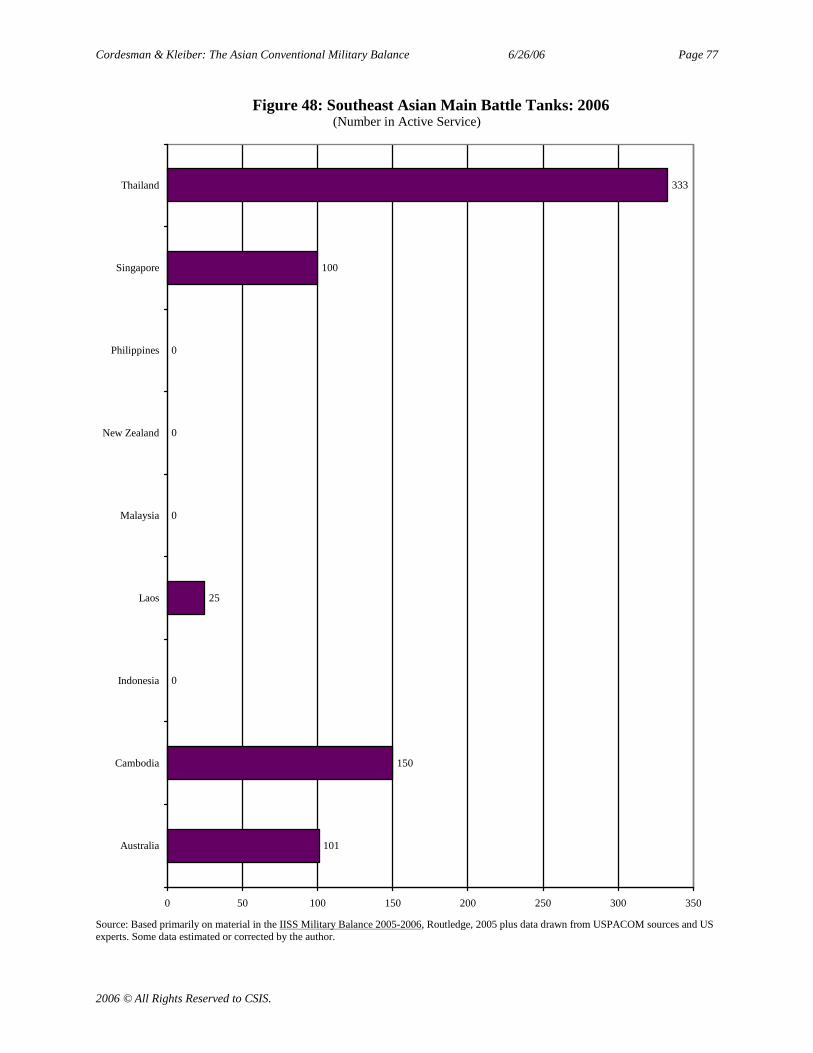
Cordesman & Kleiber: The Asian Conventional Military Balance 6/26/06 Page 77
2006 © All Rights Reserved to CSIS.
Figure 48: Southeast Asian Main Battle Tanks: 2006(Number in Active Service)
101
150
0
25
0
0
0
100
333
0 50 100 150 200 250 300 350
Australia
Cambodia
Indonesia
Laos
Malaysia
New Zealand
Philippines
Singapore
Thailand
Source: Based primarily on material in the IISS Military Balance 2005-2006, Routledge, 2005 plus data drawn from USPACOM sources and USexperts. Some data estimated or corrected by the author.
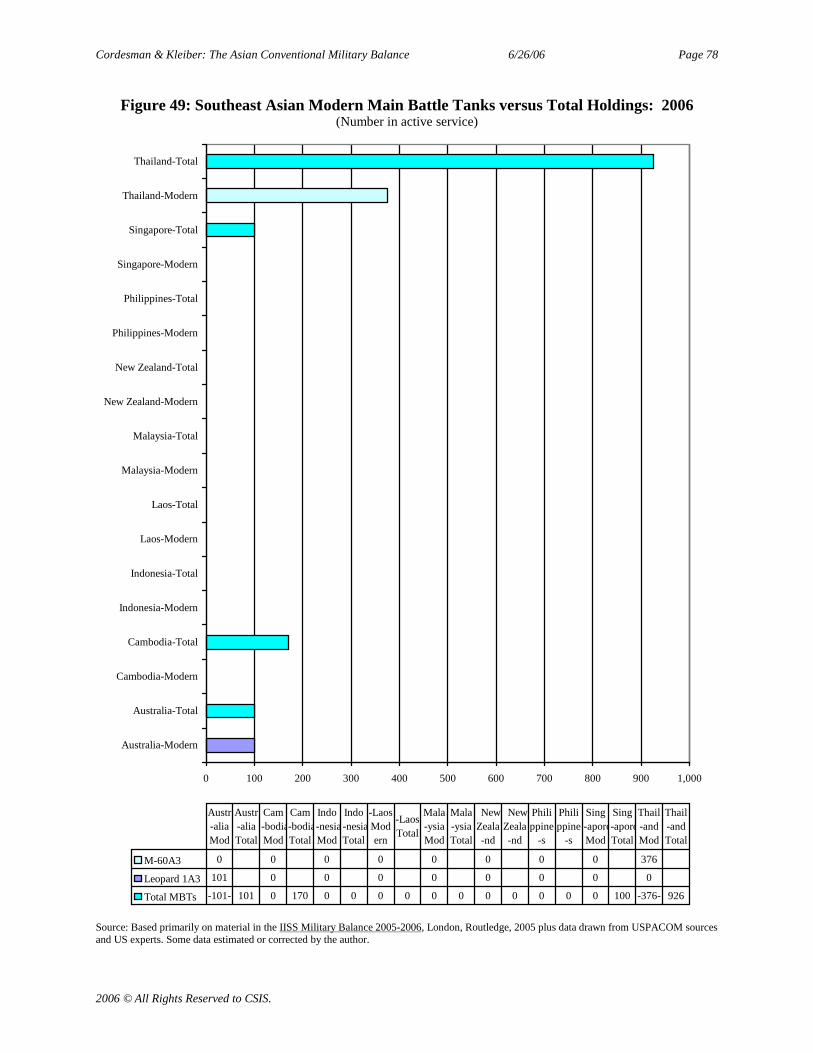
Cordesman & Kleiber: The Asian Conventional Military Balance 6/26/06 Page 78
2006 © All Rights Reserved to CSIS.
Figure 49: Southeast Asian Modern Main Battle Tanks versus Total Holdings: 2006(Number in active service)
0 100 200 300 400 500 600 700 800 900 1,000
Australia-Modern
Australia-Total
Cambodia-Modern
Cambodia-Total
Indonesia-Modern
Indonesia-Total
Laos-Modern
Laos-Total
Malaysia-Modern
Malaysia-Total
New Zealand-Modern
New Zealand-Total
Philippines-Modern
Philippines-Total
Singapore-Modern
Singapore-Total
Thailand-Modern
Thailand-Total
M-60A3 0 0 0 0 0 0 0 0 376
Leopard 1A3 101 0 0 0 0 0 0 0 0
Total MBTs -101- 101 0 170 0 0 0 0 0 0 0 0 0 0 0 100 -376- 926
Austr-aliaMod
Austr-aliaTotal
Cam-bodiaMod
Cam-bodiaTotal
Indo-nesiaMod
Indo-nesiaTotal
-LaosModern
-LaosTotal
Mala-ysiaMod
Mala-ysiaTotal
NewZeala-nd
NewZeala-nd
Philippine
-s
Philippine
-s
Sing-aporeMod
Sing-aporeTotal
Thail-andMod
Thail-andTotal
Source: Based primarily on material in the IISS Military Balance 2005-2006, London, Routledge, 2005 plus data drawn from USPACOM sourcesand US experts. Some data estimated or corrected by the author.
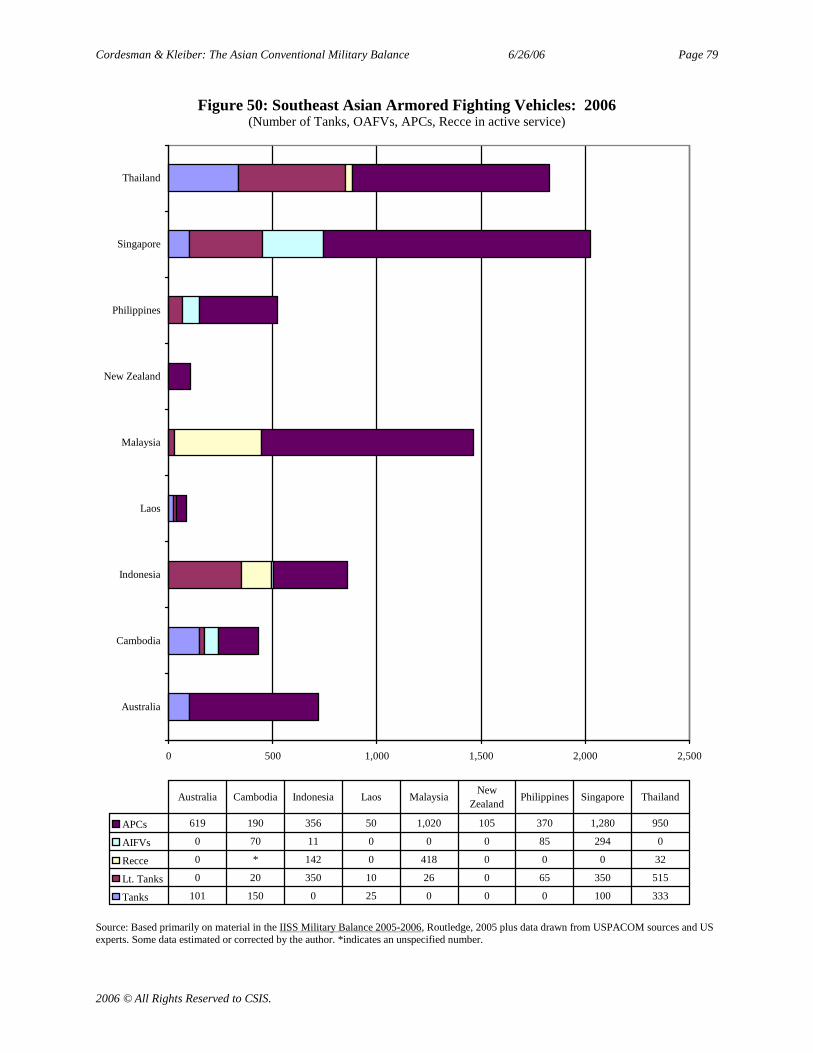
Cordesman & Kleiber: The Asian Conventional Military Balance 6/26/06 Page 79
2006 © All Rights Reserved to CSIS.
Figure 50: Southeast Asian Armored Fighting Vehicles: 2006(Number of Tanks, OAFVs, APCs, Recce in active service)
0 500 1,000 1,500 2,000 2,500
Australia
Cambodia
Indonesia
Laos
Malaysia
New Zealand
Philippines
Singapore
Thailand
APCs 619 190 356 50 1,020 105 370 1,280 950
AIFVs 0 70 11 0 0 0 85 294 0
Recce 0 * 142 0 418 0 0 0 32
Lt. Tanks 0 20 350 10 26 0 65 350 515
Tanks 101 150 0 25 0 0 0 100 333
Australia Cambodia Indonesia Laos MalaysiaNew
ZealandPhilippines Singapore Thailand
Source: Based primarily on material in the IISS Military Balance 2005-2006, Routledge, 2005 plus data drawn from USPACOM sources and USexperts. Some data estimated or corrected by the author. *indicates an unspecified number.
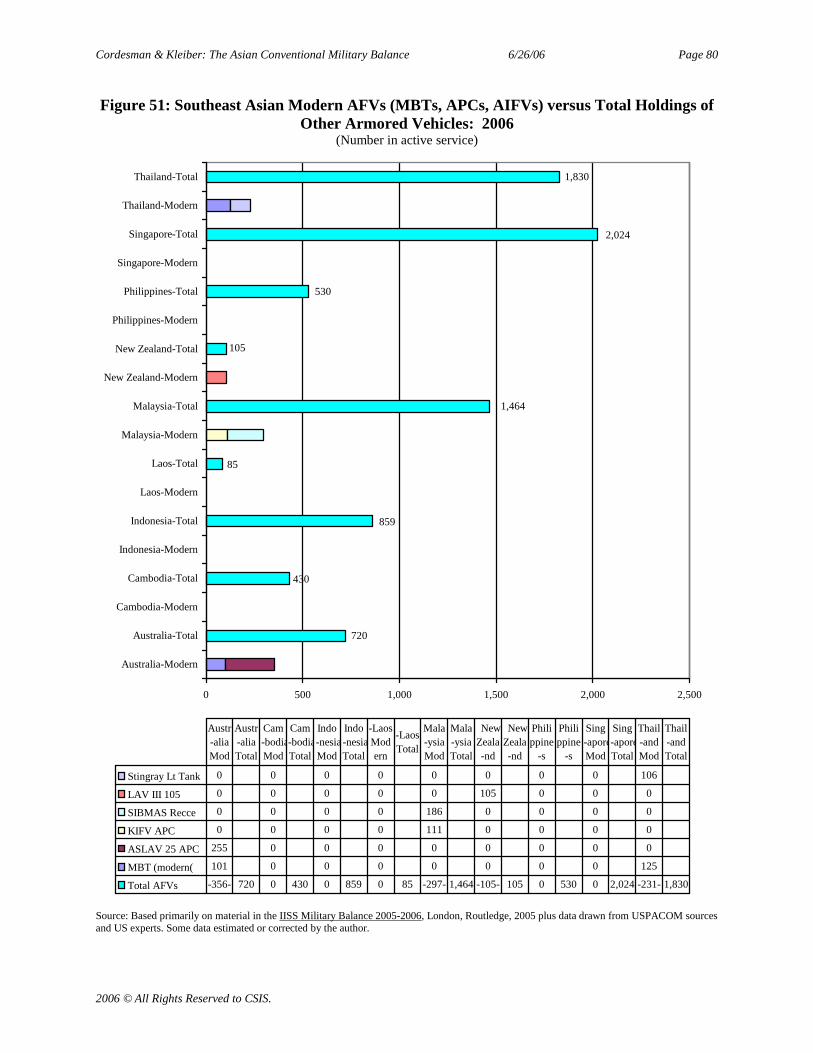
Cordesman & Kleiber: The Asian Conventional Military Balance 6/26/06 Page 80
2006 © All Rights Reserved to CSIS.
Figure 51: Southeast Asian Modern AFVs (MBTs, APCs, AIFVs) versus Total Holdings ofOther Armored Vehicles: 2006
(Number in active service)
105
720
430
859
85
1,464
530
2,024
1,830
0 500 1,000 1,500 2,000 2,500
Australia-Modern
Australia-Total
Cambodia-Modern
Cambodia-Total
Indonesia-Modern
Indonesia-Total
Laos-Modern
Laos-Total
Malaysia-Modern
Malaysia-Total
New Zealand-Modern
New Zealand-Total
Philippines-Modern
Philippines-Total
Singapore-Modern
Singapore-Total
Thailand-Modern
Thailand-Total
Stingray Lt Tank 0 0 0 0 0 0 0 0 106
LAV III 105 0 0 0 0 0 105 0 0 0
SIBMAS Recce 0 0 0 0 186 0 0 0 0
KIFV APC 0 0 0 0 111 0 0 0 0
ASLAV 25 APC 255 0 0 0 0 0 0 0 0
MBT (modern( 101 0 0 0 0 0 0 0 125
Total AFVs -356- 720 0 430 0 859 0 85 -297- 1,464 -105- 105 0 530 0 2,024 -231- 1,830
Austr-aliaMod
Austr-aliaTotal
Cam-bodiaMod
Cam-bodiaTotal
Indo-nesiaMod
Indo-nesiaTotal
-LaosModern
-LaosTotal
Mala-ysiaMod
Mala-ysiaTotal
NewZeala-nd
NewZeala-nd
Philippine
-s
Philippine
-s
Sing-aporeMod
Sing-aporeTotal
Thail-andMod
Thail-andTotal
Source: Based primarily on material in the IISS Military Balance 2005-2006, London, Routledge, 2005 plus data drawn from USPACOM sourcesand US experts. Some data estimated or corrected by the author.
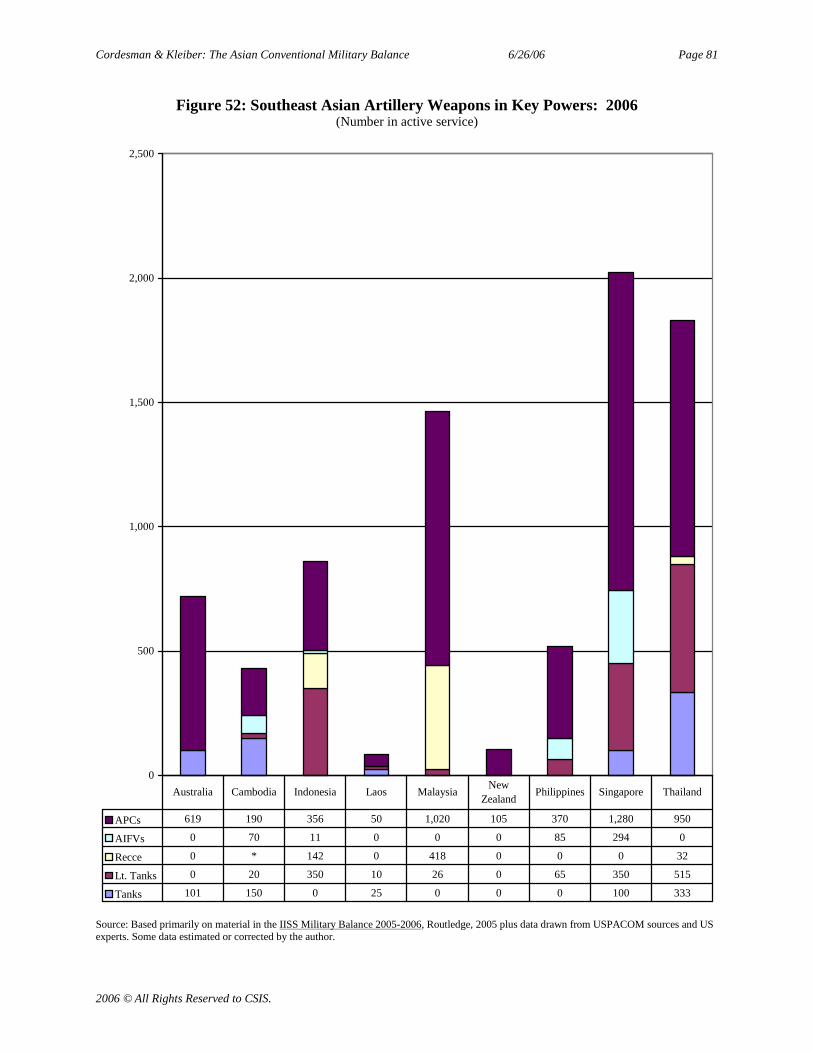
Cordesman & Kleiber: The Asian Conventional Military Balance 6/26/06 Page 81
2006 © All Rights Reserved to CSIS.
Figure 52: Southeast Asian Artillery Weapons in Key Powers: 2006(Number in active service)
0
500
1,000
1,500
2,000
2,500
APCs 619 190 356 50 1,020 105 370 1,280 950
AIFVs 0 70 11 0 0 0 85 294 0
Recce 0 * 142 0 418 0 0 0 32
Lt. Tanks 0 20 350 10 26 0 65 350 515
Tanks 101 150 0 25 0 0 0 100 333
Australia Cambodia Indonesia Laos MalaysiaNew
ZealandPhilippines Singapore Thailand
Source: Based primarily on material in the IISS Military Balance 2005-2006, Routledge, 2005 plus data drawn from USPACOM sources and USexperts. Some data estimated or corrected by the author.
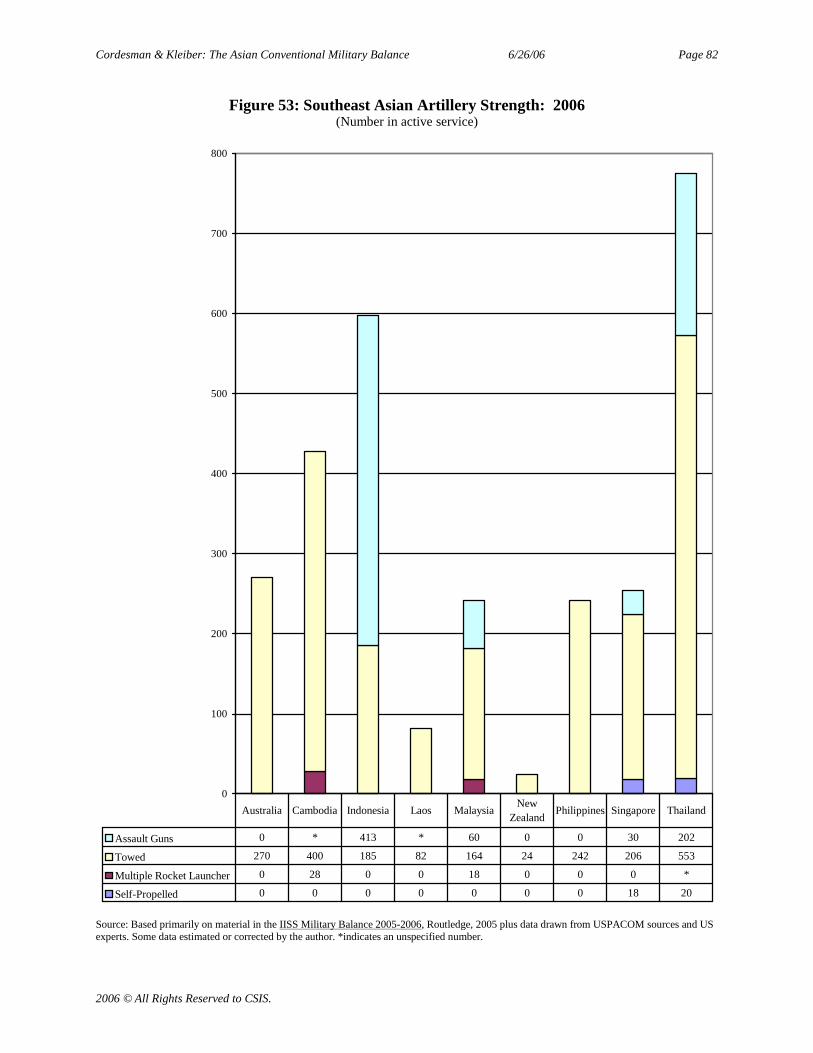
Cordesman & Kleiber: The Asian Conventional Military Balance 6/26/06 Page 82
2006 © All Rights Reserved to CSIS.
Figure 53: Southeast Asian Artillery Strength: 2006(Number in active service)
0
100
200
300
400
500
600
700
800
Assault Guns 0 * 413 * 60 0 0 30 202
Towed 270 400 185 82 164 24 242 206 553
Multiple Rocket Launcher 0 28 0 0 18 0 0 0 *
Self-Propelled 0 0 0 0 0 0 0 18 20
Australia Cambodia Indonesia Laos MalaysiaNew
ZealandPhilippines Singapore Thailand
Source: Based primarily on material in the IISS Military Balance 2005-2006, Routledge, 2005 plus data drawn from USPACOM sources and USexperts. Some data estimated or corrected by the author. *indicates an unspecified number.
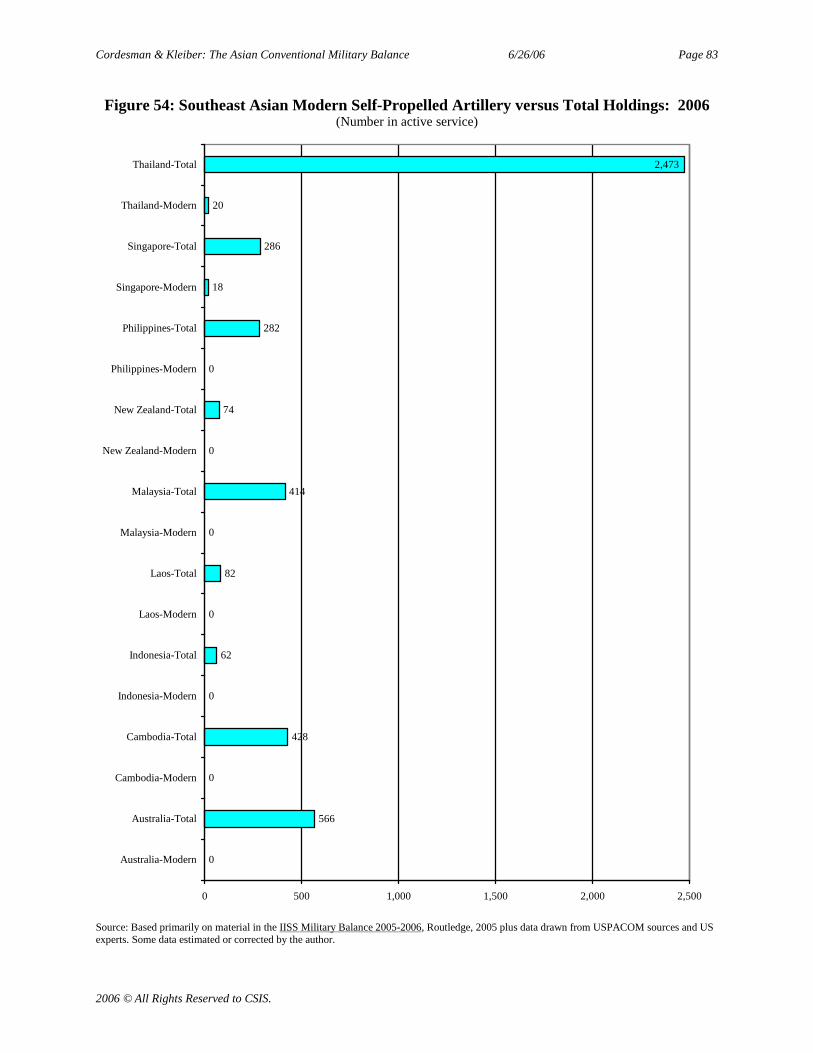
Cordesman & Kleiber: The Asian Conventional Military Balance 6/26/06 Page 83
2006 © All Rights Reserved to CSIS.
Figure 54: Southeast Asian Modern Self-Propelled Artillery versus Total Holdings: 2006(Number in active service)
0
566
0
428
0
62
0
82
0
414
0
74
0
282
18
286
20
2,473
0 500 1,000 1,500 2,000 2,500
Australia-Modern
Australia-Total
Cambodia-Modern
Cambodia-Total
Indonesia-Modern
Indonesia-Total
Laos-Modern
Laos-Total
Malaysia-Modern
Malaysia-Total
New Zealand-Modern
New Zealand-Total
Philippines-Modern
Philippines-Total
Singapore-Modern
Singapore-Total
Thailand-Modern
Thailand-Total
Source: Based primarily on material in the IISS Military Balance 2005-2006, Routledge, 2005 plus data drawn from USPACOM sources and USexperts. Some data estimated or corrected by the author.

Cordesman & Kleiber: The Asian Conventional Military Balance 6/26/06 Page 84
2006 © All Rights Reserved to CSIS.
Figure 55: Southeast Asian Fixed And Rotary Wing Combat Aircraft: 2006(Number in active service)
0 100 200 300 400 500 600
Australia
Bangladesh
Cambodia
Indonesia
Laos
Malaysia
Myanmar
New Zealand
Philippines
Singapore
Sri Lanka
Thailand
Vietnam
Air Force Hel * 29 18 38 27 53 66 19 80 110 49 47 75
Navy Hel 35 0 0 37 0 6 0 5 4 0 0 23 0
Army Hel 117 0 0 51 0 9 0 0 0 0 0 212 0
Air Force Fixed Wing 140 83 24 94 22 63 125 6 21 111 21 165 221
Navy Fixed Wing 0 0 0 48 0 0 0 0 6 0 0 18 0
Army Fixed Wing 6 6 0 11 0 0 0 0 4 0 0 93 0
Australia
Bangladesh
Cambodia
Indonesia
LaosMalays
iaMyanmar
NewZealan
d
Philippines
Singapore
SriLanka
Thailand
Vietnam
Source: Based primarily on material in the IISS Military Balance 2005-2006, Routledge, 2005 plus data drawn from USPACOM sources and USexperts. Some data estimated or corrected by the author. *indicates an unspecified number.
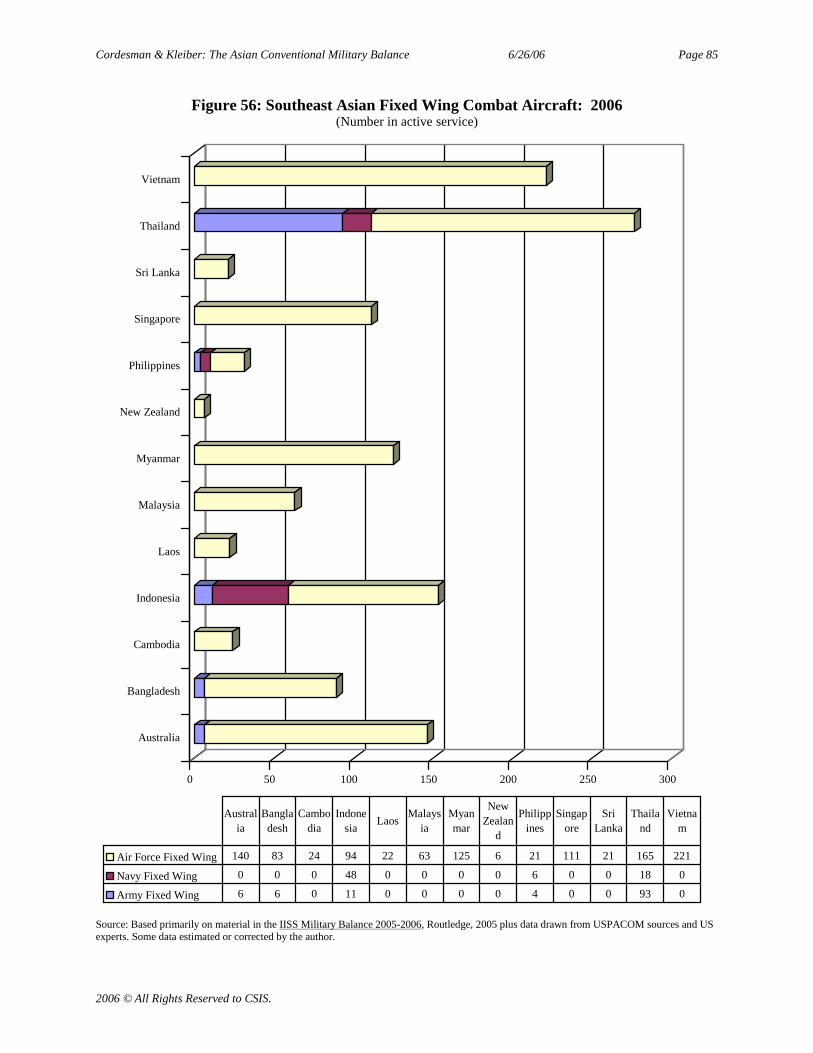
Cordesman & Kleiber: The Asian Conventional Military Balance 6/26/06 Page 85
2006 © All Rights Reserved to CSIS.
Figure 56: Southeast Asian Fixed Wing Combat Aircraft: 2006(Number in active service)
0 50 100 150 200 250 300
Australia
Bangladesh
Cambodia
Indonesia
Laos
Malaysia
Myanmar
New Zealand
Philippines
Singapore
Sri Lanka
Thailand
Vietnam
Air Force Fixed Wing 140 83 24 94 22 63 125 6 21 111 21 165 221
Navy Fixed Wing 0 0 0 48 0 0 0 0 6 0 0 18 0
Army Fixed Wing 6 6 0 11 0 0 0 0 4 0 0 93 0
Australia
Bangladesh
Cambodia
Indonesia
LaosMalays
iaMyanmar
NewZealan
d
Philippines
Singapore
SriLanka
Thailand
Vietnam
Source: Based primarily on material in the IISS Military Balance 2005-2006, Routledge, 2005 plus data drawn from USPACOM sources and USexperts. Some data estimated or corrected by the author.
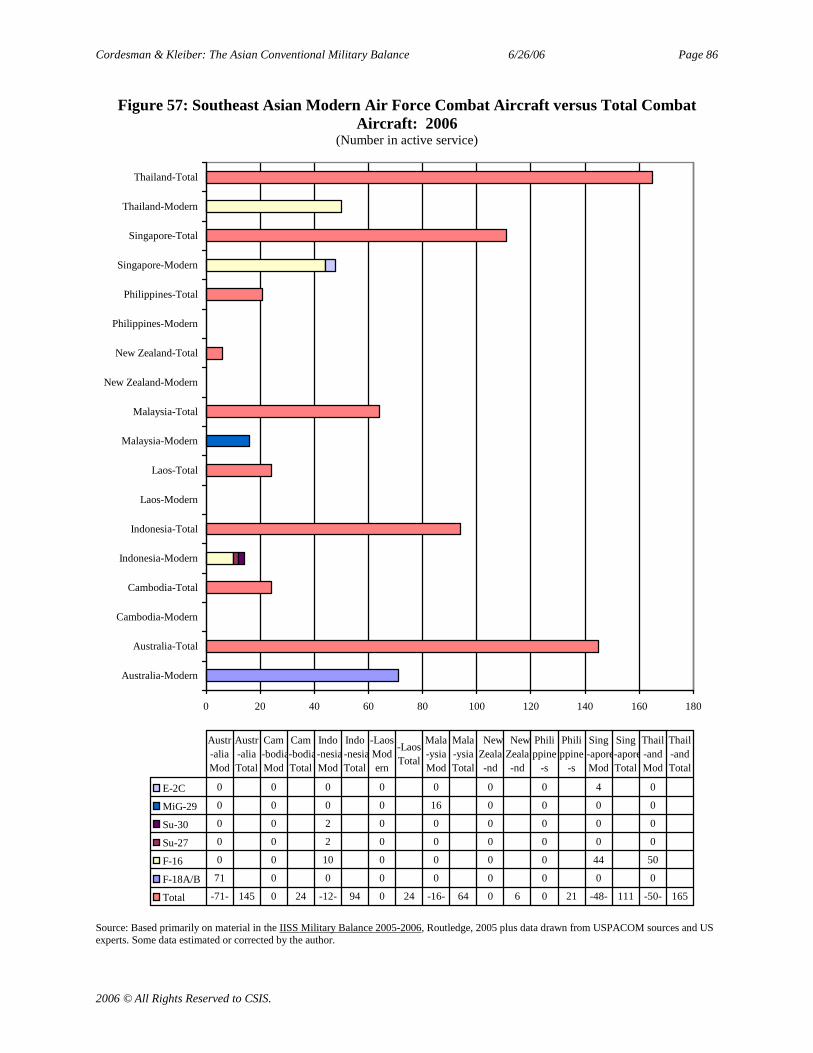
Cordesman & Kleiber: The Asian Conventional Military Balance 6/26/06 Page 86
2006 © All Rights Reserved to CSIS.
Figure 57: Southeast Asian Modern Air Force Combat Aircraft versus Total CombatAircraft: 2006
(Number in active service)
0 20 40 60 80 100 120 140 160 180
Australia-Modern
Australia-Total
Cambodia-Modern
Cambodia-Total
Indonesia-Modern
Indonesia-Total
Laos-Modern
Laos-Total
Malaysia-Modern
Malaysia-Total
New Zealand-Modern
New Zealand-Total
Philippines-Modern
Philippines-Total
Singapore-Modern
Singapore-Total
Thailand-Modern
Thailand-Total
E-2C 0 0 0 0 0 0 0 4 0
MiG-29 0 0 0 0 16 0 0 0 0
Su-30 0 0 2 0 0 0 0 0 0
Su-27 0 0 2 0 0 0 0 0 0
F-16 0 0 10 0 0 0 0 44 50
F-18A/B 71 0 0 0 0 0 0 0 0
Total -71- 145 0 24 -12- 94 0 24 -16- 64 0 6 0 21 -48- 111 -50- 165
Austr-aliaMod
Austr-aliaTotal
Cam-bodiaMod
Cam-bodiaTotal
Indo-nesiaMod
Indo-nesiaTotal
-LaosModern
-LaosTotal
Mala-ysiaMod
Mala-ysiaTotal
NewZeala-nd
NewZeala-nd
Philippine
-s
Philippine
-s
Sing-aporeMod
Sing-aporeTotal
Thail-andMod
Thail-andTotal
Source: Based primarily on material in the IISS Military Balance 2005-2006, Routledge, 2005 plus data drawn from USPACOM sources and USexperts. Some data estimated or corrected by the author.
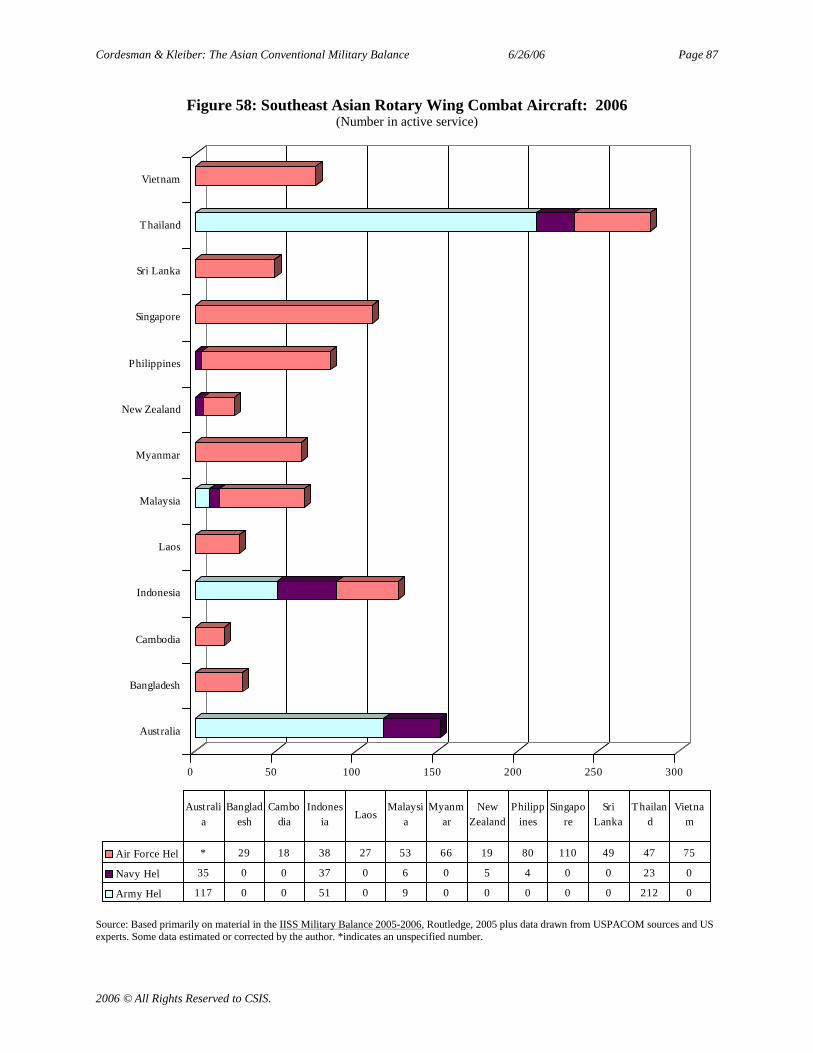
Cordesman & Kleiber: The Asian Conventional Military Balance 6/26/06 Page 87
2006 © All Rights Reserved to CSIS.
Figure 58: Southeast Asian Rotary Wing Combat Aircraft: 2006(Number in active service)
0 50 100 150 200 250 300
Australia
Bangladesh
Cambodia
Indonesia
Laos
Malaysia
Myanmar
New Zealand
Philippines
Singapore
Sri Lanka
Thailand
Vietnam
Air Force Hel * 29 18 38 27 53 66 19 80 110 49 47 75
Navy Hel 35 0 0 37 0 6 0 5 4 0 0 23 0
Army Hel 117 0 0 51 0 9 0 0 0 0 0 212 0
Australia
Bangladesh
Cambodia
Indonesia
LaosMalaysi
aMyanm
arNew
ZealandPhilipp
inesSingapo
reSri
LankaThailan
dVietna
m
Source: Based primarily on material in the IISS Military Balance 2005-2006, Routledge, 2005 plus data drawn from USPACOM sources and USexperts. Some data estimated or corrected by the author. *indicates an unspecified number.
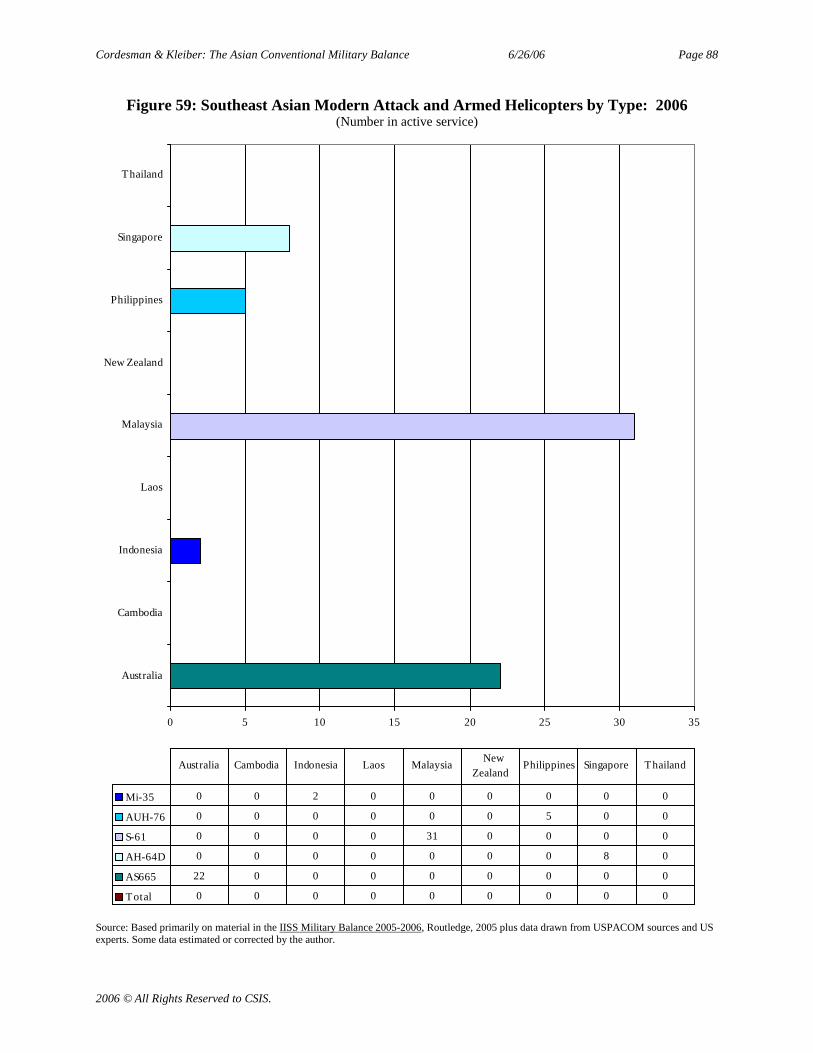
Cordesman & Kleiber: The Asian Conventional Military Balance 6/26/06 Page 88
2006 © All Rights Reserved to CSIS.
Figure 59: Southeast Asian Modern Attack and Armed Helicopters by Type: 2006(Number in active service)
0 5 10 15 20 25 30 35
Australia
Cambodia
Indonesia
Laos
Malaysia
New Zealand
Philippines
Singapore
Thailand
Mi-35 0 0 2 0 0 0 0 0 0
AUH-76 0 0 0 0 0 0 5 0 0
S-61 0 0 0 0 31 0 0 0 0
AH-64D 0 0 0 0 0 0 0 8 0
AS665 22 0 0 0 0 0 0 0 0
Total 0 0 0 0 0 0 0 0 0
Australia Cambodia Indonesia Laos MalaysiaNew
ZealandPhilippines Singapore Thailand
Source: Based primarily on material in the IISS Military Balance 2005-2006, Routledge, 2005 plus data drawn from USPACOM sources and USexperts. Some data estimated or corrected by the author.
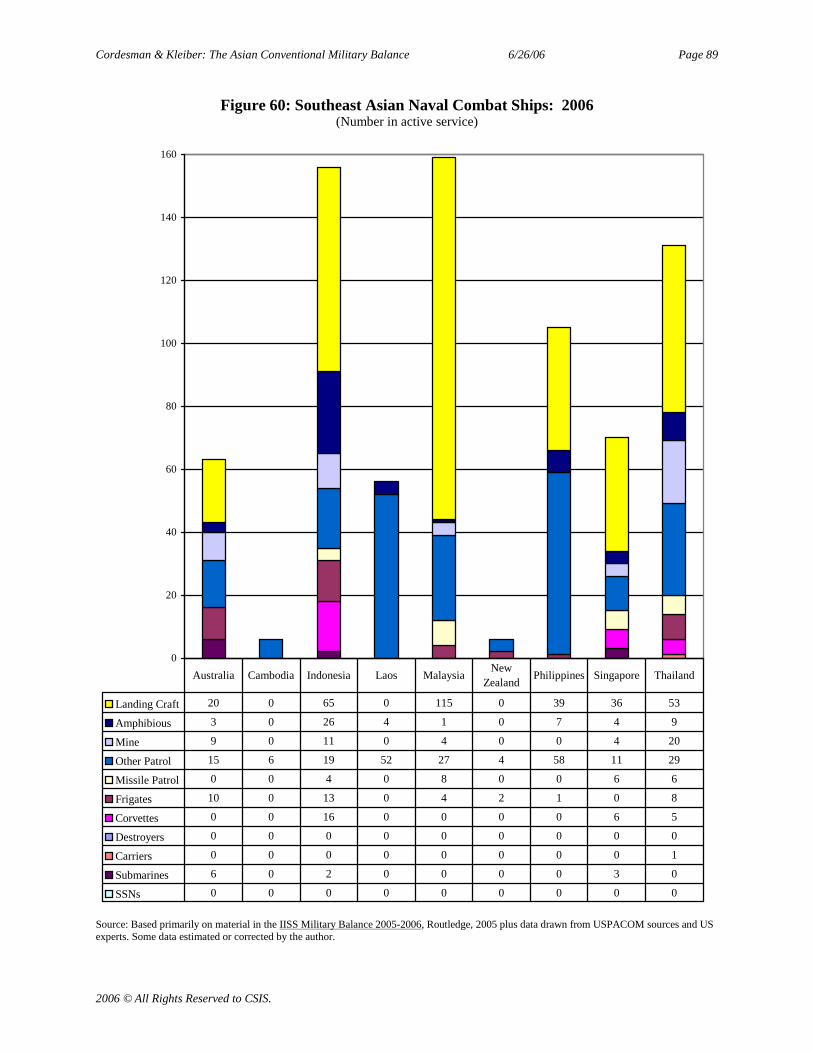
Cordesman & Kleiber: The Asian Conventional Military Balance 6/26/06 Page 89
2006 © All Rights Reserved to CSIS.
Figure 60: Southeast Asian Naval Combat Ships: 2006(Number in active service)
0
20
40
60
80
100
120
140
160
Landing Craft 20 0 65 0 115 0 39 36 53
Amphibious 3 0 26 4 1 0 7 4 9
Mine 9 0 11 0 4 0 0 4 20
Other Patrol 15 6 19 52 27 4 58 11 29
Missile Patrol 0 0 4 0 8 0 0 6 6
Frigates 10 0 13 0 4 2 1 0 8
Corvettes 0 0 16 0 0 0 0 6 5
Destroyers 0 0 0 0 0 0 0 0 0
Carriers 0 0 0 0 0 0 0 0 1
Submarines 6 0 2 0 0 0 0 3 0
SSNs 0 0 0 0 0 0 0 0 0
Australia Cambodia Indonesia Laos MalaysiaNew
ZealandPhilippines Singapore Thailand
Source: Based primarily on material in the IISS Military Balance 2005-2006, Routledge, 2005 plus data drawn from USPACOM sources and USexperts. Some data estimated or corrected by the author.

Cordesman & Kleiber: The Asian Conventional Military Balance 6/26/06 Page 90
2006 © All Rights Reserved to CSIS.
Figure 61: Southeast Asian Major Naval Combat Ships in Key Powers: 2006(Number in active service)
0
5
10
15
20
25
30
35
40
Missile Patrol 0 0 4 0 8 0 0 6 6
Major Surface 10 0 29 0 10 2 1 6 18
Carriers 0 0 0 0 0 0 0 0 1
Submarines 6 0 2 0 0 0 0 3 0
Australia Cambodia Indonesia Laos MalaysiaNew
ZealandPhilippines Singapore Thailand
Source: Based primarily on material in the IISS Military Balance 2005-2006, Routledge, 2005 plus data drawn from USPACOM sources and USexperts. Some data estimated or corrected by the author.
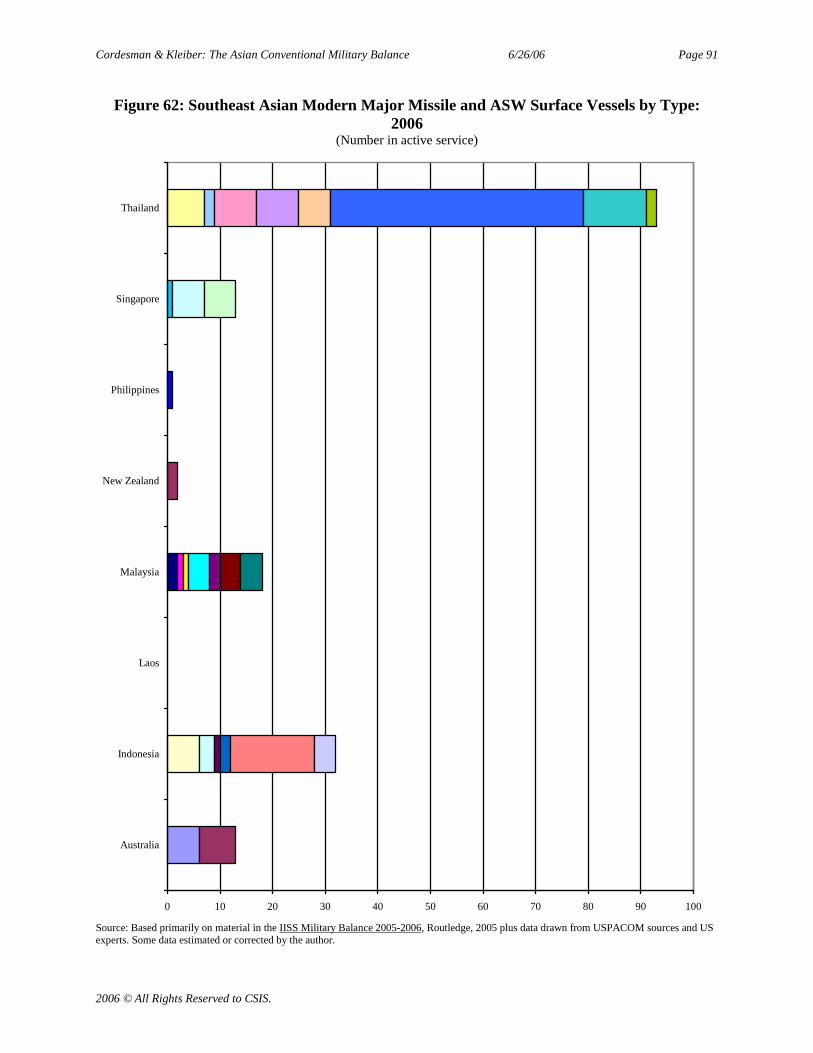
Cordesman & Kleiber: The Asian Conventional Military Balance 6/26/06 Page 91
2006 © All Rights Reserved to CSIS.
Figure 62: Southeast Asian Modern Major Missile and ASW Surface Vessels by Type:2006
(Number in active service)
0 10 20 30 40 50 60 70 80 90 100
Australia
Indonesia
Laos
Malaysia
New Zealand
Philippines
Singapore
Thailand
Source: Based primarily on material in the IISS Military Balance 2005-2006, Routledge, 2005 plus data drawn from USPACOM sources and USexperts. Some data estimated or corrected by the author.

Cordesman & Kleiber: The Asian Conventional Military Balance 6/26/06 Page 92
2006 © All Rights Reserved to CSIS.
Figure 62: Southeast Asian Modern Major Missile and ASW Surface Vessels by Type:2006 (continued)
(Number in active service)
Vessel class andtype
Australia
Indonesia
Laos Malaysia
NewZealan
d
Philippines
Singapore
Thailand
Adelaide FFG 6Anzac FF 7
Ahmad Yani FFG 6Fatahillah FFG 3
Hajar DewantaraFFG
1
Samadikun FF 2Kapitan Patimura FS 16
Mandau PFM 4Kekiu FFG 2
Hang Tuah FF 1Rahmat FF 1
Lakasama FS 4Kasturi FS 2
Handalan PFM 4Perdana PFM 4
Rajah Humabon FF 1Formidable FF 1Victory FSG 6
Sea Wolf PFM 6Chakri Narubet CVH 1
Chao Phraya FFG 2Kraburi FFG 2
Naresuan FFG 2Phutta Yutfa
Chulalok FFG2
Rattanakosin FSG 2Khamronsin FS 3
Tapi FS 2Prabparapak PFM 3
Ratcharit PFM 3
Source: Based primarily on material in the IISS Military Balance 2005-2006, Routledge, 2005 plus data drawn from USPACOM sources and USexperts. Some data estimated or corrected by the author.
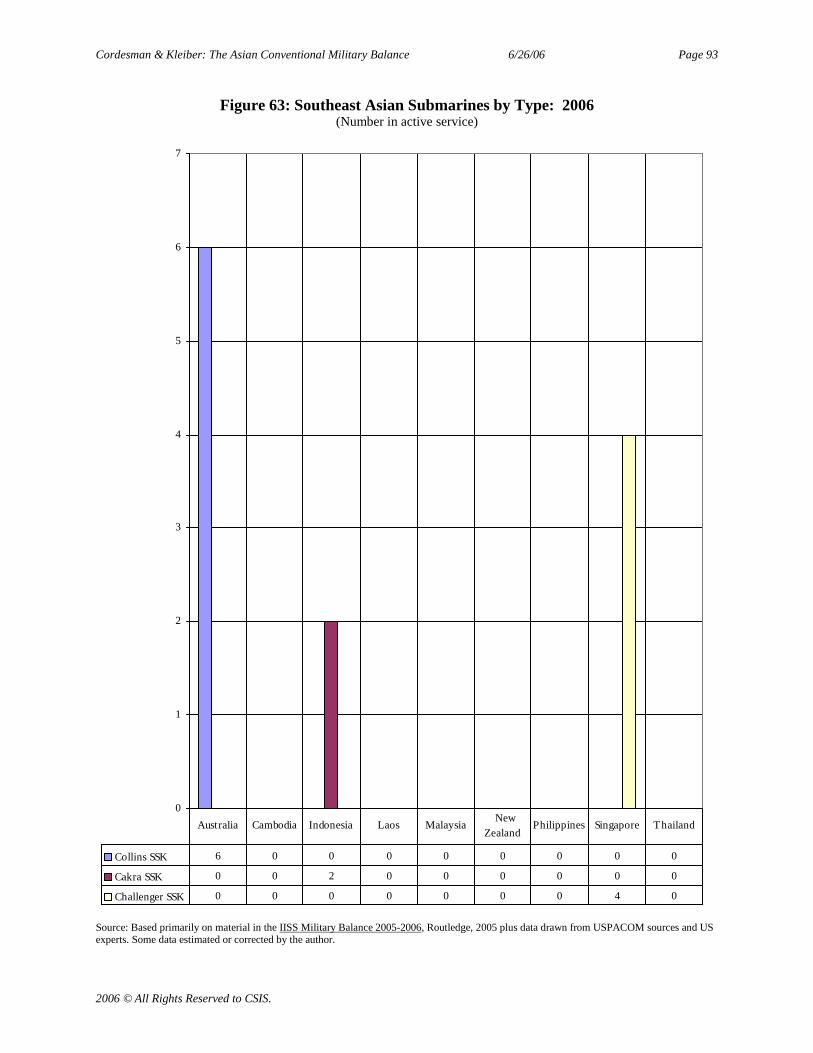
Cordesman & Kleiber: The Asian Conventional Military Balance 6/26/06 Page 93
2006 © All Rights Reserved to CSIS.
Figure 63: Southeast Asian Submarines by Type: 2006(Number in active service)
0
1
2
3
4
5
6
7
Collins SSK 6 0 0 0 0 0 0 0 0
Cakra SSK 0 0 2 0 0 0 0 0 0
Challenger SSK 0 0 0 0 0 0 0 4 0
Australia Cambodia Indonesia Laos MalaysiaNew
ZealandPhilippines Singapore Thailand
Source: Based primarily on material in the IISS Military Balance 2005-2006, Routledge, 2005 plus data drawn from USPACOM sources and USexperts. Some data estimated or corrected by the author.

Cordesman & Kleiber: The Asian Conventional Military Balance 6/26/06 Page 94
2006 © All Rights Reserved to CSIS.
Figure 64: Western Naval Combat Ships Affecting the Asian Balance: 2006
0
20
40
60
80
100
120
140
US 80 12 0 118 26 39
UK 15 3 0 34 22 7
Russia 54 1 35 66 41 22
Submarines Carriers Missile Patrol Major Surface Mine Amphibious
Source: Based primarily on material in the IISS Military Balance 2005-2006, Routledge, 2005 plus data drawn from USPACOM sources and USexperts. Some data estimated or corrected by the author.

Cordesman & Kleiber: The Asian Conventional Military Balance 6/26/06 Page 95
2006 © All Rights Reserved to CSIS.
The South Asian Military Balance
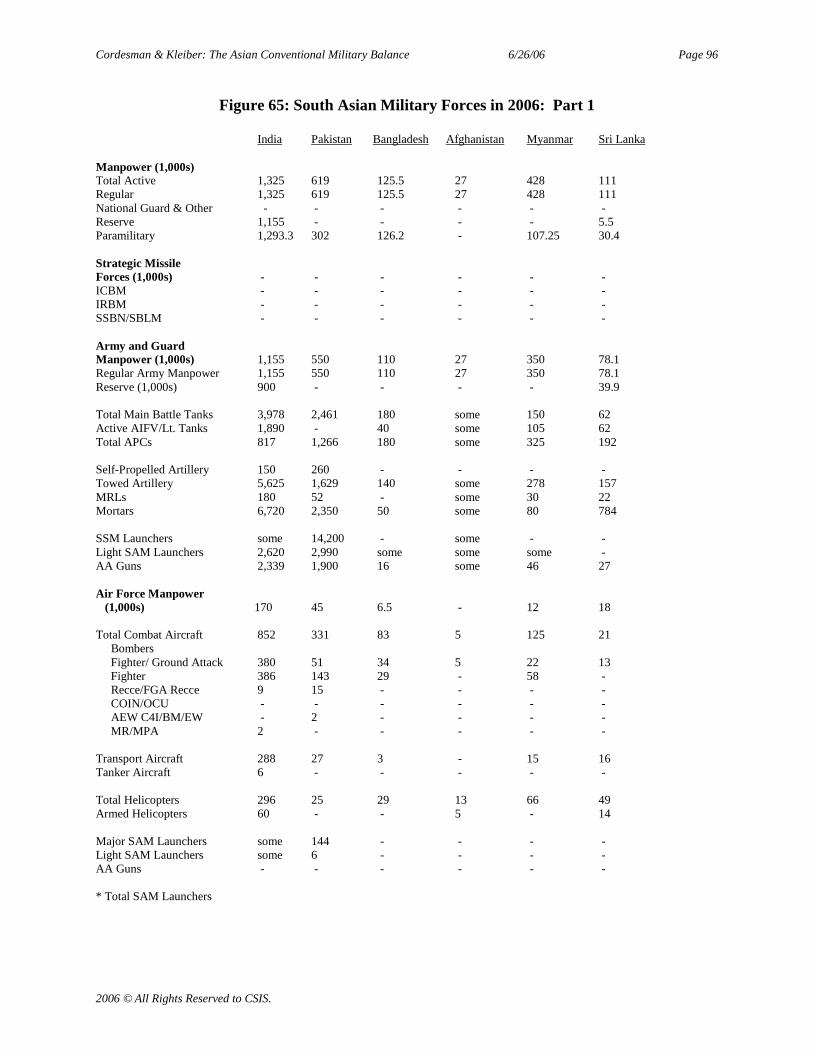
Cordesman & Kleiber: The Asian Conventional Military Balance 6/26/06 Page 96
2006 © All Rights Reserved to CSIS.
Figure 65: South Asian Military Forces in 2006: Part 1
India Pakistan Bangladesh Afghanistan Myanmar Sri Lanka
Manpower (1,000s)Total Active 1,325 619 125.5 27 428 111Regular 1,325 619 125.5 27 428 111National Guard & Other - - - - - -Reserve 1,155 - - - - 5.5Paramilitary 1,293.3 302 126.2 - 107.25 30.4
Strategic MissileForces (1,000s) - - - - - -ICBM - - - - - -IRBM - - - - - -SSBN/SBLM - - - - - -
Army and GuardManpower (1,000s) 1,155 550 110 27 350 78.1Regular Army Manpower 1,155 550 110 27 350 78.1Reserve (1,000s) 900 - - - - 39.9
Total Main Battle Tanks 3,978 2,461 180 some 150 62Active AIFV/Lt. Tanks 1,890 - 40 some 105 62Total APCs 817 1,266 180 some 325 192
Self-Propelled Artillery 150 260 - - - -Towed Artillery 5,625 1,629 140 some 278 157MRLs 180 52 - some 30 22Mortars 6,720 2,350 50 some 80 784
SSM Launchers some 14,200 - some - -Light SAM Launchers 2,620 2,990 some some some -AA Guns 2,339 1,900 16 some 46 27
Air Force Manpower(1,000s) 170 45 6.5 - 12 18
Total Combat Aircraft 852 331 83 5 125 21BombersFighter/ Ground Attack 380 51 34 5 22 13Fighter 386 143 29 - 58 -Recce/FGA Recce 9 15 - - - -COIN/OCU - - - - - -AEW C4I/BM/EW - 2 - - - -MR/MPA 2 - - - - -
Transport Aircraft 288 27 3 - 15 16Tanker Aircraft 6 - - - - -
Total Helicopters 296 25 29 13 66 49Armed Helicopters 60 - - 5 - 14
Major SAM Launchers some 144 - - - -Light SAM Launchers some 6 - - - -AA Guns - - - - - -
* Total SAM Launchers
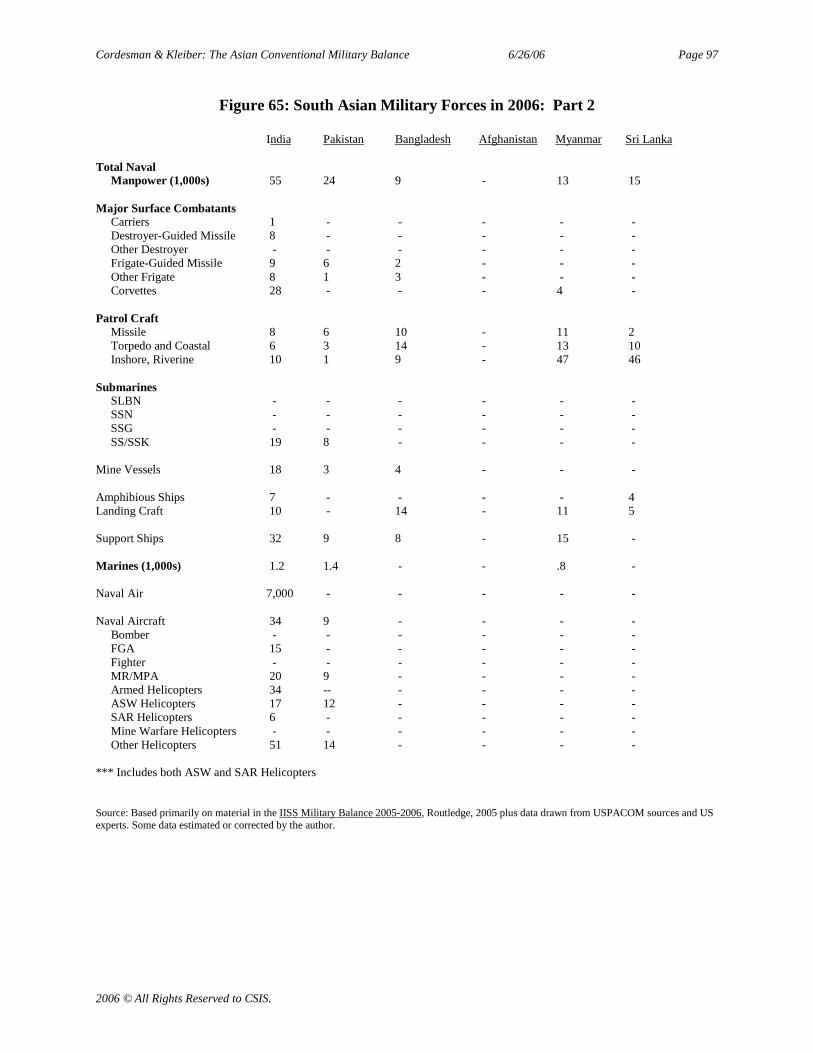
Cordesman & Kleiber: The Asian Conventional Military Balance 6/26/06 Page 97
2006 © All Rights Reserved to CSIS.
Figure 65: South Asian Military Forces in 2006: Part 2
India Pakistan Bangladesh Afghanistan Myanmar Sri Lanka
Total NavalManpower (1,000s) 55 24 9 - 13 15
Major Surface CombatantsCarriers 1 - - - - -Destroyer-Guided Missile 8 - - - - -Other Destroyer - - - - - -Frigate-Guided Missile 9 6 2 - - -Other Frigate 8 1 3 - - -Corvettes 28 - - - 4 -
Patrol CraftMissile 8 6 10 - 11 2Torpedo and Coastal 6 3 14 - 13 10Inshore, Riverine 10 1 9 - 47 46
SubmarinesSLBN - - - - - -SSN - - - - - -SSG - - - - - -SS/SSK 19 8 - - - -
Mine Vessels 18 3 4 - - -
Amphibious Ships 7 - - - - 4Landing Craft 10 - 14 - 11 5
Support Ships 32 9 8 - 15 -
Marines (1,000s) 1.2 1.4 - - .8 -
Naval Air 7,000 - - - - -
Naval Aircraft 34 9 - - - -Bomber - - - - - -FGA 15 - - - - -Fighter - - - - - -MR/MPA 20 9 - - - -Armed Helicopters 34 -- - - - -ASW Helicopters 17 12 - - - -SAR Helicopters 6 - - - - -Mine Warfare Helicopters - - - - - -Other Helicopters 51 14 - - - -
*** Includes both ASW and SAR Helicopters
Source: Based primarily on material in the IISS Military Balance 2005-2006, Routledge, 2005 plus data drawn from USPACOM sources and USexperts. Some data estimated or corrected by the author.
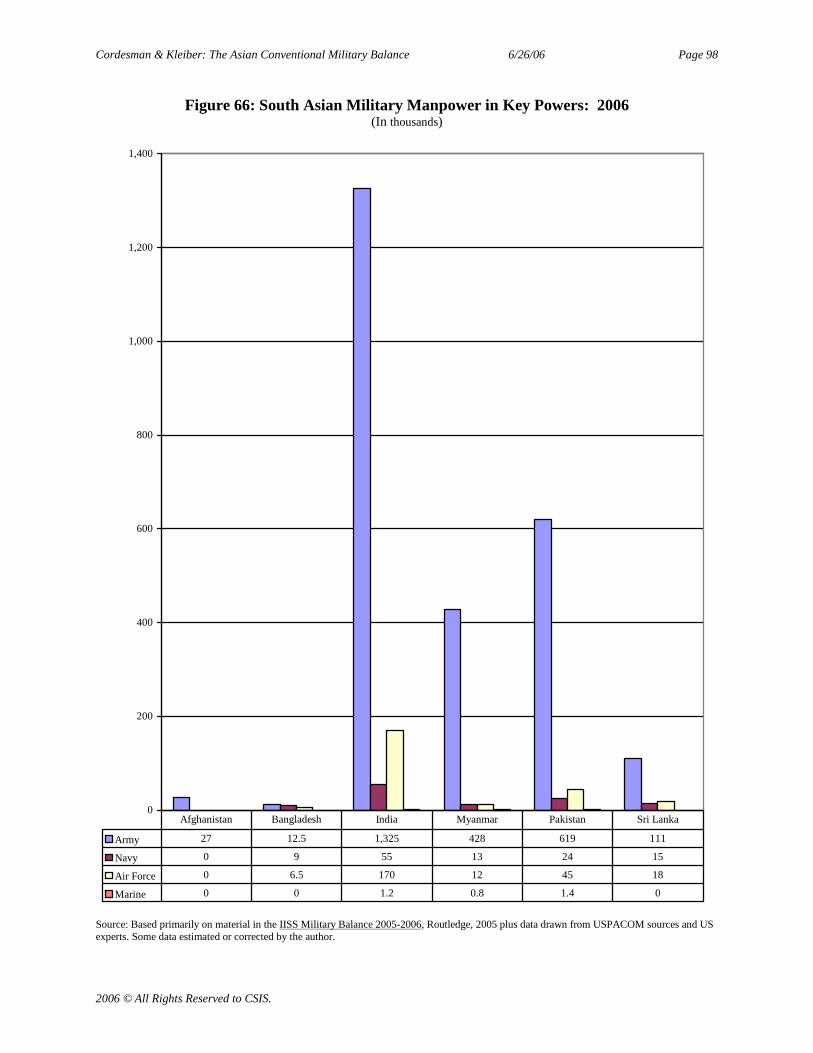
Cordesman & Kleiber: The Asian Conventional Military Balance 6/26/06 Page 98
2006 © All Rights Reserved to CSIS.
Figure 66: South Asian Military Manpower in Key Powers: 2006(In thousands)
0
200
400
600
800
1,000
1,200
1,400
Army 27 12.5 1,325 428 619 111
Navy 0 9 55 13 24 15
Air Force 0 6.5 170 12 45 18
Marine 0 0 1.2 0.8 1.4 0
Afghanistan Bangladesh India Myanmar Pakistan Sri Lanka
Source: Based primarily on material in the IISS Military Balance 2005-2006, Routledge, 2005 plus data drawn from USPACOM sources and USexperts. Some data estimated or corrected by the author.
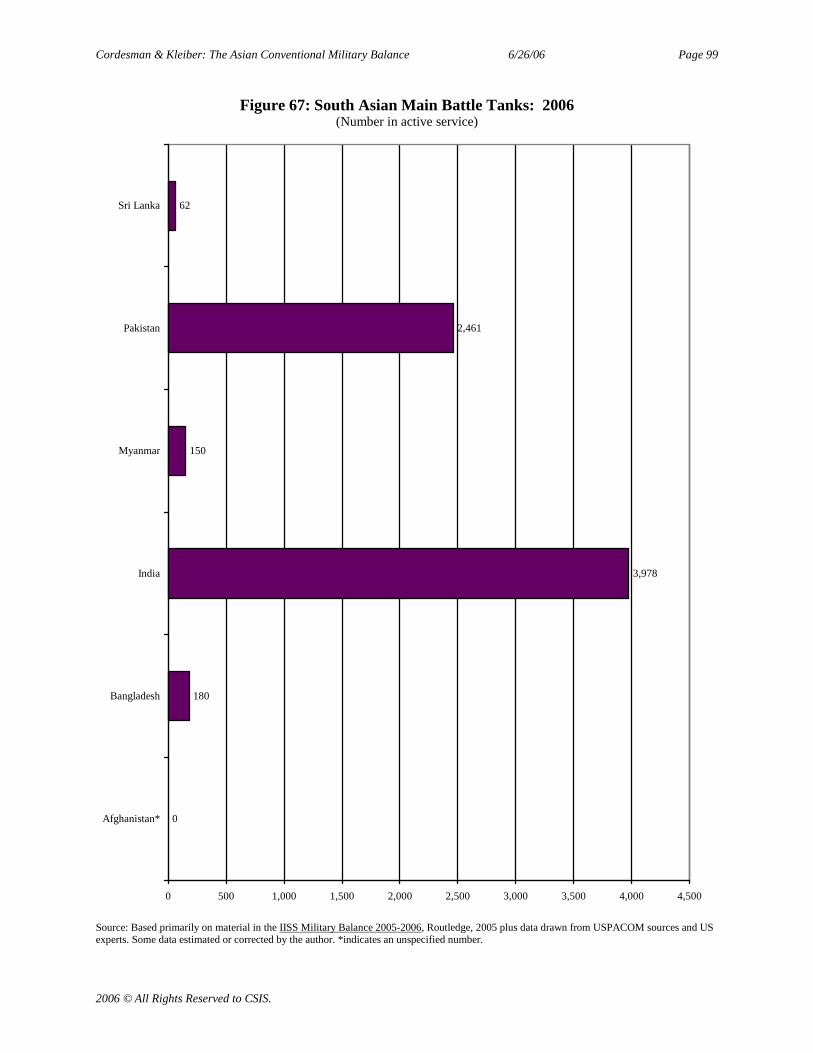
Cordesman & Kleiber: The Asian Conventional Military Balance 6/26/06 Page 99
2006 © All Rights Reserved to CSIS.
Figure 67: South Asian Main Battle Tanks: 2006(Number in active service)
0
180
3,978
150
2,461
62
0 500 1,000 1,500 2,000 2,500 3,000 3,500 4,000 4,500
Afghanistan*
Bangladesh
India
Myanmar
Pakistan
Sri Lanka
Source: Based primarily on material in the IISS Military Balance 2005-2006, Routledge, 2005 plus data drawn from USPACOM sources and USexperts. Some data estimated or corrected by the author. *indicates an unspecified number.
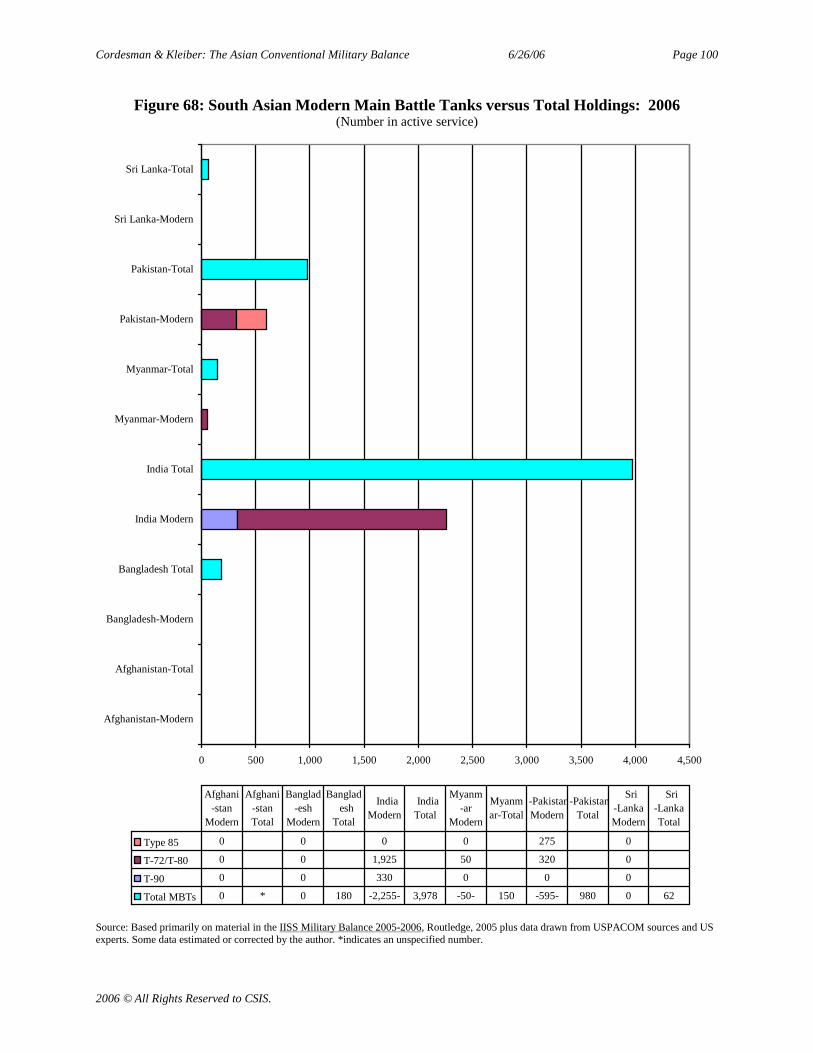
Cordesman & Kleiber: The Asian Conventional Military Balance 6/26/06 Page 100
2006 © All Rights Reserved to CSIS.
Figure 68: South Asian Modern Main Battle Tanks versus Total Holdings: 2006(Number in active service)
0 500 1,000 1,500 2,000 2,500 3,000 3,500 4,000 4,500
Afghanistan-Modern
Afghanistan-Total
Bangladesh-Modern
Bangladesh Total
India Modern
India Total
Myanmar-Modern
Myanmar-Total
Pakistan-Modern
Pakistan-Total
Sri Lanka-Modern
Sri Lanka-Total
Type 85 0 0 0 0 275 0
T-72/T-80 0 0 1,925 50 320 0
T-90 0 0 330 0 0 0
Total MBTs 0 * 0 180 -2,255- 3,978 -50- 150 -595- 980 0 62
Afghani-stan
Modern
Afghani-stanTotal
Banglad-esh
Modern
Bangladesh
Total
IndiaModern
IndiaTotal
Myanm-ar
Modern
Myanmar-Total
-PakistanModern
-PakistanTotal
Sri-LankaModern
Sri-LankaTotal
Source: Based primarily on material in the IISS Military Balance 2005-2006, Routledge, 2005 plus data drawn from USPACOM sources and USexperts. Some data estimated or corrected by the author. *indicates an unspecified number.
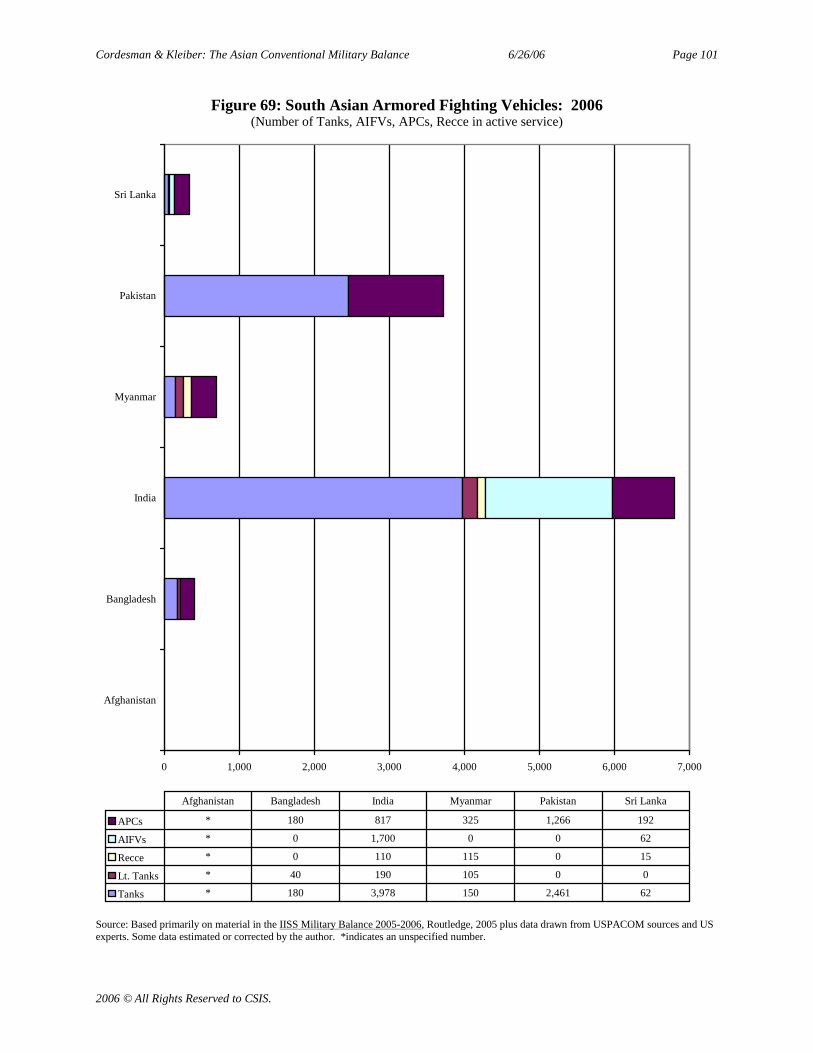
Cordesman & Kleiber: The Asian Conventional Military Balance 6/26/06 Page 101
2006 © All Rights Reserved to CSIS.
Figure 69: South Asian Armored Fighting Vehicles: 2006(Number of Tanks, AIFVs, APCs, Recce in active service)
0 1,000 2,000 3,000 4,000 5,000 6,000 7,000
Afghanistan
Bangladesh
India
Myanmar
Pakistan
Sri Lanka
APCs * 180 817 325 1,266 192
AIFVs * 0 1,700 0 0 62
Recce * 0 110 115 0 15
Lt. Tanks * 40 190 105 0 0
Tanks * 180 3,978 150 2,461 62
Afghanistan Bangladesh India Myanmar Pakistan Sri Lanka
Source: Based primarily on material in the IISS Military Balance 2005-2006, Routledge, 2005 plus data drawn from USPACOM sources and USexperts. Some data estimated or corrected by the author. *indicates an unspecified number.
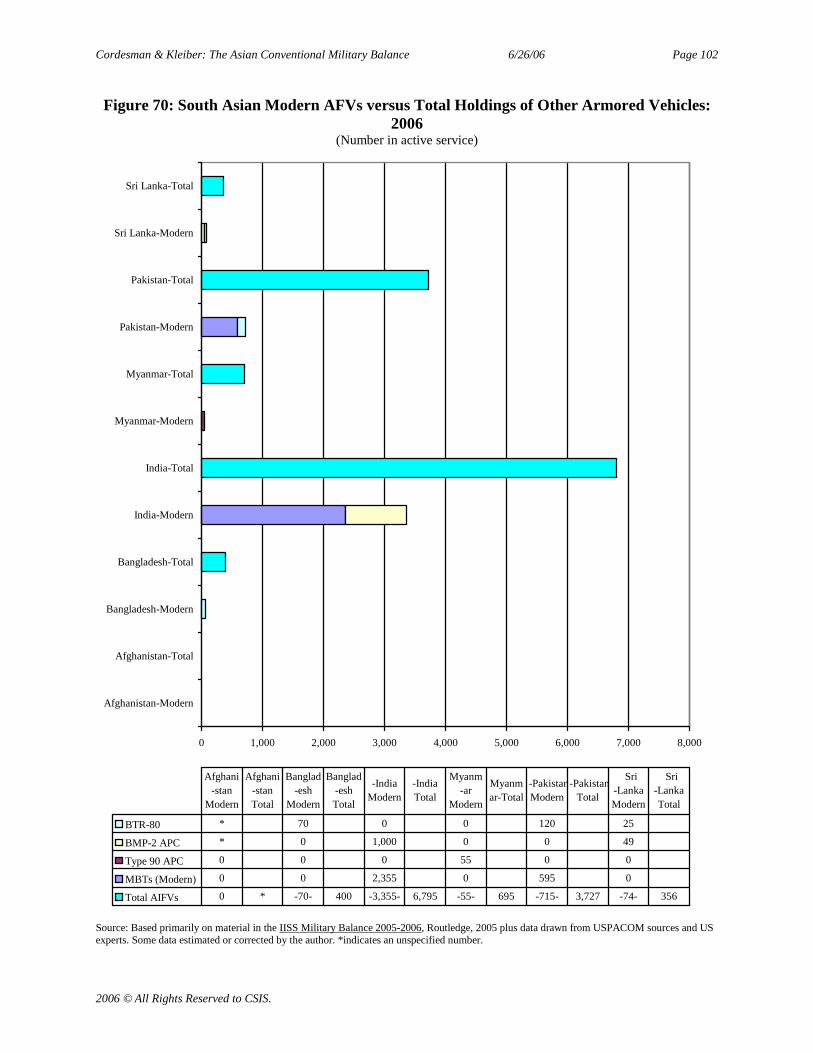
Cordesman & Kleiber: The Asian Conventional Military Balance 6/26/06 Page 102
2006 © All Rights Reserved to CSIS.
Figure 70: South Asian Modern AFVs versus Total Holdings of Other Armored Vehicles:2006
(Number in active service)
0 1,000 2,000 3,000 4,000 5,000 6,000 7,000 8,000
Afghanistan-Modern
Afghanistan-Total
Bangladesh-Modern
Bangladesh-Total
India-Modern
India-Total
Myanmar-Modern
Myanmar-Total
Pakistan-Modern
Pakistan-Total
Sri Lanka-Modern
Sri Lanka-Total
BTR-80 * 70 0 0 120 25
BMP-2 APC * 0 1,000 0 0 49
Type 90 APC 0 0 0 55 0 0
MBTs (Modern) 0 0 2,355 0 595 0
Total AIFVs 0 * -70- 400 -3,355- 6,795 -55- 695 -715- 3,727 -74- 356
Afghani-stan
Modern
Afghani-stanTotal
Banglad-esh
Modern
Banglad-eshTotal
-IndiaModern
-IndiaTotal
Myanm-ar
Modern
Myanmar-Total
-PakistanModern
-PakistanTotal
Sri-LankaModern
Sri-LankaTotal
Source: Based primarily on material in the IISS Military Balance 2005-2006, Routledge, 2005 plus data drawn from USPACOM sources and USexperts. Some data estimated or corrected by the author. *indicates an unspecified number.
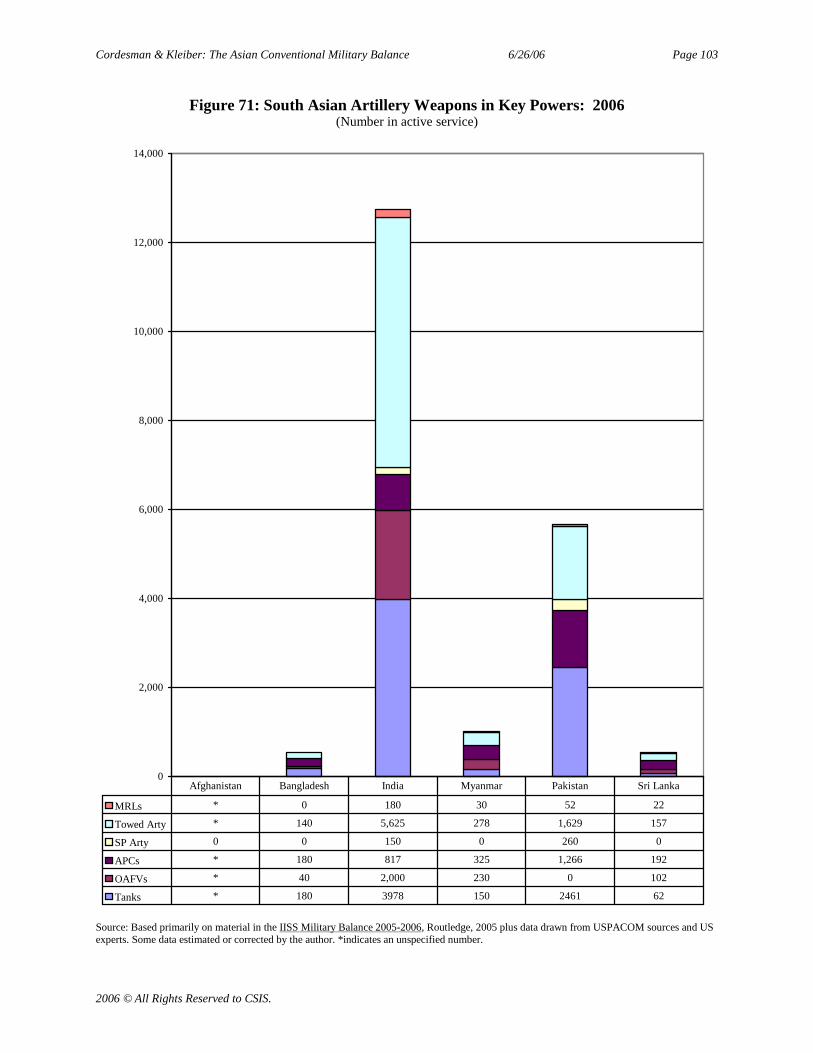
Cordesman & Kleiber: The Asian Conventional Military Balance 6/26/06 Page 103
2006 © All Rights Reserved to CSIS.
Figure 71: South Asian Artillery Weapons in Key Powers: 2006(Number in active service)
0
2,000
4,000
6,000
8,000
10,000
12,000
14,000
MRLs * 0 180 30 52 22
Towed Arty * 140 5,625 278 1,629 157
SP Arty 0 0 150 0 260 0
APCs * 180 817 325 1,266 192
OAFVs * 40 2,000 230 0 102
Tanks * 180 3978 150 2461 62
Afghanistan Bangladesh India Myanmar Pakistan Sri Lanka
Source: Based primarily on material in the IISS Military Balance 2005-2006, Routledge, 2005 plus data drawn from USPACOM sources and USexperts. Some data estimated or corrected by the author. *indicates an unspecified number.
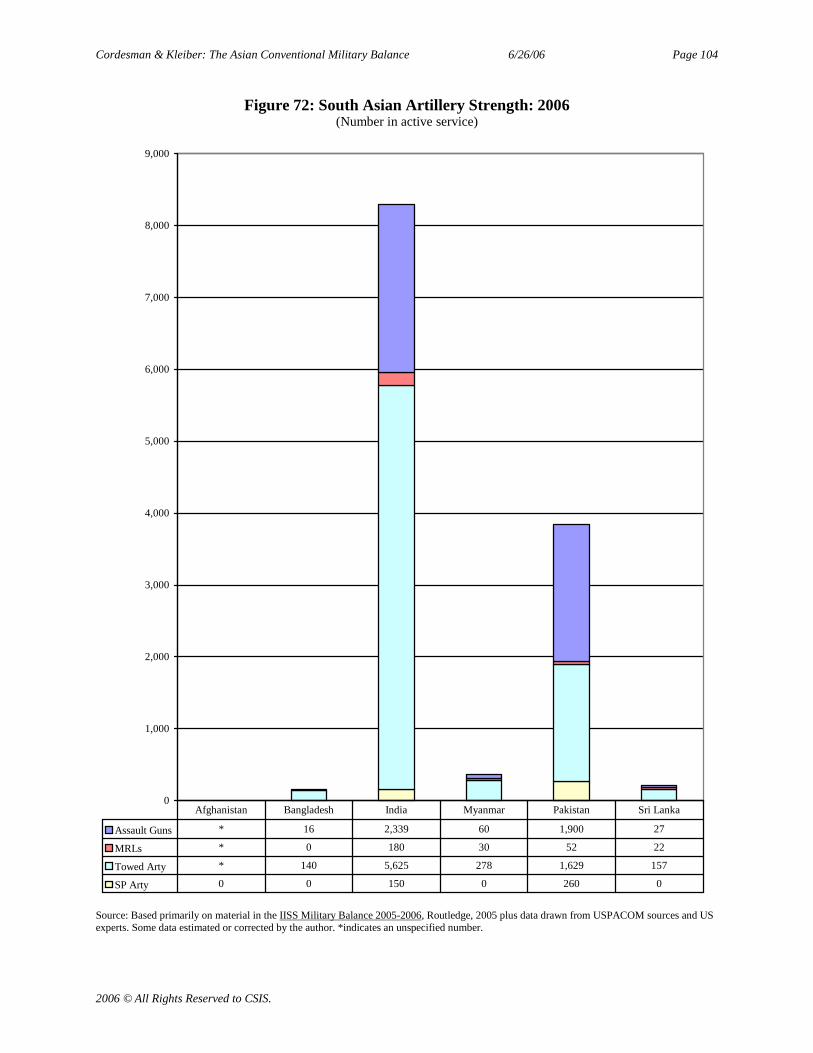
Cordesman & Kleiber: The Asian Conventional Military Balance 6/26/06 Page 104
2006 © All Rights Reserved to CSIS.
Figure 72: South Asian Artillery Strength: 2006(Number in active service)
0
1,000
2,000
3,000
4,000
5,000
6,000
7,000
8,000
9,000
Assault Guns * 16 2,339 60 1,900 27
MRLs * 0 180 30 52 22
Towed Arty * 140 5,625 278 1,629 157
SP Arty 0 0 150 0 260 0
Afghanistan Bangladesh India Myanmar Pakistan Sri Lanka
Source: Based primarily on material in the IISS Military Balance 2005-2006, Routledge, 2005 plus data drawn from USPACOM sources and USexperts. Some data estimated or corrected by the author. *indicates an unspecified number.
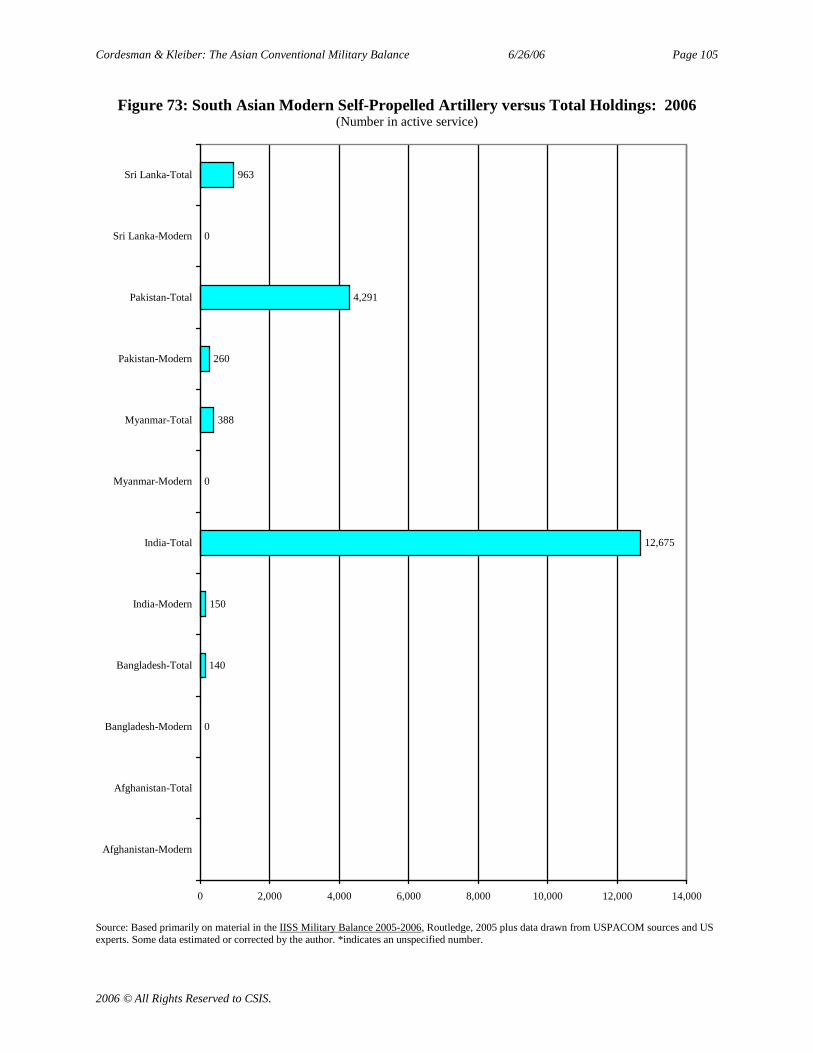
Cordesman & Kleiber: The Asian Conventional Military Balance 6/26/06 Page 105
2006 © All Rights Reserved to CSIS.
Figure 73: South Asian Modern Self-Propelled Artillery versus Total Holdings: 2006(Number in active service)
0
140
150
12,675
0
388
260
4,291
0
963
0 2,000 4,000 6,000 8,000 10,000 12,000 14,000
Afghanistan-Modern
Afghanistan-Total
Bangladesh-Modern
Bangladesh-Total
India-Modern
India-Total
Myanmar-Modern
Myanmar-Total
Pakistan-Modern
Pakistan-Total
Sri Lanka-Modern
Sri Lanka-Total
Source: Based primarily on material in the IISS Military Balance 2005-2006, Routledge, 2005 plus data drawn from USPACOM sources and USexperts. Some data estimated or corrected by the author. *indicates an unspecified number.
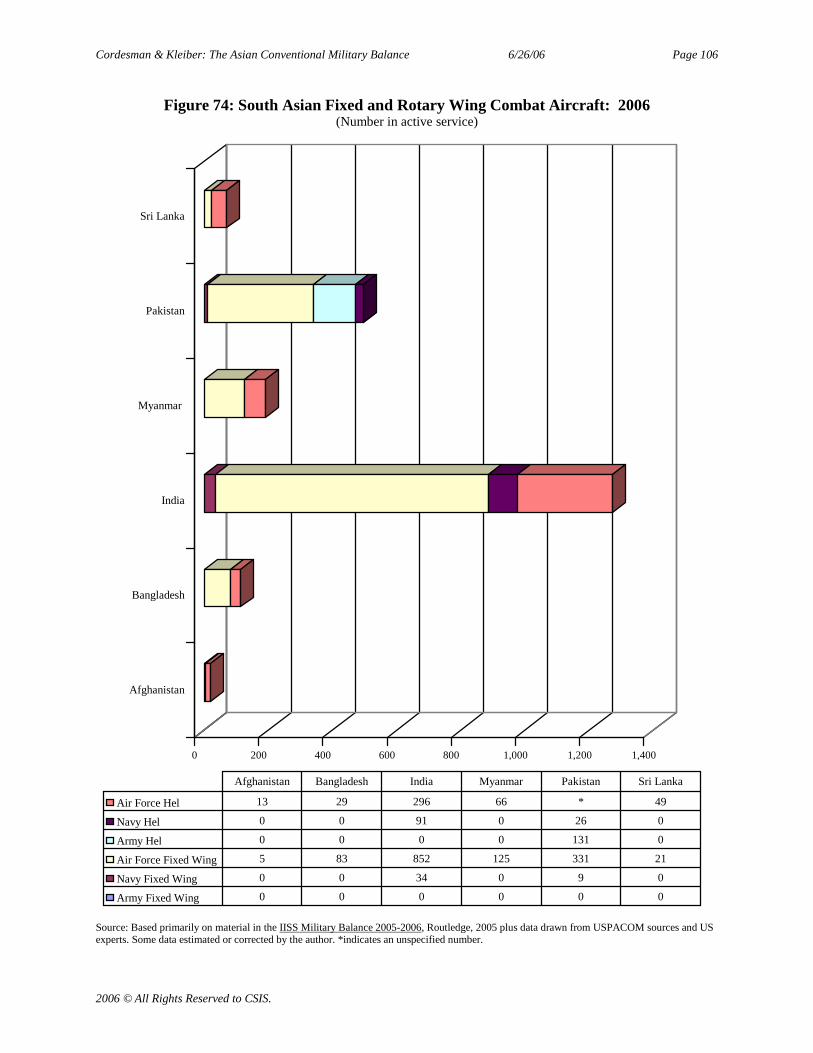
Cordesman & Kleiber: The Asian Conventional Military Balance 6/26/06 Page 106
2006 © All Rights Reserved to CSIS.
Figure 74: South Asian Fixed and Rotary Wing Combat Aircraft: 2006(Number in active service)
0 200 400 600 800 1,000 1,200 1,400
Afghanistan
Bangladesh
India
Myanmar
Pakistan
Sri Lanka
Air Force Hel 13 29 296 66 * 49
Navy Hel 0 0 91 0 26 0
Army Hel 0 0 0 0 131 0
Air Force Fixed Wing 5 83 852 125 331 21
Navy Fixed Wing 0 0 34 0 9 0
Army Fixed Wing 0 0 0 0 0 0
Afghanistan Bangladesh India Myanmar Pakistan Sri Lanka
Source: Based primarily on material in the IISS Military Balance 2005-2006, Routledge, 2005 plus data drawn from USPACOM sources and USexperts. Some data estimated or corrected by the author. *indicates an unspecified number.
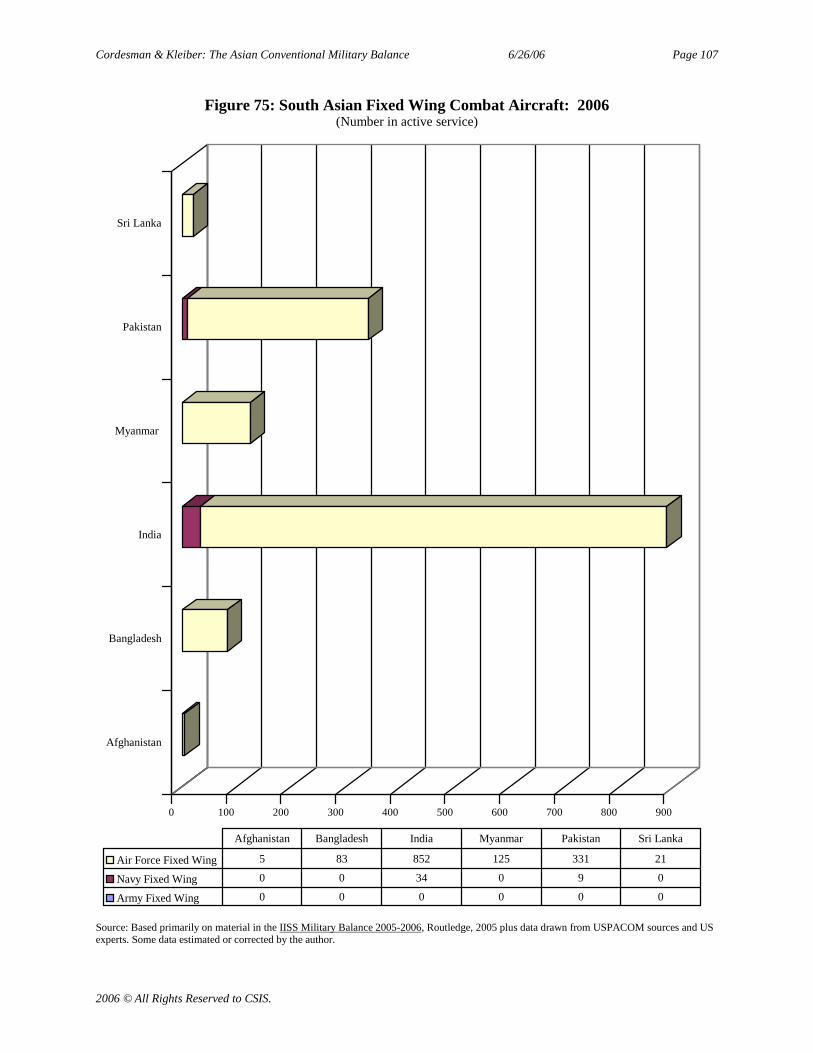
Cordesman & Kleiber: The Asian Conventional Military Balance 6/26/06 Page 107
2006 © All Rights Reserved to CSIS.
Figure 75: South Asian Fixed Wing Combat Aircraft: 2006(Number in active service)
0 100 200 300 400 500 600 700 800 900
Afghanistan
Bangladesh
India
Myanmar
Pakistan
Sri Lanka
Air Force Fixed Wing 5 83 852 125 331 21
Navy Fixed Wing 0 0 34 0 9 0
Army Fixed Wing 0 0 0 0 0 0
Afghanistan Bangladesh India Myanmar Pakistan Sri Lanka
Source: Based primarily on material in the IISS Military Balance 2005-2006, Routledge, 2005 plus data drawn from USPACOM sources and USexperts. Some data estimated or corrected by the author.

Cordesman & Kleiber: The Asian Conventional Military Balance 6/26/06 Page 108
2006 © All Rights Reserved to CSIS.
Figure 76: South Asian Modern Air Force Combat Aircraft versus Total Combat Aircraft:2006
(Number in active service)
0 500 1,000 1,500 2,000 2,500 3,000
North Korea-Modern
North Korea-Total
South Korea-Modern
South Korea Total
US PACOM Modern
US PACOM Total
Taiwan-Modern
Taiwan-Total
Japan-Modern
Japan-Total
China-Modern
China-Total
Su-25 34 0 0 0 0
MiG-29 20 0 0 0 0
Hawkeye XP 0 4 6 0 0
E-2T 0 0 4 0 0
M-2000-5 0 0 57 0 0
F-16 0 283 146 0 0
EC-2 0 0 0 10 0
F-15 0 2 0 150 0
Su-30 0 0 0 0 10
Su-27 0 0 0 0 110
J-10 0 0 0 0 62
Total -54- 540 -289- 540 * 318 -213- 479 -160- 300 -182- 2643
North-KoreaModern
North-KoreaTotal
South-KoreaModern
SouthKoreaTotal
USPACO
M
USPACO
M Total
-TaiwanModern
-TaiwanTotal
-JapanModern
-JapanTotal
-ChinaModern
-ChinaTotal
Source: Based primarily on material in the IISS Military Balance 2005-2006, Routledge, 2005 plus data drawn from USPACOM sources and USexperts. Some data estimated or corrected by the author.

Cordesman & Kleiber: The Asian Conventional Military Balance 6/26/06 Page 109
2006 © All Rights Reserved to CSIS.
Figure 77: South Asian Rotary Wing Combat Aircraft: 2006(Number in active service)
0 50 100 150 200 250 300 350 400
Afghanistan
Bangladesh
India
Myanmar
Pakistan
Sri Lanka
Air Force Hel 13 29 296 66 * 49
Navy Hel 0 0 91 0 26 0
Army Hel 0 0 0 0 131 0
Afghanistan Bangladesh India Myanmar Pakistan Sri Lanka
Source: Based primarily on material in the IISS Military Balance 2005-2006, plus data drawn from USPACOM sources and US experts. Somedata estimated or corrected by the author. *indicates an unspecified number.
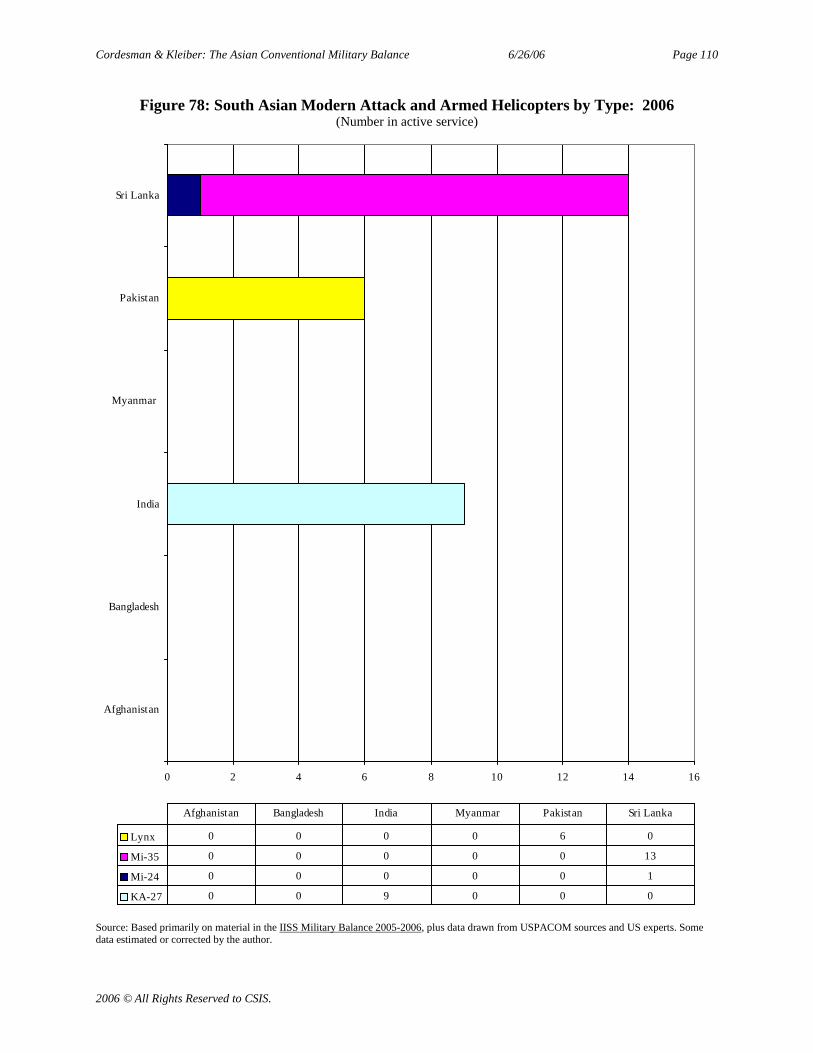
Cordesman & Kleiber: The Asian Conventional Military Balance 6/26/06 Page 110
2006 © All Rights Reserved to CSIS.
Figure 78: South Asian Modern Attack and Armed Helicopters by Type: 2006(Number in active service)
0 2 4 6 8 10 12 14 16
Afghanistan
Bangladesh
India
Myanmar
Pakistan
Sri Lanka
Lynx 0 0 0 0 6 0
Mi-35 0 0 0 0 0 13
Mi-24 0 0 0 0 0 1
KA-27 0 0 9 0 0 0
Afghanistan Bangladesh India Myanmar Pakistan Sri Lanka
Source: Based primarily on material in the IISS Military Balance 2005-2006, plus data drawn from USPACOM sources and US experts. Somedata estimated or corrected by the author.
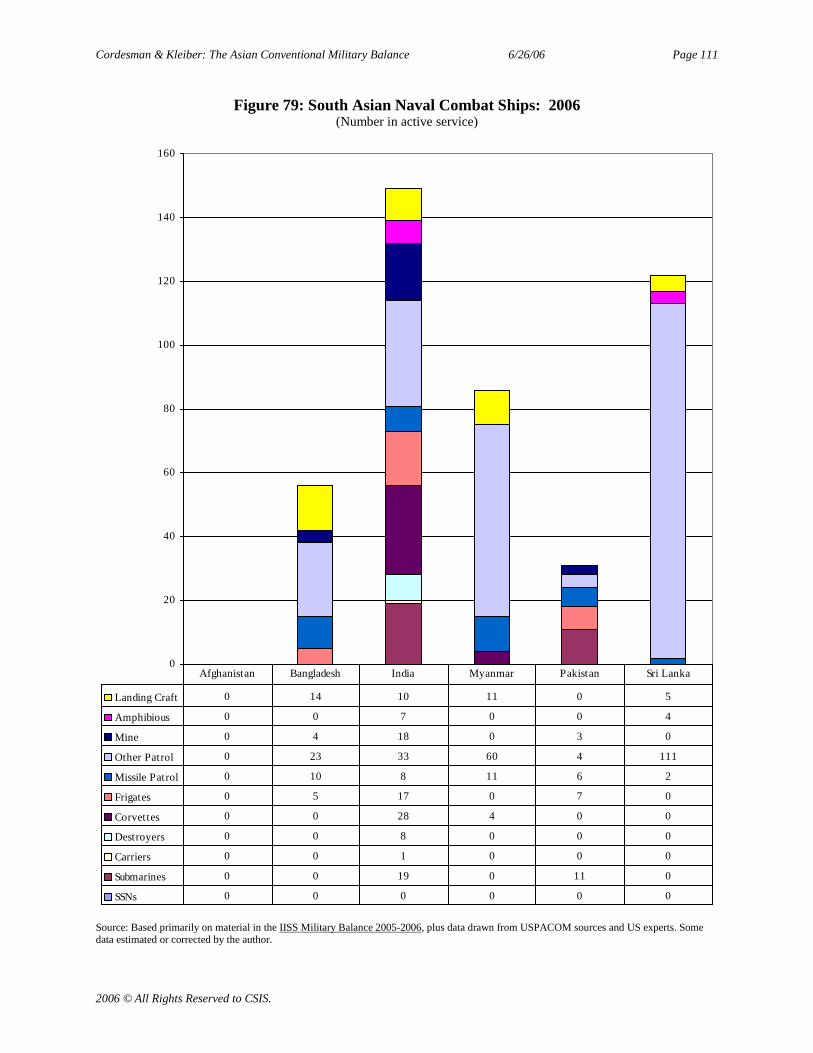
Cordesman & Kleiber: The Asian Conventional Military Balance 6/26/06 Page 111
2006 © All Rights Reserved to CSIS.
Figure 79: South Asian Naval Combat Ships: 2006(Number in active service)
0
20
40
60
80
100
120
140
160
Landing Craft 0 14 10 11 0 5
Amphibious 0 0 7 0 0 4
Mine 0 4 18 0 3 0
Other Patrol 0 23 33 60 4 111
Missile Patrol 0 10 8 11 6 2
Frigates 0 5 17 0 7 0
Corvettes 0 0 28 4 0 0
Destroyers 0 0 8 0 0 0
Carriers 0 0 1 0 0 0
Submarines 0 0 19 0 11 0
SSNs 0 0 0 0 0 0
Afghanistan Bangladesh India Myanmar Pakistan Sri Lanka
Source: Based primarily on material in the IISS Military Balance 2005-2006, plus data drawn from USPACOM sources and US experts. Somedata estimated or corrected by the author.
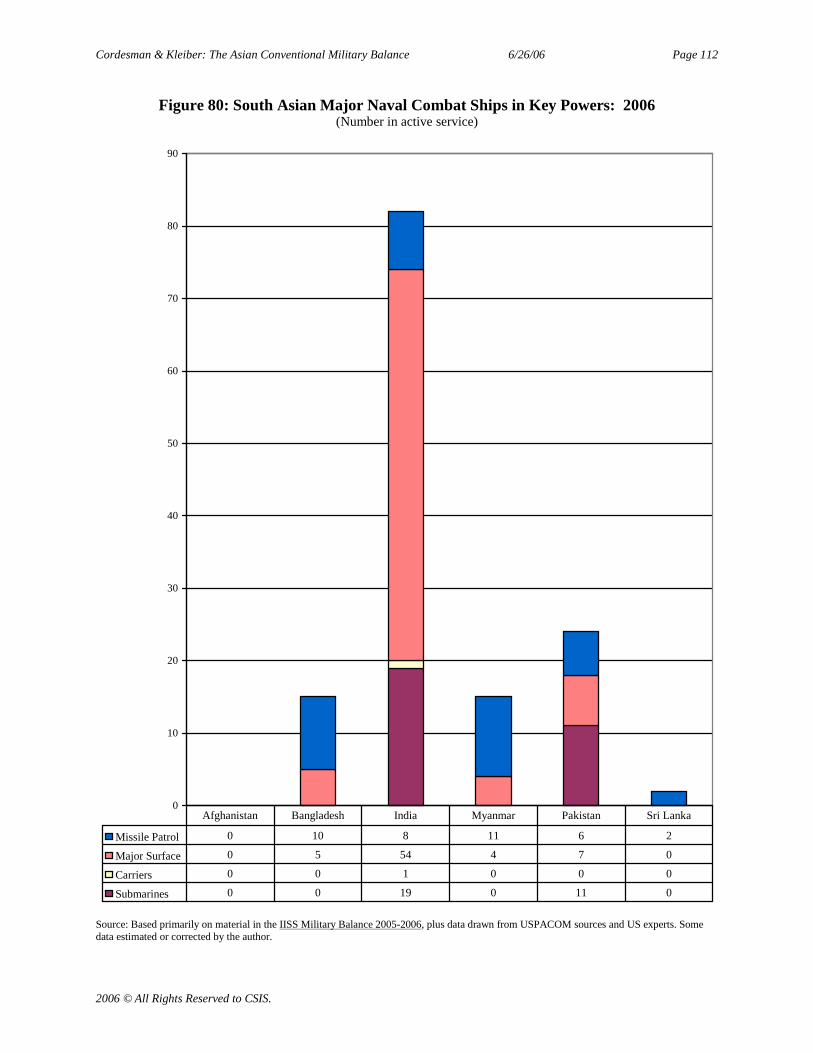
Cordesman & Kleiber: The Asian Conventional Military Balance 6/26/06 Page 112
2006 © All Rights Reserved to CSIS.
Figure 80: South Asian Major Naval Combat Ships in Key Powers: 2006(Number in active service)
0
10
20
30
40
50
60
70
80
90
Missile Patrol 0 10 8 11 6 2
Major Surface 0 5 54 4 7 0
Carriers 0 0 1 0 0 0
Submarines 0 0 19 0 11 0
Afghanistan Bangladesh India Myanmar Pakistan Sri Lanka
Source: Based primarily on material in the IISS Military Balance 2005-2006, plus data drawn from USPACOM sources and US experts. Somedata estimated or corrected by the author.
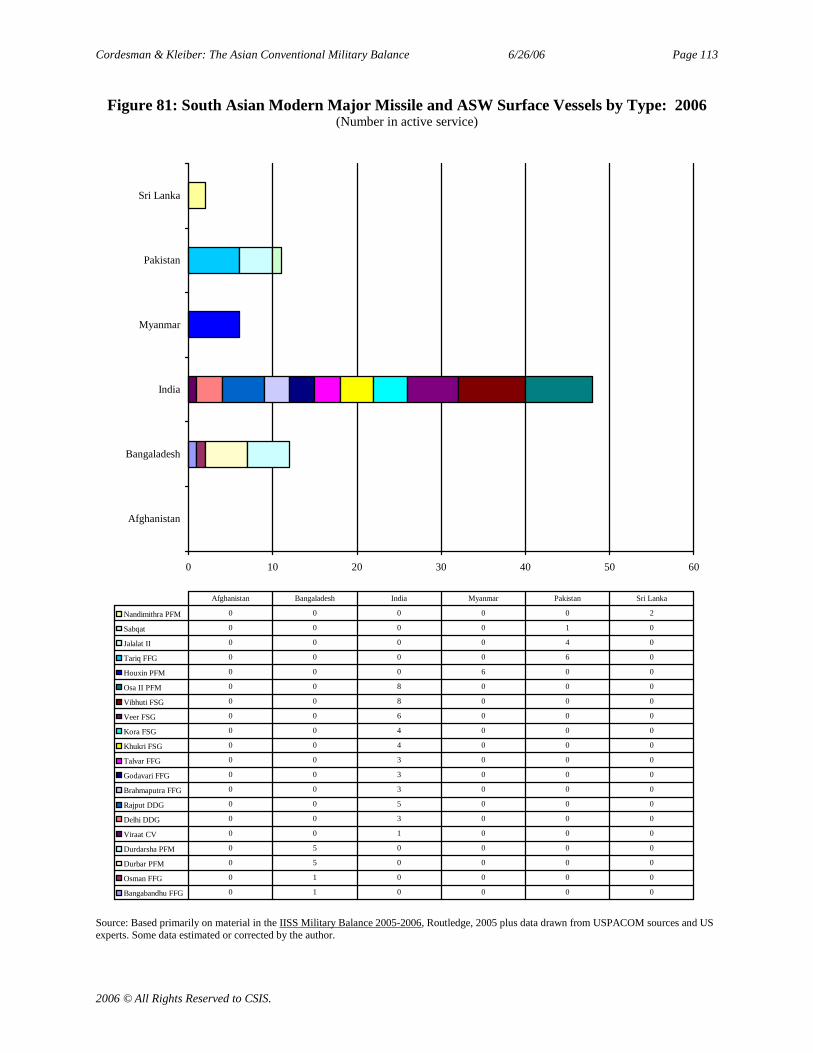
Cordesman & Kleiber: The Asian Conventional Military Balance 6/26/06 Page 113
2006 © All Rights Reserved to CSIS.
Figure 81: South Asian Modern Major Missile and ASW Surface Vessels by Type: 2006(Number in active service)
0 10 20 30 40 50 60
Afghanistan
Bangaladesh
India
Myanmar
Pakistan
Sri Lanka
Nandimithra PFM 0 0 0 0 0 2
Sabqat 0 0 0 0 1 0
Jalalat II 0 0 0 0 4 0
Tariq FFG 0 0 0 0 6 0
Houxin PFM 0 0 0 6 0 0
Osa II PFM 0 0 8 0 0 0
Vibhuti FSG 0 0 8 0 0 0
Veer FSG 0 0 6 0 0 0
Kora FSG 0 0 4 0 0 0
Khukri FSG 0 0 4 0 0 0
Talvar FFG 0 0 3 0 0 0
Godavari FFG 0 0 3 0 0 0
Brahmaputra FFG 0 0 3 0 0 0
Rajput DDG 0 0 5 0 0 0
Delhi DDG 0 0 3 0 0 0
Viraat CV 0 0 1 0 0 0
Durdarsha PFM 0 5 0 0 0 0
Durbar PFM 0 5 0 0 0 0
Osman FFG 0 1 0 0 0 0
Bangabandhu FFG 0 1 0 0 0 0
Afghanistan Bangaladesh India Myanmar Pakistan Sri Lanka
Source: Based primarily on material in the IISS Military Balance 2005-2006, Routledge, 2005 plus data drawn from USPACOM sources and USexperts. Some data estimated or corrected by the author.

Cordesman & Kleiber: The Asian Conventional Military Balance 6/26/06 Page 114
2006 © All Rights Reserved to CSIS.
Figure 82: South Asian Submarines by Type: 2006(Number in active Service)
0
1
2
3
4
5
6
7
Collins SSK 6 0 0 0 0 0 0 0 0
Cakra SSK 0 0 2 0 0 0 0 0 0
Challenger SSK 0 0 0 0 0 0 0 4 0
Australia Cambodia Indonesia Laos MalaysiaNew
ZealandPhilippines Singapore Thailand
Source: Based primarily on material in the IISS Military Balance 2005-2006, Routledge, 2005 plus data drawn from USPACOM sources and USexperts. Some data estimated or corrected by the author.
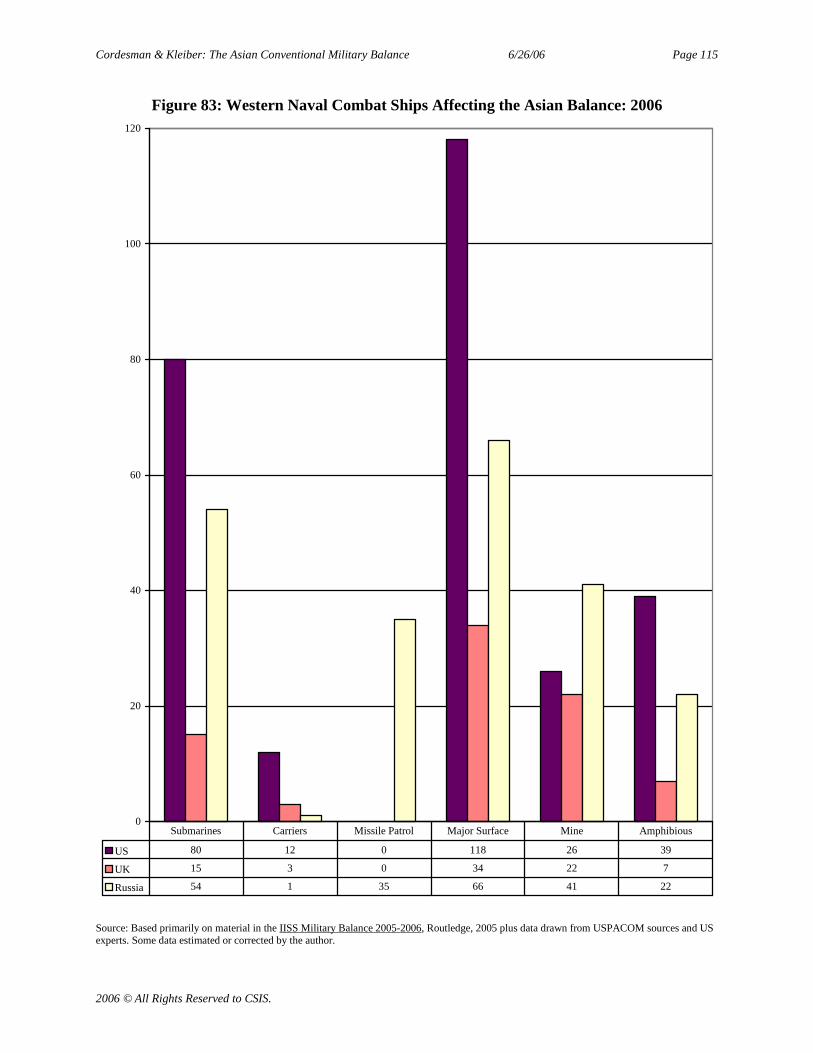
Cordesman & Kleiber: The Asian Conventional Military Balance 6/26/06 Page 115
2006 © All Rights Reserved to CSIS.
Figure 83: Western Naval Combat Ships Affecting the Asian Balance: 2006
0
20
40
60
80
100
120
US 80 12 0 118 26 39
UK 15 3 0 34 22 7
Russia 54 1 35 66 41 22
Submarines Carriers Missile Patrol Major Surface Mine Amphibious
Source: Based primarily on material in the IISS Military Balance 2005-2006, Routledge, 2005 plus data drawn from USPACOM sources and USexperts. Some data estimated or corrected by the author.
Cordesman & Kleiber: The Asian Conventional Military Balance 6/26/06 Page 116
2006 © All Rights Reserved to CSIS.
1 See Col. Ernie Howard, “The Strategic Logic of Suicide Terror,” Air University Warfare Studies Institute, April2004.
Related Documents


