Top Banner
Q3/2015 THE APPSFLYER PERFORMANCE INDEX FOR eCommerce, Travel and Utility Apps
29

The AppsFlyer Performance Index for eCommerce, Travel and Utility Apps

Apr 15, 2017

Download

Mobile

DataLead
Welcome message from author
This document is posted to help you gain knowledge. Please leave a comment to let me know what you think about it! Share it to your friends and learn new things together.
Transcript
Page 1: The AppsFlyer Performance Index for eCommerce, Travel and Utility Apps

Q3/2015

THE APPSFLYER

PERFORMANCE INDEX FOR

eCommerce, Travel and Utility Apps

Page 2: The AppsFlyer Performance Index for eCommerce, Travel and Utility Apps
Page 3: The AppsFlyer Performance Index for eCommerce, Travel and Utility Apps

APPS

APPS

APPS PER DAY

APPS PER DEVICE

Page 4: The AppsFlyer Performance Index for eCommerce, Travel and Utility Apps
Page 5: The AppsFlyer Performance Index for eCommerce, Travel and Utility Apps

WHAT IS POSSIBLE

LTV

UPLIFT

IMPROVED

RETENTIONDATA

ANALYSIS

Page 6: The AppsFlyer Performance Index for eCommerce, Travel and Utility Apps
Page 7: The AppsFlyer Performance Index for eCommerce, Travel and Utility Apps
Page 8: The AppsFlyer Performance Index for eCommerce, Travel and Utility Apps
Page 9: The AppsFlyer Performance Index for eCommerce, Travel and Utility Apps

Key Takeaways• Twitter stands out with a

25% higher retention than

2nd place

• Google proves user intent is

a great indication of loyalty

• Cheetah mobile’s

investment in quality user

acquisition pays off

Page 10: The AppsFlyer Performance Index for eCommerce, Travel and Utility Apps
Page 11: The AppsFlyer Performance Index for eCommerce, Travel and Utility Apps

• Facebook’s unrivaled reach and strong retention

puts the social network well ahead of the crowd

• Twitter scale on Android not as high as its top

retention position – landing it in 8th spot

• China grown networks (Mobvita, Cheeah Mobile,

AppFlood, Yeah Mobi) emerging as dominant

forces across the globe with 4 out of top 6 slots

• India’s mobile growth is evident with four

networks (Komli, Tyroo, affle, InMobi)

entering the top 25

Page 12: The AppsFlyer Performance Index for eCommerce, Travel and Utility Apps

Key Takeaways• Intent in iOS searches shows its value as Google AdWords tops chart

• Social networks show very high value

• Twitter proves its cross-platform value
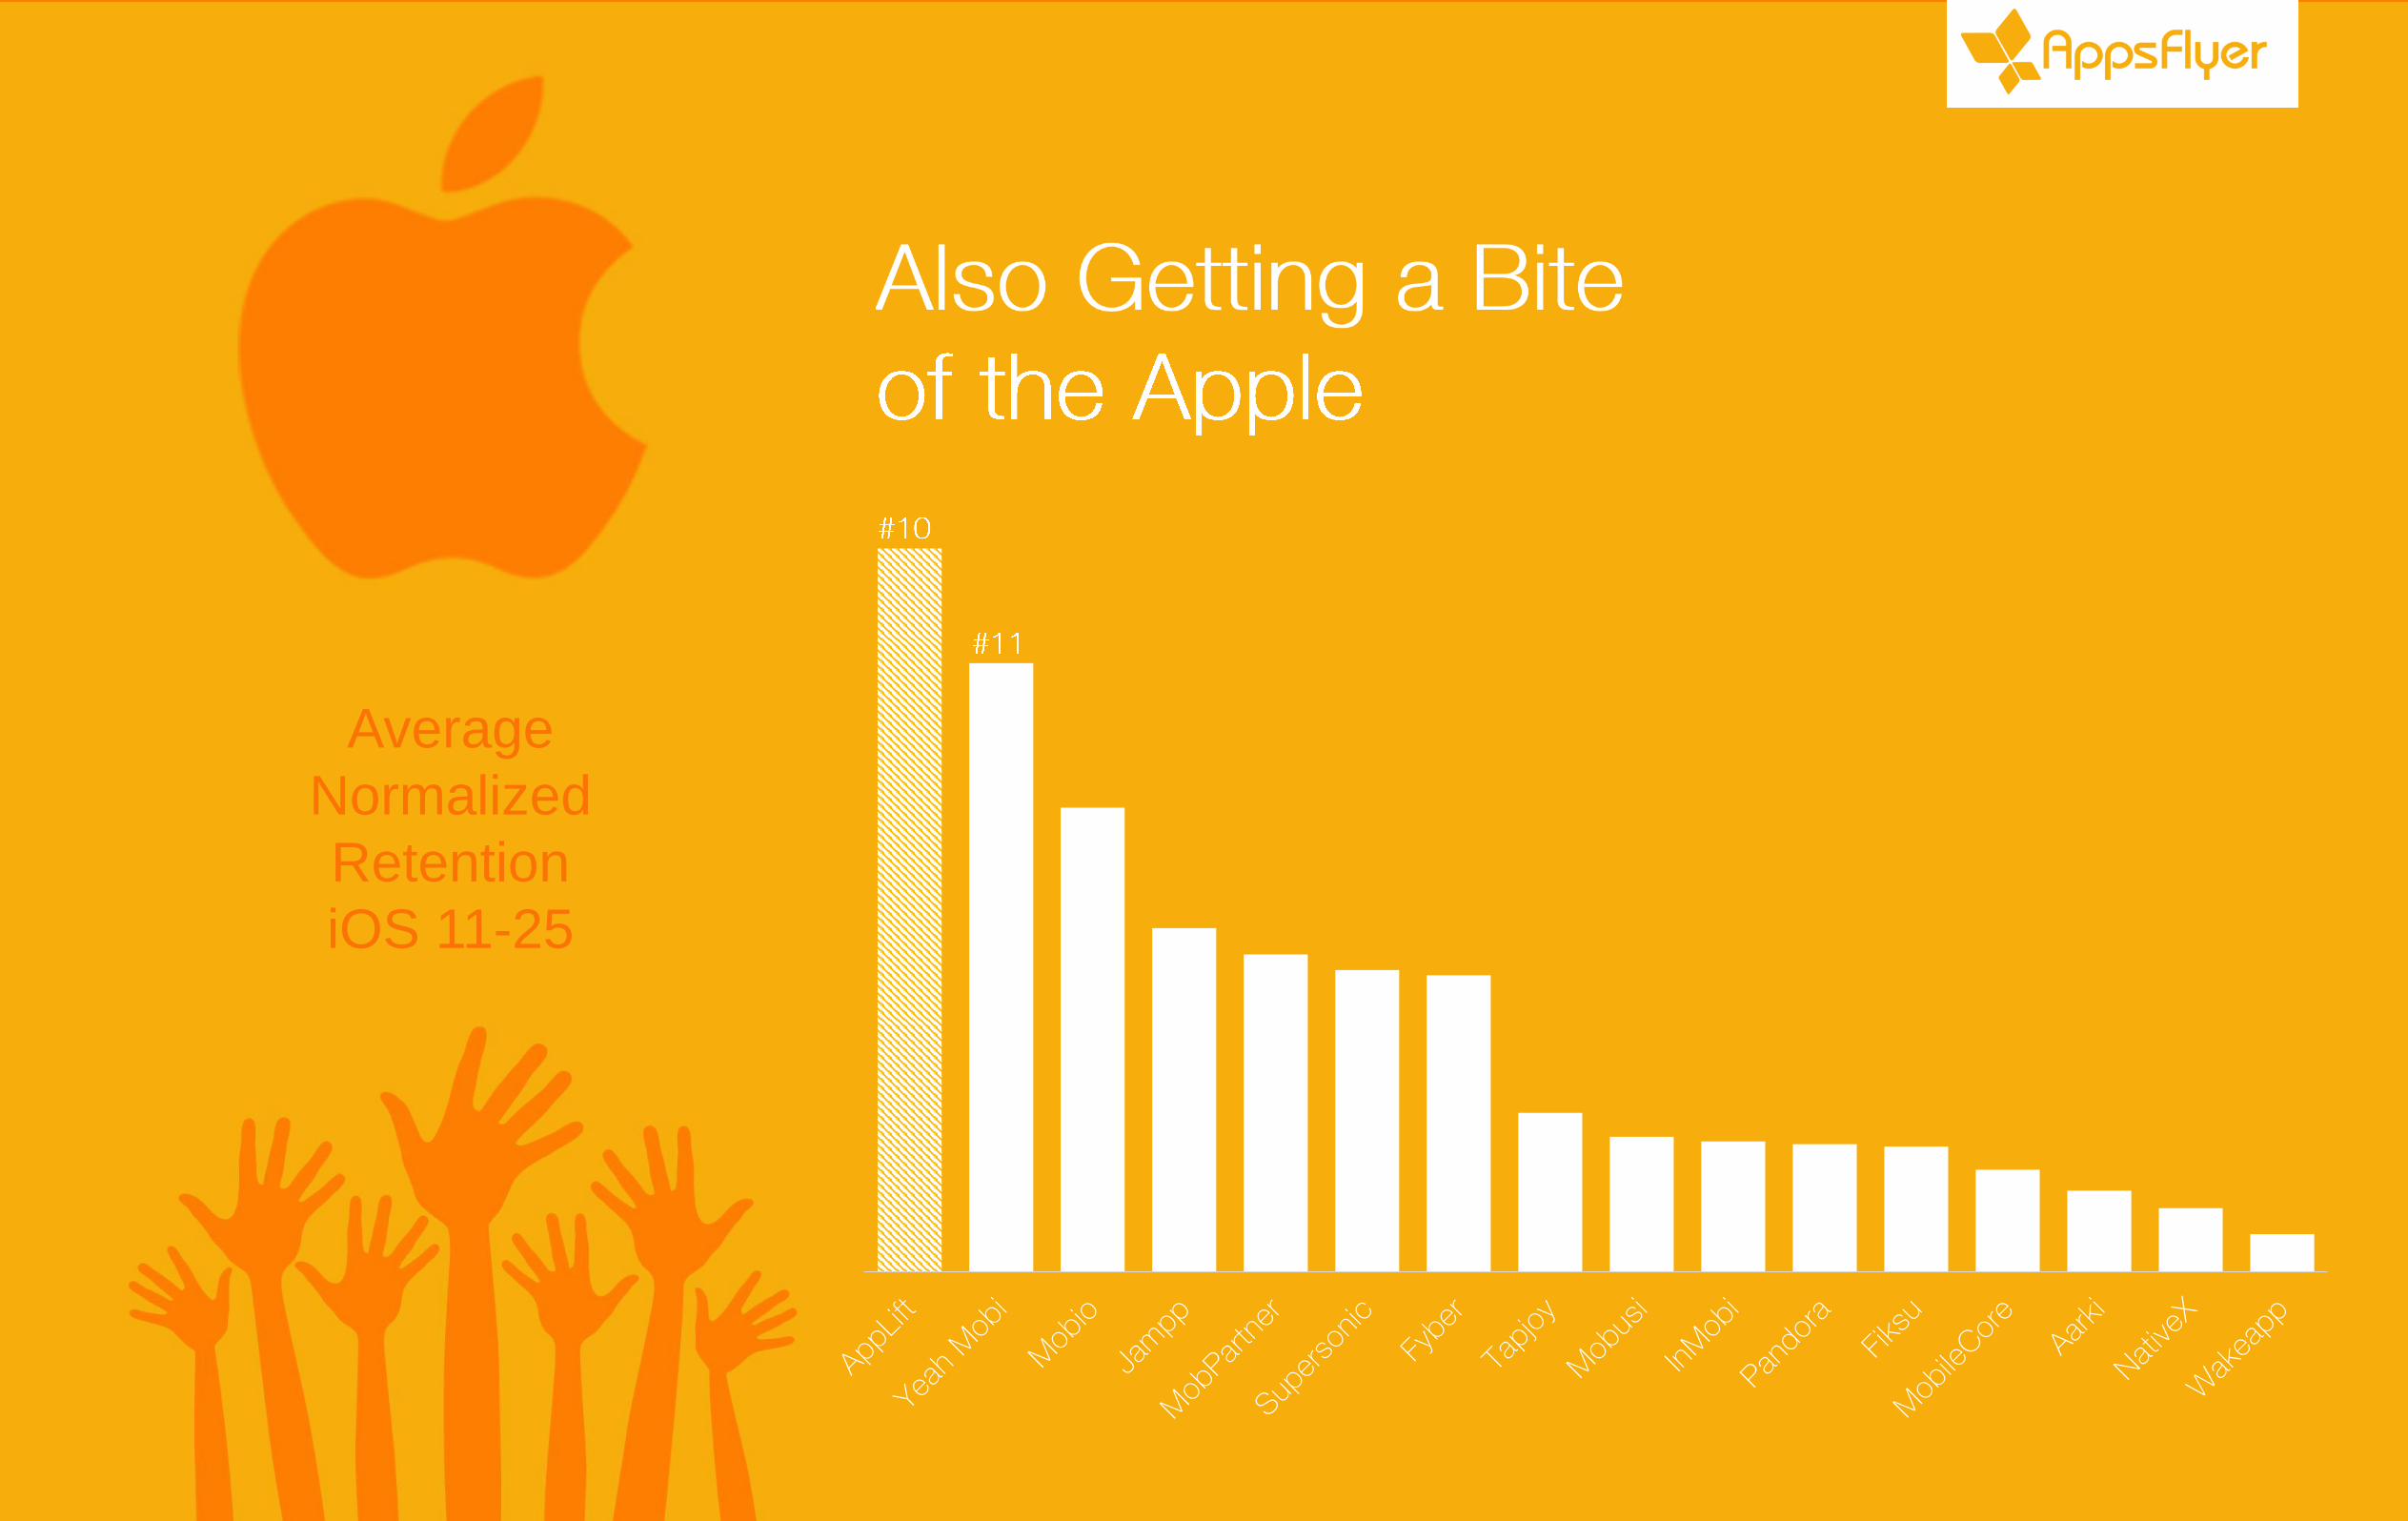
Page 13: The AppsFlyer Performance Index for eCommerce, Travel and Utility Apps

Average

Normalized

Retention

iOS 11-25

Page 14: The AppsFlyer Performance Index for eCommerce, Travel and Utility Apps

• On iOS just as on Android: Facebook’s

unrivaled reach and strong retention puts

social network well ahead of the crowd

• Great reach and great retention

put Twitter in 2nd spot• AppLovin proves focus on

data bears fruit

Page 15: The AppsFlyer Performance Index for eCommerce, Travel and Utility Apps

Day 1 Day 7 Day 30

Organic Paid Organic Paid

Page 16: The AppsFlyer Performance Index for eCommerce, Travel and Utility Apps

Day 1 Day 7 Day 30

Organic Paid Organic Paid

Page 17: The AppsFlyer Performance Index for eCommerce, Travel and Utility Apps

29.06%

10.99%

3.29%

25.53%

10.21%

3.17%

Day 1 Day 7 Day 30Android Apple

Page 18: The AppsFlyer Performance Index for eCommerce, Travel and Utility Apps
Page 19: The AppsFlyer Performance Index for eCommerce, Travel and Utility Apps

ZTE Sony HTC Motorola LG Samsung Asus Lenovo Huawei Xiaomi

Average Normalized Retention by Brand – Top 10 Smartphone Makers

Page 20: The AppsFlyer Performance Index for eCommerce, Travel and Utility Apps
Page 21: The AppsFlyer Performance Index for eCommerce, Travel and Utility Apps
Page 22: The AppsFlyer Performance Index for eCommerce, Travel and Utility Apps
Page 23: The AppsFlyer Performance Index for eCommerce, Travel and Utility Apps

UK Spain Mexico Malaysia US Thailand Russia Brazil Indonesia Vietnam

Page 24: The AppsFlyer Performance Index for eCommerce, Travel and Utility Apps
Page 25: The AppsFlyer Performance Index for eCommerce, Travel and Utility Apps

Average Normalized Retention by OS Version – Android Top 10

Page 26: The AppsFlyer Performance Index for eCommerce, Travel and Utility Apps

. . . . . . . . . .

Page 27: The AppsFlyer Performance Index for eCommerce, Travel and Utility Apps

Average Normalized Retention OS Version - iOS

Page 28: The AppsFlyer Performance Index for eCommerce, Travel and Utility Apps
Page 29: The AppsFlyer Performance Index for eCommerce, Travel and Utility Apps

Thanks!www.appsflyer.com