THE APPLICATION OF PORTER’S GENERIC BUSINESS STRATEGIES AND PERFORMANCE OF PHARMACEUTICAL WHOLESALERS IN KENYA BY PAULINE OLWANDE A Management Research Project Submitted in Partial Fulfillment of the Requirements for the Degree of Master of Business Administration, School of Business, University of Nairobi 2012

Welcome message from author
This document is posted to help you gain knowledge. Please leave a comment to let me know what you think about it! Share it to your friends and learn new things together.
Transcript
THE APPLICATION OF PORTER’S GENERIC BUSINESS STRATEGIES
AND PERFORMANCE OF PHARMACEUTICAL WHOLESALERS IN
KENYA
BY
PAULINE OLWANDE
A Management Research Project Submitted in Partial Fulfillment of the
Requirements for the Degree of Master of Business Administration,
School of Business, University of Nairobi
2012
i
DECLARATION
I hereby declare that this management research project is my original work. It has not been
presented by any other person from the University or any other institution.
Signature: ___________________ Date: _______________________
Pauline Olwande
Reg. No. D61/P/7629/02
This project has been submitted for examination with my approval as University supervisor
Signature: ____________________ Date: _______________________
Professor Francis N. Kibera
Supervisor

ii
ACKNOWLEDGEMENT I have taken efforts in this project. However, it would not have been possible without the kind
support and help of many individuals and organizations. I would like to extend my sincere thanks
to all of them.
I am highly indebted to Prof Francis Kibera for his guidance and constant supervision as well as
for providing necessary information regarding the project & also for his support in completing
the project.
I would like to express my gratitude towards my parents & family for their kind co-operation and
encouragement which helped me in completion of this project.
I would like to express my special gratitude and thanks to industry persons for giving me such
attention and time.
My thanks and appreciations also go to my colleagues in supporting this project and people who
have willingly helped me out with their abilities.
iii
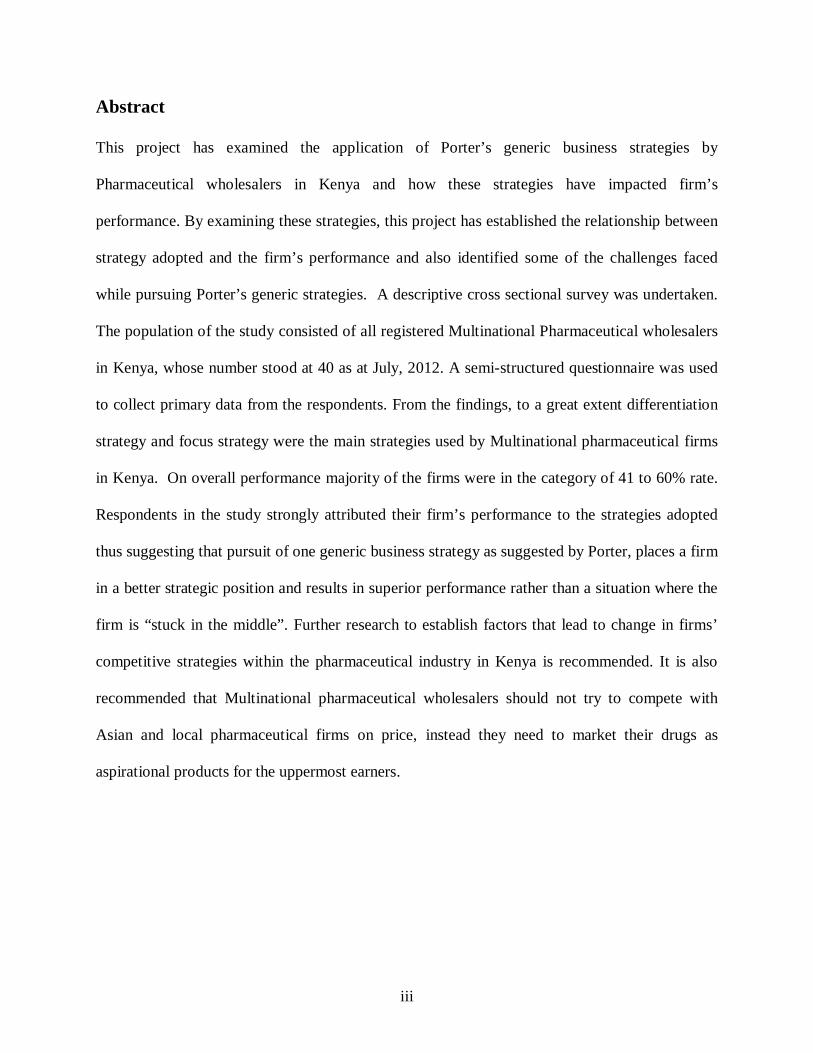
Abstract
This project has examined the application of Porter’s generic business strategies by
Pharmaceutical wholesalers in Kenya and how these strategies have impacted firm’s
performance. By examining these strategies, this project has established the relationship between
strategy adopted and the firm’s performance and also identified some of the challenges faced
while pursuing Porter’s generic strategies. A descriptive cross sectional survey was undertaken.
The population of the study consisted of all registered Multinational Pharmaceutical wholesalers
in Kenya, whose number stood at 40 as at July, 2012. A semi-structured questionnaire was used
to collect primary data from the respondents. From the findings, to a great extent differentiation
strategy and focus strategy were the main strategies used by Multinational pharmaceutical firms
in Kenya. On overall performance majority of the firms were in the category of 41 to 60% rate.
Respondents in the study strongly attributed their firm’s performance to the strategies adopted
thus suggesting that pursuit of one generic business strategy as suggested by Porter, places a firm
in a better strategic position and results in superior performance rather than a situation where the
firm is “stuck in the middle”. Further research to establish factors that lead to change in firms’
competitive strategies within the pharmaceutical industry in Kenya is recommended. It is also
recommended that Multinational pharmaceutical wholesalers should not try to compete with
Asian and local pharmaceutical firms on price, instead they need to market their drugs as
aspirational products for the uppermost earners.
iv
TABLE OF CONTENTS
ABBREVIATIONS AND ACRONYMS……………………………………….. vii
CHAPTER ONE: INTRODUCTION…………………...………...…………. 1
1.1 Background of the Study…………………………………………. 1
1.1.1 The concept of Porter's generic business strategies…………......
1.1.2 The concept of organization performance……………………….
2
3
1.1.3 The Pharmaceutical Industry in Kenya…………………………..
1.1.4 Pharmaceutical wholesalers in Kenya……………………………
4
9
1.2 Statement of the Problem …………………………………………. 10
1.3 Objectives of the Study …………………………………………… 13
1.4 Importance of the Study………………………………………...… 13
CHAPTER TWO: LITERATURE REVIEW…………..…………………….. 15
2.1 Introduction……………………………………………………... 15
2.2 Theoretical background…………………………………………... 15
2.3 Porter’s generic business strategies………………………………… 16
2.4 Organizational performance measures…………………………………… 22
2.5 Conceptual Framework…………………………………………………… 23
CHAPTER THREE: RESEARCH METHODOLOGY……………………… 25
3.1 Introduction……………………………………………………… 25
3.2 Research Design……………………………………………..…………… 25
3.3 Population of the study…………………………………………………… 25
3.4 Data Collection…………………………………………………... 26
3.5 Data analysis and presentation……………………………..……… CHAPTER FOUR: DATA ANALYSIS, FINDINGS AND DISCUSSION….
4.1 Introduction……………………………………………………………………
27
29
29
v
4.2 General information…………………………………………………………...
4.3 Competitive strategies used by pharmaceutical wholesalers in Kenya……….
4.4 Performance of pharmaceutical wholesalers in Kenya………………………..
4.5 Regression and correlation analysis…………………………………………...
CHAPTER FIVE: SUMMARY, CONCLUSION AND
RECOMMENDATIONS………………………………………………………...
5.1 Summary………………………………………………………………………
5.2 Conclusion…………………………………………………………………….
5.3 Recommendations……………………………………………………………..
29
36
37
38
41
41
43
44
REFERENCES………………………………….…………….………………… 46
APPENDIX I: QUESTIONNAIRE……………………..………………………..
List of Tables
4.2.1 Ownership structure.......................................................................................
4.2.2 Length of operation in Kenya (Years)............................................................
4.2.3 Distribution of respondents by age.................................................................
4.2.4 Distribution of respondents by level of education..........................................
4.2.5 Length of service with organisation................................................................
4.3.1 Extent to which various strategic practices are used......................................
4.4.1 Performance of Pharmaceutical wholesalers in Kenya...................................
4.5.1 Pearson correlation..........................................................................................
4.5.2 Model summary..............................................................................................
4.5.3 Coefficients of regression equation................................................................
List of Figures
2.1 Porters’ generic strategies..................................................................................
2.2 Conceptual framework.......................................................................................
4.1 Response rate.....................................................................................................
4.2 Number of employees in the organisation.........................................................
4.3 Number of branches...........................................................................................
54
30
30
32
33
34
36
37
38
39
40
21
24
29
31
32
vi
4.4 Gender composition...........................................................................................
4.5 Position held in the organisation........................................................................
4.6 Number of years in the current position in the organisation..............................
33
35
35

vii
ABBREVIATIONS AND ACRONYMS
ARIPO African Regional Industrial Property Organization
ARV Anti-Retroviral
BMI Business Monitor International
CAGR Compound Annual Growth Rate
COMESA Common Market for Eastern and Southern Africa
EAC East African Community
FBO Faith Based Organizations
GDP Gross Domestic Product
GoK Government of Kenya
IO Industrial Organization
KEBS Kenya Bureau of Standards
KEMSA Kenya Medical Supplies Agency
MEDS Mission for Essential Drugs Supplies
MoH Ministry of Health
MoMs Ministry of Medical services
MoPHS Ministry of Public Health and Sanitation
NHIF National Health Insurance Fund
OTC Over the Counter
SPSS Statistical Package for Social Sciences
TB Tuberculosis
USA United States of America
WHO World Health Organization
1
CHAPTER ONE: INTRODUCTION
1.1 Background of the Study
The challenges of the business environment in the 1990s, characterized by fragmented
markets, increased competition, rapid technological changes, shifting regulatory
frameworks, and a growing dependence on non-price competition, forced many
businesses to more closely scrutinize their competitive strategy. Porter (1985) argues that
firms create competitive advantage by conceiving new ways to deliver superior value to
customers. Innovation is a key source of competitive advantage and can occur at any
stage of the value chain. However, the literature in this regard is biased towards
technological innovation.
A growing number of researchers suggest that definitions of innovation should
incorporate a broader range of activities (Porter, 1987). The increased competition has
been further fuelled by the developments in technology, communication and liberalisation
of the major world economies. These factors have reduced the world into a global village
as far as business transactions are concerned. As a result, organisations are facing stiff
competition from both local and foreign competitors. Organisations are therefore
implementing various competitive strategies with the aim of achieving a sustainable
competitive advantage over their competitors and to ensure their survival.
2
1.1.1 The concept of Porter's Generic Business Strategies
Strategy is an essential part of any effective business plan. By using an effective
competitive strategy, a company defines its industry niche and learns about its customers
(Porter, 1980). Porter (1985) asserts that there are three basic business strategies
(differentiation, cost leadership, and focus) and a company performs best by choosing
one strategy on which to concentrate. However, many researchers feel a combination of
these strategies may offer a company the best chance to achieve a competitive advantage
(White, 1986; Fuerer and Chaharbaghi, 1997; Cross, 1999; Hlavacka et al., 2001).
Whatever strategy a business chooses, it must fit with the company and its goals and
objectives in order to gain a competitive advantage (Parker and Helms, 1992;
Kippenberger, 1996; Surowiecki, 1999; Ross, 1999).
Porter (1987) asserts that companies must be competitive to become an industry leader
(Murdoch, 1999; Suutari, 1999), to be successful both nationally and abroad (Anon,
1998; Niemira, 2000; Davidson, 2001). These strategies for gaining competitive
advantage apply to all industries in most nations (McNamee and McHugh, 1989; Green et
al., 1993; Median and Chin, 1995).
While various types of organizational strategies have been identified over the years,
Porter's generic strategies remain the most commonly supported and identified in key
strategic management textbooks (Thompson and Stickland, 1998; David, 2000 ;) and in
other literature (Kim and Lim, 1988; Miller and Dess, 1993). Porter (1980) suggests that
for long-term profitability, the firm must make a choice among the generic strategies
rather than end up being “stuck in the middle”. A firm’s ability to survive in an industry
3
is largely influenced by the competitive strategies it adopts. The Kenyan Pharmaceutical
Industry, which is no exception to the rest of the dynamic and competitive business
environment, forms a good context for a study on the application of Porter’s generic
business strategies.
1.1.2 The concept of organization performance
Lusch and Laczniak (1989) define business performance as the total economic results of
the activities undertaken by an organization. Walker and Ruekert (1987) found primary
dimensions of business performance could be grouped into the three categories of
effectiveness, efficiency, and adaptability. But there is little agreement as to which
measure is best. Thus, any comparison of business performance with only these three
dimensions involve substantial trade-offs because good performance on one dimension
often means sacrificing performance on another (Donaldson, 1984).
In many research situations it is impractical or impossible to access objective measures of
organizational performance. Even if such measures were available it would not guarantee
the accuracy of the performance measurements. For example, when a sample contains a
variety of industries, performance measurements and comparisons can be particularly
problematic. What is considered excellent performance in one industry may be
considered poor performance in another industry. If researchers limit themselves to a
single industry, the performance measures may be more meaningful, but the
generalizability of the findings to other industries is problematic.
4
The literature has remained largely at the conceptual level in discussing the link between
the generic strategies and firm performance. Scholars agree it should and must exist, but
researchers have not determined which specific strategic practices within the generic
strategy framework best achieve organizational performance goals. It seems some
combination of practices is more effective than others, but propositions on strategic
practices have remained largely untested and there is a recognized need for empirical
work in this area.
1.1.3 The Pharmaceutical Industry in Kenya
The pharmaceutical industry in Kenya is growing and within the next 20 years it is
expected that the research and development of drugs, devices and vaccines needed for
Kenya and the other East African countries (Burundi, Rwanda, Uganda, and Tanzania)
will be done in East Africa. (Dodgson, 2008).
“In general, the Ministry of Medical Services (MoMs) and the Ministry of Public Health
and Sanitation (MoPHS) (formerly one single Ministry of Health) run programmes for
diseases with a heavy impact on public health, including the promotion of good health
lifestyles, prevention, and treatment or curative measures” (Shahid & Wanyanga, 2010, p.
27). The Division of Malaria Control under MoPHS is responsible for the control and
management of malaria. The estimated budget in the year 2009-2010 for public
procurement of anti-malarial medicines was KSh 1,436,688,247 (US$ 19.3 million),
which amounts to US$ 1.17 (KSh 87.85) per treatment.
5
The funding requirements for 2009 for Tuberculosis (TB) control in Kenya, as assessed
by the Global Plan for World health organisation’s (WHO) Stop TB Partnership, totalled
US$ 37 million. Of this, only some 60 per cent or US$ 22.2 million was raised, with the
government contributing about one third of this money. There has been a massive scale-
up of treatment and care for HIV/AIDS in the last few years. The financial requirement
for HIV/AIDS control has been rising steadily, with a total projected requirement for the
four years from 2009 to 2013 of KSh 266.7 billion (US$ 3,556 million). Treatment and
care takes the largest portion (57.9 per cent) of the total cost estimate, with ART
accounting for 38.3 per cent (Shahid &Wanyanga, 2010).
In 2005, legislation for a National Social Health Insurance was passed. This envisioned
universal compulsory health coverage for all Kenyans, with free coverage for the most
vulnerable sections of the population. The objective is to cover 60 per cent of the
population by 2015, while offering increasing inpatient and outpatient services.
Meanwhile, new, more affordable, private health insurance packages are also being
launched, some through public-private partnerships involving donor assistance. As
insurance coverage expands, the demand for medicines is naturally expected to rise
although the impact is difficult to quantify at this stage.
In 2010, some 1.6 million Kenyans (9.5 million, when dependants are included) were
covered by the National Health Insurance Fund (NHIF), which covers only in-patient
care, while the costs of diagnosis, treatment, and medicines are expected to be borne
directly by the individuals concerned (Shahid & Wanyanga, 2010). Currently, medical
6
care is a requirement among employers; the law requires that every employer ensures
provision of proper medicine and attendance to employees, unless otherwise provided for
by the government.
Kenya’s exports of pharmaceuticals expanded by 96 per cent between 2004 and 2008,
rising from US$ 30.3 million to US$ 59.4 million, in spite of the economic slowdown in
2008. This represents a Compound Annual Growth Rate (CAGR) of 18.3 per cent over
the period. About half of Kenya’s exports of pharmaceutical products are to the United
Republic of Tanzania and Uganda. Demand has been expanding in these two countries
but they buy in relatively small volumes. China and Indian suppliers represent the main
competition in generic medicines. Neighbouring (southern) Sudan is emerging as another
important market and there may be considerable scope in future for sales to Somalia
(Shahid & Wanyanga, 2010).
Shahid and Wanyanga (2010) point out that “An estimate of the Kenyan pharmaceutical
market by Business Monitor International (BMI) shows that expenditure on prescription
medicines in 2008 was KSh 10.9 billion (US$ 158 million) and that this constituted 68.7
per cent of the total market. The market share of prescription drugs could rise in future if
strict controls are introduced on the sale of drugs since many people currently buy such
medicines without a prescription. Using the BMI definition, prescription medicines
include generics, branded generics, and original brands. Self-medication is prevalent in
Kenya and the Over the Counter (OTC) market is therefore very important. However,
while sales volumes are large, OTC medicines are usually low-priced and competition is
high. The OTC market component was estimated at KSh 4.96 billion (US$ 72 million)
7
and, combining prescription medicines and OTC products, BMI estimates the total
domestic market to have reached US$ 230 million in 2008” (p.36).
For purposes of comparison, another market study by Frost & Sullivan (F & S) in
December 2008 valued the Kenyan market for pharmaceuticals at $208.6 million in 2007
and expected it to reach $558.5 million by 2014, growing at a CAGR of 15.1 per cent.
The generic pharmaceuticals market is expected to grow more rapidly than the market for
branded pharmaceuticals, a trend that is expected to be driven largely by increased
government purchases of generics and the price-sensitive nature of the overall market.
The Frost & Sullivan report said that locally manufactured pharmaceutical products
commanded 28 per cent of the overall pharmaceutical market in 2007. F & S also forecast
per capita expenditure on medicines at US$ 5.9 in 2009, increasing to US$14.1 by 2014.
Of the total market in 2008, F & S estimated that generics would have accounted for 58.7
per cent of the total, while original branded pharmaceuticals would have accounted for
the balance of 41.3 per cent (Shahid & Wanyanga, 2010).
The patent protection of pharmaceuticals in Kenya is based on the African Regional
Industrial Property Organization (ARIPO) patent system. Kenya’s patent laws have been
revised from the traditional British based format to the ARIPO system, which was created
by the Lusaka agreement in 1976. ARIPO is based in Harare, Zimbabwe. The
organization was mainly established to pool the resources of its member countries in
industrial property matters together in order to avoid duplication of financial and human
resources. Additionally, the Kenyan government passed the Kenya Industrial Property
8
Bill in 2001. This bill allows Kenya to import and produce more affordable medicines for
HIV/AIDS and other diseases (Kenya’s pharmaceutical industry, 2005).
The Government of Kenya (GoK) procures medicines through its national procurement
agency, the Kenya Medical Supplies Agency (KEMSA). The Agency receives funding
from the GoK and development partners for procurement of medical supplies for Rural
Health Facilities (4,000 dispensaries and 511 health centres, which are operated by both
the GoK and Faith-Based Organizations (FBOs)). It has been estimated that KEMSA’s
purchases constitute 30 per cent of all prescription drugs in the domestic market. KEMSA
competes with other suppliers, such as the Mission for Essential Drugs Supplies (MEDS)
and private wholesalers.
The country continues to have remarkable expansion in the number of health facilities in
all provinces. This is in line with the GoK’s effort to avail accessible health facilities and
services to all Kenyans. The WHO estimates the global market for herbal medicines to
currently stand at over US$60 billion annually and is growing steadily. Kenya
emphasizes continuous training of more medical personnel to compliment the growth in
the health sector.
The profession of pharmacy and the trade in pharmaceutical products is administered by
MoMs, through the Pharmacy and Poisons Board, as provided for by Chapter 244 (The
Pharmacy and Poisons Act) and Chapter 245 (The Dangerous Drugs Act) of the Laws of
Kenya.
9
1.1.4 Pharmaceutical wholesalers in Kenya
The pharmaceutical industry in Kenya consists of three segments namely the
manufacturers, distributors and retailers. These sectors play a major role in supporting the
country’s health sector, which is estimated to have about 5000 health facilities
countrywide. Kenya is one of the main producers of pharmaceutical products in the
Common Market for Eastern and Southern Africa (COMESA) region, supplying about
50% of the regions’ market. Out of the region’s estimate of 50 recognized pharmaceutical
manufacturers; 30 are based in Kenya. It is approximated that about 12,000
pharmaceutical products have been registered for sale in Kenya. These are categorized
according to particular levels of outlet as free sales/ Over the Counter (OTC), pharmacy
technologist dispensable or pharmacist dispensable/ prescription only.
The pharmaceutical Manufacturing sector consists of local manufacturing companies and
large Multinational Corporations (MNCs), subsidiaries or joint ventures. Most
multinational firms are located within Nairobi and its environs. These firms collectively
employ over 2,000 people, about 65% of who work in direct production. The industry
compounds and packages medicines, repacking formulated drugs, and processing bulk
drugs into doses using predominantly imported active ingredients and excipients. The
bulk of locally manufactured preparations are non-sterile, over-the-counter (OTC)
products. The number of companies engaged in manufacturing and distribution of
pharmaceutical products in Kenya continue to expand, driven by the Government’s
efforts to promote local and foreign investment in the sector.
10
The Country largely imports medicinal and pharmaceutical products from sources such as
Britain, India, Germany, France, the USA and Switzerland. Importers are expected to
meet legal requirements, which include providing samples to the Kenya Bureau of
Standards (KEBS) for quality checks and registration and meeting of the regulations of
the national policy, which has been adopted by MoMs. This includes an essential drugs
list, using WHO guidelines, whose objective is to promote the availability of quality
pharmaceutical products at affordable prices; and pass regulatory quality control,
monitoring and market surveillance as stipulated by the Pharmacy and Poisons Board and
the National Drug Quality Control.
Pharmaceutical products in Kenya are channeled through pharmacies, chemists, health
facilities and traditional outlets. There are about 700 registered wholesale and 1,300 retail
dealers in Kenya which are manned by registered pharmacists and pharmaceutical
technologists. The drugs in Kenya are sold according to the outlet categorization, which
can be described as free-sales/OTC, pharmacy technologist dispensable, or pharmacist
dispensable/prescription only (Kenya’s pharmaceutical industry, 2005).
1.2 Statement of the Problem
The primary objective of managers of profit seeking organizations is to maximize the
performance of the firm over time. Porter (1980, 1985) argues that superior performance
can be achieved in a competitive industry through the pursuit of a generic strategy, which
he defines as the development of overall cost leadership, differentiation, or focus
11
approach to industry competition. If a firm does not pursue one of these strategy types, it
will be stuck-in-the-middle and will experience lower performance when compared to
firms that pursue a generic strategy (Porter, 1980). The linkages between competitive
methods; cost leadership, differentiation and focused generic strategies, and resulting
firm performance have been explored in the literature (Hambrick, 1983; Dess and Davis,
1984; Kumar et al., 1997). However, the results have not conclusively established that
performance is enhanced by following one of these generic strategy types.
Studies related to competitive strategies in Kenya include those of Kibiru (1999) who
studied the achievement of competitive advantage through differentiation of market
offering by chemical fertilizers importing companies in Kenya; Murage (2001)
investigated the competitive strategies adopted by members of the Kenya Independent
Petroleum Dealers Association; Karanja (2002) studied the competitive strategies of real
estate firms in Kenya; and Ndubai (2003) investigated the competitive strategies applied
by retail sector of the pharmaceutical industry in Nairobi. The findings show that the
pharmaceutical industry adopted a stay-on-the-offensive strategy, fortify-and-defend
strategy and muscle-flexing strategy. In addition, the industry adopted a restructure the
company’s business lineup, divest some businesses and retrench to a narrower
diversification base, and broaden the diversification base. The study by Ndubai (2003)
did not focus on Porter’s generic strategies.
There are several studies which have investigated the subject of competitive advantage in
other product – market contexts. For instance, in the manufacturing sector Theuri (2003)
studied the competitive strategies adopted by branded fast food chain in Nairobi; Obado
12
(2005) studied the competitive strategies employed by the sugar manufacturing firms in
Kenya; and Mungai (2006) investigated competitive strategies adopted by mainstream
daily print media firms in Kenya.
In the services sector, Namada (2004) investigated the competitive strategies adopted by
small scale enterprises in exhibition halls in Nairobi; Ogolla (2005) researched the
application of porter’s strategies by insurance companies in Kenya; Kitoto (2005)
examined the competitive strategies adopted by universities in Kenya. Other researchers
such as Okal (2006) studied competitive strategies adopted by NGOs dealing with
HIV/AIDS in Kenya to cope with increased competition for funding; Mwakundia (2006)
investigated competitive strategies applied by commercial colleges in Nairobi CBD; and
Njoroge (2006) researched competitive strategies adopted by LPG marketers in Kenya to
cope with competition.
None of the above studies focused on the application of Porter’s generic competitive
strategies by pharmaceutical wholesalers in Kenya. The current study therefore set out to
address this knowledge gap. The study addressed the following research questions: (i) to
what extent have pharmaceutical wholesalers in Kenya adopted Porter’s generic business
strategies; (ii) What is the relationship between Porter’s generic business strategies and
key performance indicators (KPIs) such as market share, profitability and business
growth?; and (iii) What are the challenges faced by the Pharmaceutical wholesalers in
Kenya in implementing Porter’s generic business strategies and what are the suggested
solutions?
13
1.3 Objectives of the Study
1.3.1 General Objective
The broad objective of the study was to examine the application of Porter’s generic
strategies by Pharmaceutical wholesalers in Kenya.
1.3.2 Specific Objectives
The specific objectives of the study were to:
(i) establish the extent to which Pharmaceutical wholesalers in Kenya have
adopted Porter’s generic business strategies ;
(ii) assess the relationship between Porter’s generic business strategies and key
performance indicators (KPIs) such as market share, profitability and business
growth; and
(iii) Identify the challenges faced by the Pharmaceutical wholesalers in Kenya in
implementing Porter’s generic business strategies.
1.4 Importance of the Study
It was hoped that the research findings of the study would be beneficial to various key
stakeholders, including the following:
14
The management of pharmaceutical companies
The management of the various manufacturing companies, pharmaceutical wholesalers
and retail outlets would gain a better understanding and value of Porter’s generic
strategies , the relationship between the strategies adopted and firm performance and the
challenges faced when implementing the strategies. On the basis of the findings of the
study, the management of these companies would be expected to implement corporate
strategies from an informed position for the benefit of key stakeholders.
Policy Makers
The pharmaceutical industry policy makers, who include MoMs and the Pharmacy and
Poisons Board would acquire insight into the involvement of the stakeholders in the
pharmaceutical industry in the generic strategies and accommodate the strategies in the
policies to be formulated.
Academicians and scholars
The relationship between the generic strategies and organizational performance is a
relatively new concept. The academic world would consider the enormous potential of
this strategic interface. The study was expected to make a significant contribution to the
growing body of knowledge based research in the generic strategies. It was anticipated
that the findings will be used as a source of reference by other researchers.

15
CHAPTER TWO: LITERATURE REVIEW
2.1 Introduction
This chapter presents a review of the literature related to the purpose of the study. The
chapter was organized according to the specific objectives in order to ensure relevance to
the research problem. The review was undertaken in order to eliminate duplication of
what has been done and provide a clear understanding of existing knowledge base in the
problem area. The literature review was based on authoritative, recent, and original
sources such as journals, books, theses and dissertations.
2.2 Theoretical background
Strategic contingency theory has its roots in the structure-strategy-performance paradigm
associated with institutional economists (Bain, 1956) but focuses less on structure and
more on strategy. Its focus is on the “fit or match between strategy and environment”.
Many theorists have explored the relationship between environment and strategy, but
much of the early work was completed by Porter (1980, p. 3), who states that, “The
essence of formulating competitive strategy is relating a company to its environment.”
Porter (1980) introduced the three generic strategies of cost leadership, differentiation,
and focus. These strategies are a result of various environmental features but are rooted in
the firm’s decision to pursue a broad or narrow target market and a uniqueness or cost
competency. The three generic strategies have motivated much research (Murray, 1988;
Hill, 1988). Porter (1980, p. 41) states that, “the firm failing to develop its strategy in at
least one of the three directions (a firm that is “stuck in the middle”) is in an extremely
16
poor strategic situation.” This “stuck-in-the-middle” scenario is discussed by Porter
(1980) on a global level with the use of example firms that compete in multiple foreign
markets. Porter’s rigid view of the appropriateness of utilizing one generic strategy and
one only, regardless of environmental conditions, has been criticized (Wright, 1987; Hill,
1988). There is some empirical evidence that a hybrid or “middle” approach may be
usefully applied (Kim and Lim, 1988; Hlavacka et al., 2001). To quote Miller and Friesen
(1986, p. 730): “studies have found that strategies have varying utility in different
settings.” In contrast to this position, other scholars have supported Porter’s idea that
competing with an exclusive, single strategy is most effective. Overall, the literature is
generally supportive of Porter’s claim (Miller and Friesen, 1986; Green et al., 1993).
2.3 Porter’s generic business strategies
Porter argues that companies must be competitive in order to become an industry leader
(Murdoch, 1999; Suutari, 1999), to be successful both nationally and abroad (Niemira,
2000; Davidson, 2001), and these strategies for gaining competitive advantage apply to
all industries in most nations (Green et al., 1993; Median and Chin, 1995). While various
types of organizational strategies have been identified over the years, the generic
strategies remain the most commonly supported and identified in key strategic
management textbooks (David, 2000) and in the literature (Miller and Dess, 1993).
2.3.1 Differentiation
When using this strategy, a company focuses its efforts on providing a unique product or
service (Cross, 1999; Hlavacka et al., 2001). Since, the product or service is unique; this
17
strategy provides high customer loyalty (Cross, 1999; Hlavacka et al., 2001).
Differentiation strategy is effectively implemented when the business provides unique or
superior value to the customer through product quality, features, or after-sale support.
Firms following a differentiation strategy can charge a higher price for their products
based on the product characteristics, the delivery system, the quality of service, or the
distribution channels. The quality may be real or perceived based on fashion, brand name,
or image. The differentiation strategy appeals to a sophisticated or knowledgeable
consumer interested in a unique or quality product and willing to pay a higher price.
A key step in devising a differentiation strategy is to determine what makes a company
different from a competitor’s (Rajecki, 2002; Tuminello, 2002). Factors including market
sector quality of work, the size of the firm, the image, geographical reach, involvement in
client organizations, product, delivery system, and the marketing approach have been
suggested as firms differentiators (Davidson, 2001; McCracken, 2002). To be effective,
the message of differentiation must reach the clients (McCracken, 2002), as the
customer’s perceptions of the company are important (Berthoff, 2002; Troy, 2002). When
using differentiation, firms must be prepared to add a premium to the cost (Hyatt, 2001).
This is not to suggest costs and prices are not considered; only it is not the main focus
(Hlavacka et al., 2001). However, since customers perceive the product or service as
unique, they are loyal to the company and willing to pay the higher price for its products
(Cross, 1999; Hlavacka et al., 2001; Venu, 2001).
Some key concepts for establishing differentiation include speaking about the product to
select panels (McCracken, 2002), writing on key topics affecting the company in the
18
association’s magazine or newsletter (McCracken, 2002), becoming involved in the
community (McCracken, 2002), being creative when composing the company’s portfolio
(Tuminello, 2002), offering something the competitor does not or cannot offer (Rajecki,
2002), using company size as an advantage (Darrow et al., 2001), training employees
with in-depth product and service knowledge (Darrow et al., 2001), offering improved or
innovative products (Helms et al., 1997), emphasizing the company’s state-of-the-art
technology, quality service, and unique products/services (Hlavacka et al., 2001), using
photos and renderings in brochures (McCracken, 2002), and selecting products and
services for which there is a strong local need (Darrow et al., 2001).
2.3.2 Cost leadership
The second generic strategy is cost leadership (Malburg, 2000). This strategy focuses on
gaining competitive advantage by having the lowest cost in the industry (Cross, 1999;
Hyatt, 2001; Davidson, 2001). In order to achieve a low-cost advantage, an organization
must have a low-cost leadership strategy, low-cost manufacturing, and a workforce
committed to the low-cost strategy (Malburg, 2000). The organization must be willing to
discontinue any activities in which it does not have a cost advantage and should consider
outsourcing activities to other organizations with a cost advantage (Malburg, 2000). For
an effective cost leadership strategy, a firm must have a large market share (Hyatt, 2001).
Cost leadership can be achieved through mass production, mass distribution, economies
of scale, technology, product design, input cost, capacity utilization of resources, and
access to raw materials (Malburg, 2000; Venu, 2001; Davidson, 2001). According to
Porter (1985), only one firm in an industry can be the cost leader (Venu, 2001; Sy, 2002)
19
and if this is the only difference between a firm and competitors, the best strategic choice
is the low cost leadership role (Malburg, 2000).
Lower costs and cost advantages result from process innovations, learning curve benefits,
and economies of scale, product designs reducing manufacturing time and costs, and
reengineering activities. A low-cost or cost leadership strategy is effectively implemented
when the business designs, produces, and markets a comparable product more efficiently
than its competitors. The firm may have access to raw materials or superior proprietary
technology which helps to lower costs.
Firms do not have to sacrifice revenue to be the cost leader since high revenue is
achieved through obtaining a large market share (Porter, 1996). Lower prices lead to
higher demand and, therefore, to a larger market share (Helms et al., 1997). As a low cost
leader, an organization can present barriers against new market entrants who would need
large amounts of capital to enter the market (Hyatt, 2001). The leader then is somewhat
insulated from industry wide price reductions (Malburg, 2000; Hlavacka et al., 2001).
The cost leadership strategy does have disadvantages. It creates little customer loyalty
and if a firm lowers prices too much, it may lose revenues (Cross, 1999).
2.3.3 Focus
In the focus strategy, a firm targets a specific segment of the market (Porter, 1987, 1996;
Cross, 1999; Davidson, 2001; Hlavacka et al., 2001; Hyatt, 2001). The firm can choose to
focus on a select customer group, product range, geographical area, or service line (Hyatt,
2001; Venu, 2001; Darrow et al., 2001; McCracken, 2002). For example, some European
20
firms focus solely on the European market (Stone, 1995). Focus is also based on adopting
a narrow competitive scope within an industry. It aims at growing market share through
operating in a niche market or in markets either not attractive to, or overlooked by, larger
competitors. These niches arise from a number of factors including geography, buyer
characteristics, and product specifications or requirements. A successful focus strategy
(Porter, 1980) depends upon an industry segment large enough to have good growth
potential but not of key importance to other major competitors. Market penetration or
market development can be an important focus strategy. Medium sized and large firms
use focus-based strategies but only in conjunction with differentiation or cost leadership
generic strategies. But, focus strategies are most effective when consumers have distinct
preferences and when the niche has not been pursued by rival firms (David, 2000).
2.3.4 Combination of different strategies.
An organization may also choose a combination strategy by mixing the generic strategies.
For example, a firm may choose to have a focused differentiation strategy. This means
the organization has a unique product offered to a targeted market segment. An
organization may also choose to have a focused cost-leadership strategy. In this instance,
an organization would use a cost leadership strategy targeted to a specific market
segment. There is much debate as to whether or not a company can have a differentiation
and low-cost leadership strategy at the same time (Helms et al., 1997). Porter felt
differentiation and cost-leadership were mutually exclusive (Helms et al., 1997).
However, research shows this is not always the case (Gupta, 1995; Fuerer and
Chaharbaghi, 1997; Hlavacka et al., 2001). Kumar et al. (1997) in their study of generic
21
strategies found that when hospitals follow a focused cost leadership hybrid strategy they
exhibited higher performance than those following either cost leadership or
differentiation alone. Similarly in their research on the UK wine industry, Richardson and
Dennis (2003) found that the hybrid focused differentiation approach was best for niche
segments. Spanos et al. (2004) studied the Greek manufacturing industry and found that
hybrid strategies were preferable to pure strategies. According to Porter (Argyres and
McGaha, 2002), lower cost and differentiation are directly connected with profitability.
As research addressed the relationship between strategy and performance, some studies
concluded only “pure” strategies (generic strategies of cost leadership or differentiation)
resulted in superior performance, while other research studies found that combinations
strategies (low-cost and differentiation) were optimal. This debate continues in the
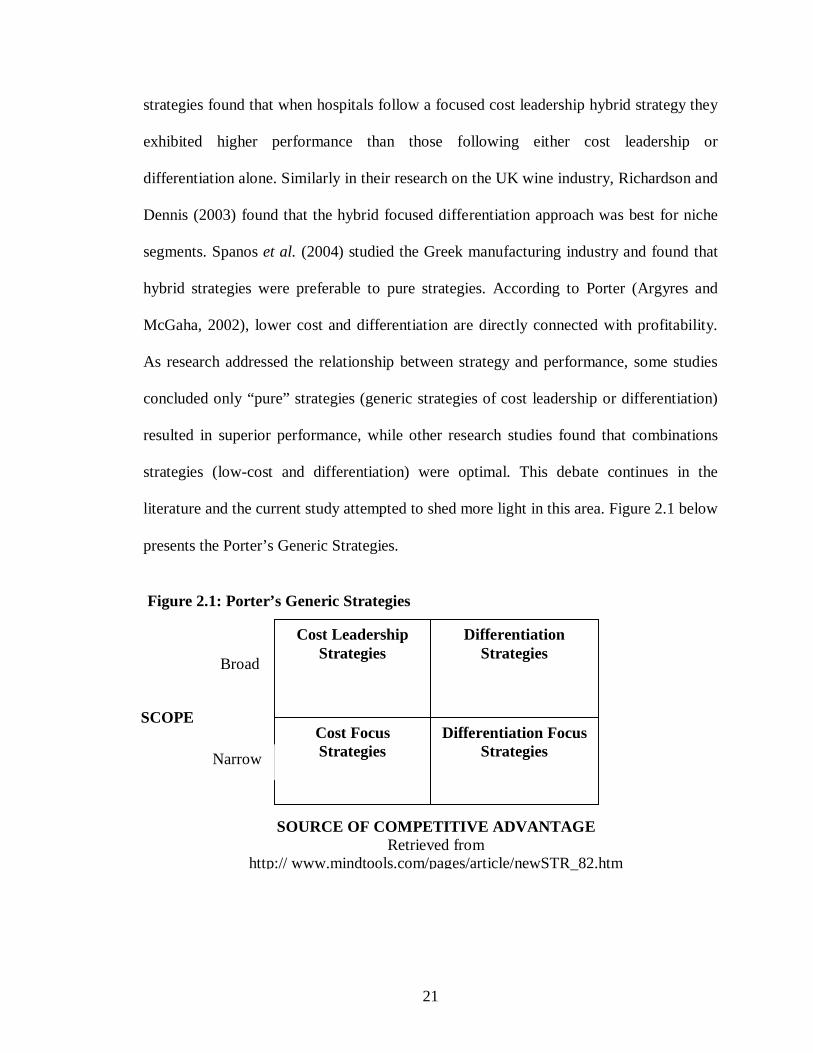
literature and the current study attempted to shed more light in this area. Figure 2.1 below
presents the Porter’s Generic Strategies.
Figure 2.1: Porter’s Generic Strategies
Generic strategy and performance linkage
Cost Leadership Strategies
Differentiation Strategies
Cost Focus Strategies
Differentiation Focus Strategies
SCOPE
Broad
Narrow
SOURCE OF COMPETITIVE ADVANTAGE Retrieved from
http:// www.mindtools.com/pages/article/newSTR_82.htm
22
The strategy literature provides numerous theories, research methodologies, and ideas on
the strategy-performance relationship. Strategy research has its roots in industrial
organization (IO) theory. According to Bain (1956), the IO framework of industry
behavior, firm performance or profitability is seen as a function of the industry structure.
Industry characteristics rather than firm-based issues are found to determine firm
performance (Barney, 1986). This structure-conduct-performance model from IO and
economics has been used in industries with high concentrations and similar firms (Seth
and Thomas, 1994). Some studies have not found any linkage between strategy and
performance (McGee and Thomas, 1986, 1992). To investigate the strategy and
performance linkage, many researchers began utilizing approaches found to be
generalizable across industries, specifically those proposed by Porter (1987).
2.4 Organizational Performance Measures
While researchers may not always agree on the best strategy, or strategy combination,
most if not all, support the long-term benefits of strategic planning for the successful
performance of an organization or business unit. However, measuring the performance of
a company is challenging. Researchers disagree about how to both define and
operationalize performance (Buckley et al., 1988; Littler, 1988; Day and Wensley, 1988).
Most studies on organizational performance use a variety of financial and non-financial
success measures. Researchers employ financial measures such as profit (Saunders and
Wong, 1985; Hooley and Lynch, 1985; Baker et al., 1988), turnover (Frazier and Howell,
1983), return on investment (Hooley and Lynch, 1985), return on capital employed
(Baker et al., 1988), and inventory turnover (Frazier and Howell, 1983). Non-financial
23
measures include innovativeness (Goldsmith and Clutterbuck, 1984) and market standing
(Saunders and Wong, 1985; Hooley and Lynch, 1985). When performance is measured at
a variety of levels (national, industry, company, and product), comparison of results is
rather difficult (Frazier and Howell, 1983; Buckley et al., 1988; Baker and Hart, 1989).
Measures of firm performance generally include bottom-line financial indicators such as
sales, profits, cash flow, return on equity, and growth. It is however, also important to
determine how a firm compares with its industry competitors when assessing firm
performance (Dess and Robinson, 1984). With the multitude of competitive environments
faced by firms in different industries, knowing only absolute financial numbers such as
sales, profits, or cash flow is not very illuminating unless viewed in the context of how
well the firm is doing compared to their competition. Therefore, it is important to use an
industry comparison approach when making firm performance assessments for
organizations sampled from a wide variety of industries. This study assessed the
relationship between Porter’s generic business strategies and Key Performance Indicators
such as market share; profitability and business growth so as to enable investors in the
various industries make informed decisions.
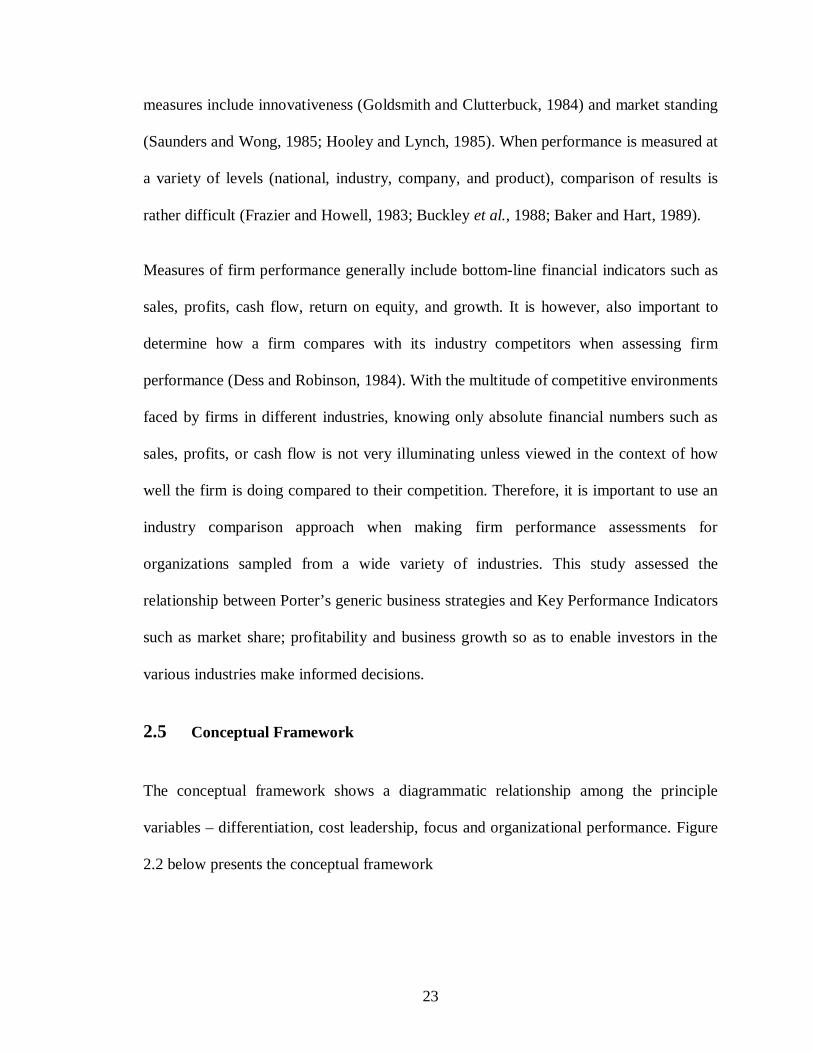
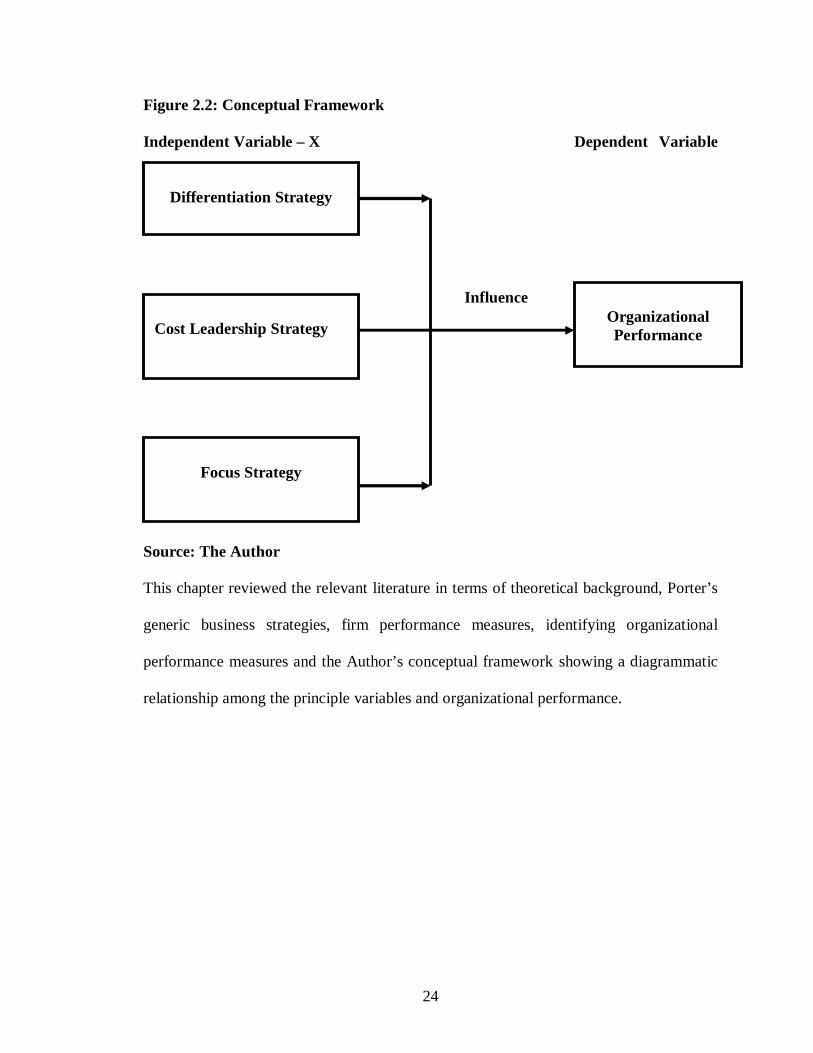
2.5 Conceptual Framework
The conceptual framework shows a diagrammatic relationship among the principle
variables – differentiation, cost leadership, focus and organizational performance. Figure
2.2 below presents the conceptual framework
24
Figure 2.2: Conceptual Framework
Independent Variable – X Dependent Variable
-y– Y
Source: The Author
This chapter reviewed the relevant literature in terms of theoretical background, Porter’s
generic business strategies, firm performance measures, identifying organizational
performance measures and the Author’s conceptual framework showing a diagrammatic
relationship among the principle variables and organizational performance.
Differentiation Strategy
Cost Leadership Strategy
Focus Strategy
Organizational Performance
Influence
25
CHAPTER THREE: RESEARCH METHODOLOGY
3.1 Introduction
This chapter defines the research design and methodology for the study. It contains a
description of the study design, population of the study, sampling design, data collection
instruments and procedures, data analysis and presentation.
3.2 Research Design
For purposes of this study, a descriptive cross sectional survey was undertaken. The
method was preferred as it permitted gathering of data from the respondents in natural
settings. Descriptive designs result in a description of the data, whether in words,
pictures, charts, or tables, and whether the data analysis shows statistical relationships or
is merely descriptive. Descriptive research is designed to describe the characteristics or
behaviors of a particular population in a systematic and accurate fashion. Survey research
uses questionnaires and interviews to collect information about people’s attitudes, beliefs,
feelings, behaviors, and lifestyles. The design was used to describe the what, who, when,
how and whereof the phenomenon. It had been used in the past by many researchers,
including Kibiru, 1999; Murage, 2001; Ndubai, 2003; and Ogolla, 2005.
3.3 Population of the study
The population of the study consisted of all the registered Multinational Pharmaceutical
wholesalers in Kenya, whose number stood at 40 as at July, 2012 (Pharmacy and Poisons
Board, 2012). The pharmaceutical wholesalers are located in the major towns in Kenya
26
and can be stratified in terms of distribution on the basis of the eight provinces. Due to
the small number of population of the study, a census study was conducted. In each of the
Pharmaceutical Wholesalers’ organizations, the Business Development manager or the
equivalent constituted the respondent.
3.4 Data Collection
A semi-structured questionnaire was used to collect primary data from the respondents.
Closed ended questions were presented on a Likert type scale. The Likert type scale,
commonly used in business research was applied because it allows participants to provide
their perceptions and opinions both in terms of direction (positive or negative) and
intensity (degree of agreement or disagreement). The ratings were on a scale of 1 (lowest
impact or least important) to 5 (highest or most important). The questionnaire had two
main sections. Section I captured the profile of the respondents and the pharmaceutical
wholesalers while section II captured information on the use of competitive strategies by
pharmaceutical wholesalers in Kenya.
The questionnaire was pre-tested on a small number of respondents who were selected on
a judgmental basis. The researcher and/or the research assistant delivered by hand, the
questionnaires to the personnel in charge of business development in the Pharmaceutical
wholesalers located in Nairobi and its environs while for those located outside Nairobi,
the questionnaires were emailed to them. A letter of introduction and questionnaire was
enclosed in an envelope delivered to the respondents. In addition, the researcher made
telephone calls to the respective respondents to further explain the purpose of the study
27
and set a time frame for the completion of the questionnaires. The respondents were
given a period of two weeks to complete and return the questionnaires. Once completed,
the researcher collected the questionnaires.
3.5 Data analysis and presentation
The Statistical Package for Social Sciences (SPSS) was used as an aid in the analysis.
The researcher preferred SPSS because of its ability to cover a wide range of the most
common statistical and graphical data analysis. The collected data from the questionnaire
and secondary sources were systematically organized in a manner to facilitate analysis.
For purposes of the study, the data pertaining to the profile of respondents were analyzed
using measures of central tendency and dispersion. In order to determine the relationship
between Porter’s Generic Strategies and firm performance, correlation and regression
analyses was undertaken. Measures of central tendency (mean scores and percentages)
and measures of dispersion (range, variance and standard deviation) were computed as
appropriate. In addition, bar charts, pie charts and graphs were also used. The information
was presented and discussed as per the objectives.
28
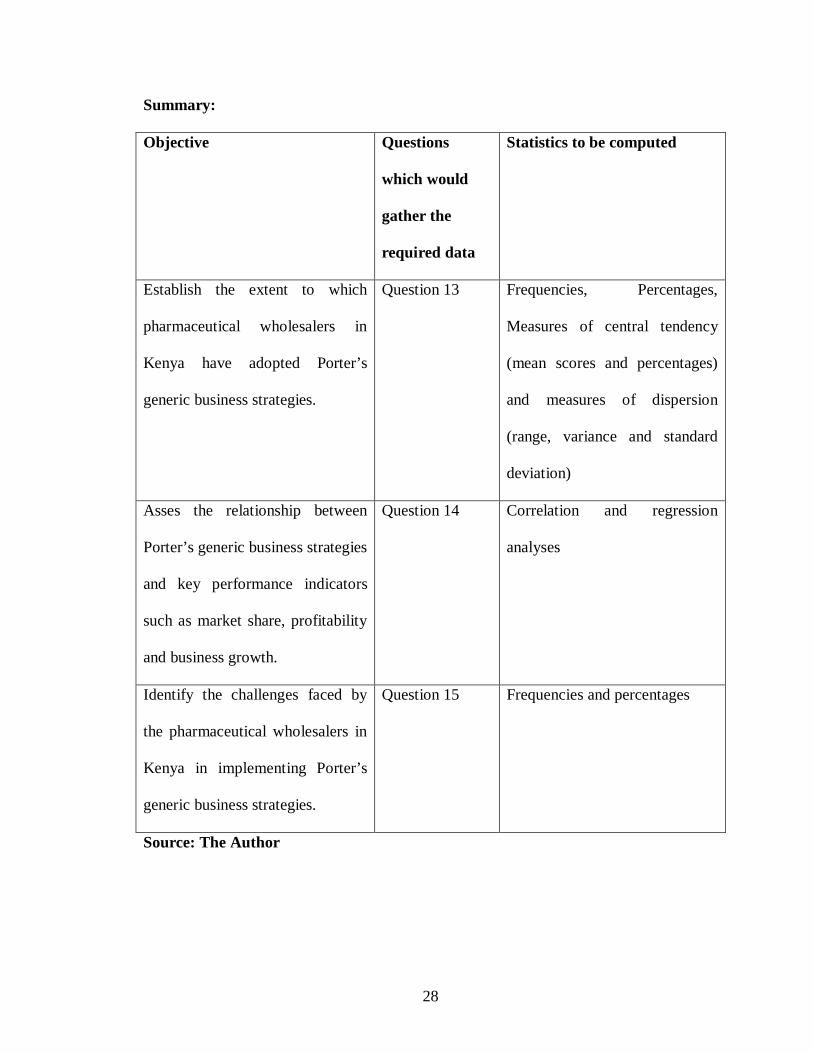
Summary:
Objective Questions
which would
gather the
required data
Statistics to be computed
Establish the extent to which
pharmaceutical wholesalers in
Kenya have adopted Porter’s
generic business strategies.
Question 13 Frequencies, Percentages,
Measures of central tendency
(mean scores and percentages)
and measures of dispersion
(range, variance and standard
deviation)
Asses the relationship between
Porter’s generic business strategies
and key performance indicators
such as market share, profitability
and business growth.
Question 14 Correlation and regression
analyses
Identify the challenges faced by
the pharmaceutical wholesalers in
Kenya in implementing Porter’s
generic business strategies.
Question 15 Frequencies and percentages
Source: The Author
29
CHAPTER FOUR: DATA ANALYSIS, FINDINGS AND DISCUSSION
4.1: Introduction
The research objective was to examine the application of Porter’s generic strategies by
Pharmaceutical wholesalers in Kenya. This chapter presents the analysis and findings
with regard to the objective and discussion of the same. The data was collected from the
40 Multinational Pharmaceutical wholesalers in Kenya. Respondents were personnel in
charge of business development in the Pharmaceutical wholesalers. The findings are
presented in percentages and frequency distributions, mean and standard deviations.
4.2: General information
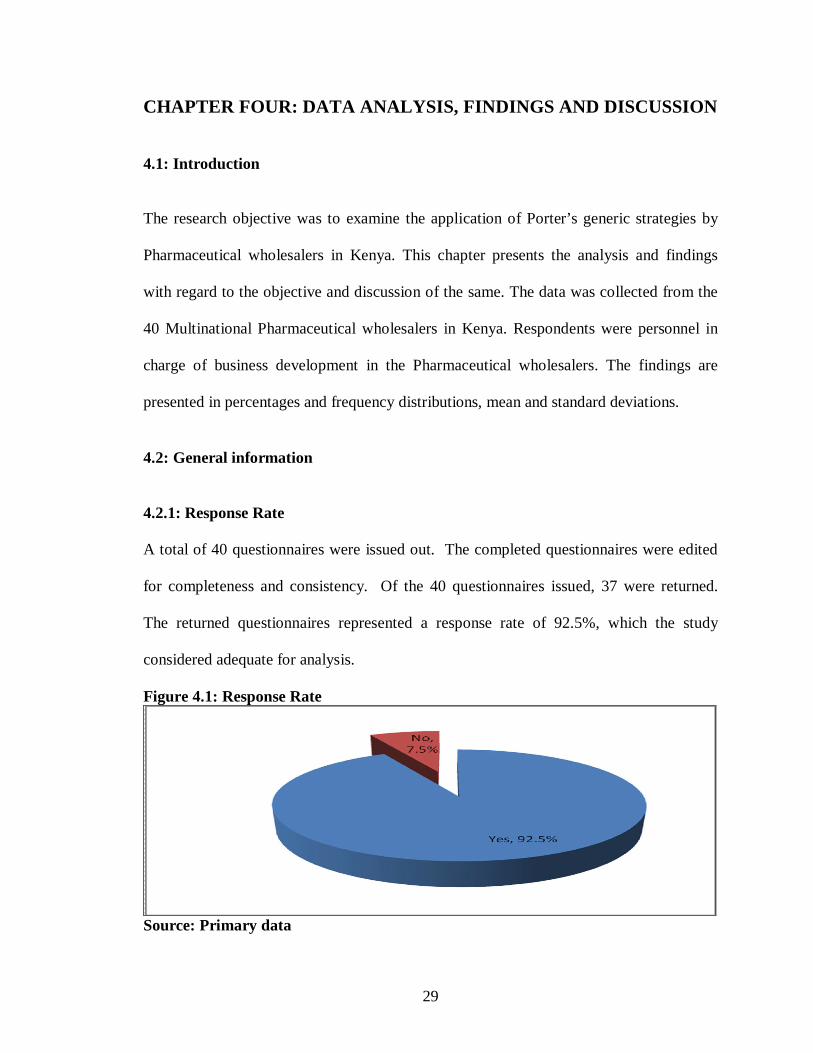
4.2.1: Response Rate
A total of 40 questionnaires were issued out. The completed questionnaires were edited
for completeness and consistency. Of the 40 questionnaires issued, 37 were returned.
The returned questionnaires represented a response rate of 92.5%, which the study
considered adequate for analysis.
Figure 4.1: Response Rate
Source: Primary data
30
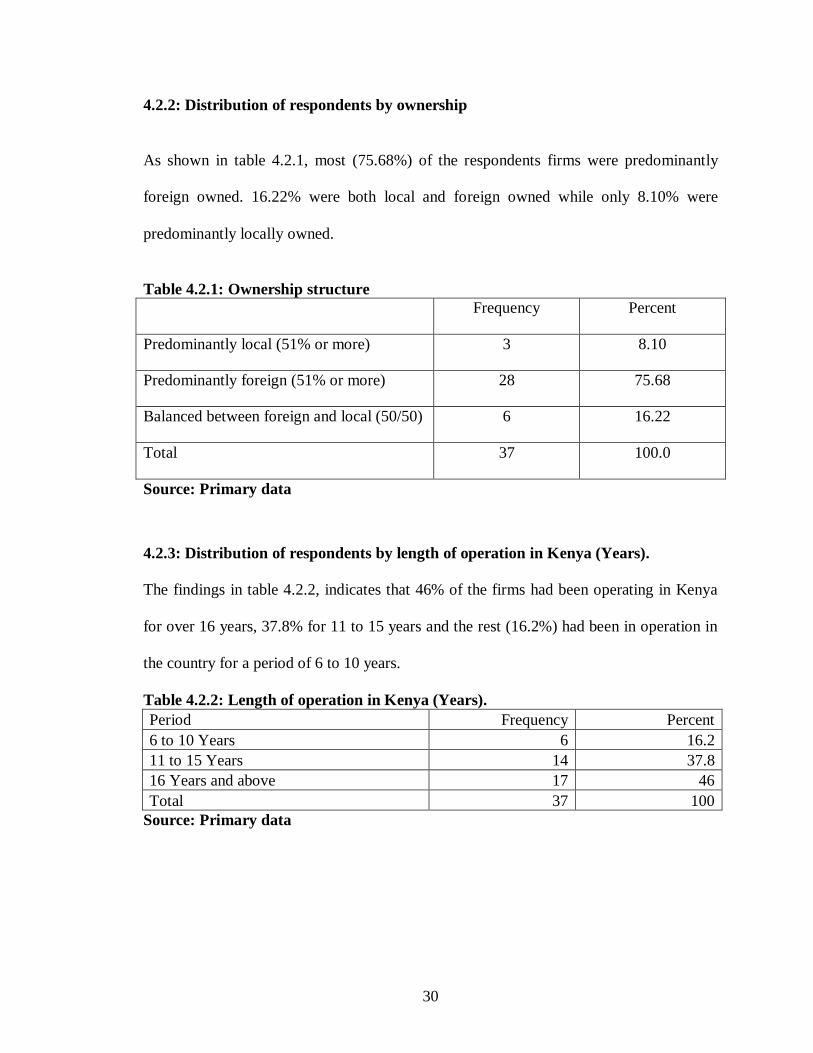
4.2.2: Distribution of respondents by ownership
As shown in table 4.2.1, most (75.68%) of the respondents firms were predominantly
foreign owned. 16.22% were both local and foreign owned while only 8.10% were
predominantly locally owned.
Table 4.2.1: Ownership structure Frequency Percent
Predominantly local (51% or more) 3 8.10
Predominantly foreign (51% or more) 28 75.68
Balanced between foreign and local (50/50) 6 16.22
Total 37 100.0
Source: Primary data
4.2.3: Distribution of respondents by length of operation in Kenya (Years).
The findings in table 4.2.2, indicates that 46% of the firms had been operating in Kenya
for over 16 years, 37.8% for 11 to 15 years and the rest (16.2%) had been in operation in
the country for a period of 6 to 10 years.
Table 4.2.2: Length of operation in Kenya (Years). Period Frequency Percent 6 to 10 Years 6 16.2 11 to 15 Years 14 37.8 16 Years and above 17 46 Total 37 100
Source: Primary data
31
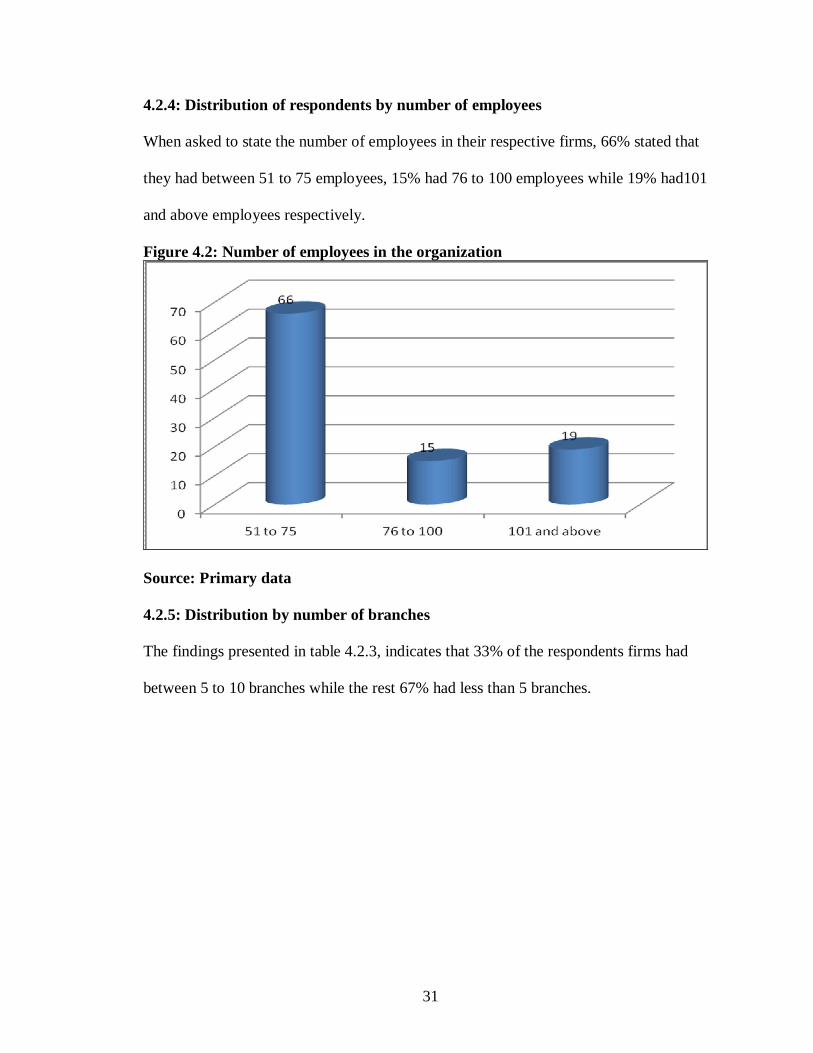
4.2.4: Distribution of respondents by number of employees
When asked to state the number of employees in their respective firms, 66% stated that
they had between 51 to 75 employees, 15% had 76 to 100 employees while 19% had101
and above employees respectively.
Figure 4.2: Number of employees in the organization
Source: Primary data
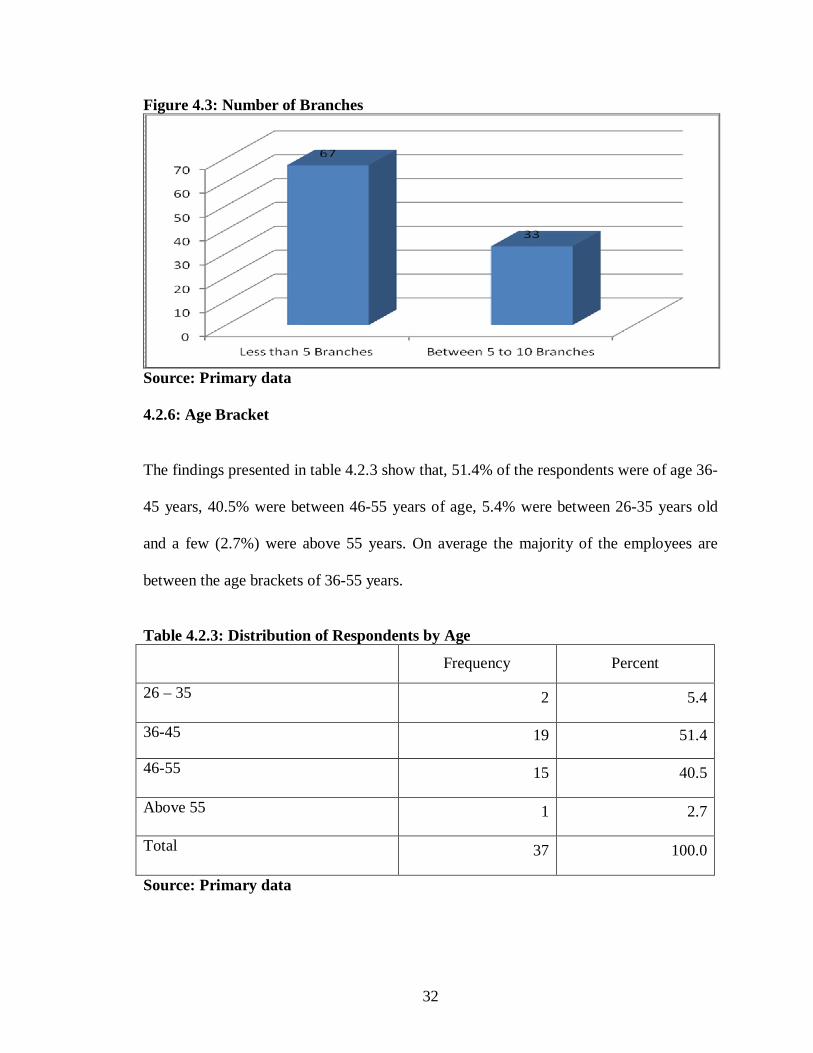
4.2.5: Distribution by number of branches
The findings presented in table 4.2.3, indicates that 33% of the respondents firms had
between 5 to 10 branches while the rest 67% had less than 5 branches.
32
Figure 4.3: Number of Branches
Source: Primary data
4.2.6: Age Bracket
The findings presented in table 4.2.3 show that, 51.4% of the respondents were of age 36-
45 years, 40.5% were between 46-55 years of age, 5.4% were between 26-35 years old
and a few (2.7%) were above 55 years. On average the majority of the employees are
between the age brackets of 36-55 years.
Table 4.2.3: Distribution of Respondents by Age Frequency Percent
26 – 35 2 5.4
36-45 19 51.4
46-55 15 40.5
Above 55 1 2.7
Total 37 100.0
Source: Primary data
33
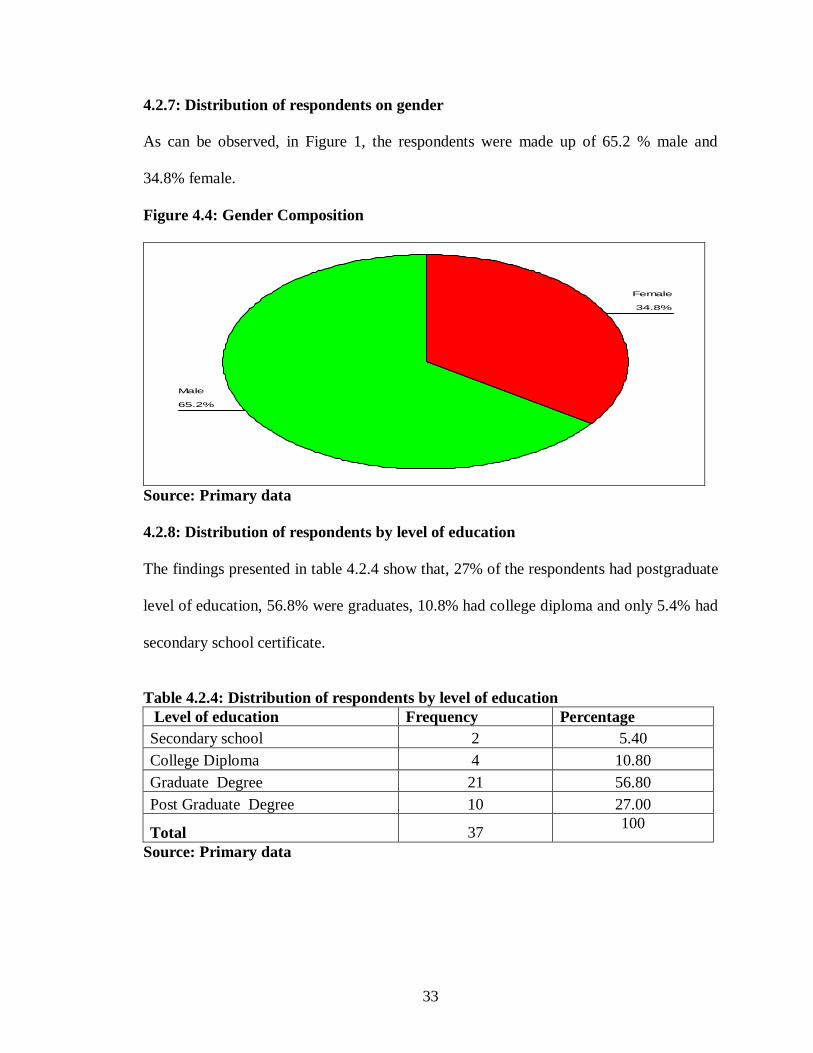
4.2.7: Distribution of respondents on gender
As can be observed, in Figure 1, the respondents were made up of 65.2 % male and
34.8% female.
Figure 4.4: Gender Composition
65.2%
34.8%
Male
Female
Source: Primary data
4.2.8: Distribution of respondents by level of education
The findings presented in table 4.2.4 show that, 27% of the respondents had postgraduate
level of education, 56.8% were graduates, 10.8% had college diploma and only 5.4% had
secondary school certificate.
Table 4.2.4: Distribution of respondents by level of education Level of education Frequency Percentage Secondary school 2 5.40 College Diploma 4 10.80 Graduate Degree 21 56.80 Post Graduate Degree 10 27.00
Total 37 100
Source: Primary data
34
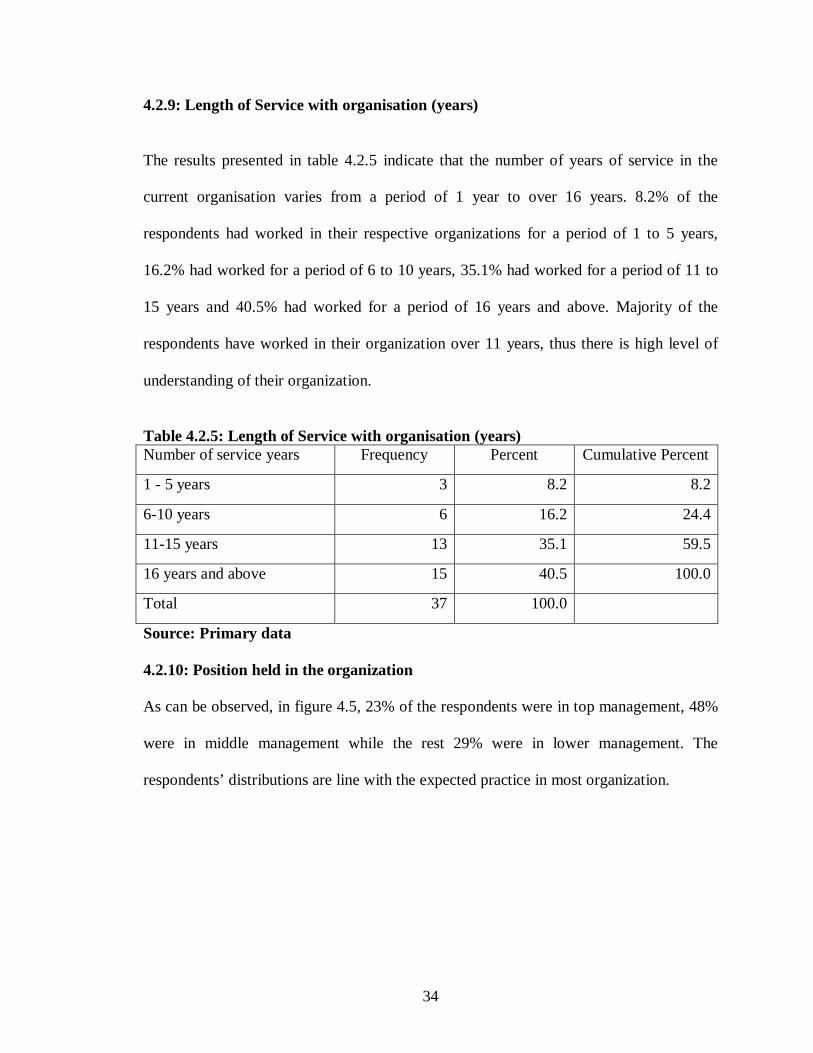
4.2.9: Length of Service with organisation (years)
The results presented in table 4.2.5 indicate that the number of years of service in the
current organisation varies from a period of 1 year to over 16 years. 8.2% of the
respondents had worked in their respective organizations for a period of 1 to 5 years,
16.2% had worked for a period of 6 to 10 years, 35.1% had worked for a period of 11 to
15 years and 40.5% had worked for a period of 16 years and above. Majority of the
respondents have worked in their organization over 11 years, thus there is high level of
understanding of their organization.
Table 4.2.5: Length of Service with organisation (years) Number of service years Frequency Percent Cumulative Percent
1 - 5 years 3 8.2 8.2
6-10 years 6 16.2 24.4
11-15 years 13 35.1 59.5
16 years and above 15 40.5 100.0
Total 37 100.0
Source: Primary data
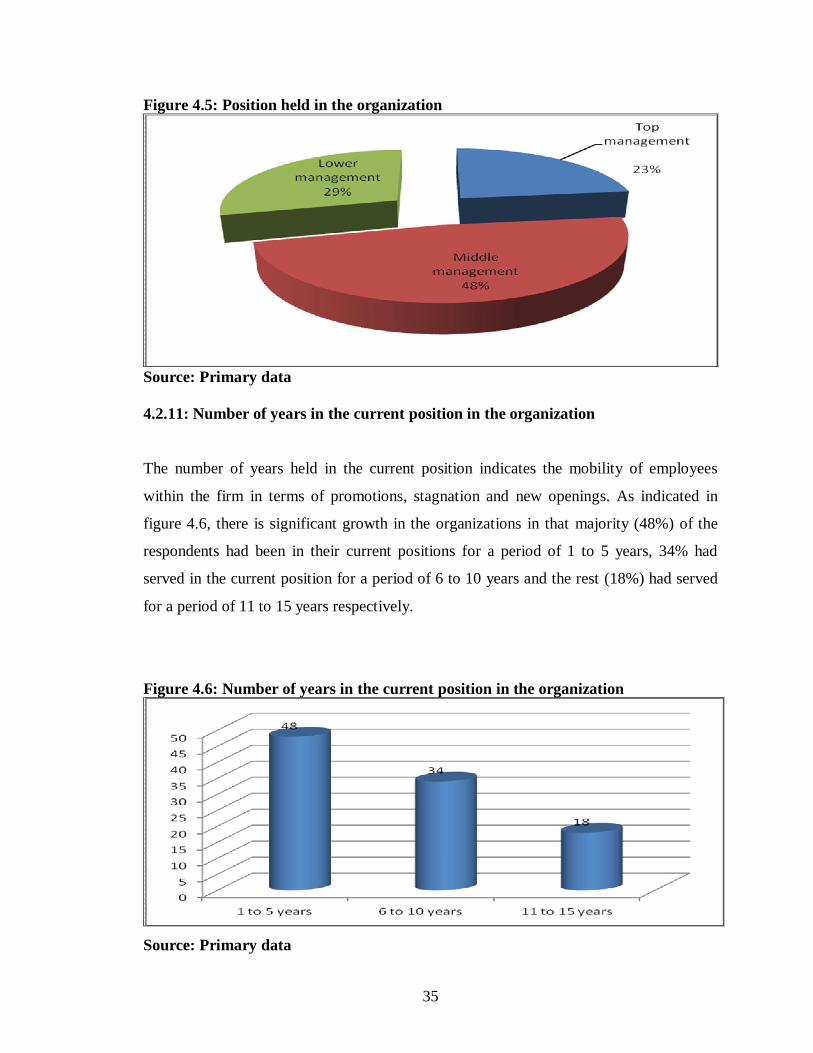
4.2.10: Position held in the organization As can be observed, in figure 4.5, 23% of the respondents were in top management, 48%
were in middle management while the rest 29% were in lower management. The
respondents’ distributions are line with the expected practice in most organization.
35
Figure 4.5: Position held in the organization
Source: Primary data
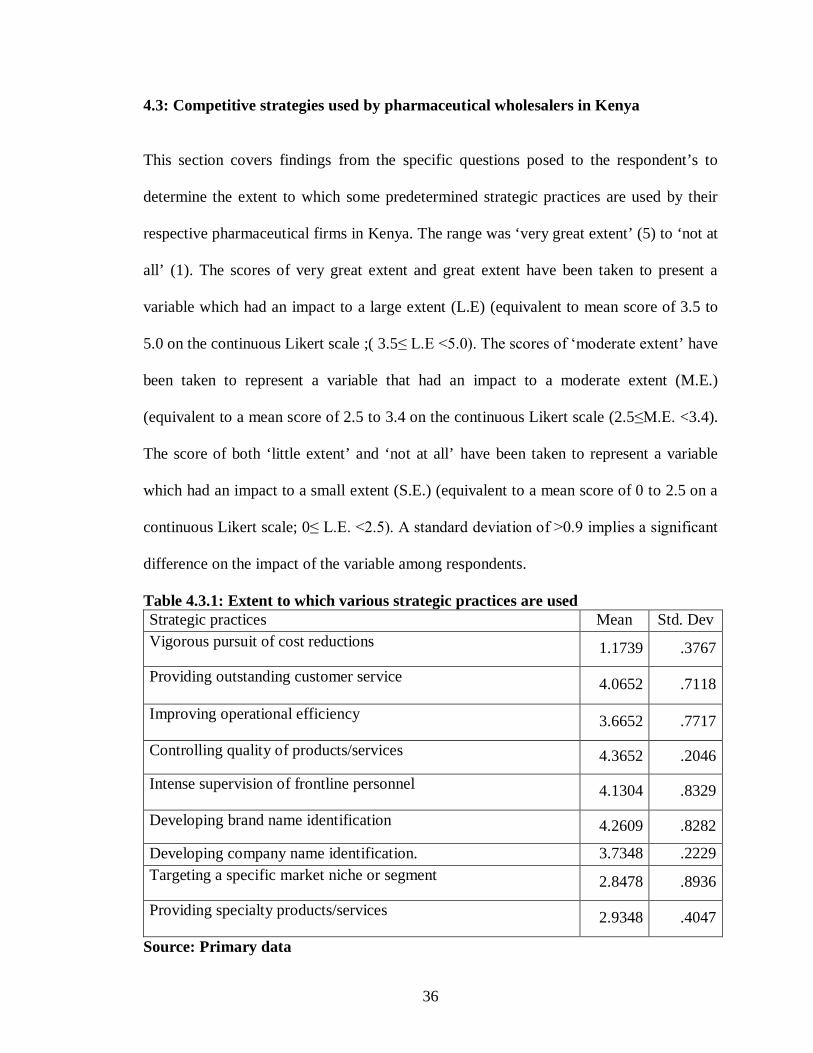
4.2.11: Number of years in the current position in the organization
The number of years held in the current position indicates the mobility of employees
within the firm in terms of promotions, stagnation and new openings. As indicated in
figure 4.6, there is significant growth in the organizations in that majority (48%) of the
respondents had been in their current positions for a period of 1 to 5 years, 34% had
served in the current position for a period of 6 to 10 years and the rest (18%) had served
for a period of 11 to 15 years respectively.
Figure 4.6: Number of years in the current position in the organization
Source: Primary data
36
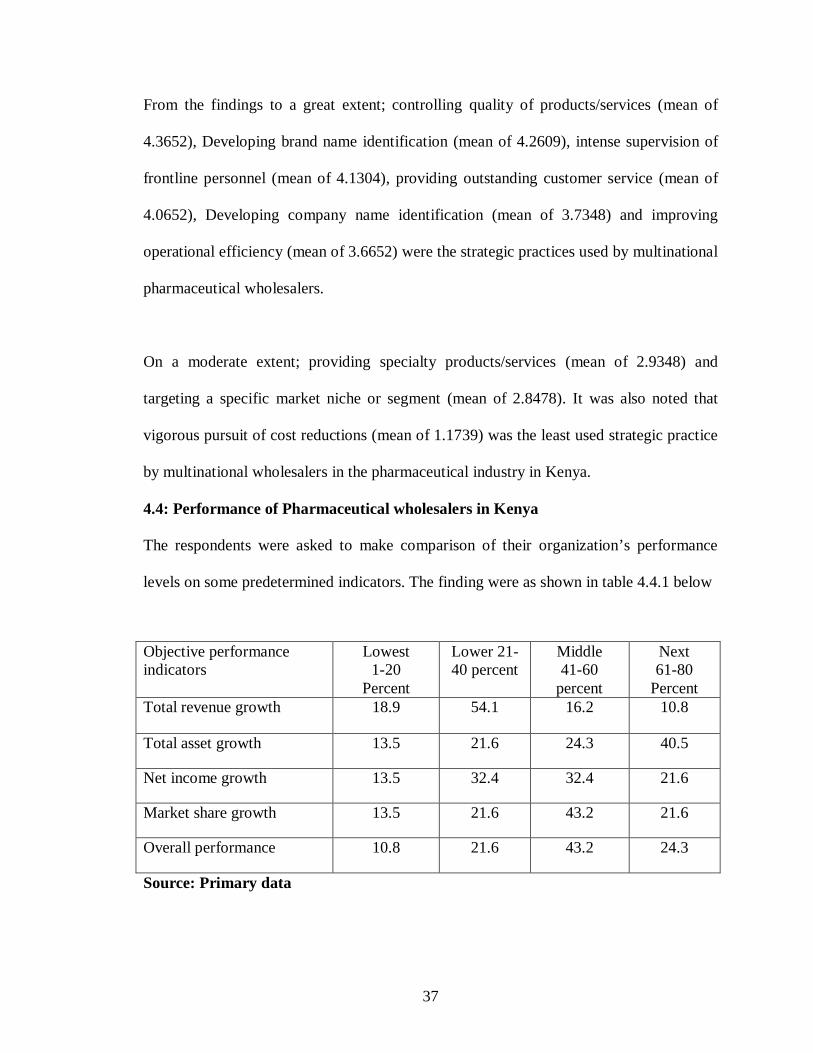
4.3: Competitive strategies used by pharmaceutical wholesalers in Kenya
This section covers findings from the specific questions posed to the respondent’s to
determine the extent to which some predetermined strategic practices are used by their
respective pharmaceutical firms in Kenya. The range was ‘very great extent’ (5) to ‘not at
all’ (1). The scores of very great extent and great extent have been taken to present a
variable which had an impact to a large extent (L.E) (equivalent to mean score of 3.5 to
5.0 on the continuous Likert scale ;( 3.5≤ L.E <5.0). The scores of ‘moderate extent’ have
been taken to represent a variable that had an impact to a moderate extent (M.E.)
(equivalent to a mean score of 2.5 to 3.4 on the continuous Likert scale (2.5≤M.E. <3.4).
The score of both ‘little extent’ and ‘not at all’ have been taken to represent a variable
which had an impact to a small extent (S.E.) (equivalent to a mean score of 0 to 2.5 on a
continuous Likert scale; 0≤ L.E. <2.5). A standard deviation of >0.9 implies a significant
difference on the impact of the variable among respondents.
Table 4.3.1: Extent to which various strategic practices are used Strategic practices Mean Std. Dev Vigorous pursuit of cost reductions 1.1739 .3767
Providing outstanding customer service 4.0652 .7118
Improving operational efficiency 3.6652 .7717
Controlling quality of products/services 4.3652 .2046
Intense supervision of frontline personnel 4.1304 .8329
Developing brand name identification 4.2609 .8282
Developing company name identification. 3.7348 .2229 Targeting a specific market niche or segment 2.8478 .8936
Providing specialty products/services 2.9348 .4047
Source: Primary data
37
From the findings to a great extent; controlling quality of products/services (mean of
4.3652), Developing brand name identification (mean of 4.2609), intense supervision of
frontline personnel (mean of 4.1304), providing outstanding customer service (mean of
4.0652), Developing company name identification (mean of 3.7348) and improving
operational efficiency (mean of 3.6652) were the strategic practices used by multinational
pharmaceutical wholesalers.
On a moderate extent; providing specialty products/services (mean of 2.9348) and
targeting a specific market niche or segment (mean of 2.8478). It was also noted that
vigorous pursuit of cost reductions (mean of 1.1739) was the least used strategic practice
by multinational wholesalers in the pharmaceutical industry in Kenya.
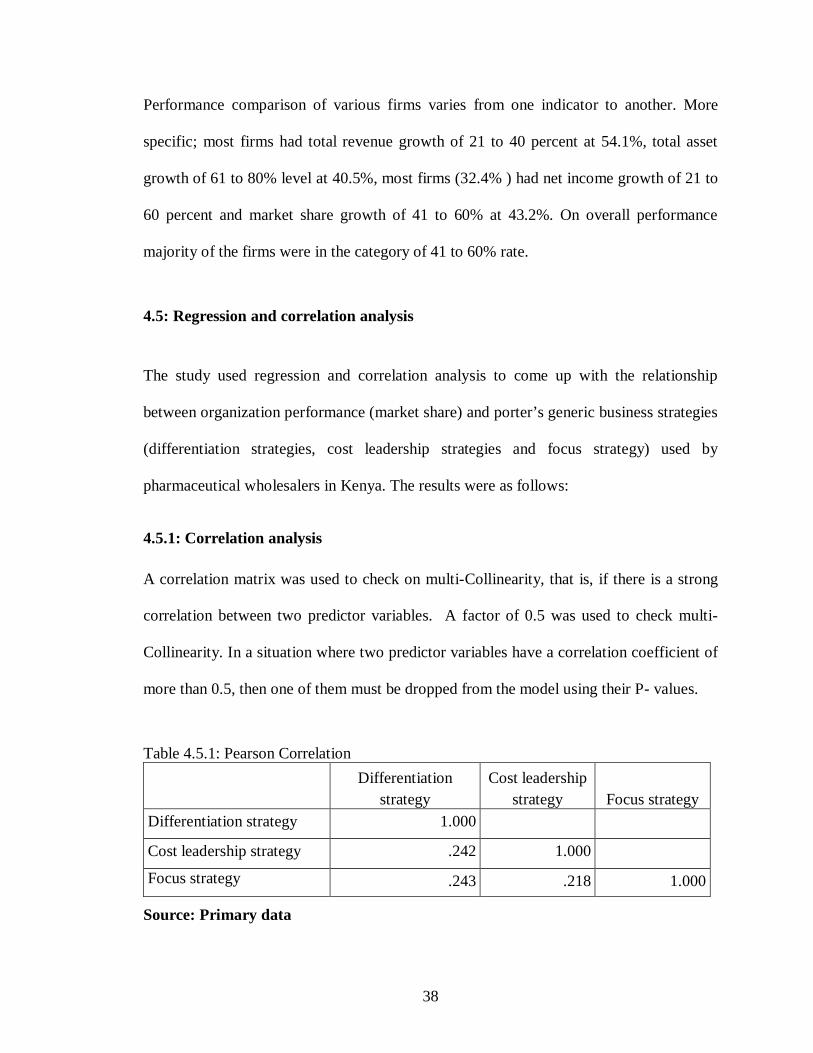
4.4: Performance of Pharmaceutical wholesalers in Kenya
The respondents were asked to make comparison of their organization’s performance
levels on some predetermined indicators. The finding were as shown in table 4.4.1 below
Objective performance indicators
Lowest 1-20
Percent
Lower 21-40 percent
Middle 41-60
percent
Next 61-80
Percent Total revenue growth 18.9 54.1 16.2 10.8
Total asset growth 13.5 21.6 24.3 40.5
Net income growth 13.5 32.4 32.4 21.6
Market share growth 13.5 21.6 43.2 21.6
Overall performance 10.8 21.6 43.2 24.3
Source: Primary data
38
Performance comparison of various firms varies from one indicator to another. More
specific; most firms had total revenue growth of 21 to 40 percent at 54.1%, total asset
growth of 61 to 80% level at 40.5%, most firms (32.4% ) had net income growth of 21 to
60 percent and market share growth of 41 to 60% at 43.2%. On overall performance
majority of the firms were in the category of 41 to 60% rate.
4.5: Regression and correlation analysis
The study used regression and correlation analysis to come up with the relationship
between organization performance (market share) and porter’s generic business strategies
(differentiation strategies, cost leadership strategies and focus strategy) used by
pharmaceutical wholesalers in Kenya. The results were as follows:
4.5.1: Correlation analysis A correlation matrix was used to check on multi-Collinearity, that is, if there is a strong
correlation between two predictor variables. A factor of 0.5 was used to check multi-
Collinearity. In a situation where two predictor variables have a correlation coefficient of
more than 0.5, then one of them must be dropped from the model using their P- values.
Table 4.5.1: Pearson Correlation Differentiation
strategy Cost leadership
strategy Focus strategy Differentiation strategy 1.000
Cost leadership strategy .242 1.000
Focus strategy .243 .218 1.000
Source: Primary data
39
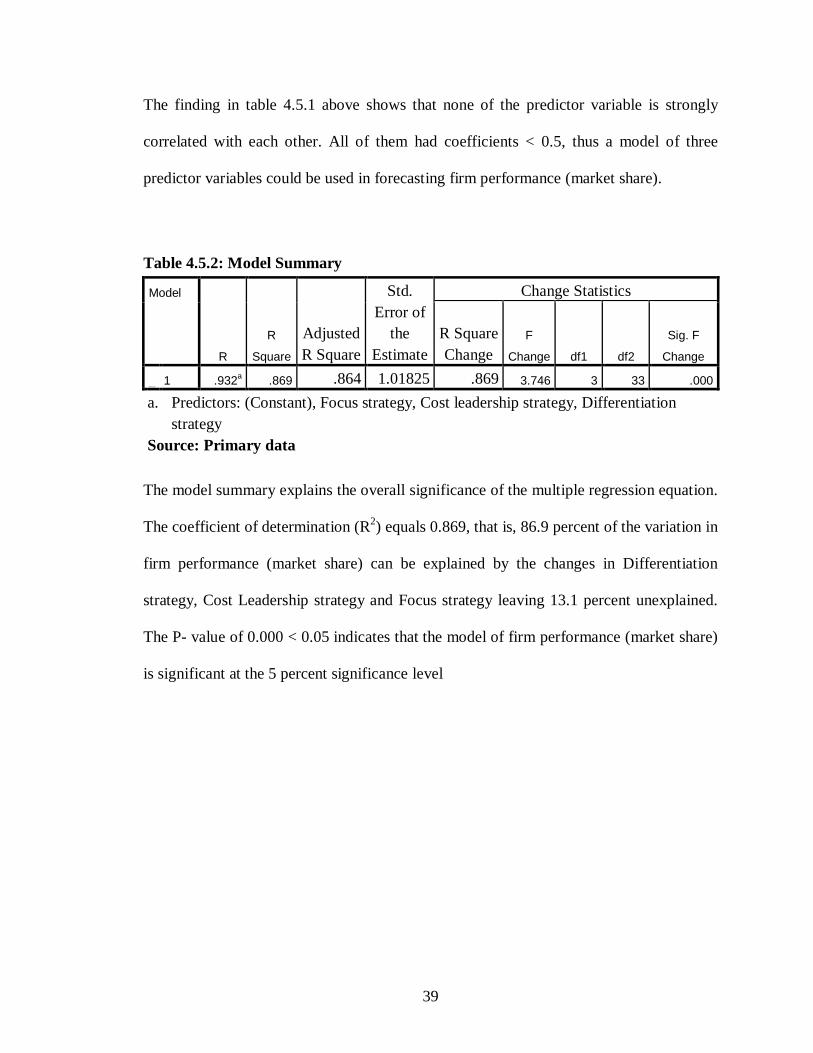
The finding in table 4.5.1 above shows that none of the predictor variable is strongly
correlated with each other. All of them had coefficients < 0.5, thus a model of three
predictor variables could be used in forecasting firm performance (market share).
Table 4.5.2: Model Summary
Model
R
R
Square
Adjusted R Square
Std. Error of
the Estimate
Change Statistics
R Square Change
F
Change df1 df2
Sig. F
Change
dimensi on0
1 .932a .869 .864 1.01825 .869 3.746 3 33 .000
a. Predictors: (Constant), Focus strategy, Cost leadership strategy, Differentiation strategy
Source: Primary data
The model summary explains the overall significance of the multiple regression equation.
The coefficient of determination (R2) equals 0.869, that is, 86.9 percent of the variation in
firm performance (market share) can be explained by the changes in Differentiation
strategy, Cost Leadership strategy and Focus strategy leaving 13.1 percent unexplained.
The P- value of 0.000 < 0.05 indicates that the model of firm performance (market share)
is significant at the 5 percent significance level
40
4.5.3: Regression equation
Table 4.5.3: Coefficients of regression equation Model Unstandardized
Coefficients Standardized Coefficients
T Sig. B Std.
Error Beta 1 (Constant) 1.127 .723 1.560 .128
Differentiation strategy
X1 .446 .124 .042 3.597 .002
Cost leadership strategy
X2 .196 .078 .362 2.513 .004
Focus strategy X3 .388 .107 .147 3.626 .001
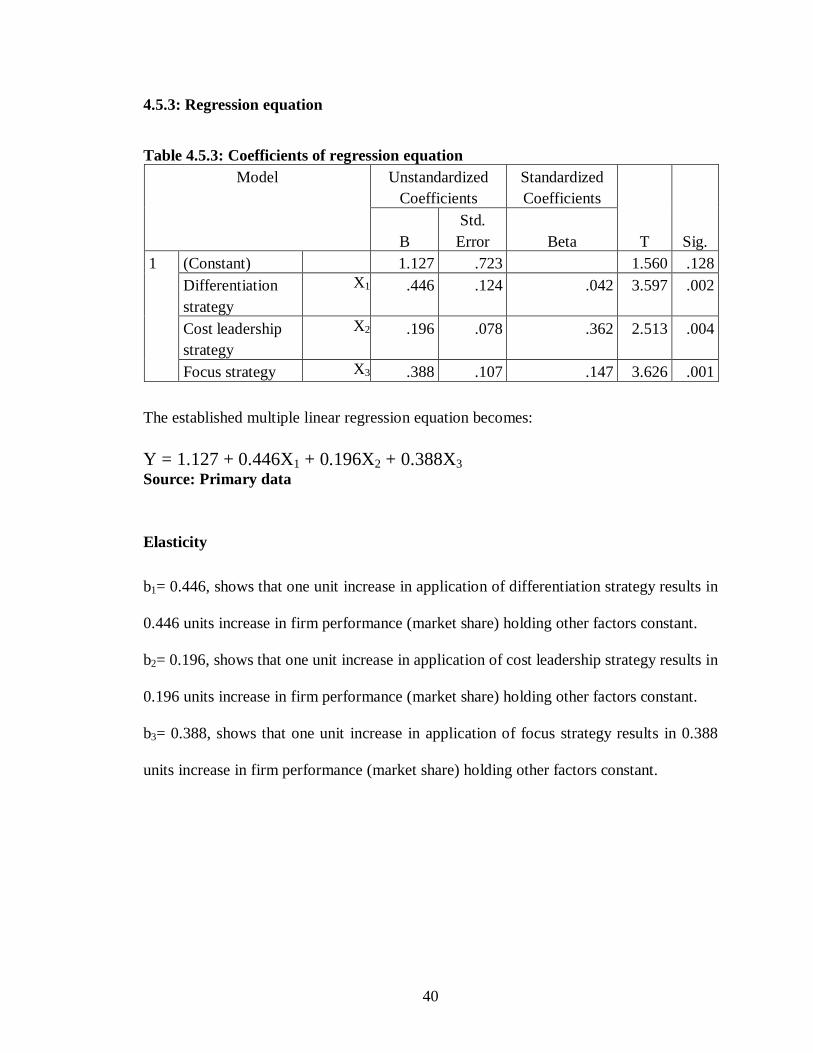
The established multiple linear regression equation becomes: Y = 1.127 + 0.446X1 + 0.196X2 + 0.388X3 Source: Primary data
Elasticity
b1= 0.446, shows that one unit increase in application of differentiation strategy results in
0.446 units increase in firm performance (market share) holding other factors constant.
b2= 0.196, shows that one unit increase in application of cost leadership strategy results in
0.196 units increase in firm performance (market share) holding other factors constant.
b3= 0.388, shows that one unit increase in application of focus strategy results in 0.388
units increase in firm performance (market share) holding other factors constant.
41
CHAPTER FIVE: SUMMARY, CONCLUSION AND
RECOMMENDATIONS
5.0: Introduction
In this section we discuss the main findings, draw conclusions and make
recommendations.
5.1 Summary
The objective of the study was to examine the application of Porter’s generic strategies
by Pharmaceutical wholesalers in Kenya. This involved looking at the influence of
differentiation strategy, cost leadership strategy and focus strategy on organizational
performance. At the same time majority of the respondents have worked in their
organization over 11 years, thus there is high level of understanding of their organization.
This shows that the information obtained would be reliable and suitable for generalization
in the context of the Kenyan pharmaceutical industry.
The study indentified the following strategic practices as the most commonly used
competitive strategies by pharmaceutical wholesalers in Kenya; controlling quality of
products/services, Developing brand name identification, intense supervision of
frontline personnel, providing outstanding customer service, Developing company
name identification and improving operational efficiency. On the other hand the least
used strategic practice by pharmaceutical firms was vigorous pursuit of cost reductions.
This could be attributed to the fact that most multinational pharmaceutical wholesalers
studied were foreign owned thus invest more in research and development of new drugs
42
rather than manufacturing of generic drugs. Such multinational pharmaceutical
wholesalers thus tend to pursue the differentiation strategy more than they would cost
reduction strategies. These companies are mostly pioneers of new drugs in the industry
hence tend to focus on strategies that differentiate them from generic companies which
pursue vigorous cost reduction strategies.
The study used regression analysis to find the relationship between organization
performance (market share) and porter’s generic business strategies (differentiation
strategies, cost leadership strategies and focus strategy) used by pharmaceutical
wholesalers in Kenya. The finding of the study indicated that the model was significant
for forecasting the firm’s performance. This was demonstrated in the part of the analysis
where R2 for the association was 86.9%. The respondents strongly associated their firm’s
performance with the strategy adopted.
All the predictor variables were also linearly related with the dependent variable thus a
model of three predictor variables could be used in predicting organization performance
(market share). More so differentiation strategy and focus strategy were the main
strategies used by pharmaceutical firms in Kenya.
Some of the challenges faced by pharmaceutical wholesalers in Kenya while pursuing
porter’s generic strategies included but were not limited to the following:
Majority of patients in the country were of low disposable income hence could not afford
the premium price of Multinational pharmaceutical brands. Such patients therefore tend
43
to switch to cheaper generic substitutes. Health management organizations were also a
hindrance to firm’s growth because of the annual limits for expenditure on drugs that
were imposed on patients which in turn resulted to patients opting for cheaper substitutes.
Most firms faced challenges with regard to their innovative pipelines with majority
having limited new molecules to introduce to the market. This trend could result in some
firms changing their strategy to hybrid rather than pure strategies to face the changing
competitive environment.
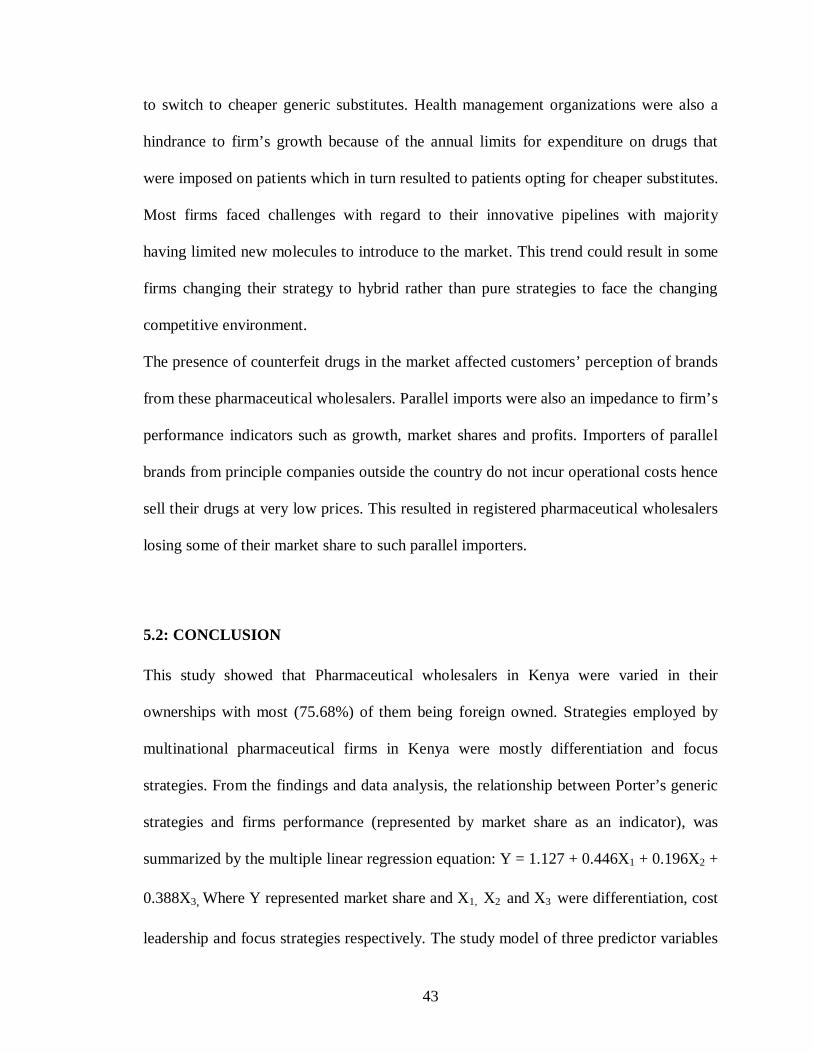
The presence of counterfeit drugs in the market affected customers’ perception of brands
from these pharmaceutical wholesalers. Parallel imports were also an impedance to firm’s
performance indicators such as growth, market shares and profits. Importers of parallel
brands from principle companies outside the country do not incur operational costs hence
sell their drugs at very low prices. This resulted in registered pharmaceutical wholesalers
losing some of their market share to such parallel importers.
5.2: CONCLUSION
This study showed that Pharmaceutical wholesalers in Kenya were varied in their
ownerships with most (75.68%) of them being foreign owned. Strategies employed by
multinational pharmaceutical firms in Kenya were mostly differentiation and focus
strategies. From the findings and data analysis, the relationship between Porter’s generic
strategies and firms performance (represented by market share as an indicator), was
summarized by the multiple linear regression equation: Y = 1.127 + 0.446X1 + 0.196X2 +
0.388X3, Where Y represented market share and X1, X2 and X3 were differentiation, cost
leadership and focus strategies respectively. The study model of three predictor variables
44
was significant for forecasting the firm’s performance. This was demonstrated in the part
of the analysis where R2 for the association was 86.9%. Respondents in the study strongly
attributed their firm’s performance to the strategies adopted thus suggesting that pursuit
of one generic business strategy as suggested by Porter, placed a firm in a better strategic
position and resulted in superior performance rather than a situation where the firm was
“stuck in the middle”.
5.3: RECOMMENDATIONS
5.3.1: Recommendation to policy makers
Based on the review of Kenya’s pharmaceutical wholesalers’ adoption of Porters generic
strategies derived from analyses in earlier sections, the following is a set of
recommendations to policy makers in the pharmaceutical industry:
The Ministry of Medical services while procuring mostly low priced brands through the
tendering process at KEMSA, should consider strengthening regulations that support the
inclusion of Multinational pharmaceutical wholesalers in public procurement of
medicines. This will enhance such firm’s performance locally, thereby creating
opportunity for further investment in research and development of new drugs.
The Pharmacy and Poisons board should strengthen post market surveillance in order to
control substandard and counterfeit drugs in the Kenyan market by enhancing
pharmacovigilance and instituting guidelines and protocols for drug registrations. This
will enable Multinational pharmaceutical wholesalers compete effectively thereby
investing more into research and development of new drugs.
45
The GoK should consider establishing a package of incentives (in terms of taxes and
duties) to encourage more investment by multinational wholesalers in the Kenyan
pharmaceutical industry.
5.3.2: Recommendation to managers of Multinational pharmaceutical wholesalers
Multinational pharmaceutical wholesalers are interested in Kenya because the country is
forecast to experience rapid macroeconomic growth. This will drive the emergence of a
middle class that will be able to afford expensive branded and patented drugs.
Differential pricing may be necessary in the medium term for multinationals to establish a
presence in Kenya, but Multinational firms should not try to compete with Asian and
local pharmaceutical firms on price. Instead they need to market their drugs as
aspirational products for the uppermost earners.
5.3.3: Recommendation for Further Research
Further research to establish factors that lead to change in firms’ competitive strategies
within the pharmaceutical industry in Kenya is recommended. This will enable managers
of pharmaceutical companies understand the changing competitive environment within
the industry and options available to them should they need to review their strategic
position.
46
REFERENCES Anon, (1998), Strategy according to Michael Porter. The Antidote from CSBS, 16, 24-25.
Argyres, N., & McGaha, A.M. (2002), An interview with Michael Porter. Academy of
Management Executive, 16(2), 43-52.
Bain, J. (1956), Barriers to New Competition: Their Character and Consequences in
Manufacturing Industries, Harvard University Press, Cambridge, MA.,
Baker, M.J., Black, C.D. & Hart, S. (1988), The competitiveness of British industry: what
really makes the difference? European Journal of Marketing, 22(2), 70-85.
Baker, M.J. & Hart, S. (1989), Marketing and Competitive Success. Philip Allan, Hemel
Hempstead.
Barney, J.B. (1986), Types of competition and the theory of strategy: toward an
integrated framework. Academy of Management Review, 110, 791-800.
Berthoff, A. (2002), Differentiation II. Computer Dealer News, 18(2), 20.
Buckley, P., Pass, C.L. & Prescott, K. (1988), Measures of international competitiveness:
a critical survey. Journal of Marketing Management, 4, 175-200.
Cross, L. (1999), Strategy drives marketing success. Graphic Arts Monthly, 71(2), 96.
Darrow, W.P., Algin, B. & King, D.H. (2001), David vs. Goliath in the hardware
industry: generic strategies and critical success factors as revealed by business
practice. The Mid-Atlantic Journal of Business, 37(2/3), 97-109.
David, F. (2000), Strategic Management Concepts and Cases. Prentice-Hall, Englewood
Cliffs, NJ.

47
Davidson, S. (2001), Seizing the competitive advantage. Community Banker, 10(8), 32-
34.
Day, G.S. & Wensley, R. (1988), Assessing advantage: a framework for diagnosing
competitive superiority. Journal of Marketing, 52, 1-20.
Dess, G.G. & Davis, P.S. (1984), Porter's generic strategies as determinants of strategic
group membership and performance. Academy of Management Journal, 26(3),
467-488.
Dess, G.G. & Robinson, R.B. Jr (1984), Measuring organizational performance in the
absence of objective measures. Strategic Management Journal, 5, 265-273.
Dogson, S.J. (2008), Pharmaceutical industry in Kenya. Medical Journal of Therapeutics
Africa, 2(4), 328.
Donaldson, G. (1984), Managing Corporate Wealth. Praeger, New York, NY.
Frazier, G.L. & Howell, R.D. (1983), Business definition and performance. Journal of
Marketing, 47, 59-67
Fuerer, R. & Chaharbaghi, K. (1997), Strategy development: past, present, and future.
Training for Quality, 5(2), 58-70.
Green, R.F., Lisboa, J. & Yasin, M.M. (1993), Porter's (1980) generic strategies in
Portugal. European Business Review, 93(2), 3-10.
Goldsmith, W. & Clutterbuck, D. (1984), The Winning Streak: Britain's Top Companies
Reveal their Formulas for Success. Weidenfield and Nicolson, London.
Gupta, A. (1995), A stakeholder analysis approach for inter-organizational systems.
Industrial Management and Stat Systems, 95(6), 3-7.
48
Hambrick, D.C. (1983), Some tests of the effectiveness and functional attributes of miles
and snow's strategic types. Academy of Management Journal, 26(1), 5-26.
Helms, M.M., Clay, D. & Peter, W. (1997), Competitive strategies and business
performance: evidence from the adhesives and sealants industry. Management
Decision, 35(9), 689-703.
Hill, C.W.L. (1988), Differentiation versus low cost or differentiation and low cost: a
contingency framework. Academy of Management Review, 13(3), 401-12.
Hlavacka, S., Ljuba, B., Viera, R. & Robert, W. (2001), Performance implications of
Porter's generic strategies in Slovak hospitals. Journal of Management in
Medicine, 15(1), 44-66.
Hooley, G.I. & Lynch, J.E. (1985), Marketing lesson's from the UK's high-flying
companies. Journal of Marketing Management, 1, 65-74.
Hyatt, L. (2001), A simple guide to strategy. Nursing Homes, 50(1), 12-3.
Karanja, P. (2002), Competitive strategies of real estate firms- the perspective of porter’s
generic model. (Unpublished MBA Research Project). University of Nairobi,
Nairobi.
Kenya’s Pharmaceutical Industry (2005).
Kibiru (1999), Achieving competitive advantage through differentiation of market
offering – the case of chemical fertilizers importing companies in Kenya.
(Unpublished MBA Research Project). University of Nairobi, Nairobi.
Kim, L. & Lim, Y. (1988), Environment, generic strategies, and performance in a rapidly
developing country: a taxonomic approach. Academy of Management Journal,
31, 802-27.
49
Kippenberger, T. (1996), A strong focus at Amoco UK. The Antinode, 1(1), 22-24.
Kitoto (2005), Competitive strategies adopted by universities in Kenya. (Unpublished
MBA Research Project). University of Nairobi, Nairobi.
Kumar, K., Subramanian, R. & Yauger, C. (1997), Pure versus hybrid: performance
implications of porter's generic strategies. Health Care Management Review,
22(4), 47-60.
Littler, D. (1988), Marketing Education Group Proceedings of the 21st Annual
Conference: Perspectives on competitiveness. Huddersfield Polytechnic, 3, 57-
72.
Lusch, R.F. & Laczniak, G.R. (1989), Macro-environmental forces, marketing strategy
and business performance: a futures approach. Journal of the Academy of
Marketing Science, 17, 283-295.
Malburg, C. (2000), Competing on costs. Industry Week, 249(17), 31.
McCracken, L. (2002), Differentiation: win new business with less effort. Principal's
Report, 2(4), 1.
McGee, J. & Thomas, H. (1986), Strategic groups: theory, research and taxonomy.
Strategic Management Journal, 7(1), 141-60.
McNamee, P. & McHugh, M. (1989), Competitive strategies in the clothing industry.
Long Range Planning, 22(4), 63-71.
Median, A. & Chin, A.C. (1995), Mortgage-pricing determinants: a comparative
investigation of national regional and local building societies. International
50
Journal of Bank Marketing, 13(3), 3-11.
Miller, A. & Dess, G. (1993), Assessing Porter's (1980) model in terms of its
generalizability, accuracy, and simplicity. Journal of Management Studies, 30,
553-85.
Miller, D. & Friesen, P.H. (1986), Porter's generic strategies and performance: an
empirical examination with American data. Part I: testing porter. Journal of
Management Studies, 7, 37-55.
Mungai, M.A. (2006), Competitive strategies adopted by mainstream daily print media
firms in Kenya. (Unpublished MBA Research Project). University of Nairobi,
Nairobi.
Murage, S. (2001), Competitive strategies adopted by members of the Kenya independent
petroleum dealers association. (Unpublished MBA Research Project).
University of Nairobi, Nairobi.
Murdoch, A. (1999), Future indicative. Accountancy, 123(1270), 48-9.
Murray, A.I. (1988), A contingency view of Porter's generic strategies. Academy of
Management Review, 13(3), 390-400.
Mwakundia (2006), Competitive strategies applied by commercial colleges in Nairobi
CBD. (Unpublished MBA Research Project). University of Nairobi, Nairobi.
Namada, M. (2004), Competitive strategies adopted by small scale enterprises in
exhibition halls in Nairobi. (Unpublished MBA Research Project). University of
Nairobi, Nairobi.
51
Ndubai, N. (2003), Competitive strategies applied by retail sector of the pharmaceutical
industry in Nairobi. (Unpublished MBA Research Project). University of
Nairobi, Nairobi.
Niemira, M.P. (2000), Can Japan compete? Barron's, 80(49), 57-8.
Njoroge, J. (2006), Competitive strategies adopted by LPG marketers in Kenya to cope
with competition. (Unpublished MBA Research Project). University of Nairobi,
Nairobi.
Obado (2005), Competitive strategies employed by the sugar manufacturing firms in
Kenya. (Unpublished MBA research project). University of Nairobi, Nairobi.
Ogolla, M.A. (2005), Application of porter’s strategies by insurance companies in
Kenya. (Unpublished MBA Research Project). University of Nairobi, Nairobi.
Okal, L.D. (2006), Competitive strategies adopted by NGOs dealing with HIV/AIDS in
Kenya to cope with increased competition for funding. (Unpublished MBA
Research Project). University of Nairobi, Nairobi.
Parker, B. & Helms, M.M. (1992), Generic strategies and firm performance in a declining
industry. Management International Review, 32(1), 23-29.
Pharmacy and Poisons Board (2012). Porter, M.E. (1980), Competitive Strategy. Free Press, New York, NY.
Porter, M. (1985), Competitive Advantage Creating and Sustaining Superior
Performance. Free Press, New York, NY.
Porter, M. (1987), From competitive advantage to corporate strategy. Harvard Business
Review, May/June, 43-59.
52
Porter, M. (1996), What is strategy? Harvard Business Review, November/December, 61-
78.
Rajecki, R. (2002), What's your brand? Contracting Business, 59(3), 40.
Richardson, O. & Dennis, C. (2003), UK vineyards sector case study: analysis of retail
activities using exemplar strategic marketing tools. British Food Journal,
105(9), 634.
Ross, D.N. (1999), Culture as a context for multinational business: a framework for
assessing the strategy-culture ‘fit’. Multinational Business Review, 7(1), 13-19.
Saunders, J. & Wong, V. (1985), In search of excellence in the UK. Journal of Marketing
Management, 1, 119-137.
Seth, A. & Thomas, H. (1994), Theories of the firm: implications for strategy research.
Journal of Management Studies, 31(2), 165-91.
United Nations Industrial Development Organization. (2010), Pharmaceutical sector
profile: Kenya. Vienna, Austria: Shahid, H. & Wanyanga, W.
Spanos, Y.E., Zaralis, G. & Lioukas, S. (2004), Strategy and industry effects on
profitability: evidence from Greece. Strategic Management Journal, 25(2), 139.
Stone, M. (1995), Strategic development related to Europeanization of UK logistics and
distribution service suppliers. European Business Review, 95(5), 9-14.
Surowiecki, J. (1999), The return of Michael Porter. Fortune, 139(2), 135-138.
Suutari, R. (1999), Tale of two strategies. CMA Management, 73(6), 12-13.
Sy, D. (2002), The view from Taft. Businessworld, 2, 1.
Theuri (2003), Competitive strategies adopted by branded fast food chains in Nairobi.
53
(Unpublished MBA Research Project). University of Nairobi, Nairobi.
Thompson, A. & Strickland, A. (1998), Crafting and Implementing Strategy. Irwin
McGraw-Hill, New York, NY.
Troy, M. (2002), Below the surface lies a discount core. DSN Retailing Today, 41(7), 57.
Tuminello, R. (2002), The psychology of client selection. Northwest Construction, 5(2),
14.
Venu, S. (2001), India: competitive advantage: alternative scenarios. Businessline, 12, 1.
Walker, O.C. & Ruekert, R.W. (1987), Marketing's role in the implementation of
business strategies: a critical review and conceptual framework. Journal of
Marketing, 51, 15-33.
White, R.E. (1986), Generic business strategies, organizational context, and performance:
an empirical investigation. Strategic Management Journal, 7(2), 217-231.
Wright, P. (1987), A refinement of Porter's strategies. Strategic Management Journal,
8(1), 93-101.
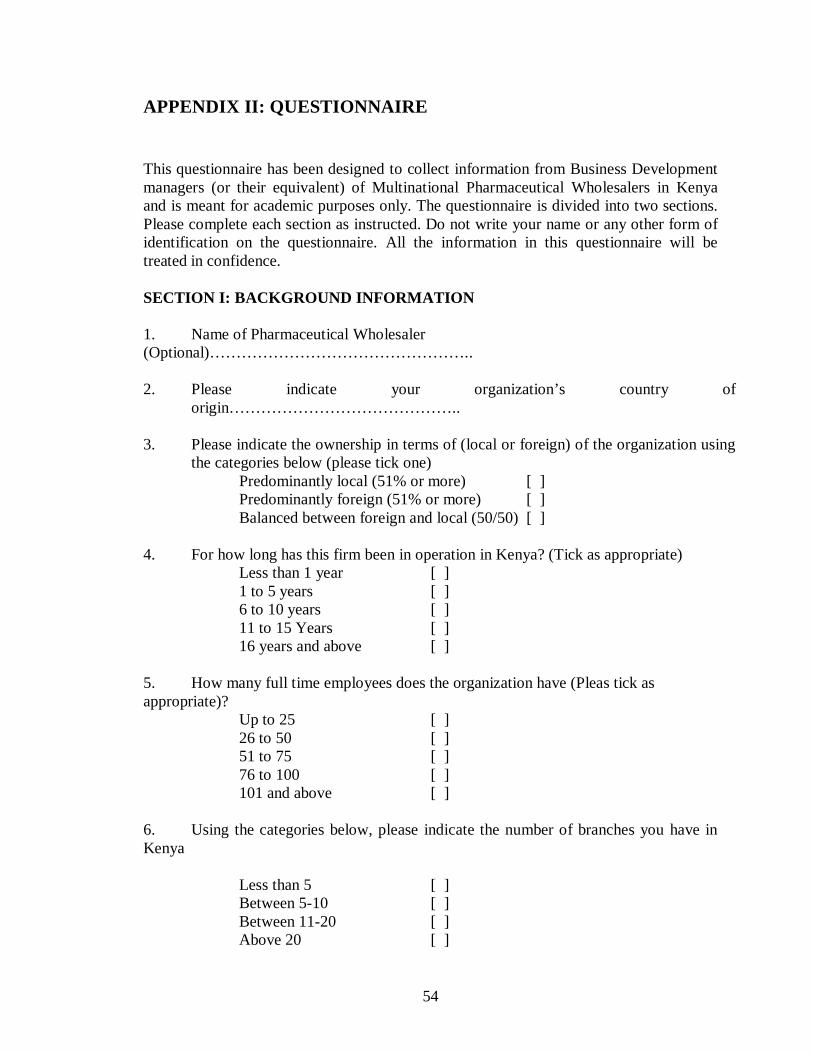
54
APPENDIX II: QUESTIONNAIRE
This questionnaire has been designed to collect information from Business Development managers (or their equivalent) of Multinational Pharmaceutical Wholesalers in Kenya and is meant for academic purposes only. The questionnaire is divided into two sections. Please complete each section as instructed. Do not write your name or any other form of identification on the questionnaire. All the information in this questionnaire will be treated in confidence. SECTION I: BACKGROUND INFORMATION 1. Name of Pharmaceutical Wholesaler (Optional)………………………………………….. 2. Please indicate your organization’s country of
origin…………………………………….. 3. Please indicate the ownership in terms of (local or foreign) of the organization using
the categories below (please tick one) Predominantly local (51% or more) [ ]
Predominantly foreign (51% or more) [ ] Balanced between foreign and local (50/50) [ ] 4. For how long has this firm been in operation in Kenya? (Tick as appropriate) Less than 1 year [ ] 1 to 5 years [ ] 6 to 10 years [ ] 11 to 15 Years [ ] 16 years and above [ ] 5. How many full time employees does the organization have (Pleas tick as appropriate)? Up to 25 [ ] 26 to 50 [ ] 51 to 75 [ ] 76 to 100 [ ] 101 and above [ ] 6. Using the categories below, please indicate the number of branches you have in Kenya Less than 5 [ ] Between 5-10 [ ] Between 11-20 [ ] Above 20 [ ]
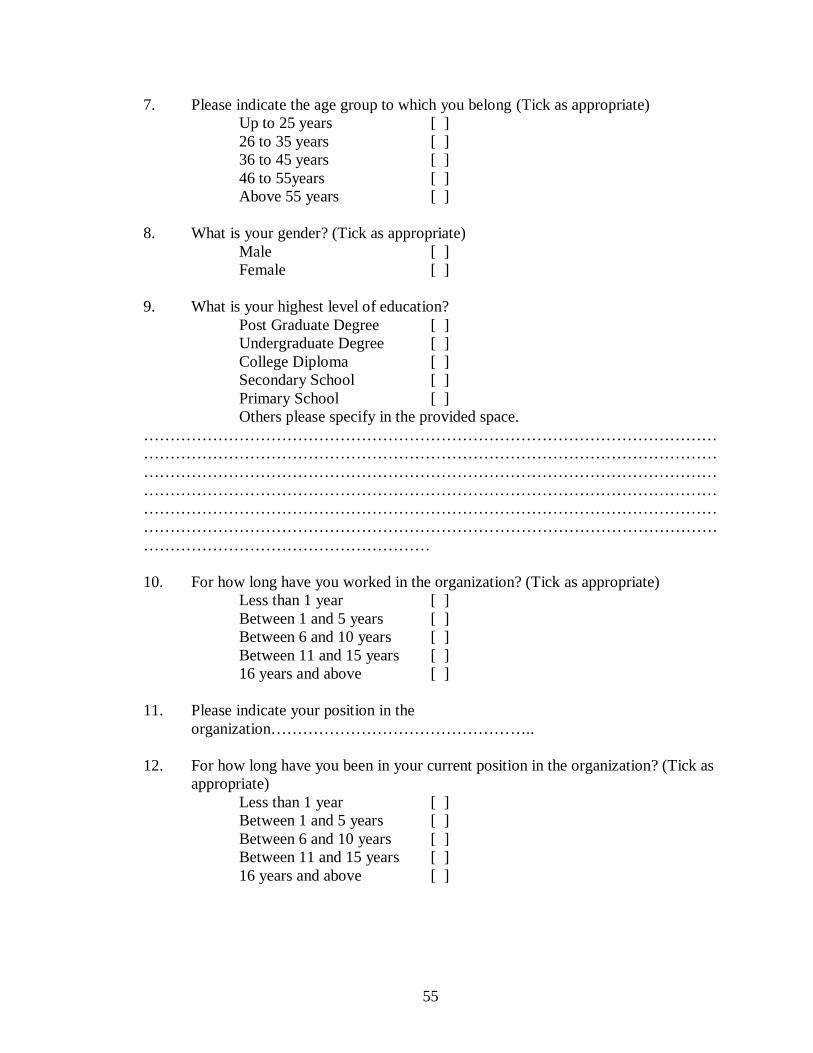
55
7. Please indicate the age group to which you belong (Tick as appropriate) Up to 25 years [ ] 26 to 35 years [ ] 36 to 45 years [ ] 46 to 55years [ ] Above 55 years [ ] 8. What is your gender? (Tick as appropriate) Male [ ] Female [ ] 9. What is your highest level of education? Post Graduate Degree [ ] Undergraduate Degree [ ] College Diploma [ ] Secondary School [ ] Primary School [ ] Others please specify in the provided space. ……………………………………………………………………………………………………………………………………………………………………………………………………………………………………………………………………………………………………………………………………………………………………………………………………………………………………………………………………………………………………………………………………………………………………………………………………………………………………………… 10. For how long have you worked in the organization? (Tick as appropriate) Less than 1 year [ ] Between 1 and 5 years [ ] Between 6 and 10 years [ ] Between 11 and 15 years [ ] 16 years and above [ ] 11. Please indicate your position in the
organization………………………………………….. 12. For how long have you been in your current position in the organization? (Tick as
appropriate) Less than 1 year [ ] Between 1 and 5 years [ ] Between 6 and 10 years [ ] Between 11 and 15 years [ ] 16 years and above [ ]
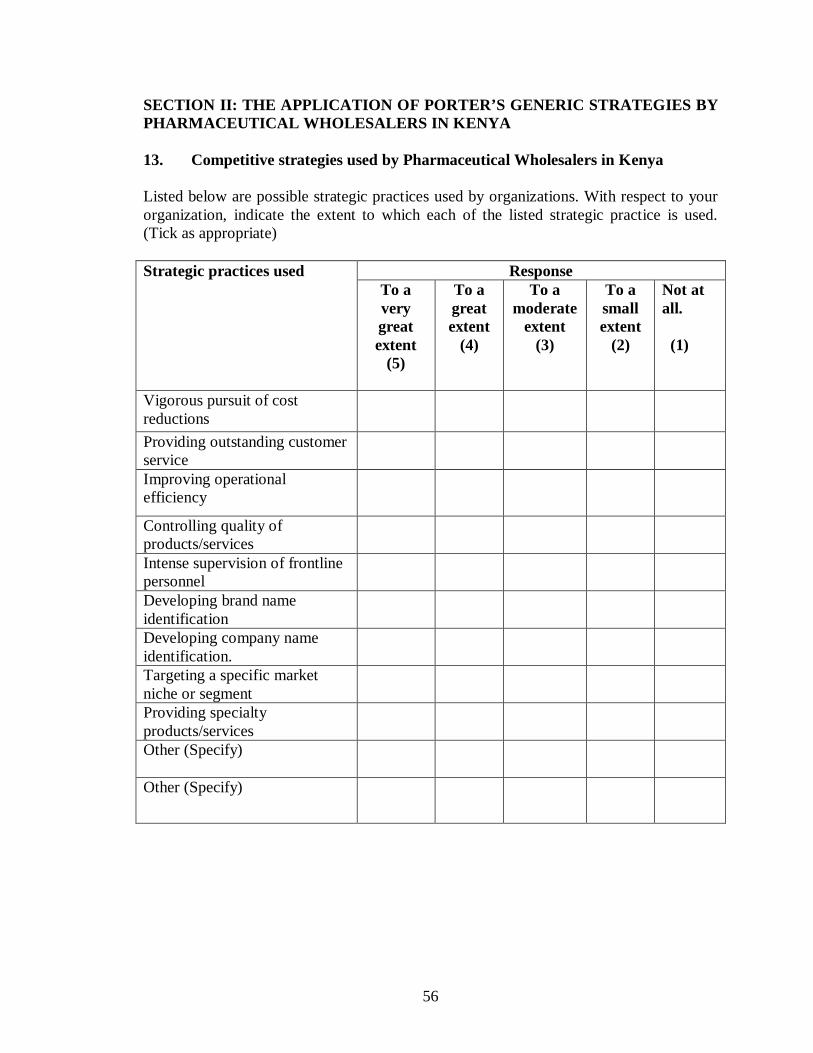
56
SECTION II: THE APPLICATION OF PORTER’S GENERIC STRATEGIES BY PHARMACEUTICAL WHOLESALERS IN KENYA 13. Competitive strategies used by Pharmaceutical Wholesalers in Kenya Listed below are possible strategic practices used by organizations. With respect to your organization, indicate the extent to which each of the listed strategic practice is used. (Tick as appropriate) Strategic practices used Response
To a very great extent
(5)
To a great extent
(4)
To a moderate
extent (3)
To a small extent
(2)
Not at all. (1)
Vigorous pursuit of cost reductions
Providing outstanding customer service
Improving operational efficiency
Controlling quality of products/services
Intense supervision of frontline personnel
Developing brand name identification
Developing company name identification.
Targeting a specific market niche or segment
Providing specialty products/services
Other (Specify)
Other (Specify)
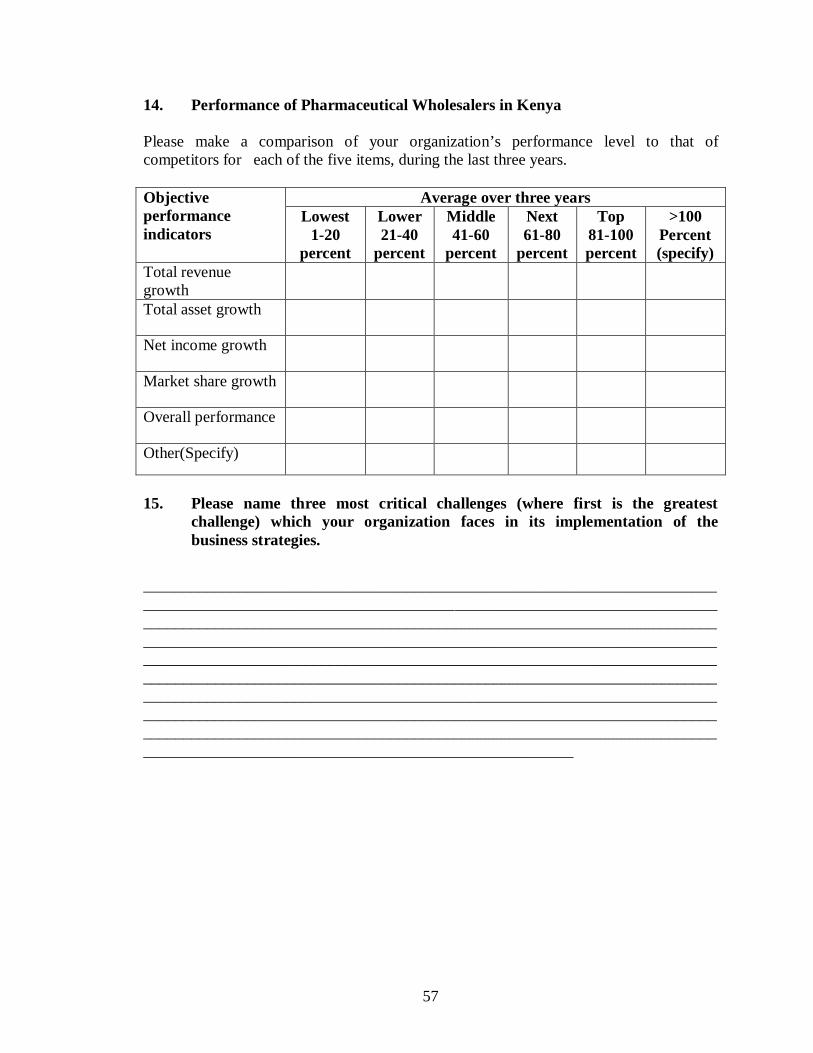
57
14. Performance of Pharmaceutical Wholesalers in Kenya Please make a comparison of your organization’s performance level to that of competitors for each of the five items, during the last three years. Objective performance indicators
Average over three years Lowest
1-20 percent
Lower 21-40
percent
Middle 41-60
percent
Next 61-80
percent
Top 81-100 percent
>100 Percent (specify)
Total revenue growth
Total asset growth
Net income growth
Market share growth
Overall performance
Other(Specify)
15. Please name three most critical challenges (where first is the greatest
challenge) which your organization faces in its implementation of the business strategies.
______________________________________________________________________________________________________________________________________________________________________________________________________________________________________________________________________________________________________________________________________________________________________________________________________________________________________________________________________________________________________________________________________________________________________________________________________________________________________________________________________________________________________________________________
Related Documents