The Application of Multiple Antibiotic Resistance Profiles of Coliforms to Detect Sources of Bacterial Contamination of the Anacostia River Final Report Submitted to DISTRICT OF COLUMBIA WATER RESOURCES RESEARCH INSTITUTE By: Dr. David W. Morris Associate Professor Department of Biological Sciences George Washington University May 2011

Welcome message from author
This document is posted to help you gain knowledge. Please leave a comment to let me know what you think about it! Share it to your friends and learn new things together.
Transcript

The Application of Multiple Antibiotic Resistance Profiles
of Coliforms to Detect Sources of
Bacterial Contamination of the Anacostia River
Final Report
Submitted to
DISTRICT OF COLUMBIA WATER RESOURCES RESEARCH INSTITUTE
By:
Dr. David W. Morris
Associate Professor
Department of Biological Sciences
George Washington University
May 2011
Abstract
The Anacostia River in Washington, DC has been burdened with the problem of an estimated
2,142 million gallons of sewage overflow per year. Our study is part of a year-long investigation
to identify major sources of fecal pollution in the District of Columbia from both combined
sewage outlet (CSO) sites and non-point sources (NPS). This project has involved the training
and active participation of a least 84 undergraduate students in four classes. Samples were
obtained from the outflow of CSOs located in the District from the Northeast Boundary to the
Douglass Bridge following precipitation events. The presence of Escherichia coli and other
coliforms were confirmed and differentiated from other known enteric bacteria using
characterization media. Isolates were tested for MAR using a panel of drugs commonly
prescribed in clinical and agricultural practice. To determine antibiotic resistance patterns, a two-
sided test of binomial proportion and Euclidian metric analysis were used. Isolates from all CSO
sources showed significantly greater resistance and higher MAR indices than the NPS sites
(p<0.05). The highest MAR indices were obtained from outflows from CSO sites 14, 16, 17, 18
and 19. MAR testing has proved to be a quick and reliable measure of identifying the source of
fecal contamination and have clearly shown that multiple drug resistance (MDR) fecal coliforms
are associated with CSO overflows. Ultimately, our study will provide a comprehensive ―before
and after‖ assessment of fecal contamination in the watershed as projected revitalization
continues. The continuation of this study is focused on determining antibiotic resistance transfer
to environmental sources of E. coli, Enterobacter spp. and non-coliform enteric bacteria such as
Salmonella spp., as well as the impact of MDR organisms and their long-term presence in the
watershed. Many isolates were identified as possible Extended-Spectrum β-Lactamase (ESBL)-
producing bacteria based on their resistance to cephalosporin drugs and aztreonam. Others were
resistant to the new fluoroquinoline antibiotics. These studies point to the critical need to hasten
current efforts for the rehabilitation of the river.
Introduction
The Anacostia River is an urban tributary in a highly industrial surrounding, making it a
dynamic and unique environment in which to study fecal pollution. It flows approximately 8.5
miles from Prince George’s County, Maryland through Washington, D.C., before finally joining
the Washington Canal and emptying into the Potomac River. Its watershed covers 176 square
miles and contains 13 sub-watersheds. Although encompassed by parkland, the Anacostia is
heavily polluted from sediment, toxins, pathogens, and trash (1,2). Public health risks can
originate from sewage drainage directly into the river and is caused by fecal coliform bacteria
and other pathogens found in the untreated wastewater. The harmful microbes debilitate water
quality and create hypoxic conditions, leading to large-scale fish death and deterioration of the
local wild-life (2,3). Water pollution is further compounded by the disrepair of the D. C.

combined sewage outlet (CSO) system, much of which dates back to the early nineteenth century
(4).
The CSO system carries water runoff and human waste to treatment facilities; however,
problems occur when excessive rainfall overwhelms the internal barrier keeping the water runoff
and sewage waste separated. When this occurs, wastewater is directed from sewage lines into the
river. CSO’s account for an estimated 73% of the average annual increase of fecal coliform
bacteria along the D. C. region of the Anacostia River, amounting to 348,000 billion Most
Probable Number (MPN) fecal coliforms per year (4,5). Washington Suburban Sanitary
Commission (WSSC) estimates 75 overflows occur each year, releasing 2,142 million gallons of
untreated water into the environment (6).
Fecal coliforms have frequently been surveyed as indicators of the potential presence of
human enteric pathogens. Indeed, standards for the District of Columbia are based upon the
detection of fecal coliforms (7), although other indicator bacteria, such as the fecal streptococci
(reclassified as Enterococcus) are favored by other studies (8). Fecal coliforms are gram-
negative bacilli able to ferment lactose at elevated temperatures and include species such as
Escherichia coli and Klebsiella pneumoniae (9). Furthermore, the presence of antibiotic resistant
coliforms in water samples is a strong indicator of fecal pollution from animal and/or human
sources. Recent studies have shown major sources of fecal water pollution can be determined by
conducting a Multiple Antibiotic Resistance (MAR) analysis (8,10,11)., or as it is now frequently
called Antibiotic Resistance Analysis (ARA). MAR is used to differentiate fecal E. coli (and
occasionally enteroococci) from different loci by assessing the resistance profiles from bacterial
isolates using antibiotics employed for human therapy and livestock maintenance (12,13). The
underlying principle is that bacteria in the GI tracts of humans and animals are subjected to
different types and dosages of antibiotics which select for flora with specific resistance profiles,
or ―fingerprints‖ (12). MAR analysis includes both library-dependent and non-library-dependent
approaches for studying and tracking the sources of microbial pollution (called Bacterial Source
Tracking, or BST). Each strategy has it own advantages and disadvantages. Several studies, for
example, have focused on comparing MAR profiles of Enterococcus isolates to known source
libraries for tracking bacterial pollution (14). Our approach, on the other hand, has been to use
the non-library approach which has offered more rapid results which are useful where human

health hazards are suspected (15), Few studies have been carried out to determine the variance
of MAR profiles of fecal coliforms in this tributary; therefore, our research links pollution-
derived coliform levels, antibiotic resistance in mid-summer water samples, and suggests
transference of resistance between human and/or animal-derived and natural-source coliforms.
This project, above all, has been designed to train undergraduate students in some of the currents
methods used to monitor microbial contamination of the nation’s waterways and particularly to
focus their attention on the remediation efforts for the Anacostia River. Thus, the work described
here has been carried out, and in some cases designed, by undergraduate students in our program.

Methods and Materials
The materials and methods used in the research have not differed substantially from the proposal
although slight modifications in the proposed procedure have been necessary. While general
methods are presented here, a short manual for student instruction was prepared and is presented
in Appendix A..
Collection of Samples: CSO sites along the Anacostia River between the 11th
Street Bridge and
the East Capitol Bridge were chosen for MAR analysis. These sites drain both residential (84%)
and mixed commercial areas (16%). In addition, all sampled CSO sites experience overflows
during minimal (0.1-0.5 inches) rainfall (6). The non-point source (NPS) samples were collected
mid-stream at the M Street Railroad Bridge. Approximately 1 liter of water was collected from
each site on June 30th
2010, in duplicate, at each area immediately following a high flow storm
event. The samples were stored in sterile plastic collection bottles (Fisher Scientific) at 4oC and
were analyzed 24 hours later.
Figure 1: CSO sites on the Anacostia River sampled during this investigation (6)

Isolation, Enumeration, and Identification of Fecal Coliforms: Fecal coliform contamination in
each sample was assessed initially by using the Standard Method Analysis recommended by the
American Public Health Association (APHA) (16). This method estimates the MPN of fecal
coliforms using a standard assay and expressed as MPN /100 mL of water sample. Individual
colonies of fecal isolates were obtained based upon sample MPN results: coliform–confirmed
water samples were filtered through 0.2 m pore-sized nitrocellulose filters and the filters
incubated on MacConkey Agar plates at 37oC for 48 hours. Lactose-fermenting colonies were
further analyzed by replica-plating on Eosin-Methylene Blue, Desoxycholate and Hektoen
Enteric agar plates to confirm the isolation of fecal E. coli. Fecal coliform isolates were then
plated onto antibiotic inoculated LB media and scored according to their resistances to each in
order to generate MAR data.
MAR Analysis: The MAR value for a given organism or source relies upon the specific panel of
antibiotics which are used for testing. MAR indices were determined using similar patterns to
those employed by Kasper, et al (15). Isolates confirmed as fecal coliforms were tested for
antibiotic resistance on drug-infused LB agar plates of several different antibiotics used for
clinical therapy in humans and prophylactic use in livestock (Table 1). Isolates were replica-
plated from master plates to each of the antibiotic plates and incubated at 37oC for 18 to 24
hours. Isolates were recorded as resistant to an antibiotic if ≥80% colonial growth was observed.
The MAR index for each isolate was calculated using the following relationship: number of
antibiotics to which the isolate was resistant / number of antibiotics tested. MAR indices for
each sample site were calculated as the number of antibiotics to which all isolates were resistant /
(number of antibiotics tested x number of isolates inoculated per site) (15). Significant
differences between antibiotic resistance patterns at each site were determined by a two-sided
test of binomial proportion (p<0.05). Inter-isolate relationships were examined by converting the
data to binary code and analyzed by a Euclidian metric, average linked method (DendroUPGMA
Program)(12,17).
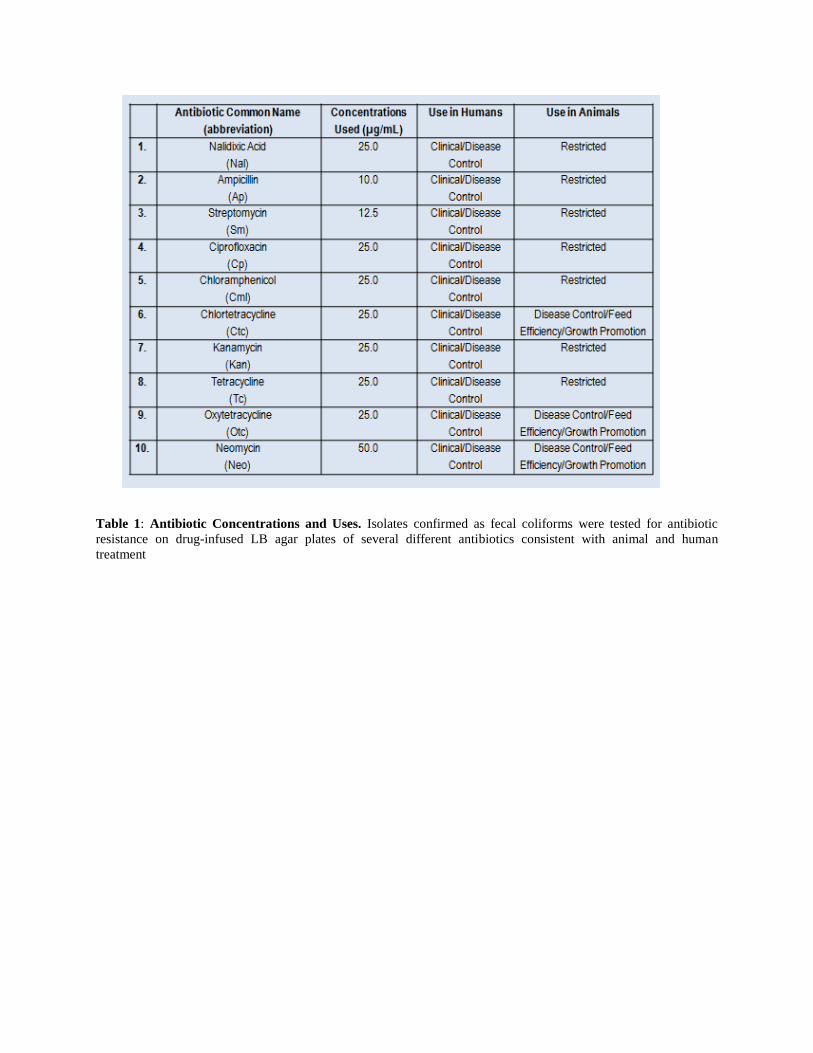
Table 1: Antibiotic Concentrations and Uses. Isolates confirmed as fecal coliforms were tested for antibiotic
resistance on drug-infused LB agar plates of several different antibiotics consistent with animal and human
treatment

Results and Discussion
Undergraduate involvement in the project (individual and class) commenced in late
summer 2010 and carried into spring 2011. Two classes were presented with group projects
involving some aspect of the work. The first was: ―Do We Need Biotechnology?, a part of the
Dean’s Seminar Series and is attended exclusively by freshmen (science and non-science
majors). This year’s class, held in the fall of 2010, constituted 18 students, only two of whom
were from the D.C. area. The second class was Introductory Microbiology (BiSc 2237 and BiSc
2237W), designed for upper-level undergraduates (juniors and seniors,), which was held in fall
2010 and spring 2011. Each class contained 32 students. Including all participating
undergraduate students conducting individual research projects in the laboratory, a total of 84
undergraduates have been actively involved in the water monitoring project. Class work and
laboratory exercises relevant to the project included water sampling and testing, determination of
fecal coliforms by APHA-recommended procedures (Most Probable Number (MPN) and water
filtration techniques), isolation, enumeration and characterization of enteric bacteria (Escherichia
coli, Enterobacter, Salmonella spp., and Shigella spp.) from water and fecal samples, MAR
analysis and plasmid DNA isolation procedures.
Comparison of Multiple-Antibiotic-Resistance (MAR) Profiles of fecal
Escherichia coli at CSO Sites 17 and 18 and a Non-Point Source on the
Anacostia River
CSO17 and CSO 18 along the Anacostia River were sampled for this study in the early
fall of 2010. Both sites lie between the 11th
Street Bridge and the Sousa Bridge. Samples of
approximately 1 liter of water were collected three times at each area in September of 2011. The
non-point source (NPS) samples were obtained mid-stream near the John Philip Sousa Bridge.
The water samples were analyzed as described previously. Briefly, water samples were filtered
through a 0.2 m pore-sized nitrocellulose filters, the filters were then placed on Desoxycholate
Agar and further differentiated on MacConkey and Hektoen Enteric Agars. Each plate was
incubated at 42.5°C. Suspected fecal E. coli isolates were plated on a grid for subsequent MAR
analysis. MAR indices were determined by the method of Kaspar et al. (15). Isolates were
identified as antibiotic-resistant if growth was identical to that on the MH plate without
antibiotics. In comparison to the control plate, if the growth of bacterial colonies of an isolate

was reduced by 20% or more, then the sample was marked as sensitive to the antibiotic. MAR
indices for each sample site were calculated as the number of antibiotics to which all isolates
were resistant / number of antibiotics tested x number of isolates inoculated per site. Antibiotic
resistance patterns at each site were determined by a two-sided test of binomial proportion
(p<0.05)(15).
The results indicated that isolates from both CSO sites showed significantly greater
resistance (p<0.001) and higher MAR indices than the NPS sites, with an average MAR index of
0.36±0.04. In contrast, NPS isolates exhibited resistance with an average MAR index of
0.07±0.04 (Figures 2 and 3).
Figure 2: Multiple antibiotic resistance testing for both non-point and point sources. From left to right the bars
represent the MAR frequency (number of antibiotic resistant isolates / total number of antibiotics tested), the percent
of resistant isolates, and the percent of isolates that had resistances to three or more antibiotics. PS (green bars); NPS
(blue bars).
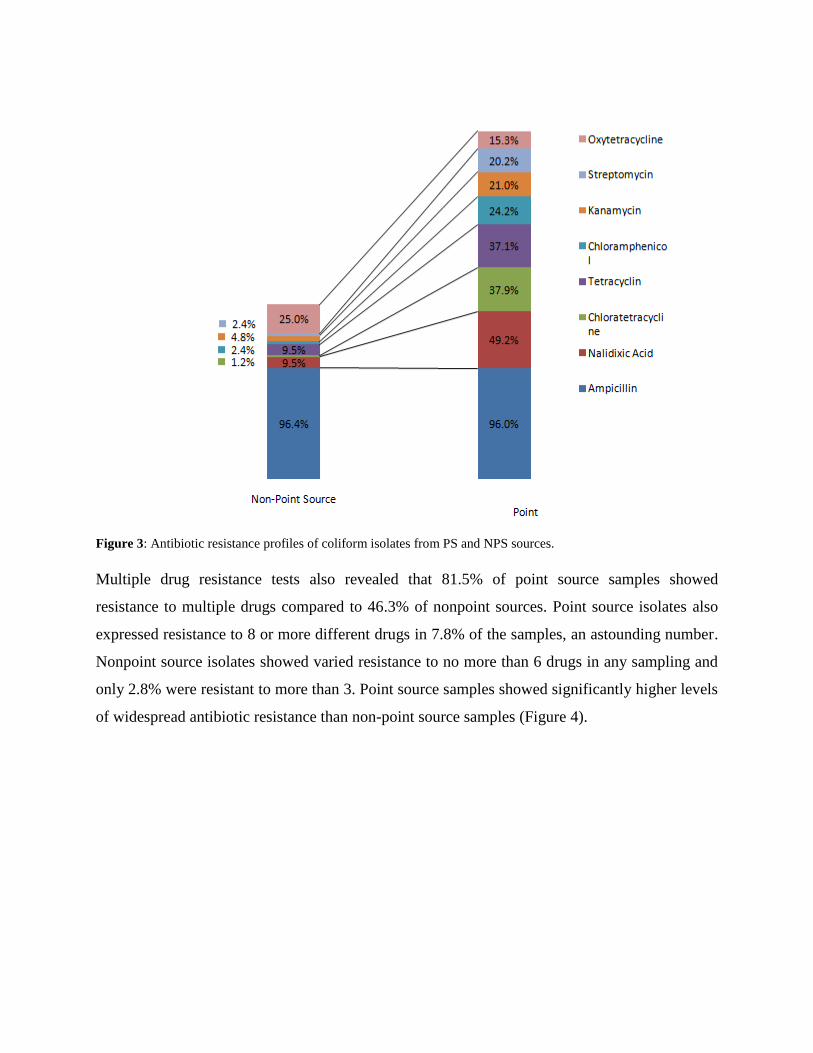
Figure 3: Antibiotic resistance profiles of coliform isolates from PS and NPS sources.
Multiple drug resistance tests also revealed that 81.5% of point source samples showed
resistance to multiple drugs compared to 46.3% of nonpoint sources. Point source isolates also
expressed resistance to 8 or more different drugs in 7.8% of the samples, an astounding number.
Nonpoint source isolates showed varied resistance to no more than 6 drugs in any sampling and
only 2.8% were resistant to more than 3. Point source samples showed significantly higher levels
of widespread antibiotic resistance than non-point source samples (Figure 4).

Figure 4: A comparison of the number of antibiotics each isolate was resistant to. Numbers on the x-axis represent
the number resistances that each isolate had and the y-axis represents the number of isolates.
The MAR values and patterns of the PS isolates were similar to fecal E. coli isolates
recovered from raw sewage samples in the D.C. metropolitan area, strongly indicating that
multiple drug resistant (MDR) E. coli are being directly deposited into the river from these CSO
overflows. This portion of the study was carried out by students of the Dean’s Seminar Class (Do
We need Biotechnology? It was presented as a poster for the George Washington Research Day
in March 2011 and later at the Undergraduate Research Symposium in April where it won first
prize. The full poster is shown in Appendix B.

Using Multiple Antibiotic Resistance (MAR) Analysis to Identify CSOs as
Sources of Fecal Escherichia coli Contamination on the Anacostia River
More extensive studies were carried out by undergraduate students engaged in individual
research projects in the laboratory throughout the summer and fall of 2010, and continued into
the new year. Five CSO sites along the Anacostia River between the 11th
Street Bridge and the
East Capitol Bridge (CSO’s 14, 16, 17, 18 and 19) were chosen for MAR analysis. All sites drain
both residential (84%) and mixed commercial areas (16%). In addition, all sampled CSO sites
experience overflows during minimal (0.1-0.5 inches) rainfall. The non-point source (NPS)
samples were collected mid-stream at the M Street Railroad Bridge. The MAR Index values for
all CSO’s calculated an average of 52%, significantly higher than the NPS samples calculated at
16% (p<0.05). This indicates that the CSO’s are major point sources for contamination by fecal
E. coli. In addition, CSO isolates showed much higher resistance to combinations of antibiotics
than NPS isolates. No significant differences in MAR indexes were calculated between each of
the CSO sites (p=0.85); however, all CSO sites showed a significant difference with the NPS site
(p<0.05). 98% of isolates from CSO sites were resistant to one or more antibiotics. 83% of
isolates from mid-stream samples were resistant to one or more antibiotics. Most importantly,
the majority of E. coli isolates from CSO sources were resistant to three or more antibiotics.
Table 2 MAR and MDR Index Percent Values for CSO Sites. No significant differences in MAR indexes were
calculated between each of the CSO sites (p=0.85); however, all CSO sites showed a significant difference with the
NPS site (p<0.05). 98% of isolates from CSO sites had resistance to one or more antibiotics. 83% of isolates from
mid-stream samples were resistant to one or more antibiotics.
Comparative antibiotic resistance profiles of CSO sites showed no significant differences
for ampicillin, ciprofloxacin, streptomycin and chlortetracycline resistances. However, isolates
from the downstream CSO14, CSO16 and CSO17 sites showed significantly more resistance to
naladixic acid, tetracycline and oxytetracycline. Upstream CSO18 and CSO19 isolates showed

significantly more resistance to chloramphenicol. Profiles of isolates from mid-stream (NPS)
samples showed similar levels for ciprofloxacin and ampicillin resistances to CSO isolates only.
More diverse patterns of antibiotic resistance were seen in the CSO isolates compared to the NPS
source. 43 different resistance patterns were seen collectively in the CSO isolates compared to 8
patterns seen in the NPS isolates. These results are shown in detail on the poster display in
Appendix C. This presentation was made at the Maryland Water Monitoring Council Conference
in Baltimore, Maryland, in November 2010.
Extensive studies were also undertaken on samples obtained from CSO sites 5, 6 and 7
(at the Fort Stanton area on the south-eastern bank of the Anacostia River). MAR and MDR
index percent values for each of these CSO sites (27.8%) was significantly lower than for CSO
sites 14, 16, 17, 18 and 19 (p<0.05) but significantly higher than NPS values (p<0.05). Low
MAR percent index values were also obtained for CSO 8 (20.5 ) and CSO 9 (20.7%).
Overall, our studies indicated that CSO sites, 14, 16, 17, 18 and 19 contribute a
significantly greater load of fecal E. coli contaminants to the Anacostia River during CSO
overflows than the other CSO sites examined in this study. The E coli isolates from the Navy
Yard and North-East Boundary sites also show a wider variation in antibiotic resistance patterns.
One explanation for this wide variation may be due to the exchange of R-factors carried on
conjugative R-plasmids. It has been shown that plasmid transference readily occurs among fecal
coliforms in the microbial milieu of mammalian GI systems and in stagnant bodies of wastewater
(18,19). WSSC has reported that the D. C. region of the Anacostia River is a stagnant water body
with a long resting time in these urbanized areas that favors such exchange (5). Consequently,
the sluggish flow of the river does not allow for effective aeration of the water. Low O2
saturation levels as well as high water temperatures likely favor the survival of facultatively
anaerobic coliforms, resulting in genetic exchange between particularly virulent microbes and
those occurring naturally within the environment (20,21). Future work will focus on these and
other CSO sites this summer to confirm the consistency of our results.
There is an effort to remediate the Anacostia River and the watershed that supplies it.
However, an aging city sewage system is likely to maintain the current high levels of fecal
coliform contamination in the river. Any serious effort to improve the condition of the Anacostia

must be accompanied by careful monitoring of bacterial populations. We believe that using
MAR profiles of selected sites on the Anacostia River (CSO and NPS), as we have described
here, may be a useful and simple tool for monitoring the rehabilitation of the CSO system.
Studying the Antibiotic “Resistome” of the Anacostia Watershed
It is generally understood that, due to the overwhelming proliferation of antibiotic
resistant bacteria, we are now living in a ―Post-Antibiotic Era‖ (22). Microbial resistance to
antibiotics now spans all known classes of both naturally-produced substances as well as
chemically-synthesized compounds. D’ Costa and others (23,24) have argued that studying
reservoirs of antibiotic resistant bacteria (in biotic and abiotic sources) could provide an early
warning system for the potential transfer of antibiotic resistance genes to clinical isolates.
Equally possible is the transfer of resistance genes from clinical pathogens to naturally occurring
bacterial populations. It seemed logical, therefore, to extend our work into investigating the
MAR spectra of fecal bacteria found in the human and animal sources which contribute to the
contamination of the Anacostia River and its watershed.
In these studies, we extended the range of antibiotics used for antibiotic resistance
analysis to take into account recent studies which point to new patterns of antibiotic resistance
acquisition by enteric bacteria which constitute a public health threat. The additional antibiotics
included cefoxitin, aztreonam, piperacillin, oflaxacin and nitrofurantoin. The emergence of
resistance to expanded-spectrum cephalosporins has been a major concern and is due to the
production of Extended-Spectrum Beta-Lactamases (ESBLs)(25). ESBLs confer resistance to
many cephalosporin antibiotics, such as cefoxitin, and related oxyimino-β lactams, such as
aztreonam (26). This latter antibiotic is primarily administered intramuscularly due to its
inability to pass through the digestive tract unaltered. Resistance to piperacillin, another extended
spectrum β-lactam antibiotic, has also raised concerns (27). Dug resistant E. coli have been
identified in sewage and sludge specimens in Austria and Spain, and recently seen in enteric
bacteria isolated from avian sources in Spain and South Africa (28). ESBLs are frequently
encoded by plasmid-borne genes. These plasmids responsible for ESBL production frequently
carry genes encoding resistance to other drug classes (i.e., aminoglycosides)(29). Resistance to
ofloxacin, a second-generation fluoroquinolone, which has been associated with clinical strains
of Mycobacterium tuberculosis, and has now been noted in among enteric isolates, including E.
coli (27), In addition, we incorporated nitrofurantoin which is often used to combat urinary tract
infections caused by E. coli. Rates of resistance to nitrofurantoin in the United States have, until

recently, remained low (0.4 to 0.8%) but clinical isolates resistant to the antibiotic have
increasingly appeared over the past few years (30).
MAR Profiles of Coliform and Non-Coliform Bacteria from the Anacostia River and some
of its Tributaries in the Anacostia Watershed. Initial results suggest that resistances to some
of these ―second generation‖ antibiotics in fecal coliform isolates from some CSO sources are
high. For example, in a survey of E. coli isolates from CSO 5, 6 and 7, out of a total of 384
individual isolates, 63% were resistant to cefoxitin, 63% to nitrofurantoin and 38% to aztreonam.
In a similar study on Enterobacter isolates from CSO 19, 91% were resistant to aztreonam, and
39% to nitrofurantoin; all isolates were resistant to cefoxitin and streptomycin (total 128
isolates). Major patterns of antibiotic resistance are shown in Table 4 below: over half of the
isolates (54%) were resistant to the combination aztreonam-cefoxitin-streptomycin.
RESISTANCE PATTERN PERCENT ISOLATES
Az-Ce-St 54
Az-Cef-St-Nf 26.5
Ce-St 15.6
Ce-Sm-Nf 3.1
Table 4: Major resistance patterns seen in Enterobacter isolates from CSO 19. Az: aztreonam; Ce: cefoxitin; St:
streptomycin; Nf: nitrofurantoin.(n=128.)
MAR Profiles of Enteric Bacteria Isolated from Human Sources. E. coli, Enterobacter and
Salmonella spp. were isolated from individual human fecal samples and raw sewage obtained in
the vicinity of CSO 19. Isolates were characterized and identified by standard microbiological
procedures before being plated onto a grid for subsequent MAR analysis. MAR indices and
resistance patterns from individual samples varied considerably; however, sewage isolates
exhibited very high MAR indices (>90%) and a wide range of multiple drug resistance patterns.
Although this part of the project is still in the preliminary stages, one study on Salmonella spp.
isolates from raw sewage taken from a sampling point near CSO 19, found that the major
resistance pattern was Az-Ce-St, which has also been found in Enterobacter isolates from CSO
19 (see Table 4 above). Over 15% of the resistant isolates carried resistances to 9 of the 11
antibiotics tested.
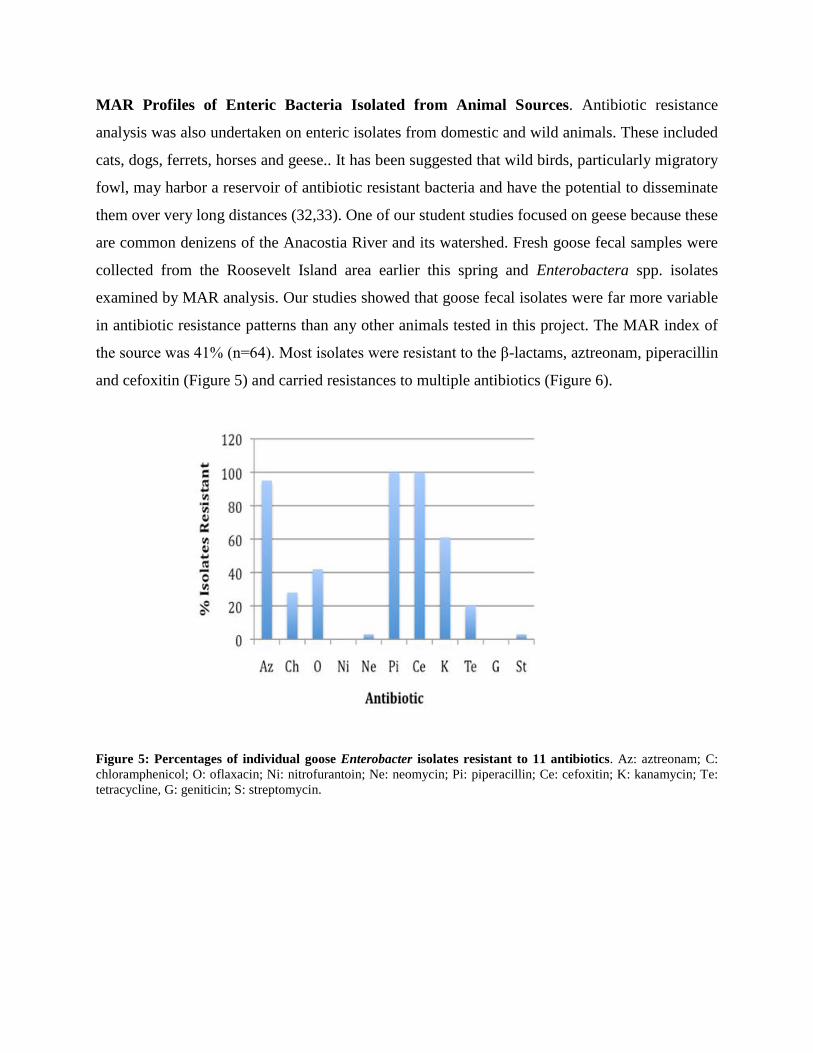
MAR Profiles of Enteric Bacteria Isolated from Animal Sources. Antibiotic resistance
analysis was also undertaken on enteric isolates from domestic and wild animals. These included
cats, dogs, ferrets, horses and geese.. It has been suggested that wild birds, particularly migratory
fowl, may harbor a reservoir of antibiotic resistant bacteria and have the potential to disseminate
them over very long distances (32,33). One of our student studies focused on geese because these
are common denizens of the Anacostia River and its watershed. Fresh goose fecal samples were
collected from the Roosevelt Island area earlier this spring and Enterobactera spp. isolates
examined by MAR analysis. Our studies showed that goose fecal isolates were far more variable
in antibiotic resistance patterns than any other animals tested in this project. The MAR index of
the source was 41% (n=64). Most isolates were resistant to the β-lactams, aztreonam, piperacillin
and cefoxitin (Figure 5) and carried resistances to multiple antibiotics (Figure 6).
Figure 5: Percentages of individual goose Enterobacter isolates resistant to 11 antibiotics. Az: aztreonam; C:
chloramphenicol; O: oflaxacin; Ni: nitrofurantoin; Ne: neomycin; Pi: piperacillin; Ce: cefoxitin; K: kanamycin; Te:
tetracycline, G: geniticin; S: streptomycin.

Figure 6: Percentage of individual goose Enterobacter isolates resistant to multiple antibiotics
19 different antibiotic resistance patterns were seen among the isolates, the most common
depicted in Table 5.
Table 5: Predominant antibiotic resistance patterns in Goose Enterobacteria. Antibiotic abbreviations are the same
as those in Figure 5.
These studies may be important for identifying sources of fecal coliform contamination
of the Anacostia River and its watershed. Geese defecate freely in and around ponds and coastal
waterways within their migration paths. Indeed, recent studies have shown that geese and gulls
carry more antibiotic resistant coliforms when they nest in urban areas, especially near waste
water, or agricultural water. Many of these isolates were found to have antibiotic resistance
profiles similar to clinical isolates (31,34), suggesting that they may be potent disseminators of
antibiotic resistance determinants (35).
0
20
40
60
80
100
1 2 3 4 5 6 7 8 9 10 11 12
% Is
ola
tes
Re
sist
ant
# of Antibiotics
% of Isolates Resistant to Indicated # of Antibiotics

Plasmid DNA Profiles of Multiple Drug Resistant Bacteria. In addition to changes in the
selection of antibiotics used for MAR analysis, plasmid DNA isolation is underway to determine
the molecular basis of multiple drug resistance seen in many bacterial isolates from CSO sites as
well as animal and human sources. It has been well-established that the wide variation seen in
antibiotic resistance, especially among Gram-negative bacteria, is due to the exchange of R-
factors carried on conjugative R-plasmids (22,24). It has been shown that plasmid transfer
readily occurs among fecal coliforms in the microbial milieu of mammalian gastro-intestinal
systems and in stagnant bodies of wastewater (18,36). Thus, it is reasonable to hypothesize that
the multiple-drug resistance profiles (particularly those which recur frequently) we see in our
isolates are a direct cause of fecal contamination by the CSO system throughout the D.C.
metropolitan area linked to shared R-plasmids. Furthermore, plasmids are easily transferred
between species of bacteria. For this reason, this study was expanded to include other bacteria
known to inhabit the intestinal tract such as Enterococcus faecalis (another indicator, in addition
to E. coli, of recent human fecal contamination [8]), E. coli O157:H7, and Enterobacter spp. (in
which the percentages of ESBL producers have risen sharply over the past few years [37]).
Additional media and other assays have allowed our students to confirm the source of fecal
contaminations, catalogue each isolate by source, and compare singular and multiple drug
resistance profiles of the various water samples (NPS and CSO) to raw fecal samples.
The first attempts at plasmid DNA isolation has begun with individual isolates of MDR
E. coli and Enterobacter spp. from water sources, and human and animal fecal samples taken in
spring 2011. Plasmid isolation was conducted as outlined by Takahashi and Nagano (38) and the
samples electrophoresed on 0.8% agarose gel for 120 minutes at 90 volts. Figures 7 shows some
of the initial results. Figure 7 shows profiles of isolates from horses (lanes 6-9) and geese fecal
samples (lanes 11-16) and human fecal samples (lanes 18-22) taken from Children’s National
Medical Center in Washington, D.C. All the horse isolates were confirmed to be cefoxitin
resistant isolates. The goose fecal samples were inconsistently drug resistant to all antibiotics
tested with no significant resistance pattern observed. Human fecal samples were unanimously
resistant to cefoxitin, piperacillin, streptomycin and tetracycline. Similar patterns of plasmid
banding (with a predominant band at ~30kbp) was observed

Figure 7. Plasmid profiles of multiple-drug resistant fecal coliform isolates from (L to R)
humans (HR). geese (GF) and horse (HR). The single band seen in most profiles was
calculated to be about 30 kb in size compared to the standards in lane M.
These investigations will continue this summer. Furthermore, as planned in the Proposal, isolates
confirmed for plasmid content will be investigated by resistance transfer testing and plasmid
curing (36) to assign resistance genes to plasmid DNA.
Acknowdgments
D.W.M. and E.N.B. would like to thank Stephen Goldstein for help in preparing and editing this
manuscript and Nina Sabzevari for preparing preliminary reports and manuals.

References
1. The Anacostia Project. 1997. NOOA Damage Assessment, Remediation, and Restoration.
Retrieved 10 May 2011 from Anacostia River Watershed Database and Mapping Project.
Web Site: http//mapping2.orr.noaa.gov/portal/AnacostiaRiver/
2. ―Cleaning up the Anacostia River.‖ National Resources Defense Council. 10 May 2011.
Web Site: www.nrdc.org/water/pollution/anacost.asp.
3. Stoddrad, R. et al. 2008. Risk Factors for Infection with Pathogenic and Antimicrobial-
Resistant Fecal Bacteria in Northern Elephant Seals in California. Public Health report.
123: 360-370
4. Combined Sewer System Overview. 2001. DC Water and Sewer Authority. Retrieved 10
May 2011. Web Site: www.dcwasa.com/education/css/combined_sewer.cfm.
5. Guillozet, P. et al. 2001. DC-WASA Combined Sewer Overflow, Anacostia River.
United States Department of Environmental Programs.
6. CSO Overflow Predictions for Average Year. 2004. DC Water and Sewer Authority.
Retrieved 10 May 2011. Web Site:
www.dcwasa.com/education/css/CSO%20Overflow%20Predictions%20Average%20Yea
r.pdf
7. Environmental Protection Agency. 2003. 1998 Section 303(d) List Fact Sheet for the
District of Columbia. Retrieved 10 May 2011. Web Site:
http://oaspub.epa.gov/waters/state_rept.control?p_state=DC#TPOL
8. Hagedorn, C. et al. 1999. Determining Sources of Fecal Pollution in a Rural Virginia
Watershed with Antibiotic Resistance Analysis Patterns in Fecal Streptococci. Appl.
Environ Microbiol. 65: 5522-5531.
9. Holt, J.G. et al.. 1994. Bergey’s Manual of Determinative Bacteriology, 9th Edition.
Williams & Wilkins, Baltimore.
10. Scott, T.M., et al. 2002. Microbial Source Tracking: Current Methodology and Future
Directions. Applied and Environmental Microbiology. 68 (12): 5796-5803.
11. Simpson, J.M. et al. 2002. Microbial Source Tracking: State of the Science.
Environmental Science and Technology. 36: 5279-5288.
12. Parveen, S., et al. 1997. ―Association of Multiple-Antibiotic-Resistance Profiles with
Point and Non-Point Sources of Escherichia coli in Apalachicola Bay.‖ Appl. Environ.
Microbiol. 63:2607-2612.
13. Whitlock, J.E., D.T. Jones, V.J. Harwood. 2002. Identification of the Sources of Fecal
Coliforms in and Urban Watershed Using Antibiotic Resistance Analysis. Water

Research. 36: 4273-4282.
14. Wiggins, B. A. 1996. Discriminate Analysis of antibiotic resistance patterns in fecal
streptococci, a method to differentiate human and animals sources of fecal pollution
in natural waters. Appl. Environ. Microbiol. 62: 3997-4002.
15. Kaspar, C.W., et al., 1990. Antibiotic Resistance Indexing of Escherichia coli to Identify
Sources of Fecal Contamination in Water. Can. J. Microbiol. 36: 891-894.
16. American Public Health Association. 1989. Standard methods for the examination of
water and wastewater, 17th ed., p. 9.99–9.107. American Public Health Association.
Washington, D.C.
17. DendroUPGMA: A Dedrogram Construction Utility. 2002. Web Site:
http://genomes.urv.cat/UPGMA/index.php?entrada=Example3
18. Goyal, S. et al.. 1979. Transferable drug-resistance in bacteria of coastal canal water and
sediment. Water Res. 13: 349–356.
19. Gonzalez A.M. et al. 2001. Relationships between fecal indicators and pathogenic
microorganisms in a tropical lagoon in Rio de Janeiro, Brazil. Department of Biological
Sciences, Institute of Biology, University Federal of Rio de Janeiro, Prédio, Brazil. 944:
97-112.
20. Grabow, W et al.. 1973. Survival in maturation ponds of coliform bacteria with
transferable drug-resistance. Water Res. 7:1589–1597.
21. Grabow, W et al. 1976. Behavior in conventional sewage purification processes of
coliform bacteria with transferable or non-transferable drug-resistance. Water Res. 10:
717–723.
22. Neu, H.C. 1994. The Crisis in Antibiotic Resistance. Science 257: 1064-1073.
23. D’Costa, V.M et al. 2006. Sampling the Antibiotic Resistome. Science 2006: 374-377.
24. Allen, H.K. et al. 2010. Call of the Wild: Antibiotic Resistance Genes in Natural
Environments. Nature Rev. Microbiol. 8: 250-259.
25. Bradford PA.2001. Extended-spectrum β-lactamases in the 21st Century
characterization, epidemiology, and detection of this important resistance threat." Clinic.
Microbiol Rev; 48:933-51.
26. Jacoby, G.A and P. Han. 1996. Detection of Extended Spectrum Beta-lactamases in
Clinical Isolates of Klebsiella pneumonia and Escherichia coli. J. Clinic. Microbiol. 4:
908-911.
27. Fridkin, S at al. 1999. Surveillance of Antimicrobial Use and Antimicrobial Resistance
in United States Hospitals: Project ICARE, Phase 2. Clinic. Infect. Dis. 29: 245-252.

28. Blanco, J.S. et al. 1997. Prevalence of Bacterial resistance to Qunolones and Other
Antimicrobials Among Avian Escherichia coli Strains isolated from Septicemic and
healthy Chickens in Spain. J. Clinic. Microbiol. 35: 2184-2185.
29. Levenstein-van Hall, M.A. et al. 2011. Identical Resistance Genes and Plasmids in
Escherichia coli from Dutch patients, Poultry and Retail Chicken Meat. Ned, Tdsch.
Geneeskd. 155: A3401.
30. Sahm, D.F. et al. 2001. Multidrug Resistant Urinary Tract Isolates of Escherichia coli:
Prevalence and Patient Demographics in the United States in 2000. Antimicrob. Agents
Chemother. 45: 1402-1406.
31. Cole, D. et al. 2005. Free-Living Canada Geese and Antimicrobial Resistance. Emerg.
Infect. Dis. 11: 935-938.
32. Dojeska, M. et al. 2007. High Prevalence of Antimicrobial-Resistance Genes and
Integrons in Escherichia coli Isolates from Black-Headed Gullis in the Czech Republic.
J. Appl. Microbiol. 103: 11-19.
33. Sjolund, M. at al. 2008. Dissemination of Multidrug-Resistant Bacteria in the Arctic.
Emerg. Infect. Dis. 14: 70-72.
34. Kullas, H. et al. 2002. Prevalence of Escherichia coli Serogroups and Human Virulence
Factors in Feces of Urban Canadian Geese. Int. J. Environ. Health Res. 12: 153-162.
35. Middleton, J.H and A. Ambrose. 2005. Enumeration and Antibiotic Resistance Patterns
of Fecal Indicator Organisms Isolated from Migratory Canada Geese (Banta
Canadensis). J. Wildlife Dis. 41: 334-341.
36. Daini O. A. and Adesemowo A. 2008. Antimicrobial Susceptibility Patterns and R-
Plasmids of Clinical Strains of Escherichia coli. American Journal of Basic and Applied
Sciences. 3: 397-400.
37. Sidjabat, H. et al. 2007. Identification of Plasmid-Mediated Extended Spectrum and
AmpC β-lactamases in Enterobacter spp. Isolated from Dogs. J. Med. Microbiol. 56:
426-434.
38.
Appendix A: Student Manual for the isolation, characterization and MAR
analysis of fecal coliforms.
Day 1—Colony Collection
1) Water samples should be processed within 48 hours of collection. Shake acquired water
samples vigorously to mix contents that may have settled. Organic material caught in the
sample is normal and inconsequential.
2) Use vacuum filtration located next to the fume hood to filter the samples.
a. Turn on the vacuum in the hood and attach a filtration cup to the filter flask.
b. Remove the lid of the filtration cup and add desired water volumes
i. Late Spring—Early Fall: 5-10mL water or one of each
ii. Late Fall—Early Spring: 20-30mL water or one of each
c. Filter an additional 10-20 mL of distilled water after the contaminated water.
d. Dip tweezers in alcohol and remove the filter paper in the cup and place onto
plate consisting of MacConkey’s agar, grid-side up.
i. Place it down at an angle to avoid air bubbles and ensure the most contact
between the paper and the agar. Using the sterilized tweezers, gently press
out any remaining air bubbles.
3) Place topside down in 37C incubator overnight.
**NOTE: Plates must be read within 24 hours to ensure late sugar fermenting
organisms do not influence original results.
Day 2—Master Plates
1) Remove plates from incubator to ensure sufficient growth. If sufficient growth is not
observed, it may be necessary to filter a larger volume of water to obtain a higher
quantity of colony forming organisms.
2) Using pre-formed grid papers align fresh MacConkey's plates on top of the grid. Mark
the bottom of the plates to orient them. This differentiates the first colony to the last
colony when you read/compare them at a later date.
a. Label fresh plates with sample name/number from the filtration plates and
[current] date.
b. Square plates = square grid; round plates = round grid papers
3) Using sterile toothpicks, collect fermenting (red) colonies individually from the filter
plates and transfer by pricking gently into the new MacConkey’s plates. One colony per
square.
4) Place topside down in 37C incubator overnight. These plates will be referred to as the
―master plates‖ and must be read within 24 hours to ensure late fermenting organisms do
not contaminate original results.
Day 3—Classification/Characterization by Differentiation Media
1) When you read the previous days plates, note/record the color, shape and other unusual
physical characteristics of each colony. Your colonies should be primarily [Lac+]
pinkbrick red, round formations, and may have a bile precipitate present.

2) Align 8 grid papers one after another. The first placement is your master plate followed
by one each of your differentiation media:
a. Desoxycholate (Desoxy)
b. Eosin Methylene Blue (EMB; or // label)
c. Hektoen Enteric (HE)
d. Simmon’s Citrate
e. MacConkey’s (MAC; or / label)
f. Xylose Lysine Desoxycholate (XLD)
g. Sorbitol MacConkey’s (S. MAC)
Expected Results for E. coli (Refer to the Difco Manual):
Desoxy Red colonies with a surrounding bile precipitate
EMB Deep red—purple colored colonies with a greenish metal tinge
HE Large yellow—salmon-pink colonies with bile precipitate
Citrate No growth: an important test because it distinguishes
E. coli from Enterobacter (which does grow and elicits media color change
from green to blue). Change in color should be recorded as positive for
Enterobacter.
MAC Pinkish—brick-red colonies and bile precipitate
XLD Large, flat yellow colonies
S.
MAC
Pink—red colonies with bile precipitate; sorbitol non-fermentation is indicative
of O157:H7 Enterohemorrhagic E. coli [EHEC]
You may also be recommended to carry out the following confirmatory tests on selected
isolates: a. Gram staining; b. IMVic tests; c. API test strips for Salmonella/Shigella; d. TSI agar stabs; e. LB Salts (6.5%)
**This test attempts to isolate Streptococcus faecalis and growth of mucoidal,
round opaque colonies indicates a positive result. Gram stain sample organisms
to confirm.
3) Label each plate with the corresponding Master Plate information and [current] date. All
plates should be marked and oriented the same direction. Using a sterile toothpick,
transfer one colony at a time to each of the plates. Complete one master plate at a time
and remain consistently centered for ease of replica plating later.
a. You only need to use a new toothpick when going from one master plate to
another; however you can use one toothpick per master plate across all media.
b. You will be transferring one colony at a time so that the grids align across ALL
media plates. Colony 1 on the mater plate corresponds with colony 1 on the
subsequent media plates. It is okay for the same toothpick to go from HE to
citrate, etc.
4) Incubate topside down at 37C overnight.
Day 4—Antibiotic Assay
1) Record the results from these plates by noting the appearance of the plates, color changes,
any significant patterns and how much growth has occurred. If there are a few colonies,
be sure to count them and note this number.
a. Observe all physical characteristics of each colony individually—color, shape,
aggregation, surrounding media, etc. This is important and informative when we
consider source contamination of the water sample in addition to the further
classification of each colony. You will use the provided media descriptions to
organize and clarify or results.
2) Using the original master plates, transfer one colony at a time to antibiotic plates in the
same replication pattern used for differentiation. The antibiotics and concentration used
are:
a. Aztreonam: 0.05 μg/mL
b. Geneticin: 25 μg/mL
c. Nitrofurantoin: 0.64 μg/mL
d. Kanamycin: 50 μg/mL
e. Ofloxacin: 10 μg/mL
f. Cefoxitin: 0.4 μg/mL
g. Piperacillin: 25 μg/mL
h. Streptomycin: 12.5 μg/mL
i. Neomycin: 50 μg/mL
j. Tetracycline: 25 μg/mL
k. Choramphenicol: 25μg/mL
3) Using the same technique and setup as above transfer one colony at a time from the
MacConkey’s master plates onto the antibiotic plates. You should have 11 antibiotic
plates per water sample.
4) Incubate the plates topside down at 37C overnight.
A. Isolation of E. coli from anal swabs, animal feces and raw sewage
1) For anal swabs (human and animal).
a. Take a sample immediately after defecation and swipe directly onto an EMB plate
and incubate for 48 hours.
b. Alternatively, the swab may be placed in 1 mL of EC broth, incubated for 8 to 16
hours at 44.5oC (in a water bath) before plating onto EMB plates.
2) For fecal specimens,
a. Place approximately 1 gm of material in 10 ml of 1% tryptone broth and shake
vigorously to disperse the material. Use sterile glass rod if necessary.
b. Transfer 1 mL amounts to 5 ml of EC broth and incubate at 44.5oC for 8 to 16
hours. Plate samples (streaking is sufficient) onto EMB plates and incubate at
37oC for 24 to 48 hours.
3) For raw sewage, pipette 1 mL amounts into 5 ml of EC broth and process as described
above.
Transfer fermentative colonies (deep red in coloration) to fresh EMB plates and screen for E. coli
as above.
B. Data Calculations and other Schematics
Susceptible: 015% growth; Sensitive: 1579% growth; Resistant: ≥80%
1) For each ISOLATE
a. Multiple Antibiotic Resistance Index for each isolate calculated as follows:
MAR Index = (# of colonies grown/total # of AB’s tested) x 100 =
b. Present this information as a bar graph
c.
2) For each CSO/NPS
a. MAR Index for each AB calculated as follows:
AB MAR Index = (total # resistant isolates/total # isolates) x 100 =
b. Present this information as a bar graph.
c. Make a chart of the samples/antibiotics and write down the number of colonies
that showed growth per total number of colonies poked onto the antibiotic plates.
a. Note if any plates have turned a greenish color.
b. In addition, your record will also need to note growth (as +)/no growth (as -) for
each colony inoculated onto the plate. This means, for each square AB plate, you
will have a series of 64 +/- notations.
c. You will use the above information later to develop analytical tools such as
comparative matrices and isolate ―fingerprints‖ called Dendograms.

Appendix B: Fecal Contamination Analysis of the Anacostia, by Gaurav Dhiman
and Mark Mallozzi (―Do We Need Biotechnology?‖ Dean’s Seminar Class).
Presented at the George Washington University Undergraduate Research
Symposium. April 25th
2011.

Appendix C: MAR Profiles of Fecal Escherichia coli from Point and Non-Point
Sources Along D.C. Metro Area Waterways, by Emma N. Burns, Yalin Firinci,
Monica Passi, Nina Sabzerai and David Morris.
Presented at the 16th
Annual Maryland Water Monitoring Council Conference,
November 2010.
Related Documents


