The Applicability of Remote Sensing in the Field of Air Pollution P. Veefkind + , R.F. van Oss + , H. Eskes + , A. Borowiak*, F. Dentner* and J. Wilson* + Royal Netherlands Meteorological Institute KNMI * European Commission, Directorate-General Joint Research Centre, Institute for Environment and Sustainability Institute for Environment and Sustainability 2007 EUR 22542 EN

Welcome message from author
This document is posted to help you gain knowledge. Please leave a comment to let me know what you think about it! Share it to your friends and learn new things together.
Transcript

The Applicability of Remote Sensing in the Field of Air Pollution
P. Veefkind+, R.F. van Oss+, H. Eskes+, A. Borowiak*, F. Dentner* and J. Wilson*
+ Royal Netherlands Meteorological Institute KNMI * European Commission, Directorate-General Joint Research Centre, Institute for Environment and Sustainability
Institute for Environment and Sustainability
2007
EUR 22542 EN

7
The mission of the Institute for Environment and Sustainability is to provide scientific and technical support to the European Union’s policies for protecting the environment and the EU Strategy for Sustainable Development.
European Commission Directorate-General Joint Research Centre Institute for Environment and Sustainability Contact information Address: T.P. 441, 21020 Ispra (VA), Italy E-mail: [email protected] Tel.: +39 0332 789956 Fax: +39 0332 785236 http://ies.jrc.cec.eu.int http://www.jrc.cec.eu.int Legal Notice Neither the European Commission nor any person acting on behalf of the Commission is responsible for the use which might be made of this publication. A great deal of additional information on the European Union is available on the Internet. It can be accessed through the Europa server http://europa.eu.int EUR 22542 EN ISSN : 1018-5593 Luxembourg: Office for Official Publications of the European Communities © European Communities, 2007 Reproduction is authorised provided the source is acknowledged Printed in Italy

8
Abstract
This report prepared by KNMI and JRC is the final result of a study on the applicability of remote sensing in the field of air pollution requested by the DG Environment. The objectives of this study were to: • Have an assessment of presently available scientific information on the feasibility of utilising remote
sensing techniques in the implementation of existing legislation, and describe opportunities for realistic streamlining of monitoring in air quality and emissions, based on greater use of remote sensing.
• Have recommendations for the next policy cycle on the use of remote sensing through development of appropriate provisions and new concepts, including, if appropriate, new environmental objectives, more suited to the use of remote sensing.
• Have guidance on how to effectively engage with GMES and other initiatives in the air policy field projects Satellite remote sensing of the troposphere is a rapidly developing field. Today several satellite sensors are in orbit that measure trace gases and aerosol properties relevant to air quality. Satellite remote sensing data have the following unique properties:
• Near-simultaneous view over a large area; • Global coverage; • Good spatial resolution.
The properties of satellite data are highly complementary to ground-based in-situ networks, which provide detailed measurements at specific locations with a high temporal resolution. Although satellite data have distinct benefits, the interpretation is often less straightforward as compared to traditional in-situ measurements. Maps of air pollution measured from space are widespread in the scientific community as well as in the media, and have had a strong impact on the general public and the policy makers. The next step is to make use of satellite data in a quantitative way. Applications based solely on satellite data are foreseen, however an integrated approach using satellite data, ground-based data and models combined with data assimilation, will make the best use of the satellite remote-sensing potential, as well as of the synergy with ground-based observations.

9
Executive Summary
This report prepared by KNMI and JRC is the final result of a study on the applicability of remote sensing in the field of air pollution requested by the DG Environment. The objectives of this study were to: • Have an assessment of presently available scientific information on the feasibility of utilising remote
sensing techniques in the implementation of existing legislation, and describe opportunities for realistic streamlining of monitoring in air quality and emissions, based on greater use of remote sensing.
• Have recommendations for the next policy cycle on the use of remote sensing through development of appropriate provisions and new concepts, including, if appropriate, new environmental objectives, more suited to the use of remote sensing.
• Have guidance on how to effectively engage with GMES and other initiatives in the air policy field projects Satellite remote sensing of the troposphere is a rapidly developing field. Today several satellite sensors are in orbit that measure trace gases and aerosol properties relevant to air quality. Satellite remote sensing data have the following unique properties:
• Near-simultaneous view over a large area; • Global coverage; • Good spatial resolution.
The properties of satellite data are highly complementary to ground-based in-situ networks, which provide detailed measurements at specific locations with a high temporal resolution. Although satellite data have distinct benefits, the interpretation is often less straightforward as compared to traditional in-situ measurements. Maps of air pollution measured from space are widespread in the scientific community as well as in the media, and have had a strong impact on the general public and the policy makers. The next step is to make use of satellite data in a quantitative way. Applications based solely on satellite data are foreseen, however an integrated approach using satellite data, ground-based data and models combined with data assimilation, will make the best use of the satellite remote-sensing potential, as well as of the synergy with ground-based observations. The following examples of using satellite remote sensing as a stand-alone tool are foreseen:
• Impact of satellite data maps on policy makers; • Information to the general public; • Hazard warning; • Planning of Ground-Based Measurement Sites; • Spatial distribution of emissions; • Trends in emissions; • Monitoring of remote locations; • Monitoring of long-range transport.
The combination of satellite observations, ground-based networks and models, e.g. with data assimilation has the following benefits for air quality:
• Air quality forecasts; • Improved characterisation of surface-level air pollution; • Improvement of emission inventories and incidental releases; • Monitoring of import/export of air pollution; • Verification of models.
As in data assimilation used in numerical weather prediction systems, chemical data assimilation will take a large effort to implement. However, it should not be forgotten that it took more than a decade for satellite data to
10
obtain a prominent role in numerical weather forecasts. Chemical data assimilation will benefit from this experience, but still will take years to develop fully. Current air quality legislation is connected strongly to what could be monitored reliably at ground level when the legislation came into existence. The characteristics of satellite remote sensing are fundamentally different from what is measured from the ground. To fully exploit the remote sensing potential, the legislation has to be modified to enable the use of satellite data with its unique characteristics. The study has made the following specific recommendations: R_1. Establish a long-term (distributed) data archive and distribution center for satellite air quality data sets.
This center should ensure harmonization of formats, units, nomenclature, etc, and should have sophisticated web services and should be part of GMES.
R_2. Support the further development of retrieval developments to improve the accuracy of the satellite
observations. New developments are for example the combination data from two or more sensors in the retrieval process, and radiance assimilation in models.
R_3. Support satellite mission to ensure long-term data continuity.
Currently no air quality monitoring sensors are planned until the 2020 timeframe. This situation should be avoided by supporting missions targeted on measuring air quality from ESA/EU (GMES Sentinels) for the period 2010-2020, and for the long-term ESA/EUMETSAT missions.
R_4. Promote the use of satellite data, e.g. by organizing workshops where new users are trained in using
remote sensing data. A wider user community will optimize the use of satellite remote sensing potential and a such fits in the GMES philosophy.
R_5. Investigate the possibility to establish a (distributed) chemical data assimilation center, with a strong
link to ECMWF. Such a system could be part of GMES.
R_6. Support the implementation of an integrated system of satellite and ground-based air quality
measurements in combination with models and data optimization, as described in the IGACO report. R_7. Initiate projects for the further development of chemical data assimilation, in which the satellite,
ground-based, and model communities are involved. A part from investing in chemical data assimilation systems, an important objective of these studies will be to improve the connections between the different research communities. These projects could be part of FP7 and ESA/EUMETSAT research programs.
R_8. Investigate how legislation may benefit from making use of the potentials of air pollution observations
from satellites.

11
EXECUTIVE SUMMARY ........................................................................................................................... 9
1 INTRODUCTION .................................................................................................................................... 12 1.1 BACKGROUND.......................................................................................................................................... 12 1.2 OBJECTIVES ............................................................................................................................................. 12 2 AIR POLLUTION LEGISLATION ....................................................................................................... 13 2.1 CONVENTION ON LONG-RANGE TRANS-BOUNDARY AIR POLLUTION ...................................................... 13 2.2 EU AIR QUALITY DIRECTIVES 96/62/EC AND ITS DAUGHTER DIRECTIVES AND AMENDMENTS................ 13 2.3 EU NATIONAL EMISSION CEILINGS DIRECTIVE ........................................................................................ 16 2.4 FUTURE DIRECTIONS IN AIR QUALITY POLICY......................................................................................... 16 3 SATELLITE OBSERVATIONS OF AIR POLLUTION ..................................................................... 18 3.1 SATELLITE MEASUREMENT METHODS ..................................................................................................... 18 3.1.1 Orbits................................................................................................................................................ 18 3.1.2 Viewing............................................................................................................................................. 19 3.1.3 Spectral properties and constituents ................................................................................................ 19 3.1.4 Retrieval: principles ......................................................................................................................... 20 3.1.5 Retrieval: Differential Optical Absorption Spectroscopy (DOAS)................................................... 22 3.1.6 Retrieval: tropospheric NO2 (example) ............................................................................................ 23 3.1.7 Summary of properties of air quality satellite measurement ............................................................ 23 3.2 CURRENT AND PLANNED SATELLITE INSTRUMENTS ................................................................................. 24 3.2.1 UV-Visible spectrometers................................................................................................................. 25 3.2.2 Aerosol instruments.......................................................................................................................... 25 3.2.3 Infrared instruments ......................................................................................................................... 25 3.2.4 Future missions ................................................................................................................................ 25 3.3 EXAMPLES OF SATELLITE OBSERVATIONS OF AIR POLLUTION ................................................................ 30 3.3.1 Tropospheric Ozone ......................................................................................................................... 30 3.3.2 Tropospheric Nitrogen Dioxide........................................................................................................ 31 3.3.3 Tropospheric Carbon Monoxide ...................................................................................................... 35 3.3.4 Tropospheric Sulfur Dioxide ............................................................................................................ 36 3.3.5 Tropospheric Aerosols ..................................................................................................................... 37 3.3.6 Tropospheric Formaldehyde ............................................................................................................ 41 4 APPLYING SATELLITE REMOTE SENSING FOR AIR QUALITY MONITORING ................. 43 4.1 GENERAL CONSIDERATIONS .................................................................................................................... 43 4.2 USING SATELLITE REMOTE SENSING AS A STAND-ALONE TOOL .............................................................. 43 4.3 INTEGRATION OF SATELLITE REMOTE SENSING, GROUND BASED NETWORKS, AND MODELS ..................... 44 5 CONCLUSIONS AND RECOMMENDATIONS.................................................................................. 47 5.1 SUMMARY AND CONCLUSIONS................................................................................................................. 47 5.2 RECOMMENDATIONS................................................................................................................................ 48 6 REFERENCES.......................................................................................................................................... 51
APPENDIX A: LIST OF ORGANIZATIONS.......................................................................................... 53
APPENDIX B: LIST OF RELEVANT PROJECTS ................................................................................ 54
APPENDIX C: LIST OF RELEVANT SATELLITE INSTRUMENTS ................................................ 55

12
1 Introduction
1.1 Background
The vast majority of measurements in the field of air quality in Europe are ground point observations. However, in order to make assessments throughout the territory, as requested by the air quality directives, modeling is often employed, which relies heavily on emission inventories and meteorological modeling. The latter has been facilitated and improved by remote sensing via satellites. In the last decade information from remote sensing that is directly linked to air pollution has increasingly been provided. In addition, a number of research projects and large international initiatives, such as the Global Monitoring of Environment and Security (GMES), are exploring the potential of spatial data and information provided by remote sensing. Potentials definitely exist in using remote sensing information for the validation of emission inventories and for a better understanding of the atmospheric processes controlling air pollution episodes. In addition, remote sensing can complement ground monitoring data when performing assessments of air pollution levels. In future, its role should however develop in the manner similar to the steps already taken in meteorology, when fusion of ground based monitoring and satellite data will provide the “chemical weather” reports and forecasts. Over the last decade, the capabilities of satellite instruments for remote sensing of the lower troposphere have strongly increased. New spaceborne radiometers make it possible to determine aerosol parameters on spatial scales of a few kilometers, whereas the new generation of spectrometers can detect NO2 and other trace gases on urban scales. The data from these instruments provide a new exciting view on global air quality. While satellite observations have the advantage of global coverage and homogeneous quality, they also have disadvantages such as their limited spatial and temporal resolution. To benefit the most from the spaceborne observations, the air quality community might have to combine the satellite data with information from ground based sensors and models. On request of the European Commission’s DG Environment the Institute for Environment and Sustainability of the Joint Research Centre is exploring the possibilities of how the use of remote sensing can facilitate streamlining of existing monitoring systems today and in the near future.
1.2 Objectives
The Joint Research Centre has requested KNMI to perform a study on the applicability of remote sensing in the field of air pollution. The objectives of this study are: • Have an assessment of presently available scientific information on the feasibility to rely on remote sensing
techniques in the implementation of existing legislation, and describe opportunities for realistic streamlining of monitoring in air quality and emissions, based on greater use of remote sensing.
• Have recommendations for the next policy cycle on the use of remote sensing through development of appropriate provisions and new concepts, including, if appropriate, new environmental objectives, more suited to the use of remote sensing.
• Have guidance on how to engage effectively with GMES and other initiatives in the air policy field projects. This scientific review is the result of this study. This report contains the following chapters: Chapter 2 gives a review of the current and near future European legislation on air quality. Chapter 3 gives a review of the current capabilities of satellites for monitoring the lower troposphere. Chapter 4 gives an overview of the applicability of satellite data for air quality monitoring. Chapter 5 contains the conclusions and recommendations.
13
2 Air Pollution Legislation
This section describes the existing and proposed European legislation on air pollution.
2.1 Convention on Long-Range Trans-boundary Air Pollution
The United Nations Economic Commission for Europe (UN/ECE) Convention on Long-Range Trans-boundary Air Pollution (CLRTAP, www.unece.org/env/lrtap/) was the first international treaty to address air pollution. In 1972, the UN Conference on the Human Environment established a set of principles, including that States (countries, as opposed to U.S. states) have “the responsibility to ensure that activities within their jurisdiction or control do not cause damage to the environment of other States or of areas beyond the limits of national jurisdiction”. Referring to this principle, LRTAP was negotiated to address transboundary air pollution primarily among States in Europe, the former Soviet Union, and North America. Asia, the Middle East, northern Africa, and central America as well as the entire Southern Hemisphere are not currently included in LRTAP. Following the LRTAP convention the EC has introduced controls on emissions of sulphur, nitrous oxides (NOx), volatile organic compounds (VOCs), heavy metals, persistent organic pollutants (POPs). The most recent Protocol (Gothenburg, 1999) introduces a multi-pollutant, multi-effect approach to reduce emissions of sulphur, NOx, VOCs and ammonia (NH3), in order to abate acidification of lakes and soils, eutrophication, ground-level ozone, and to reduce the release in the atmosphere of toxic pollutants (heavy metals) and Persistent Organic Pollutants (POP). It is stated in the Convention that monitoring of the concentrations of air pollutants is necessary in order to achieve the objectives. The Cooperative Programme for Monitoring and Evaluation of the long-range transport of air pollutants in Europe (EMEP) provides this information. Parties to the Convention monitor AQ at regional sites across Europe and submit data to EMEP. EMEP has three centres that coordinate these activities of which NILU is one. There are two large databases; the measurement database and the emission database. The AIRBASE database of the ETC/ACC forms the reference data set for the European ground-based observation network. In addition to measurements, EMEP maintains and develops an atmospheric dispersion model. The model calculates averages over a grid with a resolution of 50 km x 50 km. EMEP network density depends on the species measured, for NO2 there are close to 100 sites, for VOC the number of measurement sites is less than 10. The required laboratory accuracy is 10 to 25%. At present 24 ECE countries participate in the EMEP programme.
2.2 EU air quality directives 96/62/EC and its Daughter Directives and Amendments
The EC has introduced a series of Directives to control levels of certain pollutants and to monitor their concentrations in the air (http://europa.eu.int/comm/environment/air/ambient.htm). In 1996, the Environment Council adopted Framework Directive 96/62/EC on ambient air quality assessment and management. This Directive covers the revision of previously existing legislation and the introduction of new air quality standards for previously unregulated air pollutants. The list of atmospheric pollutants to be considered includes sulphur dioxide, nitrogen dioxide, particulate matter, lead and ozone, benzene, carbon monoxide, poly-aromatic hydrocarbons (PAH), cadmium, arsenic, nickel and mercury. The general aim of this Directive is to define the basic principles of a common strategy to: • define and establish objectives for ambient air quality in the Community designed to avoid, prevent or reduce
harmful effects on human health and the environment as a whole; • assess the ambient air quality in Member States on the basis of common methods and criteria; • obtain adequate information on ambient air quality and ensure that it is made available to the public, inter alia
by means of alert thresholds; • maintain ambient air quality where it is good and improve it in other cases.

14
Meanwhile so-called Daughter Directives (Directive 1999/30/EC on SO2, NOx, PM10, Pb, Directive 2002/3/EC on ozone, Directive 2000/69/EC on benzene and CO, Directive 2004/107/EC on As, Cd, Hg, Ni PAH’s), are covering the list of atmospheric pollutants of the Framework Directive. In addition to the limit values given in

15
Table 2-1, other pollutants are required to be monitored regularly, in order to gain background information on long-range transport or atmospheric processes. Such a list of “ozone precursors” (among others Fomaldehyde) is mentioned in the Ozone Daughter Directive.
16
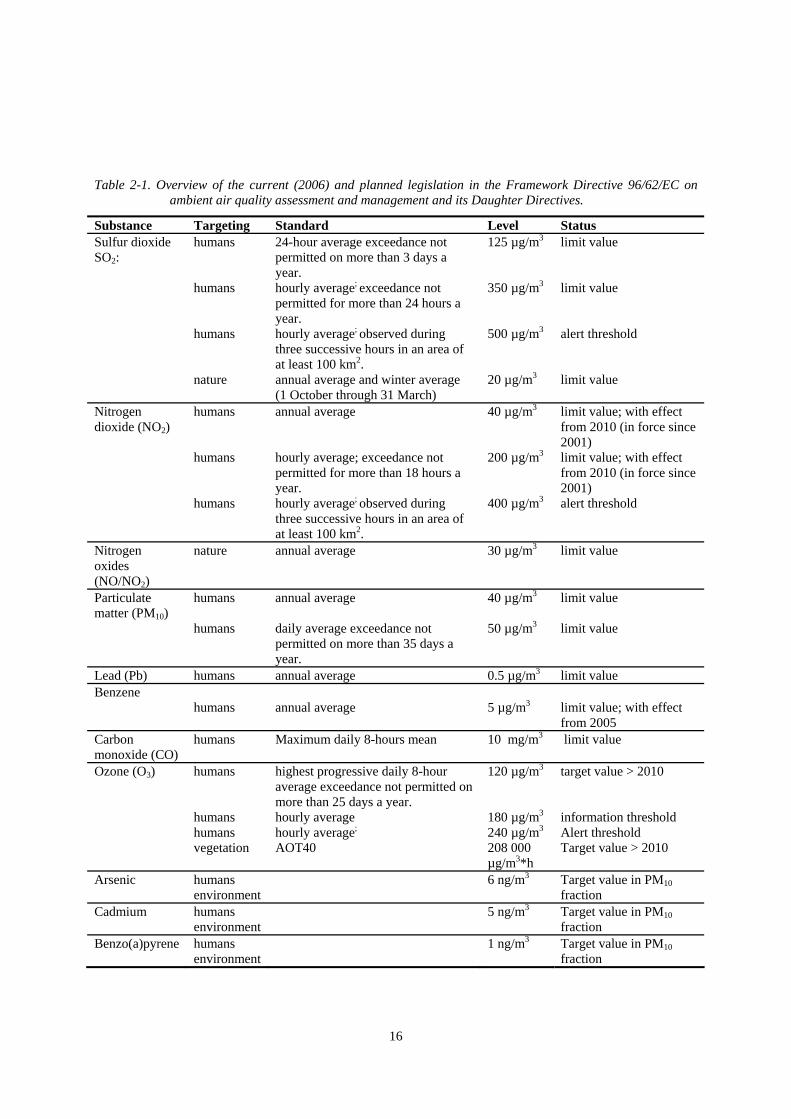
Table 2-1. Overview of the current (2006) and planned legislation in the Framework Directive 96/62/EC on ambient air quality assessment and management and its Daughter Directives.
Substance Targeting Standard Level Status Sulfur dioxide SO2:
humans 24-hour average exceedance not permitted on more than 3 days a year.
125 µg/m3 limit value
humans hourly average; exceedance not permitted for more than 24 hours a year.
350 µg/m3 limit value
humans hourly average; observed during three successive hours in an area of at least 100 km2.
500 µg/m3 alert threshold
nature annual average and winter average (1 October through 31 March)
20 µg/m3 limit value
Nitrogen dioxide (NO2)
humans annual average 40 µg/m3 limit value; with effect from 2010 (in force since 2001)
humans hourly average; exceedance not permitted for more than 18 hours a year.
200 µg/m3 limit value; with effect from 2010 (in force since 2001)
humans hourly average; observed during three successive hours in an area of at least 100 km2.
400 µg/m3 alert threshold
Nitrogen oxides (NO/NO2)
nature annual average 30 µg/m3 limit value
Particulate matter (PM10)
humans annual average 40 µg/m3 limit value
humans daily average exceedance not permitted on more than 35 days a year.
50 µg/m3 limit value
Lead (Pb) humans annual average 0.5 µg/m3 limit value Benzene humans annual average 5 µg/m3 limit value; with effect
from 2005 Carbon monoxide (CO)
humans Maximum daily 8-hours mean 10 mg/m3 limit value
Ozone (O3) humans highest progressive daily 8-hour average exceedance not permitted on more than 25 days a year.
120 µg/m3 target value > 2010
humans hourly average 180 µg/m3 information threshold humans hourly average; 240 µg/m3 Alert threshold vegetation AOT40 208 000
µg/m3*h Target value > 2010
Arsenic humans environment
6 ng/m3 Target value in PM10 fraction
Cadmium humans environment
5 ng/m3 Target value in PM10 fraction
Benzo(a)pyrene humans environment
1 ng/m3 Target value in PM10 fraction

17
2.3 EU National Emission Ceilings directive
According to the European Community directive 2001/81/EC (NEC directive), the member states have to reduce by 2010 their emissions of certain atmospheric pollutants under national emission ceilings. The emission ceilings are fixed for four pollutants (ammonia (NH3), nitrogen oxides (NOx), sulfur dioxide (SO2) and volatile organic compounds (VOCs)) for each member state as well as for the European Union as a whole. The main objective of the directive is to improve the protection of the environment and human health against risks of adverse effects from eutrophication, acidification and ground level ozone. The member states are obliged to report annually on their emissions and on emission projections up to 2010. In addition, in 2002 and 2006 they have to establish a national program detailing the measures to be taken in order to reach the ceiling. In Table 2-2 and Table 2-3 list the emission ceilings to be attained for the individual member states and EU as a whole.
Table 2-2. National emission ceilings for SO2, NOx, VOC and NH3, to be attained by 2010.
Member State SO2 Kilotonnes
NOx Kilotonnes
VOC Kilotonnes
NH3 Kilotonnes
Austria 39 103 159 66 Belgium 99 176 139 74 Denmark 55 127 85 69 Finland 110 170 130 31 France 375 810 1050 780 Germany 520 1051 995 550 Greece 523 344 261 73 Ireland 42 65 55 116 Italy 475 990 1159 419 Luxemburg 4 11 9 7 Netherlands 50 260 185 128 Portugal 160 250 180 90 Spain 746 847 662 353 Sweden 67 148 241 57 UK 585 1167 1200 297
EC 15 3850 6519 6510 3110
Table 2-3. Emission ceilings for SO2, NOx, VOCs for the European Union to be attained by 2010.
SO2 Kilotonnes
NOx Kilotonnes
VOC Kilotonnes
EC 15 3634 5923 5581
2.4 Future Directions in Air Quality Policy
Within the European Communities Environmental Action Programme (6th EAP) the European Commission’s Directorate General Environment (DG ENV) was requested to draft a “Thematic Strategy on Air Pollution”. It’s objectives are to attain “levels of air quality that do not give rise to significant negative impacts on, and risks to human health and the environment”. The Commission has examined current legislation and analyzed future emissions and impacts on health and the environment. It showed that impacts will persist even with the effective implementation of current legislation. Accordingly the Thematic Strategy on Air Pollution has been proposed (COM (2005) 446), establishing interim objectives, proposing appropriate measures, recommending to modernize current legislation, focusing on most serious pollutants and putting more emphasis on integration into other policies and programmes. A legislative proposal has been attached to the Strategy, combining the Framework Directive, First, Second and Third Daughter Directive (see section 2.2). The proposal simplifies, clarifies, repeals obsolete provisions and

18
introduces new provisions on fine particulates. Monitoring and reporting of air quality data shall be modernized and more emphasis on the spatial dimension shall be put. Additionally a cap for PM2.5 of 25 µg/m3 is proposed to minimize human exposure to fine particulates. The full text of the Thematic Strategy on Air Pollution can be found at http://eur-lex.europa.eu/LexUriServ/site/en/com/2005/com2005_0446en01.pdf The proposal for a “Directive of the European Parliament and of the Council on Ambient Air Quality and Cleaner Air for Europe” COM (2005) 447 is available at http://ec.europa.eu/environment/air/cafe/pdf/com_2005_447_en.pdf

19
3 Satellite Observations of Air Pollution
3.1 Satellite Measurement Methods
3.1.1 Orbits
Remote sensing instruments on board earth orbiting satellites are able to measure atmospheric constituents on a global scale. The spatial and temporal sampling and coverage of the measurement depend on the orbit of the satellite and the viewing and scanning properties of the instrument. Most satellite instruments have been placed on board polar orbiting platforms. These platforms circle the earth at a high of about 700 km over the poles in about 100 minutes. With each orbit they cover a track on earth whose width depends on the viewing properties of the instrument. This so-called swath width ranges from less than 100 to almost 3000 km. Most polar orbiting satellites are sun-synchronous, which means that they cross the equator at a fixed local time. After each orbit the earth has rotated such that the satellite instrument samples a different part of the earth. For wide swaths (>2000 km) the instrument covers the full earth in one day, as shown in Figure 3-1.
Figure 3-1. Example of the measurements from a Sun synchronous orbit. The left image shows a single orbit of OMI data plotted as false colour RGB for orbit 9061 of 29 March 2006. The image on the right shows how all the orbits for this day cover the whole globe. Image courtesy of Ruud Dirksen, KNMI.
Other orbits are: • Geostationary (GEO): mostly used for weather satellites. The satellites is positioned above the equator at
such a high altitude (40.000 km) that they have the same rotational period as the earth. Therefore they always see the same part of the earth, about 1/3 of the total surface. From these orbits the satellite instrument can observe variations on short (5 min – hours) time variability, which is not possible for polar satellites.
• Non-sun-synchronous low earth orbits (LEO): orbiting at about the same altitude as polar satellites, but not above the poles. These orbits can sample the same location more than once within a day.
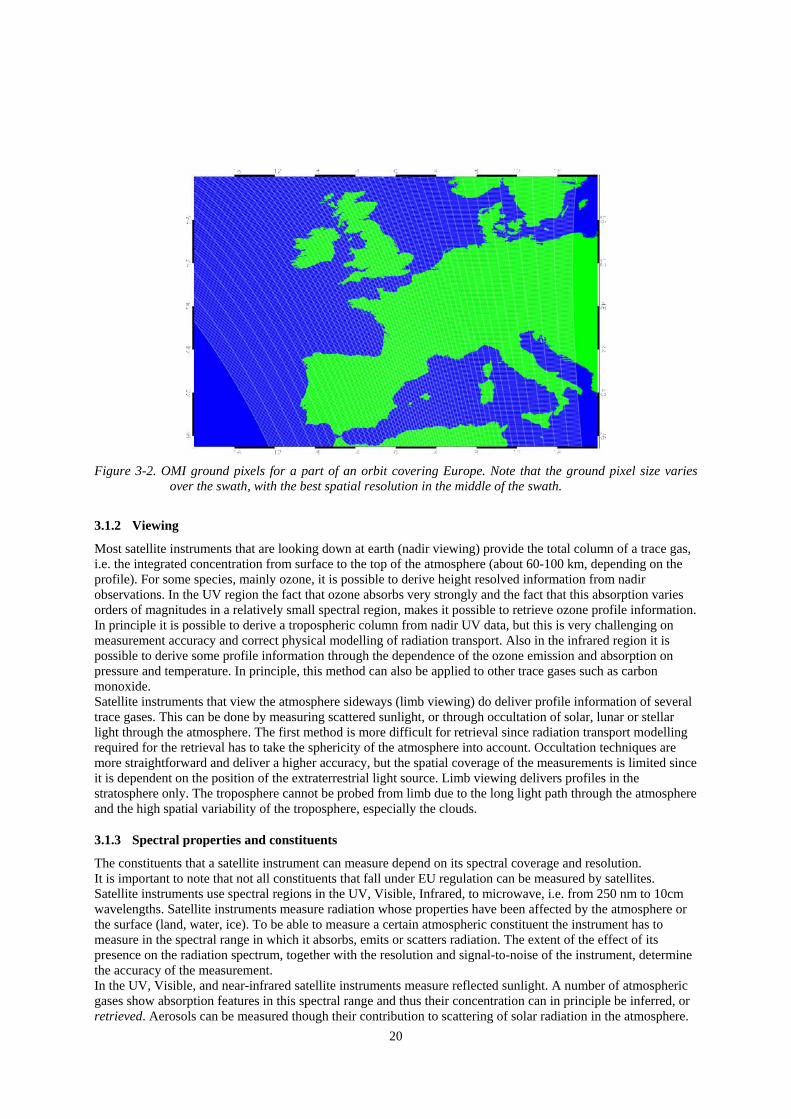
A satellite track on the earth is subdivided into ground pixels. For each groundpixel a measurement is performed, e.g. a trace gas column or surface albedo. Groundpixels for atmospheric measurements vary in size from 0.5 to 1000 km. Figure 3-2 shows an example of the ground pixel resolution of the OMI instrument.
20
Figure 3-2. OMI ground pixels for a part of an orbit covering Europe. Note that the ground pixel size varies
over the swath, with the best spatial resolution in the middle of the swath.
3.1.2 Viewing
Most satellite instruments that are looking down at earth (nadir viewing) provide the total column of a trace gas, i.e. the integrated concentration from surface to the top of the atmosphere (about 60-100 km, depending on the profile). For some species, mainly ozone, it is possible to derive height resolved information from nadir observations. In the UV region the fact that ozone absorbs very strongly and the fact that this absorption varies orders of magnitudes in a relatively small spectral region, makes it possible to retrieve ozone profile information. In principle it is possible to derive a tropospheric column from nadir UV data, but this is very challenging on measurement accuracy and correct physical modelling of radiation transport. Also in the infrared region it is possible to derive some profile information through the dependence of the ozone emission and absorption on pressure and temperature. In principle, this method can also be applied to other trace gases such as carbon monoxide. Satellite instruments that view the atmosphere sideways (limb viewing) do deliver profile information of several trace gases. This can be done by measuring scattered sunlight, or through occultation of solar, lunar or stellar light through the atmosphere. The first method is more difficult for retrieval since radiation transport modelling required for the retrieval has to take the sphericity of the atmosphere into account. Occultation techniques are more straightforward and deliver a higher accuracy, but the spatial coverage of the measurements is limited since it is dependent on the position of the extraterrestrial light source. Limb viewing delivers profiles in the stratosphere only. The troposphere cannot be probed from limb due to the long light path through the atmosphere and the high spatial variability of the troposphere, especially the clouds.
3.1.3 Spectral properties and constituents
The constituents that a satellite instrument can measure depend on its spectral coverage and resolution. It is important to note that not all constituents that fall under EU regulation can be measured by satellites. Satellite instruments use spectral regions in the UV, Visible, Infrared, to microwave, i.e. from 250 nm to 10cm wavelengths. Satellite instruments measure radiation whose properties have been affected by the atmosphere or the surface (land, water, ice). To be able to measure a certain atmospheric constituent the instrument has to measure in the spectral range in which it absorbs, emits or scatters radiation. The extent of the effect of its presence on the radiation spectrum, together with the resolution and signal-to-noise of the instrument, determine the accuracy of the measurement. In the UV, Visible, and near-infrared satellite instruments measure reflected sunlight. A number of atmospheric gases show absorption features in this spectral range and thus their concentration can in principle be inferred, or retrieved. Aerosols can be measured though their contribution to scattering of solar radiation in the atmosphere.

21
Certain aerosols also significantly absorb solar radiation (dust, soot). Figure 3-3 shows the absorption by atmospheric ozone as a function of wavelength. The magnitude of the absorption in the UV region is such that all solar radiation in this spectral region is blocked by the ozone in the stratosphere: the ozone layer. At somewhat larger wavelengths the spectral variations of the absorption allow an accurate retrieval of ozone from spectrally resolved satellite measurements of the earth radiance.
Figure 3-3. Ozone absorption cross section in the UV from 260 to 340 nm. Note that a logarithmic scale is used,
thus the absorption by ozone decrease by 4 orders of magnitude in this wavelength range.
In the Infrared satellite instrument measure the thermal radiation from the surface and the atmosphere. Trace gases can be discerned through their absorption and emission. In the microwave region satellite instruments can measure emission lines of molecules and thus retrieve amounts.
3.1.4 Retrieval: principles
Figure 3-4 shows the reflectance of the earth atmosphere as viewed from space in the wavelength region where ozone exhibits prominent absorption features (cf Figure 3-3). The reflectance is obtained by dividing the earth radiance through the solar irradiance that enters the atmosphere: the reflectance thus depends on the optical properties of the earth-atmosphere-surface system, the solar input is divided out.

22
Figure 3-4. OMI reflectance spectrum for a cloud-free scene over De Bilt, The Netherlands, on 2 April 2005.
Note that a logarithmic scale is used for the reflectance. Image by Robert Voors, KNMI.
How can this reflectance spectrum be used to derive the amount of ozone in the atmosphere? Clearly, more ozone gives deeper absorption, but there are, besides ozone, other parameters that also determine the reflectance spectrum. Evidently a model is needed that can be used to compute the reflectance given the properties of the atmosphere, the surface and the viewing conditions: a forward model, in this case a radiative transfer model. The following properties are needed to compute the reflectance: Atmosphere
• Temperature profile • Pressure profile • Profiles of all trace gases that absorb in the spectral region of interest • Profiles of all relevant aerosol properties (absorption and scattering coefficients) that absorb and/or
scatter in the spectral region of interest • Profiles of scattering coefficients of cloud droplets and/or ice particles for the spectral region of interest • Air mass factor
Surface
• Surface reflection functions relating incoming radiance to reflected radiance; in general this depends on incident and outgoing angles.
Viewing conditions
• Viewing angles: polar angle with respect to nadir and azimuth angle with respect to e.g. local North • Solar angles: polar angle with respect to zenith and azimuth angle with respect to e.g. local North (Note that these four angles vary with position along the line-of –sight due to the curvature of the atmosphere)
In general the viewing conditions are very well known, but for the atmospheric and surface properties assumptions have to be made. Temperature and pressure can be obtained from climatologies or from meteorological models. The spectral region for retrieval is often chosen such that the trace gas to be retrieved shows the dominant absorption and the effect of other trace gases can be relatively easy corrected for. Aerosols pose a significant problem for most retrievals. Their properties are very variable in time and space and their

23
properties for a given scene are often not well known. In most cases the bulk of the aerosols reside in the lowest layers and their effect on the radiance mimics the surface reflectance: part of the radiance is absorbed, part is scattered back. Fitting the surface reflectance as one of the unknowns in the retrieval then accounts for aerosols to some degree. Aerosol presence in higher layers, like desert dust outbreaks or biomass burning often lead to error in the retrieval if not accounted for. Apart from the forward model, an inversion method has to be applied to derive the unknown parameter (e.g. ozone profile or column) from the measured reflectance. The unknown parameters are adjusted until the modelled and measured reflectance agree within the bounds of the measurement error. The straightforward way of doing this is to minimize the (squared-sum) difference between the two spectra, weighted with the measurement errors: least-squares fitting. In case the forward model is linear in the fitted parameters the minimum is easily found by inverting the matrix corresponding to the forward model. Since the forward model is usually non-linear, some search method has to be applied to find the minimum. For mildly non-linear models, the minimum can be found by linearizing the model around some initial estimate and iteratively applying the matrix inversion and re-computing the forward matrix for the new set of fit parameters: the Gauss-Newton method. The linearized model constitutes the matrix of derivatives of all measurements with respect to all fit parameters: the Jacobian. A more robust search method that can be applied to non-linear models is the Levenberg-Marquardt method. Often in retrieval applications, the retrieval problem is underdetermined: more fit parameters are attempted than there is information in the measurement. This is often the case for profile retrievals. A profile retrieval assigns a set of concentrations at various altitudes or pressures as the set of fit parameters. The measurement contains only limited information on the vertical profile and therefore a priori information is needed to stabilize the retrieval. The optimal estimation method [Rodgers, 2000] is the most popular for such profile retrievals.
3.1.5 Retrieval: Differential Optical Absorption Spectroscopy (DOAS)
Differential Optical Absorption Spectroscopy (DOAS) is a special type of retrieval that can be used to retrieve trace gas total columns from earthshine spectra with sufficient spectral resolution to distinguish multiple absorption structures of the trace gas. Figure 3-5 shows a spectral window from which ozone total column can be retrieved by DOAS. The DOAS method is to infer from the spectrum a single measured quantity which relates in a simple (sometimes linear) manner to the total column. This quantity is the slant column density and can be interpreted as the column density of the trace gas, not along the vertical direction, but along the average light path of the solar light through the atmosphere. It is derived by fitting the reflectance with the absorption cross-sections and a lower order polynomial to account for slowly varying parameters that govern the reflectance.
Figure 3-5. Example of a DOAS fit of ozone in the fit window selected for OMI [Veefkind et al., 2006]

24
For the conversion of the slant column density into a vertical column density a so-called air mass factor is used, which is defined as the ratio of the slant column and the vertical column densities. For cases when the scattering can be ignored, i.e. for the retrieval of trace gases in the near-infrared, the air mass factor can be approximated by the geometrical air mass factor. However, in the UV and visible part of the spectrum, scattering in the atmosphere has be account for. In this case, the computation of the air mass factor requires radiative transfer modelling, taking scattering, surface reflection, cloud effects and for strong absorbers such as ozone, the trace gas profile into account. For many tropospheric trace gas retrievals, the largest uncertainty are in the air mass factor [Boersma et al. 2004].
3.1.6 Retrieval: tropospheric NO2 (example)
Tropospheric nitrogen dioxide (NO2) is retrieved using DOAS yielding the total column density, followed by a correction for the stratospheric column. Figure 3-6 shows the spectral window from which NO2 is retrieved. The spectral structures in the reflectance spectrum due to nitrogen dioxide absorption are less pronounced than for ozone. There are two reasons for this: (1) the absorption of NO2 is weak, and (2) other features as for example ozone and the Ring-effect contribute to the spectral structure in this wavelength region. For these reasons the nitrogen dioxide columns are retrieved with a lower precision than ozone columns.
Figure 3-6. Example of an OMI spectrum for the NO2 fit window as measured over Belgium on 15 March 2006.
In blue: reflectance spectrum normalized using a second order polynomial. In red: absorption cross-section of NO2 in the same wavelength region. Data courtesy of Ben Veihelmann, KNMI.
Interesting cases for tropospheric nitrogen dioxide retrieval are polluted scenes, as shown in Figure 3-10. The nitrogen dioxide vertical profiles for polluted cases show that a very large fraction of the total column resides in the boundary layer. The sensitivity of the spectral measurement for nitrogen dioxide is much smaller for these lower layers than for layers higher up. The low surface albedo of cloud free scenes means that most of the measured light comes from scattering in the atmosphere and therefore not much light has passed through the polluted boundary layer. This is corrected using the appropriate air mass factor and an assumed nitrogen dioxide profile. Obviously this leads to larger uncertainties in NO2 determination. Boersma et al. [2004] have shown that errors up to 50% in the air mass factor for polluted scenes result from profile uncertainties. For air pollution studies the tropospheric column is of interest, so the stratospheric column of nitrogen dioxide needs to be deducted from the total column. There are several methods in use to do this. They have in common that they use total column measurements above sites that are remote from nitrogen dioxide sources and therefore have a very small tropospheric column. The difference between the stratospheric column above the remote site and the site of interest is them found by applying a model or smooth functions.
3.1.7 Summary of properties of air quality satellite measurement
The main properties of satellite observations for constituents that are relevant for air quality are summarized. Table 3-2 links the species that can be observed from space to the pollutants regulated in the EU Directives.

25
Table 3-1. Main properties of satellite measurements for satellite measurement relevant for air quality.
Property Characteristic Value Temporal sampling 1-3 times per 24hr Integration time ±1 sec Spatial averaging (vertical) Tropospheric column (0 - ±10 km) Spatial averaging (horizontal) 1 – 100 km Spatial coverage (vertical) troposphere Spatial coverage (horizontal) Global in 1 – 6 days
Table 3-2. Link between species that can be measured using satellite remote sensing and the related regulated pollutants.
Satellite Measurement Related regulated pollutant Tropospheric Ozone Ozone concentration on ground level (EU Directive 2002/3/EC) Tropospheric NO2 Column NO2 concentration on ground level (EU Directive 1999/30/EC)
NOx National Emission Ceiling (EU Directive 2001/81/EC) Tropospheric SO2 Column SO2 concentration on ground level (EU Directive 1999/30/EC) Tropospheric CO Column CO concentration on ground level (EU Directive 2000/69/EC) Aerosol Properties1: Optical depth Single scattering albedo Ångström parameter Fine mode fraction
PM10 concentration on ground level (EU Directive 1999/30/EC)
Formaldehyde Column Formaldehyde concentration on ground level (EU Directive 2002/3/EC)2 1 The aerosol optical properties are related to the physcical/chemical aerosol properties in the following manner. Aerosol optical depth is the vertically integrated aerosol extinction and is a proxy for total aerosol mass. The single scattering albedo is a measure for the absorption and is an indicator for the aerosol composition or type. The Ångström parameter is an indicator for the aerosol size distribution. 2 EU Directive 2002/3/EC formaldehyde is not regulated, but has to be regularly monitored, because of its role in ozone formation. Compared to ground based measurements of constituents relevant for air quality, we can conclude that satellite observations do not:
• Measure air quality directly at the altitude relevant for (human) exposure (0 – 10 m). • Measure air quality with sufficient temporal sampling and averaging to determine exposure. • Measure all relevant constituents to determine the exposure to air quality . • Measure air quality with such a high spatial resolution that exposure in individual streets can be
determined. • Measure air quality for clouded days.
Compared to ground based measurements satellite observations do: • Deliver daily information on air quality on the continental - global scale. • Deliver information on the spatial distribution of air quality with a resolution up to 1-10 km.
3.2 Current and planned satellite instruments
In this section an overview is given over the current and planned satellite instruments that are capable of observing tropospheric pollutants. An important input to this section is the IGACO report [IGACO, 2004], which describes amongst others the current and planned satellite missions. To be useful for monitoring air quality, sufficient spatial and temporal resolutions are required. This section is therefore limited to satellite instruments that meet these requirements. Table 3-3 provides an overview of the instruments listed for each atmospheric species. It should be noted that Table 3-3 doesn’t provide a ranking of
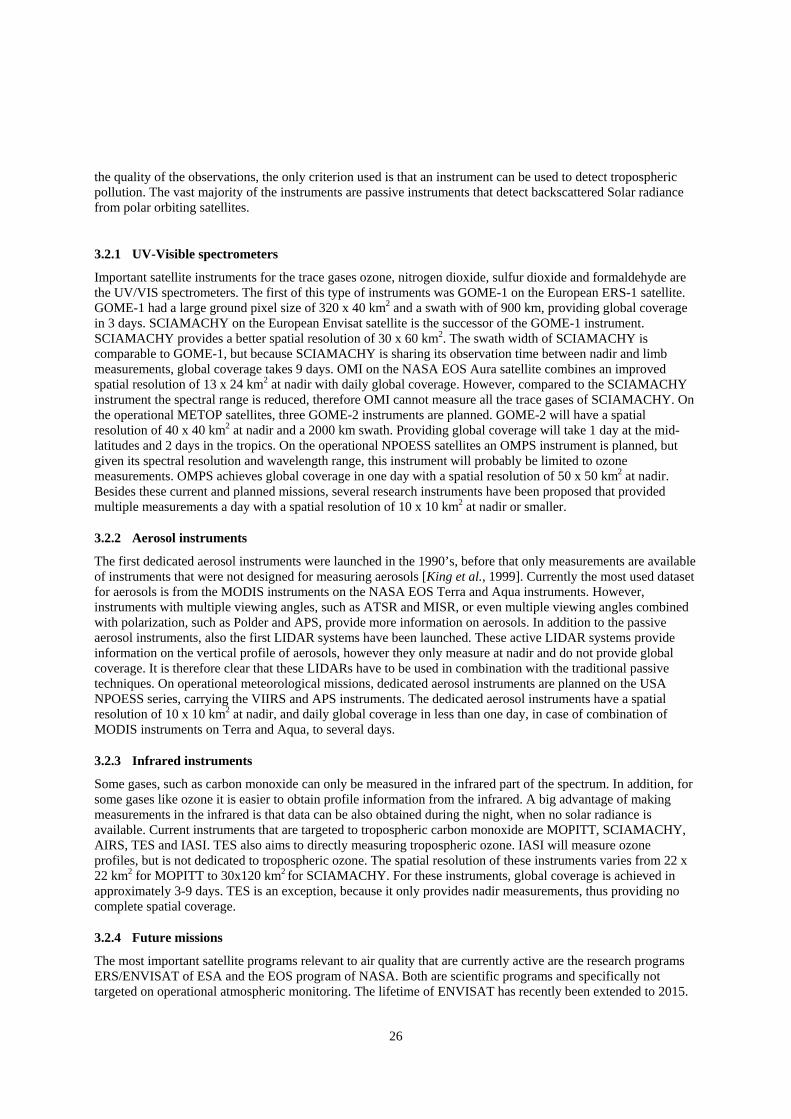
26
the quality of the observations, the only criterion used is that an instrument can be used to detect tropospheric pollution. The vast majority of the instruments are passive instruments that detect backscattered Solar radiance from polar orbiting satellites.
3.2.1 UV-Visible spectrometers
Important satellite instruments for the trace gases ozone, nitrogen dioxide, sulfur dioxide and formaldehyde are the UV/VIS spectrometers. The first of this type of instruments was GOME-1 on the European ERS-1 satellite. GOME-1 had a large ground pixel size of 320 x 40 km2 and a swath with of 900 km, providing global coverage in 3 days. SCIAMACHY on the European Envisat satellite is the successor of the GOME-1 instrument. SCIAMACHY provides a better spatial resolution of 30 x 60 km2. The swath width of SCIAMACHY is comparable to GOME-1, but because SCIAMACHY is sharing its observation time between nadir and limb measurements, global coverage takes 9 days. OMI on the NASA EOS Aura satellite combines an improved spatial resolution of 13 x 24 km2 at nadir with daily global coverage. However, compared to the SCIAMACHY instrument the spectral range is reduced, therefore OMI cannot measure all the trace gases of SCIAMACHY. On the operational METOP satellites, three GOME-2 instruments are planned. GOME-2 will have a spatial resolution of 40 x 40 km2 at nadir and a 2000 km swath. Providing global coverage will take 1 day at the mid-latitudes and 2 days in the tropics. On the operational NPOESS satellites an OMPS instrument is planned, but given its spectral resolution and wavelength range, this instrument will probably be limited to ozone measurements. OMPS achieves global coverage in one day with a spatial resolution of 50 x 50 km2 at nadir. Besides these current and planned missions, several research instruments have been proposed that provided multiple measurements a day with a spatial resolution of 10 x 10 km2 at nadir or smaller.
3.2.2 Aerosol instruments
The first dedicated aerosol instruments were launched in the 1990’s, before that only measurements are available of instruments that were not designed for measuring aerosols [King et al., 1999]. Currently the most used dataset for aerosols is from the MODIS instruments on the NASA EOS Terra and Aqua instruments. However, instruments with multiple viewing angles, such as ATSR and MISR, or even multiple viewing angles combined with polarization, such as Polder and APS, provide more information on aerosols. In addition to the passive aerosol instruments, also the first LIDAR systems have been launched. These active LIDAR systems provide information on the vertical profile of aerosols, however they only measure at nadir and do not provide global coverage. It is therefore clear that these LIDARs have to be used in combination with the traditional passive techniques. On operational meteorological missions, dedicated aerosol instruments are planned on the USA NPOESS series, carrying the VIIRS and APS instruments. The dedicated aerosol instruments have a spatial resolution of 10 x 10 km2 at nadir, and daily global coverage in less than one day, in case of combination of MODIS instruments on Terra and Aqua, to several days.
3.2.3 Infrared instruments
Some gases, such as carbon monoxide can only be measured in the infrared part of the spectrum. In addition, for some gases like ozone it is easier to obtain profile information from the infrared. A big advantage of making measurements in the infrared is that data can be also obtained during the night, when no solar radiance is available. Current instruments that are targeted to tropospheric carbon monoxide are MOPITT, SCIAMACHY, AIRS, TES and IASI. TES also aims to directly measuring tropospheric ozone. IASI will measure ozone profiles, but is not dedicated to tropospheric ozone. The spatial resolution of these instruments varies from 22 x 22 km2 for MOPITT to 30x120 km2 for SCIAMACHY. For these instruments, global coverage is achieved in approximately 3-9 days. TES is an exception, because it only provides nadir measurements, thus providing no complete spatial coverage.
3.2.4 Future missions
The most important satellite programs relevant to air quality that are currently active are the research programs ERS/ENVISAT of ESA and the EOS program of NASA. Both are scientific programs and specifically not targeted on operational atmospheric monitoring. The lifetime of ENVISAT has recently been extended to 2015.

27
The three major missions of the EOS program, Terra, Aqua and Aura, are expected to end between 2010 and 2015. For the time period after 2010 it is expected that the GMES initiative will be important in providing innovative systems. The aim of the CAPACITY project (www.knmi.nl/capacity) included the definition of satellite components of a future operational system to monitor atmospheric composition for implementation by ESA/EU within the Space Component of GMES. This project has delivered user requirements in a number of fields, including air quality. The conclusions of the CAPACITY study are, amongst other, that a combination of a geostationary (GEO) and low earth orbit (LEO) satellites are needed to fulfill the user requirements. As a compromise a constellation of three satellites in an orbit with low inclination is mentioned. Current and planned operational missions for operational air quality monitoring include:
• EUMETSAT Polar System (EPS-MetOp) including GOME-2 and IASI (2006-2020); • EUMETSAT Post-EPS program (2020-); • ESA/EU GMES Sentinel Programme nominally including Sentinels 4 and 5 dedicated to atmospheric
chemistry monitoring, required to bridge the gap between current capabilities and the timeframe beyond 2020. Sentinel 3 is dedicated to ocean color but will also provide information on aerosols.
• US NPOESS Preparatory Program (NPP) (2007-2011); • US National Polar-orbiting Operational Environment Satellite System (NPOESS) (2010-).
For the Meteosat Third Generation (MTG), EUMETSAT has conducted pre-Phase A studies for air quality monitoring sensors on a geostationary platform, with a focus on Europe. The Meteosat Third Generation is planned for the period 2015-2025. However, the air quality sensors are currently not in the baseline for MTG. In addition to the operational programs, the TRAQ (Tropospheric composition and Air Quality) mission is one of the six missions that have been selected for a pre-Phase-A study within the ESA Earth Explorer program. The TRAQ mission main objective is to study air quality and tropospheric chemistry globally, with a special focus on Europe. Of these six missions that are going to the pre-Phase-A, one will be selected for launch after 2012.
28
Table 3-3. Overview of relevant current and planned satellite instruments for observing tropospheric pollutants. Adapted from IGACO [2004].
Ozone (O3) y
Satellite Instrument Agency 00 01 02 03 04 05 06 07 08 09 10 11 12 13 14 15
TOMS NASA
ERS-2 GOME-1 ESA
ENVISAT SCIAMACHY GE/NL/BE
TES/OMI NASA
AURA/OMI NL/FI
METOP GOME-2 Eumetsat METOP IASI Eumetsat NPP OMPS NOAA/NASA/DOD
NPOESS OMPS NOAA/NASA/DOD
Carbon Monoxide (CO)
Satellite Instrument Agency 00 01 02 03 04 05 06 07 08 09 10 11 12 13 14 15
Terra MOPITT NASA
ENVISAT SCIAMACHY GE/NL/BE
AQUA AIRS NASA
AURA TES NASA
METOP IASI Eumetsat
Formaldehyde (HCHO)
Satellite Instrument Agency 00 01 02 03 04 05 06 07 08 09 10 11 12 13 14 15
ERS-2 GOME-1 ESA
ENVISAT SCIAMACHY GE/NL/BE
AURA/OMI NL/FI
METOP GOME-2 Eumetsat

29
Nitrogen Dioxide (NO2)
Satellite Instrument Agency 00 01 02 03 04 05 06 07 08 09 10 11 12 13 14 15
ERS-2 GOME-1 ESA
ENVISAT SCIAMACHY GE/NL/BE
AURA/OMI NL/FI
METOP GOME-2 Eumetsat
Sulfur Dioxide (SO2)
Satellite Instrument Agency 00 01 02 03 04 05 06 07 08 09 10 11 12 13 14 15
ERS-2 GOME-1 ESA
ENVISAT SCIAMACHY GE/NL/BE
AQUA AIRS NASA
AURA/OMI NL/FI
METOP GOME-2 Eumetsat NPP OMPS NOAA/NASA/DOD
NPOESS OMPS NOAA/NASA/DOD

30
Satellite Instrument Agency 00 01 02 03 04 05 06 07 08 09 10 11 12 13 14 15
Aerosol Optical Properties
NOAA AVHRR NOAA MVIRI/SEVIRI Eumetsat METOP AVHRR3 NOAA NPP VIIRS NOAA/NASA/DOD NPOESS VIIRS NOAA/NASA/DOD NPOESS APS NOAA/NASA/DOD TOMS NASA ERS-2/ENVISAT ATSR-2/AATSR ESA TERRA-AQUA MODIS NASA TERRA MISR NASA ENVISAT SCIAMACHY GE/NL/BE AURA/OMI NL/FI Parasol/Polder CNES Icesat / GLAS NASA ALADIN ESA CALIPSO NASA EarthCare/ATLID ESA
Legend
Research Instrument Pre-Operational Operational

31
3.3 Examples of Satellite Observations of Air Pollution
In this section examples of satellite data related to air quality are presented. It is noted that this is not a complete review, but a broad selection of relevant studies covering the most important tropospheric pollutants and measurement techniques.
3.3.1 Tropospheric Ozone
Total column ozone measurements from space date back to the mid 1970’s. Currently these measurements can be performed with a very high accuracy from space of approximately 1-3 % [e.g Veefkind et al., 2006]. However the retrieval of tropospheric ozone is a much larger challenge, because only a small part of the total ozone column is in the troposphere and the sensitivity of the measurements decreases towards the surface. For measuring tropospheric ozone two main approaches exists. The first method performs an ozone profile retrieval from a single instrument. Below an example is given of the TES. The second method derives the tropospheric ozone column from a combination of a total ozone measurement and information on the stratospheric ozone column. Several sources for stratospheric column data have been used in the literature, for example from a different instrument [Fishman and Larsen, 1987], using so-called cloud slicing methods [Ziemke et al., 2003; Valks et al., 2003], or using data assimilation of the stratosphere. Below an example is given of recent efforts to combine OMI total ozone with a stratospheric column derived from MLS data. Using the spectrally resolved measurements in the infrared, the TES instrument can be used to derive tropospheric ozone information. TES performs measurements for a narrow swath nadir of the satellite. Figure 3-7 shows ozone from TES in the troposphere for 4-16 November 2004. For this period, the largest tropospheric ozone concentrations are found over the South Atlantic, which is probably caused by the transportation of polluted air from biomass burning in Africa and South America. Also, high values are found over Australia and Indonesia, which probably are caused by biomass burning in these regions. These TES data show that pollution from biomass burning, which is mainly anthropogenic, is transported hundreds of kilometers away from the sources.
Figure 3-7. Tropospheric ozone at 464.16 hPa derived from the TES instrument for 4-16 November
2004. Image courtesy of Kevin Bowman, NASA-JPL.
Ziemke et al. [2006] have used the residual method to derive the tropospheric column ozone from a combination of OMI total column and MLS stratospheric measurements. The OMI/MLS tropospheric columns can be derived on a daily basis and cover both the tropics and the mid-latitiudes. First validation results show a good comparison with ozone sonde measurements. Figure 3-8 shows monthly means for October 2004 and July 2005. For October 2004 most tropopsheric ozone appears in the Southern Hemisphere in a large region extending from the Equator in the Atlantic to 30°S-40°S along all longitudes. In July the largest tropospheric ozone columns are found in the Northern hemisphere. An interesting feature for July 2005 are the high values found over the Mediterranean, which is known as the “crossroads” effect.

32
Figure 3-8. Tropospheric ozone column for October 2004 and July 2005 derived using a residual
technique that combines total column ozone from OMI with stratospheric column ozone from MLS [Ziemke et al., 2006].
3.3.2 Tropospheric Nitrogen Dioxide
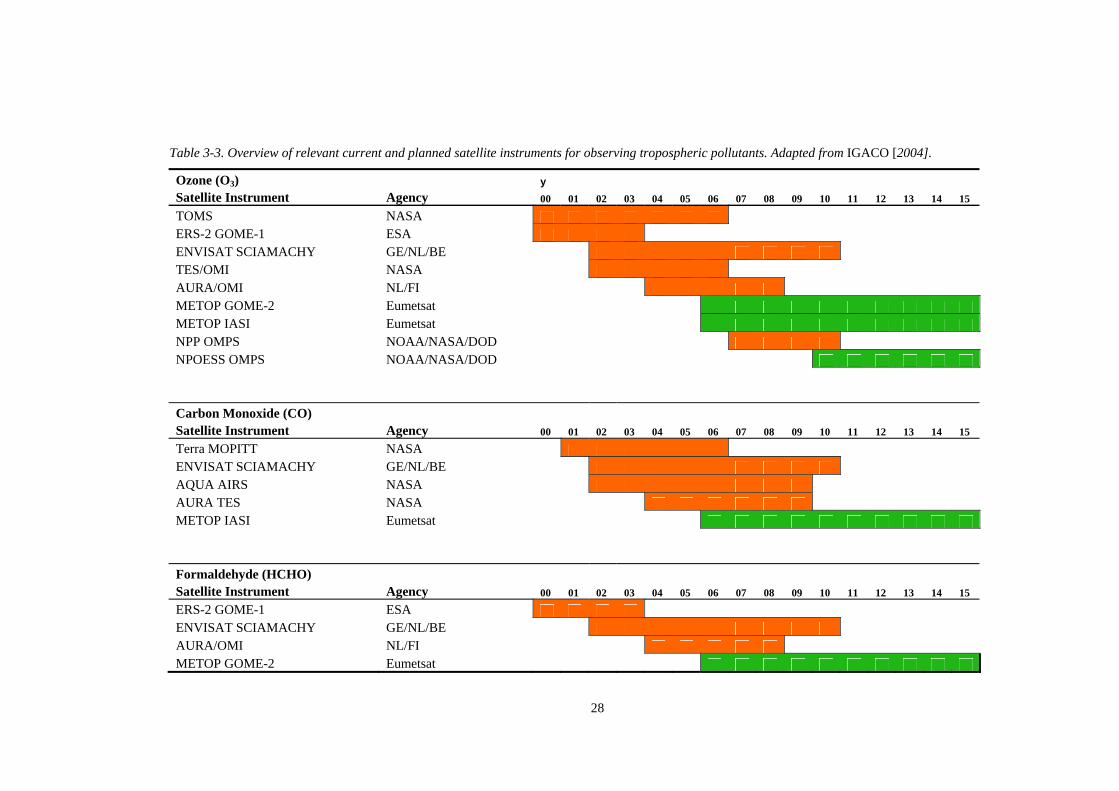
Since the start of the GOME record in 1994 a continuous record of NO2 data from space exists. This record now spans data from three instruments: GOME-1, SCIAMACHY and OMI, and will be continued by the GOME-2 instruments. Many research groups have used this data record to study air quality. In this section only a few examples of these studies will be discussed. These examples cover the following four topics: (1) the current state-of-the-art satellite measurements of tropospheric NO2; (2) the relationship between the ground based and satellite measurements; (3) the source strengths and trends therein as derived from satellite measurements; and (4) satellite measurements over remote locations. For air quality applications, satellite instruments should combine a good spatial resolution with good temporal resolution. The current state-of-the-art instrument for tropospheric NO2 from space is the OMI on the NASA EOS Aura satellite. The OMI has an urban scale spatial resolution (13x24 km2 at nadir) with one or more measurements per day for each location in the world. The OMI NO2 products are both produced as offline data products as well as in near-real time. The offline products are intended for research users that need the best quality data that can be achieved. The near-real-time products are delivered within three hours of the observations, and are intended for dedicated users that have a strict time requirements, for example air quality forecasting systems. Figure 3-9 shows tropospheric NO2 over Europe averaged half a year of OMI offline data (J.P. Veefkind, manuscript in preparation). The spatial resolution and coverage shown in this figure can only be achieved from satellites. A direct comparison between the various locations is possible, because the instrument and measurement method has been used to construct this image. Data from GOME and SCIAMACHY have shown tropospheric NO2 for the major urban areas in Europe [Beirle et al., 2004], [Richter et al., 2005]. With OMI it is now possible to detect variations on smaller scales, for example caused by smaller cities.
33
Figure 3-9. Tropospheric NO2 from the Ozone Monitoring Instrument (OMI) over Europe for the
period March to September 2005. Image by Pepijn Veefkind, KNMI.
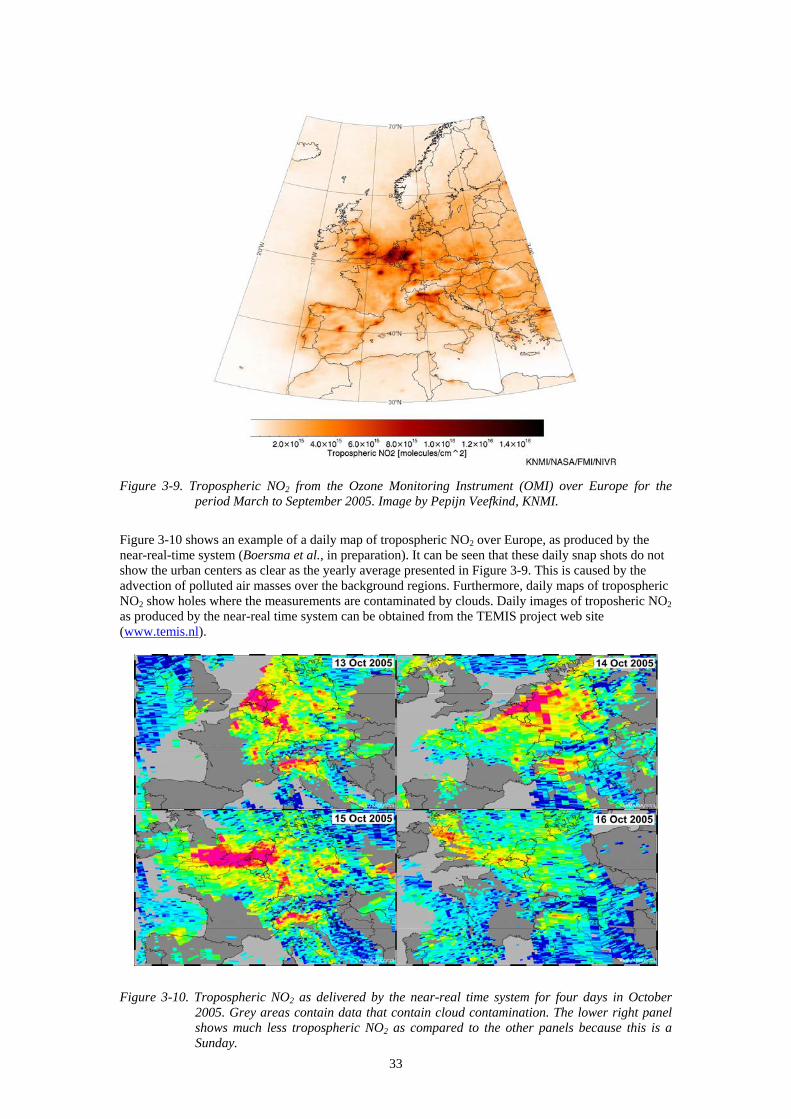
Figure 3-10 shows an example of a daily map of tropospheric NO2 over Europe, as produced by the near-real-time system (Boersma et al., in preparation). It can be seen that these daily snap shots do not show the urban centers as clear as the yearly average presented in Figure 3-9. This is caused by the advection of polluted air masses over the background regions. Furthermore, daily maps of tropospheric NO2 show holes where the measurements are contaminated by clouds. Daily images of troposheric NO2 as produced by the near-real time system can be obtained from the TEMIS project web site (www.temis.nl).
Figure 3-10. Tropospheric NO2 as delivered by the near-real time system for four days in October 2005. Grey areas contain data that contain cloud contamination. The lower right panel shows much less tropospheric NO2 as compared to the other panels because this is a Sunday.

34
The satellite images obtained from GOME, SCIAMACHY and OMI clearly show increased tropospheric NO2 concentrations over urban areas. However, for air quality monitoring its very relevant to know how the satellite measured tropospheric NO2 columns are related to concentrations measured at the ground level. Petritoli et al. [2004] have shown a very high correlation between the GOME tropopsheric NO2 data and ground based measurements for a background station in the Po Valley in Italy. For stations in the Netherlands a similarly high correlation was found between ground based data and OMI tropospheric NO2 columns, as shown in Figure 3-11 (K.F. Boersma, unpublished results). The high correlations between the ground based and satellite data suggests that for background conditions, NO2 at the surface can be estimated with an uncertainty of the order 50% from satellite measurements. For urban locations this is not expected to be possible because of the large impact of the NO2 emissions in the direct vicinity of the ground based station.
Figure 3-11. Comparison of ground-based NO2 and tropospheric NO2 as measured with OMI for a
period of two months in October-November 2004. For the grond-based measurements the data are presented in microgram/m3. The satellite data are expressed in 1015 molecules/cm2. Figure courtesey of Folkert Boersma, KNMI (currently at the University of Harvard).
Several studies have been performed that estimate the NO2 sources or trends in the source using the GOME-SCIAMACHY time series. Richter et al. [2005] have determined trends in tropospheric NO2 for the time period 1996-2002, see Figure 3-12. This study showed that over this six year period the NO2 concentrations over China increased more than 40 %. For Europe a 20-30 % reduction was found for the same time period. The main cause for the change in the tropospheric NO2 concentrations is the change in the source strengths.

35
Figure 3-12. Trend in NO2 from 1996 to 2002 for several industrialized regions in the world, as
derived from GOME and SCIAMACHY data. Image courtesy of Anreas Richter, IUP Bremen.
Emissions of NOx can also be determined from inverse modeling of satellite concentrations. Inverse modeling uses satellite data in combination with model output to improve the estimates of the source strengths. In practice, inverse modeling will change the NOx emissions such, that the modeled and measured NO2 fields agree within their uncertainties. Inverse modeling has been performed on continental scales, as well as on smaller spatial scales. Konovalov et al. [2005] have shown that the updated emissions show a significantly better agreement with the satellite observations. The tropospheric NO2 observations by GOME have been used by [Van Noije et al., 2006] to evaluate 17 atmospheric chemistry models using three different retrieval schemes. The conclusions are amongst others that on average the models underestimate the retrievals in industrial regions, especially over eastern China and over regions in South Africa, and overestimate the retrievals in regions dominated by biomass burning during the dry season. Also, this study shows how satellite data can be used to quantitatively improve on existing global emissions databases using quantitative analysis of satellite data. One of the advantages of using satellite data is, that it is available globally, also in regions that are difficult to monitor with ground-based networks, such as over the ocean. Also, in case of sudden events, for example large scale forest fires, the satellite can provide unique information on the source strength and the extent of such air pollution events. GOME NO2 data over the ocean have been used to study transcontinental transport of NOx [Wenig et al., 2002]. Also, measurements of tropospheric NO2 by SCIAMACHY have been used to estimate ship emissions over the Indian ocean [Richter et al., 2004]. Figure 3-13 shows tropospheric NO2 produced by the forest fires in Portugal in the summer of 2005. From these data the source strength of NO2 could be estimated (J.P. Veefkind, unpublished results).

36
Figure 3-13. NO2 initial column density from wildfires in Portugal for 21 August 2005. Image from
www.knmi.nl/omi.
3.3.3 Tropospheric Carbon Monoxide
Carbon monoxide (CO) is a reactive toxic gas, mainly produced by the combustion of fossil fuels and vegetation burning. As the sources of CO are near the Earth’s surface, the highest concentrations are expected in the boundary layer. Figure 3-14 shows an example of CO concentrations measured with SCIAMACHY [Frankenberg et al., 2005]. These data are based on SCIAMACHY observations in the shortwave infrared, which have the advantage that they are highly sensitive to lower layers of the troposphere, where the sources and the bulk of the CO is usually situated.
Figure 3-14. Maximum observed CO vertical column density [molec/cm2] in six two-month periods
from September 2003 to August 2004. 1 · 1018 molec/cm2 correspond roughly to a column
averaged CO mixing ratio of 50 ppbv. Enhancements due to seasonal variations of biomass burning (e.g. in Africa), constant anthropogenic sources (e.g. China) or sporadic fires (e.g. Alaska in July/August 2004) can be observed. Although the CO columns are not averaged over the given time periods, the patterns of enhancements appear rather smooth, proving the good fit quality and the absence of outliers. Over certain areas (gray), no suitable measurements are available due to very low surface albedo (e.g. over the ocean) or too high solar zenith angles. (Image from Frankenberg et al., [2005]).
The lifetimes of CO in the troposphere is quite variable, but on average it is on the order of a few weeks. This enables CO to reach higher layers in the atmosphere and thus be transported over great distances. This transport has been observed with the MOPITT instrument. MOPITT measures in the
37
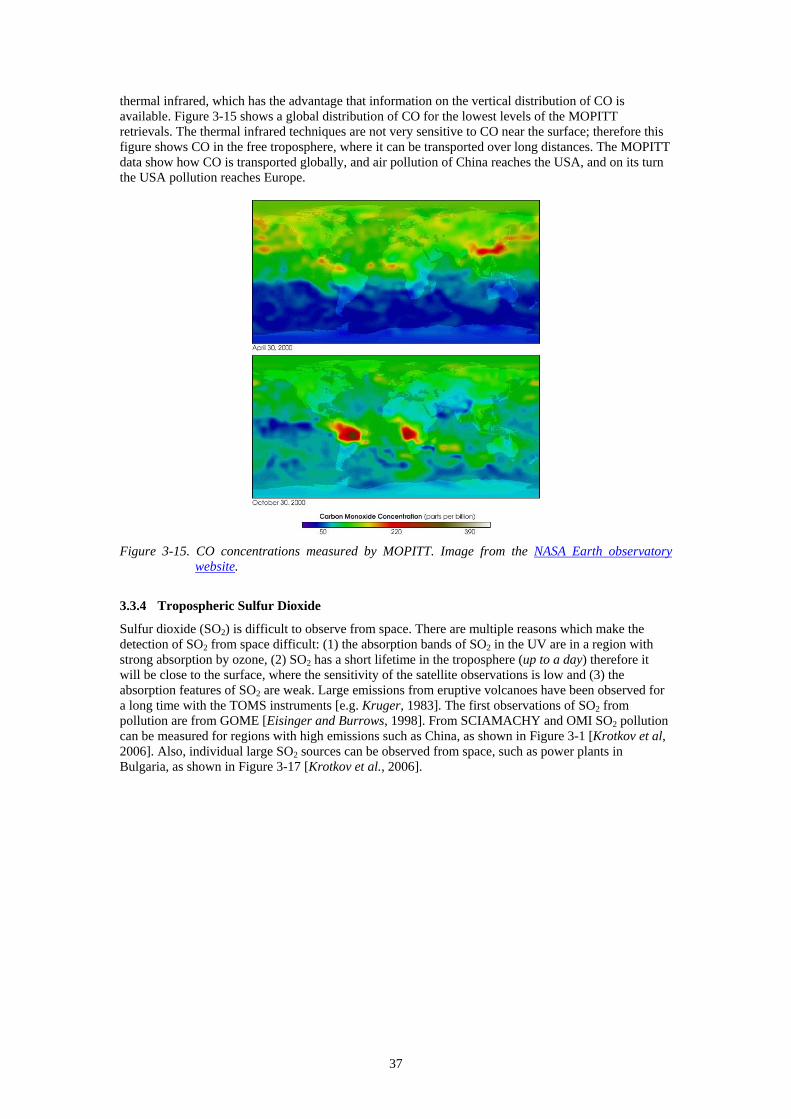
thermal infrared, which has the advantage that information on the vertical distribution of CO is available. Figure 3-15 shows a global distribution of CO for the lowest levels of the MOPITT retrievals. The thermal infrared techniques are not very sensitive to CO near the surface; therefore this figure shows CO in the free troposphere, where it can be transported over long distances. The MOPITT data show how CO is transported globally, and air pollution of China reaches the USA, and on its turn the USA pollution reaches Europe.
Figure 3-15. CO concentrations measured by MOPITT. Image from the NASA Earth observatory
website.
3.3.4 Tropospheric Sulfur Dioxide
Sulfur dioxide (SO2) is difficult to observe from space. There are multiple reasons which make the detection of SO2 from space difficult: (1) the absorption bands of SO2 in the UV are in a region with strong absorption by ozone, (2) SO2 has a short lifetime in the troposphere (up to a day) therefore it will be close to the surface, where the sensitivity of the satellite observations is low and (3) the absorption features of SO2 are weak. Large emissions from eruptive volcanoes have been observed for a long time with the TOMS instruments [e.g. Kruger, 1983]. The first observations of SO2 from pollution are from GOME [Eisinger and Burrows, 1998]. From SCIAMACHY and OMI SO2 pollution can be measured for regions with high emissions such as China, as shown in Figure 3-1 [Krotkov et al, 2006]. Also, individual large SO2 sources can be observed from space, such as power plants in Bulgaria, as shown in Figure 3-17 [Krotkov et al., 2006].

38
Figure 3-16. SO2 over China for one orbit on 24 December 2004 as derived from OMI. Image courtesy
of Nick Krotkov, UMBC/NASA.
Figure 3-17. SO2 over Southeast Europe for one orbit on 2 September 2005 as derived from OMI. The
high SO2 concentrations are sourced from lignite-burning power plants in the Balkan region. Image courtesy of Nick Krotkov, UMBC/NASA.
3.3.5 Tropospheric Aerosols
Tropospheric aerosols are a complex mixture of particulate matter produced from different sources. These sources can be both natural, such as desert dust and sea salt, as well as anthropogenic, e.g. from fossil fuel burning or biomass burning. Some of the particles are emitted as particles, while others are produced from precursor gases such as NO2 and SO2. The oldest observations of aerosols from satellites are of Saharan dust. In fact the dust from the Sahara desert dominates the global aerosol field. For a long time quantitative aerosol retrieval from space was hampered by the fact that there were no satellite sensors that were designed for aerosol retrieval. Although the accuracy is limited by the instruments, long term datasets of aerosol optical depth exist from AVHRR (over the ocean), METEOSAT (over the ocean) and TOMS. In addition TOMS has a long-term data set of the Absorbing

39
Aerosol Index. Advanced retrievals of aerosols from space requires well-calibrated spectral resolved measurements, with a good spatial resolution, and preferably using multiple viewing angles and/or polarization measurements. Such sensors became available around 1994 with the launch of the ATSR-2. Nowadays there are several instruments with good capabilities for aerosol retrieval: MODIS, MISR, MERIS, AATSR, POLDER, SEAWIFS, etc.. Figure 3-18 shows aerosol distribution over Europe for July 1997 [Robles-Gonzalez et al., 2000].
QuickTime™ and a decompressor
are needed to see this picture.
Figure 3-18. Aerosol optical depth at 555 nm over Europe for August 1997, as derived from the ATSR-
2. Image courtesy of G. de Leeuw, TNO.
Important aerosol parameters to derive from satellite instruments are the aerosol load, the aerosol size distribution, the aerosol chemical composition and the vertical distribution. Because satellite instruments measure backscattered radiances, the retrievals start with the optical properties of the aerosol, rather than the physical properties. For example, the aerosol optical depth (also called the aerosol optical thickness) is a proxy for the total aerosol mass. Table 3-4 links the aerosol properties to the chemical and physical properties. To link the aerosol optical properties to aerosol physical and chemical properties like the dry mass, dry size distribution and aerosol type is not a straightforward task. Especially important is the hygroscopic uptake of water vapor by most aerosol particles, which causes growth of the particles which is strongly non-linear at relative humidities larger than 80%. Since the aerosol optical properties like the aerosol optical depth and the single scattering albedo are changed by the hygroscopic growth of the particles, information on the vertical distribution of the aerosol as well as the relative humidity is needed to translate the optical properties into dry aerosol mass and dry aerosol size distribution.
Table 3-4. Link between aerosol optical properties and chemical/physical properties. The last column provides the minimum required measurement techniques. Although not mentioned in the table, polarization measurements will improve the accuracy of all measurement technique.
Aerosol Optical Property Chemical/Physical Property Measurement Technique Aerosol Optical Depth Aerosol mass Broadband radiometry Spectral Aerosol Optical Depth Ångström Parameter
Aerosol size distribution Fine/Coarse mode
VIS/NIR narrowband radiometry VIS/NIR spectrometry
Single Scattering Albedo Imaginary refractive index
Aerosol chemical compositionAerosol type
UV/VIS Spectrometry VIS/NIR multi-angle narrowband radiometry
Scattering phase function Particle shape VIS/NIR multi-angle narrowband radiometry VIS/NIR multi-angle narrowband
Vertically resolved backscatter Aerosol vertical profile LIDAR

40
Information on the aerosol size can be derived from multiple spectral bands. For example MODIS derives information on small and coarse particles from the wavelengths in the visible and near-infrared. Small particles are predominantly of secondary origin, meaning that they are formed from precursor gases. These secondary aerosols are mostly from man-made origin, whereas the coarse particles are dominated by natural aerosols [Kaufman et al., 2005]. Thus distinguishing a small and a large aerosol mode gives also information on natural versus anthropogenic aerosols. It is noted that for deriving size information satellite instruments are needed with narrow and well-separated spectral bands. For this reason it can be done with MODIS, whereas retrieval of aerosol size based on for older instruments like for example AVHRR is hampered by the sensor limitations. Information on the aerosol chemical composition derived from satellite is usually expressed as an aerosol type. These aerosol types refer to the source of the aerosol particles. Commonly used types are Marine, Polluted, Desert Dust and Biomass Burning. The information on the aerosol type is derived from the single scattering albedo and/or aerosol size information. For example, the Absorbing Aerosol Index [Torres et al., 1998] provides information on the presence of elevated absorbing aerosol layers. Although the Aerosol Absorbing Index can be used to track desert dust and biomass burning plumes, it does not provide quantitative information on the aerosol optical depth and/or the single scattering albedo. To derive information on the single scattering albedo for aerosols in the boundary layer, satellite instruments with multiple viewing directions preferably combined with polarization information are needed [Chowdhary et al., 2005]. Satellite instruments with multiple viewing directions (POLDER, MISR) can also provide information on the shape of the aerosol particles [Herman et al., 2005]. Using these instruments, spherical particles can be distinguished from non-spherical particles, which is especially important for desert dust aerosols, as illustrated in Figure 3-19. This is an additional way of classifying the aerosol type, for example to distinguish desert dust from biomass burning aerosols, in addition to the method of using the absortion by the particles.
Figure 3-19. Aerosol optical depth for the non-spherical particle mode for July 2005, as measured with
the POLDER instrument. Image courtesy of Jean-Francois Leon.
A new development in aerosol observations from satellites is the use of LIDAR technology. LIDARS provide information on the vertical distribution of aerosol layers. Figure 3-20 shows clouds and aerosols over China as measured by the GLAS instrument [Spinhirne et al., 2005]. Such information is important to be able to translate total column aerosol properties, as provided by passive satellite instruments, to values near the surface. The Calipso LIDAR, which was launched in April 2006 and will be part of the A-Train satellite constellation, will be an excellent opportunity to combine the vertical information from a LIDAR with passive sensors such as MODIS, POLDER and OMI.

41
Figure 3-20. GLAS cloud and aerosol signal over China on October 23, 2003. Also shown are the
GLAS cloud and aerosol layer height level data products produced from analysis of the signal. Image from Spinhirne et al., [2005]. Copyright 2005, American Geophysical Union. Reproduced by permission of American Geophysical Union.
Several studies have tried to correlate column integrated aerosol optical depth with ground based PM 10 or PM 2.5 concentrations. The correlation between the ground based and the column integrated depends, amongst others, on the vertical distribution. When the aerosols are predominantly in the boundary layer, and the day-to-day variation of the boundary doesn’t vary strongly, a good correlation may be expected. Figure 3-21 shows the correlation between MODIS aerosol optical depth and PM2.5 for different sites in the USA, for August and September 2003 [Al-Saadi et al., 2005]. A clear difference between the East and West of the USA can be seen in this figure, which is due to the difference in air quality conditions in this period. A similar study was conducted for 28 stations in France, correlating PM2.5 with POLDER-2 aerosol optical depth [Kacenelenbogen et al., 2006]. The regression analysis for the time period April to October 2003 showed a maximum correlation of 0.80 for certain sites, whereas the correlation coefficient of al data was 0.55. Al-Saadi et al. [2005] describe tools that have been developed based on the combination of ground based and near-real time satellite data, to improve air quality forecasts. An example of such a tool is shown in Figure 3-22, that shows a composite image of ground-base, satellite and meteorological data.
Figure 3-21. Correlation between PM2.5 measurements and MODIS aerosol optical depth observation
for the USA for late summer 2003. The circles each represent ground-based network site and the size of the circle indicates the number of coincident measurements. Figure from [Al-Saadi et al., 2005].

42
Figure 3-22. Composite image showing MODIS aerosol optical depth, ground-based PM2.5
measurements and meteorological information. Figure from [Al-Saadi et al., 2005].
3.3.6 Tropospheric Formaldehyde
Formaldehyde (HCHO) is a major intermediate gas in the oxidation of methane and many other hydrocarbons. The lifetime of formaldehyde is short, and the photolysis reactions and reaction with OH are a major source of CO. Because of the short lifetime of several hours, the presence of formaldehyde signals hydrocarbon emission areas. Formaldehyde is important, since it is a measure of the total amount of oxidised hydrocarbons, and together with Nox quantifies the chemical ozone production. The presence of elevated levels of formaldehyde is related to the release of hydrocarbons (e.g. isoprene or methane) by forests, biomass burning, traffic and industrial emissions. Formaldehyde has been retrieved from GOME observations by Thomas et al. [1998] and by Chance et al. [2000]. The retrieval of formaldehyde is similar to NO2, although the absorption features are much smaller. As with NO2, an important source of the retrieval uncertainty is the uncertainty of the vertical profile distribution. Based on the experience with NO2, coupled retrieval-modelling methods are used, where chemistry-transport model will provides best-guess profiles of CH2O, based on the latest emission inventories, atmospheric transport, photochemistry, lightning modelling and wet/dry removal processes. Figure 3-23 shows an example of formaldehyde as observed with GOME.

43
Figure 3-23. Average tropospheric formaldehyde concentrations for 1997, derived from GOME. Image
from www.gse-promote.org.

44
4 Applying Satellite Remote Sensing for Air Quality Monitoring
4.1 General Considerations
It is foreseen that the most important applications of satellite remote sensing in the field of air quality monitoring and forecasting will combine satellite and model information, using data assimilation. In addition, there are also interesting several interesting stand-alone applications of satellite remote sensing. Satellite observations and surface measurements are largely complementary and both are needed for a comprehensive monitoring of all aspects of air pollution: Surface sites sample the concentration of a set of air pollutants with high repeat rate. Only a subset of regulated species can be measured from space. Surface observations are normally available continuously, as compared to one observation per day typical for present-day polar orbiting satellite instruments. The aim of the surface measurements is first of all to compare local pollution levels with current legislation (see

45
Table 2-1) for which the surface network is designed. Air is sampled at the surface where people live, and stations can be placed at strategic locations (busy streets, town centres, residential areas, and rural areas representative of background pollution levels). Satellites provide extensive and dense data sets with global coverage. Extensive surface networks are only available for a small portion of the Earth’s surface. Satellites provide information over sparsely populated areas, over oceans, and over countries that lack a dense network of surface sites. Even in a densely populated country like the Netherlands the satellite instruments with resolution of the order of 10 km provide additional information about the areas in between the surface sites. Individual satellite observations are mean values over an area of typically 10 to 50 km square, and are representative for this area. This in contrast to surface measurements of short-lived species like NO/NO2, which can be influenced by very local factors (a single nearby road, a factory, etc.). Satellites typically measure a tropospheric column, which is related to the total amount/mass of air pollution in the atmosphere. This has a more direct relation with the amount of pollution released at the surface (emissions) than the concentrations measured with the surface network. In order to relate concentrations measured by the surface network to the emissions one needs detailed information on the meteorological conditions such as wind speed, vertical mixing and removal processes, as well as local condition and sources. Satellites provide extensive data sets with a single instrument, and are thereby an ideal source of information for models and data assimilation.
4.2 Using Satellite Remote Sensing as a Stand-alone tool
In this section applications are discussed that are solely based on satellite data. Combinations of satellite and models, e.g. in data assimilation or inverse modelling, are thus excluded from this section. Air quality of satellite data can be used as a stand-alone tool for the following applications:
• Impact of satellite data on policy. Maps of satellite data related to air quality have an important impact on policy makers. For example, in the Netherlands the maps of tropospheric NO2 over Europe have helped placing air quality high on the political agenda. Maps of satellite data show the global and regional distribution of air pollution and put the national situation into a larger perspective, in an objective manner.
• Information to the general public.
The general public can be informed about the air quality situation of today and in the past, by means of publicly available satellite maps. For example for people who are oversensitive for air pollution may use such maps for supporting decisions for housing and/or vacation.
• Hazard warning. During hazards because of unforeseen emissions of pollutants, for example from large-scale forest fires, satellite data can be used to track and quantify the source strength. For such applications, the satellite data should be available in near-real time. These satellite data can be provided to hazard warning systems.
• Planning of Ground-Based Measurement Sites High spatial resolution satellite data of air quality distributions are useful in determining the number of ground-based measurement sites needed to provide a reasonable coverage. Also the satellite data may show interesting features that need to be investigate in ground-based field campaigns.
• Spatial distribution of emissions. Spatial patterns in the emission databases can be verified by comparing to time averaged satellite maps of pollutants. For species like for example NO2, such maps are available at a resolution of 10x10 km2 or better, a resolution that is not feasible from ground based networks. The spatial patterns in the inventories should be checked against such maps.
• Trends in emissions. Trends in emission inventories can be verified against long-term satellite data records.

46
Although this can also be done using ground-based information, satellite data has the advantage that it is available everywhere and not just for measurements stations, for which the trends may be influenced by changes in the local emissions.
• Monitoring of remote locations. Satellite data is available globally and not just for selected measurements stations, therefore satellite data are very valuable for the monitoring of air quality for remote locations. Such remote locations are for example over seas and oceans, as well as sparsely populated regions over land. Also, regions outside of the EU for which the ground-based data are not available can be monitored using satellite data.
• Monitoring of long-range transport The long-range transport of air pollution can be monitored from day-to-day using satellite data. As such the transport of air pollutants between continents, i.e. from the U.S. east coast to Europe and from Asia to the U.S. west coast can be followed.
4.3 Integration of satellite remote sensing, ground based networks, and models
A maximal benefit of the extensive satellite data sets is obtained only when the measurements are combined with state of the art atmospheric models by means of data assimilation and inverse modelling techniques. In this way both surface and space based observations can be analysed together to reconstruct the atmospheric composition. Data assimilation (and inverse modelling) is a statistical method to objectively find the most accurate description of the distribution of atmospheric trace gases and aerosols, based on all available observations and model-predicted distributions. The objective analysis is based on knowledge about the observation noise, retrieval error and estimated accuracy of the model fields (see Figure 4-1)
Figure 4-1. A schematic overview of the data assimilation process. The measurements are compared
with model predictions of the measurements computed from the three-dimensional atmospheric composition model fields (left part of the figure). These observation-minus-forecast differences are combined with information on the quality of both the measurements and the model to derive an objective analysis of trace gases and aerosols in the atmosphere.
Data assimilation is the “beating heart” of modern numerical weather prediction (NWP) and has reached a state of considerable maturity in this field. In NWP a very diverse set of observations (surface, aircraft, balloon and satellite) is combined with a meteorological model to accurately construct the present wind field, temperature distribution, moisture and cloud cover. This accurate reconstruction of the present state of the atmosphere is a prerequisite for a successful medium-range weather prediction. The use of data assimilation techniques in atmospheric composition research and air quality forecasting is still in its infancy. However, given the availability of routine surface, aircraft, balloon, as well as

47
satellite measurements the expected benefits of the use of data assimilation are similar to those in numerical weather prediction (Within Europe, the GEMS project is one major initiative to set up such an atmospheric composition analysis system). In the future it is expected that data assimilation will become increasingly important for atmospheric composition and air-quality forecasting, and will gain a similar central position as in numerical weather prediction. It should be realised that considerable research is needed for such a data assimilation system to become successful. Much investigation work has to be done to characterise and optimise the model and the retrievals, and to choose optimal inversion strategies. One important difference with respect to meteorology is the importance of the emission and deposition of pollutants. Observations can be used to improve the knowledge of these sources and removal processes by means of inverse modelling techniques. Also the quality of the satellite retrievals is a point of concern. Presently the uncertainty of the tropospheric trace gas and aerosol retrievals is comparable to the model uncertainties (order 30-50% for e.g. tropospheric trace gas columns). Improvements can be expected from a better characterisation of surface and cloud properties, and a better model first guess resulting from model improvements. The combination of satellite observations and data assimilation has the following benefits for air quality:
• Air quality forecasts. The assimilation of near-real time satellite and in-situ observations will improve the description of the present day atmospheric chemical composition and the natural and man-made air pollution source strengths. This improved characterisation is used as starting point for an improved air-quality forecast for a few days ahead. It is important that the available near-real-time observations are used to both optimise the atmospheric concentrations as well as the emission (and deposition) fluxes.
• Improved characterisation of surface-level air pollution.
The assimilation of a combination of surface and satellite observations is anticipated to lead to an improved description of surface-level concentrations at locations where no surface station is available. In this way satellite observations can indirectly contribute to air-quality legislation monitoring.
• Improvement of emission inventories and characterization of incidental releases. Satellite observations are representative for large areas, have full coverage and often provide total column information. Because of this these observations have a more direct relation to the global distribution of emissions and can be used to improve existing emission inventories. For example, assimilation of satellite data may be used to monitor the national emissions of NOx, independent from the method based air quality networks. Daily satellite observations may be used to quantify incidental releases such as those related to major forest fires. One restriction of the current satellite capability is the missing or limited information on the diurnal variability, information that is provided by the surface networks.
• Monitoring of import/export of air pollution. Air quality in the EU is not only affected by sources in the EU, but also by pollutants imported from outside the EU. Trace gases like for example ozone and carbon monoxide can be transported from the United States and even from China to Europe. Also, pollution from the countries at the east of the EU will contribute to the air pollution within the EU. Likewise the EU countries also export pollutants to other countries. These import and export of pollutants can be quantified and monitored using assimilation of satellite data. Likewise, import and export of pollutants of the EU member states can be quantified.
• Verification of models Satellite observations have distinct advantages over surface observations for model evaluation. Because the spatial resolution of the satellites is comparable to typical model grid box sizes these measurements will be much more representative for the model value than the surface observations. The combination of surface (concentration at the ground) and satellite (column)

48
observations provides information about the quality of the description of vertical transport of pollutants, one aspect of models which is presently characterised by large uncertainties. This combination of information will bring information on all aspects of the models, like horizontal transport, vertical mixing and deep convection, dry and wet deposition and chemistry. Satellite observations are available with full global coverage and not just at station locations, which greatly extends the possibilities of verifying the spatial and temporal distribution of modelled atmospheric trace gases and aerosols.

49
5 Conclusions and Recommendations
Air pollution monitoring is traditionally based on in-situ measurements and dispersion models. This document is a review of satellite remote sensing as a new tool for air quality monitoring.
5.1 Summary and Conclusions
Satellite remote sensing of the troposphere is a rapidly developing field. Today several satellite sensors are in orbit that measure trace gases and aerosol properties relevant to air quality, of which several examples have been given in section 3.3. Satellite remote sensing data have the following unique properties:
• Near-simultaneous view over a large area; • Global coverage; • Good spatial resolution.
Although satellite data have distinct benefits, the interpretation is often less straightforward as compared to traditional in-situ measurements. The properties of satellite data are highly complementary to ground-based in-situ networks, which provide detailed measurements at specific locations with a high temporal resolution. Current legislation is strongly connected to what could be monitored reliably at ground level when the legislation came into existence. The characteristics of satellite remote sensing are fundamentally different from what is measured from the ground. To fully exploit the remote sensing potential, the legislation has to be modified, to use the satellite data with its unique characteristics. Maps of air pollution measured from space are widespread in the scientific community as well as in the media, and have a strong impact on the general public and the policy makers. The next step is to make use of satellite data in a quantitative way. Applications can be based solely on satellite data. However an integrated approach using satellite data, ground-based data and models combined with data assimilation, as described in section 0, will make the best use of the satellite remote-sensing potential, as well as of the synergy with ground-based observations. Figure 5-1 schematically shows the elements of such an integrated data assimilation system.
Figure 5-1. Schematic of the elements of chemical data assimilation systems. The assimilation process
is the central tool that combines ground-based observations, remote-sensing observations and models.
In section 4.2 the following examples of using satellite remote sensing as a stand-alone tool are described:
• Impact of satellite data on policy makers; • Information to the general public; • Hazard warning; • Planning of Ground-Based Measurement Sites; • Spatial distribution of emissions; • Trends in emissions; • Monitoring of remote locations.

50
The combination of satellite observations, ground-based networks and models, e.g. with data assimilation has the following benefits for air quality:
• Air quality forecasts; • Improved characterisation of surface-level air pollution; • Improvement of emission inventories and incidental releases; • Monitoring of import/export of air pollution; • Verification of models.
As in data assimilation numerical weather prediction, chemical data assimilation will take a large effort to implement. It should not be forgotten that it took more than a decade for satellite data to obtain a prominent role in the numerical weather forecasts. Chemical data assimilation will benefit from this experience, but still will take years to develop.
5.2 Recommendations
Although images of air quality measured from space are widespread, the quantitative usage of the data is limited. To promote the use of satellite data, the data sets should be:
• Good quality: o Based on state-of-the-art retrieval algorithms. o Validation is performed throughout the time period of the data set. o Further retrieval development needs to be encouraged to reduce the uncertainty.
• Easily accessible: o Distribution using the Internet with sophisticated web services. o Standardization of formats, units and nomenclature. o Good technical and scientific support.
• Reliable o Ensured long-term data continuity. o The quality of the data should be assessed throughout the instrument life time. o No undocumented jumps should be in the data sets due to for example algorithm
changes. o Well documented.
Good quality data Promotion of the use of satellite data starts with good quality data sets. The retrieval methods should be based on state-of-the-art methods, that should be well-established using extensive validation. Validation should be performed throughout the time period of the data sets. Given that satellite remote sensing of air quality is a young field, it is anticipated that analysis methods can be further developed to reduce the uncertainty. A new development is the combination of data from two or more sensors in the retrieval process, for example by combining UV and TIR instruments to improve the observations of tropospheric ozone. Another possible developments is the integration of retrieval and data assimilation (radiance assimilation). Radiance assimilation will demand for fast forward radiative transfer models. For applications of radiance assimilation a direct interaction between the instrument and assimilation teams is essential (on especially calibration and forward modeling issues). Easily accessible data sets: The satellite data should be easily accessible on the Internet. It is favorable to have a single web portal for tropospheric satellite data sets. The web sites should not only distribute data, but also have web services that allow for example to subset data in space and time and to subscribe to subsetted data sets. This may be important for users who are interested in monitoring air quality in a specific location. Also the web sites should support online analysis of data, for example by making 1-D or 2-D plots. The advantage of such online analysis is that people don’t need the tools for reading the often complex data files and do not have to transport these often large files to their local computers. Different satellite data producers have been using different data formats, different units and different nomenclature. Harmonizing data formats, units and nomenclature for different data sets will make it much more easy to use data sets of different satellite instruments. The retrieval products should be complete, e.g. the retrieved quantity should be complemented by detailed error covariances and averaging kernels and an analysis of systematic and random error components. An important aspect for users new to satellite data is scientific support. An example of scientific support are workshops where new users are trained in working with the satellite data. During such

51
workshops new users will get hands-on experience and also there will be interaction between people from the satellite community and these new users. Reliable data sets: An important aspect of reliable data sets is the long-term data continuity. There is a problem after the end of the ENVISAT and EOS-Aura missions because there are no dedicated satellite chemistry missions planned. In addition to the space-segment, also long-term continuity should be ensured for the ground segment. Other aspects of reliable data sets are quality control (this is daily effort), the absence of undocumented jumps in data sets, and complete and up-to-date documentation. Integration of satellite observations, ground-based observations and models In the coming year data assimilation will become more and more important for integrating satellite, ground based and model data. The development of chemical data assimilation systems is a huge effort. It is recommended to support this development of data assimilation systems. Because of the extent of this effort interaction between institutes involved (meteorological centers like ECMWF, research institutes and universities, environmental agencies) should be encouraged. One first initiative in this direction is the GEMS project, part of the EU GMES effort. One interesting option would be to set up a distributed center for chemical data assimilation. This centre should exploit the existing expertise in the field of data assimilation, numerical weather prediction and atmospheric composition research. The implementation of an integrated system of satellite and ground-based air quality measurements in combination with models and data assimilation, as described in the IGACO report, should be actively supported. Future quality legislation The current air quality legislation is based on observations from ground-based networks. Is recommended to investigate how legislation may benefit from making optimal use of the satellite remote sensing potential. The following specific recommendations are made: R_1. Establish a long-term (distributed) data archive and distribution center for satellite air quality
data sets. This center should ensure harmonization of formats, units, nomenclature, etc, and should have sophisticated web services and should be part of GMES.
R_2. Support the further development of retrieval developments to improve the accuracy of the
satellite observations. New developments are for example the combination data from two or more sensors in the retrieval process, and radiance assimilation.
R_3. Support satellite mission to ensure long-term data continuity.
Currently no air quality monitoring sensors are planned until the 2020 timeframe. This situation should be avoided by supporting missions targeted on measuring air quality from ESA/EU (GMES Sentinels) for the period 2010-2020, and for the long-term ESA/EUMETSAT missions.
R_4. Promote the use of satellite data, e.g. by organizing workshops where new users are trained in
using remote sensing data. A wider user community will optimize the use of satellite remote sensing potential and a such fits in the GMES philosophy.
R_5. Investigate the possibility to establish a (distributed) chemical data assimilation center, with a
strong link to ECMWF. Such a system could be part of GMES.

52
R_6. Support the implementation of an integrated system of satellite and ground-based air quality measurements in combination with models and data assimilation, as described in the IGACO report.
R_7. Initiate projects for the further development of chemical data assimilation, in which the
satellite, ground-based, and model communities are involved. A part from investing in chemical data assimilation systems, an important objective of these studies will be to improve the connections between the different research communities. These projects could be part of FP7 and ESA/EUMETSAT research programs.
R_8. Investigate how legislation may benefit from making use of the potentials of air pollution observations from satellites.

53
6 References
Al-Saadi, J., et al. (2005), Improving national air quality forecasts with satellite observations, Bull. Am. Met. Soc., pp. 1249–1261 doi:10.1175/BAMS–86–9–1249.
Beirle, S., U. Platt, M. Wenig, and T. Wagner (2004), Highly resolved global distribution of tropospheric no2 using gome narrow swath mode data, Atmos. Chem. Phys., 4, 1913–1924.
Blond, N., and R.Vautard (2004), Three-dimensional ozone analyses and their use for short-term ozone forecasts, J. Geophys. Res., 109, doi:10.1029/2004JD004,515.
Boersma, K. F., H. Eskes, and E. J. Brinksma (2004), Error analysis for topospheric no2 retrieval from space, J. Geophys. Res., 109(D04311), doi:1029/2003JD003,962.
Chance, K., P. I. Palmer, R. J. D. Spurr, R. V. Martin, T. P. Kurosu, and D. J. Jacob (2000), atellite observations of formaldehyde over north �ptimiz from gome, Geophys. Res. Lett., 27, 3461–3464.
Chowdhary, J., B. Cairns, M. Mishchenko, P. Hobbs, G. Cota, J. Redemann, K. Rutledge, B. Holben, and E. Russel (2005), Retrieval of aerosol scattering and absorption properties from photopolarimetric observations over the ocean during the clams experiment, J. Atmos. Sci., 62, 1093–1117.
Eisinger, M., and J. P. Burrows (1998), Tropospheric sulfur dioxide observed by the ers-2 gome instrument, Geophys. Res. Lett., 25(22), 177–4180, 10.1029/1998GL900,128.
Fishman, J., and J. C. Larsen (1987), Distribution of total ozone and stratospheric ozone in the tropics: Implications for the distribution of tropospheric ozone, J. Geophys. Res., 92, 6627–6634.
Frankenberg, C., U. Platt, and T. Wagner (2005), Retrieval of co from sciamachy onboard envisat: detection of strongly polluted areas and seasonal patterns in global co abundances, Atmos. Chem. Phys., 5, 1639–1644.
Herman, M., J.-L. Deuzé, A. Marchand, B. Roger, and P. Lallart (2005), Aerosol remote sensing from polder/�ptim over the ocean: Improved retrieval using a nonspherical particle model, J. Geophys. Res., 110, doi:10.1029/2004JD004,798.
IGACO (2004), Igos atmospheric chemistry theme report 2004, Tech. Rep. ESA SP-1282, Report GAW No. 159 (WMO TD No. 1235), IGOS.
Konovalov, B., M. Beekmann, A. Richter, and J. P. Burrows (2005), Inverse �ptimize of the spatial distribution of nox emissions on a continental scale using satellite data, Atmos. Chem. Phys. Discuss., 5, 12641-12695, 2005, 5, 12,641–12,695.
Kruger, A. J. (1983), Sighting of el chichon sulfur dioxide clouds with the nimbus t total ozone mapping spectrometer, Science, 220, 1277–1279.
Kaufman, Y. J., O. Boucher, D. Tanre, M. Chin, L. A. Remer, and T. Takemura (2005), Aerosol anthropogenic component estimated from satellite data, Geophys. Res. Lett., 32, doi:10.1029/2005GL023,125.
King, M. D., Y. J. Kaufman, D. Tanré, and T. Nakajima (1999), Remote sensing of tropospheric aerosols from space: Past, present, and future., Bull. Am. Met. Soc., Vol. 80(No. 11), 2229–2259.
Krotkov, A., N, S. A. Carn, A. Krueger, P. Bhartia, and K. Yang (2006), Ieee transactions on geoscience and remote sensing, IEEE Trans. Geo. Rem. Sens., p. doi:10.1109/TGRS.2005.861932.
van Noije, T., et al. (2006), Multi-model ensemble simulations of tropospheric no2 compared with gome retrievals for the year 2000, Atmos. Chem. Phys., 6, 2943–2979.
Petritoli, A., et al. (2004), First comparison between ground-based and satellite-borne measurements of tropospheric nitrogen dioxide in the po basin, J. Geophys. Res., 109(D15307), doi:10.1029/2004JD004,547.
Richter, A., V. Eyring, J. P. Burrows, H. Bovensmann, A. Lauer, B. Sierk, and P. J. Crutzen (2004), Satellite measurements of no2 from international shipping emissions, Geophys. Res. Lett., 31, doi:10.1029/2004GL020,822.
Richter, A., J. Burrows, H. Nuess, H. Granier, and U. Niemeier (2005), Increase in tropospheric nitrogen dioxide over china observed from space, Nature, 437, doi:10.1038/nature04,092.
Robles-Gonzalez, C., J. P. Veefkind, and G. de Leeuw (2000), Aerosol optical depth over �ptimi in august 1997 derived from atsr-2 data, Geophys. Res. Lett., 27(7), 955–956

54
doi:10.1029/1999GL010,962. Rodgers, C. D. (2000), Inverse methods for �ptimize�ic sounding, Series on atmospheric,
oceanic and planetary physics, vol. 2, World Scientific, Singapore. Spinhirne, J. D., S. P. Palm, W. D. Hart, D. L. Hlavk, and E. J. Welton (2005), Cloud and aerosol
measurements from glas: Overview and initial results, Geophys. Res. Lett., 32(doi:10.1029/2005GL023507).
Thomas, W., E. Hegels, S. Slijkhuis, R. Spurr, and K. Chance (1998), Detection of biomass burning combustion products in southeast asia from backscatter data taken by the gome spectrometer, Geophys. Res. Lett., 25(9), 1317–1320.
Torres, O., P. K. Bhartia, J. R. Herman, Z. Ahmad, and J. Gleason (1998), Derivation of aerosol properties from satellite measurements of backscattered ultraviolet radiation: Theoretical basis, J. Geophys. Res., 103(D14), 17,099–17,110, 10.1029/98JD00,900.
Valks, P. J. M., R. B. A. Koelemeijer, M. van Weele, P. van Velthoven, J. P. F. Fortuin, and H. Kelder (2003), Variability in tropical tropospheric ozone: Analysis with global ozone monitoring experiment observations and a global, model, J. Geophys. Res., 108(D11), doi:10.1029/2002JD002,894.
Veefkind, J. P., J. F. de Haan, E. J. Brinksma, M. Kroon, and P. F. Levelt (2006), Total ozone from the ozone monitoring instrument (omi) using the doas technique, IEEE Trans. Geo. Rem. Sens., Vol. 44(5), 1239–1244, doi: 10.1109/TGRS.2006.871,204.
Wenig, M., N. Spichtinger, A. Stohl, G. Held, S. Beirle, T. Wagner, B. Jaehne, and U. Platt (2002), Intercontinental transport of �ptimize oxide pollution plumes, Atmos. Chem. Phys. Discuss., 2, 2151–2165.
Ziemke, J. R., S. Chandra, and P. K. Bhartia (2001), “cloud slicing”: A new technique to derive upper tropospheric ozone from satellite measurements, J. Geophys. Res., 106, 9853–9867.
Ziemke, J. R., S. Chandra, B. N. Duncan, L. Froidevaux, P. K. Bhartia, and P. F. Levelt (2006), Tropospheric ozone determined from aura omi and mls: Evaluation of measurements and comparison with the global modeling initiative’s chemical tracer model, J. Geophys. Res., p. submitted.

55
Appendix A: List of Organizations
The table below list all organizations that have a significant impact on the development, implementation or use of satellite data on air quality. Name Acronym Type Geographical
scope Role w.r.t air quality satellite data
European Space Agency
ESA Space agency
Europe Satellite construction and launch Satellite instrument specification Funding development and services based on satellite data Political influence on development of environmental monitoring systems
National Aeronautics and Space Administration
NASA Space agency
United States Satellite construction and launch Satellite instrument specification Funding development and services based on satellite data Political influence on development of environmental monitoring systems
European Union
EU Funding development and services based on satellite data Political influence on development of environmental monitoring systems
European Environment Agency
EEA
US Environmental Protection Agency
EPA USA Political influence on development of environmental monitoring systems. User of satellite data.
Co-operative programme for monitoring and evaluation of air pollutants in Europe
EMEP Monitoring Institution
Europe Potential user of satellite data.
European Centre for the Medium-Range Weather Forecast
ECMWF Europe User of satellite data. PI for the GEMS Project.
National Oceanic and Atmospheric Administration
NOAA USA Satellite instrument specification. Provides satellite data and services based on satellite data. Political influence on development of environmental monitoring systems. User of satellite data.
World Health Organization
WHO
World Meteorological Organization
WMO
UN Environmental Programme
UNEP
UN Economic Commission for Europe
UNECE

56
Appendix B: List of Relevant Projects
There are several large international projects that deal in one way or another with satellite observations of air quality. The table below includes some basic information on the project, but focuses on the activities which are relevant for air quality and satellites. Name Funding
organization Budget Period Goals/activities
ACCENT http://www.accent-network.org/
EU FP6 (NOE)
2004-2009
• Promote a common European strategy for research on atmospheric composition sustainability
• Develop and maintain durable means of communication and collaboration within the European scientific community
Facilitate this research and to �ptimize the interactions with policy-makers and the general public.
AIR4EU www.air4eu.nl
EU FP6 2004 – 2006
• Formulate a guidance document on best practices for the combined use of monitoring methods and models to assess Air Quality in Europe from hotspot/street level to continental level for various users on local, regional, national and European level and for various purposes.
• Prepare maps of air quality in Europe based on the available European wide data sets and best technique of assessment.
CAPACITY www.knmi.nl/capacity
ESA 2003 -2005
• define satellite components of a future operational system to monitor atmospheric composition for implementation within the Space Component of GMES.
GEMS www.gems.info
EU FP6 (IP)
17 M€ (12 M€ EU)
2005 – 2009
Create a new European operational system for operational global monitoring of atmospheric chemistry and dynamics and an operational system to produce improved medium-range & short-range air-chemistry forecasts, • through much improved
exploitation of satellite data. PROMOTE www.gse-promote.org
ESA 1.5 M€ 2004-2005
• Deliver information services to users with a statutory task to monitor air quality.
• Establish negotiation platform between providers and users on the service requirements and appraisal
• Use data from models, groundbased and satellite based measurements for service input
PROMOTE 2 www.gse-promote.org
ESA 2006 – 2009
• Extension of the Promote goals.

57
Appendix C: List of Relevant Satellite Instruments
AIRS Atmospheric Infrared Sounder Instrument on the NASA EOS Aua satellite
ALADIN Atmospheric Laser Doppler Instrument Instrument on the ESA ADM-Aeolus satellite
APS Aerosol Polarimeter Sensor Instruments on the NPOESS satellites (A)ATSR (Advanced) Along Track and Scanning
Radiometer Instrument on the ESA ERS-2 and ENVISAT satellites
ATLID Backscatter Lidar Instrument on the ESA EarthCare satellite.
AVHRR Advance Very High Resolution Radiometer
Instruments on NOAA and Eumetsat METOP satellites
CALIPSO Cloud-Aerosol Lidar and Infrared Pathfinder Satellite Observation
Instrument on the NASA CloudSat satellite
GLAS Geoscience Laser Altimeter System Instrument on the NASA IceSat satellite GOME Global Ozone Monitoring Experiment Instrument on the ESA ERS-2 satellite GOME-2 Global Ozone Monitoring Experiment 2 Instruments on the Eumetsat METOP
satellites IASI Infrared Atmospheric Sounding
Interferometer Instruments on the Eumetsat METOP satellites
MERIS Medium Resolution Imaging Spectrometer Instrument
Instrument on the ESA Envisat satellite
MVIRI Meteosat Visible and InfraRed Imager Instrument on the EUMETSAT METEOSAT satellites
MISR Multi-angle Imaging SpectroRadiometer Instrument on the NASA EOS Aura satellite
MLS Microwave Limb Sounder Instrument on the NASA EOS Aura satellite
MODIS Moderate Resolution Imaging Spectroradiometer
Instruments on the NASA EOS Terra and Aqua satellites
MOPITT Measurements of Pollution in the Troposphere
Instrument on the NASA EOS Terra satellite
OMI Ozone Monitoring Instrument Instrument on the NASA EOS Aura satellite
OMPS Ozone Monitoring Profiling Suite Instruments on the NPP and NPOESS satellites
POLDER Polarization and Directionality of the Earth’s Reflectances
Instruments on the JAXA ADEOS and CNES Parasol satellites
SCIAMACHY Scanning Imaging Absorption SpectroMeter for Atmospheric ChartographY
Instrument on the ESA Envisat satellite
TOMS Total Ozone Mapping Spectrometer Instruments on the NASA Nimbus-7 and EP satellites
SEVIRI Spinning Enhanced Visible and Infrared Imager
Instrument on the EUMETSAT MSG satellites
TES Tropospheric Emission Sounder Instrument on the NASA EOS Aura satellite
VIIRS Visible Infrared Imager / Radiometer Suite
Instruments on the NPP and NPOESS satellites

58
EUR 22542 EN – DG Joint Research Centre, Institute for Environment and Sustainability Title: Scientific review on remote sensing of air pollution Authors: P. Veefkind, R.F. van Oss, H. Eskes, A. Borowiak, F. Dentner and J. Wilson Luxembourg: Office for Official Publications of the European Communities ISSN: 1018-5593 2007 – 57 pp. EUR - Scientific and Technical Research series

59
The mission of the JRC is to provide customer-driven scientific and technical support for the conception, development, implementation and monitoring of EU policies. As a service of the European Commission, the JRC functions as a reference centre of science and technology for the Union. Close to the policy-making process, it serves the common interest of the Member States, while being independent of special interests, whether private or national.
Related Documents