The American Middle Class Under Stress Sherle R. Schwenninger and Samuel Sherraden New America Foundation April 2011

Welcome message from author
This document is posted to help you gain knowledge. Please leave a comment to let me know what you think about it! Share it to your friends and learn new things together.
Transcript

The American Middle Class Under Stress
Sherle R. Schwenninger and Samuel Sherraden
New America Foundation
April 2011

The American Dream is now to get
out of debt.
David Rosenberg
Chief Economist & Strategist, Gluskin Sheff
1
Tottering Pillars of America’s
Middle Class
1. Jobs and Wages
2. The Social Wage: Education, Health Care and Other Essential Goods
3. Wealth and Home Ownership
4. Retirement Security
5. Signs of Middle Class Decline
2
Jobs and Wages:
High Unemployment
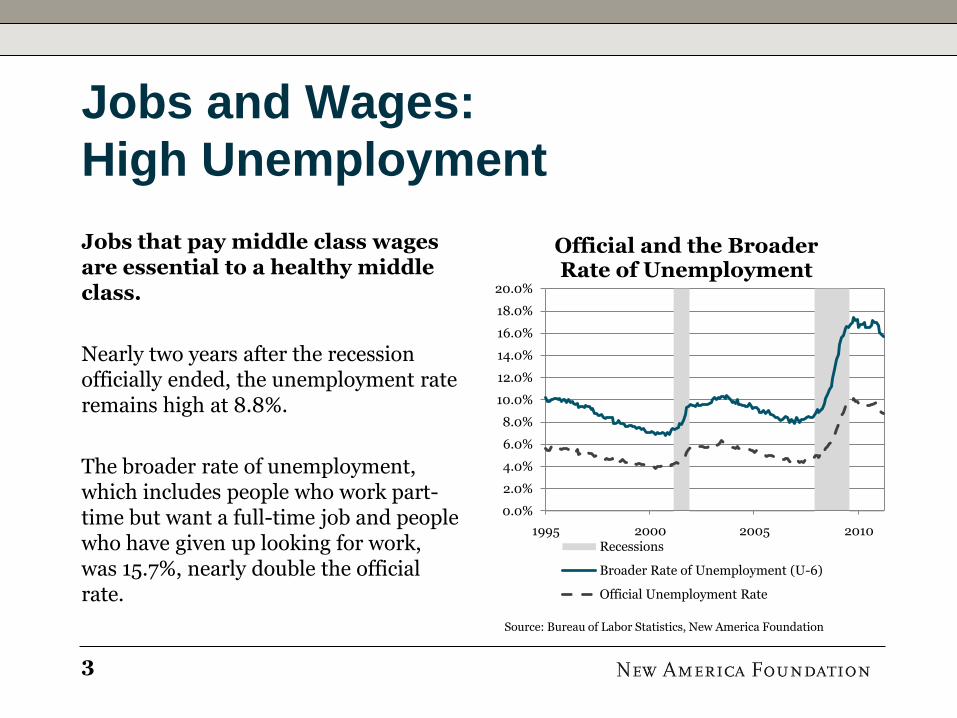
Jobs that pay middle class wages are essential to a healthy middle class.
Nearly two years after the recession officially ended, the unemployment rate remains high at 8.8%.
The broader rate of unemployment, which includes people who work part-time but want a full-time job and people who have given up looking for work, was 15.7%, nearly double the official rate.
0.0%
2.0%
4.0%
6.0%
8.0%
10.0%
12.0%
14.0%
16.0%
18.0%
20.0%
1995 2000 2005 2010
Official and the Broader Rate of Unemployment
Recessions
Broader Rate of Unemployment (U-6)
Official Unemployment Rate
Source: Bureau of Labor Statistics, New America Foundation
3
A Jobless Recovery
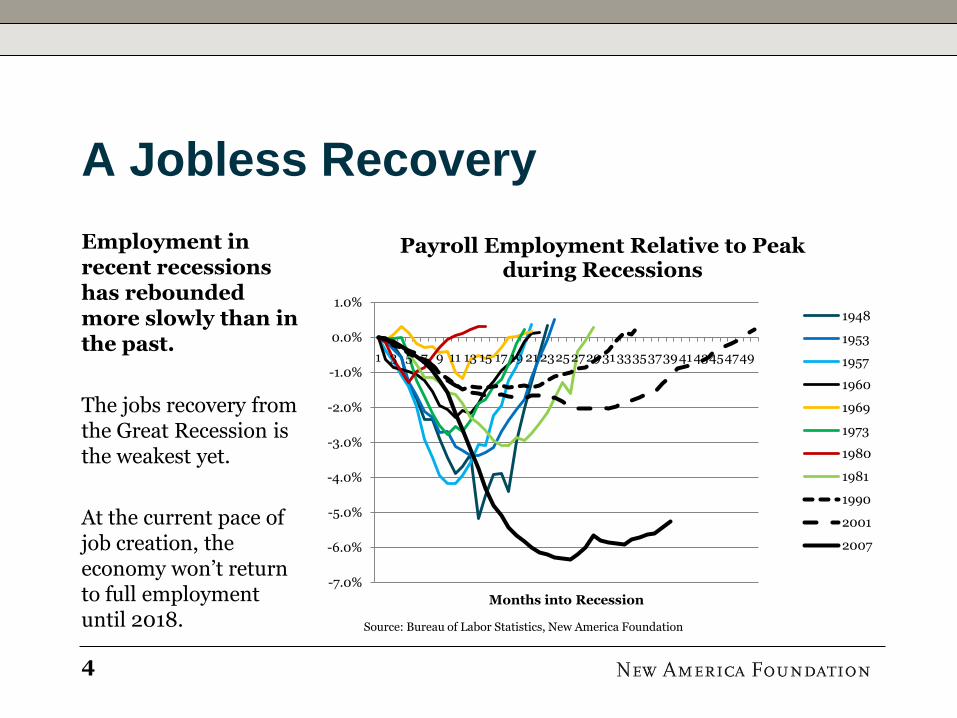
Employment in recent recessions has rebounded more slowly than in the past.
The jobs recovery from the Great Recession is the weakest yet.
At the current pace of job creation, the economy won’t return to full employment until 2018.
-7.0%
-6.0%
-5.0%
-4.0%
-3.0%
-2.0%
-1.0%
0.0%
1.0%
1 3 5 7 9 11 13 15 17 19 212325272931333537394143454749
Months into Recession
Payroll Employment Relative to Peak during Recessions
1948
1953
1957
1960
1969
1973
1980
1981
1990
2001
2007
Source: Bureau of Labor Statistics, New America Foundation
4

More of the Employed Have
Low-Income Jobs
Middle-income jobs are disappearing from the economy.
The share of middle-income jobs in the United States has fallen from 52% in 1980 to 42% in 2010.
Middle-income jobs have been replaced by low-income jobs, which now make up 41% of total employment.
0%
10%
20%
30%
40%
50%
60%
1980 1985 1990 1995 2000 2005 2010
Share of Total Employment
Private Sector Middle-Income
Private Sector Low-Income
Government Jobs
Source: Bureau of Labor Statistics, Westwood Capital
5

The Under-Employed American
The problem is not lack of skills, but the structure of the job market.
17 million Americans with college degrees are doing jobs that require less than the skill levels associated with a bachelor’s degree.
Just under 30% of flight attendants and 16% of telemarketers have bachelor’s degrees even though this credential is not necessary for these jobs.
OccupationPercent with
BA/BS Number
Waiter/Waitress 13.4 317,759
Flight Attendants 29.8 29,645
Laborers 5.07 118,441
Janitors 5.01 107,457
Truck Drivers 5.09 85,205
Bartenders 16 80,542
Food Preparation 7.24 63,737
Telemarketers 15.85 54,713
Postmen/women 13.95 49,452
Parking Lot Attendants 13.74 18,749
Source: Bureau of Labor Statistics
6
Real Wages are Falling
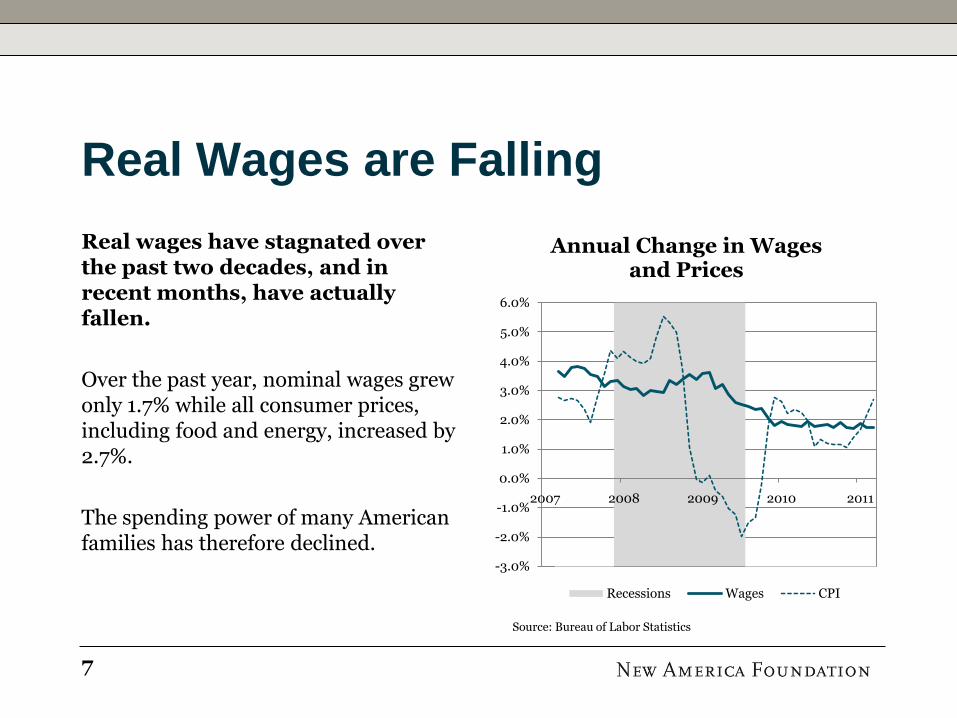
Real wages have stagnated over the past two decades, and in recent months, have actually fallen.
Over the past year, nominal wages grew only 1.7% while all consumer prices, including food and energy, increased by 2.7%.
The spending power of many American families has therefore declined.
-3.0%
-2.0%
-1.0%
0.0%
1.0%
2.0%
3.0%
4.0%
5.0%
6.0%
2007 2008 2009 2010 2011
Annual Change in Wages and Prices
Recessions Wages CPI
Source: Bureau of Labor Statistics
7

Government Transfers Have Partly
Offset the Stagnation of Wages
Wages and salaries have fallen from 60% of personal income in 1980 to 51% in 2010.
Government transfers have risen from 11.7% of personal income in 1980 to 18.4% in 2010, a post-War high.
There are 8.5 million people receiving unemployment insurance and over 40 million receiving food stamps.
0%
10%
20%
30%
40%
50%
60%
70%
1980 1985 1990 1995 2000 2005 2010
Share of Personal Income
Wages and Salaries
Government Transfers
Source: Bureau of Economic Analysis, New America Foundation
8

The Erosion of the Social Wage:
Rising Health Expenditures
Despite an increase in government transfers, America’s social wage has been eroded by the rising cost of health care and education.
Health care spending increased from 9.5% of personal consumption in 1980 to 16.3% in 2010.
Many households cannot afford rising insurance premiums and out-of-pocket health care costs, leaving nearly 50 million Americans without adequate health coverage.
8.0%
9.0%
10.0%
11.0%
12.0%
13.0%
14.0%
15.0%
16.0%
17.0%
1980 1985 1990 1995 2000 2005 2010
Health Care Spending as a Share of Personal
Consumption
Source: Bureau of Economic Analysis
9

Higher Education is Not
Affordable
A college education is considered necessary to get a good job, but for many families college is no longer affordable.
The average cost of one year of college is $21,000. After adjusting for inflation, it has risen 72% since 1990.
For households with incomes at the 40th and 60th percentiles, one year of college tuition makes up 54% and 40% of their annual income, respectively. 0%
10%
20%
30%
40%
50%
60%
1980 1985 1990 1995 2000 2005 2010
Cost of 1 year of College Tuition as a Share of Annual
Household Income
60th Percentile of Income
40th Percentile of Income
Source: US Census Bureau, National Center for Education Statistics
10
The Emergence of “Screwflation”
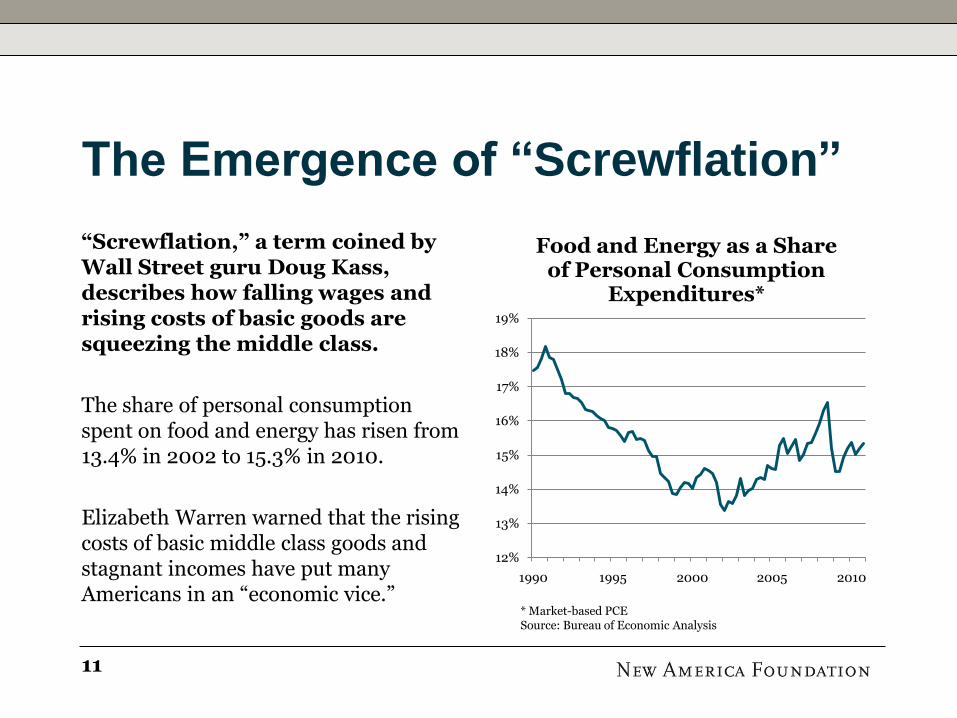
“Screwflation,” a term coined by Wall Street guru Doug Kass, describes how falling wages and rising costs of basic goods are squeezing the middle class.
The share of personal consumption spent on food and energy has risen from 13.4% in 2002 to 15.3% in 2010.
Elizabeth Warren warned that the rising costs of basic middle class goods and stagnant incomes have put many Americans in an “economic vice.”
12%
13%
14%
15%
16%
17%
18%
19%
1990 1995 2000 2005 2010
Food and Energy as a Share of Personal Consumption
Expenditures*
* Market-based PCESource: Bureau of Economic Analysis
11
The Great Recession Dealt a Blow
to Middle Class Wealth
$0
$10,000
$20,000
$30,000
$40,000
$50,000
$60,000
$70,000
US
D b
illi
on
s
Household Net Worth
Source: Federal Reserve
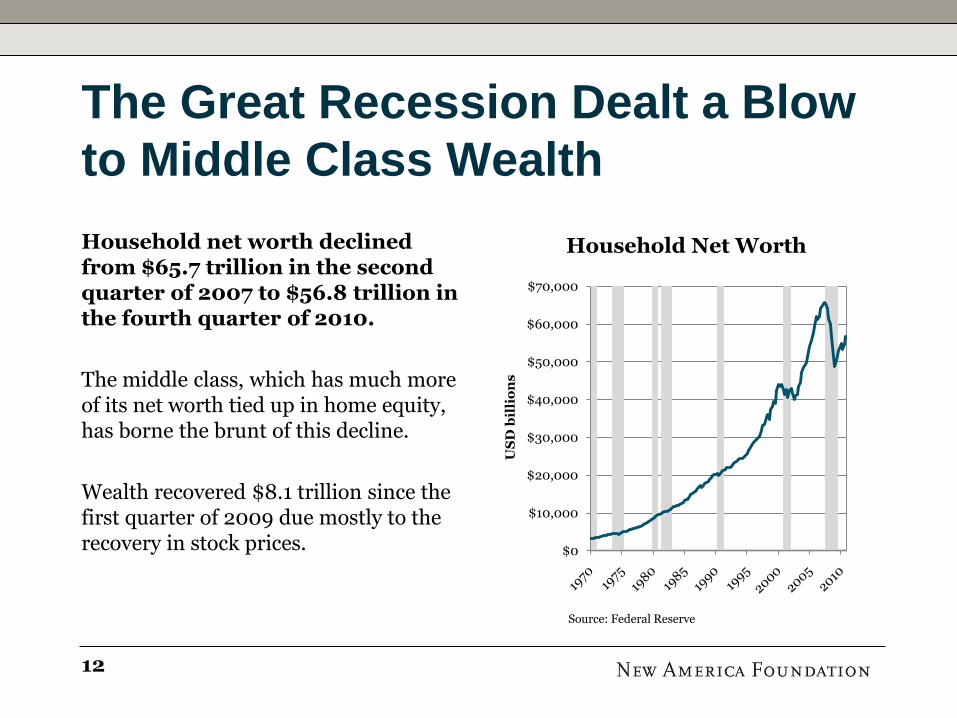
Household net worth declined from $65.7 trillion in the second quarter of 2007 to $56.8 trillion in the fourth quarter of 2010.
The middle class, which has much more of its net worth tied up in home equity, has borne the brunt of this decline.
Wealth recovered $8.1 trillion since the first quarter of 2009 due mostly to the recovery in stock prices.
12
Home Equity and Wealth
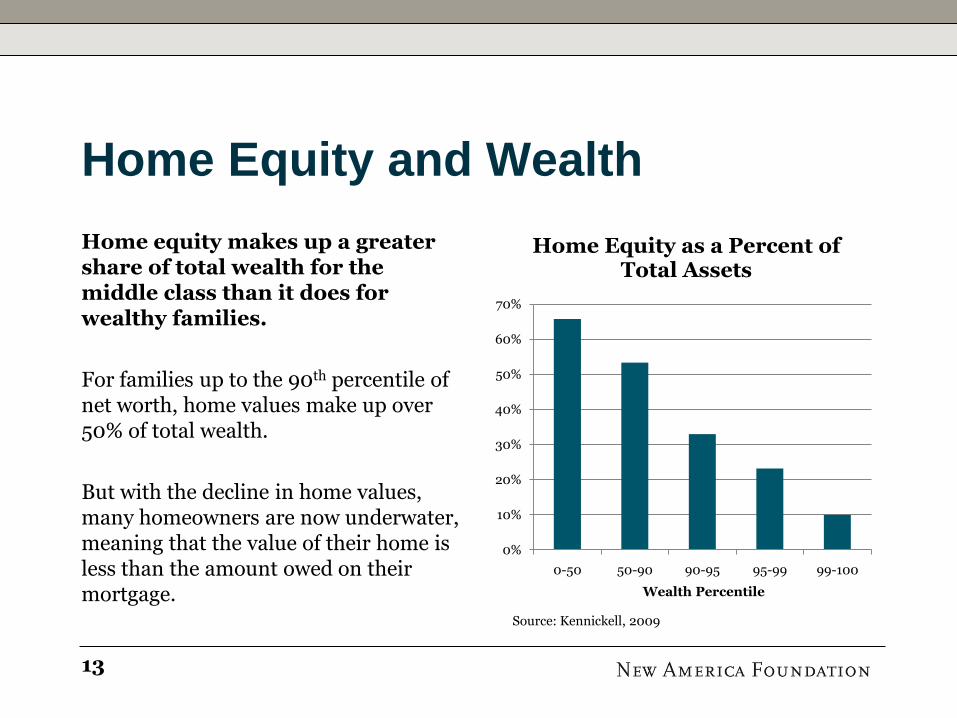
Home equity makes up a greater share of total wealth for the middle class than it does for wealthy families.
For families up to the 90th percentile of net worth, home values make up over 50% of total wealth.
But with the decline in home values, many homeowners are now underwater, meaning that the value of their home is less than the amount owed on their mortgage.
0%
10%
20%
30%
40%
50%
60%
70%
0-50 50-90 90-95 95-99 99-100
Wealth Percentile
Home Equity as a Percent of Total Assets
Source: Kennickell, 2009
13

Uneven Recovery:
Stocks & Home Prices
40
50
60
70
80
90
100
110
120
130
2006 2007 2008 2009 2010 2011
Equity and Home Prices Diverge
S&P 500 Case-Shiller Home Price Index
Source: Standard and Poors, New America Foundation
Equity markets have recovered much of their losses, but housing prices have not.
While the outlook in the equity market is uncertain, housing prices have resumed their decline and could fall another 10% to 20%, due to the pressure from the shadow inventory.
At the end of 2010, 23.1% of all residential properties with a mortgage were underwater, with total negative equity nationwide of $750 billion.
14

Deleveraging Remains a Painful
Reality
Over the past three decades, household debt as a share of disposable income increased from 68% to 116%.
Households have begun to pay down debt, but have a long way to go to get back to the 1990s average of 85% of disposable income.
0%
20%
40%
60%
80%
100%
120%
140%
1980 1985 1990 1995 2000 2005 2010
Household Debt as a Share of Disposable Income
Source: Federal Reserve, Bureau of Economic Analysis
1990-1999 = 85%
1980-1989 = 70%
Average 2000-Present = 114%
15
A Less Secure Retirement
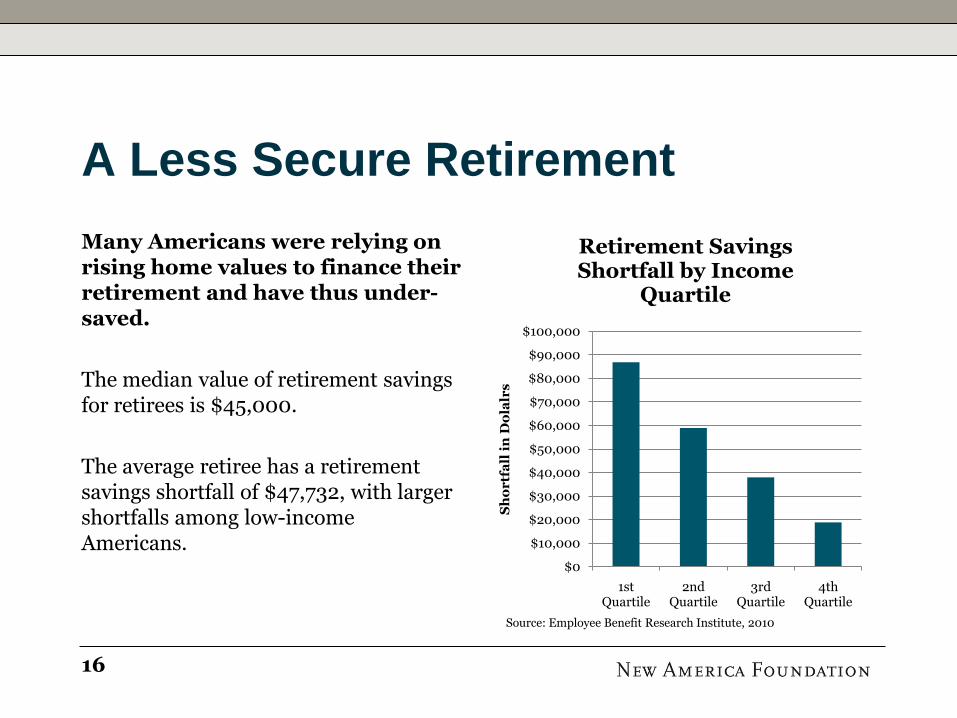
Many Americans were relying on rising home values to finance their retirement and have thus under-saved.
The median value of retirement savings for retirees is $45,000.
The average retiree has a retirement savings shortfall of $47,732, with larger shortfalls among low-income Americans.
$0
$10,000
$20,000
$30,000
$40,000
$50,000
$60,000
$70,000
$80,000
$90,000
$100,000
1st Quartile
2nd Quartile
3rd Quartile
4th Quartile
Sh
or
tfa
ll i
n D
ola
lrs
Source: Employee Benefit Research Institute, 2010
Retirement Savings Shortfall by Income
Quartile
16
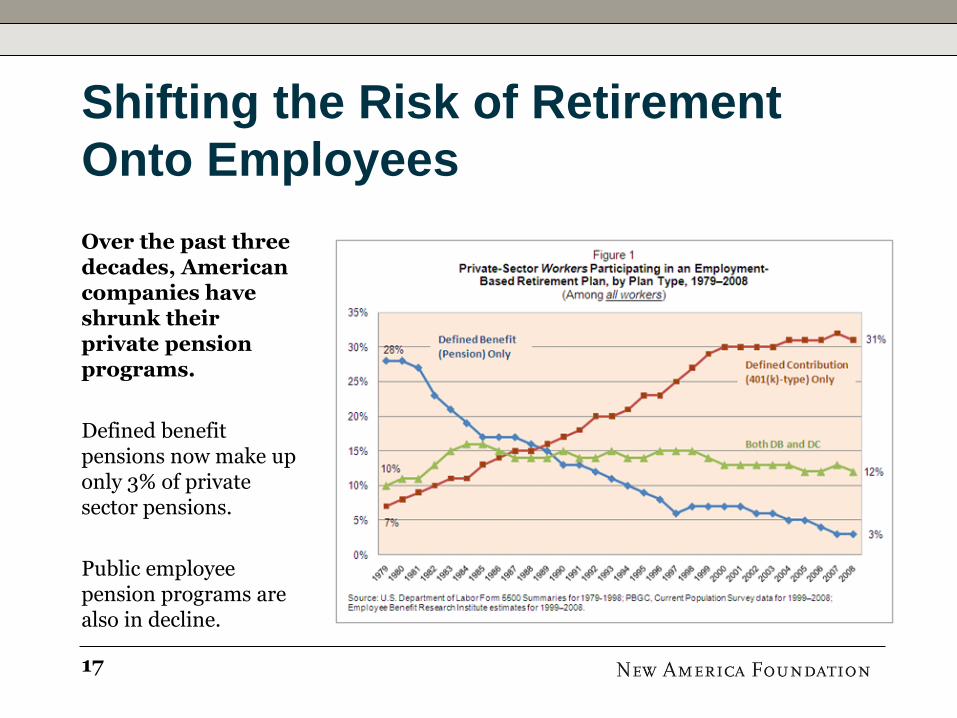
Shifting the Risk of Retirement
Onto Employees
Over the past three decades, American companies have shrunk their private pension programs.
Defined benefit pensions now make up only 3% of private sector pensions.
Public employee pension programs are also in decline.
17
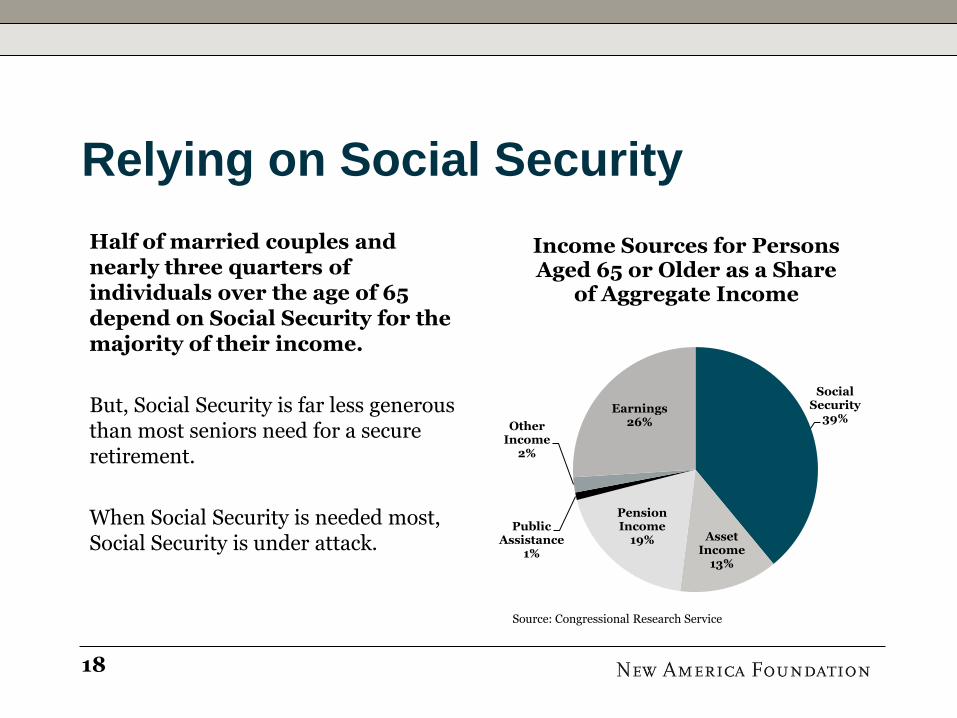
Relying on Social Security
Social Security
39%
Asset Income
13%
Pension Income
19%Public
Assistance1%
Other Income
2%
Earnings26%
Income Sources for Persons Aged 65 or Older as a Share
of Aggregate Income
Source: Congressional Research Service
Half of married couples and nearly three quarters of individuals over the age of 65 depend on Social Security for the majority of their income.
But, Social Security is far less generous than most seniors need for a secure retirement.
When Social Security is needed most, Social Security is under attack.
18

Signs of Middle Class Decline:
More at the Top, Less for the Middle
The top 1% of income earners in the United States account for 21% of aggregate income.
The wealthiest 1 percent own about 35% of the nation’s wealth.
The top 20% of income earners account for nearly 40% of total consumption.
0%
5%
10%
15%
20%
25%
30%
1920 1930 1940 1950 1960 1970 1980 1990 2000 2010
Income Share of the Top 1% of Earners*
* Including capital gainsSource: Top Incomes Database, UC Berkeley
19
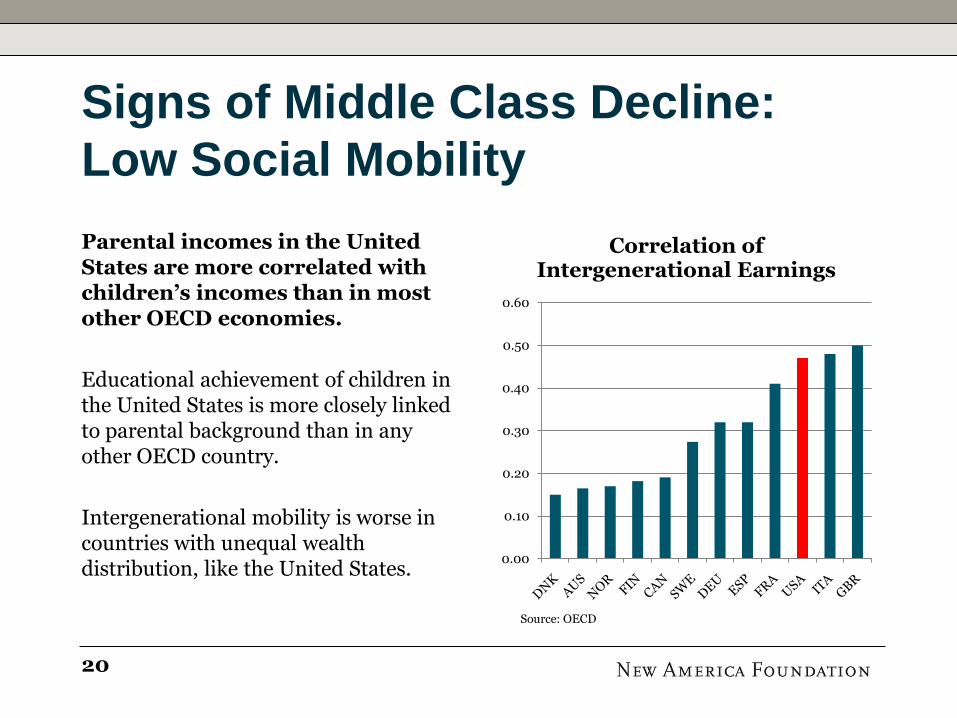
Signs of Middle Class Decline:
Low Social Mobility
0.00
0.10
0.20
0.30
0.40
0.50
0.60
Correlation of Intergenerational Earnings
Source: OECD
Parental incomes in the United States are more correlated with children’s incomes than in most other OECD economies.
Educational achievement of children in the United States is more closely linked to parental background than in any other OECD country.
Intergenerational mobility is worse in countries with unequal wealth distribution, like the United States.
20
Related Documents