U S C E N S U S B U R E A U Helping You Make Informed Decisions U.S. Department of Commerce Economics and Statistics Administration U.S. CENSUS BUREAU The American Community— Blacks: 2004 American Community Survey Reports ACS-04 Issued February 2007

Welcome message from author
This document is posted to help you gain knowledge. Please leave a comment to let me know what you think about it! Share it to your friends and learn new things together.
Transcript

U S C E N S U S B U R E A U Helping You Make Informed Decisions
U.S. Department of Commerce Economics and Statistics Administration
U.S. CENSUS BUREAU
The American Community— Blacks: 2004American Community Survey Reports
ACS-04
Issued February 2007

Acknowledgments This report was drafted for the U.S. Census Bureau’s Racial StatisticsBranch by staff of the Pew Hispanic Center, Washington, DC(Roberto Suro, Rakesh Kocchar, Jeffrey Passel, GabrielEscobar, Sonya Tafoya, Richard Fry, Dulce Benevides, andMichelle Wunsch). Edward Spar and Frederick J. Cavanaugh ofSabre Systems, Inc. provided initial review of the report.
Direction for the report was provided by Jorge H. del Pinal, formerAssistant Division Chief, Special Population Statistics, PopulationDivision. Overall direction was provided by Howard Hogan,Associate Director for Demographic Programs, and Enrique J.Lamas, Chief, Population Division.
The report was finalized by Nicholas A. Jones, PopulationDivision. Within the Population Division, Frank B. Hobbs andClaudette E. Bennett provided subject matter review and guid-ance, Letha L. Clinton and Maryam Asi provided principal statisti-cal assistance, and Anika Juhn and Pedro Martinez prepared themaps. Principle editorial review and guidance was provided byMarjorie F. Hanson, Data Integration Division. In addition, Lisa M.Blumerman, Kenneth R. Bryson, and Deborah H. Griffin of theAmerican Community Survey Office provided helpful comments onthis report.
Dale Garrett, under the guidance of Alfredo Navarro andAnthony G. Tersine, Jr. of the Decennial Statistical StudiesDivision, conducted sampling review.
Jan Sweeney, Theodora Forgione, and Jamie Peters of theAdministrative and Customer Services Division, Walter C. Odom,Chief, provided publications and printing management, graphicsdesign and composition, and editorial review for print and electronicmedia. General direction and production management were providedby Wanda Cevis, Chief, Publications Services Branch.

U.S. Census Bureau The American Community—Blacks: 2004 1
The American Community—Blacks: 2004
INTRODUCTION
This report presents a portrait of theBlack or African-American popula-tion in the United States.1 It is partof the American Community Survey(ACS) report series. Information ondemographic, social, economic, andhousing characteristics in the tablesand figures are based on data fromthe 2004 ACS Selected PopulationProfiles and Detailed Tables.2 Thedata for the Black population arebased on responses to the 2004ACS question on race, which askedall respondents to report one ormore races.3
1 In the federal government, the category“Black or African American” refers to peoplehaving origins in any of the Black racialgroups of Africa. It includes people who indi-cated their race or races as “Black, AfricanAm., or Negro,” or wrote in entries such asAfrican American, Afro American, Nigerian, orHaitian. The terms “Black” and “AfricanAmerican” are used by the U.S. CensusBureau; hereinafter in this report, the term“Black” is used to refer to all individuals whoreported they were Black or African American.
2 The 2004 ACS datasets, includingSelected Population Profiles and DetailedTables, are available online in the AmericanFactFinder at <http://factfinder.census.gov>.
3 For further information on the contentand format of the questionnaire, see<www.census.gov/acs/www/Downloads/SQuest03.pdf>.
Table 1.Population by Race and Hispanic Origin: 2004(Data based on sample limited to the household population and exclude the populationliving in institutions, college dormitories, and other group quarters. For information onconfidentiality protection, sampling error, nonsampling error, and definitions, seehttp://factfinder.census.gov/home/en/datanotes/exp_acs2004.html)
Race and Hispanic originPopulation
Percent ofU.S.
populationMargin oferror1 (±)
Total . . . . . . . . . . . . . . . . . . . . . . . . . . . 285,691,501 100.0 (X)White alone, not Hispanic . . . . . . . . . . . . . . . . . 192,362,875 67.3 0.01
Black alone . . . . . . . . . . . . . . . . . . . . . . . . . . . . . 34,772,381 12.2 0.03Not Hispanic . . . . . . . . . . . . . . . . . . . . . . . . . . 34,142,554 12.0 0.03Hispanic . . . . . . . . . . . . . . . . . . . . . . . . . . . . . . 629,827 0.2 0.02
Black alone or in combination . . . . . . . . . . . . . 36,597,015 12.8 0.02Not Hispanic . . . . . . . . . . . . . . . . . . . . . . . . . . 35,630,167 12.5 0.02Hispanic . . . . . . . . . . . . . . . . . . . . . . . . . . . . . . 966,848 0.3 0.01
Black in combination . . . . . . . . . . . . . . . . . . . . . 1,824,634 0.6 0.01Not Hispanic . . . . . . . . . . . . . . . . . . . . . . . . . . 1,487,613 0.5 0.01Hispanic . . . . . . . . . . . . . . . . . . . . . . . . . . . . . . 337,021 0.1 0.01
Black and White . . . . . . . . . . . . . . . . . . . . . . . . . 1,141,232 0.4 0.02
(X) Not applicable.1 This number, when added to and subtracted from the estimate, produces the 90-percent
confidence interval around the estimate.Source: U.S. Census Bureau, 2004 American Community Survey, Selected Population Profiles,
S0201.

The 2004 ACS estimated the num-ber of Blacks to be 36.6 million, or12.8 percent of the U.S. householdpopulation (Table 1).4 The numberof individuals who reported Blackas their only race was 34.8 million,or 12.2 percent of the population.About another 1.8 million reportedtheir race as Black and one or moreother races, including 1.1 millionpeople who reported their race asBlack and White.5 The Black-alone-or-in-combination populationincluded 967,000 Hispanics, andthe Black-alone populationincluded 630,000 Hispanics.6
Data are reported for both theBlack-alone and the Black-alone-or-in-combination populations. In thisreport, respondents who reportedBlack and no other race areincluded in the single-race or Black-alone population. Respondents whoreported Black either alone or withone or more other race categoriesare included in the Black-alone-or-in-combination population. The report
2 The American Community—Blacks: 2004 U.S. Census Bureau
4 This report discusses data for theUnited States, including the 50 states andthe District of Columbia; it does not includedata for Puerto Rico.
5 The race-in-combination categories usethe conjunction and in bold and italicizedprint to link the race groups that composethe combination.
6 The estimates in this report are basedon responses from a sample of households.Estimates may vary from the actual valuesbecause of sampling error and other factors.All comparative statements have undergonestatistical testing and are significant at the90-percent confidence level unless otherwise noted.
also includes data for the non-Hispanic segments of these popula-tions. Data on individuals whoreported that they were Black andWhite, a part of the in-combinationpopulation, are shown separately inthis report in the Black andWhite category.
The term “Black” is used to refer tothe Black-alone population and theterm “non-Hispanic White” is usedto refer to the White-alone, notHispanic population.
HIGHLIGHTS
While Blacks resided in every statein 2004, about 1 of every 4 Blackslived in three states (New York,Florida, and Georgia). Blacks repre-sented about one-third or more ofthe population in the District ofColumbia, Mississippi, andLouisiana. Blacks represented lessthan 5 percent of the population in20 states.
Compared with the non-HispanicWhite population, the Black popula-tion had a larger proportion ofyounger people and a smaller pro-portion of elderly people in 2004.Blacks were also less likely to bemarried than non-Hispanic Whites,and a larger proportion of theirhouseholds were maintained bywomen. Compared with non-Hispanic White women, Blackwomen were more likely to havegiven birth in the past 12 months.Black grandparents who lived with
their grandchildren were more likelyto be responsible for their care.7
Most Blacks were high school grad-uates and more than 1 of every 6had a bachelor’s degree or moreeducation. Compared with non-Hispanic White workers, Blackworkers were less likely to beemployed in management, profes-sional, and related occupations.Black workers and non-HispanicWhite workers were employed insales and office occupations at asimilar rate. About 1 of every 4Blacks lived below the povertylevel, compared with about 1 ofevery 10 non-Hispanic Whites.Blacks had a lower median incomeand were more likely to rent their homes.
The foreign-born Black populationwas about 2.6 million, or 8 percentof the total Black population, in2004. About 66 percent of foreign-born Blacks were born in LatinAmerica and about 30 percentwere born in Africa. About one-halfof foreign-born Blacks entered theUnited States in 1990 or later, andalmost 1 of every 2 foreign-bornBlacks was a naturalized citizen.
7 The summary statistics mentioned inthese highlights often refer to different seg-ments of the Black-alone population. Forexample, birth rates are estimated forwomen 15 to 50 years old and educationalattainment refers to the population aged 25and older. The figures in the report containinformation on the universe for each statistic.

U.S. Census Bureau The American Community—Blacks: 2004 3
What Is the American Community Survey?
The American Community Survey (ACS) is a newnationwide survey designed to provide reliable,timely information for local communities on howthey are changing. This survey is a critical elementin the Census Bureau’s 2010 Decennial CensusProgram. The ACS collects detailed information onthe characteristics of the population and housingon an ongoing sample basis. These data previouslywere collected in census years in conjunction withthe decennial census. Since the ACS is conductedevery year, rather than once every 10 years, it willprovide more current data throughout the decade.
Fully implemented in 2005, the ACS is the largesthousehold survey in the United States, with anannual sample size of about 3 million housing unitaddresses throughout the country. Release ofannual estimates from the ACS began in 2006 forall geographic areas with a population of 65,000 ormore; 3-year period estimates will begin in 2008for areas and populations as small as 20,000; and5-year period estimates will start in 2010 for cen-sus tracts, block groups, and small populations. Allestimates, including the 3-year and 5-year periodestimates, are planned to be updated every year.
During the testing program (2000 to 2004), theACS sampled approximately 800,000 addresses peryear and produced estimates for the United States,states, and essentially all places, counties, and met-ropolitan areas with at least 250,000 people.
The data contained in this report are based on theACS sample interviewed in 2004. The populationrepresented (the population universe) is limited tothe household population and excludes the popula-tion living in institutions, college dormitories, andother group quarters. For information on the ACSsample design and other ACS topics, visit<http://factfinder.census.gov/home/en/datanotes/exp_acs2004.html>.
The Census Bureau’s population estimates programreleases official population estimates of the U.S. resi-dent population by sex, age, race, and Hispanic ori-gin. For information on the Census Bureau’s popula-tion estimates program, visit <www.census.gov/popest/estimates.php>. The ACS estimates in thisreport pertain to the household population only (i.e.,the total population, excluding the group quarterspopulation). Therefore, the ACS estimate of the Blackpopulation shown in this report should not beviewed as the official measure of this population.

4 The American Community—Blacks: 2004 U.S. Census Bureau
Understanding Data on Race and Hispanic Origin From the 2004 American Community Survey
The 2004 American Community Survey (ACS) fol-lowed the federal standards for collecting and pre-senting data on race and Hispanic origin estab-lished by the Office of Management and Budget(OMB) in 1997. In accordance with these standards,which mandate that race and Hispanic origin aretwo separate and distinct concepts, the ACS askedboth a Hispanic-origin question and a race ques-tion.* The first question asked respondents if theywere Spanish, Hispanic, or Latino. The next ques-tion asked respondents to indicate the race or racesthey considered themselves to be.**
The questions about race and Hispanic origin onthe 2004 ACS are comparable with those on Census2000. In both, the Hispanic-origin question pre-ceded the race question and respondents wereasked to select one or more race categories. The2004 ACS question on race included 15 separateresponse categories and two areas where respon-dents could write in a more specific race group. Inaddition to White, Black or African American,American Indian or Alaska Native, and Some OtherRace, 7 of the 15 response categories are Asian and4 are Native Hawaiian or Other Pacific Islander. OMBrecognizes five standard race categories: White,Black or African American, American Indian orAlaska Native, Asian, and Native Hawaiian or OtherPacific Islander. The response categories and write-in answers can be combined to create the fiveOMB race categories plus Some Other Race, as wellas all combinations of two or more races. The“Some Other Race” category was included in
* For further information, see <www.whitehouse.gov/omb/fedreg/1997standards.html>.
** Race and Hispanic origin, as used by the Census Bureau,reflect self-identification by individuals according to the group orgroups with which they most closely identify. The categories aresociopolitical constructs that include racial, ethnic, and national-origin groups. For more details, see <www.census.gov/acs/www/Downloads/2004/usedata/Subject_Definitions.pdf>.
Census 2000 and also in the 2004 ACS for respon-dents who were unable to identify with 1 of the 5OMB race categories.
Because the 2004 ACS allowed respondents toreport more than one race, two basic ways of defin-ing a race group are possible. A group such asBlack may be defined as those who reported Blackand no other race (the race-alone or single-raceconcept) or as those who reported Black regardlessof whether they also reported another race (therace-alone-or-in-combination concept).
Because race and Hispanic origin are treated as sep-arate concepts in the federal statistical system,people in each race group may be either Hispanicor not Hispanic, and Hispanics may be any race.The Census Bureau uses a variety of approaches forshowing data on race and ethnicity. The text of thisreport compares the population and housing char-acteristics for the single-race Black population withthose of the White-alone, not Hispanic population.However, this does not imply that this approach isthe Census Bureau’s preferred method for analyzingdata on race. In the graphics and tables of thisreport, several approaches for measuring race areshown. These approaches illustrate the overlappingconcepts for measuring race. The specific measuresshown are: 1) the single-race Black population; 2) the single-race Black, not Hispanic population; 3) the Black-alone-or-in-combination population; 4) the Black-alone-or-in-combination, not Hispanicpopulation; and 5) the Black and White population(the largest race combination involving Black).
Because Hispanics may be any race, data in thisreport for Blacks overlap slightly with data forHispanics. Data from the ACS show that, in 2004,Hispanic Blacks composed approximately 2 percentof the single-race Black population.

U.S. Census Bureau The American Community—Blacks: 2004 5
A majority of Blacks lived in ten states.
• In 2004, nearly 60 percent of allBlacks in the United States livedin ten states (New York, Florida,Georgia, Texas, California,Illinois, North Carolina,Maryland, Louisiana, andVirginia).
• Combined, the states of NewYork, Florida, and Georgia repre-sented about one-fourth of thetotal Black population.
• Five of the ten most populousstates had Black populationslarger than 2 million (New York,Florida, Georgia, Texas, andCalifornia).
Figure 1.Black Household Population by State: 2004
Note: Percentages do not sum to 100.0 due to rounding. Source: U.S. Census Bureau, 2004 American Community Survey, Selected Population Profiles, S0201.
(Percent distribution of Black-alone population. Data based on sample limited to the household population and exclude the population living in institutions, college dormitories, and other group quarters. For information on confidentiality protection, sampling error, nonsampling error, and definitions, see http://factfinder.census.gov/home/en/datanotes/exp_acs2004.html)
All other states 41.1
New York 8.5
Florida 7.4
Georgia 7.1
Texas 6.9
California 6.2
Illinois 5.2
North Carolina 5.0
Maryland 4.4
Louisiana 4.1
Virginia 4.0
6 The American Community—Blacks: 2004 U.S. Census Bureau
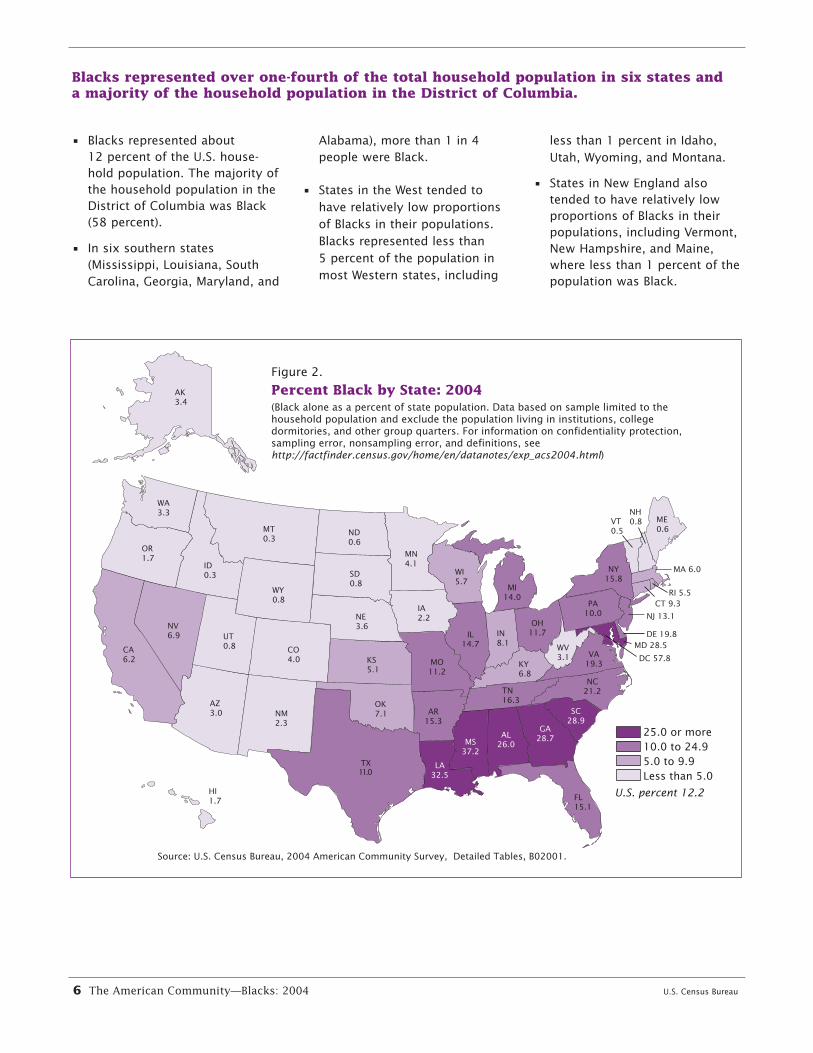
Blacks represented over one-fourth of the total household population in six states and a majority of the household population in the District of Columbia.
• Blacks represented about 12 percent of the U.S. house-hold population. The majority ofthe household population in theDistrict of Columbia was Black(58 percent).
• In six southern states(Mississippi, Louisiana, SouthCarolina, Georgia, Maryland, and
Alabama), more than 1 in 4people were Black.
• States in the West tended tohave relatively low proportionsof Blacks in their populations.Blacks represented less than 5 percent of the population inmost Western states, including
less than 1 percent in Idaho,Utah, Wyoming, and Montana.
• States in New England alsotended to have relatively lowproportions of Blacks in theirpopulations, including Vermont,New Hampshire, and Maine,where less than 1 percent of thepopulation was Black.
Figure 2.
Percent Black by State: 2004(Black alone as a percent of state population. Data based on sample limited to the household population and exclude the population living in institutions, college dormitories, and other group quarters. For information on confidentiality protection, sampling error, nonsampling error, and definitions, see http://factfinder.census.gov/home/en/datanotes/exp_acs2004.html)
MT0.3
WY0.8
TX11.0
CA6.2
AK3.4
AZ3.0
NV6.9
NM2.3
CO4.0
OR1.7
UT0.8
ID0.3
KS5.1
NE3.6
SD0.8
MN4.1
ND0.6
OK7.1
WA3.3
IA2.2
WI5.7
MO11.2
GA28.7
FL15.1
KY6.8
IL14.7
AR15.3
AL26.0
IN8.1
NC21.2
NY15.8
MS37.2
LA32.5
PA10.0
ME0.6
TN16.3
MI14.0
OH11.7
VA19.3
SC28.9
WV3.1
VT0.5
NH0.8
MD 28.5
MA 6.0
NJ 13.1
CT 9.3
HI1.7
DE 19.8
RI 5.5
DC 57.8
25.0 or more10.0 to 24.95.0 to 9.9Less than 5.0
U.S. percent 12.2
Source: U.S. Census Bureau, 2004 American Community Survey, Detailed Tables, B02001.
U.S. Census Bureau The American Community—Blacks: 2004 7
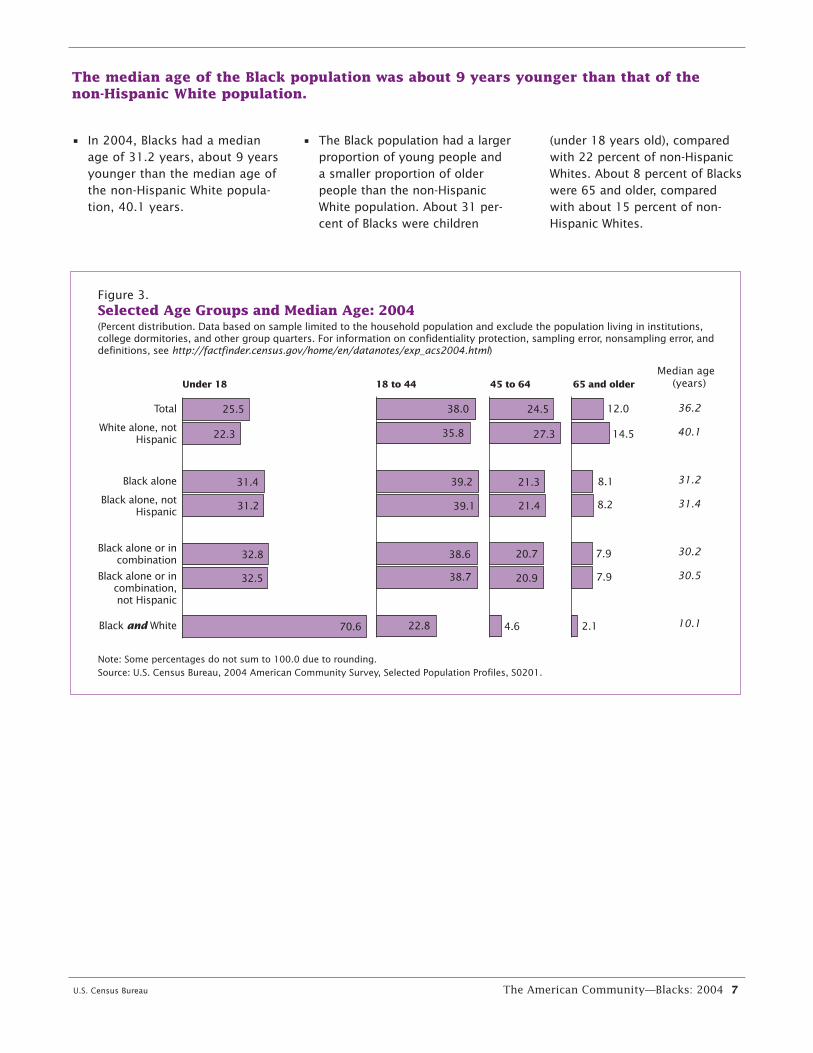
The median age of the Black population was about 9 years younger than that of the non-Hispanic White population.
• In 2004, Blacks had a medianage of 31.2 years, about 9 yearsyounger than the median age ofthe non-Hispanic White popula-tion, 40.1 years.
• The Black population had a largerproportion of young people anda smaller proportion of olderpeople than the non-HispanicWhite population. About 31 per-cent of Blacks were children
(under 18 years old), comparedwith 22 percent of non-HispanicWhites. About 8 percent of Blackswere 65 and older, comparedwith about 15 percent of non-Hispanic Whites.
Figure 3.Selected Age Groups and Median Age: 2004
Note: Some percentages do not sum to 100.0 due to rounding. Source: U.S. Census Bureau, 2004 American Community Survey, Selected Population Profiles, S0201.
(Percent distribution. Data based on sample limited to the household population and exclude the population living in institutions, college dormitories, and other group quarters. For information on confidentiality protection, sampling error, nonsampling error, and definitions, see http://factfinder.census.gov/home/en/datanotes/exp_acs2004.html)
Black and White
Black alone or incombination,not Hispanic
Black alone or incombination
Black alone, notHispanic
Black alone
White alone, notHispanic
Total
Under 18 18 to 44 45 to 64 65 and olderMedian age
(years)
36.2
40.1
31.2
31.4
30.2
30.5
10.1
25.5
22.3
31.4
31.2
32.8
32.5
70.6
38.0
35.8
39.2
39.1
38.6
38.7
22.8
24.5
27.3
21.3
21.4
20.7
20.9
4.6
12.0
14.5
8.1
8.2
7.9
7.9
2.1

8 The American Community—Blacks: 2004 U.S. Census Bureau
More than 40 percent of Blacks were never married.
• In 2004, about 34 percent ofBlacks aged 15 and older weremarried, while about 43 percentwere never married. Non-Hispanic Whites aged 15 andolder were more likely to bemarried (about 57 percent) and
less likely never to have married(about 24 percent).8
8 Differences between the age distribu-tions of Blacks and non-Hispanic Whites mayaffect marital status patterns.
• About 1 in 6 Blacks was eitherseparated (5 percent) ordivorced (12 percent). In com-parison, about 1 in 8 non-Hispanic Whites was either sepa-rated (2 percent) or divorced (11 percent).
Figure 4.Marital Status: 2004
Note: Some percentages do not sum to 100.0 due to rounding. Source: U.S. Census Bureau, 2004 American Community Survey, Selected Population Profiles, S0201.
(Percent distribution of population 15 and older. Data based on sample limited to the household population and exclude the population living in institutions, college dormitories, and other group quarters. For information on confidentiality protection, sampling error, nonsampling error, and definitions, see http://factfinder.census.gov/home/en/datanotes/exp_acs2004.html)
Black and White
Black alone or incombination,not Hispanic
Black alone or incombination
Black alone, notHispanic
Black alone
White alone, notHispanic
Total
Never married Married Separated Widowed Divorced
27.8
23.8
42.6
42.5
42.9
42.8
58.8
53.8
57.3
34.2
34.3
34.1
34.1
27.2
2.1
1.5
5.0
5.0
4.9
4.9
4.1
6.1
6.7
6.5
6.5
6.4
6.4
2.8
10.2
10.7
11.7
11.7
11.7
11.7
7.1
U.S. Census Bureau The American Community—Blacks: 2004 9
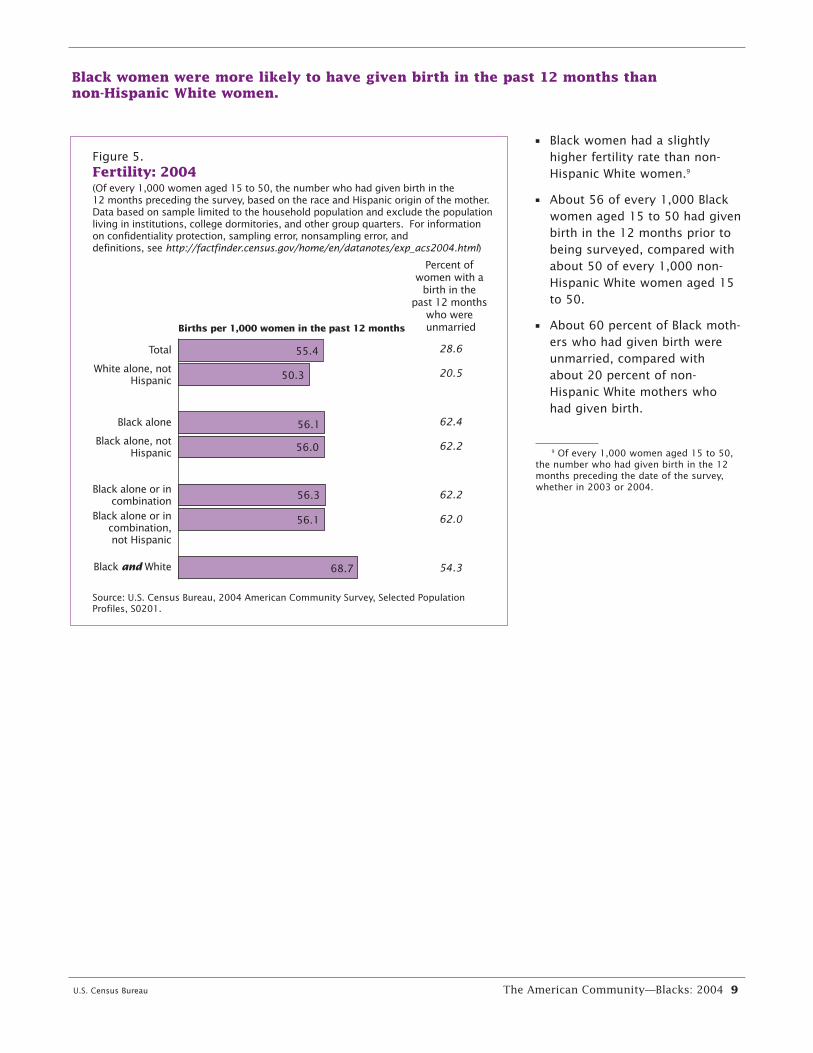
Black women were more likely to have given birth in the past 12 months than non-Hispanic White women.
• Black women had a slightlyhigher fertility rate than non-Hispanic White women.9
• About 56 of every 1,000 Blackwomen aged 15 to 50 had givenbirth in the 12 months prior tobeing surveyed, compared withabout 50 of every 1,000 non-Hispanic White women aged 15to 50.
• About 60 percent of Black moth-ers who had given birth wereunmarried, compared withabout 20 percent of non-Hispanic White mothers whohad given birth.
9 Of every 1,000 women aged 15 to 50,the number who had given birth in the 12months preceding the date of the survey,whether in 2003 or 2004.
Figure 5.Fertility: 2004
Source: U.S. Census Bureau, 2004 American Community Survey, Selected Population Profiles, S0201.
(Of every 1,000 women aged 15 to 50, the number who had given birth in the 12 months preceding the survey, based on the race and Hispanic origin of the mother. Data based on sample limited to the household population and exclude the population living in institutions, college dormitories, and other group quarters. For information on confidentiality protection, sampling error, nonsampling error, and definitions, see http://factfinder.census.gov/home/en/datanotes/exp_acs2004.html)
Black and White
Black alone or incombination,not Hispanic
Black alone or incombination
Black alone, notHispanic
Black alone
White alone, notHispanic
Total
Births per 1,000 women in the past 12 months
Percent of women with a
birth in the past 12 months
who were unmarried
28.6
20.5
62.4
62.2
62.2
62.0
54.3
55.4
50.3
56.1
56.0
56.3
56.1
68.7

10 The American Community—Blacks: 2004 U.S. Census Bureau
About two-thirds of Black households and non-Hispanic White households were family households.
• About 65 percent of Blackhouseholds and about 66 percent of non-HispanicWhite households were familyhouseholds.10
10 A household is a person or a group ofpeople who occupy a housing unit as theircurrent residence. A family household consistsof a householder and one or more people liv-ing together in the same household who arerelated to the householder by birth, marriage,or adoption. It may also include people
unrelated to the householder. There are threetypes of family households in the survey data:married couple, female householders with nohusband present, and male householders withno wife present. In addition, there are non-family households, such as a person livingalone or with unrelated individuals.
• About 30 percent of Blackhouseholds were families main-tained by a woman with no hus-band present, compared withabout 9 percent of non-HispanicWhite households.
• Black households (29 percent)were less likely than non-Hispanic White households (54 percent) to be married-couple households.
• Black households consisted of2.7 people on average, com-pared with 2.5 people on aver-age for non-Hispanic Whitehouseholds.
Figure 6.Household Type: 2004
Source: U.S. Census Bureau, 2004 American Community Survey, Selected Population Profiles, S0201, and Detailed Tables, B11001.
(Percent distribution. Household type is shown by the race and Hispanic origin of the householder. Data based on sample limited to the household population and exclude the population living in institutions, college dormitories, and other group quarters. For information on confidentiality protection, sampling error, nonsampling error, and definitions, see http://factfinder.census.gov/home/en/datanotes/exp_acs2004.html)
Black and White
Black alone or incombination,not Hispanic
Black alone or incombination
Black alone, notHispanic
Black alone
White alone, notHispanic
Total
Married coupleFemale householder, no husband present
Male householder, no wife present Nonfamily households
Averagehousehold
size
2.60
2.45
2.66
2.66
2.66
2.65
2.72
Family households
50.2
53.5
28.8
28.8
28.8
28.7
30.5
12.6
8.9
30.4
30.4
30.4
30.4
27.6
4.4
3.5
5.7
5.6
5.6
5.6
6.2
32.8
34.1
35.1
35.2
35.2
35.3
35.7

U.S. Census Bureau The American Community—Blacks: 2004 11
Blacks were more likely than non-Hispanic Whites to live with and care for grandchildren.
• About 7 percent of Blacks aged30 and older were grandparentsliving in the same householdwith their coresident grandchil-dren younger than 18. In com-parison, about 2 percent of non-Hispanic Whites aged 30 and
older were grandparents livingin the same household withtheir coresident grandchildrenyounger than 18.
• About 52 percent of Blackgrandparents who lived withtheir coresident grandchildren
were also responsible for theircare, compared with about 45 percent of non-Hispanic Whitegrandparents who lived withtheir coresident grandchildren.
Figure 7.Responsibility for Grandchildren Under 18 Years: 2004
Source: U.S. Census Bureau, 2004 American Community Survey, Selected Population Profiles, S0201.
(Percent of people 30 and older. Data based on sample limited to the household population and exclude the population living in institutions, college dormitories, and other group quarters. For information on confidentiality protection, sampling error, nonsampling error, and definitions, see http://factfinder.census.gov/home/en/datanotes/exp_acs2004.html)
Black and White
Black alone or incombination,not Hispanic
Black alone or incombination
Black alone, notHispanic
Black alone
White alone, notHispanic
Total
Percent with grandchildren in the household
Percent of grandparents responsible for coresident grandchildren
3.4
2.3
6.6
6.6
6.6
6.6
3.9
41.8
44.5
51.5
51.7
51.5
51.7
30.0
12 The American Community—Blacks: 2004 U.S. Census Bureau
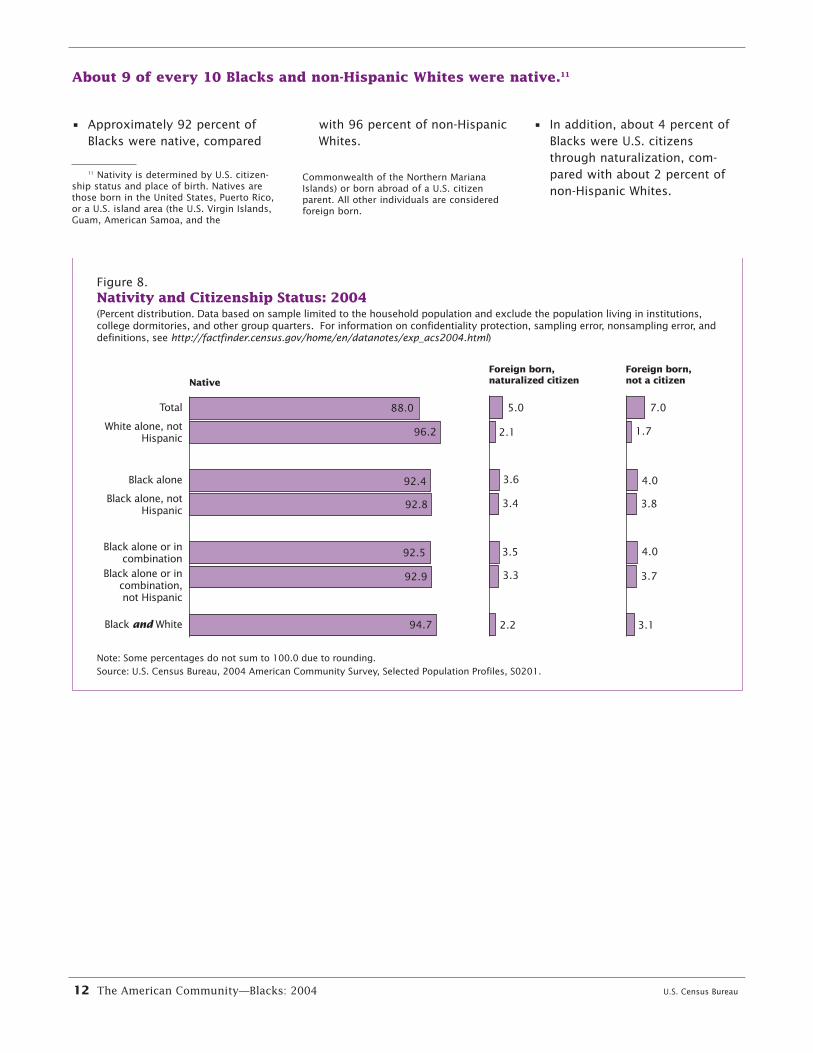
About 9 of every 10 Blacks and non-Hispanic Whites were native.11
• Approximately 92 percent ofBlacks were native, compared
with 96 percent of non-HispanicWhites.
• In addition, about 4 percent ofBlacks were U.S. citizensthrough naturalization, com-pared with about 2 percent ofnon-Hispanic Whites.
11 Nativity is determined by U.S. citizen- Commonwealth of the Northern Marianaship status and place of birth. Natives are Islands) or born abroad of a U.S. citizenthose born in the United States, Puerto Rico, parent. All other individuals are consideredor a U.S. island area (the U.S. Virgin Islands, foreign born.Guam, American Samoa, and the
Figure 8.Nativity and Citizenship Status: 2004
Note: Some percentages do not sum to 100.0 due to rounding. Source: U.S. Census Bureau, 2004 American Community Survey, Selected Population Profiles, S0201.
(Percent distribution. Data based on sample limited to the household population and exclude the population living in institutions, college dormitories, and other group quarters. For information on confidentiality protection, sampling error, nonsampling error, and definitions, see http://factfinder.census.gov/home/en/datanotes/exp_acs2004.html)
Black and White
Black alone or incombination,not Hispanic
Black alone or incombination
Black alone, notHispanic
Black alone
White alone, notHispanic
Total
Native Foreign born, naturalized citizen
Foreign born, not a citizen
88.0
96.2
92.4
92.8
92.5
92.9
94.7
5.0
2.1
3.6
3.4
3.5
3.3
2.2
7.0
1.7
4.0
3.8
4.0
3.7
3.1
U.S. Census Bureau The American Community—Blacks: 2004 13
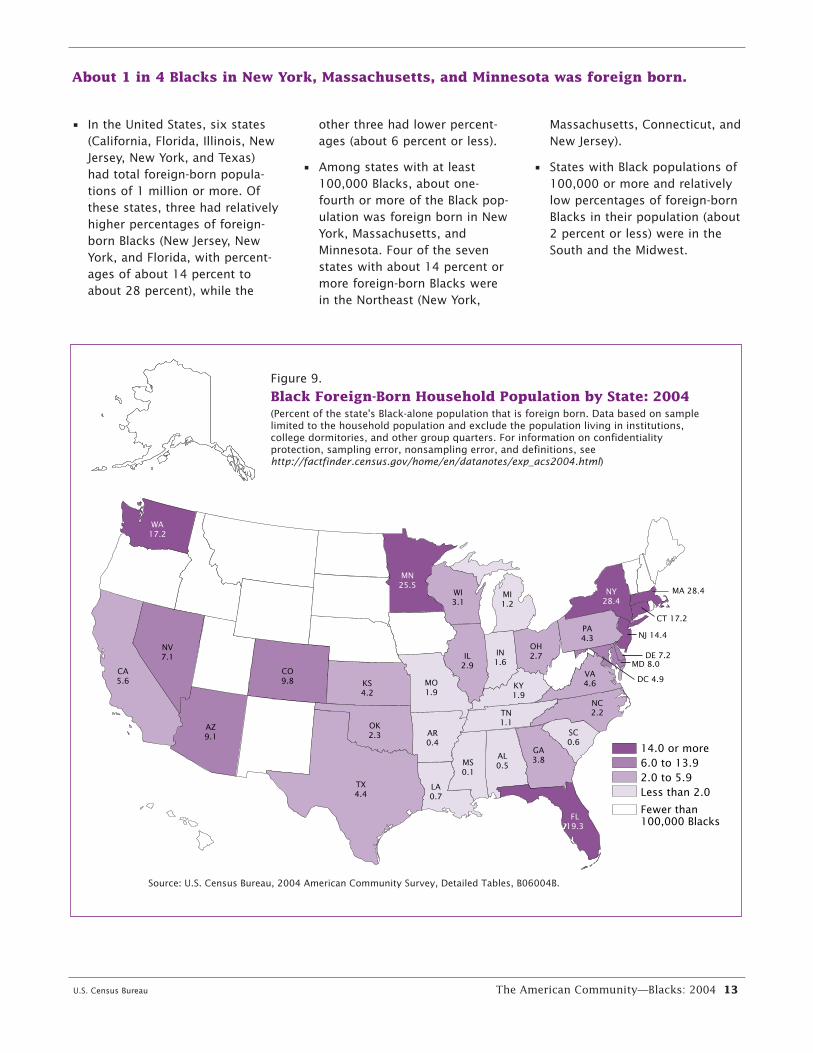
About 1 in 4 Blacks in New York, Massachusetts, and Minnesota was foreign born.
• In the United States, six states(California, Florida, Illinois, NewJersey, New York, and Texas)had total foreign-born popula-tions of 1 million or more. Ofthese states, three had relativelyhigher percentages of foreign-born Blacks (New Jersey, NewYork, and Florida, with percent-ages of about 14 percent toabout 28 percent), while the
other three had lower percent-ages (about 6 percent or less).
• Among states with at least100,000 Blacks, about one-fourth or more of the Black pop-ulation was foreign born in NewYork, Massachusetts, andMinnesota. Four of the sevenstates with about 14 percent ormore foreign-born Blacks werein the Northeast (New York,
Massachusetts, Connecticut, andNew Jersey).
• States with Black populations of100,000 or more and relativelylow percentages of foreign-bornBlacks in their population (about2 percent or less) were in theSouth and the Midwest.
TX4.4
CA5.6
AZ9.1
NV7.1
CO9.8 KS
4.2
MN25.5
OK2.3
WA17.2
WI3.1
MO1.9
GA3.8
FL19.3
KY1.9
IL2.9
AR0.4
AL0.5
IN1.6
NC2.2
NY28.4
MS0.1
LA0.7
PA4.3
TN1.1
MI1.2
OH2.7
VA4.6
SC0.6
MD 8.0
MA 28.4
NJ 14.4
CT 17.2
DE 7.2
14.0 or more6.0 to 13.92.0 to 5.9Less than 2.0
Fewer than100,000 Blacks
Source: U.S. Census Bureau, 2004 American Community Survey, Detailed Tables, B06004B.
Figure 9.
Black Foreign-Born Household Population by State: 2004(Percent of the state's Black-alone population that is foreign born. Data based on sample limited to the household population and exclude the population living in institutions, college dormitories, and other group quarters. For information on confidentiality protection, sampling error, nonsampling error, and definitions, see http://factfinder.census.gov/home/en/datanotes/exp_acs2004.html)
DC 4.9
14 The American Community—Blacks: 2004 U.S. Census Bureau
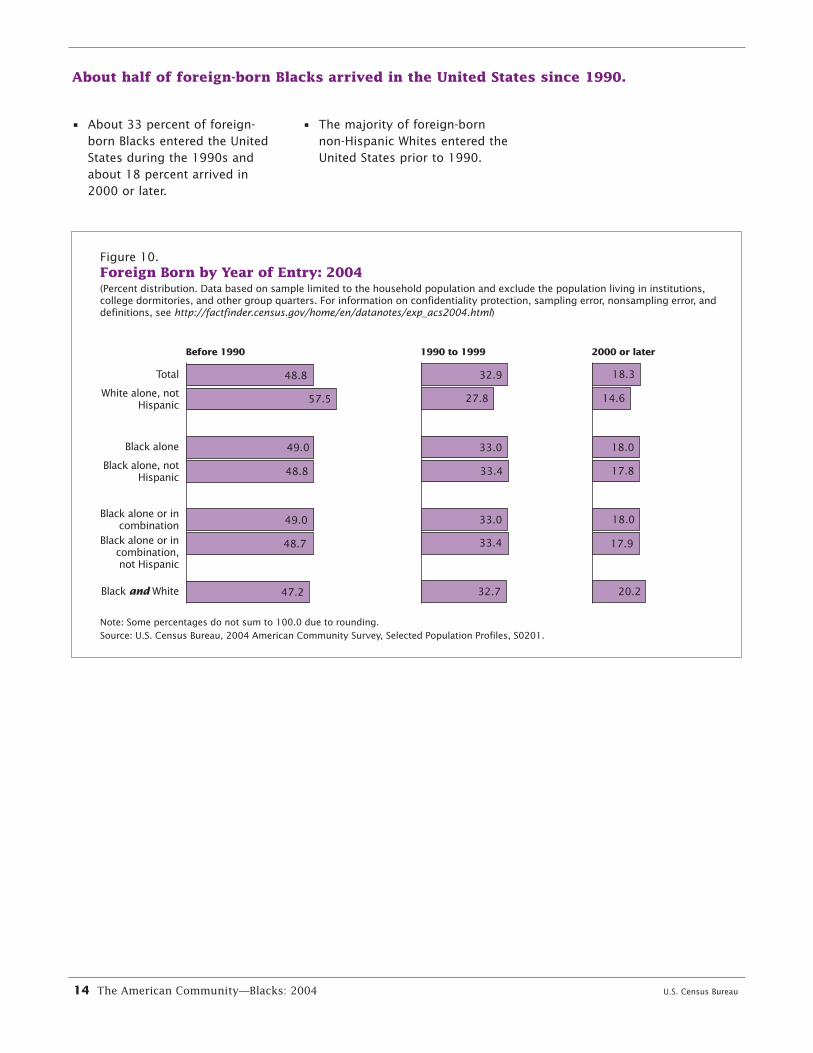
About half of foreign-born Blacks arrived in the United States since 1990.
• About 33 percent of foreign-born Blacks entered the UnitedStates during the 1990s andabout 18 percent arrived in2000 or later.
• The majority of foreign-bornnon-Hispanic Whites entered theUnited States prior to 1990.
Figure 10.Foreign Born by Year of Entry: 2004
Note: Some percentages do not sum to 100.0 due to rounding. Source: U.S. Census Bureau, 2004 American Community Survey, Selected Population Profiles, S0201.
(Percent distribution. Data based on sample limited to the household population and exclude the population living in institutions, college dormitories, and other group quarters. For information on confidentiality protection, sampling error, nonsampling error, and definitions, see http://factfinder.census.gov/home/en/datanotes/exp_acs2004.html)
Black and White
Black alone or incombination,not Hispanic
Black alone or incombination
Black alone, notHispanic
Black alone
White alone, notHispanic
Total
Before 1990 1990 to 1999 2000 or later
20.2
48.8
57.5
49.0
48.8
49.0
48.7
47.2
32.9
27.8
33.0
33.4
33.0
33.4
32.7
18.3
14.6
18.0
17.8
18.0
17.9

U.S. Census Bureau The American Community—Blacks: 2004 15
Nearly all foreign-born Blacks were born in Africa or Latin America.
• In 2004, nearly all foreign-bornBlacks were from 1 of 2 worldregions—Africa or Latin America.About 66 percent of foreign-bornBlacks living in the United Stateswere born in Latin America;another 30 percent of foreign-born Blacks were born in Africa.
• Most foreign-born non-HispanicWhites were born in Europe
(64 percent), Asia (16 percent),and Northern America (10 per-cent). Less than 5 percent offoreign-born Blacks were born inthese regions.12
12 The world regions referenced abovegenerally reflect those defined by the UnitedNations. For a list of detailed countries, see<http://factfinder.census.gov/metadoc/birthplace.pdf>.
Figure 11.World Region of Birth of Foreign-Born Household Population: 2004
– Rounds to zero.Note: Some percentages do not sum to 100.0 due to rounding. Source: U.S. Census Bureau, 2004 American Community Survey, Selected Population Profiles, S0201.
(Percent distribution. Data based on sample limited to the household population and exclude the population living in institutions, college dormitories, and other group quarters. For information on confidentiality protection, sampling error, nonsampling error, and definitions, see http://factfinder.census.gov/home/en/datanotes/exp_acs2004.html)
Black and White
Black alone or incombination,not Hispanic
Black alone or incombination
Black alone, notHispanic
Black alone
White alone, notHispanic
Total
Europe Asia Africa OceaniaLatin America
Northern America
14.3
63.6
1.8
1.8
2.1
2.2
16.3
27.0
16.4
0.9
0.9
1.1
1.2
0.6
3.3
3.5
30.4
32.5
29.4
32.0
4.7
0.6
1.3
–
–
–
–
–
52.4
5.3
66.3
64.1
66.7
63.8
76.2
2.4
9.9
0.6
0.6
0.7
0.7
2.3

16 The American Community—Blacks: 2004 U.S. Census Bureau
About four-fifths of Blacks were high school graduates.
• About 80 percent of Blacks aged25 and older were high schoolgraduates and about 17 percenthad a bachelor’s degree or moreeducation. Among non-HispanicWhites aged 25 and older, about89 percent were high school
graduates and about 30 percenthad a bachelor’s degree or moreeducation.
• About 17 percent each of Blackmen and Black women had abachelor’s degree or more
education, compared with about 32 percent of non-HispanicWhite men and about 28 percentof non-Hispanic White women.
Figure 12.Educational Attainment by Sex: 2004
Source: U.S. Census Bureau, 2004 American Community Survey, Selected Population Profiles, S0201.
(Percent of population 25 and older. Data based on sample limited to the household population and exclude the population living in institutions, college dormitories, and other group quarters. For information on confidentiality protection, sampling error, nonsampling error, and definitions, see http://factfinder.census.gov/home/en/datanotes/exp_acs2004.html)
Black and White
Black alone or in combination,not Hispanic
Black alone or in combination
Black alone, not Hispanic
Black alone
White alone, not Hispanic
Total
Less than high schoolBoth sexes
Black and White
Black alone or in combination,not Hispanic
Black alone or in combination
Black alone, not Hispanic
Black alone
White alone, not Hispanic
Total
Male
Black and White
Black alone or in combination,not Hispanic
Black alone or in combination
Black alone, not Hispanic
Black alone
White alone, not Hispanic
Total
Female
High school graduate or moreBachelor's degree or more
16.1
11.4
20.7
20.6
20.6
20.5
17.7
16.4
11.7
21.0
20.9
20.9
20.8
22.0
15.7
11.2
20.5
20.3
20.4
20.2
14.1
83.9
88.6
79.3
79.4
79.4
79.5
82.3
83.6
88.3
79.0
79.1
79.1
79.2
78.0
84.3
88.8
79.5
79.7
79.6
79.8
85.9
27.0
29.7
17.3
17.3
17.4
17.4
21.9
28.6
31.7
17.0
16.9
17.1
17.1
19.5
25.6
27.8
17.5
17.5
17.7
17.7
23.8
U.S. Census Bureau The American Community—Blacks: 2004 17
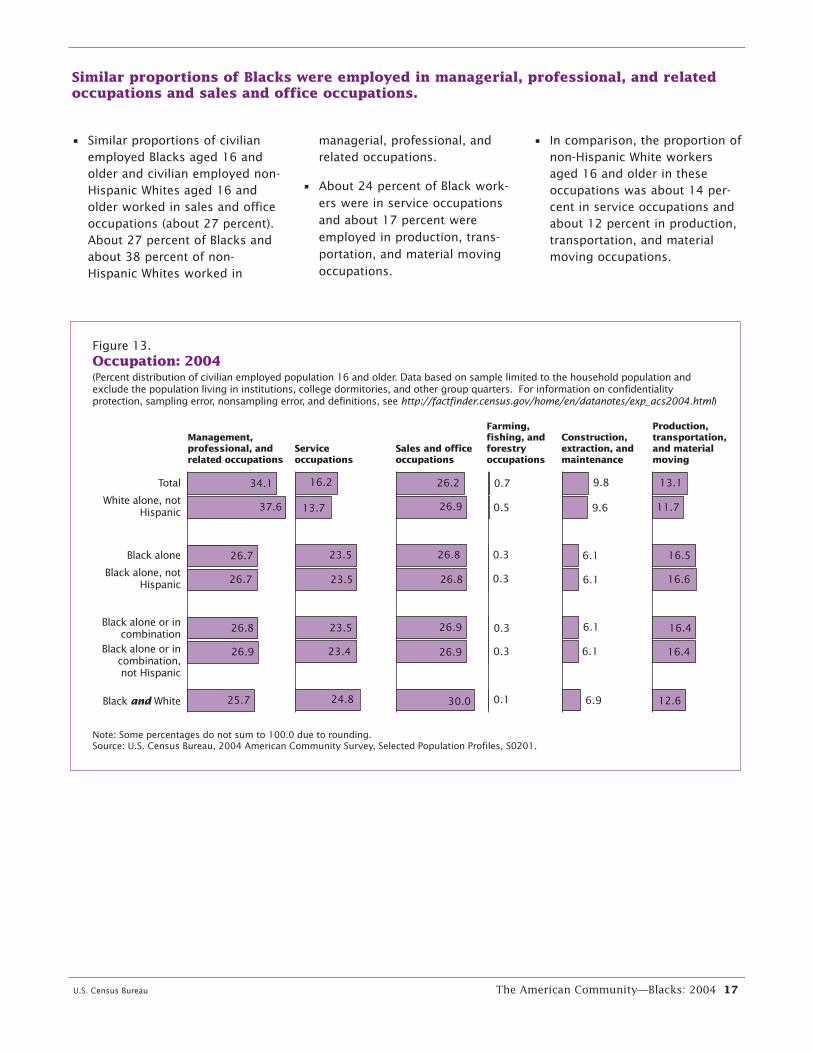
Similar proportions of Blacks were employed in managerial, professional, and relatedoccupations and sales and office occupations.
• Similar proportions of civilianemployed Blacks aged 16 andolder and civilian employed non-Hispanic Whites aged 16 andolder worked in sales and officeoccupations (about 27 percent).About 27 percent of Blacks andabout 38 percent of non-Hispanic Whites worked in
managerial, professional, andrelated occupations.
• About 24 percent of Black work-ers were in service occupationsand about 17 percent wereemployed in production, trans-portation, and material movingoccupations.
• In comparison, the proportion ofnon-Hispanic White workersaged 16 and older in theseoccupations was about 14 per-cent in service occupations andabout 12 percent in production,transportation, and materialmoving occupations.
Figure 13.Occupation: 2004
Note: Some percentages do not sum to 100.0 due to rounding.Source: U.S. Census Bureau, 2004 American Community Survey, Selected Population Profiles, S0201.
(Percent distribution of civilian employed population 16 and older. Data based on sample limited to the household population and exclude the population living in institutions, college dormitories, and other group quarters. For information on confidentiality protection, sampling error, nonsampling error, and definitions, see http://factfinder.census.gov/home/en/datanotes/exp_acs2004.html)
Black and White
Black alone or incombination,not Hispanic
Black alone or incombination
Black alone, notHispanic
Black alone
White alone, notHispanic
Total
Management, professional, and related occupations
Service occupations
Sales and office occupations
Farming, fishing, and forestry occupations
Construction, extraction, and maintenance
Production, transportation, and material moving
34.1
37.6
26.7
26.7
26.8
26.9
25.7
16.2
13.7
23.5
23.5
23.5
23.4
24.8
26.2
26.9
26.8
26.8
26.9
26.9
30.0
0.7
0.5
0.3
0.3
0.3
0.3
0.1
9.8
9.6
6.1
6.1
6.1
6.1
6.9
13.1
11.7
16.5
16.6
16.4
16.4
12.6

18 The American Community—Blacks: 2004 U.S. Census Bureau
The median income of Black households was less than that of non-Hispanic White households.13
• The median income of Blackhouseholds in the 12 monthsprior to being surveyed wasabout $30,200. This was lessthan two-thirds of the medianincome of non-Hispanic Whitehouseholds, which was about$48,800.
13 Data reflect the median income ofhouseholds in the 12 months prior to beingsurveyed. Income is expressed in 2004 infla-tion-adjusted dollars. It is based on the dis-tribution of the total number of householdsand includes those with no income.Households are classified by the race andHispanic origin of the householder.
Figure 14.Median Household Income: 2004
Source: U.S. Census Bureau, 2004 American Community Survey, Selected Population Profiles, S0201.
(Household income in the past 12 months in 2004 inflation-adjusted dollars. Housing units are classified by the race and Hispanic origin of the householder. Data based on sample limited to the household population and exclude the population living in institutions, college dormitories, and other group quarters. For information on confidentiality protection, sampling error, nonsampling error, and definitions, see http://factfinder.census.gov/home/en/datanotes/exp_acs2004.html)
Black and White
Black alone or incombination,not Hispanic
Black alone or incombination
Black alone, notHispanic
Black alone
White alone, notHispanic
Total $44,684
$48,784
$30,173
$30,196
$30,216
$30,227
$31,374

U.S. Census Bureau The American Community—Blacks: 2004 19
The poverty rate was higher for Blacks than for non-Hispanic Whites.14
• About 26 percent of Blacks wereliving below the poverty level inthe 12 months prior to being
surveyed, compared with about9 percent of non-HispanicWhites.
• The poverty rate was generallyhigher for children (under age18). About 36 percent of Blackchildren and about 11 percentof non-Hispanic White childrenlived in poverty.
• Among those aged 65 and older,Blacks had a poverty rate ofabout 22 percent, comparedwith about 7 percent for non-Hispanic Whites.
14 In accordance with the U.S. Office ofManagement and Budget’s (OMB) StatisticalPolicy Directive 14, the Census Bureau uses aset of money income thresholds that vary byfamily size and composition to determinewho is in poverty. If a family’s total income isless than the threshold for the family, thenthat family and every individual in it are con-sidered to be in poverty. For example, thepoverty threshold for a family of three withone child under 18 for the 1-year period
preceding the ACS interview was $14,974.Poverty status was determined for all individ-uals except for unrelated individuals under15 years old. The official poverty definitionuses money income before taxes and doesnot include capital gains or noncash benefits.For more information on poverty in the ACS,see <www.census.gov/prod/2005pubs/acs-01.pdf> and <www.census.gov/acs/www/UseData/Def/Poverty.htm>.
Figure 15.Poverty Rate by Age Group: 2004
Source: U.S. Census Bureau, 2004 American Community Survey, Selected Population Profiles, S0201.
(Percent of specific group in poverty in the past 12 months. Data based on sample limited to the household population and exclude the population living in institutions, college dormitories, and other group quarters. For information on confidentiality protection,sampling error, nonsampling error, and definitions, see http://factfinder.census.gov/home/en/datanotes/exp_acs2004.html)
Black and White
Black alone or incombination,not Hispanic
Black alone or incombination
Black alone, notHispanic
Black alone
White alone, notHispanic
Total
All ages Under 18 65 and older
13.1
8.8
25.6
25.6
25.5
25.4
21.8
18.4
11.0
35.9
35.9
34.8
35.0
23.2
9.4
7.2
21.5
21.4
21.3
21.3
9.7

20 The American Community—Blacks: 2004 U.S. Census Bureau
Nearly one-half of Black households lived in owner-occupied homes.
• A majority of Black households,about 54 percent, lived inrenter-occupied homes andabout 46 percent lived in owner-occupied homes.
• In comparison, about 74 percentof non-Hispanic White house-holds lived in owner-occupiedhomes.
Figure 16.Housing Tenure: 2004
Source: U.S. Census Bureau, 2004 American Community Survey, Selected Population Profiles, S0201.
(Percent of occupied housing units. Housing tenure is shown by the race and Hispanic origin of the householder. Data based on sample limited to the household population and exclude the population living in institutions, college dormitories, and other group quarters. For information on confidentiality protection, sampling error, nonsampling error, and definitions, see http://factfinder.census.gov/home/en/datanotes/exp_acs2004.html)
Black and White
Black alone or incombination,not Hispanic
Black alone or incombination
Black alone, notHispanic
Black alone
White alone, notHispanic
Total
Owners Renters
67.1
73.9
46.1
46.4
45.9
46.2
35.7
32.9
26.1
53.9
53.6
54.1
53.8
64.3

U.S. Census Bureau The American Community—Blacks: 2004 21
The median value of owner-occupied homes for Black households was $104,000.
• The median value of Blackowner-occupied homes wasabout $104,000. This was about$50,000 less than the medianvalue of non-Hispanic White
owner-occupied homes (about$154,000).15
• The median monthly rent pay-ment of Black households inrenter-occupied homes was
about $647. This was about $50less than the median monthlyrental payment made by non-Hispanic White households(about $693).16
15 Differences between the geographic dis-tribution of Blacks and non-Hispanic Whitesmay affect home values and rental costs.
16 The monthly rental payment representsgross rent (i.e., the amount of the contractrent plus the estimated average monthlycost of utilities and fuels).
Figure 17.Selected Housing Characteristics: 2004
Source: U.S. Census Bureau, 2004 American Community Survey, Selected Population Profiles, S0201.
(Housing units are classified by the race and Hispanic origin of the householder. Data based on sample limited to the household population and exclude the population living in institutions, college dormitories, and other group quarters. For information on confidentiality protection, sampling error, nonsampling error, and definitions, see http://factfinder.census.gov/home/en/datanotes/exp_acs2004.html)
Black and White
Black alone or incombination,not Hispanic
Black alone or incombination
Black alone, notHispanic
Black alone
White alone, notHispanic
Total
Median value of owner-occupied housing units Median gross rent of renter-occupied housing units
$151,366 $694
$153,693 $693
$104,185 $647
$105,532 $646
$105,190 $649
$104,316 $647
$144,565 $726

22 The American Community—Blacks: 2004 U.S. Census Bureau
Black workers were more likely than non-Hispanic White workers to use publictransportation or to carpool to work.
• In 2004, about 72 percent ofBlack workers aged 16 andolder drove alone and about 11 percent carpooled to work.Among non-Hispanic Whiteworkers aged 16 and older,about 81 percent drove alone
and about 8 percent carpooledto work.17
• Public transportation was usedto commute by a higher propor-tion of Black workers (about 12 percent) than non-HispanicWhite workers (about 3 percent).
17 Differences between the geographicdistribution of Blacks and non-HispanicWhites may affect commuting patterns.
• Non-Hispanic White workers(about 4 percent) were morelikely than Black workers (about2 percent) to work at home.
• The mean travel time to workfor Black workers was 27 min-utes, compared with a meantravel time of 24 minutes fornon-Hispanic White workers.
Figure 18.Commuting to Work: 2004
Note: Some percentages do not sum to 100.0 due to rounding. Source: U.S. Census Bureau, 2004 American Community Survey, Selected Population Profiles, S0201.
(Percent of workers 16 and older. Data based on sample limited to the household population and exclude the population living in institutions, college dormitories, and other group quarters. For information on confidentiality protection, sampling error, nonsampling error, and definitions, see http://factfinder.census.gov/home/en/datanotes/exp_acs2004.html)
Black and White
Black alone or incombination,not Hispanic
Black alone or incombination
Black alone, notHispanic
Black alone
White alone, notHispanic
Total
Drove alone: car, truck, or van
Carpooled: car, truck, or van
Public transportation, except taxicab Walked
Other means
Worked at home
Mean travel time
(mins.)
24.7
23.9
27.1
27.0
27.0
27.0
23.5
77.7
81.1
72.2
72.3
72.0
72.2
67.8
10.1
8.3
10.5
10.5
10.6
10.6
12.9
4.6
2.6
11.5
11.3
11.5
11.3
9.7
2.4
2.2
2.3
2.3
2.4
2.4
5.1
1.4
1.3
1.5
1.5
1.5
1.5
2.7
3.8
4.4
2.0
2.0
2.1
2.0
1.8
U.S. Census Bureau The American Community—Blacks: 2004 23
SOURCE OF THE DATA AND ACCURACY OF THE ESTIMATES
The findings presented in thisreport are based on the ACS sam-ple interviewed in 2004. The datain this report are based on thepopulation living in householdsthat were included in the ACS sam-ple. The 2004 ACS did not collectinformation from people living ingroup quarters, which include cor-rectional facilities, hospitals, col-lege dormitories, group homes,and overnight shelters.
The 2004 ACS used a two-stagestratified sample of approximately838,000 housing units and theoccupants of these units. ACS fig-ures are estimates based on thissample and approximate the actualfigures that would have beenobtained by interviewing the entirehousehold population using thesame methodology. The estimatesfrom the 2004 ACS sample may dif-fer from other samples of housingunits and people within those hous-ing units. The process of samplingensures the integrity and the repre-sentativeness of sample surveyresults but also results in samplingerror. Sampling error is the devia-tion of a sample estimate from theaverage of all possible samples.
In addition to sampling error, othertypes of errors, specifically,nonsampling errors, may be intro-duced during any of the operationsused to collect and process surveydata. For example, operations suchas editing, reviewing, or keyingdata from questionnaires mayintroduce error into the estimates.Nonsampling errors may affect thedata in two ways. Errors that areintroduced randomly increase thevariability of the data. Systematicerrors that are consistent in onedirection introduce bias into theresults of a sample survey. TheCensus Bureau protects against theeffect of systematic errors on sur-vey estimates by conductingextensive research and evaluationprograms on sampling techniques,questionnaire design, and data col-lection and processing procedures.The primary sources of error andthe processes instituted to controlerror in the 2004 ACS aredescribed in further detail in theAccuracy of the Data (2004) expla-nation located at <www.census.gov/acs/www/Downloads/ACS/accuracy2004.pdf>.
Sampling errors and some types ofnonsampling errors are estimatedby the measure of standard error.The sample estimate and its esti-mated standard error permit the
construction of interval estimateswith a prescribed confidence thatthe interval includes the averageresult of all possible samples. Allcomparative statements in this ACS2004 report have undergone statis-tical testing and comparisons aresignificant at the 90-percent confi-dence level unless otherwise noted.
FOR MORE INFORMATION
Further information from the 2004ACS is available from the AmericanFactFinder on the Census Bureau’sWeb site. More than 1,000 tablesare available, including populationprofiles for race, Hispanic-origin,and ancestry groups.
The Internet address is<http://factfinder.census.gov>. Forinformation on confidentiality pro-tection, also see <www.census.gov/acs/www/Downloads/ACS/accuracy2004.pdf>.
For more information on the Blackpopulation, visit <www.census.gov/population/www/socdemo/race/black.html>.
CONTACT
For additional information, contactthe Racial Statistics Branch at 301-763-2402 or via e-mail<[email protected]>.
Related Documents