The Always Best Positioned Paradigm for Mobile Indoor Applications Dissertation zur Erlangung des Grades des Doktors der Ingenieurwissenschaften (Dr.-Ing.) der Naturwissenschaftlich-Technischen Fakult¨ aten der Universit¨ at des Saarlandes vorgelegt von Tim Schwartz Saarbr¨ ucken 4. Januar 2012

Welcome message from author
This document is posted to help you gain knowledge. Please leave a comment to let me know what you think about it! Share it to your friends and learn new things together.
Transcript

The Always Best PositionedParadigm for Mobile Indoor
Applications
Dissertationzur Erlangung des Grades
des Doktors der Ingenieurwissenschaften (Dr.-Ing.)der Naturwissenschaftlich-Technischen Fakultaten der Universitat des
Saarlandes
vorgelegt vonTim Schwartz
Saarbrucken4. Januar 2012

Dekan:Prof. Dr. Holger Hermanns
Vorsitzender des Prufungsausschusses:Prof. Dr. Philipp Slusallek
Berichterstatter:Prof. Dr. Dr. h.c. mult. Wolfgang WahlsterProf. Dr. Antonio Kruger
Promovierter akademischer Mitarbeiter der Fakultat:Dr. Jorg Baus
Tag des Kolloquiums:31. Januar 2012

Eidesstattliche Versicherung
Hiermit versichere ich an Eides statt, dass ich die vorliegende Arbeit selbstandigund ohne Benutzung anderer als der angegebenen Hilfsmittel angefertigt habe. Dieaus anderen Quellen oder indirekt ubernommenen Daten und Konzepte sind unterAngabe der Quelle gekennzeichnet.
Die Arbeit wurde bisher weder im In- noch im Ausland in gleicher oder ahnlicherForm in einem Verfahren zur Erlangung eines akademischen Grades vorgelegt.
Tim Schwartz, Saarbrucken, 4. Januar, 2012
iii

Short Abstract
In this dissertation, methods for personal positioning in outdoor and indoor envi-ronments are investigated. The Always Best Positioned paradigm, which has thegoal of providing a preferably consistent self-positioning, will be defined. Further-more, the localization toolkit LOCATO will be presented, which allows to easilyrealize positioning systems that follow the paradigm. New algorithms were devel-oped, which particularly address the robustness of positioning systems with respectto the Always Best Positioned paradigm. With the help of this toolkit, three exam-ple positioning-systems were implemented, each designed for different applicationsand requirements: a low-cost system, which can be used in conjunction with user-adaptive public displays, a so-called opportunistic system, which enables positioningwith room-level accuracy in any building that provides a WiFi infrastructure, and ahigh-accuracy system for instrumented environments, which works with active RFIDtags and infrared beacons. Furthermore, a new and unique evaluation-method for po-sitioning systems is presented, which uses step-accurate natural walking-traces asground truth. Finally, six location based services will be presented, which wererealized either with the tools provided by LOCATO or with one of the examplepositioning-systems.
iv

Kurzzusammenfassung
In dieser Doktorarbeit werden Methoden zur Personenpositionierung im Innen- undAußenbereich von Gebauden untersucht. Es wird das ,,Always Best Positioned”Paradigma definiert, welches eine moglichst luckenlose Selbstpositionierung zumZiel hat. Weiterhin wird die Lokalisierungsplattform LOCATO vorgestellt, welcheeine einfache Umsetzung von Positionierungssystemen ermoglicht. Hierzu wurdenneue Algorithmen entwickelt, welche gezielt die Robustheit von Positionierungssys-temen unter Berucksichtigung des ,,Always Best Positioned” Paradigmas angehen.Mit Hilfe dieser Plattform wurden drei Beispiel-Positionierungssysteme entwick-elt, welche unterschiedliche Einsatzgebiete berucksichtigen: Ein kostengunstigesSystem, das im Zusammenhang mit benutzeradaptiven offentlichen Bildschirmenbenutzt werden kann; ein sogenanntes opportunistisches Positionierungssystem,welches eine raumgenaue Positionierung in allen Gebauden mit WLAN-Infrastrukturermoglicht, sowie ein metergenaues Positionierungssystem, welches mit Hilfe einerInstrumentierung aus aktiven RFID-Tags und Infrarot-Baken arbeitet. Weiterhinwird erstmalig eine Positionierungsevaluation vorgestellt, welche schrittgenaue,naturliche Bewegungspfade als Referenzsystem einsetzt. Im Abschluss werden 6lokationsbasierte Dienste vorgestellt, welche entweder mit Hilfe von LOCATO odermit Hilfe einer der drei Beispiel-Positionierungssysteme entwickelt wurden.
v

Acknowledgments
First and foremost, I want to express my gratitude to Prof. Wahlster for giving me the op-portunity and support to work on my PhD thesis. I truly enjoyed the times in which I coulddiscuss my work and worries with him, and I am grateful for the encouragement, the goodideas and sound advice he has given to me. Although I learned a lot in the whole course ofpreparing and writing my PhD thesis, I feel that I learned the most when closely workingwith him.
I also want to thank Prof. Slusallek for encouraging me to start a PhD thesis, as well as Prof.Kruger and Prof. Butz who sparked my interest in Artificial Intelligence and who are greatsources of inspiration. Likewise, I want to thank Christian Muller who always had an openear for my concerns. This work would not have been possible without a great working en-vironment with supportive, open minded and creative colleagues. It seems to me that theChair of Prof. Wahlster and the IUI group at DFKI act as magnets for these special kind ofpeople, who are usually hard to find: Doris Borchers, the good soul of the Chair, Jorg Baus,the ‘Swiss Army knife’ and stabilizing element of the Chair who provided me with soundadvice and encouragement, Christoph Stahl, with whom I worked closely to realize LOCATO
and with whom I founded a start-up company, Boris Brandherm, with whom I developed anddiscussed the concept of geoDBNs, Mira Spassova and Gerrit Kahl, who incorporated LO-CATO into the IRL, Dominik Heckmann, who provided UBISWORLD and UBISEARTH, RalfJung, my long-term office mate who realized an location-adaptive audio notification serviceusing LORIOT, Michael Schmitz, with whom I had the pleasure to supervise an interdisci-plinary course at the school of fine arts, Alexander Kroner, Jens Haupert and Matthieu Deruwith whom I supervised two Android seminars, Angela Mahr, Sandro Castronovo, ChristophEndres and Michael Feld, with whom I worked in the project simTD. Thank you for the greattime!
Of course I also want to thank my family for the love and support during my whole life andespecially during the last months of this thesis, in which I was terribly absent-minded.
Although my MacBook seemed to overheat a few times in the last couple of months, it isstill the most reliable computing machine I ever had. So yeah, thank you Steve Jobs:
Here’s to the crazy ones . . .
vi

vii
Wo laufen sie denn? Wo laufen sie denn hin, mein Gott?
Bernhard Victor (Vicco) Christoph Carl von Bulow alias ”‘Loriot”’ - AUF DER
RENNBAHN

viii

Contents
I Introduction 1
1 Introduction and Motivation 3
1.1 Introduction . . . . . . . . . . . . . . . . . . . . . . . . . . . . . . 5
1.1.1 Context-Aware Applications . . . . . . . . . . . . . . . . . 5
1.1.2 Outdoor Positioning . . . . . . . . . . . . . . . . . . . . . 6
1.1.3 Indoor Positioning . . . . . . . . . . . . . . . . . . . . . . 7
1.1.4 Privacy Protection . . . . . . . . . . . . . . . . . . . . . . 8
1.1.5 Design Criteria for Positioning Systems . . . . . . . . . . . 8
1.1.6 The Always Best Positioned Paradigm . . . . . . . . . . . . 10
1.2 Research Questions . . . . . . . . . . . . . . . . . . . . . . . . . . 11
1.3 Thesis Outline . . . . . . . . . . . . . . . . . . . . . . . . . . . . . 12
II Theoretical Part: Foundations 15
2 Background 17
2.1 The Advent of Position Awareness . . . . . . . . . . . . . . . . . . 17
2.1.1 A Naturalistic Perspective . . . . . . . . . . . . . . . . . . 17
2.1.1.1 Senses and Stimuli . . . . . . . . . . . . . . . . . 18
2.1.1.2 Combination of Senses . . . . . . . . . . . . . . 19
ix

x CONTENTS
2.1.1.3 Dead Reckoning . . . . . . . . . . . . . . . . . . 20
2.1.1.4 Landmarks . . . . . . . . . . . . . . . . . . . . . 21
2.1.1.5 Non-Electronic Tools for Positioning . . . . . . . 22
2.2 Human and Artificial Agents . . . . . . . . . . . . . . . . . . . . . 23
2.2.1 Sensors and Senders . . . . . . . . . . . . . . . . . . . . . 25
2.3 Classification of Positioning Systems . . . . . . . . . . . . . . . . . 27
2.3.1 Indoor versus Outdoor Positioning . . . . . . . . . . . . . . 27
2.3.2 Egocentric and Exocentric Positioning . . . . . . . . . . . . 28
2.3.2.1 Exocentric Positioning . . . . . . . . . . . . . . . 29
2.3.2.2 Egocentric Positioning . . . . . . . . . . . . . . . 29
2.3.2.3 Hybrid Approaches . . . . . . . . . . . . . . . . 29
2.3.2.4 Onboard and Offboard Calculation . . . . . . . . 31
2.3.2.5 Discussion . . . . . . . . . . . . . . . . . . . . . 32
2.3.3 Instrumented Environments and Opportunistic PositioningSystems . . . . . . . . . . . . . . . . . . . . . . . . . . . . 33
2.4 Position Representation . . . . . . . . . . . . . . . . . . . . . . . . 34
2.4.1 World Geodetic System WGS84 . . . . . . . . . . . . . . . 34
2.4.2 Semantic Representation . . . . . . . . . . . . . . . . . . . 36
2.4.2.1 UBISWORLD . . . . . . . . . . . . . . . . . . . 37
2.4.3 Positioning in a Moving Reference System . . . . . . . . . 38
2.5 Basic Mathematical Principles of Positioning . . . . . . . . . . . . 39
2.5.1 Trilateration and Multilateration . . . . . . . . . . . . . . . 39
2.5.1.1 Signal Strength . . . . . . . . . . . . . . . . . . 40
2.5.1.2 Time of Arrival (TOA) . . . . . . . . . . . . . . 41
2.5.1.3 Pseudorange . . . . . . . . . . . . . . . . . . . . 41
2.5.1.4 Time Difference of Arrival (TDOA) . . . . . . . 42
2.5.1.5 Frequency Difference of Arrival (FDOA) . . . . . 44
2.5.2 Triangulation . . . . . . . . . . . . . . . . . . . . . . . . . 44

CONTENTS xi
2.5.2.1 Angle of Arrival (AOA) . . . . . . . . . . . . . . 45
2.5.3 RSS Fingerprinting . . . . . . . . . . . . . . . . . . . . . . 46
2.6 Methods for Sensor Fusion . . . . . . . . . . . . . . . . . . . . . . 47
2.6.1 Kalman Filter . . . . . . . . . . . . . . . . . . . . . . . . . 48
2.6.2 Particle Filter . . . . . . . . . . . . . . . . . . . . . . . . . 51
2.6.3 Bayesian Networks . . . . . . . . . . . . . . . . . . . . . . 54
2.6.3.1 Dynamic Bayesian Networks . . . . . . . . . . . 59
3 Related Work 61
3.1 Positioning with a Single Sensor Technology . . . . . . . . . . . . 61
3.1.1 Global Navigation Satellite Systems (GNSS) . . . . . . . . 61
3.1.1.1 NAVSTAR GPS . . . . . . . . . . . . . . . . . . 61
3.1.1.2 GPS Indoors . . . . . . . . . . . . . . . . . . . . 64
3.1.1.3 GLONASS . . . . . . . . . . . . . . . . . . . . . 65
3.1.1.4 Galileo . . . . . . . . . . . . . . . . . . . . . . . 65
3.1.1.5 BeiDou . . . . . . . . . . . . . . . . . . . . . . . 66
3.1.1.6 Pseudolites . . . . . . . . . . . . . . . . . . . . . 66
3.1.2 Cellular Based . . . . . . . . . . . . . . . . . . . . . . . . 68
3.1.2.1 Cell ID (since 2G) . . . . . . . . . . . . . . . . . 70
3.1.2.2 Cell ID + Timing Advance (since 2G) . . . . . . 70
3.1.2.3 Cell ID + Round Trip Time (since 3G) . . . . . . 71
3.1.2.4 Observed Time Difference of Arrival (OTDOA)(since 2G) . . . . . . . . . . . . . . . . . . . . . 71
3.1.2.5 Angle of Arrival (AOA, only with additional hard-ware) . . . . . . . . . . . . . . . . . . . . . . . . 72
3.1.2.6 Positioning in 4G . . . . . . . . . . . . . . . . . 72
3.1.2.7 Indoor Positioning with Femtocells and Picocells 74
3.1.3 WiFi Based . . . . . . . . . . . . . . . . . . . . . . . . . . 75
3.1.4 Bluetooth Based . . . . . . . . . . . . . . . . . . . . . . . 78

xii CONTENTS
3.1.5 RFID Based . . . . . . . . . . . . . . . . . . . . . . . . . . 80
3.1.6 Optical Positioning . . . . . . . . . . . . . . . . . . . . . . 84
3.1.6.1 Infrared Based . . . . . . . . . . . . . . . . . . . 84
3.1.6.2 Camera Based . . . . . . . . . . . . . . . . . . . 87
3.1.6.3 Laser-Range Positioning . . . . . . . . . . . . . . 90
3.1.6.4 Optical Positioning in Gaming Consoles . . . . . 94
3.1.7 Terrestrial Radio & TV Broadcast Based . . . . . . . . . . 95
3.1.8 Magnetic Based . . . . . . . . . . . . . . . . . . . . . . . . 97
3.1.9 Ultra-Wideband (UWB) Based . . . . . . . . . . . . . . . . 98
3.1.10 Capacitance Based . . . . . . . . . . . . . . . . . . . . . . 99
3.1.11 Wireless Sensor Networks (WSN) . . . . . . . . . . . . . . 101
3.1.12 Sound Based . . . . . . . . . . . . . . . . . . . . . . . . . 103
3.1.12.1 Ultrasound Based . . . . . . . . . . . . . . . . . 104
3.1.12.2 Speaker Positioning . . . . . . . . . . . . . . . . 106
3.2 Inertial Positioning . . . . . . . . . . . . . . . . . . . . . . . . . . 108
3.3 Positioning with Several Sensor Technologies . . . . . . . . . . . . 110
3.3.1 Pereira et al.: LocateMe . . . . . . . . . . . . . . . . . . . 110
3.3.2 Gallagher et al. . . . . . . . . . . . . . . . . . . . . . . . . 111
3.3.3 Peng et al. . . . . . . . . . . . . . . . . . . . . . . . . . . . 112
3.3.4 Xiao et al. . . . . . . . . . . . . . . . . . . . . . . . . . . . 113
3.3.5 Ascher et al. . . . . . . . . . . . . . . . . . . . . . . . . . 114
3.3.6 Brunelli et al. . . . . . . . . . . . . . . . . . . . . . . . . . 116
3.3.7 Najib et al.: MapUme . . . . . . . . . . . . . . . . . . . . 118
3.3.8 Martınez et al. . . . . . . . . . . . . . . . . . . . . . . . . 119
3.4 Summary and Discussion . . . . . . . . . . . . . . . . . . . . . . . 122

CONTENTS xiii
III LOCATO 125
4 LocaTo: Localization Toolkit 127
4.1 Overview on the Localization Toolkit . . . . . . . . . . . . . . . . 128
4.1.1 Proximity Detection . . . . . . . . . . . . . . . . . . . . . 130
4.1.2 Frequency-Of-Appearance Fingerprinting (FOA) . . . . . . 130
4.1.2.1 Matching Fingerprints to Locations . . . . . . . . 133
4.1.2.2 Efficient Calculation of the Correlation Coefficient 133
4.1.2.3 Ranking System . . . . . . . . . . . . . . . . . . 135
4.1.2.4 Summary . . . . . . . . . . . . . . . . . . . . . . 136
4.1.3 Geo-Referenced Dynamic Bayesian Networks (geoDBN) . . 136
4.1.3.1 Position Estimation . . . . . . . . . . . . . . . . 140
4.1.3.2 Efficient Calculation . . . . . . . . . . . . . . . . 142
4.1.3.3 Summary . . . . . . . . . . . . . . . . . . . . . . 142
4.1.4 External Connections and Tools . . . . . . . . . . . . . . . 144
4.1.4.1 Blackboard: iROS Event Heap . . . . . . . . . . 144
4.1.4.2 UBISWORLD . . . . . . . . . . . . . . . . . . . 144
4.1.4.3 YAMAMOTO . . . . . . . . . . . . . . . . . . . . 145
4.1.5 Summary . . . . . . . . . . . . . . . . . . . . . . . . . . . 147
4.2 Out of the Blue: Offboard/Exocentric Positioning . . . . . . . . . . 148
4.2.1 Hardware . . . . . . . . . . . . . . . . . . . . . . . . . . . 148
4.2.1.1 Nomadic Device . . . . . . . . . . . . . . . . . . 148
4.2.1.2 Senders and Sensors . . . . . . . . . . . . . . . . 149
4.2.2 Methods . . . . . . . . . . . . . . . . . . . . . . . . . . . 150
4.2.2.1 Proximity Detection . . . . . . . . . . . . . . . . 150
4.2.3 Summary . . . . . . . . . . . . . . . . . . . . . . . . . . . 151
4.3 UBISPOT: Opportunistic Onboard/Egocentric Positioning . . . . . . 152
4.3.1 Hardware . . . . . . . . . . . . . . . . . . . . . . . . . . . 153

xiv CONTENTS
4.3.1.1 Senders and Sensors . . . . . . . . . . . . . . . . 153
4.3.1.2 Mobile Devices . . . . . . . . . . . . . . . . . . 154
4.3.2 Methods . . . . . . . . . . . . . . . . . . . . . . . . . . . 154
4.3.2.1 Frequency-Of-Appearance Fingerprinting . . . . 154
4.3.2.2 Building and Sharing the Database . . . . . . . . 155
4.3.3 Output to the User . . . . . . . . . . . . . . . . . . . . . . 157
4.3.4 Evaluation . . . . . . . . . . . . . . . . . . . . . . . . . . 158
4.3.4.1 Evaluation Design . . . . . . . . . . . . . . . . . 159
4.3.4.2 Results . . . . . . . . . . . . . . . . . . . . . . . 162
4.3.5 Summary . . . . . . . . . . . . . . . . . . . . . . . . . . . 166
4.4 LORIOT: High Accuracy Onboard/Egocentric Positioning . . . . . . 167
4.4.1 Hardware . . . . . . . . . . . . . . . . . . . . . . . . . . . 168
4.4.1.1 Senders and Sensors . . . . . . . . . . . . . . . . 168
4.4.1.2 Mobile Device . . . . . . . . . . . . . . . . . . . 170
4.4.2 Methods . . . . . . . . . . . . . . . . . . . . . . . . . . . 171
4.4.2.1 Obtaining Tag and Beacon Positions . . . . . . . 171
4.4.2.2 Data Caching . . . . . . . . . . . . . . . . . . . 172
4.4.3 Output to the User . . . . . . . . . . . . . . . . . . . . . . 173
4.4.4 Evaluation . . . . . . . . . . . . . . . . . . . . . . . . . . 173
4.4.4.1 Evaluation Design . . . . . . . . . . . . . . . . . 174
4.4.4.2 Ground Truth Acquisition . . . . . . . . . . . . . 174
4.4.4.3 Obtaining System Traces . . . . . . . . . . . . . 177
4.4.4.4 Calculation of the Error Distance . . . . . . . . . 179
4.4.4.5 Results . . . . . . . . . . . . . . . . . . . . . . . 180
4.4.5 Summary . . . . . . . . . . . . . . . . . . . . . . . . . . . 187
5 Location-Based Services Realized with the LOCATO Platform 189
5.1 Example Scenario . . . . . . . . . . . . . . . . . . . . . . . . . . . 189

CONTENTS xv
5.1.1 Hermione’s Lazy Saturday . . . . . . . . . . . . . . . . . . 189
5.2 UBIDOO: Location-Aware Task Planner . . . . . . . . . . . . . . . 191
5.3 Parking-Deck Navigation . . . . . . . . . . . . . . . . . . . . . . . 193
5.4 HYBNAVI . . . . . . . . . . . . . . . . . . . . . . . . . . . . . . . 195
5.5 IPLAY BLUE: User-Adaptive Public Displays . . . . . . . . . . . . 198
5.6 Navigation in Retail Environments . . . . . . . . . . . . . . . . . . 200
5.7 Location-Adaptive Audio-Notification Service . . . . . . . . . . . . 202
IV Conclusion 205
6 Conclusion 207
6.1 Scientific Contributions . . . . . . . . . . . . . . . . . . . . . . . . 208
6.2 Impact on Industry, Press and Research Community . . . . . . . . . 210
6.3 Outlook . . . . . . . . . . . . . . . . . . . . . . . . . . . . . . . . 210
V Appendix 213
A Appendix - LORIOT 215
A.1 Evaluation Traces . . . . . . . . . . . . . . . . . . . . . . . . . . . 215
A.1.1 Traces for only RFID and RFID & IR Conditions . . . . . . 216
A.1.2 Traces for only IR Conditions . . . . . . . . . . . . . . . . 232

xvi CONTENTS

List of Figures
1.1 Positions determined over a course of 25 minutes by a GPS receiverresting on a windowsill inside building E11 on campus of SaarlandUniversity. . . . . . . . . . . . . . . . . . . . . . . . . . . . . . . 7
2.1 A classification of senses. . . . . . . . . . . . . . . . . . . . . . . . 19
2.2 Acoustical based positioning tools. . . . . . . . . . . . . . . . . . . 23
2.3 An agent has sensors to perceive parts of its environment and actua-tors to manipulate it. . . . . . . . . . . . . . . . . . . . . . . . . . 24
2.4 A symbiosis between a human agent and an artificial agent: Insteadof using its effectors to directly change its environment, the artificialagent uses its effectors as a means of communication with its host toreach the common goal. . . . . . . . . . . . . . . . . . . . . . . . . 25
2.5 Classification of sensors. . . . . . . . . . . . . . . . . . . . . . . . 26
2.6 Classification of outdoor and indoor situations with examples. . . . 27
2.7 Exocentric and egocentric positioning. . . . . . . . . . . . . . . . 28
2.8 Hybrid exocentric and egocentric positioning. Sender and sensor areboth installed either in the environment or at the agent. . . . . . . . 30
2.9 Onboard exocentric and offboard egocentric positioning. Sensorydata is sent from the environment to the agent or from the agent to acomputing device in the environment. . . . . . . . . . . . . . . . . 31
2.10 WGS84 coordinates are expressed in latitude, longitude and altitude. 35
2.11 UBISEARTH is a spatial ontology in UBISWORLD. . . . . . . . . . 37
2.12 Trilateration with accurate and inaccurate measurements. . . . . . . 39
xvii

xviii LIST OF FIGURES
2.13 Inaccuracies of a quartz timer in comparison to an atomic clock. . . 42
2.14 A single TDOA measurement results in a hyperbola with two knownlocations as focus points. Only one branch of the hyperbola has tobe considered (marked with a solid line). . . . . . . . . . . . . . . . 43
2.15 An iso-Doppler contour results from the measurement of one FDOAmeasurement ([Vesely, 2010]). . . . . . . . . . . . . . . . . . . . . 44
2.16 The principle of triangulation . . . . . . . . . . . . . . . . . . . . . 45
2.17 An example for a probability distribution function. . . . . . . . . . 47
2.18 The Kalman filter loop: after an initial measurement, predictionphase and update phase will be repeatedly executed. . . . . . . . . . 49
2.19 Example of a Kalman filter for positioning. . . . . . . . . . . . . . 50
2.20 A non-Gaussian PDF and its approximation through weighted ran-dom samples (particles). . . . . . . . . . . . . . . . . . . . . . . . 52
2.21 Example of a particle filter for positioning. . . . . . . . . . . . . . . 53
2.22 An example for a Bayesian Network showing the directed acyclicgraph and the conditional probability tables. . . . . . . . . . . . . . 55
2.23 An example for a dynamic Bayesian Network including two time-slices and an inter-time-slice CPT. . . . . . . . . . . . . . . . . . . 59
3.1 A test environment for Mole [Ledlie et al., 2011]. . . . . . . . . . . 77
3.2 Comparison of passive RFID tag sizes, from standard tags (a) to µ-chips (b) to ‘RFID Dust’ (c). . . . . . . . . . . . . . . . . . . . . . 81
3.3 Some examples of optical markers. . . . . . . . . . . . . . . . . . . 87
3.4 Robot positioning with a laser-range scanner ([Fox et al., 2001]). . . 91
3.5 Two appliances equipped with laser-range scanners where developedin BAALL at DFKI in Bremen. . . . . . . . . . . . . . . . . . . . . 92
3.6 In the CyberAssist project several user devices were developed toenable human-centered information systems ([Nakashima, 2007]). . 93
3.7 The sensor equipment used for FM-radio-based positioning([Moghtadaiee et al., 2011]). . . . . . . . . . . . . . . . . . . . . . 96
3.8 Capacitance based interfaces as used in the beginning of the 20thcentury (a) and the beginning of the 21st century (b). . . . . . . . . 100

LIST OF FIGURES xix
3.9 The WSN in the Hecht museum consists of blinds (a), stationarybeacons (b) and bridge nodes (c) ([Dim et al., 2011]) . . . . . . . . 102
3.10 Relative positioning using WiFi ad-hoc connections([Rosa et al., 2011]). . . . . . . . . . . . . . . . . . . . . . . . . . 103
3.11 An example of a Global Coherence Field obtained by microphonearrays ([Brunelli et al., 2007]). . . . . . . . . . . . . . . . . . . . . 107
3.12 Flowcharts of LOCATEME’s position acquisition and fingerprintingprocess ([Pereira et al., 2011a]). . . . . . . . . . . . . . . . . . . . 110
3.13 Positioning errors of the pedestrian positioning experiment as re-ported in [Peng et al., 2011] . . . . . . . . . . . . . . . . . . . . . . 113
3.14 Average positioning error as shown in [Xiao et al., 2011]. . . . . . . 114
3.15 Simulation results as reported by [Ascher et al., 2011] . . . . . . . . 115
3.16 The architecture of the MapUme middleware ([Najib et al., 2011]). . 118
4.1 Overview on LOCATO – Localization Toolkit . . . . . . . . . . . . 129
4.2 Example calculation of a Frequency-of-Appearance fingerprint withm = 3: The appearance of each ID in all three snapshots is countedout and the relative appearance is stored in the fingerprint along witha semantic description of the current position. . . . . . . . . . . . . 131
4.3 Calculation of Frequency-of-Appearance fingerprints with a FIFOqueue of length m and resulting duration TimeWindowSize. . . . . . 132
4.4 Example of a geo-referenced Bayesian network and correspondingconditional probability tables. . . . . . . . . . . . . . . . . . . . . 137
4.5 Time-slices of a geoDBN and the corresponding conditional proba-bility tables for the transition edge between two time-slices. . . . . . 138
4.6 A cloud of geoDBNs arises around the user. Each geoDBN has aweight (indicated by the size of each geoDBN in this picture), deter-mined by its belief that the user is standing at its position. The user’sposition is estimated by calculating the center of mass of the cloud. . 140
4.7 FOA systems can be integrated into geoDBN systems by adding anode representing the FOA system. . . . . . . . . . . . . . . . . . . 143
4.8 UBISWORLD provides a film-metaphor view of the history of posi-tions of a user. . . . . . . . . . . . . . . . . . . . . . . . . . . . . . 145

xx LIST OF FIGURES
4.9 YAMAMOTO can be used to model a building and plan the position-ing infrastructure. Shown are IR beacons (red), active RFID tags(green) and Bluetooth beacons (blue). . . . . . . . . . . . . . . . . 146
4.10 YAMAMOTO allows to geo-reference a model by rescaling, resizingand placing it into an already geo-referenced areal photography. . . 147
4.11 OUT OF THE BLUE is not limited to smartphones on the user’s side.Any Bluetooth enabled device is usable as positioning tag, includingso-called ‘dumbphones’. . . . . . . . . . . . . . . . . . . . . . . . 149
4.12 OUT OF THE BLUE consists of stationary devices, like desktop PCs,public displays or kiosk systems that scan their environment for mo-bile Bluetooth devices, like cell phones, wireless headsets or Blue-tooth tags. Information can be shared via a blackboard service andregistered users can store their Bluetooth IDs in UBISWORLD. . . . 150
4.13 Sensors and senders of UBISPOT: GSM/UMTS cells, WiFi accesspoints and Bluetooth devices act as senders. For outdoor positioning,GPS is used in addition. . . . . . . . . . . . . . . . . . . . . . . . . 153
4.14 Training of a new location in UBISPOT: A user browses throughthe imported UBISEARTH location model and refines it by a newlocation. This location is stored with the current fingerprint. . . . . . 156
4.15 Output of the UI of UBISPOT: The confidence level of the systemis color-coded: green for highest confidence, yellow for middle andgray for lowest confidence. . . . . . . . . . . . . . . . . . . . . . . 157
4.16 Floor plan of the evaluation environment, located in the first floorof computer science building E11 of Saarland University, Germany.Red dots indicate rooms that were trained as landmarks, green starsindicate the tested rooms. . . . . . . . . . . . . . . . . . . . . . . . 160
4.17 The calculation of 100 FOA fingerprints with differentTimeWindowSize. Since the fingerprints are calculated byusing a FIFO, 99 + TimeWindowSize snapshots are needed. . . . 161
4.18 Recognition accuracy versus TimeWindowSize for three adjacentrooms. Solid lines indicate results including all available sensor data,dashed lines indicate the results when Bluetooth is not considered forthe position calculation. . . . . . . . . . . . . . . . . . . . . . . . . 163
4.19 Hits and misses for office 119-1 not considering Bluetooth devices.Most of the time UBISPOT mistakes the office 119-1 for the corridor. 164

LIST OF FIGURES xxi
4.20 Hits and misses for office 119-1 including Bluetooth devices. Office119-1 is correctly classified most of the time, the number of incorrectclassifications is drastically reduced. . . . . . . . . . . . . . . . . . 165
4.21 Accuracy plotted against TimeWindowSize when only three land-marks are stored in the trained database. . . . . . . . . . . . . . . . 165
4.22 LORIOT uses active RFID tags and infrared beacons, which are dis-tributed into the environment, to estimate the current position of aWindows Mobile PDA. . . . . . . . . . . . . . . . . . . . . . . . . 167
4.23 IR beacon as manufactured by Eyeled (a). Each beacon sends out a16-bit wide ID, which can be configured by DIP switches. The circuitis powered by 3 AA batteries (b). The beacons can be detected andidentified by standard IR sensors, which are often already integratedinto mobile devices (c). IR beacons are perfect to signal points ofinterests (d). . . . . . . . . . . . . . . . . . . . . . . . . . . . . . . 169
4.24 Active RFID tag by Identec Solutions as used in the LORIOT system.Each tag has a unique ID number that is also printed on the back ofthe housing (b). The tags are powered by coin cell batteries and thecircuit contains an LED that can be used to indicate activity of eachtag (c). . . . . . . . . . . . . . . . . . . . . . . . . . . . . . . . . . 170
4.25 Geo referenced dynamic Bayesian network and the correspondingconditional probability tables as used by LORIOT. . . . . . . . . . . 171
4.26 The foyer of DFKI Saarbrucken was used a testfield, since it providesa large area and a visual coordinate system through the tiles. . . . . 175
4.27 A grid overlay was used to annotate each step of a person with ac-cording coordinates. . . . . . . . . . . . . . . . . . . . . . . . . . . 176
4.28 Four basic cases were considered for obtaining coordinates of eachstep of a person. . . . . . . . . . . . . . . . . . . . . . . . . . . . . 176
4.29 Example visualizations of extracted ground truth traces. . . . . . . . 177
4.30 58 active RFID tags were distributed in the DFKI foyer. . . . . . . . 178
4.31 Traces were laid out on the floor and followed while carrying a mo-bile device running LORIOT. . . . . . . . . . . . . . . . . . . . . . 179
4.32 Ground truth time-stamps of single footsteps and LORIOT time-stamps of user positions do not necessarily coincide. . . . . . . . . 180

xxii LIST OF FIGURES
4.33 Two example results from the evaluation. The red boxes depict theground-truth steps. The blue boxes represent the positions derived byLORIOT. The black crosses show the interpolated user steps, whichare connected by black dotted lines with their respective user position. 181
4.34 The average positioning error of all traces with original velocitiesand with respect to the five tested conditions. . . . . . . . . . . . . 182
4.35 The worst (a) and best (b) result for the ‘only IR’ condition. In Trace8 only one IR beacon was detected. Trace 6 contains 4 detected IRbeacons. . . . . . . . . . . . . . . . . . . . . . . . . . . . . . . . . 184
5.1 The here-and-now view of the same to-do list at different locations[Stahl et al., 2007]. . . . . . . . . . . . . . . . . . . . . . . . . . . 192
5.2 Components of PARKNAVI. The current user position isread from LORIOT to update route instructions accordingly[Gholamsaghaee, 2007]. . . . . . . . . . . . . . . . . . . . . . . . 194
5.3 PARKNAVI screenshots [Gholamsaghaee, 2007] . . . . . . . . . . . 195
5.4 HYBNAVI is an extension of PARKNAVI [Mutafchiev, 2008]. . . . . 196
5.5 HYBNAVI supports three different navigation perspectives and is ca-pable of rendering eye-catching objects that can act as landmarks[Mutafchiev, 2008]. . . . . . . . . . . . . . . . . . . . . . . . . . . 197
5.6 Example view of IPLAY BLUE on a public display [Schottle, 2006]. 199
5.7 The IRL SmartCart enables product-related navigation in shoppingenvironments [Kahl et al., 2011]. . . . . . . . . . . . . . . . . . . . 200
A.1 Trace 01 . . . . . . . . . . . . . . . . . . . . . . . . . . . . . . . . 216
A.2 Trace 02 . . . . . . . . . . . . . . . . . . . . . . . . . . . . . . . . 217
A.3 Trace 03 . . . . . . . . . . . . . . . . . . . . . . . . . . . . . . . . 218
A.4 Trace 04 . . . . . . . . . . . . . . . . . . . . . . . . . . . . . . . . 219
A.5 Trace 05 . . . . . . . . . . . . . . . . . . . . . . . . . . . . . . . . 220
A.6 Trace 06 . . . . . . . . . . . . . . . . . . . . . . . . . . . . . . . . 221
A.7 Trace 07 . . . . . . . . . . . . . . . . . . . . . . . . . . . . . . . . 222
A.8 Trace 08 . . . . . . . . . . . . . . . . . . . . . . . . . . . . . . . . 223
A.9 Trace 09 . . . . . . . . . . . . . . . . . . . . . . . . . . . . . . . . 224

LIST OF FIGURES xxiii
A.10 Trace 10 . . . . . . . . . . . . . . . . . . . . . . . . . . . . . . . . 225
A.11 Trace 11 . . . . . . . . . . . . . . . . . . . . . . . . . . . . . . . . 226
A.12 Trace 12 . . . . . . . . . . . . . . . . . . . . . . . . . . . . . . . . 227
A.13 Trace 13 . . . . . . . . . . . . . . . . . . . . . . . . . . . . . . . . 228
A.14 Trace 14 . . . . . . . . . . . . . . . . . . . . . . . . . . . . . . . . 229
A.15 Trace 15 . . . . . . . . . . . . . . . . . . . . . . . . . . . . . . . . 230
A.16 Trace 16 . . . . . . . . . . . . . . . . . . . . . . . . . . . . . . . . 231
A.17 IR Traces 01, 02, 03 and 04 . . . . . . . . . . . . . . . . . . . . . . 232
A.18 IR Traces 05, 06, 07 and 08 . . . . . . . . . . . . . . . . . . . . . . 233
A.19 IR Traces 09, 10, 11 and 12 . . . . . . . . . . . . . . . . . . . . . . 234
A.20 IR Traces 13, 14, 15 and 16 . . . . . . . . . . . . . . . . . . . . . . 235

xxiv LIST OF FIGURES

List of Tables
2.1 Privacy levels for different configurations of positioning systems. . 32
3.1 Accuracies of standard GPS, AGPS, DGPS, WAAS and RTK GPS. . 64
3.2 Comparison of multiple-sensor systems and single-sensor based po-sitioning systems with LOCATO. . . . . . . . . . . . . . . . . . . . 121
4.1 The collected data for each sensor in UbiSpot. Each Snapshot cancontain several instances of GSM, WiFi Access Point and BluetoothDevice. . . . . . . . . . . . . . . . . . . . . . . . . . . . . . . . . 155
4.2 Comparison of positioning error when following the ground truth inoriginal velocity. The numbers in parenthesis show the ranking ofeach value. . . . . . . . . . . . . . . . . . . . . . . . . . . . . . . 183
4.3 Comparison of positioning errors when following the traces in slowvelocity. . . . . . . . . . . . . . . . . . . . . . . . . . . . . . . . . 185
4.4 Comparison of positioning error when comparing the graphical sim-ilarity of the system to the ground truth. . . . . . . . . . . . . . . . 186
xxv

xxvi LIST OF TABLES

Part I
Introduction
1


1 INTRODUCTION AND MOTIVATION
Prologue
‘Oh yes’, said Fred, smirking. ‘This little beauty’s taught us more than all the teach-ers in this school.’He took out his wand, touched the parchment lightly and said, ‘I solemnly swear thatI am up to no good.’And at once, thin ink lines began to spread like a spider’s web from the point thatGeorge’s wand had touched. They joined each other, they criss-crossed, they fannedinto every corner of the parchment; then words began to blossom across the top,great, curly green words, that proclaimed:
Messrs Moony, Wormtail, Padfoot and ProngsPurveyors of Aids to Magical Mischief-Makers
are proud to presentTHE MARAUDER’S MAP
It was a map showing every detail of the Hogwarts castle and ground. But the trulyremarkable thing was the tiny ink dots moving around it, each labelled with a namein minuscule writing. Astounded, Harry bent over it. A labelled dot in the top leftcorner showed that Professor Dumbledore was pacing his study; the caretaker’s cat,Mrs Norris, was prowling the second floor, and Peeves the poltergeist was currentlybouncing around the trophy room. And as Harry’s eyes travelled up and down thefamiliar corridors, he noticed something else.
This map showed a set of passages he had never entered. And many of them seemedto lead –
3

4 INTRODUCTION AND MOTIVATION
‘Right into Hogsmeade,’ said Fred, tracing one of them with his finger.
As Harry stood there, flooded with excitement, something he had once heard MrWeasley say came floating out of his memory.
Never trust anything that can think for itself, if you can’t see where it keeps its brain.
This map was one of those dangerous magical objects Mr Weasley had been warn-ing against . . . Aids to Magical Mischief-Makers . . . but then, Harry reasoned, he onlywanted to use it to get into Hogsmeade, it wasn’t as though he wanted to steal any-thing or attack anyone . . . and Fred an George had been using it for years withoutanything horrible happening . . .
Harry traced the secret passage to Honeydukes with his finger.
Then, quite suddenly, as though following orders, he rolled up the map, stuffed itinside his robes, and hurried to the door of the classroom. He opened it a coupleof inches. There was no one outside. Very carefully, he edged out of the room andslipped behind the statue of the one-eyed witch.
What did he have to do? He pulled out the map again and saw, to his astonishment,that a new ink figure had appeared upon it, labelled ‘Harry Potter’. The figure wasstanding exactly where the real Harry was standing, about halfway down the third-floor corridor. Harry watched carefully. His little ink self appeared to be tapping thewitch with his minute wand. Harry quickly took out his real wand and tapped thestatue. Nothing happened. He looked back at the map. The tiniest speech bubble hadappeared next his figure. The word inside said ‘Dissendium’.
‘Dissendium!’ Harry whispered, tapping the stone witch again.
At once, the statue’s hump opened wide enough to admit a fairly thin person.
Taken and compiled from: HARRY POTTER AND THE PRISONER OF ASKABAN byJoanne K. Rowling © J.K. Rowling 1999

1.1 INTRODUCTION 5
1.1 Introduction
Many of the magical artifacts that Joanne K. Rowling describes in her world-famousHarry Potter novels can be achieved in the real world through the use of moderninformation technology. In general, movies or novels can be great inspirations for ITapplications. As creative writers of screenplays or novels do not have to care muchabout the technical feasibility of their ideas, they are free to envision any features thatare useful for their current plot. In [Schmitz et al., 2008] and [Endres et al., 2010],movies were analyzed to find new human-computer interaction paradigms and waysto personalize user-interfaces in automotive applications. The Marauder’s Map fromthe excerpt above was, for example, the inspiration for a system called Marauder’sLight ([Lochtefeld et al., 2009]).
The main topic of this thesis is positioning, and Harry Potter’s ‘Marauder’s Map’from the excerpt above is an example for an application, which is based on position-ing. In the novel, the Marauder’s Map is a piece of parchment, which shows a map ofHarry’s school as well as a part of the neighborhood. Furthermore, the positions ofall people wandering about in the school are shown, including the position of Harryhimself. With the map, Harry is able to find a secret passage to a nearby village andin order to help him gain access to the passage the map assists him by showing theneeded actions.
1.1.1 Context-Aware Applications
In general, such an application that uses the current context of a user, is called aContext-Sensitive application. [Schilit et al., 1994] identify three important aspectsof context as: ‘where you are, who you are with and what resources are nearby’. Allthree aspects are considered in the Marauder’s Map, where the first two are coveredby showing the positions of Harry and others, and the last one by showing one ormore secret passages. It can also be seen that position or location is a very importantaspect of context. A more general definition of context is given by [Dey, 2001]:
Definition 1.1 (Context) ‘Context is any information that can be used to character-ize the situation of an entity. An entity is a person, place, or object that is consideredrelevant to the interaction between a user and an application, including the user andapplications themselves.’
Services that specifically use the position of a user are called Location-Based Ser-vices, or LBS for short. A definition for LBS is given in [Virrantaus et al., 2001]:

6 INTRODUCTION AND MOTIVATION
Definition 1.2 (Location-Based Service) ’LBSs are services accessible with mobiledevices through the mobile network and utilizing the ability to make use of the loca-tion of the terminals.’
Location-based services are thus a subset of context-aware services or applications.When seeing the Marauder’s map as a mobile device and abstracting away the mobilenetwork as being some sort of magic, it fulfills the definition of an LBS.
A further interesting concept can be identified in the excerpt above: the map deter-mines that Harry is not able to open the entrance to the secret passage and automat-ically presents useful information to assist him. Such behavior, i.e. giving furtherinformation without the user specifically asking for it, is called proactive. The oppo-site behavior, in which the user specifically requests information, is called reactive.
Prominent examples in the real world that come close to the Marauder’s Map arenavigation systems for cars. The route planning of such a navigation system is usu-ally reactive, i.e. a user has to at least specify their destination. The navigation itself,i.e. giving navigation instructions and potential recalculation of the route because ofdeviations, is proactive. Based on map material and the current position of the vehi-cle, the system can derive when a user has to take a turn and can give them furtherassistance. If the current position veers away from the planned route, the system caninfer that the user has possibly lost their way or is following a deviation unknownto the system and can thus calculate a new route from the current position to thedestination.
Harry’s magic map could use a similar approach to infer that he is having troubleopening the entrance to the secret passage: if the map knows Harry’s destination –the next village in the excerpt – and detects that Harry stays in front of the entrancefor a while, it could deduce that he needs further assistance. This example shows thatposition information is viable not only for navigation instructions, but also to inferfurther knowledge about the current context of a user.
1.1.2 Outdoor Positioning
Is the Marauder’s Map thus already realizable with little technical effort? No. To-day’s navigation systems use satellite-based positioning systems, for example GPS(Global Positioning System). As will be seen in Section 2.3.1, the needed receptionof satellite signals can already be disturbed by tall buildings, which form so-calledurban canyons. Inside of a building, even highly sensitive satellite-receivers can onlywork satisfactorily near windows and exterior walls. Figure 1.1 shows the reportedpositions of a GPS receiver, resting on a windowsill in the first level of building E11on campus of Saarland University. The shown measurements were obtained over

1.1 INTRODUCTION 7
Figure 1.1: Positions determined over a course of 25 minutes by a GPS receiverresting on a windowsill inside building E11 on campus of Saarland University.
a course of 25 minutes after the first position was derived by the GPS receiver (aHolux1 GPSlim 236). The maximum deviation from the real position in this exam-ple is 444 meters. A position determination with GPS deep inside a building – orin a castle as in the case of Harry Potter – is thus highly unrealistic. GPS, or moregenerally, Global Navigation Satellite Systems (GNSS), are thus so-called outdoorpositioning systems.
1.1.3 Indoor Positioning
In order to realize positioning inside of a building, different approaches have beenrealized, which differ in several aspects: the technology that is used, the positioningaccuracy that they are able to deliver, as well as the deployment and maintenancecosts. These systems are called indoor positioning systems and a de facto standard– like GPS for outdoor positioning – is not available. This is mainly due to theinvestments a building owner or operator would have to make in order to realizesuch a system. Although it is possible to derive positions by using already existinginfrastructure, these systems may not provide the needed position accuracy for aspecific application.
1http://www.holux.com/

8 INTRODUCTION AND MOTIVATION
1.1.4 Privacy Protection
Personal position information is of course highly sensible. On the Marauder’s MapHarry can not only see his own position, but also the positions of everybody else inhis vicinity. Moreover, these people are not aware that their positions are revealedto somebody else. This is obviously a violation of privacy. Maybe this is why themap is secured with the passphrase ‘I solemnly swear that I am up to no good.’. Thename Marauder’s Map, the term ‘Magical Mischief-Makers’ and the content of thepassphrase itself are of course already hints that the map is intended for misuse. Mr.Weasley’s remark to ‘never trust anything that can think for itself, if you can’t seewhere it keeps its brain’ can also be seen as an appeal for the responsible use ofintelligent systems.
The protection of privacy is thus an important issue when dealing with positioningsystems. Ideally, a positioning system should be designed in such a way that as littleinformation as possible is revealed to the outside world and thus making it hard foran interceptor to gain access to positioning information. Furthermore, the sharing ofpositioning information should be under full control of the user.
1.1.5 Design Criteria for Positioning Systems
With the considerations from above in mind, several criteria can be specified, whichshould be kept in mind when designing a positioning system.
• Accuracy: The accuracy of a positioning system describes how close the de-rived position is to the real position. In general, the needed accuracy of apositioning system depends on the application, which makes use of the posi-tion information. Ideally, a positioning system can be used for any applicationand thus its accuracy should be as high as possible.
• Robustness: In principle, a positioning system should always deliver positioninformation. In practice however, this may not always be possible because theposition determination depends on the available information, e.g. the numberof receivable satellites or the signal quality. It may also depend on the relia-bility of hardware components, for example the accuracy of the clocks used insatellites, the sensibility of the used receiver, or even the mechanical or envi-ronmental resilience of components. A robust positioning system should thusbe able to cope with technical failure as well as degraded signals.
• Cost of Ownership: The cost of ownership of a positioning system can bedivided into the costs for the operator of such a system and the costs for a user,

1.1 INTRODUCTION 9
who wants to make use of the system. In both cases, the cost should be as lowas possible.
– Infrastructure Cost: If a positioning system needs a dedicated infra-structure, an operator has to compensate for the cost of installing andmaintaining the needed infrastructure. This includes the cost of the re-quired hardware as well as expenses for the power consumption and forpotential replacements.
– Cost of Mobile Device: A user of a positioning system may need ad-ditional hardware to make use of the system, e.g. a GPS receiver andadditional computational hardware to visualize the current position or togive route instructions.
• Usability and Applicability: A positioning system should also be easy to useand should be applicable in any situation. For example, carrying a satellite dishwith a diameter of several centimeters may increase signal quality but is hardlypractical during an exploratory tour through a foreign city. Similar considera-tions come into play when deploying an infrastructure for a positioning system:voluminous hardware may be profitable for the accuracy or robustness of a po-sitioning system, but may as well be impracticable due to space constraints orunsightliness (see also [Schwartz and Jung, 2006]). Several sub-criteria can bespecified for usability and applicability:
– Weight: At least on the user side, the needed hardware should belightweight
– Size: The needed hardware for the infrastructure and the user should besmall in size
– Power Consumption: Since the hardware for the user is in general mo-bile and thus runs on batteries, the power consumption should be as lowas possible. In order to achieve low power consumption, the hardwareitself and the computational complexity of the used algorithms on themobile device have to be taken into account.
• Privacy Protection: As mentioned in Section 1.1.4, the privacy of a user of apositioning system should be protected as well as possible.
Some of these criteria are conflicting with each other, e.g. higher accuracy and higherrobustness can often be achieved through a more expensive infrastructure or moreexpensive user hardware. In practice, trade-offs have to be made, which often dependon the main application or planned application of a positioning system.

10 INTRODUCTION AND MOTIVATION
1.1.6 The Always Best Positioned Paradigm
In general, the above mentioned trade-offs are made by the operator of a positioningsystem, who may either also provide the needed user hardware or may rely on al-ready existent hardware on the user side. If a user wants to be able to find out abouttheir position in as many situations as possible, a solution has to be found, whichenables a preferably broad coverage of positioning in indoor as well as outdoor envi-ronments. A similar situation is on hand in the area of mobile internet and cell-phoneconnectivity. A large variety of technologies for data or speech connections is avail-able to a mobile user, e.g. GSM (a second generation (2G) cell-phone technology),GPRS (sometimes dubbed 2.5G), UMTS (3G) and LTE (3.9G). At home and in pub-lic places and buildings like hotels, airports or libraries, so-called WiFi hotspots areoften available, which allow users to obtain a wireless connection to the internet.
In [Gustafsson and Jonsson, 2003], the concept of Always Best Connected (ABC)was introduced: ‘The Always Best Connected (ABC) concept allows a person con-nectivity to applications using the devices and access technologies that best suit hisor her needs, thereby combining the features of access technologies such as DSL,Bluetooth, and WLAN with cellular systems to provide an enhanced user experiencefor 2.5G, 3G, and beyond.’. [Passas et al., 2006] add that the term Best in AlwaysBest Connected ‘is usually defined separately for each user, as part of his/her pro-file, and it can be a function of service quality, cost, terminal capabilities, personalpreferences etc. [. . . ] This should be performed with no or minimum interventionof the user, leading to what is referred to as �invisible network�’. In other words,the switch between different connectivity technologies should happen proactively, ifpossible.
In analogy to the ABC concept, the Always Best Positioned paradigm (ABPparadigm) can be defined. Similarly to ABC, an ABP system always tries to de-termine the position of a user, using any means that are currently available to thesystem. If an ABP system has access to several positioning technologies at the cur-rent location, it will try to combine these technologies to achieve an even higheraccuracy. Which technologies are used in a given situation generally depends on twofactors:
• the technical resources directly available to the user, i.e. a mobile device suchas a cellphone and the available senders and sensors of that device
• the available technical resources in the current environment, i.e. the technicalinfrastructure, which can also consist of senders and sensors
The potential to gain position information and the possible position-accuracy thusdepends on the technical resources of the user’s device and the environment. As it is

1.2 RESEARCH QUESTIONS 11
the case with ABC, the switch between different positioning technologies should beproactive. An ABP system can thus be defined as:
Definition 1.3 (Always Best Positioned System) An Always Best Positioned Sys-tem tries to determine a position as accurately as possible in any situation and atany time using the resources that are accessible at the current location. The ad-dition and omission of positioning technologies or the switch between positioningtechnologies should be proactive and seamless.
The Always Best Positioned Paradigm thus tackles some of the design criteria forpositioning systems from the user’s side of view. In particular the robustness andaccuracy, where the former is influenced by the ability of an ABP system to switchbetween several technologies and the latter by the ability to combine several tech-nologies.
1.2 Research Questions
The main research question answered in this thesis is:
• How can positioning systems be built according to the design criteria spec-ified in Section 1.1.5? As already mentioned, designing a positioning systemrequires trade-offs between single criteria. In Section 1.1.6, the Always BestPositioned Paradigm was already identified as being essential to address theuser’s need for accuracy and robustness of a positioning system. Therefore,methods will be investigated in this thesis, which help to realize the AlwaysBest Positioned paradigm. In addition, a comprehensive toolkit will be de-signed and implemented, which allows to create positioning systems that canbe tailored to the specific needs of the operator and its users.
In order to answer this main question, the following subquestions must be answered:
• What are the basic methods for position determination in natural organ-isms? In order to gain a basic understanding of how position determination canbe achieved, interdisciplinary insights on neuropsychology and biology will beused to identify the basic needs and methods to obtain self-position awareness.
• How can natural self-position awareness be replicated through methodsof Artificial Intelligence? A link between the natural methods and technicalmethods of position awareness and position determination will be established.This link will help to identify basic building blocks of positioning systems.

12 INTRODUCTION AND MOTIVATION
• How can technical positioning methods be classified and what are the im-plications of the classification? Based on the derived basic building-blocksof positioning systems, possible design-variations will be analyzed.
• How should a positioning system be designed to protect the privacy of itsusers? As the protection of the user’s privacy is one of the design criteria ofpositioning systems, the design variations that give the best privacy protectionshould be identified. This will be done by analyzing the data flow in possiblepositioning-system architectures.
• What are possible methods to build positioning systems following the Al-ways Best Positioned paradigm? In order to realize the Always Best Posi-tioned paradigm, a preferably general solution to perform sensor fusion has tobe found. This question will be answered by analyzing known methods forsensor fusion.
• How far do state-of-the-art positioning systems comply with the specifieddesign criteria and the Always Best Positioned paradigm? This questionwill be answered by conducting a comprehensive analysis of state-of-the-art aswell as classical positioning systems.
• How can positioning systems be evaluated? Since the accuracy is one of themain design criteria for positioning systems, preferably rigorous evaluationmethods should be found, which take interferences into account instead ofminimizing them. Using the designed toolkit, several positioning systems willbe realized and rigorously tested regarding their accuracy.
1.3 Thesis Outline
In Chapter 2, the basic building blocks of positioning systems are derived by givingan overview on the neuropsychological view on perception. Based on these find-ings, the basic building blocks for a position-aware artificial agent are identified andpossible variations are discussed. Furthermore, the chapter gives an introduction toposition representation, the mathematical principles of positioning and an introduc-tion to Bayesian filtering and Bayesian networks.
Chapter 3 first gives an introduction into GPS and Global Navigation Satellite Sys-tems in general. Furthermore, the most widespread sender and sensor technologieswill be discussed in detail and example positioning-systems for each technology willbe explained. State of the art single-sensor and multi-sensor positioning systemswill be analyzed and their compliance with the design criteria and the Always BestPositioned paradigm will be discussed.

1.3 THESIS OUTLINE 13
Chapter 4 introduces the Localization Toolkit LOCATO. An overview on its capa-bilities will be given and its components will be explained in detail. Section 4.2to Section 4.4 describe three positioning systems that were developed using LO-CATO. Each system addresses different design criteria. Section 4.2 introduces OUT
OF THE BLUE, a simple but cost-effective tracking system, with emphasis on usagein conjunction with public displays. UBISPOT, an opportunistic positioning sys-tem designed for Android devices that can provide position information in variousenvironments without additional instrumentation, is described and evaluated in Sec-tion 4.3. Section 4.4 introduces LORIOT, a real-time capable positioning system withhigh accuracy, which was designed for instrumented environments. The evaluationof LORIOT will also be described in detail.
Chapter 5 presents six applications that were realized either with modules of LO-CATO or by directly integrating one of the implemented positioning systems.
Chapter 6 summarizes the results of this thesis and gives an outlook on future work.

14 INTRODUCTION AND MOTIVATION

Part II
Theoretical Part: Foundations
15


2 BACKGROUND
2.1 The Advent of Position Awareness
This section describes a general concept, which enables a methodical analysis ofways how to accomplish the task of positioning.
2.1.1 A Naturalistic Perspective
Positioning is not a purely technical task: Even animals have ways to keep track oftheir own position. It can be argued that the problem of positioning, i.e. having somesense about one’s own location, arises as soon as an organism gains the ability topropel itself in a controlled fashion.
To elaborate further on this thought, consider a hypothetical low life-form in the Pan-thalassic Ocean1, with no means of self-locomotion or other ways to influence its ownposition. Furthermore, it has no sense of its surroundings, nor of its own position.Whether or not this life form has access to life-supporting and species-preservingresources would totally depend on external factors, e.g. ocean currents. Developinga sense of its own position would therefore not be beneficial for preserving its ownlife or for the survival of its own species (but it would be of no obvious disadvantageeither). In terms of genetic evolution, a mutation of this life-form into a ’self-positionaware’ being would not give a survival benefit over its ’non self-position aware’ con-geners.
What if the life-form develops the ability to control its own movement and thereforeits own position? In order to gain evolutionary advantage from this new ability, the
1The Panthalassic Ocean or Panthalassa (Greek: all sea) is the global ocean that sur-rounded the supercontinent Pangaea (Greek: entire earth) about 250 million years ago[van Waterschoot van der Gracht et al., 1928]
17

18 BACKGROUND
life-form would need a way to decide, in which direction it should move, i.e. itneeds to be aware of the locations of species- and life-preserving resources (and/orthe locations of endangering threats) and at least it has to have some indication if itis getting nearer to, or further away from, these locations. In other words, the life-form needs to be aware of its own position relative to locations of other life-formsor objects that are important for it. This kind of position is called relative positionand such locations that are of particular interest are called points of interest (oftenabbreviated as POIs).
Definition 2.1 (Relative Position) A point defined with reference to another posi-tion, either fixed or moving.
Definition 2.2 (Point of Interest (POI)) A specific point location that is interestingor valuable for an entity.
2.1.1.1 Senses and Stimuli
In order to gain a relative position, the life-form needs to be able to sense the presenceof other life-forms or objects. In biological terms, this is achieved with sensory re-ceptors that are able to pick up signals that are emitted or reflected by other entities.In his treatise ‘De Anima’, Aristotle identified five senses: sight (ophthalmocep-tion), sound (audioception), smell (olfacoception), taste (gustaoception) and touch(tactioception). He also argued that there are no other than these five senses. Mod-ern science however recognizes more senses, like pain (nociception), temperature(thermoception), balance (equilibrioception) and kinesthetic sense (proprioception).Non-human senses also include magnetism (magnetoception), electrical fields (elec-troception), and polarized light.
There is no consensus about a definition of sense and thus the number of sensesvaries throughout the literature. Some researchers classify into exteroceptive and in-teroceptive senses. Exteroceptive senses are senses that react to stimuli that originateoutside of the sensing entity. Interoceptive senses react to stimuli from inside the en-tity and can be further divided into proprioception, which senses relative positions ofown body parts as well as their acceleration, and visceroception, which senses stim-uli originating from internal organs, e.g. the perception of one’s own heartbeat (cf.[Vaitl, 1996]). Obviously, exteroception provides the life-form with the necessary in-formation to sense the presence of other entities. Proprioception, on the other hand,provides information about the configuration and orientation of its own body. How-ever, the strict distinction between exteroception and proprioception is also disputedin literature. [Gibson, 1979] claims that ‘all perceptual systems are propriosensitiveas well as exterosensitive, for they all provide information in their various ways aboutthe observer’s activities’ (page 115). He further argues, that the term egoreception is

2.1 THE ADVENT OF POSITION AWARENESS 19
!"#$"$%
&'(")*+",-."%!"#$"$%
/0)1!"#$"$%
2"0)1!"#$"$%
3#(")*+",-."%!"#$"$%
4)*,)5*+",-."%!"#$"$%
65$+")*+",-."%!"#$"$%
Figure 2.1: A classification of senses.
more appropriate than proprioception. This view is supported by the reported case ofa 19 years old male who, due to injury, lost his proprioception. He never recoveredfrom this loss, but managed to relearn how to walk and even how to drive a car byreplacing his proprioception through vision. He reported that the mental effort in hisdaily life feels like having to do a daily marathon (cf. [Kolb and Whishaw, 2003],pp. 173–174 and [Cole, 1995]). From this episode it can be concluded that althoughproprioception might be substituted by exteroception, the combination of both helpsto reduce the cognitive load.
Human senses can further be classified into near-senses and far-senses, dependingon whether the perception is directly associated with the sensing organ (near-sense)or not (far sense). According to this definition, the only human far-senses are sightand sound and all other senses are near-senses. Figure 2.1 shows a classification ofsenses by combining the different existent classifications.
2.1.1.2 Combination of Senses
In general, the combination of different senses, may they be exteroceptive or intero-ceptive, plays an important role in self-positioning. For example, if one is standingin a bakery, the visual sense will provide cues like the shape and texture of differentbreads and cakes, olfacoception provides the characteristic smell of freshly bakedbread and thermoception may provide a higher temperature due to the heated oven.

20 BACKGROUND
The technical term for such a combination of senses is sensor fusion and will bediscussed in Section 2.6.
A more concrete example can be derived from fauna. As already mentioned above,some animals have a sense for polarized light, or more specifically for the direc-tion of polarized light. This sense helps them to keep direction, since sunlight getspolarized through scattering and the polarization direction depends on the currentposition of the sun. The sense for polarization direction thus can help animals tokeep their direction, although no direct view to the sun is available. This ability ofkeeping direction is also called celestial compass ([Wehner and Lanfranconi, 1981]).According to the classification above, the sense for polarization direction is an extero-ceptive far-sense. This sense alone is not sufficient to determine a relative position. In[Wagner et al., 2006] the authors hypothesize that ants combine their celestial com-pass with some kind of step-counter, or odometer, to determine their current positionrelative to the nest. They tested this hypothesis by artificially shortening or lengthen-ing the legs of Cataglyphis fortis, a foraging desert ant species, after they had arrivedat a location outside of their nest. The results confirmed their theory in that ants withlengthened legs overshot while trying to return to the nest and ants with shortenedlegs stopped prematurely. The exact mechanism of the odometer is not known, butcould be based on proprioceptive senses.
Although humans do not have a direct sense for polarized light, most can learn toidentify the polarization direction by an entoptic phenomenon2, called Haidinger’sbrush. This phenomenon is named after its discoverer Wilhelm Karl Ritter vonHaidinger, an Austrian scientist, who realized that a sudden change of the po-larization direction relative to the observer’s eye results in a visible, faint yel-low and blue pattern, whose orientation correlates with the polarization direction[Haidinger, 1844].
2.1.1.3 Dead Reckoning
In the context of animals, the above described method of self-positioning through theuse of direction and distance information is commonly referred to as path integration.A more technical term for path integration is dead reckoning, which is claimed to bederived from the phrase ‘deduced reckoning’ (cf. [Kolb and Whishaw, 2003], page560). Humans usually perform dead reckoning with the help of tools, like a compassand a means of measuring their speed to determine the traveled distance. Columbusis believed to have used dead reckoning while traveling to Central America. Deadreckoning still plays an important role in technical position determination and willbe further discussed in Section 2.6.
2a phenomenon that is created in the eye itself

2.1 THE ADVENT OF POSITION AWARENESS 21
Although there is no evidence that humans use Haidinger’s brush to accomplish pathintegration, it seems that the polarization effect was used by humans in maritime nav-igation. [Ropars et al., 2011] claim that the Vikings sailed to North America usinga special crystal, the transparent common Iceland spar, as a depolarizer to detect thehidden sun and thus being able to keep their direction even when no visible land-marks were available. Ropars et al. conducted experiments showing that with thehelp of such a ‘sunstone’, the direction of the sun can be determined up to +/- fivedegrees, even under crepuscular conditions.
2.1.1.4 Landmarks
A further concept to gain more information about relative position is that of land-marks, i.e. objects with known positions that are easy to identify and that can beperceived over a large distance. Examples for landmarks are peculiar looking moun-tains or tree formations, but also star-formations and single stars (especially the sun),although the latter change their position over time. Besides natural objects, manmade objects can act as landmarks as well and can be classified into landmarks thatwere built for the purpose of positioning or navigation, e.g. position fires, lighthousesand foghorns, and landmarks that were built for other purposes, e.g. skyscrapers orradio towers (see also Section 2.3.3). [Lynch, 1960] claimed that in order to navigatethrough cities, the memory of landmarks plays an important role. However, the usageof the term landmark varies in literature. [Sadalla et al., 1980] summarized that theterm has been used to denote
(a) discriminable features of a route, which signal navigational decisions
(b) discriminable features of a region, which allow a subject to maintain a generalgeographical orientation
(c) salient information in a memory task.
In the context of positioning, (a) and (b) are the most appropriate interpretations. Adefinition close to (b) is given in [Allen et al., 1978]:
Definition 2.3 (Landmark) Landmarks are environmental features that when rec-ognized with a specific perceptual context, serve as reference points in large-scalespace.

22 BACKGROUND
Landmarks that more closely resemble interpretation (a), for example an oddlyshaped tree leaning towards one path at a crossroad, are often called waymarks orroutemarks, as they are directly related to a route. [Kray, 2003] proposed to distin-guish between landmarks and routemarks by taking their proximity and visibility inrelation to a position on a specific route into account.
In general, landmarks do not necessarily have to be visually perceptible, they canalso be auditive, e.g. the sound of a waterfall, or perceptible by any other sense. Theperception, identification and knowledge of the position of one landmark allows todraw conclusions in which area the current position is located. This area can furtherbe diminished by estimating the distance to the landmark. If a landmark is perceivedby a near-sense, it can be derived that it is fairly close. For far-sensed landmarks, adistance estimation is often possible because stimuli tend to degrade with increasingdistance, e.g. a faraway waterfall sounds softer than a nearer one. The distance tovisually perceived landmarks can be estimated by the perceived size or the perceivedlevel of detail. The famous proverb ‘Don’t shoot until you see the whites of theireyes’ is an example for a distance estimation using the perceived level of detail.If more landmarks and distance estimations are available, an even more accurateposition determination is possible through so-called trilateration. These methods forposition estimation will be discussed in detail in Section 2.5.1.
2.1.1.5 Non-Electronic Tools for Positioning
Humans began very early to develop various aids to enhance their capability of po-sitioning and navigation. Especially on open sea, the lack of earthbound landmarksforced seamen to search for different solutions. Celestial navigation, i.e. the useof stars as landmarks, was and is typically aided by mechanical tools like a kamal,sextant or octant, which help to more accurately determine direction, angles and dis-tance.
Early examples for artificial landmarks especially designed for maritime positioningwere fires, which were lit at the coastlines especially near ports to allow naviga-tion even at night. These fires eventually evolved into lighthouses, which have ahigher visibility and are protected against weather influences. However, these visu-ally enhanced landmarks have the disadvantage of being barely perceivable in foggyconditions. Foghorns were thus invented, to at least be able to warn ships of rocksor shoals, but these devices only give coarse information about the direction of thesignal.
The topophone (see Figure 2.2a), was a purely acoustical appliance, which shouldhelp to determine the direction to a sound-source, e.g. a foghorn. Through turningthe body, and thus turning two equidistant resonators attached to a shoulder rest, an

2.2 HUMAN AND ARTIFICIAL AGENTS 23
(a) The topophone was an acous-tic based tool for direction es-timation in maritime applications[Scientific American, 1880]
(b) Acoustic mirror near Kilnsea, UK (source:http://www.geograph.org.uk/photo/315865)
Figure 2.2: Acoustical based positioning tools.
increasing or decreasing level of sound could be perceived by the operator. When theoperator was facing the direction of the foghorn, the highest volume was perceived3
[Scientific American, 1880].
Between the first and second World War, so-called acoustic mirrors were used to de-tect and localize incoming military airplanes. An example of such a sound-mirror isshown in Figure 2.2b. These concrete monumental buildings should reflect and focusthe sound of airplane engines and soldiers standing in front of the mirrors should tryto estimate the incoming direction by moving in front of the mirrors [Scarth, 1999].
2.2 Human and Artificial Agents
The considerations about senses and perceptions can be transfered into the fieldof Artificial Intelligence through the use of the notion agent instead of life-form.[Poole et al., 1998, page 1] define the field of Computational Intelligence4 as ’thestudy of the design of intelligent agents’. [Russel and Norvig, 1995, page 31] definethe term agent in the following way:
3If the acoustical setup of tubes matches the wavelength of the sound signal, it can also happenthat the signals of both resonators cancel each other out
4Poole et. al. prefer to use the term Computational Intelligence over the term Artificial Intelli-gence, and argue that the latter is a source of confusion

24 BACKGROUND
!"#$%&
'#$()*(&
!+%,-%)*(&
.$/0*)$1#$%&
2#*+#34)$(&
!+4)$(&
'#$5#*6&
'#$5#*7&'#$5#*8&
'#$5#*9&
Figure 2.3: An agent has sensors to perceive parts of its environment and actuatorsto manipulate it.
Definition 2.4 (Agent) An agent is anything that can be viewed as perceiving itsenvironment through sensors and acting upon that environment through effectors (seeFigure 2.3).
According to that definition, the life-form from Section 2.1.1 can be seen as an agent,with sensors emulating receptors to gain knowledge about landmarks in its vicinityand effectors to change its own position. It is however important to keep in mindthat an agent does not necessarily have to have a robot-like appearance. It can alsobe a pure software-agent, that gets encoded bit-strings as perceptions and producesencoded bit-strings as actions. The idea of agents is becoming even more intriguing,if one considers a human agent carrying a mobile computational-device as a kind ofsymbiosis5 between the human agent and the artificial agent: Instead of the artificialagent using effectors to change its position, it uses effectors – e.g. its screen or audiooutput – to influence the ‘host’ (the human) to change the position (see Figure 2.4).
This symbiosis can even be seen as mutualistic, when assuming the device’s batterycharge as the artificial agent’s fitness criterion: providing useful location informationensures that the host will keep the device charged. Moreover, human agents canshare their perceptions with the artificial agent, which in turn can take these intoaccount to gain position information. Such a situation is depicted in Figure 2.4: thehuman agent provides its perception of a landmark via speech input. [Kray, 2003]described such a system, called SISTO, which can derive a coarse position throughdescriptions and tries to refine it by asking additional questions, e.g. showing pictures
5The term symbiosis is here used in the original sense of ‘the living together of unlike organisms’,which includes mutualistic, commensal and parasitic relationships.

2.2 HUMAN AND ARTIFICIAL AGENTS 25
!"#$%&&'#()#*+,$-&
!"#$%&
!"#$%&!)+,$-&
'()*$&+#$,-.,&
'()*$&!/%(*%-.,&
+#$0#.1&
+#$0#.2&
+#$0#.3&
+#$0#.4&
./01$&&
!)+,$-&
5-&)6&7#89&:&,##&%;#&<;(./;&-=&%;#&>#0##)#.&
Figure 2.4: A symbiosis between a human agent and an artificial agent: Insteadof using its effectors to directly change its environment, the artificial agent uses itseffectors as a means of communication with its host to reach the common goal.
of additional landmarks and asking if they are visible. Such a symbiosis of a humanagent and an artificial agent is the common scenario for personal positioning, i.e. thedetermination of one’s own position by electronic means. In Figure 2.4, the humanagent – or user – carries an agent running on a mobile device, such as a smart phone.
2.2.1 Sensors and Senders
Although the term sensor is used very vaguely in Definition 2.4, it is clear that asensor acts as an input for some kind of signals.
A technical definition for sensors can be found in the Federal Standard 1037c[National Communications System Technology & Standards Division, 1996]:

26 BACKGROUND
!"#$%&$'
()*"&%+",-."'!"#$%&$'
/0&1!"#$%&$'
2"0&1!"#$%&$'
3#*"&%+",-."'!"#$%&$'
4&%,&5%+",-."'!"#$%&$'
65$+"&%+",-."'!"#$%&$'
Figure 2.5: Classification of sensors.
Definition 2.5 (Sensor) A device that responds to a physical stimulus, such as ther-mal energy, electromagnetic energy, acoustic energy, pressure, magnetism, or mo-tion, by producing a signal, usually electrical.
According to this definition, the analogy of sensors to sensory receptors becomesobvious. Examples for sensors mimicking human receptors are cameras and micro-phones, replacing ears and eyes. Although it is possible to use these sensors to pickup natural signals from the environment, the signal processing necessary to deriveuseful information for positioning can be quite complex and demands high compu-tational power. Most practical attempts for positioning thus use specialized senders,acting as artificial landmarks that broadcast designed signals, which are easier tohandle by a machine and can contain data that is tailored to the task of positioning.
Moreover, sensors can be classified in analogy to the classification of senses in Sec-tion 2.1.1.1. The sensor classification, as shown in Figure 2.5, is from the perspectiveof an agent to which the sensors are attached. In that sense, exteroceptive sensors aresensors that pick up signals from external senders. The discrimination between far-sensors and near-sensors depends on the reach of a sensor, i.e. the maximum distancefrom a sensor to a sender. Examples for far-sensors are cameras and microphones,but also radio technologies like WiFi (see Section 3.1.3). A touchscreen is an exam-ple for a near-sensor. Technically, sensors can often reduce their range, which allowsthem to switch between being far-sensing and near-sensing.

2.3 CLASSIFICATION OF POSITIONING SYSTEMS 27
!"#$%%&'
()%*+#&",#-$'./)$+,/0-+'!"#$%&#'%(#&#)*%+'&*#,'$-%
1/#"&/2'!*+#&",3%)+'.',,#/&%0'$/1$&%21)#&*&%
4/)5/$-'!*+#&",3%)+'3)4'$%5'$/1$&%67$$#,&%
.678#'9)$%%&':);6&%)5-)#+'6#$*&%+11-#$%&8#-&%9#')%,'):#%:,'&&%;)1$*%
<-/;='9)$%%&':);6&%)5-)#+'<$&=-#%,'):#%47=,-=$:&%01$5)#*#>;#))151$5)#*#%?',,&%3$-#):)17$-%&*)75*7)#&%
1/#"&/2'9)$%%&':);6&%)5-)#+'0'@#&%3$-#):)17$->?'*#)%5'@#%&/&*#A&%
9)$%%&'
>-&?-,#'@1AA' B-7&/$-$'@1AA' <-/;62='B-7&/$-$''@1AA'
1%'@1AA'
Figure 2.6: Classification of outdoor and indoor situations with examples.
Interoceptive sensors are sensors that react to signals from ‘inside’ an agent. Pro-prioceptive sensors are sensors that report about the agent’s own spatial configura-tion, like orientation, acceleration. Many modern smart phones have proprioceptivesensors that replicate human proprioception, for example accelerometers that reportacceleration on different axes, and gyroscopes that report the spatial attitude. Vis-ceroceptive sensors report about internal processes or vital internal signals, e.g. theremaining battery-power or the current CPU load.
2.3 Classification of Positioning Systems
2.3.1 Indoor versus Outdoor Positioning
In literature, the terms outdoor and indoor positioning are often found. The need forthis distinction arises from the advent of Global Navigation Satellite Systems (GNSS,see also Section 3.1.1), such as GPS. Although these systems are designed to coverthe whole globe, a clear line of sight (LOS) to at least four satellites is needed inorder to determine a position. The availability of a sufficient number of satellitescan be achieved by a high density of satellites, but the prerequisite of a clear lineof sight can already be violated in a steep valley or canyon. In general, objects ordifferent transmission media, such as ionosphere and stratosphere, result in so-calledfading, i.e. attenuation, scattering, reflection and diffraction of the signals. This

28 BACKGROUND
Figure 2.7: Exocentric and egocentric positioning.
fading leads to inaccuracies or even a complete inability to determine a position.This is especially true inside of large buildings, where walls, floors and the roofcause massive degradations of the satellite signals. In general, GNSS does not workinside buildings. Nonetheless, having position information indoors is still desirable,e.g. in shopping malls, airport terminals, museums or large fairs. To overcomethese problems of GNSS, special positioning systems are developed, which are calledIndoor Positioning Systems (IPS).
Although the terms indoor and outdoor suggest a strict distinction between insideand outside of a building, the term indoor is often used more loosely in literature, de-scribing any system that can be used when GNSS fails, e.g. inside of tunnels, caves,underground or in urban environments where large buildings and structures inhibitsatellite signals. In analogy to natural canyons, the latter situation is often calledurban canyon. Figure 2.6 shows a classification of indoor and outdoor situations.Perfect GNSS positioning is only achievable with clear LOS. With increasing ob-structions, the GNSS signal quality decreases. In light indoor environments, GNSSpositioning can be possible with the use of high sensitivity GNSS receivers (see Sec-tion 3.1.1.2).
2.3.2 Egocentric and Exocentric Positioning
Through the clear distinction between sensors and senders, positioning techniquescan be roughly classified into two categories: exocentric positioning (or tracking)

2.3 CLASSIFICATION OF POSITIONING SYSTEMS 29
and egocentric positioning (or self-positioning). Figure 2.7 shows an abstraction ofboth categories.
2.3.2.1 Exocentric Positioning
In exocentric positioning, the mobile agent is equipped with some kind of sender (orsenders) that is broadcasting a specific identification signal. Sensors are installed inthe environment and send their readings to a centralized computing device (a server).The sensors do not necessarily have to be connected directly to the server but canalso form a sensor network. The centralized computing device collects all sensorreadings, which can already be preprocessed, and calculates the resulting position.
With the exocentric approach, the main data flow is from the agent to the environ-ment, meaning that the agent is constantly giving away information. In order to givethe agent access to his own positioning information some sort of back channel has tobe used. If a third party entity wants to spy on position information, it can gain accessto this information by intercepting this back channel or by attacking the server. Theexocentric approach is depicted in Figure 2.7 on the left side.
2.3.2.2 Egocentric Positioning
An egocentric positioning system uses the reversed approach: Senders are installedin the environment and the mobile agent is equipped with one or more sensors. Thesenders broadcast signals into the environment, which are collected by the mobileagent’s sensors. The agent can then calculate its own position. The main differenceto the exocentric approach is that the main data flow is from the environment to theagent, meaning that it is the environment, or parts of the environment, that is givinginformation to the agent. The positioning calculation is thus literally in the hands ofthe user.
In the case of egocentric localization a back channel, which is usually controlledby the agent, can be used to voluntarily give a third person access to the positioninformation. A malicious third party would have to attack the mobile agent directly.The egocentric approach is shown on the right side of Figure 2.7.
2.3.2.3 Hybrid Approaches
Besides the two basic cases, it is also possible to have both, senders and sensors, onthe same side, i.e. in the environment or at the agent. If such a combination of senderand sensor share parts of their circuitry, it is called a transceiver. If both parts are

30 BACKGROUND
Figure 2.8: Hybrid exocentric and egocentric positioning. Sender and sensor areboth installed either in the environment or at the agent.
completely separated, it is called a transmitter-receiver. When such a combinationis used, the senders usually broadcast a high entropy signal and the receivers pick upthe same signal or reflections of the signal. The received signal may have a lowerentropy and can thus contain data useful for identification or position determination.A simple example for such a sender/sensor combination is a light barrier, which canonly detect if something breaks the light ray.
A more elaborated example is a laser range scanner, which can also measure thedistance to the reflecting object. An example for changing the entropy of a signal isa camera with a flash light: the emitted white light is an evenly distributed mixtureof frequencies in the visible light range, and has thus a high entropy. Objects absorbsome of these frequencies and reflect others and thus reduce the entropy. The result,as most should know from experience, is a picture containing a massive amount ofdata.
If such a combination is installed in the environment, the system is classified asexocentric, as it is still the agent who will reveal information to the environment, byeither reflecting or absorbing the signal.
A system where the agent is equipped with the sender/sensor combination is egocen-tric, although a third party entity might try to use the broadcast signal to track theagent. However, such a third party tracking system will then again be exocentric.Both variants of hybrid methods are depicted in Figure 2.8.

2.3 CLASSIFICATION OF POSITIONING SYSTEMS 31
Figure 2.9: Onboard exocentric and offboard egocentric positioning. Sensory datais sent from the environment to the agent or from the agent to a computing device inthe environment.
2.3.2.4 Onboard and Offboard Calculation
With an exocentric system, it is also possible that sensors send their collected databack to the mobile agent, which then does the actual position determination. Al-though this would in a way protect privacy, the user would have to trust the systemto not further distribute the collected sensory data.
The same approach is possible with an egocentric system, i.e. the mobile agentcollects sensor data and forwards it to a centralized server, for example to reduce itsown computational load. In this case, the privacy could be protected through the useof an anonymized and encrypted protocol to the server, but this is again a matter oftrust on the user’s side.
With these considerations in mind, the terms onboard and offboard can be used tofurther classify positioning systems. Onboard systems calculate the position on theuser’s personal device, i.e. the agent determines its own position, while offboard sys-tems use a computation device outside of the user’s control. Exocentric onboard andegocentric offboard are visualized in Figure 2.9. In the case of egocentric offboard,two channels or a bidirectional channel have to be used to communicate sensor datato the computing device and to receive position data from the computing device.Exocentric offboard and egocentric onboard are the default cases of exocentric andegocentric as shown in the previous Figure 2.7.

32 BACKGROUND
Exocentric EgocentricOffboard Low Privacy Reduced PrivacyOnboard Reduced Privacy High Privacy
Table 2.1: Privacy levels for different configurations of positioning systems.
2.3.2.5 Discussion
As described above, the main difference between both positioning techniques liesin the direction of the main data flow. From agent to environment in the exocentriccase and from environment to agent in the egocentric case. Offboard exocentricpositioning is therefore the preferred approach for tracking people or objects, since inthat case neither the agent nor the object is interested in the position but a third personwants to find out about the whereabouts of somebody or something else. For thepurpose of personal navigation, which requires the knowledge of the own position,an exocentric system has to be extended with a back channel to either send back thederived position or to enable onboard calculation, which can increase the cost of sucha system.
Onboard egocentric positioning is the choice for self-localization (e.g. for naviga-tional purposes), since the agent itself is interested in its own position and passingthe positioning information on to third persons is often perceived as a violation ofprivacy. An offboard egocentric positioning system or an onboard egocentric sys-tem with a back channel can also be used for tracking purposes. As in the case ofan added back channel in exocentric positioning, this can lead to further costs buthas the advantage that users can either use the system for their private purposes (byswitching off the back channel) or to share their positioning information with otherusers or systems.
The different privacy levels depending on ego/exocentric and on/offboard are sum-marized in Table 2.1.
In general, onboard positioning systems have to deal with higher technical-resourcelimitations of mobile device in comparison to stationary devices, e.g. restricted com-putational power, restricted memory capacity and restricted power supply. Algo-rithms for onboard positioning thus have to be optimized according to those restric-tions. An onboard system can thus be easily converted into an offboard system, inthe simplest case by using the same computational hardware and installing it into theenvironment. In addition, sensor data has to be communicated to the now stationarydevice, if the system is egocentric.
On the other hand, converting an offboard system into an onboard system is usuallynot an easy task (unless one is willing to carry a bulky stationary device with heavy

2.3 CLASSIFICATION OF POSITIONING SYSTEMS 33
batteries). Depending on the used algorithms, even a high optimization may not besufficient to cope with the resource restrictions of mobile devices.
2.3.3 Instrumented Environments and Opportunistic PositioningSystems
As already indicated above, positioning is also possible using natural signals, i.e.without special senders. Examples for such natural signals are heat radiation of ahuman body, which can be picked up by infrared sensors, or the noise produced bythe engine of an airplane, which can be picked up by a microphone or by sound mir-rors (see Section 2.1.1.5). Systems that use these kinds of signals are called passivepositioning systems.
Most positioning systems however need additional infrastructure installed in the en-vironment. For example, the well-known GPS requires specialized satellites acting assenders in the orbit around the earth (see also Section 3.1.1.1). The infrastructure, orinstrumentation, for a such a system is thus specially designed to enable positioning.As already indicated in Section 2.1.1.5, humans very early began to build such in-strumentations in form of lighthouses, fog-horns and buoys. Early electronic systemsfor position determination in maritime and aviation applications were the Britsh GEEsystem and the American Loran (LOng RAnge Navigation) system, which were bothdeveloped during World War II ([Appleyard et al., 1988]). The GEE system was thefirst hyperbolic positioning system and was mainly used for aircrafts. The instrumen-tation consisted of stations that were installed on the ground and were organized inchains. Each chain had a master station that was responsible for the synchronizationof three slave stations, dubbed B, C and D. Pilots could determine their position bytuning in to these stations and using multilateration (see Section 2.5.1.4). Even todaysimilar systems are still in use for aviation purposes as Instrument Landing Systems(ILS). Besides the use of terrestrial radio signals, bright light-arrays are often used inaddition.
Besides these especially for positioning designed instrumentations, it is also possi-ble to use instrumentations that were originally set-up for a different purpose. Ingeneral, technical services or applications often need a special infrastructure, e.g.mobile phones need cell towers; wireless internet needs access points. If a position-ing system uses the already existing infrastructure of a different service, it is calledan opportunistic positioning system. WiFi-based positioning systems are an examplefor such opportunistic approaches (see also Section 2.5.3 and Section 3.1.3).
Positioning systems with designed instrumentation often achieve higher position ac-curacy, but also increase the cost of deploying and maintaining the system. Oppor-tunistic positioning systems on the other hand, help to keep the infrastructure-costs

34 BACKGROUND
low because no additional instrumentation has to be provided, but often have the dis-advantage of a lower position accuracy and need an initial training phase. However,this initial training phase can sometimes also be combined with other activities, likeit was done with Google Streetview6, where cars used to actually take geo-referencedpictures simultaneously collected geo-referenced WiFi data. This method of collect-ing geo-referenced WiFi data with a car is called war-driving, as opposed to war-walking, where the same is done by pedestrians.
2.4 Position Representation
In order to realize a positioning system, positions have to be represented by somemeans. A straightforward mathematical way is to use a Cartesian coordinate system.In Section 2.1.1 the definition for relative positions was given. As a matter of fact,any position is a relative position and a position given in a Cartesian coordinate sys-tem is a relative position with reference to the origin of the coordinate system. Such aposition is represented by a multidimensional vector, containing the distance on eachCartesian axis to the origin. However, if a certain coordinate system is defined andagreed upon, positions in reference to the origin of that coordinate system are oftencalled absolute positions (in respect to that coordinate system), and relative positionsare positions that are given in reference to such an absolute position.
Cartesian coordinate systems are easy to handle and sufficient to describe small areas,such as a building or campus. However, when larger areas have to be covered, suchas a country or even a whole planet, the fact that the Earth is not flat can no longerbe ignored.
2.4.1 World Geodetic System WGS84
There are several coordinate systems that deal with covering large areas or the wholeEarth. The World Geodetic System (WGS) in its iteration WGS84 is widespread, asit is the reference coordinate system of GPS (see also Section 3.1.1.1). WGS84 wasestablished, as the name implies, in 1984.
In order to represent a position on Earth, a geometrical model is needed that describesits shape. In WGS84, the Earth’s shape is approximated by a biaxial ellipsoid, with amajor radius of 6, 378, 137 meters (equator) and a minor radius of 6, 356, 752.314245meters (rotational axis) ([National Imagery and Mapping Agency, 2000]). The cen-ter of that ellipsoid lies at the Earth’s center of mass. In order to describe a position
6http://maps.google.com/streetview/

2.4 POSITION REPRESENTATION 35
!"#$%&'(
)$'$**+*(,-.(/&'%0(
)'12+(3+'141$5( 3+'141$5(67.(!$8%(
3+'141$5(,-.(9+8%(
)$'$**+*(:7.(;&#%0(
(a) Meridians and parallels on the ellipsoid
ϕ!"#$%&'(!
)(*+,!-,(*.*%/!!
!!
×!"00*12'*.!3,*45&!
(b) Determination of latitude and ellipsoidheight
Figure 2.10: WGS84 coordinates are expressed in latitude, longitude and altitude.
on the surface of the ellipsoid, it is organized into meridians, which run from northto south, and parallels, which run from east to west (see Figure 2.10a). One meridianis chosen as the prime meridian, and the equator of the ellipsoid is chosen as the ref-erence parallel. Coordinates are expressed with two angles: latitude and longitude,where the prime meridian is assigned to 0° longitude and the equator is assigned to0° latitude. An arbitrary meridian is identified by the angle between this meridianand the prime meridian, where angles go from 0° to 180° East and from 0° to 180°West. The longitude of a position on the ellipsoid is thus determined by finding themeridian that passes through that position.
The latitude of a position is determined by the angle φ between the plane that isdescribed by the equator and the line that is perpendicular to the ellipsoid and passesthrough the position (see Figure 2.10b). Similar to longitude, latitude angles aredivided into North and South and are thus expressed as values between 0° and 90°North or South.
A position that lies directly on the ellipsoid can thus be described by latitude andlongitude. In order to express the height of a position, an appropriate reference hasto be found. If the ellipsoid itself is used as a reference, the third coordinate is namedellipsoid height and denotes the distance from the ellipsoid surface to the positionalong a line perpendicular to the ellipsoid surface. Although latitude, longitude andellipsoid height (λ, φ,H) uniquely define a position with respect to the ellipsoid, theellipsoid height does not really correspond with the actual height of a position, i.e. toreach a position with the same ellipsoid height one may have to climb a hill.
A better measure of height can be derived by using a Geoid. The basic idea of aGeoid is best explained by imagining that all of the Earth’s oceans were connectedthrough canals and that influences like weather and sea currents were not present.The surface of the water would then describe the perfect Geoid of the Earth and

36 BACKGROUND
would directly depend on the Earth’s gravitational field and the centrifugal force ofits rotation. The surface of the Geoid is thus highly irregular, as the gravitationalfield is not regular. In practice, a Geoid is derived by measurements from a densenet of reference points and modeled through a spherical harmonics representation,which allows to approximate the gravitational potential at a particular position on theellipsoid. With the help of such a Geoid, the ellipsoid height can be transferred intoa Geoid height (sometimes also called orthometric height). Since an accurate Geoidmodel is rather complex and thus needs additional memory, GPS receivers usuallyreport the ellipsoid height, which can then be transformed by additional hardware.Currently WGS84 uses the 1996 Earth Gravitational Model (EGM96).
If a position expressed in geodetic coordinates latitude, longitude and ellipsoid heightis to be converted into a three-dimensional Cartesian system, the origin of the Carte-sian coordinate system has to be defined, along with the orientation of the axes inrelation to the Earth’s surface, and the used ellipsoid has to be taken into account.This set of information is called a geodetic datum or Terrestrial Reference System(TRS). In order to show geodetic coordinates on a map, the coordinates have to beprojected onto a two-dimensional Cartesian coordinate system. This is done througha map projection and the resulting coordinates are usually called eastings, for thex-coordinate, and northings, for the y-coordinate (cf. [Ordnance Survey, 2010]).
2.4.2 Semantic Representation
Coordinates are a mathematical expression of a position, but are usually meaninglessto humans unless indicated on a map. In day-to-day conversations, semantic descrip-tions are used to indicate a position, e.g. ‘I’m in the kitchen’ or ‘I’m currently inBabylon’. Of course such descriptions can be underspecified or can only be disam-biguated with further knowledge about the context or dialog discourse. For exampleif somebody has received a phone call on their landline telephone and utters ‘I’m inthe kitchen’ it can be derived from the context that the person is in the kitchen of hishome. If somebody mentions on a mobile phone that they have just landed at JFKand that they are now in Jamaica, it can be inferred from the discourse and worldknowledge that the person is most probably in Jamaica, in the borough of Queens inNew York City.
To represent such a semantic description of a position, a hierarchical spatial ontologycan be used, which describes the spatial relations between different locations. Theexample position above could be expressed as Earth→ North America→ USA→New York → New York City → Queens → Jamaica. In general, such an ontologycan be stored in a tree, where each node represents an area and the areas denoted bychild nodes are part of the areas denoted by their parent node.

2.4 POSITION REPRESENTATION 37
(a) Top nodes of UBISEARTH (b) Subnodes can be freely added, evendown to single drawers
Figure 2.11: UBISEARTH is a spatial ontology in UBISWORLD.
2.4.2.1 UBISWORLD
Such a spatial ontology is provided by UBISWORLD7, which was developed by[Heckmann, 2006]. UBISWORLD is a cloud service for ubiquitous user modelingthat follows the Web 3.0 paradigm, i.e. the combination of Web 2.0 ideas withmethodologies of the Semantic Web, as described by [Wahlster et al., 2006]. Thebasic idea of ubiquitous user modeling is to build and keep an up-to-date user pro-file, which is accessible anytime and anywhere and contains viable information thatcan be used for user adaptation. Of course such information is highly private and thusappropriate filtering and security mechanisms have to be taken into consideration.
The current position of a user or a history of positions is of course viable informationfor a user profile. UBISWORLD uses ontologies to build its knowledge base and theontology that is used to represent positions is called UBISEARTH. This ontologycontains over 28 million places all over the Earth. Figure 2.11a shows the first layersof the hierarchy of UBISEARTH: Earth, which is divided into Oceans and Continents.The hierarchy is then further divided into Countries, Regions, Cities, Buildings andRooms. Since the ontology is user editable, further subnodes can be defined, forexample cabinets and drawers of cabinets (see Figure 2.11b). Countries, Regionsetc. are roles, and Germany, Saarland etc. are instances of these roles.
7http://www.ubisworld.org/

38 BACKGROUND
Every instance in UBISWORLD has a unique identifier, called UbisPointers. In-stances can also have properties, which contain further information. In Figure 2.11b,the properties of the instance Saarbrucken can be seen. Among other informationlike zip-codes and dialing-codes, a WGS84 coordinate is given. With this informa-tion it is possible to convert a semantic description or a UbisPointer into geodeticcoordinates and vice versa.
As a cloud-service, UBISWORLD provides sophisticated interfaces, which allowto efficiently search, modify and refine the ontologies while keeping the datatraffic low. With these interfaces, it is possible for a mobile agent to down-load a specific part of the UBISEARTH ontology that is currently relevant to theuser (cf. [Heckmann et al., 2005a, Heckmann et al., 2005b, Schwartz et al., 2006,Loskyll et al., 2009]).
2.4.3 Positioning in a Moving Reference System
An interesting situation arises when a user is inside a larger, moving object, for exam-ple a train, a plain or a cruise ship. A cruise ship is basically a swimming multistory-building and passengers might be mainly interested in services that are related totheir position inside the ship, e.g on which deck they are, where the casino is locatedor how to find back to their cabin. However, in some circumstances, for example topinpoint the exact moment when one is crossing the equator for the first time, theymight be interested in their exact WGS84 coordinates.
In ships or airplanes, the current position of the vehicle is determined for navigationpurposes. Thus, a solution this situation is to use a static coordinate system for the in-terior of the vehicle itself, with a datum (see Section 2.4.1) that ideally coincides witha reference point for the vehicle’s own position determination, e.g. a GPS antenna.
Mobile agents can use this static coordinate system to determine their position withinthe vehicle. If a global position is needed, the mobile agent needs access to the ve-hicle’s position and can then determine its own global position. If a system likeUBISWORLD is used, the vehicle would constantly update its own position in thespatial ontology, and a passenger’s position would include the vehicle in the descrip-tion hierarchy, e.g. MS Ejemplo→ Deck 2→ Dining Room→ Table 2→ Seat 4.The properties of subtree of the vehicle, which contain the geodetic coordinates ofeach position, would then be automatically updated by UBISWORLD.

2.5 BASIC MATHEMATICAL PRINCIPLES OF POSITIONING 39
2.5 Basic Mathematical Principles of Positioning
With the considerations from Sections 2.3 and 2.4 in mind, the basic building blocksfor a positioning system can be derived. Regardless if a positioning system is ego-centric, exocentric, onboard or offboard, position determination is always done onthe basis of sensor data. Using the raw sensor output, a positioning system has toderive a position representation. In this section, standard mathematical position de-termination methods are introduced, which mostly rely on a position representationthrough numerical coordinates.
2.5.1 Trilateration and Multilateration
Trilateration is a method to determine the position of an object with the use of threedistance measurements to three known locations. In two-dimensional space, onesuch distance measurement d0 to a known location l0 leads to the conclusion thatthe searched position is somewhere on the circle around l0 with radius d0. Adding asecond distance measurement d1 to known location l1 reduces the possible positionsto two points, described by the intersection points of the two resulting circles. A thirdmeasurement finally disambiguates between the two positions and thus determinesthe correct position in the plane that is defined by the three known locations (seeFigure 2.12a).
Besides the location in the plane, also the height above the plane can be computed,which generally has two solutions representing mirror images with respect to the
(a) Trilateration with accurate measurements (b) Trilateration with inaccurate measurements
Figure 2.12: Trilateration with accurate and inaccurate measurements.

40 BACKGROUND
plane. The correct solution cannot be determined mathematically and must thereforebe solved by using additional information, e.g. testing if one solution would lead to aposition inside the earth ([Fang, 1986]) or by adding a fourth distance measurement.
In practice, measurements are noisy and thus introduce inaccuracies, which lead toan area instead of one point in which the searched position can lie. Figure 2.12bshows an example where the distance measurements d′0, d
′1 and d′2 are erroneous.
The resulting area of possible solutions is shaded and marked with a black line.
In general, trilateration can be expressed as the problem of finding the solu-tion to a system of quadratic equations, where each equation describes a spherearound a known location with the measured distance to that location as radius([Thomas and Ros, 2005]):
(x− x0)2 + (y − y0)2 + (z − z0)2 = d20 (2.1)(x− x1)2 + (y − y1)2 + (z − z1)2 = d21 (2.2)(x− x2)2 + (y − y2)2 + (z − z2)2 = d22 (2.3)
Here, x, y, z denote the coordinates of the searched position, xi, yi, zi, i = 1, 2, 3 arethe coordinates for the known locations li and di are the measured distances.
In [Murphy and Hereman, 1995], the authors tested different approximations for tri-lateration and found out, that a nonlinear least squares method gave the most accurateposition calculation. This method results in the exact position if the exact distancesare known and in a reasonably accurate position if only approximate distances areknown.
In order to obtain the needed distance measurements, several standard methods canbe found throughout the literature, which will be described in the following.
2.5.1.1 Signal Strength
As already indicated in Section 2.1.1, signals or stimuli tend to degrade with increas-ing traveling-distance. Sensors can often derive an indication for the received signalstrength, the so-called Received Signal Strength Indicator (RSSI). Technically thisproperty can be used to estimate the distance to a sending object, when a propagationmodel for the signal-type is available. Generally, signal loss follows the inverse-square law, which states that the strength of a signal is inversely proportional to thesquare of the distance it has traveled.
p ∼ 1
d2(2.4)

2.5 BASIC MATHEMATICAL PRINCIPLES OF POSITIONING 41
Using more elaborated path-loss models, the distance to the sender can be approxi-mated. RSSI based distance calculations are however highly influenced by variousenvironmental factors, like air humidity, temperature, refraction and reflection.
2.5.1.2 Time of Arrival (TOA)
Time of Arrival describes the determination of the distance between a sender and asensor by measuring the travel time t of the signal. When the travel velocity v isknown, the distance d can be easily calculated by
d = v ∗ t (2.5)
The travel time, sometimes also called Time of Flight (TOF), can be measured byincorporating a time-stamp into the signal, which indicates when the sender startedto transmit the signal. In this case, the clocks of all receivers and senders need to betightly synchronized with each other. Another way to accomplish TOA is to send asignal with embedded time-stamp and have the receiver immediately send the samesignal back (optionally with added delay information) and then measuring the socalled round-trip time of the signal, which results in twice the travel time (minus theadded delay).
TOA can be used for exo- and egocentric applications. In the case of exocentricpositioning, at least three sensors with known positions are needed, each one deter-mining the distance to the sender and sharing this information with each other or anadditional instance that then performs the trilateration.
For egocentric positioning, at least three senders need to be detectable by the sensorsof the self-locating entity. Moreover, the location of the senders has to be known,e.g. by sending this information along with the time-stamp or by a map stored on thelocating device.
Although simple in theory, the practical application of TOA has some drawbacks:the distance error depends highly on the accuracy of the time measurement. In thecase of radio signals, which are traveling at the speed of light, a measurement error of1µs results in about 300 meters distance error. Also, the velocity of a signal dependson the materials it travels through. A signal passing through different or unknownmaterials can therefore also have an effect on the accuracy of the distance calculation.
2.5.1.3 Pseudorange
In the context of satellite based positioning, the term pseudorange or pseudorangingis used to describe the above mentioned problem of inaccuracies in TOA measure-

42 BACKGROUND
!"#$%&'()#&*'+,-.,/0'12"3'4511'
55655655655565556555'''7''$%-'''2'''''$2''''''82''''''-2'
+,-.,/0'12"3'4511'
55655651655565556555'''7''$%-'''2'''''$2''''''82''''''-2'
+,-.,/0'12"3'4514'
55655655655565556555'''7''$%-'''2'''''$2''''''82''''''-2'
9.,/":'()#&*'+,-.,/0'12"3'4511'
55655655655565556555'''7''$%-'''2'''''$2''''''82''''''-2'
+,-.,/0'12"3'4511'
55655651655565556;1<'''7''$%-'''2'''''$2''''''82''''''-2'
+,-.,/0'12"3'4514'
55655615655565556555'''7''$%-'''2'''''$2''''''82''''''-2'
!!!"!#!$%&'()!*+$,-(&%./00'0!1!23!4%,%0$!
!!"!#!5%-0!*+$,-(&%./00'0!1!678887888!9+:'4%,%0$!
;5(&<0'(+=->'(!-,!>4%!!"*+$,-(&%./00'0!?!8!4%,%0!
!#!
!#!
!#!
Figure 2.13: Inaccuracies of a quartz timer in comparison to an atomic clock.
ments due to unsynchronized or loosely synchronized clocks. More specifically, thereceiver’s clock is usually based on a quartz oscillator, whereas the satellites useatomic clocks. In comparison to an atomic clock, a quartz oscillator is either a bit toofast or too slow, which results in a timer-offset between both clocks. For example, atypical quartz watch has an accuracy of about ±10 seconds per year:
10s
1a≈ 10s
365 ∗ 24 ∗ 60 ∗ 60s≈ 0.317µs/s (2.6)
This means that if an atomic clock and a quartz clock are perfectly synchronized attime t, then at time t + 1s the quartz based clock will be ≈ 0.317µs before or be-hind the atomic clock. As radio signals travel with the speed of light c, the resultingerror in the distance calculation according to Equation 2.5 is 0.317µs ∗ c ≈ 95m.The timer-offset will increase over time; after one hour, the error will be over300 kilometers and after one year 3 million kilometers (see Figure 2.13). Theterm pseudorange is used to describe an uncorrected distance measurement, i.e.pseudorange = (signal traveltime + timer offset) ∗ c. Since the satellites are tightlysynchronized among themselves, the offset between a receiver and any satelliteis constant at a given point in time. To correct the resulting distance error, thetimer-offset can be computed through a fourth TOA measurement, as described in[Teunissen and Kleusberg, 1996].
2.5.1.4 Time Difference of Arrival (TDOA)
In contrast to TOA, Time Difference of Arrival does not measure the absolute traveltime of signals from senders to receivers, but the time difference of either the arrivalof a signal on at least two different receivers with known locations (exocentric), or the

2.5 BASIC MATHEMATICAL PRINCIPLES OF POSITIONING 43
Figure 2.14: A single TDOA measurement results in a hyperbola with two knownlocations as focus points. Only one branch of the hyperbola has to be considered(marked with a solid line).
arrival of signals sent simultaneously from at least two senders with known locations(egocentric).
In the exocentric case, the needed time difference can be determined by a cross-relation process, which means that the receivers need synchronized clocks and away to exchange the measured signals. Determining one such time difference leadsto a hyperbola with the known locations of the receivers at its two focal points([Bucher and Misra, 2002]). Unless the sender has the exact same distance to thereceivers, the receiver nearest to the sender will detect the signal first. The positionof the sender is thus somewhere on the branch of the hyperbola that has the nearestreceiver as focal point. Figure 2.14 exemplifies such a hyperbola with two knownlocations l0 and l1. The relevant branch is drawn as solid line. Every point on thehyperbola results in the same TDOA measurement (2 ms in the example).
In two-dimensional space, a position can be fixed by intersecting at least two hy-perbola obtained from two TDOA measurements. To pinpoint a location in threedimensions, three TDOA measurements are required, resulting in three hyperboloids(instead of hyperbola) intersecting in one point. As it was the case with TOA, mea-surement errors lead to an area of possible locations instead of a single point. Po-sitioning with the help of TDOA is also often called multilateration or hyperbolicpositioning.
For egocentric positioning, pairs of senders must be synchronized to ensure that theirsignals are sent simultaneously. Furthermore, the receiver must be capable of identi-

44 BACKGROUND
!
!
!"! #$%&'()%*+,-.'/0+"#$!%&'()'%*$!+,!-#'.!/$-#+0!'.!-+!0&12!3+-#!'.+0+%%*$&1.!'(-+!4&'0!1(0!-#1(!,'(0!-#$'&!'(-$&.$)-'+(5!"#$!31.$!%&+3*$/!'.!#+2!-+! 0&12! -#$! '.+0+%%*$&15! 6$! )1(! 7.$! -#$! 0$,'('-'+(! +,!'.+0+%%*$&1!1.!/$(-'+($0!3$**+28!!
9)+.:9)+.: !" #$1 !! ! ! ! ! ! ! ! ! ! ! ! ! !!:;<9!!=-! ,'&.-! ,+&! %! 9>;1&))+.: 1#& ! 1&$! )+/%7-$0!
91&))+.: !" '$ 1 !.+!-#$! 9-1(:" !1(0! 9-1(:! 1&$!-#$!.*+%$.!+,!-#$!*'($.!,&+/!,+)'!:&$)$'?$&!%+.'-'+(.95!"#$!,'(1*!%')-7&$!'.!.'/'*1&!-+!@'47&$!;5!!
!!!@'45!A!B+(.-&7)-'+(!+,!'.+0+%%*$&1!3C!'(-$&.$)-'+(!+,!-2+!*'($.!!!
2"! +#$%&'()%*3)/,&4.%.(/5%*+,-.'/0+6&/*%$+)//$0(5%.(/57+"#'.!/$-#+0!'.!.'/'*1&!-+!4&1%#')1*!/$-#+0!37-!-#$!0&12'(4!+,!'.+0+%%*$&1.!1(0!,'(0'(4!+,!'(-$&)$%-'+(!%+'(-!'.!%&+?'0$0!(7/$&')1**C5!"#$!,A!D!E!1!,;!D!F!!=(0!,+&!)+/%7-'(4!'(!'(-$&?1*! %! 9>;1&))+.: 1#& !%&'()*+,"-)*+,%.//0!1&'$(2,%&/0!.*+%$!+,!*'($!,&+/!B!G!%+.'-'+(!1.'$(2,%./0!.*+%$!+,!*'($!,&+/!H!G!%+.'-'+(!!I+'(-.! +,! '.+0+%%*$&1! 1&$! +(! '(-$&.$)-'+(! +,! *'($.8!!"#$%&'()*+,%&'-&#*!.!!/#$&#+("#0!!JKL!!=,-$&! -#$! -&1(.,+&/1-'+(! '(-+! %+*1&! )++&0'(1-'+(! -#$!'.+0+%%*$&1.!#1?$!-#$!.#1%$!.#+2(!+(!@'47&$!K5!!
!@'45!K!M.+0+%%*$&1.!'(!%+*1&!)++&0'(1-'+(!1(0!-#$'&!'(-$&.$)-'+(!
N+!-#$!'(-$&.$)-'+(!/1C!3$!,+7(0!3C!-#$!0',,$&$()$.!+,!&10''!2#$&$!-#$C!1&$!$O71*5!"#'.!'0$1!)1(!3$!-&1(.,+&/$0!'(-+!+($!$O71-'+(!2#$&$!-#$!&10''!0',,$&$()$!'.8!!!
!"#$+
!2#$&$8!8!G!'.!*$,-!)+.'($!0',,$&$()$!:"9!!1(0!!!9!G!'.!&'4#-!)+.'($!0',,$&$()$!:39!"#$!:2+'.!.#+2(!'(!@'47&$!P!1(0!'-.!Q$&+!%+'(-!'(0')1-$.!-#$!'(-$&)$%-'+(!+,!'.+0+%%*$&1.!!!
!!@'45!P!"#$!&10'7.!0',,$&$()$!:2+1.!,7()-'+(!+,!1*%#1+!!"#$!,7()-'+(!:2!'.!$O71*!-+!<!,+&!4'&5&67.866!9(:!'!!;85&68<6*!=(0!,+&!-#'.!1(4*$!-#$!&10'7.!:!'.8!!:;+#!:;!<=58<&;>87>!1?!!!
9)+.:":< $ @!9.'(:":= $ !
MMM5! BRSBHTNMRS!M(! -#'.! %1%$&! 21.! %&$.$(-$0! ,+7&! /$-#+0.! ,+&! U',,$&$(-'1*!
U+%%*$&! "1&4$-! %+.'-'+(! ,'V! )+/%7-'(45! "#$&$! '.! (+! %7&$!1(1*C-')1*!.+*7-'+(5!"#$!'-$&1-'+(!/$-#+0!'.!?$&C!7('?$&.1*!1(0!7.13*$! ,+&! /1(C! 0',,$&$(-! U+%%*$&! U',,$&$()$! )+(,'47&1-'+(!37-! '-! '.! (+-! .7'-13*$! ,+&! 7(0$&.-1(0'(4! -+! )#1&1)-$&'.-')! 1(0!1/3'47'-C! +,! /$-#+05! "#'.! /$-#+0! '.! 1%%*')13*$! ,+&! W&&+&!$.-'/1-'+(! 1(0! )+?1&'1()$!/1-&'V! )+/%7-'(45!"#$! )+(?$&.'+(!-+!%+*C(+/'1*!/$-#+0!'.!7.13*$!+(*C!,+&!-#'.!)+(,'47&1-'+(!1(0!-#$!)+/%7-'(4!+,!%+*C(+/'1*!&++-.!($$0.!?$&C!#'4#!(7/$&')1*!&$.+*7-'+(5! "#$! 4&1%#')1*! /$-#+0! '.! 7('?$&.1*! .'/'*1&! -+!'-$&1-'+(! /$-#+0! 37-! '-! '.! ?$&C! 4++0! ,+&! ?'.71*'Q1-'+(! +,!0',,$&$(-! )+(,'47&1-'+(! .'-71-'+(! 1(0! -#$'&! '.+0+%%*$&1.5! "#$!%+*1&!)++&0'(1-'+(!/$-#+0!'.!7.13*$!+(*C!,+&!-#'.!/$-#+0!37-!'.!.'/%*$&! ,+&! )+/%7-'(4! -#$! -1&4$-! %+.'-'+(! -#1(! %+*C(+/'1*!/$-#+05!!!"#$!U',,$&$(-'1*!U+%%*$&!/$-#+0!)1(!3$!7.$!($'-#$&!,+&! -1&4$-! *+)1-'+(! -1&4$-! ?$*+)'-C! ?$)-+&! $.-'/1-'+(! (+&! ,+&!(1&&+2!,&$O7$()C!31(0!.#+&-!(1?'41-'+(5!JXL!
Proceedings of the International Conference on Circuits, Systems, Signals
286
Figure 2.15: An iso-Doppler contour results from the measurement of one FDOAmeasurement ([Vesely, 2010]).
fying the origin of each signal and the locations of the senders must be known. Withthis setup, the receiving unit can determine TDOA measurements between pairs ofsenders and calculate its own position with the same principles as described in theexocentric case.
The main advantage of TDOA over TOA is that only the deployed infrastructure hasto maintain synchronization, i.e. either the installed senders or the installed receivers(cf. [Appleyard et al., 1988], pp. 76–79). Due to this property, TDOA can alsobe used to locate unknown signal origins, for example cosmic gamma-ray bursts asdescribed in [Klebesadel et al., 1982].
2.5.1.5 Frequency Difference of Arrival (FDOA)
If senders and receivers are in relative motion to each other, Frequency Difference ofArrival can be applied. The relative movement causes a signal shift in the frequencydomain – the so-called Doppler shift – that can be observed on the receivers’ end.The FDOA is derived by subtracting the Doppler shifts of different sensors or signals([Musicki and Koch, 2008]). In order to determine a position, the relative velocityas well as the locations of the senders or receivers have to be known. One FDOAmeasurement results in a so-called iso-Doppler contour, as shown if Figure 2.15.Again, a position can be fixed by intersecting at least two iso-Doppler contours intwo dimensions or three contours for three dimensions.
2.5.2 Triangulation
In the context of positioning, triangulation is the process of calculating the coordi-nates of an object by measurement of angles and at least one distance in a triangle.

2.5 BASIC MATHEMATICAL PRINCIPLES OF POSITIONING 45
Figure 2.16: The principle of triangulation
The basic idea of triangulation is depicted in Figure 2.16. If A and B are knownpoints, then P can be calculated by measuring the angles α, β and by using the lawof sines ( a
sinα= b
sinβ= c
sin γ) and the fact that the three angles in a triangle sum up to
180 degrees. In two-dimensional space the calculation is as follows:
γ = 180− α− β (2.7)
a =c
sin γsinα (2.8)
b =c
sin γsin β (2.9)
2.5.2.1 Angle of Arrival (AOA)
To accomplish triangulation, the angles of arriving signals have to be determined.This can be accomplished by the use of a rotating antenna with a highly directedfield of view. By internally tracking the rotation angle of the antenna, the angle ofthe incoming signal can be determined by observing at which angle the highest signalstrength is reached.
Alternatively, a static antenna array can be used, consisting of several spatially ar-ranged antennae. These antennae can either be directed, with each antenna pointingto different directions, or undirected antennae are used.
In the first case, the TOA can be determined by observing which antenna receives thehighest signal strength. The angle can be fine-tuned by interpolating between all an-tennae that receive the signal and weighting according to the received signal strength.In the latter case, the spatial arrangement often dependents on the frequency or fre-quency range of the expected signals, such that phase-differences can be measured.The AOA can then be derived by measuring these differences between the individualantennae, which usually also correlates with the TDOA.

46 BACKGROUND
2.5.3 RSS Fingerprinting
Fingerprinting differs from the above approaches in that it is not purely geometricallybased. The main idea here is to use previously made relative signal strength (RSS)measurements as indicators for the current position. In general, a fingerprinting ap-proach is divided into two phases: a so-called training-, calibration-, or offline-phaseand an actual positioning- or online-phase.
In the egocentric case, the calibration is done by taking repeated measurements ata number n of reference points pn with known coordinates (xn, yn). These mea-surements include IDs of the received senders as well as the measured RSS of eachsender. The IDs and their averaged RSS are stored in a database, together with thecoordinates of the reference point. These are the so-called reference fingerprints andthe resulting database is a fingerprinting map. More formally, a reference finger-print rfi for a reference point pi is a vector of averaged RSS measurements for eachdetected sender rfi = [ri0, ri1 . . . rim−1], with 0 ≤ i ≤ n and m detected senders.In the exocentric case, a sender is placed at the reference points and the sensors inthe environment report the measured RSS of the sender to a centralized server, whichthen creates the fingerprint map, again consisting of the coordinates of each referencepoint, the averaged RSS and the IDs of the sensors that sensed the sender.
In the actual position phase, a fingerprint f = [cr0, . . . crm] is made at the currentlocation and the positioning algorithm tries to estimate which reference fingerprintrfi most closely resembles the currently measured one. A simple approach to dothis, is the Nearest Neighbor algorithm: The Euclidean distance Di from the currentfingerprint f to each reference fingerprint rfi is calculated with
Di =
√√√√m−1∑j=0
(crj − rij)2 (2.10)
The fingerprint with the smallest distance Di is assumed to indicate the correct po-sition and thus the reference point associated to that fingerprint is returned. Thismethod has the disadvantage that no intermediate coordinates, i.e. coordinates thatlie between reference points, can be returned. The k-Nearest Neighbor (kNN) al-gorithm overcomes this restriction by returning the mean of k reference points withthe lowest calculated distance ([Laoudias et al., 2011]). A further variation is thek-Weighted Nearest Neighbor algorithm, which calculates the weighted mean of kreference points, where the inversed Euclidean distance of each reference point canbe used as weight ([Chernoff and Nielsen, 2010]).

2.6 METHODS FOR SENSOR FUSION 47
2.6 Methods for Sensor Fusion
As indicated in Section 2.1.1.2, a combination of different senses is often used innatural positioning. The technical term for such a combination is Sensor Fusion. Forpositioning systems, sensor fusion is generally used to gain higher position accuracy,when data from different types of sensors are available at the same time. This is oneof the key-features needed in order to realize the Always Best Positioned paradigm(see Definition 1.3). Furthermore, an ABP system has to be able to work with anysubset of the used sensors, in particular if only data from one sensor is available.In the following, three methods for probabilistic position determination will be de-scribed. All of them are based on Bayesian inference.
In general, a positioning system, may it be egocentric or exocentric, can be regardedas a system that represents the position of an agent as a state vector st ∈ Rn, wheret ∈ N denotes a so-called time-slice and n ∈ N denotes the dimension of the statevector. The state can contain more information than just the agent’s position, i.e. itscurrent velocities. A concrete example is st = [x, y, z, x, y, z]T , where x, y, z denoteposition coordinates and x, y, z denote velocities; T indicates a translation. More-over, a state vector could also contain semantic descriptions instead of numericalcoordinates.
The task of a positioning system is to estimate the current (position) state given a se-ries of observations or measurements z1:t = {z1, z2, . . . zt}, where each measurementzi ∈ Rm describes a measurement vector with m dimensions at the ith time-slice.
The estimation of such a system will contain inaccuracies introduced through mea-surement errors, noisy sensors et cetera. These inaccuracies can be expressed throughprobabilities. In the following, the notation P (A) will be used to denote the proba-bility of an event A, e.g. P (AtWork) = 1.0 means that the probability of the event
Figure 2.17: An example for a probability distribution function.

48 BACKGROUND
AtWork is 100%. A probability density function (PDF) is a function that describesthe probability of a random variable, or of a vector of variables, at a given point.A PDF of a random variable r will be denoted as p(r). Figure 2.17 shows an ex-ample of a PDF. More specifically, it shows a Gaussian distribution N(µ, σ) withmean µ = 1.0 and standard deviation σ = 1.0. If this were the PDF p(st) of a one-dimensional state vector st, it would indicate that the probability of being at coordi-nate 1.0 is P (st = [1.0]) = N(1.0, µ, σ) ≈ 0.4. The probability of being at coordi-nate 0.0 would be P (st = [0.0]) = N(0.0, µ, σ) ≈ 0.24 and P (st = [8.0]) ≈ 910−12.In other words, with the help of a PDF, probabilities for all locations can be derived.The location with the highest probability can be considered as the current position.
One way to accomplish the task of estimating the current state given a series of mea-surements is to derive the PDF p(st | z1:t), i.e. the PDF of the current state under thecondition of observed measurements z1, z2; . . . zt. Generally, the measurement z0 isregarded as being an empty measurement as it is commonly used to derive an initialstate s0, i.e. p(s0 | z0) ≡ p(s0). The PDF p(st | z1:t) is called the posterior PDF,as it includes all observed measurements up to time t. From this PDF, the positionwith the highest probability can be derived and reported as the current position. Thismethod is used by Kalman filters and particle filters.
2.6.1 Kalman Filter
The Kalman filter was introduced in [Kalman, 1960] and belongs to the family ofBayesian estimators. It uses a prediction model, a measurement model and errormodels for the measurement noise as well as for the error of the prediction to calcu-late the current posterior PDF. The basic principle of the Kalman filter is depicted inFigure 2.18a: an initial state s0 will be derived from a first measurement z0. Afterthis initialization, the filter will enter a recursive loop consisting of a prediction phaseand an update or correction phase. In the prediction phase, the filter tries to estimatethe next state using the prediction model. In the update phase, a new measurementwill be used to correct the prediction from the previous phase. This corrected statewill then be used for the next prediction and so on (see Figure 2.18a).
The Kalman filter has some restrictions: the prediction model and the measurementmodels must be linear and all PDFs can only be expressed as Gaussian densities. Ifthese restrictions are met, the Kalman filter is an optimal estimator, i.e. it minimizesthe mean square error of the estimated parameters.
Because of the required linearity of the prediction and measurement models, bothmodels can be expressed through matrices. The prediction model tries to estimatethe next state of the system s−t+1, which is called the a-priori state as it does notyet contain a measurement for time t + 1. The a-posteriori state st+1 is computed

2.6 METHODS FOR SENSOR FUSION 49
!"#$%&'()*!+,-#* ./$,0#*12(""#&'()3*!+,-#*
4)%',5*6#,-7"#8#)0*
(a) Kalman Filter Loop
Figure 2.18: The Kalman filter loop: after an initial measurement, prediction phaseand update phase will be repeatedly executed.
in the update phase by taking a new measurement zt+1 into account. Because theKalman filter is recursive, the prediction of the next a-priory state is based on theprevious a-posteriori state. The prediction is calculated by using a state predictionmodel At ∈ Rn×n and a probability variable vt, which represents the inaccuraciesintroduced by A, the so-called process noise:
s−t+1 = Atst + vt (2.11)
vt is assumed to be white noise with a noise covariance Q and normal probabilitydistribution: p(vt) ∼ N(0, Q). In practical applications, the process noise is oftenguessed or fine-tuned after a running system is implemented. In other words, the nextstate follows from the previous one by a translation plus the inaccuracies introducedby the translation itself. These inaccuracies are reflected in the so-called prior PDFp(s−t+1 | z1:t−1). In a positioning system, At would include the speed and direction ofan agent at time t to compute the next state, i.e. the next position, by using Newtonianphysics.
From the calculated a-priori state, a prediction for the next measurement z′t+1 ∈ Rm
can be made:z′t+1 = Hts
−t+1 + nt (2.12)
Here, Ht ∈ Rm×n translates a state into a measurement and nt is a random variablerepresenting the measurement or sensor noise with noise covariance R. s−t+1 canbe seen as a hypothesis and z′t+1 describes which measurement is needed in orderto confirm the hypothesis. Again, the added noise has an effect on the resultingPDF p(z′t+1 | s−t+1). In general, a probability that an observation occurs under thecondition that a defined state is given, is called likelihood. This in contrast to aprobability that a state occurs under the condition of a specific observation, which iscalled belief.

50 BACKGROUND
(a) Initial Measure-ment
(b) Prediction (c) New Measure-ment
(d) Update (e) Prediction
Figure 2.19: Example of a Kalman filter for positioning.
In the update phase an actual measurement zt+1 ∈ Rm is taken. The discrepancybetween the actual measurement and the predicted measurement, i.e. zt+1 − z′t+1,is called the measurement innovation. The a-posteriori state is calculated as a linearcombination of the a-priori state and the measurement innovation:
st+1 = s−t+1 +Kt+1(zt+1 − z′t+1) (2.13)
Kt+1 ∈ Rn×m is called the Kalman gain and is computed from the prior andlikelihood PDFs. The Kalman gain also changes in every iteration of the filterand thus the weight between the a-priori state and the measurement innovation isshifted accordingly. With very noisy sensors and a good prediction model, theweight will be gradually shifted towards the a-priori state (cf. ([Maybeck, 1979,Welch and Bishop, 2006]).
The Kalman filter can be used to fuse the measurements of a position-giving system,i.e. a system that derives a position out of measurements (like a GPS receiver), withvelocity- and direction-giving sensors, e.g accelerometers, by using the latter to pre-dict the next position. Figure 2.19 exemplifies this approach: (a) a first GPS positionis measured and the sensor-noise model is used to construct an initial posterior PDF(black). (b) the Kalman recursion is entered and a prediction for the next positionis made. The resulting prior PDF (red) is flattened out in comparison to the initialposterior PDF (black) because of the process noise. (c) A new GPS measurement istaken. The PDF of the measurement (green) has the same shape as the initial pos-terior, since the same sensor-noise model is used. (d) The update phase provides anew position, which lies between the first measured position and the predicted po-sition according to the Kalman gain. The resulting posterior PDF (black) is slightlysharper than the prior and the measurement PDF. (d) The Kalman filter enters thenext iteration and generates a new prediction (red).

2.6 METHODS FOR SENSOR FUSION 51
The method used in the example is called a loosely coupled Kalman filter. Here, thederived position of a position-giving system is treated as measurement and the dis-tance between the predicted position and the measured next position is used as mea-surement innovation. A tightly coupled Kalman filter predicts the actual measure-ments of the position-giving system, e.g. TOA measurements and uses the differencebetween the predicted measurements and the next measurements as measurementinnovation.
As already mentioned above, the Kalman filter has some restrictions. The ExtendedKalman Filter (EKF) reduces some of these limitations by allowing non-linear mod-els through the use of local linearization. However, the state PDF is still limited tobe Gaussian.
In [Wolpert and Ghahramani, 2000] the model of a Kalman filter is used to explainhow humans are capable to compensate for sensorimotor delays and noise inherent insensory and motor signals. For example, a visual perception can easily be delayed by100 ms, from the moment stimuli hit the retina until the signal reaches the accordingregions of the brain. According to the authors’ theory, the brain uses a copy of amotor command, a so-called efference copy, and a model to predict the current statefrom the previous state, from which then the expected sensory feedback is predicted.The error between this prediction and the actual sensory feedback is then used tocorrect the estimate.
2.6.2 Particle Filter
As indicated above, the use of the Kalman filter is restricted to applications, where thesystem-state PDF can be described by a Gaussian density function. In practice how-ever, this is often not the case, e.g. when different sensors report different positions.Figure 2.20 shows a non-Gaussian pdf, indicating two different one-dimensional po-sitions. In general, the problem with non-Gaussian distributions is that they cannotbe expressed through a uniform description and thus providing a general algorithmproofs somewhat difficult.
Particle filters tackle this problem by using Independent and Identically Distributed(IID) random samples of the system-state PDF. In the following, the same notationas in Section 2.6.1 is used, i.e. st ∈ Rn represents a system state at time t, zt ∈ <mrepresents a measurement taken at time t. s0:t and z1:t represent the set of all systemstates and measurements until time t.
As it was the case with Kalman filters, a particle filter has a prediction model and ameasurement model. Since particle filters can also deal with non-linear state models,

52 BACKGROUND
!"
#$!%"
Figure 2.20: A non-Gaussian PDF and its approximation through weighted randomsamples (particles).
both models can be expressed through the use of functions:
st+1 = ft(st, vt) (2.14)
is the prediction model, with ft : Rn × Rnv → Rn and vt being a noise vector withdimension nv. With the help of Equation 2.14, the PDF p(st | st−1) can be computed.
zt+1 = ht(st, nt) (2.15)
is the measurement model, with ht : Rn × Rnn → Rm and taking a state description
st and a noise vector nt with dimension nn as input to predict a measurement.
A particle consists of a so-called support point si0:t, which represents a partition ofthe system state at time t, and an associated weight wit. A set of particles {si0:t, wit}
Np
i=1
is used to characterize the posterior probability function p(st | z1:t), where Np is thenumber of used particles. The weights are normalized, i.e. all available weights sumup to 1 and each weight wi is proportional to p(sit | z1:t). The posterior probabilitycan then be approximated as the weighted sum over the contributions of each supportpoint to the complete system state, which can be calculated using the Dirac deltameasure δ:
p(s0:t | z1:t) ≈Np∑i=1
witδ(s0:t − si0:t) (2.16)
A set of particles thus divides a state PDF into discrete partitions. In terms of posi-tioning, each particle si0:t, w
it is a hypothesis stating that the current position is at the
particle’s support point si0:t. The particle’s weight wi0:t is proportional to the prob-ability that this hypothesis is true. Through the use of the prediction model, the

2.6 METHODS FOR SENSOR FUSION 53
(a) Initial state (b) Prediction (c) New Measure-ment
(d) Update (e) (optional) Re-sampling
Figure 2.21: Example of a particle filter for positioning.
measurement model and a new measurement zt+1, the weight of each particle is up-dated proportionally to the probability that the next position will be at the particlessupport point. Particles that are far away from the newest measurement, i.e. hy-potheses that do not have a high support from the taken measurement, will thus havea lower weight than those that are closer.
There is however a problem: the state PDF is usually not directly accessible. In or-der to solve that problem, a so-called importance density q(·) is used, which has tobe proportional to the state PDF. In practical applications, the last posterior PDF isoften used as importance density. As it was the case with the Kalman filter, particlefilters are executed recursively, thus an initial posterior PDF has to be created. Fig-ure 2.21 shows an example in the positioning domain. The boxes represent a finitetwo-dimensional state space. In (a) an initial state is created by randomly distribut-ing particles, indicated as black dots, over the state space. Each particle has the sameweight and thus an evenly distributed PDF is represented. (b) Using the predictionmodel and the measurement model, predictions for each particle are created (markedin red). These ‘prediction particles’ are for illustration purposes only. (c) A new mea-surement is taken by two different sensors, which results in two possible positions(marked as green crosses). (d) The weights of each particle are adjusted according tohow well each particle fits the new measurement. The new weights are normalized,so that they sum up to 1 again. Note that the particles do not change their position,they still represent the probability that the current position is at each particles initialsupport point. Step (e) will be explained further below.
It becomes clear from this example, that the number of particles – and thus the parti-cle density – has a high impact on the accuracy of the position determination. More-over, a central problem of this approach is visible: after a small number iterations,a few particles will gain most of the weight, while the other particles’ weight willquickly become insignificant. This effect is called the degeneracy problem. Sincecomputations have to be performed for every particle, most of the computations willthen not really contribute to the position determination and thus the effectiveness

54 BACKGROUND
of the particle filter is impaired. A measure for the effectiveness of a particle filterNeff(t) at time t can be derived from the summed squares of all weights:
Neff(t) =1
Np∑i=1
(wit)2
(2.17)
The lower Neff(t), the less effective is the particle filter at time t. To overcomethe problem of degeneracy, resampling can be used when Neff(t) falls below a de-fined threshold. In the resampling step, Np new particles are drawn out of the cur-rent state PDF, which can be approximated by Equation 2.16. The basic idea isto keep the particles with high weight and to shift those with low weight closerto the high weight ones. This is sometimes also referred to as ‘survival of thefittest’. The weight of all particles in the new particle set is reset to 1/Np, i.e. theweight is equally distributed. The effect of such an additional resampling step is de-picted in Figure 2.21e: The particles form a cloud around the high probability areaof the state space. Resampling thus not only helps to keep the efficiency up, butalso increases the accuracy as the distances between the hypotheses are reduced (cf.[Arulampalam et al., 2002, Gordon et al., 1993, Gustafsson et al., 2002]).
Particle filters are often used because of their ability to cope with non-Gaussian statePDFs and non-linear prediction- and measurement-models. The main disadvantagesare the high computational complexity and the determination of a sufficient numberof particles. Both parameters interact with each other: the higher the number ofparticles, the higher the computational complexity.
2.6.3 Bayesian Networks
Since Bayesian Networks, and moreover, dynamic Bayesian Networks play an im-portant part in Chapter III, they will be described in more detail in the following. Asa matter of act, Kalman filters and particle filters are subsets of dynamic BayesianNetworks ([Diard et al., 2003]).
Bayesian Networks (BNs) and their extension – Dynamic Bayesian Networks (DBN)– are a computational framework for the representation and the inference of uncer-tain knowledge via probability theory. As a matter of act, Kalman filters and particlefilters are subsets or special applications of dynamic Bayesian Networks. The term‘Bayesian Networks’ and their basic concept was introduced by [Pearl, 1985]. Inthe aforementioned article, Pearl argues that the straightforward way of implement-ing probability-based reasoning by using a joint probability distribution quickly runsinto complexity problems. The main reasons for this being the exponential memoryrequirements to store the joint probability table for n propositions x1 . . . xn, and the

2.6 METHODS FOR SENSOR FUSION 55
Figure 2.22: An example for a Bayesian Network showing the directed acyclic graphand the conditional probability tables.
exponential runtime to calculate the marginal (i.e. unconditional) probability for anyproposition xi (1 ≤ i ≤ n), which would be needed twice to compute conditionalprobabilities such as P (xi | xj). Furthermore, Pearl elaborates that humans are ingeneral very good at judging the dependence or independence between propositions,while being reluctant when asked about numerical estimates for conditional proba-bilities of propositions. Therefore, his proposed approach consists of a qualitativepart, which describes the dependency between propositions, and a quantitative part,which describes the (estimated) numerical probabilities.
To model the qualitative part, directed acyclic graphs (DAGs) are used, where thenodes represent random variables and the directed edges represent direct dependen-cies between these variables. An example of such a DAG is shown Figure 2.22. Theshown graph models the situation, where an agent tries to reach a certain destination,which it can identify by two routemarks. As explained in Section 2.1.1.4, routemarksdiffer from landmarks in that they are closer to a particular point on a route. The topnode, labeled ‘Destination’ represents the probability whether the agent has reachedits destination or not. The node thus contains two states: ‘true’ and ‘false’. Thebottom left node, labeled ‘Temple’ represents if the agent has visually perceived thetemple, which marks his destination. It contains two states ‘true’ and ‘false’. The lastnode, ‘Waterfall’, represents the event of acoustically perceiving a waterfall, whichis also close to the destination but visually hidden in a dense forest. Like the othertwo nodes, it contains the states ‘true’ and ‘false’.
Whether or not the agent sees the temple, directly depends on whether or not it hasreached its destination, thus a directed edge leads from the node ‘Destination’ to thenode ‘Temple’ (the direction is indicated by the arrow in the graph). The same istrue for the event of hearing the waterfall. Thus ‘Waterfall’ also directly depends on

56 BACKGROUND
‘Destination’ and also has an edge starting from ‘Destination’.
More formally, a directed graph G is defined by set of nodes, or vertices, V and a setof directed edges E (G = (V,E)). An edge can be represented by an ordered pair(v, w) ∈ E, with v, w ∈ V . A graph is acyclic if no path exists that starts and endsat the same node. A node vp that directly influences another node vc, i.e. there is anedge (vp, vc) ∈ E, is called parent of vc.
In order to describe the quantitative part of the network, each node contains a con-ditional probability table (CPT), which describes the effects of the parent nodes onthis node. The number of entries in each CPT is determined by the number of par-ent nodes and the number of states of the parent nodes and the node itself. In thecase of the example network, the node ‘Destination’ does not have any parent nodes.Its CPT therefore only contains two entries, describing the probabilities whether theagent has reached its destination or not. Because of the lack of parent nodes, theseprobabilities are unconditional, i.e. they are a-priori probabilities. In this example,a very low a-priori probability of P (Destination = true) = 0.8% is assumed forthe event that the agent is at its destination. Terms like P (Destination = true)or P (Destination = false) are often shortened to more readable notations likeP (D) and P (D). Since a CPT represents the exhaustive set of cases for a node, itfollows that the a-priory probability that the agent has not reached its destination isP (D = 1− P (D) = 99.2%).
The CPT of the node ‘Temple’ contains four entries, since it is directly influencedby the node ‘Destination’. Thus, its entries describe the probabilities of seeing thetemple under the condition that the agent did or did not reach its destination. Usingthe abbreviations T for Temple = true and T for the Temple = false, the CPTcontains values for P (T | D), P (T | D), P (T | D) and P (T | D). The reliabilityof tests or sensors is often expressed in terms of sensitivity and specificity, e.g. thepercentage of cases where the sensor correctly classifies the temple as temple andthe percentage of cases where the sensor correctly classifies other objects as notbeing the temple. These values can be retrieved through evaluations under laboratoryconditions. For this example a sensitivity and specificity of 99% in each case isassumed, i.e. a highly reliable sensor. The sensitivity equates to P (T | D) and thespecificity equates to P (T | D). The values for P (T | D) (false positives) andP (T | D) (false negatives) can be calculated by 1 − P (T | D) and 1 − P (T | D),respectively.
The CPT of the ‘Waterfall’ node represents the probabilities of hearing or not hearingthe waterfall under the condition that the agent has reached its destination or not.For the sake of an example, it is assumed here, that the auditive sensor is highlyunreliable, and more than that, the possible perception of the waterfall highly dependson environmental factors, like the amount of water the river carries, which can make

2.6 METHODS FOR SENSOR FUSION 57
the sound of the waterfall louder or softer, and the current wind speed, which candrown out the sound. In such cases, the probabilities are often estimated, whichalso allows to incorporate influences that are not explicitly modeled in the DAG byadjusting the probabilities accordingly. In this example, a 10% chance is assumedthat the agent’s audio-sensor mistakingly reports a waterfall although the agent is notat its destination (P (W | D) = 10%). By analyzing the current and past weathercondition, the agent may adapt this value accordingly. Again, the value of P (W | D)can be computed by 1− P (W | D). For this example, the probability of hearing thewaterfall when being at the destination, P (W | D), is estimated to be a low 40%,and thus the probability of missing the sound of the waterfall is P (W | D) = 60%.
According to [Russel and Norvig, 1995], Bayesian Networks can be summarized as‘a graph in which the following holds:
1. A set of random variables makes up the nodes of the network
2. A set of directed links or arrows connects pairs of nodes. The intuitive meaningof an arrow from node X to node Y is that X has a direct influence on Y .
3. Each node has a conditional probability table that quantifies the effects that theparents have on the node. The parents of a node are all those nodes that havearrows pointing to it.
4. The graph has no directed cycles (hence is a directed, acyclic graph, or DAG).’
Inference in Bayesian Networks
Having such a graph and the associated CPTs, queries can be answered. For examplethe question ‘How high is the probability that the agent sees the temple when beingat its destination?’ can be translated into P (T | D) and the answer (99%) can bedirectly retrieved from the CPT of the ‘Temple‘ node. In this example query, thevalue of the node ‘Destination’ was observed, i.e. its state was known. In general,such a node, whose value can be observed, is called evidence node. Nodes whosevalues are unknown are called hidden or latent nodes [Ben-Gal, 2008].
The question ‘How high is the probability that the agent will hear the waterfall, notknowing if the agent is at its destination or not?’ translates into the marginal proba-bility P (W ), which is not directly accessible through the CPTs. However, the querycan be answered by summing up the joint probabilities over all outcomes of the in-fluencing node ‘Destination’. This method is also called marginalization:
P (W ) = P (W | D)P (D) + P (W | D)P (D) = 10.24%

58 BACKGROUND
Note that all probabilities needed to perform that calculation can again be retrievedfrom the CPTs of the network.
A more interesting question would be ‘If the agent sees the temple, how high is theprobability that it is at its destination?’, which translates into P (D | T ). In contrastto the first example query, in which the evidence node was a parent to the queriednode, the evidence node is now a child to the queried node. This type of inference iscalled bottom-up reasoning and can be performed by using Bayes rule, which is alsothe reason for the term ‘Bayesian Network’. The general form of Bayes rule is:
P (A | B) =P (B | A)P (A)
P (B)(2.18)
Applied to the query above, this leads to
P (D | T ) =P (T | D)P (D)
P (T )
Since P (T ) is not directly accessible from the CPTs, it has to be computed viamarginalization, leading to
P (D | T ) =P (T | D)P (D)
P (T | D)P (D) + P (T | D)P (D)= 44.39% (2.19)
The outcome is surprising given the high accuracy that is suggested by the assumed99% sensitivity and specificity of the test. This is however the effect of the low a-priory probability of P (D) = 0.8% (when assuming that the a-priory probability ofbeing at the destination is 20%, the probability P (D | T ) rises to 96.12%).
If the node ‘Waterfall’ is also observed, P (D | T ∧W ) = 76.15% or P (D | T ∧W ) = 34.74% can be computed (here the original probability of P (D) = 0.8% wasused), again by applying Bayes rule and marginalization. Especially the bottom-upreasoning makes Bayesian Networks a very powerful tool.
Of course the outcome of a Bayesian Network can only be as good or exact asits modeling, including the quality of the CPT entries. As stated above, missingor unknown influences in the graph can be compensated for in the CPT entries.Nonetheless, such a network can only represent the view or the belief of its architect.Thus, Bayesian Networks are also called Belief networks and computed evidencesare called beliefs, e.g. the computed probability of P (D | T ∧W ) is called the be-lief that the agent is at its destination under the observation of seeing the temple andhearing the waterfall. Other terms for Bayesian Networks are Influence network andCausal network.
To summarize, Bayesian Networks approach the problem of storing a complete jointprobability table by decomposing it into CPTs, e.g. a complete joint probability ta-ble for 30 two-valued variables would need 230 > 1 billion table entries, whereas

2.6 METHODS FOR SENSOR FUSION 59
Figure 2.23: An example for a dynamic Bayesian Network including two time-slicesand an inter-time-slice CPT.
a Bayesian Network consisting of 30 nodes, where each node has at most 5 par-ents only needs at most 30 × 25 = 960 CPT entries ([Russell and Norvig, 2003]).However, in general the exact inference in a Bayesian Network is still an NP-hardproblem ([Cooper, 1990]), but efficient algorithms exist for certain network topolo-gies, e.g. networks that only have at most one undirected path between any twonodes, so-called polytrees or singly-connected networks. [Pearl, 1986] describessuch an algorithm, which is based on message passing, a technique that was also usedby [Lauritzen and Spiegelhalter, 1988]. For large, multiply-connected networks, ap-proximate inference can be used, e.g. Monte Carlo sampling ([Pearl, 1987]), logicsampling ([Henrion, 1986]) or importance sampling ([Fung and Chang, 1989]).
2.6.3.1 Dynamic Bayesian Networks
Dynamic Bayesian Networks (DBNs) are an extension of Bayesian Networks. Witha DBN, it is possible to model dynamic processes: Each time the DBN receivesnew evidence a new time slice is added to the existing DBN. Figure 2.23 shows anexample DBN with two time-slices and a single edge leading from time-slice t totime-slice t + 1. In this example, the CPT of this inter-time-slice edge models theprobabilities for a change of states in the node ‘Destination’ from one time-slice toanother. Dt andDt denote the states of being at the destination in time-slice t and notbeing at the destination in time-slice t. Likewise, Dt+1 and Dt+1 denote the statesof being or not being at the destination in time-slice t + 1. P (Dt+1 | Dt) thus is theprobability that the agent will still be at the destination in the next time-slice underthe condition that it is already at the destination in the current time-slice.

60 BACKGROUND
In the example, this probability is set to 70%. The probability that the agent will notbe at the destination anymore in the next time-slice P (Dt+1 | Dt) is thus 30%. Theprobability that the agent will reach the destination in the next time-slice althoughit is not there at the current time-slice is set very low: P (Dt+1 | Dt) = 0.1%. Theprobability that it will still not reach the destination in the next time-slice is thusset to 99.9%. The CPT can be seen as an equivalent to the prediction model ormotion-model in the Kalman filter and particle filter as it predicts the future stateof the ‘Destination’ node based upon the current state. And as in the Kalman andparticle filter, this prediction will be updated or corrected by new measurements, i.e.by setting new evidences in the nodes ‘Temple’ and ‘Waterfall’.
DBNs can have an arbitrary number of inter-time-slice edges and these edges arenot restricted to lead from one time-slice to the immediately following one. In prin-ciple, DBNs can be evaluated with the same inference procedures as normal BNs,but their dynamic nature places heavy demands on computation time and mem-ory. This complexity can be greatly reduced, by applying roll-up procedures thatcut off old time slices without eliminating their influence on the newer time slices.[Brandherm, 2006] describes sophisticated algorithms to apply these roll-ups andintroduces a tool that automatically generates Java code for graphically modeledDBNs. In Chapter III a new positioning method based on DBNs is elaborated, whichcombines the principles of particle filtering with the power of DBNs.

3 RELATED WORK
3.1 Positioning with a Single Sensor Technology
3.1.1 Global Navigation Satellite Systems (GNSS)
The most prominent example for an outdoor positioning-system is the Global Po-sitioning System (GPS), which is based on satellites orbiting the earth. In general,positioning systems based on satellites and pseudolites are called Global NavigationSatellite System (GNSS). The satellites of a GNSS usually act as senders, at leastbroadcasting a time-stamp that encodes the exact point in time when the broadcastbegan. A receiver on earth can then calculate its own position through TOA andtrilateration, as described in Section 2.5.1. In theory, three satellites with known po-sitions are enough to determine the receiver’s position on the surface of the earth.However, as indicated in Section 2.5.1.3, the inaccuracies of the quartz timer on thereceiver’s end only leads to pseudoranges. These inaccuracies can be resolved by us-ing a fourth satellite. In general, more satellites lead to a more accurate positioning.Because the data-flow in a GNSS is from the satellites to the receiver, GNSSs areegocentric positioning systems.
3.1.1.1 NAVSTAR GPS
As already indicated, GPS is the most well known GNSS system, with various appli-cations in military as well as civil domains. The full name of the system is NavigationSystem with Timing and Ranging – Global Positioning System, or NAVSTAR GPS.It was deployed by the US Department of Defense, and reached its initial operationcapability in 1993. Full operation capability was declared in 1995 ([Roth, 2005], p.284).
61

62 RELATED WORK
GPS satellites operate on two frequencies called L1 and L2, with L1 = 1575.42MHz and L2 = 1227.6 MHz. The L2 frequency is reserved for the so-called Pre-cise Positioning Service (PPS), which is encrypted and can only be used by militaryapplications. The L1 frequency is available for PPS as well as the Standard Position-ing Service (SPS), which can also be used by consumers. Until 2000, the consumerSPS signals were artificially degraded trough a method called Selective Availability(SA) to ensure that only the US and NATO military could use high accuracy posi-tioning. Since May 2000, SPS and PPS deliver the same basic accuracy, but since thePPS signals are sent on L1 and L2 frequencies, military applications can perform anionospheric correction, which results in a higher accuracy.
Each satellite sends its own, unique Pseudo Random Noise (PRN) code, onto whichadditional data is modulated. A GPS receiver can simulate the PRN code of eachsatellite and thus knows how the signal looks like at the time the satellite sent it. Theactually received PRN code is thus delayed against the simulated signal and the TOF(see Section 2.5.1.2) can be derived by shifting the simulated signal until it correlateswith the received one. The accuracy of the TOF determination depends on how fastthe bits of the PRN code are transmitted. In the case of SPS, a time resolution of 0.01µs is possible, which leads to an accuracy of 3 meters for one distance measurement.
The bandwidth of the modulated information is only 50 bits per second and the pay-load is divided into three parts: clock-correction data, which contains the currentnumber of the week and time; the ephemeris, which contains the orbit and healthstatus of the satellite; and the almanac, which contains the coarse orbit and healthstatus of other satellites. A GPS receiver typically has to build an internal databasefrom the received data before it can provide a first position. The time that passesuntil the first position can be delivered is called Time To First Fix (TTFF). The TTFFdepends on how much the satellite constellation has changed since the receiver waslast turned on. In extreme cases, e.g. when the receiver has been brought to a differ-ent continent while being switched off, the complete database has to be rebuilt. Thisso-called cold-start takes 12.5 minutes when a clear view to one of the satellites isgiven. A warm-start is possible, when large parts of the database are still up-to-date,e.g. if the receiver has changed its position less than 300 kilometers since the last fix.A warm-start can be as fast as 45 seconds. A hot-start only takes 15 to 20 secondsand is possible when the database is up-to-date ([NavCen, 1996]).
Assisted GPS (AGPS)
A long TTFF is prohibitive for most mobile location-based services. To overcomethis problem, assisted GPS downloads almanac data via a cell phone network orWiFi access from an assistance server. This server can also provide precise timeand information about local ionospheric conditions, which can be used to derive a

3.1 POSITIONING WITH A SINGLE SENSOR TECHNOLOGY 63
higher position accuracy. Furthermore, complex calculations can be offloaded fromthe receiver to the server, which allows to reduce the computational power of anAGPS device. In the case of AGPS via cell phone network, the cell phone providercan roughly estimate the current position of the device by the cell in which it islogged in, which also helps to reduce the search area for satellite signals. An AGPSsystem can bring the TTFF down to about one second.
In [Waters et al., 2011], a method is proposed in which several devices equipped withGPS and WiFi (see also Section 3.1.3) can assist each other similarly to AGPS. Theidea here is that GPS devices that have already determined the correct GPS system-time, can act as access points according to the upcoming IEEE 802.11v WiFi stan-dard, and insert the correct system-time in their data-packages. As the providedsystem-time has to be as accurate as possible, the timing of the transmission itselfis highly critical. The authors propose, that integrated chipsets, which contain WiFiand GPS capabilities should be used, to minimize the transmission time.
Differential GPS (DGPS)
Differential GPS is a method to further increase the position accuracy through staticreference stations with precisely known positions. These reference stations deter-mine their own GPS position and use the difference to their exact position to calcu-late correction data. This correction data is usually broadcast via terrestrial radio anda DGPS enabled device can use the delivered data to correct its own position. Theachieved accuracy depends on the distance from the receiver to the reference stationand in order to be able to use the correction data, the DGPS receiver must use thesame satellites as the reference station. According to [NavCen, 2001], the accuracyat the reference station is below 1 meter and degrades about 1 meter for each 150kilometer of increased distance between receiver and reference station.
Wide Area Augmentation System (WAAS)
A Wide Area Augmentation System is based on the same methods as DGPS, butuses satellites instead of terrestrial radio to broadcast the correction data. Usually, aWAAS has a master control station, which collects the data of several reference sta-tions. The calculated correction data is then sent to a geostationary satellite, whichbroadcasts the data on the L1 frequency using its own PRN identification. The ad-vantage of WAAS over DGPS is, that no additional antenna has to be used to receivethe correction data.

64 RELATED WORK
Standard GPS 2.0 - 8.76 mDifferential GPS 1 - 5 mWide Area Augmentation System 1 - 3 mRTK GPS ≈ 1 cm
Table 3.1: Accuracies of standard GPS, AGPS, DGPS, WAAS and RTK GPS.
Realtime Kinematic GPS (RTK GPS)
As mentioned earlier, the accuracy of the distance measurements from the receiverto each satellite is restricted through the bit-rate with which the PRN codes are trans-mitted. A way to further improve the positioning accuracy is to use the carrier-signalitself, which has a higher bit-rate, instead of the PRN code to measure the TOFand thus the distance to each satellite. However, since the carrier-signal is missingdirect information that is needed to align the measured delayed signal with a simu-lated one, a statistical approach is needed to find this alignment. First approaches tothis problem needed hours of carrier-signal measurements from one static position,which were then post-processed offline on a desktop computer. This method wascalled Static Surveying. Rapid Static Surveying was an improvement of this methodand only needed a few minutes of measurements, but still had to be post-processed.Kinematic Surveying relied on Rapid Static Surveying but allowed the receiver to bemoved after an initialization phase as long as it kept using the same satellites. Withincreasing computing power, it was eventually possible to perform the needed calcu-lations on site and in realtime, thus the name Realtime Kinematic GPS (RTK GPS)([van Diggelen, 1997]).
RTK is a refinement of DGPS, in that it also needs a precisely positioned referencestation, but has higher restrictions. The reference station must be in a range of max.50 kilometers of the moving receiver and at least 5 satellites must be available. Witha clear LOS to at least 6 satellites, an accuracy of 1 centimeter can be reached.
Table 3.1 shows a comparison of the accuracies achieved by the different GPS basedsystems.
3.1.1.2 GPS Indoors
Like all known GNSS systems, GPS generally does not work inside buildings. Thisis mainly due to high attenuation of the satellite signals caused by exterior and inte-rior walls. Although highly sensitive GPS receivers can sometimes pick up enoughsatellite signals next to windows or thin walls to be able attempt a position, the re-ceived signals are often distorted by reflection and diffraction. This distortion cancause a direct signal to be weaker than indirect ones and thus decreases the accuracy.

3.1 POSITIONING WITH A SINGLE SENSOR TECHNOLOGY 65
Ghinamo et al. In [Ghinamo and Gangyi, 2011], the authors tested GPS position-ing in a light indoor-environment (see Section 2.3.1) and propose to use a particle fil-ter approach, based on an empirical error distribution. They compared their approachwith a weighted least squares method, and found out that the particle filter improvesthe accuracy in those conditions, where the error distribution is non-Gaussian. Ac-cording to their experiment, conducted with a Sirf Star III high sensitivity receiver,they could achieve a position accuracy between 0.35 and 1.04 meters. The exactevaluation process, i.e. if only one position was measured or a moving receiver, wasnot disclosed.
3.1.1.3 GLONASS
GLONASS (Globalnaya Navigatsionnaya Sputnikovaya Sistema) is a RussianGNSS, which was completed in 1995. With the Russian financial crisis in 1998, thesystem could not be kept fully operational and in 2000 only 10 of the originally 24satellites were still active. At the end of 2003, the restoration of GLONASS began,and since November 2011, the system is fully operational again.
As it is the case with GPS, GLONASS provides two different positioning accuracies:Standard Precision (SP) and High Precision (HP). In contrast to GPS, all satellitesuse the same PRN, but send on different frequencies. The center frequencies areL1 and L2, but different channels are used by adding offsets to them, i.e. L1ch =L1 + ch ∗ 562.5 kHz and L2ch = L2 + ch ∗ 437.5 kHz, were ch = −07..06 denotes achannel number. With 4.46 to 7.38 meters, the accuracy of an unassisted GLONASSreceiver is in general slightly less than that of unassisted GPS.
3.1.1.4 Galileo
Galileo is a planned European GNSS, which is inter-operable with GPS andGLONASS. In contrast to the other two systems, Galileo will be completely un-der civilian control. Furthermore, the satellites will be placed in orbits at a greaterinclination to the equatorial plane, which should increase the coverage in northernEurope and other areas with high latitude. The first Galileo test satellite, GIOVE-A,was launched in 2005, followed by GIOVE-B in 2008. With the launch of the firsttwo of four navigation satellites in 2011, Galileo reached the third phase. At theend of the fourth phase, which is planned for 2014, 18 satellites will be in orbit andfirst services will be available. The system will be fully deployed in 2020, with 30satellites in three circular medium earth orbit planes.
Galileo shares the L1 frequency with GPS, but uses a different modulation scheme.Additionally, the L5 frequency at 1176.45 MHz is used instead of L2. According

66 RELATED WORK
to the official Galileo webportal1, Galileo will provide several different services: theOpen Service (OS), which is free of charge and provides ‘position and timing per-formance competitive with other GNSS systems’; the Safety-of-Life Service (SoL),which will provide a service guarantee and can warn users when the accuracy dropsbelow a threshold and a Commercial Service (CS), which will be encrypted and pro-vides a higher accuracy. Officially, no accuracies are given, but Galileo is expectedto provide the same accuracy as GPS.
3.1.1.5 BeiDou
The Chinese GNSS BeiDou (chin. for the Big Dipper asterism, formed by theseven brightest stars of Ursa Major) was declared operational for the region of Chinaand its surrounding areas on December 27th 2011. In contrast to GPS, GLONASSand Galileo, BeiDou uses five geostationary satellites in addition to conventionalnon-geostationary satellites, and uses the China Geodetic Coordinate System 2000(CGCS2000) instead of WGS84. BeiDou satellites operate on a carrier frequency of1561.098 MHz, which is called theB1 frequency. The current system is also referredto as Compass or BeiDou-2 and is planned to reach completion in 2020, then com-prising of 37 satellites and being operational world wide with a nominal accuracy of10 meters ([China Satellite Navigation Office, 2011]).
The previous system, called BeiDou Satellite Navigation Experimental System orBeiDou-1, consisted of three satellites and differed from BeiDou-2, GPS, GLONASSand Galileo by being an offboard/exocentric positioning system: a user’s terminalbroadcasts a signal to the satellites, which in turn send the measured time of arrivalto a terrestrial ground-station. The ground station determines the position of theterminal and sends this information back to the terminal via the satellites2.
3.1.1.6 Pseudolites
Although global navigation satellite systems work well in outdoor scenarios with afree line of sight to four satellites, they have problems in urban canyons, and usuallydo not work within buildings. A proposed solution consists of so-called pseudolites,which can be received with the same hardware as the orbital satellites, but are in-stalled terrestrial in said urban canyons or inside buildings. Although the idea soundseffective, it has some disadvantages, most notably the near-far problem: dependingon the range between the receiver and the pseudolite, the signal can become more
1http://www.esa.int/esaNA/SEMTHVXEM4E galileo 0.html; visited November 29, 20112http://www.cnsa.gov.cn/n615708/n620172/n677078/n751578/62676.html; visited December 29,
2011; translated with Google Translate

3.1 POSITIONING WITH A SINGLE SENSOR TECHNOLOGY 67
powerful than that of satellite and thus jam the receiver ([Ndili, 1994]). Solutions tothis problem either modify the used frequency, pulse the signal or change the dataprotocol of the pseudolites, which also leads to hardware and software updates onthe receivers side. In [Borio et al., 2011], a theoretical framework is presented thatallows simulating and quantifying the signal loss of satellite signals, if pulsed pseu-dolites are used in addition to satellite signals. With the help of such a simulation,the deployment of pseudolites in buildings can be tested and optimized in terms ofinterference with satellite signals.
Indoor Messaging System (IMES)
A more concrete attempt to pseudolites is the Indoor Messaging System (IMES).IMES is a part of Japan’s Quasi-Zenith Satellite System (QZSS), which itself is anextension of GPS through three additional satellites, which should improve posi-tioning accuracy in Japan. The IMES specification states that in order to receiveIMES data, only a small customization of existing GPS receivers has to be made([QZSS, 2009]). The pseudolites use the L1 frequency with an offset of 8.2 kHzand use specially assigned PRN codes. Instead of the ephemeris data sent by GPSsatellites, IMES pseudolites can send different data, e.g. longitude/latitude and floor-data or even a simple ID that refers to a database entry, which can then be accessedvia a network. An IMES capable receiver usually does not use triangulation, butjust adopts the received location of the pseudolite. According to [Dempster, 2009],IMES has to face several potential problems: pseudolites have to be installed every20-30 meters, which could result in high costs; the pseudolites are likely to jam thereception of GPS satellites and could thus influence outdoor positioning; a seam-less handover from pseudolite to pseudolite or to satellites could provide difficultiesbecause of the near-far problem.
Kohtake et al. [Kohtake et al., 2011] describe a seamless indoor and outdoor posi-tioning system based on IMES and GPS. They installed IMES pseudolites at variouslocations in a shopping mall, each one covering a distance of 10 to 20 meters andsending out a unique database ID. The used GPS receivers can read position infor-mation sent by the nearest pseudolite and measure the received signal strength of thatsatellite. If a receiver is in the middle of two pseudolites, both signals can be readand measured, which allows for a higher position-accuracy in those overlap zones.For testing purposes, the authors constructed a cart containing a GPS chipset receiverwith modified software, a GPS antenna and a cell phone. The authors do not give anevaluation of the achieved position accuracy.

68 RELATED WORK
Sakamoto et al. [Sakamoto et al., 2011] use IMES pseudolites for robot localiza-tion. Since an accuracy of tens of meters is not applicable for robots and trilaterationis impossible with IMES, they use Doppler shift effects to improve the positioningaccuracy. In order to produce the needed Doppler shifts, they use two receivers, onewith a stationary antenna and a second one with a movable antenna. Both receiversshare the same clock and are thus tightly synchronized. The position of the mov-able antenna is always known by the robot in its own local coordinate system (LCS).The robot tries to determine its coordinates in a world coordinate system (WCS) byrotating the movable antenna around the fixed one, while the robot itself remains sta-tionary. The authors conducted two experiments, in which either the rotation radiusor the rotation angle was varied. In both experiments only one IMES pseudolite wasused. The resulting measurements were stored and the positions were determinedin an off-line phase. The resulting accuracy was highest with the longest rotationradius (300 millimeters) and biggest rotation angle (360 degrees) and resulted in ≈17 centimeters. However, because of the rotating antenna the proposed approach isnot suitable for personal positioning.
3.1.2 Cellular Based
Modern mobile phones rely on a cellular network, consisting of radio towers. Asalready indicated in Section 2.3.3, opportunistic positioning systems use already ex-isting infrastructure that was originally set up for a different purpose. Since cellularnetworks are widespread, they are often used for opportunistic positioning.
Cell phone standards are categorized in generations by the International Telecommu-nication Union (ITU). For each generation, key-features and requirement are defined,on which new standards are developed. The development of first generation (1G) mo-bile phones and networks started in the 1950s and was based on analog technology.In Germany, the first consumer-usable mobile phone network was available in 1958and was called A-Netz (A network). The switch to digital technology, and thus to thesecond generation (2G), took place in 1991, with the start of the Global System forMobile Communications (GSM) standard in Finland. Besides telephony, the secondgeneration also introduced the capability of transferring data packets. The third gen-eration (3G) was launched in 2001 by NTT DoCoMo in Japan and implemented theUniversal Mobile Telecommunications System (UMTS). Candidates for the fourthgeneration (4G) are Long Term Evolution Advanced (LTE Advanced) and World-wide Interoperability for Microwave Access 2 (WiMAX 2). Both standards havepredecessors (LTE and WiMAX), which do not completely fulfill the 4G require-ments, and are thus dubbed near-4G systems or 3.9G. Since 2G the main differencesbetween each generation are higher data bandwidth and new frequency bands. Thedifferent generations are non-backwards compatible in transmission technology.

3.1 POSITIONING WITH A SINGLE SENSOR TECHNOLOGY 69
As the name implies, a cellular network consists of individual cells, each one cover-ing a limited area. One such cell is created by at least one base station, consisting ofa transceiver that operates on a certain radio frequency and that is able to maintain aconnection to a limited number of mobile phones. In this context, terminal devices,such as a mobile phone, are called User Equipment (UE). Signals that are sent froma base station to an UE are called down-link signals and signals from an UE to abase station are called up-link signals. Adjacent cells, which can overlap, operateon different frequencies or frequency-bands, to minimize interference. However, iftwo cells are far enough apart, the same frequency-band can be reused. Through thepartition of the whole network into cells, several problems are addressed. Firstly,the distance between an UE and a base station can be kept low, which is importantfor battery operated mobile devices, since the power consumption of such a deviceshould be low. Secondly, if a sufficient number of cells is available, more UEs canconnect to the network at the same time. However, for both solutions to work, asufficient number of base stations has to be available, which can drive up the costof deploying and maintaining such a network. To address this problem, several cellsizes can be used, e.g. large cells for rural areas and several small cells for urban en-vironments (cf. [Roth, 2005], pp. 46). In the telecommunications domain, the namesfor different sized cells are derived from International System of Units (SI) prefixes:
• Macrocells are cells with a coverage up to 35 kilometers and are usually de-ployed in rural areas
• Microcells cover up to 2 kilometers and are ideal for urban and suburban areas
• Picocells have a range up to 200 meters and can be deployed in high-densityareas, such as shopping malls or large office buildings
• Femtocells have a range up to 10 meters and are usually deployed and main-tained by consumers
As indicated in the list, femtocells are operated by consumers. Because picocells andfemtocells are especially designed for indoor usage and have a relative small range,they are particularly interesting for indoor positioning (see also Section 3.1.2.7).
The need for positioning in cellular phone networks was largely motivated by gov-ernmental regulations, such as E112 in Europe, E911 in North America and 110 inChina. These regulations demand that network operators must be capable to locateany emergency caller within a given accuracy, i.e. 95% of all E911 callers within 150meters. The following standard methods are often used to determine the position ofan UE.

70 RELATED WORK
3.1.2.1 Cell ID (since 2G)
UEs connect to the base station that is nearest to them, i.e. the one that providesthe device with the highest signal strength. This cell is called the Cell of Origin(COO) and can be used for positioning, either ego- or exocentric. In the exocentriccase, the network operator can check in which cell the UE is logged in, and can thusdetermine the area in which it is located. A simple egocentric approach is based onthe information each cell broadcasts, i.e. the Cell ID. By having a table stored onthe device that contains the location for each cell ID, the device itself can determineits current area. A network provider can also broadcast this location info for eachbase station, which obsoletes the provision of such a table. The accuracy of thesesimple approaches depends on the size of the current cell and ranges from 200 meters(picocells) to 35 kilometers (macrocells) ([Singh and Ismail, 2005]).
3.1.2.2 Cell ID + Timing Advance (since 2G)
The accuracy of Cell ID based systems can be increased by taking additional mea-surements into account. For example the received signal strength on either the UE orthe base station can be used to further narrow the radius of the circle around the basestation describing possible locations.
GSM uses a Time Division Multiplex Access (TDMA) method to share one fre-quency with several UEs, i.e. each UE gets assigned to a specific time slot inside atime frame. In order for a base station to receive a data-package in the correct time-slot, the UE has to compensate for the signal delay due to the distance between itselfand the base station. In order to determine this delay, the base station measures theRound-Trip Time (RTT) between itself and an UE, i.e. the time that is needed for asignal to be received by the UE plus the time that is needed to receive an acknowl-edgment signal from the UE.
A quantized value of this measurement, called the Timing Advance (TA) value, issent back to the UE. TA values range between 0 and 63 and each step represents atime-step of 3.7 µs ([3GPP, 1999, 3GPP, 2010]). A TA value of 1 thus representsthe distance of 3.7µs
2∗ c ≈ 550m and a value of 63 represents the maximum GSM
cell-size of 35 kilometers. The TA thus already provides an approximation of theUE’s distance to the base station and since the value is known to both, the networkoperator and the UE, it can be used for exo- and egocentric positioning.
This kind of enhanced Cell ID is called Cell ID+TA. However, since Cell ID+TA canonly provide a resolution in 550 meter-steps, this method only provides an advantageover simple Cell ID in macro and micro cells, where the maximum cell range exceedsa single step.

3.1 POSITIONING WITH A SINGLE SENSOR TECHNOLOGY 71
3.1.2.3 Cell ID + Round Trip Time (since 3G)
3G systems, like UMTS, can determine the RTT with higher accuracy. This improve-ment is achieved through the larger bandwidth and thus shorter time-slots of the pro-tocol and can be further improved by applying optional Location Measurement Units(LMU) to the base stations (called Node B since 3G). Moreover, 3G cells can be di-vided into sectors by using directional antennae, which can be used to further narrowdown the possible area of an UE. According to [Borkowski and Lempiainen, 2006],distance measurements with an accuracy between 5 and 36 meters can theoreticallybe achieved by using oversampling at Node B measurements. Practical measure-ments however achieve an accuracy between 150 and 450 meters.
Third generation networks also provide features called softer handover and soft han-dover. As the names imply, these features ensure a seamless handover of a movingUE’s connection from one Node B to another. During softer handover, the UE gainsaccess to two Cell IDs and one RTT value. When the UE is in soft handover, it hasaccess to two or more Cell IDs and to two or more RTT values. In these cases, amore precise positioning is possible, by using trilateration (see Section 2.5.1). In[Borkowski et al., 2004] a comparison of Cell ID+RTT was performed, includingsingle Cell, softer handover and soft handover scenarios. According to the authors,the accuracy heavily depends on the network topology and lies in the range of 16 to440 meters. As reported above, single Cell ID provided a range estimation between150 and 450 meters. Softer handover resulted in positions with an accuracy between50 and 100 meters, and soft handover could achieve a rather constant accuracy of 16meters.
3.1.2.4 Observed Time Difference of Arrival (OTDOA) (since 2G)
In the context of positioning in cellular networks, the term Observed Time Differenceof Arrival (OTDOA) is often used for a multilateration based on Time Difference ofArrival (see also Section 2.5.1.4). OTDOA can be used for exocentric and egocentricpositioning. The latter is dubbed Down-Link Observed Time Difference of Arrival(DL-OTDOA) and is only possible if the UE is capable of measuring signals fromdifferent base stations.
OTDOA measurements are already performed in GSM networks to realize theso-called pseudo-synchronous handover between two base stations, which re-quires the determination of a new TA for the new base station. According to[Silventoinen and Rantalainen, 1996], the rate with which OTDOA measurementsare performed in a GSM network is too low for positioning. They propose a soft-ware change on the network and UE side to increase the measurement rate and testedtheir approach with a simulation. A mean positioning accuracy between 100 and 200

72 RELATED WORK
meters could be measured. However, the authors admit that the measurement errormight be much higher in some real-world environments. [Singh and Ismail, 2005]report a medium accuracy between 100 and 500 meters in urban environments (dueto closer distances to several base stations) and a few kilometers in rural areas.
In 3G networks, OTDOA measurements for egocentric positioning face the near-far problem (see also Section 3.1.1.6), where the serving Node B drowns signalsfrom other base stations. A solution to this problem is called Time Aligned IdlePeriod Downlink (TA-IPDL), where each Node B suspends its transmissions for agiven amount of time, which enables the UE to receive signals from distant NodeBs. According to [Borkowski and Lempiainen, 2006], with TA-IPDL an accuracybetween 30 and 100 meters can be achieved.
3.1.2.5 Angle of Arrival (AOA, only with additional hardware)
To enable exocentric positioning through triangulation within a cellular phone net-work, the base stations must be equipped with antenna arrays to be able to derive theAOA (see also Section 2.5.2.1). Egocentric positioning through trilateration is un-common in cellular networks, since standard UE hardware is not capable of derivingAOA measurements. The accuracy through exocentric triangulation based on AOAmeasurements ranges between 100 and 500 meters ([Singh and Ismail, 2005]).
3.1.2.6 Positioning in 4G
The 3rd Generation Partnership Project3 (3GPP) is an international consortium oftelecommunications associations, which produces technical specifications. Origi-nally the consortium was founded to define standards for 3G cellular networks, butis now also involved in 4G standardization.
3GPP specified three positioning methods for 4G:
• Network-assisted GNSS methods
• Cell ID + enhancements like RTT
• OTDOA
The network-assisted GNSS methods, e.g. AGPS, are specified as the main po-sitioning method, while Cell ID methods and OTDOA are specified as fallbacksolutions. The motivation for this specification of positioning methods is mainly
3http://www.3gpp.org

3.1 POSITIONING WITH A SINGLE SENSOR TECHNOLOGY 73
motivated by the E911/E112 regulations (see Section 3.1.2), although the ex-pected higher data-rates of 4G (up to 1GBit/s in LTE Advanced) are also envi-sioned to provide new opportunities for location based services. However, an in-crease in position accuracy of the proposed standard solutions is not expected (cf.[Tam and Lee, 2009, Ranta-aho, 2010]).
Pereira F. et al. In [Pereira et al., 2011b], an approach is described how to useGSM fingerprinting to derive position information in the Large Hadron Collider(LHC) tunnel, located near Geneva, Switzerland. The LHC is a particle acceleratorring with a perimeter of 27 kilometers, lying 100 meters below the surface. Inside thetunnel, positioning information could be helpful for the radiation protection group,who has to perform frequent radiation surveys involving radiation measurements atthousands of points.
Due to the location deep under ground, no GPS signals can be received inside thetunnel. However, GSM is provided inside the tunnel through several so-called leaky-feeder cables. The tunnel is divided into eight sections and for each section two GSMcells are created through the leaker-feeder cables, such that when following along thetunnel in one direction, the signal strength of one GSM cell rises and the other getsattenuated.
The authors used a modified Nokia 6150 mobile phone connected to a laptop to logthe signal strength of different GSM cells and to create a fingerprint map. To find cor-responding locations, a weighted k-nearest neighbor approach was used. The systemwas tested using test-locations inside the tunnel, and measurements were taken underoptimal conditions (nobody was near the measuring equipment), sub-optimal condi-tions (at least one person was standing near the measuring equipment) and realisticconditions (a person was holding the equipment during measurement).
As expected, the signal variations where minimal in the optimal condition (± 2.5dBm) and were highest in the realistic condition (± 6 dBm). The authors furthernoticed that significant differences arose between different measurement sessions,which may be due to magnets being powered in the particle accelerator equipment.
The measured accuracy of the positioning algorithms was determined being between20 and 280 meters, taking all three conditions into account. The authors concludethat their system provides accuracy within an acceptable range (for their purposes)and that they will be able to enhance the system through a higher resolution of thefingerprinting map, a better signal measurement process and through the applicationof filtering techniques.

74 RELATED WORK
3.1.2.7 Indoor Positioning with Femtocells and Picocells
As already mentioned above, femtocells and picocells are especially interesting forindoor positioning applications, due to their short sending range. In contrast to pic-ocells, femtocells are operated by consumers and bridge the user’s cell phones totheir cellular network operator by using the consumer’s DSL or other broadband In-ternet access. As an incentive, operator companies usually offer reduced call ratesor lower fees for their services. According to [Haddad and Porrat, 2009], cellularnetwork operators consider femtocells as a solution for two problems: low signalreception of cell towers indoors, which usually degrades voice quality and leads tolow data throughput, and losing profit because users tend to use WiFi and Voice overIP at home instead of the cellular network. The idea to use privately operated basestations – also called Home Base Stations (HBS) in contrast to the network operatedbase stations – has already been proposed in [Silventoinen et al., 1996] to connectGSM based phones with a fixed telephone line. The current concept of femtocells ispromoted since 2007 by the Femto Forum, a “not-for-profit membership organizationwhich seeks to enable and promote femtocells and femto technology worldwide”4.The first femtocell standard was published in 2009 and was the result of a three-waycooperation between 3rd Generation Partnership Project (3GPP), Femto Forum andBroadband Forum.
Dempsey et al. [Dempsey et al., 2011] describe a testbed, in which they imple-mented a Customer Relation Management (CRM) system, which should help to in-crease a company’s interaction with customers, clients and sales prospects. Amongother features, the CRM system provides location information for subscribers and away to share location information with third parties. The hardware consists of three2.5G proprietary GSM picocells, although the authors argue that the same principlescan be used for 3G or 4G pico- and femtocells. The testbed also contains a central-ized server to which the picocells are connected and which can gain information onthe Cell ID and signal strength of every subscriber’s mobile phone. Furthermore,the current connection status of a subscriber can be extracted, e.g. whether they arecurrently talking on the phone or not. The CRM system can poll this information inintervals of 20 seconds and also has access to the calendars of every subscriber.
Coarse position information is derived through the Cell ID information. Motion isinferred through changing signal strength between polling intervals and direction isestimated through Cell ID changes. So-called presence agents try to infer a moreprecise position or sub-status by combining the measured information with calendarentries through the use of Bayesian Networks. For example, if a subscriber has ascheduled meeting at 8:30 in room A on the ground floor and the measured cell at
4http://femtoforum.org/

3.1 POSITIONING WITH A SINGLE SENSOR TECHNOLOGY 75
8:25 is the one on the ground floor, the agent refines the position information toroom A and changes the sub-status to ‘in a meeting’. If the subscriber’s cell is onthe first floor, with an inferred direction downstairs (e.g. the previous cell was on thesecond floor), the sub-status can be changed to ‘on the way to a meeting in room A’.The authors conclude that such a pico/femtocell based infrastructure provides ‘cheapcontext’ as the cost of a femtocell is less than $100.
3.1.3 WiFi Based
The term WiFi (or Wi-Fi) is a trademark of the Wi-Fi Alliance5 and an abbrevia-tion for Wireless Fidelity. It is used to describe the set of IEEE 802.11 standards([IEEE, 1999]) for wireless data connections into Local Area Networks (LAN) andthe Internet ([Patton et al., 2005]). Often, the term WLAN, for Wireless Local AreaNetwork is used interchangeably. According to the IEEE 802.11 standard, wirelessdata connections can be established via infrared or radio communication. However,nowadays the terms WiFi and WLAN almost always describe the access via radiocommunication. As indicated above, the IEEE 802.11 is a set of standards that hasevolved over time. The original 802.11 was proposed in 1997 and allowed data-ratesup to 2 MBits per second on the unlicensed 2.5 GHz frequency band. In 1999, theextensions 802.11a, with data rates up to 54 MBits/s on the unlicensed 5 GHz band,and 802.11b, with data rates up to 11 MBits/s on the unlicensed 2.4 GHz band, whereintroduced ([Roth, 2005], page 81). Since then several extensions followed, wherethe most important ones are 802.11g, 802.11h and 802.11n, which further increasethe data rates on the 2.4 GHz and 5 GHz bands. A special extension, named 802.11p,was proposed for vehicular applications and is a very important key-element for Car-to-Car (Car2Car) and Car-to-X (Car2X) applications.
All 802.11 standards support two basic connection modes: ad-hoc mode and in-frastructure mode. In infrastructure mode, WiFi compliant Access Points (AP) aredeployed into the environment. Mobile or stationary devices that connect to such anaccess point are called stations. An access point can handle connections to severalstations and can thus create a network between these stations. Usually, an AP canalso connect to a wire-based network or a broadband Internet access, and can thusintegrate wireless stations in an already existing LAN or provide wireless Internetaccess. In the ad-hoc mode, a network is formed between wireless stations withoutthe use of any AP. All stations must therefore be in appropriate range to each other.
Since WiFi uses unlicensed frequency bands, an infrastructure can be easily deployedby consumers and companies at relative low cost. WiFi access points in public places,like airports, trains stations, shopping malls or even parks and other municipal areas,
5http://www.wi-fi.org

76 RELATED WORK
are called hot spots and are often freely accessible. Nowadays, WiFi infrastructuresare an integral part of universities, companies and even in many private homes. Be-cause of this, WiFi infrastructures are a good choice for opportunistic positioningsystems (see 2.3.3).
Each WiFi capable station and each AP has a unique 48 bit wide Media Access Con-trol address (MAC address) that is used to identify each entity. APs also broadcast aService Set IDentifier (SSID), which consists of up to 32 characters and can be freelychosen. The SSID is therefore not necessarily unique and is mainly used to name anAP or a specific WiFi network. The SSID can be hidden, but this is merely a matterof filtering out the information by the protocol on the receiving end. APs repeatedlybroadcast their MAC address, SSID and additional data in so-called beacon framesto advertise their presence and services.
A scanning process on an AP reveals all available WiFi stations in reach and resultsin a list of their MAC addresses and the measured Relative Signal Strength (RSS)to each station (see also Section 2.5.1.1). A scanning process on a station resultsin a list of MAC addresses of nearby APs and, depending on the hardware, also themeasured RSS values for each AP. With the use of this information, several position-ing approaches are possible. Each of them can be used for egocentric or exocentricpositioning:
• Single AP: If the location of a single AP is known, a simple proximity posi-tioning is possible.
• Single AP+RSS: If the RSS is known in addition, the area of possible positionscan be further reduced.
• Multiple APs+RSS: If the locations of several APs are known, trilateration ispossible by using the RSSs to estimate distances (see Section 2.5.1).
• RSS Fingerprinting: If enough APs are available, signal strength fingerprint-ing can be used (see Section 2.5.3).
The first three methods require the knowledge about the positions of APsand the fingerprinting approach requires fingerprint maps. Usually thisdata is stored on a database, either on a server or directly on a device.In [Gschwandtner and Schindhelm, 2011] the authors propose to include additionaldata into the 802.11 beacon frames. This additional data includes the coordinate ofthe broadcasting AP itself or data that enables a mobile station to construct a finger-print map. With this extension, the authors hope to minimize the deployment effortand needed storage capacities of WiFi-based positioning systems. The proposed pro-tocol was implemented on a modified OpenWRT based WiFi access point, whichproved the feasibility of the approach.

3.1 POSITIONING WITH A SINGLE SENSOR TECHNOLOGY 77
Bahl et al. [Bahl and Padmanabhan, 2000] describe a system called RADAR,which was one of the first WiFi based positioning systems using a fingerprintingapproach, although they classified it as being based on triangulation. Besides theconstruction of a fingerprint map trough empirical measurements, they also proposedto use a radio propagation model as an alternative. The average positioning accuracyof RADAR lies between 2 and 3 meters.
Ledlie et al.: Mole In [Ledlie et al., 2011] an onboard/egocentric positioning sys-tem called Mole is presented, which relies on signal strength fingerprinting. Moleuses semantic descriptions instead of coordinates, which are organized in a hierar-chy. This hierarchy limited to five levels: country, region, city, area and uniqueplace. Trained fingerprints can be retrieved from a cloud-service and users can trainunknown places and upload their fingerprints to the cloud. Mole thus uses some ofthe ideas already published in [Dimitrov, 2007] and [Schwartz et al., 2010b], whichwill be discussed in detail in Section 4.3.
Signal-strength fingerprints in Mole are expressed as a list of triplets 〈wi, µi, σi〉 foreach detected WiFi access pointAPi at a particular position. Here, µi and σi describethe observed signal strength over a time period as a single Gaussian with mean µi andstandard deviation σi. wi is a weighting factor, which is derived from the observationhow often an access point was measured during a time period. The weighting factorsare normalized, i.e. all wi in one fingerprint sum up to 1. The similarity of twofingerprints is computed by comparing each access point in the list and computingan overlap coefficient from both Gaussian distributions. For missing access pointsa penalty value is subtracted. The weighted sum over all access points is used asa confidence level. The authors call this method MAximum Overlap localization(MAO).
Figure 3.1: A test environment for Mole [Ledlie et al., 2011].

78 RELATED WORK
Mole was tested in different setups. The most meaningful, because densely locatedrooms were tested, was conducted in a lab of which the floor plan is shown in Fig-ure 3.1. Fourteen Nokia N900 tablets with Mole running were placed in the 14 roomsindicated. The system was trained 24 hours prior to the evaluation. As Mole pro-vides semantic descriptions of positions, the evaluation tested how often the correctroom was guessed. Several variations of the algorithm were tested, including usinghistograms instead of a Gaussian distribution to describe the signal strength. Thehighest average hit-accuracy achieved was 93.16%, using MAO with signal strengthhistograms, where the rooms 309, 310, 311 and 312 had the highest miss-rates. TheMAO with a Gaussian description resulted in an average hit-accuracy of 80.46%;again rooms 309 to 312 were the most problematic. Obviously, those rooms providethe highest challenge for such a system, as they are directly adjacent. When averag-ing the hit-accuracies over those four rooms, the average hit-rate drops to 76.57% forMAO with histograms and 41.98% for MAO with Gaussian distributions.
3.1.4 Bluetooth Based
Bluetooth is an open wireless data-transmission standard for short distances. Thestandard was initially started by Swedish company Ericsson after conducting a feasi-bility study on how to create a technology that is able to wirelessly connect differentelectronic devices, e.g. desktop computers, printers, mobile phones and laptops.
The Bluetooth Special Interest Group (Bluetooth SIG) was founded in 1998 by Er-icsson, Nokia, IBM, Toshiba and Intel as a privately held, not-for-profit trade asso-ciation, with the goal of constituting an industry standard and binding specifications.The first version of the Bluetooth specification was approved in 1999. As of 2011,over 1 billion devices are Bluetooth enabled, the core specification has reached ver-sion 4.0 and over 14,000 companies are members of the SIG ([Bluetooth SIG, 2008]).
The name Bluetooth stems from the Danish King Harald Blatand, which translatesto Harald Bluetooth. Under the reign of King Blatand, several warring parties inparts of today’s Norway, Sweden and Denmark were unified in the 10th century.Since the special interest group sought after a technology to unify different devicesof competitive industries, they chose the name Bluetooth.
Bluetooth devices are classified according to their transmitting power and the result-ing range of coverage:
• Class 1: 100 mW; range of coverage up to 100 meters
• Class 2: 2.5 mW; range of coverage between 10 and 20 meters
• Class 3: 1 mW; range of coverage up to 10 meters

3.1 POSITIONING WITH A SINGLE SENSOR TECHNOLOGY 79
Like WiFi, microwave ovens and cordless phones, Bluetooth operates in an unli-censed frequency band. For Europe and USA the range between 2,400 and 2,483.5MHz is used, and in Japan the range lies between 2,471 and 2,497 MHz. In compari-son to WiFi, Bluetooth is optimized for ad-hoc networks between Bluetooth devices,but provides a lower data rate of 3 MBits/s (Bluetooth Version 2.0). With BluetoothVersion 3.0+HS (High Speed), higher data rates up to 24 MBits/s can be achieved,but the actual data transmission is then realized via a WiFi link, while Bluetooth isonly used for the initial handshake.
Up to eight Bluetooth devices can form a so-called piconet, where each device canagain be part of several different piconets. Such a network, that contains Bluetoothdevices that belong to different piconets, is called a scatternet. In each piconet, onedevice acts as the master device; all other devices act as slaves. As it was the casewith WiFi networks, each Bluetooth device has a unique 48 bit wide Bluetooth ad-dress (sometimes called Bluetooth MAC or Bluetooth ID) and a so-called friendlyBluetooth name that can be freely chosen by the user. If a Bluetooth device wants toestablish a connection, it performs an inquiry, which results in a list of all discover-able6 Bluetooth devices in its vicinity as well as RSS indicators and a list of servicesfor each detected device. According to the Bluetooth specification, such an inquiryrequires around 20 seconds ([Bluetooth SIG, 2010]).
Positioning with Bluetooth can be accomplished by instrumenting an environmentwith fixed Bluetooth beacons or by using stationary Bluetooth enabled devices thatare already in the environment, e.g. Desktop PCs, Bluetooth enabled input devicesor Bluetooth enabled printers. The latter attributes for an opportunistic positioningsystem and a detailed example will be given in Section 4.3. For the former, the sameprinciples as for WiFi positioning can be applied, but due to the low range of commonBluetooth devices, a proximity based approach is often used.
Eyeled: Indoor Navigation for the Visually Impaired The German companyEyeled GmbH7 has developed an indoor navigation system for visually impairedpeople based on Bluetooth beacons with integrated speakers. Users can downloadthe navigation system on their Bluetooth enabled Symbian OS mobile phone, eitherat home or on location via Bluetooth and will then be guided to their destination, forexample inside a communal building. The Bluetooth beacons act as landmarks forthe navigation system and can also output audible signals via the integrated speakers.According to a company spokesman, the Bluetooth beacons can also be integratedinto the already existing signage inside the building8.
6Whether or not a Bluetooth device is discoverable, depends on the user settings.7http://www.eyeled.de8Press release: http://www.eyeled.de/unternehmen/presse/index.php?File=005&news=IndoorNavigation

80 RELATED WORK
Chawate [Chawathe, 2009] describes an egocentric, onboard indoor-positioningsystem using Bluetooth beacons that addresses the important problem of long in-quiry times. As already mentioned above, the inquiry process takes about 20 sec-onds, which is generally too slow for a user walking at normal speed. On the otherhand, directly probing a Bluetooth device with known Bluetooth ID can be accom-plished in at most 2.5 seconds. The author’s idea is therefore, to use a beacon map onthe user’s Bluetooth device that contains the locations as well as the Bluetooth IDsof all available beacons in a building. With the use of this map and the knowledgeabout the previous position, the positioning system then directly probes for knownBluetooth beacons instead of starting a general inquiry. The needed beacon map isrepresented through a 4-tuple, which contains the locations of the beacons, edgesbetween neighboring beacons, hyperedges that represent the range of a beacon as theset of locations from which it is detectable, and weights that represent the distancebetween two locations. The actual positioning is done through the hyperedges. Hav-ing observed a set of Bluetooth beacons, the system tries to find the location that bestmatches the observation. The author provides sophisticated algorithms on how todetermine the set of beacons that have to be probed for in the next measurement. Anevaluation of the system’s accuracy is not given.
3.1.5 RFID Based
Radio Frequency IDentification (RFID) is a radio based technology and is based onmodulated backscattered communication. First applications of the basic idea can betraced back to the second World War, where British airplanes modulated identifica-tion information onto incoming Radar signals. This modulated information couldthen be used to distinguish between friendly or attacking planes. The first researchpaper describing the basics of RFID was [Stockman, 1948], where the author pre-dicted that ‘considerable research and development work has to be done before theremaining basic problems in reflected-power communication are solved, and beforethe field of useful applications is explored’. The first commercial application of RFIDstarted in the late 1960 with the introduction of Electronic Article Surveillance (EAP)equipment. These systems augmented merchandise with electronic circuits whosepresence could be detected at a shop’s cashing point or exit (cf. [Landt, 2005]).
In general, an RFID system consists of at least one reader and at least one so-calledtag or responder. The tags contain at least some identification information (RFIDID), which will be revealed if an interrogation signal from a reader is received. Com-pared to the reader, a tag contains a very simple circuit, which means that they areusually very cheap to produce. In [Takaragi et al., 2002], the authors report aboutthe so-called µ-chip manufactured by Hitachi, which is an RFID tag that is only 0.06millimeters thick and 0.4 millimeters long on each side. In 2007, Hitachi announced

3.1 POSITIONING WITH A SINGLE SENSOR TECHNOLOGY 81
(a) Two standard RFID tags byUPM and Siemens in compar-ison to a 1 Euro coin
(b) µ-chips by Hitachi on a fin-gertip [Takaragi et al., 2002]
(c) Powder LSI chips byHitachi in compari-son to a human hair[Hornyak, 2008]
Figure 3.2: Comparison of passive RFID tag sizes, from standard tags (a) to µ-chips(b) to ‘RFID Dust’ (c).
even smaller tags, called Powder LSI (Large Scale Integration) chips, with a thick-ness of 0.005 millimeters and a side-length of 0.05 millimeters. However, standardRFID tags usually cover a much larger area, more in the range of centimeters thanin sub-millimeters. Figure 3.2 shows a comparison of different RFID tag sizes: (a)shows a self-adhesive tag manufactured by UPM on the top and a Siemens tag, whichis integrated into a wooded block; (b) shows two µ-chips on a fingertip and (c) showsnumerous Powder LSI chips in comparison to a human hair.
RFID systems can be classified into passive and active. In passive RFID systems, thetags draw the needed operating power from the signal of the reader. Passive systemstherefore only have a short communication range, typically up to 3 meters, but somereader/tag combinations can also reach up to 10 meters. In active RFID systems,tags are powered by batteries or other external power-sources, which generally leadsto a higher reading range of up to 100 meters. The reading range in passive andactive RFID systems depends on various factors, e.g. antenna design, reader power,tag power-consumption and the used frequency band. Like WiFi and Bluetooth,RFID systems use unlicensed frequency bands. In the case of RFID the followingfrequency bands are commonly used:
• LF (Low Frequency) 125 – 135 kHz
• HF (High Frequency) 13.56 MHz
• UHF (Ultra High Frequency) 868–928 MHz
• Microwave 2.45 GHz and 5.8 GHz

82 RELATED WORK
For passive RFID systems, the highest communication ranges are achieved in theUHF and Microwave bands. Active RFID systems usually operate only in the UHFand Microwave range (cf. [Dressen, 2004]). One of the problems of RFID is that itsnot truly standardized. As a matter of fact, there is a plethora of different standardsavailable, where the most important ones are ISO 18000, which specifies protocolsfor different frequencies, ISO 14443 specifies so-called proximity RFID devices witha communication range up to 10 centimeters and ISO 15693 is for so-called vicinityRFID devices with a communication range up to 1 meter.
An important technology that is related to RFID, and in fact compatible to ISO14443, is Near Field Communication (NFC). However, with NFC the strict distinc-tion between reader and tag was repealed, i.e. each NFC-compliant device can actas reader or as tag (cf. [Juels, 2006]). NFC is expected to play an important role inmaking cashless payments, and thus NFC is already integrated in many smart phones.Through the compatibility to ISO 14443, NFC devices are also able to read passiveRFID tags, which comply with the ISO norm.
Since RFID is a radio-based technology, the same principles for positioning can beused as with WiFi and Bluetooth. However, the small communication distance ofpassive RFID makes it especially suitable for proximity approaches. As a matter offact, the already mentioned EAP systems are exocentric positioning-systems, withvery coarse accuracy: Objects in a shop or warehouse are tagged with RFID chipsand readers are placed at important points. If a reader detects the presence of an RFIDtag, it can be derived that the tagged object is now changing from one area to another.Obviously, the accuracy depends on the number of readers and the reliability of thereading device. For person positioning, tags can be attached to, or integrated in, theclothes of users. RFID chips can also be implanted in animals as well as humans,however the latter is highly controversial ([Masters and Michael, 2005]).
A straightforward way to implement an egocentric positioning system is to deployRFID tags into the environment and equip the agent with an RFID reader. The ac-curacy of such a system depends on the density of the RFID tags and the reliabilityof the reader. Manufacturers like Vorwerk9 and Future-Shape10 have developed car-pets with integrated RFID tag-grids. However, the small communication distanceof passive RFID means that the reader has to be close to the carpet, which limitsthis approach to robots, wheelchairs or shopping trolleys (see also Section 5.6), i.e.appliances where readers can be installed close to the floor.
Kiers et al.: ways4all In [Kiers et al., 2011] an indoor navigation system for visu-ally impaired people, called ways4all, is described. The used positioning determina-
9http://corporate.vorwerk.com10http://www.future-shape.com/

3.1 POSITIONING WITH A SINGLE SENSOR TECHNOLOGY 83
tion is based on passive RFID and is an onboard/egocentric system. Ways4all usespassive LF (134.2 kHz) RFID tags, which are placed at strategic spots in environ-ments (entrances, intersections, barriers) that are already equipped with a so-calledTactile Guidance System (TGS). In principle, a TGS consists of specially formedtiles that include grooves or bumps, which can be felt through the use of a so-calledlong cane or white cane.
The IDs of all deployed RFID tags are stored into a database together with theircoordinates. The RFID tags are organized into three different types: endpoint tags(ET) that mark possible destinations, intermediate tags (IT) that mark points along aroute and virtual tags (VT) that mark possible destinations where no physical RFIDtag is available. The RFID reader is either integrated into a long cane or white caneor attached via a clip to one shoe of the user. The reader is connected to the user’smobile device through Bluetooth. Since the TGS already provides ‘rails’ that helpthe users to follow specific routes, the ways4all system uses these rails to plan a routeto a selected destination and uses read RFID tags as indicators if the user is correctlyfollowing the route and gives audible instructions at decision points.
The authors did not evaluate the position accuracy of their system, but tested the de-tection rate of the deployed RFID tags and the usability of the long-cane mountedreader versus the shoe mounted one. Although initial tests with slow walking speedsshowed a detection rate of 80%, this rate dropped drastically to 33% when actualblind users where testing the system with their normal walking speed. The authorstried to improve the detection rate by forming tag arrays (TA) of up to four singletags, where each single tag in a TA is reporting for the same position. The TAs im-proved the detection rate to 40%. A user study was conducted at a public place inVienna, with four blind men between 35 and 60 years old. All test persons could suc-cessfully install the system (including the RFID reader) and find their destinations.The authors conclude that they could improve the detection rate in their system byusing or building passive RFID tags with a higher communication range.
Similar approaches, using passive RFID readers in long canes for visually impairedpeople, were reported in [Faria et al., 2010] and [E. D’Atri and et al., 2007].
Ni et al.: LANDMARC In ([Ni et al., 2004]) one of the first positioning systemsusing active RFID is described. The system, named LANDMARC, is offboard/ex-ocentric and uses active readers and tags that operate at the uncommon frequencyof 308 MHz. The communication range is specified with 150 feet (approximately45 meters). The readers can operate in eight different communication ranges, wherelevel 1 has the lowest range and 8 the highest. In a first test, the authors deployed ninereaders in a test environment, where one reader was set to level 8 and placed in themiddle. The other readers where placed on a circle around the middle reader, with

84 RELATED WORK
lower levels. The idea was to locate an active RFID tag by checking which readersreport its presence and finding the correct area, which is defined by the communica-tion ranges and positions of each detecting reader. The attempt failed, because toomany factors influenced the communication range of the RFID system. The actualLANDMARC approach was then to put additional reference tags into the environ-ment, which should help to calibrate the system.
The positioning algorithm was in fact a fingerprinting approach, where the referencetags, whose coordinates are known, acted as reference points that could be calibratedat runtime, i.e. for each reference tag, vectors containing the reported signal strengthsof all readers were continuously stored. The signal strengths were obtained by suc-cessive readings with different communication-distance settings. The same kinds ofvectors were built for the tags with unknown positions and a k-nearest neighbor (seeSection 2.5.3) method was used to determine the position of these tags.
The authors tested their approach with 4 readers and 16 reference tags. 8 tags whereplaced on known positions and measurements of this static setup were taken over acourse of 48 hours. The collected data was then analyzed to determine the positionaccuracy of the system. It turned out that a 4-nearest neighbor provided the moststable results and that the influence of changing environmental conditions was low.With one reference tag per square meter, an average accuracy of 1-2 meters could beachieved. The authors also report that different tags provide different measurements,which they identify as the main problem of their approach.
3.1.6 Optical Positioning
Although light is also an electromagnetic radiation, it makes sense to distinguishoptical systems from the radio-based methods above. First of all, the frequenciesare much higher: infrared light (IR) is defined to be in the frequency range between300 GHz and 400 Terra-Hertz (THz), visible light covers the range between 400and 790 THz and ultra-violet (UV) from 790 THz to 30 Peta-Hertz (PHz). X-raysand gamma-rays range from 30 PHz to 30 Exa-Hertz (EHz) and 30 EHz to 300EHz, respectively. Secondly, besides the use as a data-transmission medium, picturegenerating light sensitive sensors can be constructed, although UV light, X-ray andgamma-rays are usually not used for positioning systems, as they are highly energeticand are thus potentially dangerous.
3.1.6.1 Infrared Based
Infrared (IR) plays an intermediate role, as it can also be used for data transmission.Besides the already mentioned use in the IEEE 802.11 protocols (see Section 3.1.3),

3.1 POSITIONING WITH A SINGLE SENSOR TECHNOLOGY 85
the IrDA (Infrared Data Association) protocol is a widely adopted standard. IrDA1.0, also called SIR (Serial Infrared) was proposed in 1994 and allowed a data-rateup to 115.2 kBit/s. In its newest iteration, called VFIR (Very Fast Infrared), data-ratesup to 16 MBit/s are possible ([Roth, 2005], page 109). Because infrared transceivers,sensors and senders are very cheap and where available in many mobile computingdevices, early indoor positioning systems were based on this technology. As infraredlight behaves like visible light, it is easily blocked by obstacles such as walls. Thischaracteristic can be advantageous for indoor position systems, since room accuracycan be easily achieved. On the other hand, it can also be a disadvantage as an IRsignal can unintentionally be blocked.
Want et al.: Active Badge The Active Badge system as described in[Want et al., 1992] was an early offboard/exocentric positioning system based on in-frared light signals. A network of IR sensors is installed into a building. Users ofthe system have to wear an IR sender, called an active badge. This badge sends outan IR signal every 15 seconds with a 100-millisecond duration, which contains aunique identification (ID) code. IR sensors report sensed IDs to a centralized server,which in turn know the locations of each sensor and can thus position each badge. In[Want and Hopper, 1992] an extension to the original badge was introduced, calledthe Authenticated Badge. This badge can also receive information via infrared, whichwas used to implement a challenge-response method to prevent users from simplyreplaying recorded IR signals from other badges. Furthermore, the AuthenticatedBadge contains to two buttons, two LED indicators and a tone generator, which canbe used for further user interaction. The Active and Authenticated Badge systemsreached room-level accuracy.
Wahlster et al.: IRREAL IRREAL (InfraRed REsource Adaptive Localiza-tion) is an indoor positioning system, which was developed in the project REALas part of the Collaborative Research Center ’Resource-adaptive Cognitive Pro-cesses’ (SFB 378) and was funded by the German Research Foundation (DFG)([Wahlster and Tack, 1997]). The used positioning method can be classified as on-board/egocentric, however the system is a clever combination between transmissionof navigation information and positioning.
Special IrDA compliant IR senders were developed that could transmit informationover a range of 20 meters. These senders are deployed in the environments, i.e. atthe ceiling or walls, and are connected to a presentation server. Each sender not onlytransmits identification information about its own position, but also delivers presen-tation content that is viable in the current area, i.e. arrows that indicate the walkingdirection for a specific route or a time table for the nearest bus station. These presen-tations consist of different nodes, which can contain textual information or graphical

86 RELATED WORK
representations. A specially designed protocol repeats important presentation nodes,i.e. nodes at the start of a presentation, more often than unimportant ones. In thatway, the probability that the mobile device of a moving user has received the start ofa presentation is increased. As the user stays longer in the instrumented environment,additional presentation information will eventually be received by the mobile device(cf. [Wahlster et al., 2001, Bartelmus, 2002, Baus, 2003]).
Thermal Based
Any object with a temperature above absolute zero emits electromagnetic waves. Thewavelength and thus the frequency of that radiation depends on the temperature ofthe object. Objects within a temperature between 0°C to 70°C lie within the rangeof infrared light and can thus be picked up by infrared sensors. As indicated inSection 2.3.3, this effect can be used for passive positioning systems.
Hauschildt et al.: ThILo In [Hauschildt and Kirchhof, 2010, Kirchhof, 2011]such a Thermal Infrared Localization (ThILo) method is described. The authors usearrays of so-called thermopiles as sensors, which measure the difference betweenambient radiation and object radiation. Each array has a resolution of 8 pixels andeach pixel has a field of view of 6 degrees. A room is instrumented with two arrays ateach corner. In theory, a person can be localized by using the direction of the pixelswith the highest measured temperature difference in each corner and then perform-ing a triangulation. In practice however, additional heat sources also influence themeasurements.
The authors developed a semi-automatic system calibration, during which a humanhas to walk through the room and is advised by the system to stop at random points.The system takes repeated measurements during those stops and constructs a systemof non-linear equations. The solution to the equation system is approximated withthe Newton-Raphson method and results in position estimations for each stop.
In order to track multiple targets, a Probability Hypothesis Density (PHD) filter wasimplemented, which is basically an extension of particle filters (see Section 2.6.2).The system was evaluated in a 4.9 meters by 6.2 meters room without disturbingheat sources. One or two persons walked along predefined shapes (rectangles, diag-onal) and the minimum and maximum distance to these tracks were measured. Withone person in the room, the accuracy was between 9 centimeters and 26 centime-ters. With two people it was between 12 and 68 centimeters. The authors concludethat background radiation and reflection are still issues to work on but the overallresults so far are promising. Being a passive system, ThILo is an offboard/exocentricpositioning system.

3.1 POSITIONING WITH A SINGLE SENSOR TECHNOLOGY 87
(a) An example QR-code (b) A simple ARToolkit-marker
(c) An unobtrusive AR-marker byString Labs Ltd
(d) A 3D model of a shoe rendered over the detectedmarker
(e) Optical markers as usedin motion capturing
Figure 3.3: Some examples of optical markers.
3.1.6.2 Camera Based
Cameras are used for surveillance purposes for decades. As they do not only pro-vide positional information but also a plethora of other information, e.g. activity,gender, body language, they are perceived as a high breach in privacy. Although theautomatic analysis of images is a very complex task, the sheer possibility to recordimages or video-clips for later manual or human-assisted evaluation is seen as beingproblematic. Nonetheless, surveillance cameras are often installed and accepted inpublic places, shops and high security areas, with the premise that recorded imageryis only analyzed with a reasonable ground for suspecting. However, the ability toautomatically extract person identification, movement patterns and activities refuelsthe discussions about public surveillance cameras.
As indicated, this automatic data-extraction is a highly complex task and in position-ing systems with cooperative users, this task can be simplified by the use of so-calledoptical markers. These markers are easy to detect and to identify by computers andcan even store additional information. A common example is the QR code (QuickResponse code), which basically is a two-dimensional barcode (see Figure 3.3a for an

88 RELATED WORK
example). Such a QR code can contain up to 2,953 bytes plus error correction codesand can thus be used to store position information or URLs. Figure 3.3b shows amarker, which is used by the ARToolkit ([Kato and Billinghurst, 1999]). The AR-Toolkit can derive orientation and distance of such a marker in relation to a camera.Users with one or more markers attached to their clothing can thus be positioned veryeasily in an exocentric fashion.
If the size, position and orientation of such a marker in a room is known, the AR-Toolkit can be used to derive the distance and orientation of the camera relative tothe marker. In [Piekarski et al., 2003] an egocentric positioning system is described,where a user equipped with rear, front and head cameras is positioned by using AR-Toolkit markers. They report a position accuracy between 10 and 20 centimeters, butthe approach is hardly practical.
Figure 3.3c is also an optical marker, although it looks like a regular picture. To con-struct these types of markers, several methods exist. Machine-readable informationcan be incorporated into regular pictures in such a way that they are not attracting theattention of an observer (e.g. Mircosoft Tag11 and DataGlyphs [Hecht, 1994]). An-other method is to analyze pictures in preprocessing step to identify unique featuresthat can be easily recognized (e.g. Bookmarkr [Henze and Boll, 2008] and Map-Snapper [Hare et al., 2008]). The marker in Figure 3.3c is of the latter type and istied to a specific iPhone application12 that can identify the marker. By determiningthe marker’s position and orientation relative to the phone-camera, the applicationrenders a 3D model of a shoe at the markers position (see Figure 3.3d; the URL tothe application is also stored in the QR code in Figure 3.3a).
For motion capturing, which is often applied to capture movements of an actor inorder to simulate these movements with computer-generated graphics, simple lightglobes attached to a body-suit are often used as optical markers (see Figure 3.3e). Ingeneral, optical markers, which can be used as reference points, are called fiducials,fiducial points or fiducial markers.
Herranz et al. In [Herranz et al., 2011] an onboard/egocentric positioning sys-tem is described, which uses LED based markers deployed into the environmentas senders and a camera worn by the user as sensor. The LED senders sequentiallyflash in the visual spectrum. The synchronization of this flashing is done via wirelessconnections and the positions of the LED senders are known to the positioning sys-tem. The worn camera detects these flashes and takes the brightest detected pixel asa starting point for a sub-pixel analysis process, which estimates pixel coordinates ofeach detected LED sender. The system tries to determine the position of the camera
11http://www.microsoft.com/tag/12available at http://poweredbystring.com/showcase

3.1 POSITIONING WITH A SINGLE SENSOR TECHNOLOGY 89
through the use of a particle filter, where the system state represents the position,orientation and their derivatives, the prediction model contains a pinhole model ofthe camera and the pixel coordinates of detected flashes are used as measurements.
The authors evaluated their system using a circular motion, but instead of movingthe camera, they rotated eight LED senders around the fixed camera. Although thisis not the intended use of the system, the authors argue that this will provide them abetter ground-truth and will reduce the effect of changing lighting conditions. Themeasurements were then evaluated in a simulation, to vary different parameters, likenumber of used senders, different camera frame-rates and amount of simulated mea-surement noise. The reported accuracy lies between 6 and 31 millimeters, wherethe best result was obtained with 300 frames-per-second and 8 senders. In a sec-ond experiment, the authors simulated movements in a room of 5×5 square-meters.The simulated accuracy was between 173 millimeters (with 10 senders) and 62 mil-limeters (with 30 senders). Although these results seem promising, real-life effectslike obstruction of the senders and changing lighting conditions are not taken intoaccount. Furthermore, the system was not tested on a mobile device.
Ruotsalainen et al. In [Ruotsalainen et al., 2011] an algorithm is described thatuses the camera of a smart phone to deduce the heading direction of a user. Thebasic idea is to use standard algorithms for edge detection and to derive vanishingpoints from extracted lines that follow the detected edges. These vanishing pointsare used as features, whose camera coordinates can be determined. Through the useof a camera model, rotation of the camera relative to the vanishing points can becomputed.
The authors tested the proposed algorithm by mounting a smart phone on a station-ary platform that allowed orientation changes only on the x-axis. The phone wasturned in 5-degree steps and pictures were taken at each step while completing acomplete 360 degrees turn. The taken photographs were processed on a desktop PCusing Matlab. The experiment was conducted in two different corridors. The mea-sured mean error in the first corridor was 1.3 degrees and 1.8 degrees in the second.However, the authors admit that when the camera was turned into a scene with onlya plane, a wall and an elevator door, the algorithm failed. The authors conclude thatthe proposed algorithm works well in corridors and outperforms the built-in com-pass, which showed a mean error of 18.1 degrees in the same test environment. Therequired computations could be performed with a 1 Hz rate on a desktop PC and stillhave to be adapted for smart phones.
Dettori In his diploma thesis [Dettori, 2008] developed an offboard/exocentric po-sitioning system using a stereo-camera approach. Two off-the-shelf web-cams are

90 RELATED WORK
deployed at a wall with a distance of about one meter (the exact distance can be spec-ified in the system). The two resulting images are analyzed for corresponding parts,such that a correlation of both images can be computed. Through camera models,the camera-based coordinates of each pixel can be translated into a world-coordinatesystem and the distance from the camera to different object can be approximatedby triangulation. Movements can be detected by an analysis of the optical flow, i.e.the observation of differences in successive images. The system assumes that onlyone person is in the room and matches the observed optical flow with a coarse bodymodel, consisting of a torso and head. For the actual position determination, an ex-tended Kalman filter is used, where the position state contains the world-coordinatesof the body model and its rotation as well as its rotation velocity and movement ve-locity. The movement velocity can be derived from the optical flow. To approximatethe rotation and rotation velocity of a body, which are hard to extract from images,the variance of the observed shoulder-length was used. Since this observation canlead to two solutions (if the observed shoulder length changes, it could be a rotationto the left or right), a second state vector was constructed, which acted as secondhypothesis. The state vector with the highest mean probability was assumed to bethe correct one. First tests showed an accuracy of 5 to 10 centimeters in a 5×6square-meter room.
3.1.6.3 Laser-Range Positioning
A laser-range scanner is an example for a sender/sensor combination as described inSection 2.3.2.3. Typically such a device sends out a short laser-pulse in a specificdirection and measures the time of flight until the reflection of the pulse returns.A laser-range scanner thus can derive the distance to the next reflecting object in aspecific direction. By using several lasers aimed at different angles or by rotating thelaser, a laser-range scanner can determine a two- or even three-dimensional distance-map of its surroundings. Systems that follow this approach are called LIDAR, forLIght Detection And Ranging, or more specifically LADAR, for LAser Detectionand Ranging.
In robotic applications, laser-range scanners are often used to detect obstacles orfor determining the robot’s position. The latter can be achieved with the help of astored depth-map of a level in a building. A robot, which is equipped with a laser-range scanner, takes distance measurements from its current position and tries to findpositions on the map that coincide with the measurements. With the help of a particlefilter (see Section 2.6.2), these hypothetical positions are constantly tested as therobot moves along, eventually leading to one position. Figure 3.4 shows an exampleof such a laser-range based robot-positioning: (a) shows the initial state, where theparticles are uniformly distributed over the depth map. (b) shows the state after a first

3.1 POSITIONING WITH A SINGLE SENSOR TECHNOLOGY 91
(a) Initial situation (b) After first set of measurements
(c) After several sets of measure-ments
Figure 3.4: Robot positioning with a laser-range scanner ([Fox et al., 2001]).
set of distance measurements has been taken. Several hypothetical positions are leftand two larger particle clouds indicate that the robot cannot yet decide which roomit currently enters. (c) after several sets of measurements (while moving), only oneparticle cloud is left (cf. [Fox et al., 2001]).
The same principle is theoretically possible for personal positioning, however car-rying a laser-range scanner is rather inconvenient and the non-steady height of thescanner while walking adds to the inaccuracies of the approach. As it was the casewith passive RFID readers, laser-range scanners can be used to instrument applianceslike wheelchairs, shopping trolleys or walking aids.
Rofer et al.: iWalker & Rolland At the Bremen Ambient Assisted Living Lab(BAALL), which is located at the German Research Center for Artificial Intelli-gence (DFKI) in Bremen, two appliances were instrumented with laser-range scan-ners: a walking aid, named iWalker, and an electric-powered wheelchair, namedRolland. The iWalker is based on an off-the-shelf walking aid (depicted in Fig-ure 3.5a), which was upgraded with a laser-range scanner, electric brakes and wheelencoders ([Rofer et al., 2009a]). Rolland (shown in Figure 3.5b) is based on a com-mercially available, electric-powered wheelchair and was additionally equipped with

92 RELATED WORK
(a) iWalker (b) Rolland
Figure 3.5: Two appliances equipped with laser-range scanners where developed inBAALL at DFKI in Bremen.
two laser-range scanners: one at the front and one at the back of the chair. For bothappliances, the laser-range scanners are mainly used to avoid obstacles on the way.This is achieved by building so-called local obstacle maps or occupancy grids. Sucha map is quadratic array of cells, in which probabilities are stored that express the cer-tainty of a possible obstacle. These maps are constantly updated by the laser-rangescanners.
In the case of iWalker, which is manually pushed by a user, the detection of a nearbyobstacle causes the walker to slightly brake one wheel. This braking automaticallyleads to a change of direction and helps the user to avoid the obstacle while givingthem a tactile feedback at the same time. In the case of Rolland, the same principleis used, although the wheelchair is not manually powered but moved via an electricmotor and can be steered by a joystick or, as described in [Rofer et al., 2009b], bya proportional head-joystick. Rolland assists the user in controlling the wheelchairby constantly monitoring for obstacles. If an obstacle is detected that lies on thepredicted trajectory, Rolland adjusts the user given controls to help avoiding the ob-stacle. If the current control input indicates that the user is already trying to avoid theobstacle in a specific direction, Rolland will reinforce the current steering command.
Nakashima et al.: CoBIT The CyberAssist project, which was conducted at theCyber Assist Research Center at the National Institute of Advanced Industrial Sci-ence and Technology (AIST) in Japan, focused on human-centered information sys-tems ([Nakashima and Hasida, 2010]). During the project several iterations of abattery-less user device where developed, which should provide the user with lo-cation based information.

3.1 POSITIONING WITH A SINGLE SENSOR TECHNOLOGY 93
(a) Conceptual draft of MyButton. (b) CoBIT
(c) Aimulet
Figure 3.6: In the CyberAssist project several user devices were developed to enablehuman-centered information systems ([Nakashima, 2007]).
Figure 3.6a shows a draft of such a device, called MyButton, which was equippedwith reflectors, a photo detector, a speaker and a microphone as well as with a com-mand button and a fingerprint recognizer. This device, and the devices that followed,should be worn as earpieces by the users. In order to provide information to theusers and to determine their position (in an offboard/exocentric fashion), base sta-tions called i-lidar were deployed in the environment. A first prototype of these basestations contained an infrared laser that could be steered by mirrors. When the laserwas aimed at the reflector of the MyButton, the direction and distance to the basestation and thus the position could be derived. The authors report, that they could de-termine the position within an accuracy of millimeters, but four seconds of scanningtime were needed to find a MyButton.
In order to improve the time-resolution of the positioning, the i-lidar stations wereupgraded with infrared cameras, with which the direction of a MyButton could bedetected. The infrared laser could then directly aim at the reflector of a MyBut-ton and determine the distance. With this approach a positioning accuracy within1 centimeter was achieved ([Itoh et al., 2003]). Although the accuracy is extremelyhigh, the authors admit that the needed laser costs ten million Yen (about 100,000Euro) and not even mass-production will bring the costs below one million Yen([Nakashima and Hasida, 2010]). The infrared cameras were not only used for de-termining the direction of a MyButton, they could also receive data from the device.

94 RELATED WORK
One of the reflectors of MyButton could be electronically switched between translu-cency and reflection. Through this mechanism, information could be transmitted bymanipulating the reflections of an incoming infrared light-beam. Information wastransmitted to a MyButton by sending out an infrared light-beam, onto which infor-mation was modulated by changing the intensity of the beam.
Figure 3.6b shows the first integrated version of the MyButton concept, whichwas called CoBIT, as abbreviation for Compact Battery-less Information Terminal.CoBIT contained a solar cell, which simultaneously provided the needed energyand was capable of decoding the intensity-modulations of an incoming light beam([Nakamura et al., 2003]).
A low-cost and ecological version of CoBIT is shown in Figure 3.6c. It is calledAimulet and its housing is made out of bamboo. Aimulets were given away for free atthe Expo 2005 in Japan, where the system was successfully demonstrated, althoughpositioning was abandoned because of privacy considerations ([Nakashima, 2007]).
3.1.6.4 Optical Positioning in Gaming Consoles
Although cameras at home are perceived as a privacy violation, they seem to be ac-cepted in conjunction with gaming consoles. For Sony’s PlayStation 213 an accessorywas available, which was called EyeToy. EyeToy was basically an USB webcam andgames mostly used simple algorithms based on the difference of subsequential im-age frames to detect motion and coarse user positions. With the start of Nintendo’sWii14 console in 2006, a change from the traditional gamepads to a motion-basedinterface took place. Nintendo’s controller, called the WiiMote, includes an infraredcamera that tracks blobs created by infrared LEDs, which are attached to the user’sTV screen. Since the original distance of the LEDs between each other and their ori-entations is known, a coarse distance and orientation approximation of the user-heldinfrared camera can be accomplished. In addition the WiiMote also contains ac-celerometers and can be further equipped with a three-axis gyroscope, which allowsfor a more fine-grained estimation of the user’s movements. Since the WiiMote doesmost of the calculations itself, it can be classified as an onboard/egocentric system,although its main purpose is not really positioning, but movement detection.
In 2009, Sony introduced its own motion control for the PlayStation 3, calledPlayStation Move. The Move controller is equipped with a glowing orb at the top,which is illuminated by RGB LEDs. This globe acts as an optical marker, which istracked by a camera, the PlayStation Eye, which is directly connected to the gamingconsole. With the help of the camera, the gaming console determines which colors
13http://us.playstation.com/ps2/14http://wii.nintendo.com

3.1 POSITIONING WITH A SINGLE SENSOR TECHNOLOGY 95
are prominent in the current view and chooses a specific color for the glowing orb,which helps to detect and track the Move controller. Additionally, the Move con-troller is equipped with accelerometers, angular rate sensors and a magnetometer.The PlayStation Move can be classified as an offboard/exocentric system and as it isthe case with the WiiMote, its main purpose is to determine movement.
Microsoft’s solution for motion control for the XBox 36015 differs from the otherapproaches in that it does not need any user-held devices. The system was releasedin 2010 and consists of a device, called Kinect camera, which is placed above orbelow the TV screen. The Kinect camera contains an RGB camera as well as aninfrared-laser projector and a matching infrared-camera. The infrared-laser projects aregular pattern of dots into the environment, which are in turn detected by the infraredcamera. Since the system has a model of the pattern, it can infer depth informationby analyzing the pattern-distortions observed in the image of the infrared camera.The acquired depth information can be combined with the image of the RGB cameraand further image processing can be used to derive body postures and positions. Inaddition, the Kinect device also has a microphone array and can be automaticallytilted through electrical motors.
Because all three devices contain a broad array of sensors and are comparably cheap,they are often used in hobbyist and scientific projects.
3.1.7 Terrestrial Radio & TV Broadcast Based
Terrestrial Radio Broadcast infrastructures, as used for radio and television, can alsobe used for opportunistic positioning systems.
Rabinowitz et al. In [Rabinowitz and Spilker, 2005], a system is described thatuses the embedded synchronization signals of digital television (DTV) broadcasts.The system was designed for DTV signals as specified by the American TelevisionStandard Committee (ATSC), but the authors claim that other DTV standards such asDigital Video Broadcast (DVB) in Europe or Integrated Services Digital Broadcast(ISDB) in Japan could be used for accurate positioning. The proposed positioningsystem needs so-called Monitor Units at known positions, which monitor TV sta-tion timing-offsets. These timing-offsets are needed for the position determination.According to the authors, the positioning can either be onboard, where the MonitorUnits provide the offset data to the mobile device, much like in DGPS, or offboardon the Monitor Units, where the mobile device has to send its measurements to theMonitor Units. A third alternative would be to alter the TV transmission protocols
15http://www.xbox.com/

96 RELATED WORK
Figure 3.7: The sensor equipment used for FM-radio-based positioning([Moghtadaiee et al., 2011]).
in such a way, that they incorporate the needed clock offsets. The positioning algo-rithm uses pseudo-range measurements to at least three TV transmitters with knownpositions and applies a trilateration approach. The authors tested the accuracy oftheir system in different environments: in an outdoor park a mean position-error of3.2 meters was measured. In several indoor scenarios, the measured mean-error wasbetween 10.3 meters and 23.3 meters. In a parking garage, the measured mean errorwas 12.3 meters.
Moghtadaiee et al. In [Moghtadaiee et al., 2011], a positioning approach is de-scribed, which uses signal-strength fingerprinting on FM (Frequency Modulated)radio-broadcast signals. In this system, fingerprints consist of a vector of signalstrengths for a number of different FM radio channels. An evaluation was performedin the fourth floor of a multistory building, which consisted of seven rooms on 11×23square-meters. A total of 150 reference points was taken during the offline phase,where 120 measurements within 12 seconds were taken for each reference point.The fingerprints consisted of 17 signal-strength values for 17 different FM radiochannels, covering a frequency range between 88 MHz und 108 MHz. Figure 3.7shows the used sensor equipment, consisting of a Linux based radio receiver anda ‘rabbit ear’ antenna. 28 fixed test-points where defined in the test bed, at whichthe accuracy of the onboard/egocentric positioning system was tested, using threedifferent approaches: simple nearest neighbor (NN), k-nearest neighbor (kNN) andk-weighted nearest neighbor (kWNN). With NN a mean distance error of 3.29 meterswas achieved. The kNN approach reduced the error to 3.09 meters and the kWNNperformed best with 2.96 meters.

3.1 POSITIONING WITH A SINGLE SENSOR TECHNOLOGY 97
3.1.8 Magnetic Based
Magnetic compasses use the Earth’s magnetic field to determine magnetic north. Al-though a compass does not directly determine its position, it can be seen as an oppor-tunistic heading device. Modern smart phones are often equipped with magnetome-ters, which are usually used as an electronic compass to determine the orientation ofthe device or the current heading of its user. The magnetometer can also be used forposition determination, e.g. by using the Earth’s magnetic field or by instrumentingthe environment with artificial magnetic fields.
Storms et al. An example of the first method is given in [Storms et al., 2010],which relies on the fact that the Earth’s magnetic field varies depending on the cur-rent position. In essence, the same method is used as was described in Section 3.1.6.3for robot positioning with laser-range scanners, but instead of a depth map, a mapcontaining magnetic-field measurements is used, and instead of laser-range scanner,three-axis magnetic field sensors are used. A particle filter combines inertial mea-surements (see Section 3.2) with magnetic-field measurements.
The authors tested their approach in two connected, narrow corridors in their lab.For the creation of the magnetic-field map and the positioning experiment itself, themagnetic-field sensors were installed onto a non-ferrous vehicle, which was pushedtrough the corridors. To determine the position accuracy, the vehicle was pushedalong a predefined trajectory along the right side of both corridors. The authorsreport a maximum error distance of 60 centimeters and ’less than 0.2 meters forthe majority of the trajectory’. Since the generation of a magnetic-field map is acomplex task, the authors conducted a second, simulated experiment, in which afirst vehicle drives along a random path while collecting magnetic-field data, and asecond vehicle tries to follow the trajectory of the first one as closely as possibleusing the collected magnetic-field data. The reported accuracy lie is 0.3 meters,however the second vehicle seemed to have problems following the turn of the firstvehicle, when driving from one corridor into the other. The authors conclude thatpositioning with magnetic-field sensors is promising, but admit that the sensors arehighly sensitive to changing conditions, for example the way the connector cable isattached to the sensor, and that the stability of the magnetic field over time has to befurther investigated.
Blankenbach et al. In [Blankenbach et al., 2011], an outline for an instrumentedpositioning system using artificial magnetic fields is given. The proposed system iscalled MILPS, which stands for Magnetic Indoor Local Positioning System. The ba-sic idea is to deploy electrical coils in a building, which are activated sequentially. A

98 RELATED WORK
mobile device can then derive its own position by determining the distance to threecoils and performing trilateration. The authors conducted some initial tests with adirect current (DC) powered magnetic coil, with a diameter of 50 centimeters and140 turns of wire. The coil was powered with 15 Ampere and measurements weretaken with a three-axis magnetometer. To overcome interference problems, the coil’scurrent-direction was reversed in defined time intervals, thus interferences with alower frequency than the field-changing frequency could be filtered out. Measure-ments showed that the magnetic field of the coil could be detected at distances upto 16 meters, with up to four walls between the coil and the sensor. The distancebetween the coil and the sensor was approximated using the measured field strength.At distances under 6 meters, the accuracy of the approximated distance was between4 and 7 centimeters. The authors conclude, that artificial magnetic fields provide ex-cellent characteristics for penetrating objects, but further experiments and improve-ments have to be made to approximate distances greater than 10 meters away from acoil.
3.1.9 Ultra-Wideband (UWB) Based
Electromagnetic based communications protocols, as discussed so far, use a narrowfrequency-bandwidth, usually in the range of a few Megahertz. In narrowband com-munication systems, a carrier-frequency is chosen onto which information is modu-lated. Ultra-WideBand (UWB) differs from this approach, in that communication isaccomplished by sending carrierless, short-duration signal pulses, which last in therange of pico- or nanoseconds. The ratio of the time that a signal is present to thetotal transmission time is very low, thus the overall transmission power is very low incomparison to narrowband communication. By definition of the Federal Communi-cations Commission (FCC), UWB signals must have a frequency-bandwidth of morethan 500 MHz (in comparison, WiFi has a frequency-bandwidth of 22 MHz). Be-cause of the high frequency-bandwidth, a very high data-rate can be achieved. How-ever, the FCC has limited the allowed transmission power and thus only ranges of upto 10 meters can be achieved. The IEEE 802.15.3a working group tried to establishan UWB standard for Wireless Personal Area Networks (WPAN), but the group wasdissolved in 2006, due to disagreements over two technology proposals. However,another working group has specified IEEE 802.15.4a16, which specifies alternativephysical layers for 802.15.4, one of which is based on UWB (cf. [Nekoogar, 2011],pp. 2–24).
For positioning applications, the high frequency-bandwidth is supposed to grant ahigh signal-penetration through different materials, and thus tackles the problem of
16http://www.ieee802.org/15/pub/TG4a.html

3.1 POSITIONING WITH A SINGLE SENSOR TECHNOLOGY 99
signal fading. As a generic electromagnetic wave based communication, the samepositioning approaches can be used as with cell phones or WiFi, e.g. proximity,AOA, TOA, TDOA, signal strength and RSS fingerprinting.
Ubisense Ubisense17 is a commercially available offboard/exocentric positioningsystem, which is based on UWB. Objects or persons are equipped with a proprietarytag, called the Ubitag, which contains a UWB sender. UWB sensors, called Ubisen-sors, are installed in the environment at known positions and are connected to eachother via Ethernet. The Ubisensors are organized in cells of four to seven sensors,where one cell acts as master. Both, Ubitags and Ubisensors, are also capable of ex-changing data via conventional narrow-band radio. The master sensors synchronizethe measurements of several Ubitags, i.e. they provide a timing-schedule in whicheach Ubitag is assigned a specific time-slot. In these time-slots, Ubitags send their IDvia narrow-band and emit UWB pulse sequence. The tags’ positions are determinedby a combination of TOA and TDOA measurements and thus only two Ubisensormeasurements are needed to obtain a position. The manufacturer claims an accuracyof 15 centimeters for the system ([Steggles and Gschwind, 2005]).
Stephan et al.: Real World Evaluation [Stephan et al., 2009] tested the accuracyof Ubisense at the SmartFactoryKL, which is a multi-vendor research, developmentand demonstration center for industrial information and communication technologylocated in Kaiserslautern, Germany. The SmartFactoryKL contains a complete pro-duction facility, which includes many metal structures, piping and glass vessels be-sides the heavy machinery. The authors tested the system in two different conditions:an optimal condition, in which no obstacles and no radio interferences were present,and a realistic scenario, which was conducted on the shop-floor of the factory. Ref-erence points where determined with an accuracy of±2 millimeters in order to setupthe system and to have references to test the positions determined by Ubisense. Un-der optimal conditions, Ubisense’s position accuracy was in the range between 12.8and 24.4 centimeters, and thus approximately in the range that was specified by themanufacturer. Under realistic conditions however, the position accuracy fluctuatedbetween 35.1 centimeters and 124.3 centimeters.
3.1.10 Capacitance Based
Capacity based systems use an effect that is best known from a musical instrumentcalled the Theremin (or aetherophone), which is played without touching the instru-
17http://www.ubisense.net18http://kvraudio.com/

100 RELATED WORK
(a) Leon Theremin playing his instru-ment18
(b) SenseFloor can detect single footsteps19.
Figure 3.8: Capacitance based interfaces as used in the beginning of the 20th century(a) and the beginning of the 21st century (b).
ment itself. The Theremin was invented by the Russian Professor Leon Theremin inthe first half of the 20th century and basically consists of a variable capacitor, wherean antenna is used as one plate of the capacitor while the other is provided by onehand of the player. Figure 3.8a shows Leon Theremin playing his own instrument.The proximity of the player’s hand (or whole body), changes the capacitor’s capaci-tance, which is the case of the Theremin is used to change the frequency of an oscil-lator circuit. The resulting frequency directly correlates to the distance of the user’snearest body part, i.e. the smaller the distance, the higher the frequency. However,the user has to be in close proximity (in the range of 1 meter) to the antenna.
Endres et al. [Endres et al., 2011] describe an initial study on how a capacity-based circuit can be used to detect and classify one-finger gestures in an automo-tive context. In this study a modified Theremin, called the Geremin, was used andthe produced sounds where sampled with an analog-to-digital converter before fur-ther signal processing was applied, i.e. the determination of the frequency and thefrequency-changes of subsequent measurements. Although only one antenna wasused in the experiment, simple gestures like finger up, down, left, right and drawingrectangles into the air could be recognized with ≈70% accuracy.
SenseFloor The SenseFloor19, manufactured by Future-Shape10 (see also Sec-tion 3.1.5), uses the same principle for position determination. To cope with the
19http://www.future-shape.com/en/technologies/23/sensfloor

3.1 POSITIONING WITH A SINGLE SENSOR TECHNOLOGY 101
problem of the needed proximity to the antenna, they designed a textile underlay thatcontains 32 capacitance-based proximity sensors per square meter. Each sensor com-municates its measurements to a control unit, which can then determine where peopleare standing or lying. Information about walking direction and moving velocity canbe derived as well as how many people are currently present on the instrumentedfloor. The underlay can be installed beneath PVC, laminate or carpets and is mainlyintended for the use in Ambient Assisted Living.
Touchscreens, such as used in most modern smart phones, can also be built usingcapacitance measurements, although here the direct touch of the user is requiredand usually also desired. The PointScreen, developed by Fraunhofer Institute forIntelligent Analysis and Information Systems20 (IAIS), uses the Theremin principleand allows users to interact with a screen without touching it.
3.1.11 Wireless Sensor Networks (WSN)
Wireless Sensor Networks (WSN) consist of a number of self-powered nodes, whereeach node contains one or more sensors as well as data-processing and communi-cation capabilities. The nodes can build ad-hoc networks over wireless commu-nication and thus sensor information can be exchanged. Because of the ability ofbuilding ad-hoc networks, WSNs can be deployed on demand by scattering sen-sor nodes in an area of interest. This makes them valuable for military opera-tions as well as for environmental and health applications ([Pottie and Kaiser, 2000],[Akyildiz et al., 2002]). A number of different standards and commercial sensornodes are available. Among the most well known is the ZigBee21 standard, whichis based on IEEE 802.15.4 (see also Section 3.1.9). For wireless communication theZigBee standard uses narrow-band transmission on the 2.4 GHz as well as the 915MHz (Americas) and 868 MHz (Europe) frequency bands. Compared to other wire-less communication protocols, the data rate is considerably low and ranges from 20Kbits/s to 250 Kbits/s. The transmission distance between two nodes ranges from 10meters to 1,600 meters and depends on the power output of the nodes as well as onenvironmental conditions.
Kuflik et al. In the PIL project (Personal experience with active cultural her-itage IsraeL), an integrated framework for multimedia museum-guides was de-veloped, which takes visitor positions as well as group interactions into account([Kuflik et al., 2011b]). An offboard/egocentric positioning system was developedand deployed in the Hecht museum in Haifa, Israel. A WSN based approach was
20http://www.iais.fraunhofer.de/21http://www.zigbee.org/

102 RELATED WORK
(a) A PIL blind (b) A PIL beacon (c) A PIL bridge node
Figure 3.9: The WSN in the Hecht museum consists of blinds (a), stationary beacons(b) and bridge nodes (c) ([Dim et al., 2011])
chosen, where the nodes consist of stationary beacon nodes and mobile nodes, whichare called blinds and are worn by the visitors. A third kind of nodes is used to bridgethe wireless communication of the nodes into a TCP network. The nodes are shownin Figure 3.9b. They were manufactured by the Italian company Tretec22 and operateon the 2.4 GHz frequency band. The blinds can detect the presence of beacon nodesas well as the presence of other blinds, which is important to derive group interac-tions. Furthermore, the blinds contain accelerometers as well as a magnetometer,to determine a visitor’s orientation, and can measure voice level and activity. Eachblind sends its measurements via the bridge nodes to a centralized server, where thepositioning estimation is accomplished by analyzing the sensed stationary beacons,which are placed at the entrance and exits as well as on selected exhibits. The send-ing range of each beacon was adjusted manually to minimize interference. The de-termined position (and group information) is sent back to the visitor’s mobile device,where a multimedia museum-guide is running, which adapts its presentation accord-ing to the visitor’s position. In locations where two exhibits were too close to eachother to be discriminated by the system, visitors were presented with a choosing dia-log on their mobile electronic museum guide. According to the authors, a positioningaccuracy of 1.5 to 2 meters could be achieved, which in this context means that a vis-itor could be detected as being interested in an instrumented exhibit, if they are in therange of 1.5 to 2 meters of that exhibit ([Kuflik et al., 2011a], [Dim et al., 2011]).
Rosa et al. In [Rosa et al., 2011] a positioning method is proposed, in which WiFienabled devices, such as mobile phones, laptops or desktop PCs, act as sensor nodes.The derived position is relative to all other sensed devices, i.e. the position is rep-resented as a coordinate system in which the user is assumed to be at the origin andall other sensed devices are shown at their estimated position relative to the user. Ascreenshot of the running application is depicted in Figure 3.10a, here three devices
22http://www.3tec.it/

3.1 POSITIONING WITH A SINGLE SENSOR TECHNOLOGY 103
(a) A screenshot of the implementation on aNokia N900
(b) A realtive-position map showing the real posi-tions as well ([Rosa et al., 2011])
Figure 3.10: Relative positioning using WiFi ad-hoc connections([Rosa et al., 2011]).
were detected an positioned. Figure 3.10b shows an evaluation for 5 devices, wherealso the real position for each device is depicted. The system works by taking signalstrength measurements for each detected WiFi device. As the signal strength onlygives an indication of the distance to the detected device, the application asks usersto perform three scans at three different positions: one to their left, one in front andone to their right. In a calibration process, an empirical path-loss model was cre-ated, which is used to approximate the distance to each sensed device based on thereceived signal strength. The position of each device is then estimated by trilatera-tion. The authors evaluated their system using 5 detectable devices in a classroomscenario. The position accuracy highly depended on the maximum distance to themeasuring device. Results were best in a range up to 5 meters, where an accuracyof a few meters could be achieved (no exact numbers are given in the paper). Theauthors also report, that the orientation of the measuring device as well as the hand-grip of the user have a high impact on the measured signal strength and thus on theaccuracy of their system.
3.1.12 Sound Based
Sound is a mechanical wave that is transmitted in a medium, like gas, liquid or asolid. Human perceptible sound lies in the range of 20 Hz to 20 kHz. Sound withfrequencies higher than 20 kHz is called ultrasound, sound below 20 Hz is calledinfrasound. In general, the same principles as for electromagnetic waves can be ap-plied, i.e. signal strength can be measured as sound pressure level, angle of arrivalof sound waves can be determined and sound traversal times can be measured. The

104 RELATED WORK
speed of sound through air is approximately 1,236 km/h, which is very low in com-parison to the speed of light (exactly 299,792.458 km/h in vacuum). Due to this lowspeed, TOA measurements, even on low distances, can be made with lower accu-racy clocks than in the case of radio signals. An easy way to determine the distanced between a sender and a receiver is by simultaneously sending a sound pulse andan electromagnetic pulse, and measuring the time difference ∆t between receivingthe electromagnetic pulse and receiving the sound pulse. The distance to the signalsource can then be determined by
d =∆t c vsc− vs
(3.1)
where c is the speed of light and vs is the speed of sound. However, the speed ofsound highly depends on the current temperature of air, which has to be taken intoaccount for precise measurements. In practice, the calculation if often simplified byassuming that the electromagnetic pulse is received instantaneously and thus the mea-sured time difference is treated as the direct TOA of the sound pulse. This methodis also called the thunderstorm principle, as it can be applied to approximate the dis-tance of an observer to a thunderstorm by counting the seconds between perceivinglightning and perceiving thunder.
3.1.12.1 Ultrasound Based
Machine-readable information can be transmitted using sound waves by the samemethods that are used for electromagnetic waves, e.g. by modulating on a carrierfrequency or sending short pulses. Examples of such sound based, machine read-able transmissions in the audible frequency range are fax machine transmissions overphone lines or MOdulator/DEModulators (MoDem), which where commonly usedbefore the introduction of ISDN or DSL to connect to computer networks. Becausethe sound of such a transmission is rather unpleasant, ultrasound frequencies are pre-ferred when applicable.
Ward et al.: UltraBat One of the first ultrasound based positioning systems is de-scribed in [Ward et al., 1997, Ward, 1998, Harter et al., 1999, Addlesee et al., 2001]and ultimately led to an offboard/exocentric system called UltraBat. Users of thesystem have to wear tags, the so-called Bats, which can send out ultrasound signalsand can receive radio signals. Ultrasound sensors are installed in a dense grid on theceiling of an indoor environment, which can detect signals sent by an ultrasound tag.The sensors are wired to a server, which collects the sensor measurements and de-termines the position of each Bat via multilateration. The measurements are taken inrounds and each measurement process is started by the server, which synchronously

3.1 POSITIONING WITH A SINGLE SENSOR TECHNOLOGY 105
sends a reset signal to the sensors and emits a radio signal. A Bat that receives theradio signal immediately sends a short ultrasound pulse. The sensors measure thetime difference between the reset signal and the incoming of the ultrasound pulse.The server then calculates the distance of the Bat to each sensor using the thunder-storm principle, as the radio signal and the ultrasound pulse are not sent from thesame location. According to the authors, UltraBat achieves an accuracy in the rangeof 10 centimeters, but a high number of wired sensors has to be installed to achievethis precision and the position of each sensor has to be accurately determined (cf.[Baus, 2003]).
Baunach et al.: SNOWBAT [Baunach et al., 2007] present a positioning systemcalled SNOW BAT, which overcomes some of the high deployment efforts of the Ul-traBat system by using a WSN (see Section 3.1.11) instead of a wired node-network.The WSN consists of mobile nodes containing ultrasound senders and static nodescontaining ultrasound sensors. Both kinds of nodes are also equipped with temper-ature sensors, which are used to approximate the correct speed of sound given themeasured ambient temperature. The nodes communicate with each other throughradio transmissions using a protocol called SmartNet.
As it was the case with UltraBat, the static nodes are deployed into the environment,knowing their own position. If a mobile node wants to find out about its own position,it broadcasts a radio message containing an ID and a time period ∆t, which specifiesa time delay after which the node will send a series of ultrasonic pulses. Static nodesthat receive the radio message start a timer after the specified time delay ∆t andwait for the incoming ultrasound pulses. If a node receives the ultrasonic pulses, itaverages its measured TOA values over all incoming pulses and sends the computedvalue back to the mobile node. Static nodes that do not receive ultrasonic pulses stopmeasuring after a specified timeout-period.
The mobile node collects the incoming TOA measurements and determines its ownposition using multilateration. Since the position determination is calculated by themobile node itself with the help of sensors in the environment, SNOW BAT classifiesas an onboard/exocentric system. In order to calibrate the system, the static nodes areinstalled in the environment and a mobile node is brought to a number of referencepoints, which positions have to be exactly known. The static nodes then calculatetheir own positions, using the reversed approach that is later used for the positioningof mobile nodes. The authors claim a position accuracy of 15 millimeters, althoughthey do not specify how they evaluated their system nor how many static nodes wereused.
In [Runge et al., 2011], two calibration methods for SNOW BAT are presented. Thefirst method is called the Explorer algorithm, which starts with three already cal-

106 RELATED WORK
ibrated static nodes, i.e. the exact position of each calibrated node is known andstored in the nodes. A mobile node is then brought into a position in which it canreach the three calibrated nodes and can thus determine its own position. The mobilenode broadcasts its determined position and each uncalibrated node stores this posi-tion along with the distance measurement to that position. The mobile node is thenmoved along a predefined path, while keeping determining and broadcasting its ownpositions. Each uncalibrated node that has received at least three non-collinear posi-tions can determine its own position, and once calibrated helps to determine the nextposition of the mobile nodes. The authors remark that with this approach, calibrationerrors sum up over time, as an initial error will lead to imprecise calibrations of newnodes, which will in turn influence the position determination for the next nodes.The explorer algorithm can thus only be used in small areas, in order to minimize theerror propagation.
The second calibration method, called Distribute & Erase, can be applied on anynumber of nodes and in areas of any size. The area is roughly divided into large cellsand in each static node the area in which it is located is stored. Again, three staticnodes have to be exactly calibrated at the start of the algorithm. As in the Exploreralgorithm, a mobile node uses these three calibrated nodes to determine and broad-cast its own position but with the Distribute& Erase approach, the mobile node canbe moved arbitrarily. Uncalibrated nodes use the received positions of the mobilenode and their own distance measurements to iteratively adjust their own position.At the start, each uncalibrated node assumes to be in the center of its cell. With eachsubsequent measurement it adjusts its own position in order to minimize the distanceerror between the current measured distance and the reported position of the mobilenode. If the distance error falls below a threshold, the node is considered calibrated.The moving node only takes calibrated nodes into consideration for its position de-termination. The authors tested their calibration approach in an area with 11×11deployed static nodes (the size of the area is not given in the paper). With 1800 mea-surement steps, a calibration error less than one millimeter could be achieved, wherean additional filter was used to reject unreliable distance measurements. However,taking these 1800 measurements takes 15 hours in which the moving node’s posi-tion has to be changed every 10 seconds. The authors propose to use several movingnodes simultaneously to reduce that time. An evaluation of the position accuracy ofthe calibrated system is not given.
3.1.12.2 Speaker Positioning
Besides using ultrasound senders, audio based positioning can also be performed byusing natural, audible sound signals, e.g. sounds produced by working machines,or spoken words. One way to accomplish this, is to use microphone arrays, which

3.1 POSITIONING WITH A SINGLE SENSOR TECHNOLOGY 107
Figure 3.11: An example of a Global Coherence Field obtained by microphone ar-rays ([Brunelli et al., 2007]).
are deployed in the environment. Such microphone arrays can be used to derive theangle of arrival (AOA, see Section 2.5.2.1) of incoming sound signals, by analyzingthe delay with which a sound signal arrives at each microphone of the array.
The reversed approach, i.e. applying different delays on the measured signals of eachmicrophones before summing them, is called beamforming. Beamforming ampli-fies sounds coming from a specific direction, while attenuating sounds arriving fromother directions. Using beamforming, a room can be ‘scanned’ for possible positionsof speakers by subdividing the room in possible speaker positions through a grid anddirecting the beam at each grid-point. Note, that the directing of the beam is notmechanical, but purely computational, i.e. during a time-slice t the measurements ofeach microphone are stored and the result for each beam can then be computed fromthese measurements. The computed power of each beam’s output signal for eachpoint gives an indication of where a speaker (or other sound source) is positioned.The obtained power output measurements for each point of the grid can be repre-sented trough a power field or through a Global Coherence Field (GCF). In order toconstruct a GCF, a coherence measure for each pair of microphones is computed foreach point of the grid. The obtained coherence measures for each point are summedup and normalized by the number of used microphones (cf. [Omologo et al., 1998]).Figure 3.11 shows an example of such a CGF. The used microphone arrays are shownat the edge of the image. Single beams can be seen as bright lines and the brightestarea in the picture represents the most plausible position of an active sound source.The image is taken from [Brunelli et al., 2007], which is described in more detail inSection 3.3.6.
Feld et al.: In-car positioning In [Feld et al., 2010], a method based on speechaudio signals is described to position passengers inside a car, i.e. to determine which

108 RELATED WORK
person sits on which seat. This ‘in-car positioning’ provides viable information forpersonalization services, e.g. to adjust the seat according to the occupant’s prefer-ences or to enable speech commands like ‘open my window’. The proposed in-carpositioning method uses the fact that the number of possible positions of passengersin a car is highly restricted. Since each possible position is equipped with a micro-phone, which is useful for other in-car applications as well, positioning can be doneby directly monitoring the power of the output signal of each microphone, instead ofusing beamforming. The system uses directional microphones, which are installed infront of each seat. To protect the privacy of the user, an onboard/exocentric approachis used, in which the microphone signals – together with an indication of the seat atwhich it is installed – are sent to the mobile devices of the users. Each user’s mobiledevice contains a user profile, which includes a voice-print of the user, i.e. a modeldescribing characteristic features of the user’s voice. The mobile device is thus ableto compare incoming microphone signals with the voice-print of its owner and candetermine the correct seat. The mobile device can use this information, for exampleto adapt the ringtone in case the user is sitting in the drivers seat. Additionally, userscan specify whether they want to share their position information with the car. Thesystem was evaluated in a Mercedes R-Class with four installed microphones (driver,front passenger, rear-passenger left and right). The system was trained with 10 adultspeakers, using 30 minutes of speech for each speaker. For the evaluation, 76 min-utes of speech were recorded in varying conditions, e.g. doors open, doors closed,overlapping dialog. The system tried to classify different lengths of speech. With10 milliseconds of speech, the system already reached an accuracy of 62.7%. Withabout one second of speech, the accuracy raised to almost 100%.
3.2 Inertial Positioning
Since inertial positioning relies on a number of proprioceptive sensors, it is in prin-ciple a positioning approach that combines different sensor technologies. The basicprinciple is dead reckoning, as already mentioned in Section 2.1.1.2: by measuringthe current speed and direction of an agent, a new position is calculated, e.g. byapplying Newton physics. In principle, inertial positioning does not need any instru-mentation of the environment, however an exact start position is needed. Becauseevery sensor is inaccurate to some extend, a position derived by dead reckoning con-tains errors. These errors add up with each subsequent position determination. Inpractice, a new position fix has to be gained from time to time to correct the ac-cumulated errors. These correction positions are usually obtained through anotherpositioning technology. Integrated devices containing sensors for inertial positioning

3.2 INERTIAL POSITIONING 109
are called Inertial Measurement Units (IMU) and are commercially available by sev-eral companies. Often they also contain a GPS receiver, to gain the needed start- andcorrection-positions. Most IMUs contain accelerometers to determine movements,gyroscopes to measure angle changes and magnetometers (compass) to gain direc-tion information according to magnetic north. In robotic positioning, wheel encoderscan additionally be used to count the number of wheel turns since the last positiondetermination. By using knowledge about the circumference of the wheels and thenumber of rotations per wheel, the distance and direction of the movement can becomputed. This method is called odometry. For humans the term odometry is oftenused to describe the counting of steps and sensors that deliver this kind of informationare called odometers.
Koppe et al. In [Koppe et al., 2011] an IMU is described, which was specificallydesigned for safety and rescue applications. The device is called BodyGuard andconsists of a GPS receiver, a 3-axis accelerometer, a gyroscope and a digital compassas well as an air-pressure sensor, to determine the altitude. Besides the IMU sensors,BodyGuard is also capable to measure temperature, humidity and the heart-rate ofthe user. The device can communicate through radio transmissions on the 868 MHzband and can store all measurements on an SD-card. Moreover, BodyGuard wasdesigned for harsh environments and can operate in a temperature range between -25°C and 70°C. Although the IMU contains a processing unit, the authors used anexternal PC to do the position determination. The reported error accumulation of thesystem is ‘less than ±2 at a traveled distance of 100 meters’.
Link et al. [Link et al., 2011] present a navigation application called FootPath thatrelies solely on the built-in accelerometer and compass of a smart phone. The appli-cation uses maps from OpenStreetMap23, which also contains rudimentary supportfor indoor maps. After a user has selected their current position and their destinationon the map, a route is calculated. The application performs a step detection usingthe accelerometer measurements. Basically, the step detection works by detectingsteep drops in the acceleration, which are produced by an up and down movementwhile walking. Positioning is done by assuming that a user is following the proposedroute. When the user takes the first step, a normal stride length l is assumed and thenext position is assumed to be at distance l on the route. In subsequent steps, thesystem compares the direction measured by the compass with the assumed directionderived from the route. If discrepancy is too big for a number k of subsequent steps,it is assumed that the position estimation is wrong and the system tries to find a newmatching position on the path, by searching for a route-segment that best matcheswith the k misaligned steps. If such a segment is found, the algorithm tries to adjust
23http://www.openstreetmap.org/

110 RELATED WORK
(a) Position acquisition process (b) Excerpt of fingerprinting positioning process
Figure 3.12: Flowcharts of LOCATEME’s position acquisition and fingerprintingprocess ([Pereira et al., 2011a]).
the stride length l in such a way, that all steps taken so far lead to the found route-segment. The new user position is assumed to be at the end of that path-segment.The authors tested FootPath in an outdoor scenario on a predefined path using GPSas ground-truth. The reported average accuracy is 8.9 meters.
3.3 Positioning with Several Sensor Technologies
3.3.1 Pereira et al.: LocateMe
[Pereira et al., 2011a] implemented an application named LOCATEME, which theydescribe as a localization system to find friends wherever they are. The system runson Android mobile phones and also provides a website, where users can register tomanage their data and see current positions of their friends. The positioning for LO-CATEME uses GPS outdoors and WiFi as well as cellular phone networks indoors.For indoor positioning, three different methods were implemented: a WiFi finger-

3.3 POSITIONING WITH SEVERAL SENSOR TECHNOLOGIES 111
printing approach, a method based on geo-referenced WiFi access-points and onebased on geo-referenced cells. Figure 3.12a shows the flow-chart of the position ac-quisition process: LOCATEME successively tries all implemented methods until oneis successful or all failed.
The training for the WiFi fingerprinting method is initiated by the user, who canthen indicate their position on a displayed map and provide an additional positiondescription and floor number. LOCATEME scans for all available access points andsends the indicated position and the resulting scan data, including MAC address,SSID and signal strength values, to a server. In the actual positioning mode, the user’sdevice will perform the same scanning process and send the results to the server forposition calculation. The server recursively checks if the currently detected accesspoints are available in its database and searches for the database entry, which containsmost detected access points. Figure 3.12b shows an excerpt of this search processfor three detected access points.
For the second method, a database containing geo-referenced WiFi access pointsis needed. If GPS is available, LOCATEME generates this database automaticallyby constantly scanning for WiFi access points and sending this data along with thecurrent GPS position to a server. If GPS and the fingerprinting method fail whiletrying to determine a position, the server tries to estimate a position by calculating aweighted center mass, using the measured signal strength of detected access pointsas weights.
The last method is practically the same as the previous one, only that detected cellsare used instead of WiFi access points.
Since LOCATEME provides its sensor measurements to a server for the actual po-sition determination, it is an offboard egocentric system. Although several sensor-types are used, no sensorfusion is performed. Semantic descriptions of indoor loca-tions can be provided, but no ontology or hierarchical location model is used. Theauthors do not provide an accuracy evaluation of their positioning system.
3.3.2 Gallagher et al.
[Gallagher et al., 2011] describe a system running on mobile phones that should helpstudents and staff at University of New South Wales to find their way through thecomplex campus and gives them information about nearby POIs, like ATMs and busstops. The emphasis of their system lies on the automatic switching between GPS foroutdoor usage and a standard WiFi fingerprinting system for indoors. This switchingshould help to reduce the power consumption, because either the GPS or the WiFiscanning will be switched off if not needed. The system is server based, working

112 RELATED WORK
with measurements sent by the mobile devices of the users. It is thus an offboardegocentric system. Users can also provide feedback about their current position tothe system, which should help to increase the accuracy.
The switching between fingerprinting and GPS – or from indoor to outdoor – isaccomplished through so-called ‘indoor transition zones’, i.e. rooms that contain orare nearby exits of a building. If the server detects a position inside such an indoortransition zone for a given number of times (default value is three times), it will tellthe phone to switch on GPS and check if it is able to get a fix. If this is successful,the WiFi scanning will be switched off and the system changes to its outdoor mode.The change from outdoor to indoor is simply triggered by the loss of GPS signals.
The authors performed tests to evaluate the probabilities of correct switches and no-ticed that the switch from indoors to outdoors is always delayed due to the time GPSneeds to provide a first fix. At low speeds (1 m/s), the correct switch was performedin 97% of all tests. This number decreases with increasing speed. At the highesttested speed (3 m/s) only ≈50% of changes were detected correctly.
3.3.3 Peng et al.
[Peng et al., 2011] developed a seamless outdoor/indoor positioning system for ve-hicle and pedestrian positioning using GPS and an active RFID system. The RFIDsystem contains of a reader card and active RFID tags manufactured by Identec So-lutions (see also Section 4.4.1.1). For pedestrians an additional inertial measure-ment module called the MinimaxX24 was used. The MinimaxX contains a tri-axisaccelerometer, three gyroscopes, a tri-axis magnetometer and has a built-in GPS re-ceiver. The authors developed a new approach to integrate the measurements of allsensors, which is based on the Reduced Sigma Point Kalman Filter (RSPKF). Theauthors claim, that this new variation, dubbed Iterated Reduced Sigma Point KalmanFilter (IRSPKF) has less computational cost than the traditional RSPKF and leads toa higher accuracy.
The accuracy of the system was evaluated using two different sites: a test track forthe vehicle, where an area with bad GPS reception was augmented with active RFIDtags, and a test track for the pedestrian application, which consisted of an outdoorpart and an indoor part. The indoor part lead through a house that was mainly con-structed of timber; the outdoor part partially lead through canopy-covered areas aswell as through open areas. Since the derived position measurements were testedagainst RTK GPS measurements (see Section 3.1.1.1), it can be assumed that theindoor environment still provided good GPS reception. For the vehicle test track, the
24http://www.catapultsports.com/products/minimax

3.3 POSITIONING WITH SEVERAL SENSOR TECHNOLOGIES 113
Figure 3.13: Positioning errors of the pedestrian positioning experiment as reportedin [Peng et al., 2011]
.
accuracy could be improved from 2.923 meters with the RSPKF approach to 1.353meters using the IRSPKF approach. For the indoor tests, the authors report a meter-level accuracy, but no exact numbers are provided. A graphical representation of themeasured errors (see Figure 3.13) shows a derivation of ±8 meters.
3.3.4 Xiao et al.
[Xiao et al., 2011] propose an egocentric sensor-fusion approach based on WiFi tags,worn by the user, and inertial measurements. Their WiFi positioning is based on RSSfingerprinting, but to reduce the inaccuracies introduced by fluctuations of the RSSmeasurements, they use a region-based approach instead of single reference points,i.e. several single reference points are grouped into regions. The authors admit thatthis method will increase the time-effort for the system calibration, but argue that asimulated evaluation of the approach showed an accuracy improvement of 1.5 meterscompared to the standard approach with single reference points.
For inertial measurements, the RAZOR IMU25 by Sparkfun Electronics was used.The RAZOR provides a single-axis gyroscope, a two-axis gyroscope, a tri-axis mag-netometer and a tri-axis accelerometer. A WiFi tag manufactured by G2 Microsys-tems was integrated with the IMU to provide a mobile platform and to send theinertial measurements to a centralized server. This server also receives the RSS mea-surements from all WiFi access points. The sensor fusion is accomplished on theserver with the help of a Kalman filter that uses the WiFi position-estimates as mea-surements and the inertial sensing data as control inputs.
25http://www.sparkfun.com/products/9431

114 RELATED WORK
Figure 3.14: Average positioning error as shown in [Xiao et al., 2011].
An evaluation was performed, using a trolley carrying the mobile measuring plat-form. Four WiFi access points were set up and 24 single reference points wheretaken during the calibration phase. Varying numbers were tried for the grouping ofthese single reference points (3, 4 and 6 neighboring points). The authors report anincrease of accuracy of 1.2 meter in average through the use of the Kalman filterwith IMU provided control inputs. A provided diagram (see Figure 3.14) shows anaverage positioning error of ≈1.25 meters with regions consisting of three referencepoints and using a Kalman filter with IMU provided inputs. The accuracy gets worsewhen regions with more reference points are used.
3.3.5 Ascher et al.
[Ascher et al., 2011] describe initial studies on how to use an UWB based indoorpositioning system to provide correction positions to an inertial positioning system.The authors argue that the problem of UWB based positioning systems lies in the factthat a high number of UWB senders or sensors have to be installed in the environmentto guarantee a position determination. Inertial position systems on the other handaccumulate errors over time. With the combination of both systems, they want toreduce number of UWB nodes that have to be installed while maintaining a highposition accuracy.
The authors did not test their approach in a real-world setting, but developed a sim-ulation suite, which consists of a walk generator and a UWB simulation. With thewalk generator, an arbitrary walking-path can be specified including different ve-locities, which will then be transformed into measurement data that a real inertialmeasurement unit (IMU, see Section 3.2) would produce. The walk generator first

3.3 POSITIONING WITH SEVERAL SENSOR TECHNOLOGIES 115
!!
!"#$%&'!()!*#+,-'!,.*#/#.0#0$!&'*%-/*!1.&!234!5#/6.%/!708!#0/'$&#/8!
+.0#/.�$9!&'1'&'0:'!#*!,-.//'/!#0!&';!
!
!
"#$%&'!<)!=..*'-8!>*?!/#$6/-8!:.%,-#0$9!*#+%-7/';!&':'#>'&!+7-1%0:/#.0!#0!-'1/!&..+9!@!7>7#-7A-'9!BC2)!DEBFGHIJJ9!0.!F=2!
K6'&'!7&'!*'>'&7-!#0/'$&#/8!+.0#/.�$!+'/6.;*!56#:6!7&'!&':'#>'&!7%/.0.+.%*!LMDBCN9!'?$?! /6'!&70$'!:.+,7&#*.0!+'/6.;!.&! /6'!O7&#/8!F,7:'!+'/6.;!A%/! /6'*'!;.!0./!%*'!#0'&/#7-!;7/7!/.!#+,&.>'!/6'#&!,.*#/#.0!A8!7!,&';#:/#.0?!!36'0! %*#0$! #0'&/#7-! ;7/7! :.+A#0';! 5#/6! 234! /#+'! .1!7&&#>7-!LK.DN!+'7*%&'+'0/*9! #0/'$&#/8!+.0#/.�$!:70!A'!A7*';!.0!/6'!#00.>7/#.0!.1!/6'!&70$'!+'7*%&'+'0/9!/6#*!#*!7-*.!%*';!#0!PGQ?!4%/!1.&!/#+'!;#11'&'0:'!.1!7&&#>7-!+'7*%&'+'0/*!LKE.DN9!7! 0.>'-! +'/6.;! :7--';! B00.>7/#.0! 47*';! B0/'$&#/8!C.0#/.�$! LB4BCN! 67*! A''0! ;'>'-.,';?! B/! #*! %*';! /.!*.->'! 7! *-#$6/-8! ;#11'&'0/! ,&.A-'+)! D*! /6'! +'7*%&'+'0/!#00.>7/#.0*! 7&'! :.&&'-7/';! 5#/6! '7:6! ./6'&! ;%'! /.!;#11'&'0:#0$9!+%-/#,-'!+'7*%&'+'0/*! 0'';! /.! A'! &'R':/';!#1!.0-8!.0'!&70$'!+'7*%&'+'0/!#*!17%-/89!'*,':#7--8!#1!/6'!+7#0!+'7*%&'+'0/!! !#*!0./!:.&&':/?!!B0! KE.D! 7,,-#:7/#.0*! &70$'! +'7*%&'+'0/*! A'/5''0!/&70*+#//'&! L%*'&N! 70;! &':'#>'&*! L#01&7*/&%:/%&'N! 7&'!;#11'&'0:';!70;!/6'0!7&'!%*';!#0!/6'!07>#$7/#.0!1#-/'&?!!".&! BSF! 7#;';! *8*/'+*9! /6'! 07>#$7/#.0! *.-%/#.0! 8#'-;*! 7!$..;! #0'&/#7-! ,&';#:/#.0! %0/#-! /6'! 0'T/! %*'&! ,.*#/#.0!+'7*%&'+'0/?! F.! /6'! #00.>7/#.0! .&! &'*#;%7-! 1.&! '7:6!+'7*%&'+'0/! :70! A'! :7-:%-7/';! 7*! 7! ;#11'&'0:'! A'/5''0!,&';#:/#.0!70;!+'7*%&'+'0/?!D*! ,&'*'0/';! #0! PGQ! /6'! #00.>7/#.0! 1.&! %0;#11'&'0:';!+'7*%&'+'0/*! 7&'! /'*/';! %*#0$! 68,./6'*#*! /'*/#0$! .0! /6'!&'*#;%7-*U#00.>7/#.0*! .1! /6'! V7-+70! 1#-/'&9! 56'0! /6'!'&&.&*! 7&'! 6#$6'&! /670! /6.*'! '*/#+7/';! 1&.+! /6'!:.01#;'0:'! #0/'&>7-?! B0! /6'! :7*'! .1! ;#11'&'0:';!+'7*%&'+'0/*! LKE.DN! 7! *#+#-7&! 7,,&.7:6! #*! %*';! /.!;'/':/!'&&.&*)!K6'!KE.D!#00.>7/#.0*!L;'&#>';!7A.>'N9!:70!A'!:.+A#0';!/.!7!&'*#;%7-!>':/.&)!!! ! !
!S.5! 7*! 7! &'R':/#.0! :&#/'&#.0! 5'! %*'! /6'! ;#11'&'0:'!A'/5''0! /6'! &'*#;%7-! >':/.&! !70;! /6'! -.5'*/! &'*#;%7-!
)!!
!!
!
K6#*!+.;#1#';!&'*#;%7-!>':/.&!0.5!#*!;#>#;';!#0/.!-.$#:7-!=DMWX! 70;! FCD==! A8! 7! /6&'*6.-;! A7*';! .0! /6'!:.01#;'0:'! #0/'&>7-! .1! /6'! 7:/%7-! '*/#+7/'! 70;!+'7*%&'+'0/!0.#*')!!!! ! !
!D*!.0'!17%-/8!&':'#>'&! &70$'! #01-%'0:'*!7--!:.+A#07/#.0*!5#/6! /6#*! &':'#>'&9! 5'! %*'! 7! :.%0/'&! 1.&! '7:6! &':'#>'&!56#:6!#*!#0:&'7*';!1.&!'7:6!.1!/6'!%*';!&':'#>'&*9!#1!/6'#&!&'*#;%7-!#*!=DMWX?!Y/6'&5#*'!/6'!:.%0/'&!#*!;':&'7*';?!!"#07--8!/6'!&':'#>'&*!5#/6!6#$6!:.%0/'&*!7&'!#;'0/#1#';!70;!7--! KE.D! &70$'! :.+A#07/#.0*! 5#/6! /6'*'! &':'#>'&*! 7&'!.+#//';?!3#/6!/6#*9!/6'!#0:.&&':/!KE.D!+'7*%&'+'0/*!:70!A'! .A*'&>';! 70;! &'R':/';! #1! /6'8! 7&'! 6#$6'&! /670! /6'!:.01#;'0:'!#0/'&>7-?!!!
ZB?! MXF2=KF!B0!/6#*!*':/#.0!/6'!&'*%-/*!1.&!7!;'',!#0;..&!*:'07&#.!5#--!A'!,&'*'0/';?! GJ! &':'#>'&*! 7&'! ;#*/&#A%/';! #0! /6'! 67--578!70;! #0! /6'! &..+*?! ! "#$?! (! *6.5*! /6'! &'*%-/*! .1! 7! *#+,-'!,.*#/#.0#0$!5#/6.%/!#0'&/#7-!;7/7?!K6'!,%&'!234!*.-%/#.0!*6.5*!6#$6!'&&.&*!56'0!0.!#0/'$&#/8!+.0#/.�$!#*!%*';?!!"#$?! <! *6.5*! 7! :.+,7&#*.0! A'/5''0! -..*'-8! 70;! /#$6/-8!:.%,-#0$?!K6'! /&7R':/.&8! &%0*! /6&.%$6! /5.! &..+*9!56'&'!#0! /6'! 1#&*/! .0'! L&#$6/N! /6'! ,'&1':/! 234! &':',/#.0! #*!,&'*'0/!70;!#0!/6'!*':.0;!.0'!L.0!/6'!-'1/N!.0-8!/5.!234!&':'#>'&*! 7&'! 7>7#-7A-'! L+7&[';! #0! A-%'N?!E%�$! /6'! &%0!#0! /6'! *':.0;! &..+! 7! @\! *':.0;! -.0$! ,7%*'! 57*!#0/&.;%:';9! #0! 56#:6! 0.!+.>'+'0/! #*! ,'&1.&+';?! B0! /6'!-..*'-8]:.%,-';!#0/'$&7/#.0!/6'!,.*#/#.0#0$!*.-%/#.0!*/7&/*!;/#0$!7578!7*!*..0!7*! -'**! /670!^!&':'#>'&*!7&'!>#*#A-'!70;! /6'! :7-:%-7/';! *.-%/#.0! -#'*! .%/*#;'! /6'! &..+! 71/'&! 7!1'5! *':.0;*?! 36'0! /6'! +.>#0$! ,'&*.0! '0/'&*! /6'! 1#&*/!&..+! 7$7#0! /6'! 2-/&7]3#;'A70;! +'7*%&'+'0/*! ,%--! /6'!
(a) UWB only
!!
!"#$%&'!()*!+#$,-./!01%2.'3!#4-'$&5-#14!6&17!89:!543!;<=!543!-,'!&'>%.->!16!2%&'!#4'&-#5.!45?#$5-#14!@#-,!>-'2!.'4$-,!%235-'>!A=B8C!!
21>#-#14#4$!>1.%-#14!D50E!-1!-,'!01&&'0-!5&'5F!G4!-,'!1-,'&!,543! -,'! -#$,-./! 01%2.'3! 522&150,! 5..1@>! 7%0,! D'--'&!45?#$5-#14F!H%$!-,'!>-'53/!2,5>'!-,'!>1.%-#14!3->!-1!-,'! >1%-,! 5>! 41! 41&-,I>1%-,! 5#3#4$! #>! 5?5#.5D.'! 6&17! -,'!-@1! &'0'#?'&>F!J1@'?'&! #-! >-#..! &'75#4>! @#-,#4! -,'! &117!543! 5>! >114! 5>! -,'! 71?'7'4-! 522'5&>! -,'! >1.%-#14!#72&1?'>!3%'!-1!-,'!0,54$#4$!$'17'-�>F!!"#$F!()!>,1@>!-,'!&'>%.->!16!-,'!-#$,-./!01%2.'3!89:K;<=!#4-'$&5-#14!#4!541-,'&!>0'45F!;4!-,'!,5..@5/!543!#4!-,'!&117! 14! -,'! -12! &#$,-L! @,'4! 14./! 6'@! .#4'! 16! >#$,-!&'0'#?'&>!5&'!?#>#D.'L!&54$'!'&&1&>!100%&F!+,'!2%&'!#4'&-#5.!'>-#75-#14!@,#0,!#>!D5>'3!14!>-'2!.'4$-,!%235-'>!A=B8C!#>!5.>1! >,1@4! #4! -,#>! 2.1-! @#-,! 5! 1D?#1%>! 3-! 3%'! -1! -,'!MNM=!$&53'!#4'&-#5.!>'4>1&>F!9,'4! 017D#4#4$! 5..! #461&75-#14! -1! 54! +#$,-./! O1%2.'3!89:K;<=K=B8!#4-'$&5-#14L!-,'!&'>%.->!5&'!D'--'&!D'05%>'!@,'4! 14./! 6'@! 89:! %235-'>! 5&'! 5?5#.5D.'L! -,'! >-'2!.'4$-,!%235-'>!2&'-'43!-,'!>1.%-#14!-1!3-!-11!7%0,L!-,#>!054!D'!>''4!#4!"#$F!((F!G4./L!#6!65%.-/!7'5>%&'7'4->!5&'!5?5#.5D.'!3%'!-1!7%.-#25-,!543!414!.#4'!16!>#$,-!>#-%5-#14>L!'&&1&>!>-#..!100%&F!J1@'?'&!@#-,!-,'!2&'>'4-'3!;441?5-#14!:5>'3!;4-'$&#-/!M14#-1$!A;:;MC!3'0#>#14!5.$1&#-,7!61&!+H1P!05>'>!@'!61%43!2&17#>#4$!&'>%.->!543!&1D%>-4'>>F!!
Q;;F! =8MMPRS!P<H!OG<OB8=;G<!;4! -,#>! 252'&! 5! 0172.'T! >-%3/! 14!89:K;<=! #4-'$&5-#14!-'0,4#U%'>! 61&! 2'3'>-6! #4311&! 45?#$5-#14! >/>-'7>! ,5>!D''4! 2'&61&7'3F! +,'! >2'0#5.! '72,5>#>! @5>! 2%-! 14!53?54-5$'>! #4?'>-#$5-#14! 16! +#$,-! O1%2.#4$F! P! >2'0#5.!>#7%.5-#14! '4?#&147'4-! 61&! 89:! 543! ;M8! ,5>! D''4!3'?'.12'3L! @,'&'! ?5%>! 6#.-'&! >%221&->! 543! 3#66'&'4-!7'-,13>!16!35-5! 6%>#14! 054!D'! '?5.%5-'3F!"%&-,'&71&'! 5!41?'.! ;:;M!7'-,13! 61&! &'V'0-#14!16! -,'! #401&&'0-!+H1P!7'5>%&'7'4->! ,5>! D''4! #4-&13%0'3F! +,'! >#7%.5-#14!&'>%.->! 5&'! ?'&/! 0.1>'! -1! &'5.#-/! 543! -,'/! >,1@! -,'!53?54-5$'! 16! -,'! -#$,-./! 01%2.'3! 522&150,F! O17D#4'3!@#-,! -,'! #4-'$&#-/! 7'-,13! 5! &1D%>-! #4-'$&5-#14! ,5>! D''4!#72.'7'4-'3F!:5>'3!14! -,'>'!&'>%.->! #-! #>!2.544'3! -1! -'>-!-,'!6#.-'&>!543!-,'!#72.'7'4-'3!#4-'$&#-/!714#-1$!@#-,!&'5.!89:!543!#4'&-#5.!35-5F!
!
!
RN"NRN<ON=!W(X! J1.L! YFHFZ! H#VE>-&5L! "FZ! B%#4$'L! JFZ! =0,14L! +F:FZ! L![+#$,-./! 01%2.'3! 89:K;M8! 21>'! '>-#75-#14L[! 8.-&5I9#3'D543L! \))]F! ;O89:! \))]F! ;NNN! ;4-'&45-#145.!O146'&'40'L!?1.FL!41FL!22F^__I^]\L!]I((!='2-F!\))]!W\X! "1/L!9FJF*! [`1>#-#14IB105-#14! =1.%-#14>! D/! +5/.1&I='&#'>! N>-#75-#14L[! P'&1>250'! 543! N.'0-&14#0! =/>-'7>L!;NNN!+&54>50-#14>L!?1.FPN=I(\L!41F\L!22F(_aI(]bL!M5&0,!(]a^!WcX!BF!d@#&'..1L!MF! Y54>14L! OF!P>0,'&L!8F! =0,@'>#4$'&L!
16! 89:! .105.#e5-#14! >/>-'7>! 3'3#05-'3! -1! .5&$'I>05.'!
`1>#-#14#4$!543!;4311&!<5?#$5-#14!A;`;<CL!='2-F!\)()F!!WbX!
G.3'4D%&$!Q'&.5$!\))a!WfX!84#?'&>-#-/!`&'>>L!(]]b!W^ L!N4$#4''$!:11E!='&#'>!!
!"#$%&'!((*!"#&>-!&'>%.->!@#-,!;:;M*!-#$,-./!01%2.'3!?>F!-#$,-./!
01%2.'3!@#-,!;:;M!
!"#"$"%&"'()*+,)-./.0'()*-./.0
!"#$%&'()*+,&-./0123456/456/
(b) Inertial (INS) positioning vs. tightly cou-pled UWB & inertial
(c) Tightly coupled with and without filtering(IBIM)
Figure 3.15: Simulation results as reported by [Ascher et al., 2011].
produces ideal IMU data, which is then modified according to error statistics fromreal IMUs.
For the simulation of the UWB positioning system, a 3D model of an indoor environ-ment can be specified, including different wall materials and objects with differentelectrical properties. With this model the radio propagation of UWB signals can besimulated. The envisioned UWB positioning system is egocentric, i.e. UWB sendersare installed in the environment, which send out their own location. The respec-tive sensor also contains the IMU. Whether the system is onboard or offboard is notspecified. Since the UWB senders and the receiver are not synchronized, the authorspropose to use TDOA measurements and multilateration for position estimation. Thecomplete UWB positioning system can be simulated using the 3D model and appro-priate radio propagation models.
The fusion of the UWB positioning system and inertial positioning is accomplishedwith a Kalman filter. The authors tested two different approaches: a loosely coupled

116 RELATED WORK
Kalman filter and a tightly coupled Kalman filter (see Section 2.6.1). The looselycoupled Kalman filter uses the calculated position of the UWB system as measure-ments and predicts the next position using the IMU measurements. This approachhas the disadvantage, that it only works when the sensor can gain at least three TDOAmeasurements. The tightly coupled Kalman filter also uses the IMU measurementsto predict the next position, but then calculates which TDOA measurements it wouldhave to receive, if the predicted position were true. The difference between the pre-dicted TDOA measurements and the real TDOA measurements are then used as mea-surement innovation. Thus, the tightly coupled Kalman filter works with any numberof received TDOA measurements. Additionally the authors developed a mechanismto filter out faulty TDOA measurements, which basically monitors the measurementinnovation and marks senders that repeatedly deliver far off TDOA measurements.These marked senders will then be omitted from position calculations. The authorscall their filter approach Innovation Based Integrity Monitoring (IBIM).
The proposed methods were tested using the simulation suite. The authors modeledone floor of their office building and simulated 15 UWB senders as well as a walktrough one of the rooms and through the corridor. The authors do not give an averageaccuracy but provide a number of diagrams. Figure 3.15a shows the performanceif only the UWB positioning system is used. As can be seen, most of the positions(black crosses) are far off the track (red line). This is due to the low number ofUWB senders in the environment. Figure 3.15b is a comparison between inertialpositioning alone (green line) and the combination of inertial and UWB positioning(blue line). As can be seen, the pure inertial position drifts away towards the endof the trace due to accumulated errors. The combined position seems to have somelarge deviations, when UWB senders from adjacent rooms are detected. Figure 3.15cshows the derived positions of the combined approach with and without enabledIBIM filtering. The large deviations seem to be corrected through the IBIM approach.The authors plan to deploy and test their system in a real-world scenario.
3.3.6 Brunelli et al.
[Brunelli et al., 2007] developed a system that can be used to position people in meet-ings or seminars. The system is offboard/exocentric and uses microphone arrays aswell as cameras that are installed in meeting rooms. The audio based positioninguses the principle of beamforming to derive a global coherence field (GCF) as de-scribed in Section 3.1.12.2. The system scans the room with a spatial resolutionof 5 centimeters. To deal with disturbances from coherent noise sources, a filterwas implemented, which checks the distance of derived positions between succes-sive measurements. Short noises that appear suddenly at a far distance from previouspositions are thus ignored.

3.3 POSITIONING WITH SEVERAL SENSOR TECHNOLOGIES 117
The camera based positioning is achieved by using a simplified model for a speakerin a meeting scenario. The authors assume that a speaker has a human-like shapeand is standing upright most of the time. Furthermore, it is assumed that a possibletarget has a consistent color throughout a sequence of images. A possible target isidentified in an image-sequence by analyzing the optical flow and trying to projecta coarse 3D model of a human onto parts of the image that indicate a high opticalflow (similar to the description in Section 3.1.6.2). A single camera obtains severalhypothesis of where a person is currently standing. The integration of hypothesesfrom different cameras is done with a particle filter, where the position state containsposition and velocity of a target, and the measurements of each camera are used toupdate the particles accordingly.
Since audio based positioning is only possible while a person is talking, the camerabased positioning is more likely to constantly determine a position. To combine thecamera based positions with the audio based ones, the particle filter for the camerabased positioning was adapted. The basic principle is to derive a hypothesis forthe audio based positioning from the current camera based position, i.e. if a personis standing at a particular position, the hypothetical position of a sound source canbe calculated, by shifting the coordinates towards the head of the 3D model. Thehypothesis can be checked, by forming beams around the area of that position. Ifa defined threshold is reached, which indicates that a person is really speaking, thecomputed GCF values are used to update particles in that region accordingly.
The authors tested the combined system as well as each single positioning method.For audio only, an average accuracy of 14.4 centimeters was reached, with 7 mi-crophone arrays (as depicted in Figure 3.11). For multiple speaker positioning, theaverage accuracy dropped to 21.8 centimeters. Positioning based only on camerainformation reached an accuracy of 13.2 centimeters for single person tracking andfour cameras.
The combination of both methods for a single person was tested in two conditions:only position a user when they are speaking and position a user for every possiblepoint in time (regardless whether they are speaking or not). In the first condition, anaverage accuracy of 13.2 centimeters was reached. The second condition is reportedwith a slightly lower accuracy of 13.4 centimeters. The fusion of both positioningmethods did thus not result in a higher average accuracy than using a single method.However, the authors report that the fusion of both methods performed better in someobserved sequences.

118 RELATED WORK
Figure 3.16: The architecture of the MapUme middleware ([Najib et al., 2011]).
3.3.7 Najib et al.: MapUme
In [Najib et al., 2011] a middleware called MapUme is presented, which is designedfor offboard positioning. The middleware was implemented using Windows Com-munication Foundation (WCF), which is part of Microsoft .NET.
MapUme can run on a single server or in a distributed server-network, which shouldhelp to balance the load of the position computations. The architecture of MapUmeis shown in Figure 3.16. The depicted sensor layer represents the actual sensor hard-ware. In the measurement layer, data structures and interfaces for each sensor have tobe defined. The aggregation layer collects sensor data and is also responsible for thecommunication in a distributed server-network. Furthermore, this layer is responsi-ble for the configuration (via XML files) of the middleware, for measurement loggingand database access, through which maps, fingerprints, locations of base stations etc.can be stored. As the name fusion layer implies, it is responsible for the fusion ofsensor data. The fusion engine uses an abstract factory pattern, which allows to im-plement different fusion algorithms that can be ‘plugged’ into the fusion layer. Inthe arrangement layer, tracked objects are represented with their current position andrelations to an environment description, e.g. a map, can be derived. The servicelayer allows to implement location-based services, to which other applications cansubscribe.

3.3 POSITIONING WITH SEVERAL SENSOR TECHNOLOGIES 119
The authors tested MapUme, by implementing an offboard/exocentric WiFi posi-tioning system, where the WiFi access points report their measured signal strengthsdirectly to a MapUme server. To test the fusion engine, they added an IMU. Atwo-story building was equipped with eight WiFi access points on an area of 25×70meters. The average position accuracy for WiFi based positioning is reported with2.52 meters. The integration of the IMU was done with a particle filter and resultedin an average positioning accuracy of 2.27 meters. The exact evaluation methods arenot disclosed.
The authors also tested how the middleware performs with a single server and in adistributed server-network and found out, that the distributed mode introduces a lownetwork-latency of 3.436 milliseconds, which is negligible compared to the averagecomputation time of 366 to 392 milliseconds per measurement.
3.3.8 Martınez et al.
[Martınez et al., 2011] propose a high-level interface to combine several positioningtechnologies and to provide location-based services. Although high-level descrip-tions are given, a concrete implementation does not seem to exist. The authors envi-sion an architecture that is divided in two main parts: Location Event Providers (LEP)and Location Services (LS). The basic idea is to separate the technology dependentparts from the technology independent parts, i.e. the Location Event Providers areresponsible for determining positions using specific hardware, while the LocationServices use the provided positions and are thus independent from the hardware.
According to the authors, there should be a Location Event Provider for every sup-ported position technology. A service discovery protocol is responsible for detectingavailable technologies, like WiFi, Bluetooth, UWB, and starts the according LocationEvent Providers. These providers can broadcast position events using a standardizedprotocol, which contains an event type description, a time-stamp and a description ofthe area where a user is in.
Location Services can receive these position events. If position events for the sameperson or object arrive, the authors propose to merge the reported areas through ge-ometrical intersection. If no intersection is found, the Location Service chooses theposition that was reported from the Location Event Provider that is known to havethe highest accuracy. Using the obtained position, a Location Service can then im-plement additional services or forward the determined position.

120R
EL
AT
ED
WO
RK
SystemDescription Se
nsor
Fusi
on
Seam
less
Out
door
/Ind
oor
Sem
antic
Des
crip
tions
Coo
rdin
ates
Ego
cent
ric
Exo
cent
ric
Onb
oard
Des
igne
dIn
stru
men
tatio
n
Opp
ortu
nist
ic
Dyn
amic
Ev a
luat
ion
Stat
icE
valu
atio
n
Acc
urac
y
Technology
Ghinamo et al., 2011 (Indoor GPS) 7 3 7 3 3 7 3 3 7 ∼ ∼ 0.34 m - 1.04 m GPS
Kohtake et al., 2011 (Pseudolites) 7 3 7 3 3 7 3 3 7 ∼ ∼ n.a. IMES Pseudolites
Sakamoto et al., 2011 (Pseudolites with robot) 7 3 7 3 3 7 3 3 7 7 3 ≈ 0.17mIMES Pseudolites, rotating
antennae
Pereira F. et al., 2011b (GSM at LHC) 7 7 7 3 3 7 7 7 3 7 3 20-280 m GSM over a leaky feeder
Dempsey et al., 2011 (Femtocells) 3 ∼ 3 7 7 3 7 7 3 ∼ ∼ Room level Pico-, Femto-cells, Calendar
Bahl et al., 2000 (RADAR) 7 7 7 3 7 3 7 7 3 7 3 2-3 m WiFi
Ledlie et al., 2011 (Mole) 7 7 3 7 3 7 3 7 3 7 3 Room level WiFi
Chawathe, 2009 7 7 ∼ ∼ 3 7 3 3 7 7 7 n.a. Bluetooth
Kiers et al., 2011 (ways4all) 7 7 7 3 3 7 3 3 7 7 7 na passive RFID
Ni et al., 2004 (LANDMARC) 7 7 7 3 7 3 7 3 7 7 3 1-2 m active RFID
Want et al., 1992 (Active Badge) 7 7 7 3 7 3 7 3 7 7 3 Room level Infrared
Hauschildt et al., 2010 (ThILo) 7 7 7 3 7 3 7 3 7 3pg 7 9-26 cm Thermal Infrared
Herranz et al., 2011 7 7 7 3 3 7 ∼ 3 7 3sim 7 3.1-17.3 cm Visual LEDs, Camera
Ruotsalainen et al., 2011 (Heading direction) 7 ∼ 7 7 3 7 ∼ 7 3 7 3 1.3°- 1.8° Camera
Dettori, 2008 7 7 7 3 7 3 7 3 7 7 3 5-10 cm Stereo Camera
Nakashima et al., 2003 (CoBIT) 3 7 ∼ ∼ 7 3 7 3 7 ∼ ∼ ≈ 1 cm Laser-range, Camera
Rabinowitz et al., 2005 (DTV) 7 3 7 3 3 7 3 ∼ 3 7 3 3.2 -23.3 m TV receiver
Moghtadaiee et al., 2011 (FM Radio) 7 ∼ 7 3 3 7 3 7 3 7 3 2.96-3.29 m FM Radio receiver
Storms et al., 2010 7 ∼ 7 3 3 7 3 7 3 3pg 7 0.2-0.6 m Magnetometer
Blankenbach et al., 2011 (MILPS) 7 7 7 3 3 7 3 3 7 ∼ 3 4-7 cm Range only Magnetometer

3.3P
OS
ITIO
NIN
GW
ITH
SE
VE
RA
LS
EN
SO
RT
EC
HN
OL
OG
IES
121Ubisense, 2005
Stephan et al., 20097 7 7 3 7 3 7 3 7 7 3 12.8-124.3 cm UWB
Kuflik et al., 2011 (PIL) 7 7 7 3 3 7 7 3 7 7 3 1.5-2 m WSN
Rosa et al., 2011 (Relative Positioning) 7 7 7 3 3 7 3 7 3 7 3 meters WSN of mobile devices
Ward et al., 1997 (UltraBat) 7 7 7 3 7 3 7 3 7 7 3 ≈ 10 cm Ultrasound
Baunach et al., 2007 (SNOW BAT) 7 7 7 3 7 3 3 3 7 ∼ ∼ 15 mm Ultrasound WSN
Feld et al., 2010 (In-Car Positioning) 7 7 3 7 7 3 3 3 7 7 3 Seat level Microphone
Koppe et al., 2011 3 3 7 3 3 7 7 7 3 ∼ ∼ ±2m/100m IMU
Link et al., 2011 (Footpath) 3 3 7 3 3 7 3 7 3 3route 7 8.9 m Accelerometer, Compass
Pereira C. et al., 2011 (LocateMe) 7 3 3 3 3 7 7 7 3 7 7 n.a. GPS, WiFi
Ghallager et al., 2011 7 3 3 3 3 7 7 7 3 7 7 n.a. GPS, WiFi
Peng et al., 2011 3 3 7 3 3 7 ∼ 3 7 3rtk 7 meters GPS, active RFID, IMU
Xiao et al., 2011 3 7 7 3 7 3 7 3 ∼ 3pg 7 ≈ 2 m WiFi tag, IMU
Ascher et al., 2011 3 7 7 3 3 7 3 3 7 7 7 n.a. UWB, IMU
Brunelli et al., 2007 (audio & video) 3 7 7 3 7 3 7 3 7 3 7 ≈ 13 cm Cameras, Microphone arrays
Najib et al., 2011 (MapUme) 3 ∼ 3 3 7 3 7 3 3 7 7 2.27 meters Middleware, WiFi, IMU
Martınez et al., 2011 3 ∼ 3 3 ∼ ∼ ∼ 3 3 7 7 n.a.High level interface, no con-
crete implementation
LOCATO 3 3 3 3 3 3 3 3 3 3nt 3Room level,
≈ 1 m
Active RFID, IR, Bluetooth,
Cells, WiFi, GPS
Table 3.2: Comparison of multiple-sensor systems and single-sensor based positioning systems with LOCATO.
pg Predefined traces were used as groundtruth, derived from geometric primitives (straight lines, rectangles)sim A simulation was used for the evaluationroute A calculated route was used as groundtruthrtk The positioning system was tested against RTK GPS measurementsnt Natural traces were used as groundtruth, derived from observation and manually annotated

122 RELATED WORK
3.4 Summary and Discussion
This chapter provided an overview on the state of the art of positioning systemsand techniques. For outdoor applications, GPS provides high position-accuracy ifenough satellites are in line of sight. With GPS RTK, a position accuracy in therange of one centimeter is possible, but the applicability is limited due to higherhardware complexity. As AGPS is supported by most modern cell-phones, this canbe seen as the standard for outdoor positioning. Galileo is not expected to surpassthe accuracy of GPS, but hybrid GNSS receivers, which will be able to use GPS,Galileo and GLONASS satellites, will be able to benefit from the combined satellite-coverage. 4G cellphones will at least be able to provide coarse position-informationin the range of 50 to 150 meters, even if no or not enough satellites are in the line ofsight.
Regarding indoor positioning, GNSS pseudolites are an interesting alternative as theytheoretically enable outdoor and indoor positioning by using only one receiver, but is-sues like the near-far problem still have to be solved. [Sakamoto et al., 2011] showedthat an accuracy in the range of centimeters is possible, but the needed hardware cannot be integrated into small mobile devices and thus the approach does not complywith the usability and applicability criteria for positioning systems.
A plethora of alternative solutions is available, where the large part of them isusing electromagnetic signaling. The highest position accuracy can be reachedby instrumenting the environment. Millimeter accuracy seems to be pos-sible by using ultrasound ([Baunach et al., 2007]) and by using laser-scanners([Nakashima and Hasida, 2010]). However, the former needs a dense network ofultrasound nodes and a high calibration effort, and the latter is rather expensive.Thermal infrared as proposed by [Hauschildt and Kirchhof, 2010] is an interestingidea with the potential of providing centimeter accuracies, but is still far from beinga robust solution.
Opportunistic systems provide an accuracy in the range of meters or room-level andare an interesting alternative, as no additional infrastructure has to be deployed.[Storms et al., 2010] could show that the natural differences in the Earth’s mag-netic field could possibly be used for positioning, but the proposed approach isstill highly sensitive to external influences. WiFi infrastructures are in widespreaduse and are thus good candidates for opportunistic positioning systems. Theapproach to enrich WiFi access points with positioning data, as proposed by[Gschwandtner and Schindhelm, 2011], could help to ease the process but would stillneed administration by the network operator and thus increases the cost of ownership.
The fingerprinting approach is the most promising for opportunistic systems, as it canalso work with a small number of access points, as opposed to trilateration, multilat-

3.4 SUMMARY AND DISCUSSION 123
eration or triangulation, which all need a minimum number of measurements. How-ever, signal-strength fingerprints are subject to changing environmental-conditions,like air-humidity and the number of people in the environment. When a crowd-sourcing approach is used to gain the needed fingerprints for reference points, an-other problem comes into play: different mobile devices can have different receptionor sending characteristics, leading to an incompatibility of fingerprints. The Local-ization Toolkit LOCATO, which is described in detail in Chapter III, tackles bothproblems.
Still, WiFi infrastructures are not available everywhere and depending on the applica-tion, a higher position accuracy might be needed. As indicated in Section 2.6, sensorfusion can be a solution to this problem. However, as the systems in Section 3.3 show,sensor fusion is mainly used to integrate IMU measurements into a position-givingsystem. Most systems use Kalman or particle filtering, where the filters are especiallytailored to fit the respective system. [Najib et al., 2011] and [Martınez et al., 2011]proposed more general approaches, but the former is designed for offboard posi-tioning and the latter uses the very simple approach of geometrical combination ofreported positions. LOCATO tackles the problem of a more generic sensor-fusion aswell.
The paper of [Stephan et al., 2009] showed that positioning systems can perform dif-ferent than advertised in realistic scenarios. Most positioning systems are testedunder optimal conditions, i.e. interfering factors are suppressed. Often the exactmethod of evaluation is not given, especially the origin of the ground truth. A staticevaluation is often performed, i.e. reference points are used with which the derivedposition is compared. This method is well suited for positioning systems that want toderive a room-level or large-area accuracy. Positioning systems with higher accuracyshould be tested with moving targets. Here, the ground truth is hard to obtain, andthus predefined paths are often used, which may not coincide with natural paths thatare taken by users. This problem will be thoroughly discussed in Section 4.4.4.1.
Table 3.2 shows a comparison of all systems described in this chapter with LOCATO.The rows are ordered according to the sequence in which the systems appear in thischapter. 3 indicates that a feature is present, 7 that it is not present and ∼ indicatesthat the feature cannot be derived from the description of a system.
The column ‘System Description’ contains a reference to the paper where the ac-cording system is described as well as the system name, if one exists. A system ismarked as being able to perform ‘Sensor Fusion’, if it fuses at least two different sen-sor technologies. Seamless Outdoor/Indoor describes if a system is capable of work-ing outdoors and indoors without having the user to switch systems. A system thatsimply switches between a sensor technology for outdoor positioning and a sensortechnology for indoor positioning does not classify as performing ‘Sensor Fusion’.

124 RELATED WORK
The column ‘Semantic Descriptions’ denotes systems that internally use semanticdescriptions to represent positions. Likewise, ‘Coordinates’ denotes systems that usenumerical coordinates for internal position representation. The columns ‘Egocen-tric’ and ‘Exocentric’ denote egocentric and exocentric systems. As described inSection 2.3.2.5, any onboard positioning system can be converted into an offboardpositioning system. Thus only the column ‘Onboard’ is represented in the table.Offboard systems are marked as not being onboard. The column ‘Designed Instru-mentation’ denotes whether a system needs a dedicated infrastructure, whereas thecolumn ‘Opportunistic’ denotes systems that use an already existent infrastructure.Systems that were evaluated with moving position-targets are marked in the column‘Dynamic Evaluation’. The column ‘Static Evaluation’ denotes systems that wereevaluated by determining positions at known reference points, without moving theposition targets. The accuracy of a system, if available, is given in the column ‘Ac-curacy’. In the column ‘Technology’, the used sensor technologies are listed.

Part III
LOCATO
125


4 LOCATO: LOCALIZATION TOOLKIT
With respect to the design criteria, which were specified in Section 1.1.5, it couldbe seen in the last chapter that there is no single positioning-system that provides aglobal optimum over all criteria. A building-owner or tenant, who wants to providea positioning system, would thus choose a system that is tailored to their capabilitiesand needs. The main criteria will usually be the cost of infrastructure and the positionaccuracy, where the latter will depend on the applications that an operator wants tosupport. Regarding robustness of positioning systems, it could also be seen that tri-lateration, multilateration or triangulation tend to be less robust, due to their need ofa line of sight to a specific number of sensors or senders. Furthermore, any position-ing method that relies on signal-strength measurements is sensitive to environmentalchanges, like air-humidity or the number of people in the room.
The Localization Toolkit LOCATO was designed to facilitate the creation of posi-tioning systems that are tailored to the needs of an operator while taking the AlwaysBest Positioned paradigm into account, which addresses the needs of the users ofpositioning systems. In order to provide a high robustness, LOCATO provides newlydeveloped positioning methods, which work without signal-strength measurementsand can derive a position even if only one sender or sensor is within reach. Fur-thermore, the algorithms provide easy ways to perform sensor fusion and are easyto extend with more sensors. In addition, the toolkit provides methods to access aubiquitous user-modeling cloud-service and a local blackboard-service.
127

128 LOCATO: LOCALIZATION TOOLKIT
4.1 Overview on the Localization Toolkit
LOCATO provides basic building blocks and additional tools to easily design and de-ploy positioning systems. It contains three core algorithms, each addressing differentneeds:
• Proximity Detection: This core algorithm can be used for low cost offboard-exocentric positioning. As the name already implies, it relies on simple prox-imity sensing and thus provides only coarse position accuracy.
• Frequency Of Appearance (FOA): This core algorithm is designed for on-board/egocentric opportunistic positioning. The FOA algorithm provides anovel, specially designed fingerprinting method that omits signal strength mea-surements and thus enables a more stable position determination and eases theprocess of sharing user-collected reference-fingerprints.
• Geo Referenced Dynamic Bayesian Networks (geoDBN): This core algo-rithm is designed for onboard/egocentric positioning systems with designedinstrumentations. The geoDBN algorithm is another novelty and is designedto built high accuracy positioning systems that are easy to extend with newsensors.
The FOA and geoDBN algorithms follow the Always Best Positioned paradigm inthat they are easily expandable with further sensors and that they work with any sub-set of provided sensors. Each core algorithm is available in Java, FOA and geoDBNare additionally available in C++. For each of the three core algorithms, example sys-tems have been built, which are described in more detail in Section 4.2, Section 4.3and Section 4.4.
Additionally, LOCATO provides support to the cloud service UBISWORLD (see Sec-tion 2.4.2.1), which allows to update user-profiles with position information andalso provides access to the spatial ontology UBISEARTH. The connection to UBIS-WORLD is complemented with access methods to a local blackboard service, whichallows users to connect to a local infrastructure, e.g. in a shop or airport, which inturn can provide additional context- or location-aware services, like automatic dooropening, or navigation services. As FOA and geoDBN support the creation of on-board/egocentric positioning systems, it is up to the user to decide whether they wantto connect to UBISWORLD or the blackboard service and how much informationthey are willing to share.
Figure 4.1 shows the components of LOCATO in a block-diagram. In the follow-ing, the three core algorithms as well as the external connections and tools will bedescribed in more detail.

4.1O
VE
RV
IEW
ON
TH
EL
OC
AL
IZA
TIO
NT
OO
LK
IT129
Figure 4.1: Overview on LOCATO – Localization Toolkit

130 LOCATO: LOCALIZATION TOOLKIT
4.1.1 Proximity Detection
The proximity detection algorithm is very simplistic and is tailored to the use ofBluetooth, although it can be easily extended to other sensor technologies. However,as it is a proximity detection, it should mainly be used with near-sensors, like NFCor passive RFID. As it is designed for offboard/exocentric positioning, sensors haveto be installed in the environment, which must have a Java compliant computationdevice attached. The basic idea of the proximity detection algorithm is to periodi-cally inquire the attached sensor and either use the data locally or to forward it to theblackboard service. When used locally, it can only be inferred that the sensed senderis in the proximity of the device. When the data is forwarded to the blackboard,sensor devices can exchange data, which allows a higher accuracy for positioning orthe inference of a moving direction. Furthermore, algorithms running on other com-puting devices in the environment can subscribe to the data and can in turn providelocation based services. Of course it is possible, to use different kinds of sensors,which all report their data to the blackboard. However, the core algorithm only pro-vides the basic structure to periodically scan the sensor and to forward the data onthe blackboard. All other inference has to be done by additional services.
A Bluetooth based example system called OUT OF THE BLUE is described in moredetail in Section 4.2.
4.1.2 Frequency-Of-Appearance Fingerprinting (FOA)
The basic method of fingerprinting was described in Section 2.5.3. In Section 3 itcould be seen that all fingerprinting systems incorporate the measured signal strengthinto their fingerprints. However, the signal strength is also very sensitive to environ-mental conditions, e.g. air humidity and people present in a room. Furthermore,reference fingerprints have to be collected, either by the operators of the building orby users themselves. With the latter method, a crowd-sourcing approach seems veryreasonable, since this distributes the work onto many shoulders, and in the case of anonboard/egocentric opportunistic positioning system, no cooperation of the buildingowner is necessary to enable a working positioning system. In order to enable sucha crowd-sourcing approach, the collected fingerprints have to be compatible to dif-ferent devices. In this case, the incorporated signal strength poses another problem,since the measured signal strength also depends on the device itself, i.e. the antennadesign, the case design including the used materials, the remaining battery strengthand the used chipsets influence the signal strength measurements.
The developed Frequency-Of-Appearance (FOA) fingerprinting overcomes theseproblems, by replacing the signal strength measurements through observations on

4.1 OVERVIEW ON THE LOCALIZATION TOOLKIT 131
!"#$%&'&"#()*+&),-.%/0012)
3%44)5672))4778784; FOA: 3/3 = 100% 4778791; FOA: 2/3 = 67% ))8"!")9:72))00:0b:0e:1b:37:40; FOA: 3/3 = 100% 00:0b:0e:1b:37:42; FOA: 1/3 = 33% 00:0b:0e:1b:37:44; FOA: 1/3 = 33% 00:0b:0e:1b:3f:c0; FOA: 2/3 = 67% 00:0b:0e:1b:3f:c2; FOA: 2/3 = 67% ;4<%(++(=)5672))00:22:fd:91:53:23; FOA: 2/3 = 67% 00:22:fd:34:d3:32; FOA: 1/3 = 33%
>#?'7=+()@2)!"##$%&'($)*++,+,*-$*++,+./0$1232$45'($)66(67(6"(/7(8+(*6-$66(67(6"(/7(89(:6-$66(67(6"(/7(89(:;0$<#=">??>@$%&'($)66(;;(9A(8*(A8(8;0$
>#?'7=+()02)!"##$%&'($)*++,+,*-$*++,+./0$1232$45'($)66(67(6"(/7(8+(*6-$66(67(6"(/7(8+(*;-$66(67(6"(/7(89(:6-$66(67(6"(/7(89(:;0$<#=">??>@$%&'($)66(;;(9A(./(B8(;80$
>#?'7=+()A2$!"##$%&'($)*++,+,*0$1232$45'($)66(67(6"(/7(8+(*6-$66(67(6"(/7(8+(**0$<#=">??>@$%&'($)66(;;(9A(./(B8(;80$
Figure 4.2: Example calculation of a Frequency-of-Appearance fingerprint withm = 3: The appearance of each ID in all three snapshots is counted out and therelative appearance is stored in the fingerprint along with a semantic description ofthe current position.
how often a particular sender was sensed over a period of time. Furthermore, FOAfingerprinting can be used to fuse an arbitrary number of sensors in the sense of theAlways Best Positioned paradigm.
In order to acquire these FOA fingerprints, repeated measurements – so called snap-shots – are taken. The duration of such a measurement (SnTime, short for SnapshotTime) depends on how fast the device can complete the scans for each sensor. De-pending on the sensor type, increasing the SnTime can result in detecting moresenders.
Each snapshot contains a list of all sensed senders from any of the used sensors.Depending on the sensor type, or more specifically, on the data that each sensordelivers, an identifier has to be identified that uniquely describes a sensed sender.For example, the ID of a cell, the MAC of a WiFi enabled device or the MAC ofBluetooth enabled device. Each ID (since MAC addresses are just another form ofidentification, the term ID is from now on used to denominate MAC addresses aswell as any other form of ID) can appear only once in one snapshot.
An FOA fingerprint is generated by taking a specified number m of snapshots andthen counting how often each ID was seen in those m consecutive measurements.Since an ID has to be seen at least once to be part of the fingerprint, and because itcan at most be seen in every snapshot, it follows that 1 ≤ counterID ≤ m, wherecounterID is the counter for a specific sender ID. An example calculation withm = 3is given in Figure 4.2. This example is taken from UBISPOT, which is described inmore detail in Section 4.3. The resulting reference-fingerprint is stored along with arepresentation of the position in which the measurements were taken.

132 LOCATO: LOCALIZATION TOOLKIT
!"#$%&'()"*+)
!"#$%&'()",-)
!"#$%&'()"*-)
!"#$%&'()")
!"#$%&'()"*+,.)
!"#$%&'()"*+,-)!!!"
!!!"!!!"
#$%&'()*"+"/#0(1234)/'"56(123)789!:);<<#=)'>)?3@@)AB%);<<#=)'>)C6D6);9%);<<#=)'>)E@13(''(&)AB%)
DADF)G1313)H6(&)@3"5(&)!"B1<#0'"I)#$!%&$'()*+$,%))J)!)K)+'#$!%"
B1<#0'"I)+'#$!%"
Figure 4.3: Calculation of Frequency-of-Appearance fingerprints with a FIFO queueof length m and resulting duration TimeWindowSize.
Efficient Calculation of FOA Fingerprints
In order to efficiently calculate FOA fingerprints, incoming snapshots are organizedinto a FIFO queue with an adjustable length. Figure 4.3 shows the general struc-ture of such a queue with length m. Since the length of the FIFO largely con-tributes to the time that is needed to collect the data for one fingerprint, it is calledTimeWindowSize.
When starting the FOA fingerprinting, each snapshot entering the FIFO is analyzedand for each detected ID new counters are initialized or existent counters are in-creased, depending on whether the ID has been seen before. The time that is neededto fill a queue with length m can be calculated by multiplying the queue length withthe time needed to obtain one snapshot, i.e. m ∗ SnTime. To obtain the first finger-print, the counters are normalized by the length m of the FIFO, to get a value that isindependent of the queue length. After this initial calculation, a new fingerprint canbe generated every SnTime seconds.
It follows that a subsequent fingerprint can only differ slightly from the direct pre-decessor, which on one hand is a desired effect, since the FIFO should prevent thesystem from toggling too fast between different locations. On the other hand, a highvalue for m will also prevent a fast recognition of an actual room change. Hence,

4.1 OVERVIEW ON THE LOCALIZATION TOOLKIT 133
the value m is subject to a trade-off between stability and response of the positioningsystem. This trade-off will be further analyzed and discussed in conjunction withUBISPOT in Section 4.3.4.
4.1.2.1 Matching Fingerprints to Locations
For position determination, a positioning system has to compare its currentlymeasured fingerprint with the fingerprints stored in a database. This can bedone by calculating the strength of a linear relationship between two sets offingerprints, also known as the correlation coefficient of two random variables([Clauss and Ebner, 1975], pp. 115–128). Consider two different fingerprints A ={a0, ..., an}, B = {b0, ..., bn}. Each element in the set indicates different measuredIDs of the same type of sender (e.g. WiFi access-points) with relative frequency ofappearance ai and bi where i ∈ {1, ..., n}. The product-moment correlation coeffi-cient rA/B is used to estimate the correlation of A and B:
rA/B =
∑ni=1 (ai − a)(bi − b)
(n− 1)sasb(4.1)
Here, a and b are the means of A and B, and sa and sb are their standard deviations.According to [Cohen, 1988, pp. 109–139], the correlation coefficient between A andB has a significant impact, if the absolute value of rab lies in the range of [0.50, 1.0].
Example Calculation
Given are two fingerprints in the database, one for location L1 and one for locationL2, which are close together and thus contain the same access points. Let L1 be{3, 2, 2, 4} and L2 = {1, 4, 0, 2}, meaning that the first access point was measured 3times in locationL1 and once in locationL2. The second access point was measured 2times inL1, 4 times inL2 and so on. Assumed that the current measured fingerprint Fis {4, 2, 3, 4}, the computed correlation coefficients are rF/L1 ≈ 0.8181 and rFL2 ≈−0.5606, meaning that location L1 has a higher correlation to the current fingerprintthan L2 and thus L1 is more likely to be the current position.
4.1.2.2 Efficient Calculation of the Correlation Coefficient
By closely examining Equation 4.1, it can be seen that n + 2 multiplications,2n + n − 1 + 1 = 3n additions and one division have to be performed in orderto obtain the correlation coefficient for two fingerprints, each containing n values,leading to O(4n) when ignoring the possible speed differences between additions,

134 LOCATO: LOCALIZATION TOOLKIT
multiplications and divisions. This number of operations can be fairly reduced byfurther examining the numerator in the fraction of Equation 4.1:
n∑i=1
(ai − a)(bi − b) (4.2)
The dividend alone contributes n multiplications and 3n− 1 additions to the overallcount of operations. By expanding, the sum above can be rewritten as:
n∑i=1
(aibi − aib− abi + ab) (4.3)
Since every summand contains the constant term ab, it can be taken out of the sumand quickly computed by nab and the remaining sum can be split into 3 sums. Thusthe term can be rewritten as:
nab+n∑i=1
(aibi)−n∑i=1
(aib)−n∑i=1
(abi) (4.4)
The two last sums contain the constants b and a respectively, meaning that theseconstants can be taken out of their sums:
nab+n∑i=1
(aibi)− bn∑i=1
(ai)− an∑i=1
(bi) (4.5)
Taking into account that the arithmetic mean x of a set of values xi is defined as
x =1
n
n∑i=1
xi (4.6)
the values of∑n
i=1(ai) and∑n
i=1(bi) can be efficiently calculated by na and nb,eliminating the need of the last two sums and leading to:
nab− bna− anb+n∑i=1
(aibi) = −nab+n∑i=1
(aibi) (4.7)
Equation 4.1 can thus be rewritten as:
rab =(∑n
i=1 (aibi))− nab(n− 1)sasb
(4.8)
reducing the computation to n+ 4 multiplications, n− 1 + 2 = n+ 1 additions andone division, or O(2n). Compared to the original runtime of O(4n), this is twice asfast for large values of n.

4.1 OVERVIEW ON THE LOCALIZATION TOOLKIT 135
4.1.2.3 Ranking System
As already indicated above, correlation coefficients should at best be applied to mea-surements of the same class, i.e. only WiFi access points, only cells or only Bluetoothdevice IDs. In theory, it would be possible to calculate the correlation coefficientover a mixed set of measurements, but taking the different characteristics of differentsenders and sensors into account, e.g. different ranges and stability of the signals, thisseems not a good idea. Instead, the fingerprints are separated into sub-fingerprints,i.e. one sub-fingerprint for each sensor type. This also opens up the possibility toassign different weights to each sensor type.
The correlation coefficient for each sub-fingerprint is calculated separately. To com-bine these results, a ranking system is used, i.e. score points (abbreviated as Sc) areassigned to indicate a level of matching-accuracy. The computed correlation coeffi-cients are used as a basis for these score points. As already mentioned above, a goodcorrelation is given if |rA/B| ∈ [0.5, 1.0]. For example, in UBISPOT only those lo-cations are considered as matching candidates, whose coefficient lies in the intervalof [0.6, 1.0]. To reduce the computational effort, it is good practice to choose onesensor type as a filter to be able to reduce the candidates for the current position. Forexample, in UBISPOT, the sensed cell ID is used to preselect only those reference-fingerprints that contain the sensed cell ID. The computation of the score-points isshown in Algorithm 1.
Algorithm 1 FOA Ranking ComputationLet F denote the current fingerprint consisting of m sub-fingerprints for m sensors:F = {SF0, . . . , SFm}Let L = {L0, . . . , Ln} be the set of n candidate-fingerprints, where each Li consistsof m sub-fingerprints SLij (0 < i < n and 0 < j < m).
1. For each candidate-fingerprint Li of L:
(a) initialize the score-point counter for candidate Li: Sc(Li) = 0
(b) For each sub-fingerprint Lij of Li:
i. update the score-point counter using the correlation coefficient and aweighting factor wjSc(Li) = Sc(Li) + wjrSFj/Lij
2. Select the candidate Lk with the highest achieved score-point value Sc(Lk) asthe current position
3. Done.

136 LOCATO: LOCALIZATION TOOLKIT
4.1.2.4 Summary
FOA fingerprinting is especially designed for opportunistic systems. By eliminat-ing signal strength information from the content of the fingerprints and replacing itthrough the frequency of appearance, a more stable positioning determination is en-abled. Furthermore, created reference-fingerprints can be easily exchanged betweendifferent devices, which eases the process of sharing collected fingerprints in a Web2.0 fashion (crowd-sourcing). UBISPOT is a practical example of an opportunis-tic onboard/egocentric positioning system using FOA fingerprinting and enablingcrowd-sourcing of reference fingerprints. UBISPOT is thoroughly described in Sec-tion 4.3, where also an evaluation is given.
Although originally designed for semantic position representation, FOA fingerprintscan also contain numerical coordinates. In that case, Algorithm 1 can be extendedin the penultimate step, by calculating the center of mass of all position candidates,using the normalized score-points as weights.
The FOA method can be easily extended with more sensors, by simply adding iden-tification information for sensed entities to the fingerprint vector and specifying anaccording weight. As a matter of fact, LOCATO allows to specify a JAVA-methodfor each sensor-type, in which more elaborated score functions can be implemented.Furthermore, the algorithms are designed such that they follow the Always Best Po-sitioned paradigm, i.e. they work with any subset of supported sensors.
4.1.3 Geo-Referenced Dynamic Bayesian Networks (geoDBN)
Geo-referenced dynamic Bayesian Networks (geoDBNs) are based on dynamicBayesian networks, as described in Section 2.6.3. As a matter of fact, the exam-ples given in Sections 2.6.3 and 2.6.3.1 were simplified versions of geoDBNs.
The basic idea of geoDBNs is to use the concept of Bayesian Networks to create amore general model for the behavior of Kalman filters and particle filters. This isaccomplished by creating several instances of a generic geoDBN, which describesthe characteristics of the used sensors and the according senders, at each possi-ble location and collecting evidences in subsequent time-slices. Instead of creatingone huge network that contains all senders installed in the environment, geoDBNsassume that all senders of the same type have the same reliability. This greatlyreduces the demand on computational power and memory requirements, which isan important aspect for any system that runs on resource-limited hardware, likea mobile device. Figure 4.4 shows an example of such a generic geo-referencedBayesian network (the dynamic part will be discussed further below) and its condi-tional probability tables. This example network uses two different sensors: Sen-

4.1 OVERVIEW ON THE LOCALIZATION TOOLKIT 137
Figure 4.4: Example of a geo-referenced Bayesian network and corresponding con-ditional probability tables.
sor1 and Sensor2. The network consists of three nodes: the top node, labeledUserPos=GeoPos, contains two states – yes and no – indicating whether a user isat position UserPos or not. The two lower nodes are sensor nodes, each contain-ing two states as well: detected and not detected. As stated above, several in-stances of this network are created at runtime, where each instance represents apossible location of the user. The term geo-referenced stems from the fact, thatthe top node of the network represents the belief that a user is standing at a spe-cific position, and thus the whole network is geo-referenced to that position (see also[Schwartz et al., 2010a, Schwartz et al., 2005, Brandherm and Schwartz, 2005]).
The basic interpretation of the geoDBN in Figure 4.4 is as follows: if the currentuser position UserPos is the same as the position GeoPos of the currently consideredgeoDBN, then there are certain probabilities that the user’s device will sense sendersthat signal this position. These probabilities, which can be estimated based on tests,are coded in the CPTs of the sensor nodes. The example values in Figure 4.4 aretaken from LORIOT. The two states of each sensor node – detected and not detected– represent the probability whether a sender for Sensor1 or Sensor2 is detected ornot. Thus, four basic cases have to be considered:
case P The user is standing at GeoPos
case P The user is not standing at GeoPos
case S1/2 The device is detecting the signaling sender for GeoPos
case S1/2 The device is not detecting the signaling sender for GeoPos
The CPTs contain probability values for each combination of a1/2 and b1/2:
Sensor1. A probability of 90% (P , S1) is assumed that a present sender will bedetected by Sensor1, and a 10% (P , S1) chance is assumed that a present sender isnot detected if the user is at GeoPos. The probability that a user who is not at position

138 LOCATO: LOCALIZATION TOOLKIT
Figure 4.5: Time-slices of a geoDBN and the corresponding conditional probabilitytables for the transition edge between two time-slices.
GeoPos will nonetheless detect the sender is considered 5% (P , S1). A 95% (P , S1)probability is given to the event that the user is not at GeoPos and will not detect thesender.
Sensor2. The CPT of the Sensor2 node is interpreted in the same way. For Sen-sor2 a larger sensing range and higher probability for overreach is assumed. Thus,the probability distribution is more even: 60% (P , S2) probability to detect an appro-priate sender if the user is at GeoPos and 40% (P , S2) to not detect it. 30% (P , S2)probability to detect the sender even if not at GeoPos and 70% (P , S2) to not detectit.
The static part of geoDBNs, which was discussed so far, only covers one measure-ment. If geoDBNs were only static Bayesian networks, previously measured sensordata would have no effect on the calculation of the current position. Through the useof dynamic Bayesian networks, the previous position can be taken into account byintroducing an edge leading from one time-slice to the subsequent one. Figure 4.5shows several time-slices of a geoDBN and the CPT assigned to the inter-time-sliceedge. This edge is taken into account when the roll-up of the current time-slice iscalculated (see Section 2.6.3) and thus influences the calculations of the next time-slice. This CPT models the movement of the user, and thus mimics the predictionstage in a Kalman or particle filter.
According to [Weidmann, 1993] normal walking speed lies in the interval of 0.5to 2.2 m/s with an average of 1.34 m/s, meaning that a user covers a maximumdistance of 2.2 meters in one second. Depending on the sending range of the usedsenders, not much difference is expected between two subsequent time-slices. These

4.1 OVERVIEW ON THE LOCALIZATION TOOLKIT 139
considerations should be taken into account when modeling the probabilities of theCPT. Again four cases have to be considered, taking the current time-slice t and thenext time-slice t+ 1 into account:
case Pt The user is currently standing at GeoPos (UserPos = GeoPos in time-slice t)
case Pt The user is currently not standing at GeoPos (UserPos 6= GeoPos intime-slice t)
case Pt+1 The user will stand at GeoPos in the next time-slice (UserPos =GeoPos in time-slice t+ 1)
case Pt+1 The user will not stand at GeoPos in the next time-slice (UserPos 6=GeoPos in time-slice t+ 1)
As in the case of the sensor nodes, the CPT contains all combinations of Pt/Pt andPt+1/Pt+1. If a user is at GeoPos in the current time-slice, a probability of 70% (Pt,Pt+1) is assumed that they will be at the same position in the next time-slice. Theprobability that they will not be at the same position in the next time-slice is set to30% (Pt, Pt+1). If a user is not at GeoPos in the current time slice, the probability thatthey will be at GeoPos in the next time-slice is set to 0.1% (Pt, Pt+1). The probabilitythat they still will not be at GeoPos in the next time-slice is set to 99.9% (Pt, Pt+1).
Example Calculation
In order to estimate the current user position, the evidences for the sensor nodes ofthe geoDBN are set according to sensor measurements. The belief of the top-node(UserPos = GeoPos) is then calculated using standard Bayes inference algorithms.
As an example, assume that a system with two sensors (Sensor1 and Sensor2) thatcan detect senders of type Sender1 with Sensor1 and of type Sender2 with Sensor2.If the system just detected a previously unseen Sender2 with a specific coordinate,it will instantiate a new geoDBN and the state detected will be set to 100% and thestate not detected will be set to 0% in the Sensor2 node.
If no senders of type Sender1 signaling for the same coordinate were detected in thecurrent and previous time-slides, both states in the Sensor1 node will be left at theira-priori probability since the system cannot decide whether there is a Sender1 presentthat was just not detected or whether such a Sender1 does not exist . Using the givenCPTs, the inference algorithm will result with a belief of 9.52% for the event thatUserPos = GeoPos.

140 LOCATO: LOCALIZATION TOOLKIT
Figure 4.6: A cloud of geoDBNs arises around the user. Each geoDBN has a weight(indicated by the size of each geoDBN in this picture), determined by its belief thatthe user is standing at its position. The user’s position is estimated by calculating thecenter of mass of the cloud.
If the same Sender2 is measured again in the next time-slice, the states of the Sen-sor2 nodes will again be set accordingly and the inferred probability for UserPos =GeoPos rises to 12.66%. If the Sender2 will not be measured again in the third mea-surement, the state not detected will be set to 100% and detected to 0%, since theSender2 has been seen before and thus the system can infer that such a tag exists butwas not detected. With the states set accordingly, the belief will drop to 5.32%. Onthe other hand, if the Sender2 and a Sender1 for the same coordinate is detected, thebelief will rise to 77.96%.
In short, if senders are measured repeatedly in subsequent time-slices, the computedprobability of the UserPos=GeoPos node will rise depending on the reliability ofthe detected senders. It will fall if a sender is not measured again. This resemblesthe Frequency Of Appearance method of LOCATO, since repeated detections of asender are indirectly taken as a measure for the distance to the user. Furthermore,the geoDBNs help to smooth out false positives, e.g. overreach of senders, as well asfalse negatives, e.g. receiving-errors by a sensor.
4.1.3.1 Position Estimation
As already indicated, new geoDBNs are instantiated for each newly detected senderand existing geoDBNs are updated for previously detected ones. Repeated measure-ments lead to a number of geoDBNs, each giving a probability – or rather a belief– that the user is at the position of the geoDBN. Graphically speaking, a cloud of

4.1 OVERVIEW ON THE LOCALIZATION TOOLKIT 141
geoDBNs arises around the user where each geoDBN is a particle of that cloud (asillustrated in Figure 4.6). The weight of each particle is determined by the belief ofthe respective geoDBN. The estimation of the current user position is calculated asthe weighted sum of the coordinates of these particles:
UserPos(t) = αn∑i=1
w(GeoDBN[i]) GeoPos(GeoDBN[i]) (4.9)
Here, n is the number of existing geoDBNs at time t (n ≥ the number of receivedsenders at time t), GeoPos(GeoDBN[i]) is the coordinate and w(GeoDBN[i]) theweight of the ith geoDBN. α is a normalization factor that ensures that the sum of allweights multiplied with α is one.
α =1∑n
i=1w(GeoDBN[i])(4.10)
A new estimation of the current position can be calculated after each new measure-ment. The schematic approach looks like this:
Algorithm 2 Basic Algorithm for the Position Calculation with geoDBNs
1. Perform a new measurement by inquiring all sensors.
2. Obtain the coordinates of each detected sender.
3. Extend every existing geoDBN with a new time slice and cut off the old timeslice.
4. Insert the new evidences of the sensors:
(a) If there is not already a geoDBN at a received coordinate, create a newgeoDBN and insert the evidence.
(b) If there is a geoDBN at a received coordinate, insert the evidence in thecurrent time slice.
5. Go through all geoDBNs and calculate the estimation that the user is at theassociated coordinate.
6. Sort the geoDBNs in descending order of their belief.
7. Mark geoDBNs as unused that provide an estimation that is lower thanthresholduse.
8. Calculate the user position by considering only those geoDBNs that providean estimation above thresholdconsider.

142 LOCATO: LOCALIZATION TOOLKIT
4.1.3.2 Efficient Calculation
Since geoDBNs were designed to run on mobile devices, calculation cost and mem-ory usage are crucial. To reduce both, the number of instantiated geoDBNs mustbe as low as possible. To achieve this goal, geoDBNs with a weight lower thanthresholduse are marked as unused (see step 7 in Algorithm 2).
To keep the overhead for memory management low, these unused geoDBNs can be‘recycled’ by resetting them to initial values and new coordinates. Furthermore, amaximum number of possible geoDBNs can be specified. If this number is exceeded,those geoDBNs that provide the least estimation will be deleted.
The dynamic Bayesian networks themselves were implemented using a tool calledJAVADBN (see [Brandherm, 2006]). This tool provides a graphical user interfaceto model dynamic Bayesian networks of nth order and automatically generates Javaor C++ code for the modeled networks. The resulting code is already optimizedregarding computational complexity as well as memory usage and contains inferenceas well as roll-up algorithms.
4.1.3.3 Summary
GeoDBNs are designed for high accuracy onboard/egocentric positioning systems ininstrumented environments following the Always Best Positioned paradigm. As it isthe case with FOA fingerprinting, signal strength values can be omitted to provide ahigher stability. However, they can also easily be integrated, e.g. by using evidencevalues for the sensor nodes that are proportional to the measured signal strength.
GeoDBNs resemble particle filters in that they provide hypotheses at different po-sitions, collecting evidence over time. Other than particle filters, the number ofhypotheses (particles) is not fixed, but rather depends on the number of sensedsenders. Thus, the number of hypotheses automatically adjusts to the environmentand through the thresholding in Algorithm 2, hypotheses that are too far away, or leftbehind, are automatically removed over time.
Besides using numerical coordinates, also semantic descriptions can be used to ref-erence the geoDBNs. In that case, each geoDBN can be seen as a vote for a spe-cific location, where each vote has a weight proportional to the calculated belief. Astraightforward way to determine a position is to choose the geoDBN with the high-est vote. If a hierarchical location model is used, votes on lower layers can be addedon higher layers of the hierarchy. By using a defined threshold, the layer exceedingthe threshold can be chosen as the current location.

4.1 OVERVIEW ON THE LOCALIZATION TOOLKIT 143
Figure 4.7: FOA systems can be integrated into geoDBN systems by adding a noderepresenting the FOA system.
New sensors can be easily added by inserting a new sensor node and specifying theCPT of that new node. IMU sensors (see Section 3.2) can be easily integrated, byusing them to adapt the CPT entries of the inter-time-slice edge between succeedingtime-slices.
Any other positioning system can be integrated as a subsystem, also by adding a newsensor node, which represents the subsystem, and specifying the reliability of thesubsystem in the CPT of that node. With this method GPS can be easily integrated,but also any other system that is able to derive a compatible position representation.However, systems using trilateration, multilateration or triangulation rely on havinga line of sight to enough senders. In situations in which not enough senders canbe sensed, such a subsystem will not contribute to the position determination. Toovercome this restriction, the sensors of the subsystem themselves can be includedin addition, again as sensor nodes. Using this method, even in the case that notenough senders are present, a coarse position-estimation is possible.
With the same approach it is possible to integrate an FOA based positioning systeminto a geoDBN system. The prerequisite for this is that both systems use the same po-sition representation, i.e. numerical coordinates or semantic descriptions, or that theposition representation of the FOA system can be translated into that of the geoDBNsystem. Figure 4.7 shows an example with n sensor nodes and one FOA node.
LORIOT, which is described in Section 4.4, is an example of an onboard/egocentricpositioning system that is built with geoDBNs. LORIOT uses active RFID tags andinfrared beacons as senders in indoor environments and GPS for outdoor positioning.The system was also rigorously evaluated, using step-accurate traces as ground-truth(see Section 4.4.4).

144 LOCATO: LOCALIZATION TOOLKIT
4.1.4 External Connections and Tools
4.1.4.1 Blackboard: iROS Event Heap
The name Blackboard-Service is very descriptive. As a matter of fact, such a ser-vice works like a blackboard at a public place: people write messages onto it andother people can read them. In conjunction with LOCATO, the iROS Event Heapwas used, which was developed at Stanford University by [Johanson et al., 2002,Johanson and Fox, 2002]. The Event Heap is a client-server architecture imple-mented in Java. The Event Heap server stores and organizes messages as tuples,called events. Clients can connect to the server in order to send and receive events.Single events contain several named standard fields, where some are mandatory andothers are optional. The mandatory fields are EventType, which is a freely chosen butunique String that describes the type of the event, SourceID, which uniquely identi-fies the sender of the event, and TimeToLive, which states a number of milliseconds,after which the event will be deleted. Furthermore, fields can be defined, whichcontain the actual content of the message. For example, the OUT OF THE BLUE sys-tem sends events of the EventType ”RAWBLUETOOTH”, which contains detectedBluetooth addresses in a field called ”BTADDRx”, and a semantic description of thelocation of the client in a field called ”LOCATION”.
Clients can subscribe to events, where filters can be specified to subscribe for specificevents, e.g. all events of specific EventType, or only events that were sent by aspecific sender. Events are stored on the server and distributed as long as the specifiedTimeToLive value was not reached. With this mechanism, clients that connect to theserver can still receive events that were sent before the connection. The iROS EventHeap was chosen because of its open architecture, which allows to send arbitrarymessages.
4.1.4.2 UBISWORLD
UBISWORLD and its subsystem UBISEARTH were already described in Sec-tion 2.4.2.1. LOCATO provides access methods to both services, where the connec-tion to UBISEARTH is used to gain access to the spatial ontology in order to querythe ontology, to download parts of it or to modify and extend it. The connection toUBISWORLD is mainly used to update user profiles with the current position of theuser. As UBISWORLD also stores old values for each user profile to some extend, aspecial view was implemented in UBISWORLD, which allows a user to visualize ahistory of their positions in a so-called film metaphor. Figure 4.8 shows an exampleof such a position history in the film metaphor.

4.1 OVERVIEW ON THE LOCALIZATION TOOLKIT 145
Figure 4.8: UBISWORLD provides a film-metaphor view of the history of positionsof a user.
4.1.4.3 YAMAMOTO
In order to use the geoDBN core algorithm of LOCATO, the environment has to beinstrumented with senders. The coordinates of these senders have to be determinedand stored somewhere. For example, in the case of LORIOT, the coordinates arestored directly onto active RFID tags. However, the deployment of senders has tobe planned according to the environment a positioning system should be used in.Having a detailed model of the environment provides great help to plan the neededinfrastructure.
In [Stahl and Haupert, 2006], YAMAMOTO (Yet Another MAp MOdeling TOolkit)was introduced as a toolkit to quickly and efficiently create such detailed modelsof multi-story buildings. To model a building, an architectural floor plan is used asbackdrop image and the outlines of rooms and corridors are manually traced, leadingto a 2D representation of each story represented by vertices and edges.
By marking edges as being doors, windows or walls the 2D model can be extendedto a so-called 2.5D model, which allows vertical arranging of multiple stories. As-sociating semantic attributes, like not passable, passable for pedestrians or passablefor wheelchairs to edges, allows for user-adapted route finding and planning. Fig-ure 4.9a shows a screen shot of YAMAMOTO during the modeling process of buildingE11 at Saarland University.

146 LOCATO: LOCALIZATION TOOLKIT
(a) Screenshot of YAMAMOTO (b) IR beacons and active RFID tags modeled withYAMAMOTO
Figure 4.9: YAMAMOTO can be used to model a building and plan the positioninginfrastructure. Shown are IR beacons (red), active RFID tags (green) and Bluetoothbeacons (blue).
YAMAMOTO was extended to represent different senders, like infrared beacons,RFID tags, WiFi access points or Bluetooth beacons ([Stahl and Schwartz, 2010]).
Three basic primitives are used to model various senders: Point (x, y) for senders thatshould be modeled without taking their range into account, like WiFi access pointswith unknown sending range, Circle(x, y, radius) for senders with radial sendingcharacteristics, like active RFID tags, and Section(x, y, radius, beam angle, orienta-tion) for directional senders, like IR beacons.
Each primitive can also be associated with a symbolic name and their sending ID.Figure 4.9b shows the model of the lab of Prof. Wahlster at Saarland University,including the LORIOT instrumentation.
A model derived with YAMAMOTO can also be geo-referenced to known points orareal photographs. In the latter case, the outline of the YAMAMOTO model can bemanually scaled and aligned to fit into the respective area of the building on an arealphotograph with known geo-references (as outlined in Figure 4.10).
YAMAMOTO automatically derives the needed scaling and rotation matrices to con-vert its internal coordinates into the coordinate system of the areal photograph.WGS84 compliant coordinates can thus be derived for every point inside the mod-eled building. If an instrumentation was planned with YAMAMOTO, the resulting listof senders can be exported to an XML format, called YML for Yamamoto ModelingLanguage, which includes the coordinates of each sender as well as their ID.

4.1 OVERVIEW ON THE LOCALIZATION TOOLKIT 147
Figure 4.10: YAMAMOTO allows to geo-reference a model by rescaling, resizing andplacing it into an already geo-referenced areal photography.
Simulation and Visualization with Yamamoto
As YAMAMOTO also has an interface to the blackboard service, it can also be usedto simulate the proximity detection core algorithm. An avatar can be freely movedinside the modeled building, either in a birds-eye’s view or in an egocentric perspec-tive, as known from 3D computer games. If the avatar’s coordinates are inside ofthe range of a modeled sensor with radial characteristics, the same events are sent tothe blackboard that would be sent in a real world deployment by the actual sensor.With this simulation, services can be tested prior to deploying the sensors in the realenvironment.
Furthermore, a TCP/IP socket connection is provided, which realizes the so-calledYamamoto Control Interface (YCI). The YCI is bidirectional, i.e. positions can bereceived and sent out. A positioning system can connect to the socket and providedetermined coordinates of a user. The avatar will then automatically be placed atthe determined coordinates. This communication direction can be used to visualizedetermined positions. The other direction, i.e. sending out the current coordinates ofthe user controlled avatar, can again be used to pretest location based services, priorto the deployment of the infrastructure. More features and practical applications ofYAMAMOTO, like activity modeling or route finding, are thoroughly described in[Stahl, 2009].
4.1.5 Summary
LOCATO provides three core algorithms. One that can be used to design offboard-/exocentric positioning systems, and two newly developed core algorithms to de-sign onboard/egocentric positioning systems that follow the Always Best Positionedparadigm. Of these two core algorithms, FOA is designed for opportunistic posi-

148 LOCATO: LOCALIZATION TOOLKIT
tioning systems, while geoDBN is designed for positioning systems in designed in-strumentations. The algorithms are optimized for low computational complexity andcan thus be executed on mobile devices with restricted resources. As explained inSection 2.3.2.5, onboard positioning systems can be easily converted into offboardpositioning systems. Thus, these two core algorithms can also be used to designoffboard/egocentric systems.
Furthermore, LOCATO provides access methods to the cloud service UBISWORLD,including its subsystem UBISEARTH, and access methods to a local infrastructureblackboard service, the iROS Event Heap. Both services can be used provide addi-tional services.
The external modeling toolkit YAMAMOTO can be used to design instrumentationsas well as to test the instrumentations prior to deployment, and to visualize the outputof a deployed positioning system.
The next three sections present example positioning-systems that were implementedusing LOCATO.
4.2 OUT OF THE BLUE: A Bluetooth-based Off-board/Exocentric Positioning System
OUT OF THE BLUE was designed as a very simplistic but also very coarse-grainedexocentric positioning system. It uses Bluetooth technology and its main advantagelies in the fact that users do not have to purchase any new device as long as theyalready own a Bluetooth enabled nomadic device. On the environment side, anystationary Bluetooth-enabled device that is capable of running Java and providesaccess to the Bluetooth stack via Java can be used to detect the presence of users.OUT OF THE BLUE is the only offboard/exocentric positioning system developed inthis thesis.
4.2.1 Hardware
4.2.1.1 Nomadic Device
OUT OF THE BLUE was designed to work with any Bluetooth enabled mobile device.The sheer Bluetooth capability is enough, since no additional software has to be
1http://www.bluenio.com2http://www.gearfuse.com/bluebird-keeps-an-eye-on-your-luggage/

4.2 OUT OF THE BLUE: OFFBOARD/EXOCENTRIC POSITIONING 149
(a) Wireless headset (b) nio™ Bluetoothtag1
(c) Bluebirdluggagetag2
(d) Sony Eric-sson T660
Figure 4.11: OUT OF THE BLUE is not limited to smartphones on the user’sside. Any Bluetooth enabled device is usable as positioning tag, including so-called‘dumbphones’.
installed on the user’s device. In that sense, a minimalistic Bluetooth circuit that isonly capable of receiving standard scanning requests and sending out an appropriateanswer could be used as positioning tag. Thus, the range of devices is not limitedto smartphones and the like, but also includes low-cost wireless headsets or specialBluetooth tags as shown in Figure 4.11.
4.2.1.2 Senders and Sensors
OUT OF THE BLUE uses Bluetooth for the instrumentation of the environment as wellas on the user-device side. Since Bluetooth relies on bidirectional communication,the basic technology is the same on both sides. There is however a difference in theneeded computing power.
As stated above, a minimalistic Bluetooth circuit is sufficient on the user side. Onthe instrumentation side, at least the ability to process the information gained fromperiodically scans is needed. To take full advantage of the system, there should alsobe a means to exchange this information with other devices on the instrumentationside.
In an office setting, the office workers’ desktop computers can be used to host theOUT OF THE BLUE software client. Usually, public displays also provide data con-nectivity as well as computational power and thus are perfect devices on the instru-mentation side. In both cases – desktop computers or public displays – the neededBluetooth capability can be retrofitted using USB dongles.

150 LOCATO: LOCALIZATION TOOLKIT
Figure 4.12: OUT OF THE BLUE consists of stationary devices, like desktop PCs,public displays or kiosk systems that scan their environment for mobile Bluetoothdevices, like cell phones, wireless headsets or Bluetooth tags. Information can beshared via a blackboard service and registered users can store their Bluetooth IDs inUBISWORLD.
4.2.2 Methods
4.2.2.1 Proximity Detection
As described in Section 3.1.4, every Bluetooth enabled device has a unique numericaddress. Two Bluetooth devices that want to exchange data need to know each other’saddresses. Since Bluetooth was also designed for ad-hoc communication, a Blue-tooth device can scan its surroundings for other Bluetooth devices or services. As aresult it gets a list of addresses of all Bluetooth devices that are willing to share thatinformation and that are in a close enough range.
The main idea behind OUT OF THE BLUE is that this mechanism provides a simplemeans to implement proximity detection: Stationary Bluetooth enabled devices, suchas desktop PCs or panel PCs used as public displays, can periodically scan theirenvironment for other Bluetooth devices. If such a stationary device has knowledgeabout the range of its own Bluetooth transceiver, it can derive which other Bluetoothdevices are in that range. Given additional information, i.e. the Bluetooth address ofthe mobile device of a certain user, it can infer whether that user is currently in itsvicinity.
Figure 4.12 shows an example setup of OUT OF THE BLUE. In such a setting, a publickiosk system at the entrance of a building could provide users the option to register

4.2 OUT OF THE BLUE: OFFBOARD/EXOCENTRIC POSITIONING 151
with the system. For ease of use, users can place their Bluetooth enabled device ina shielded box at the kiosk system, so that the Bluetooth ID of that particular devicecan be determined. If the user already has an UBISWORLD account, they can givepermission to certain parts of their user profile or they can register for a specificservice, e.g. route guidance to their destination. Along the way of the user, publicdisplays detect their Bluetooth ID and can then adapt their presentation to the user’sprofile or their requested service.
OUT OF THE BLUE runs on the aforementioned stationary devices and uses the prox-imity detection core-algorithm of LOCATO. It runs in the background and continu-ally scans the environment in a freely adjustable time interval. Such an OUT OF THE
BLUE sensor-node can operate in two modes: isolated or sharing. In isolated mode,a node keeps all information gained through the scanning process by itself, which isusually suitable for a public display to adapt its presentation to the number of usersin its vicinity or to show user specific information. In sharing mode, the resulting listof mobile devices is sent to the blackboard system (see Section 4.1.4.1), via the inter-faces provided by LOCATO. Each stationary device can therefore sense the presenceof registered users in their direct vicinity, but in the sharing mode they can also gainknowledge about users further away and can try to reason over this, e.g. to estimatethe walking direction.
The accuracy of the position depends on the range of the stationary Bluetooth devicesand on the range of the user’s mobile device. Most Bluetooth dongles available forPCs are Class 1 or Class 2, resulting in a range between 10 and 100 meters if noobstacles attenuate the signals. This range is usually decreased through walls, doorsand furniture indoors.
Since most modern mobile phones are Bluetooth enabled, this system is readily avail-able to a broad public. The missing feedback to the user about their own positionhowever limits its application to adequate services, like public displays adapting theircontent to the nearby users or user sensitive self-opening doors. An example servicethat was realized with OUT OF THE BLUE is given in Section 5.5.
4.2.3 Summary
OUT OF THE BLUE is an offboard/exocentric positioning system using a single sen-sor technology. With regard to the design criteria for positioning systems, it wasdesigned to minimize the cost of ownership for the users. As most mobile phonesare Bluetooth capable and simple Bluetooth devices – like wireless headsets – areavailable at low cost, Bluetooth was chosen as sensor technology. As the system wasdesigned for use with public displays, the cost of ownership for the positioning sys-tem is low compared to the costs of the public displays themselves. The low costs of

152 LOCATO: LOCALIZATION TOOLKIT
ownership is accompanied by a low accuracy, which is in the range of tens of meters,a low robustness, which is due to long inquiry times of the Bluetooth sensors, and alow privacy protection, due to the offboard/exocentric approach. In terms of usabil-ity and applicability, OUT OF THE BLUE is lightweight and small in size as it canbe used with any Bluetooth capable mobile phone. Due to the repeated Bluetoothinquiries, which have to be answered by the user’s mobile device, the battery con-sumption is increased. However, users who do not want to use the system can eitherswitch off Bluetooth or set their device into non-discovery mode to prevent higherbattery consumption.
4.3 UBISPOT: An Opportunistic Onboard/Egocen-tric Positioning System
UBISPOT is an onboard/egocentric opportunistic positioning system, as described inSection 2.3.3. The system uses standard, built-in sensors of modern mobile phonesto detect cells, WiFi access points and Bluetooth devices. For outdoor positioning,GPS is also taken into account.
UBISPOT can reach room level accuracy inside buildings and uses semantic descrip-tions based on the spatial ontology of UBISEARTH rather than numerical coordinates.Furthermore, UBISPOT does not only tackle the problem of determining the currentlocation of a mobile device, but also how a database containing locations and mea-surements can be established. This database can be privately created by each userto contain only their locations of interests or by sharing these entries in a Web 2.0fashion via UBISWORLD, of which UBISEARTH is a part ((see Section 2.4.2.1)).
UBISPOT was designed for context aware applications and services that do not relyon a meter or sub-meter level accuracy, but rather on the current area. One suchapplication is directly integrated into the system: automatic ring tone switching whenentering or leaving specified locations. Through the use of the spatial ontology, alsothe category of rooms in which the phone should be muted can be given instead, e.g.conference rooms or lecture halls.
The position determination is accomplished using the FOA fingerprinting algorithmsof LOCATO. UBISPOT was rigorously evaluated in an environment with small roomsbut high-density infrastructure of WiFi access points and Bluetooth devices, to de-termine the highest possible accuracy. The infrastructure was used as is, i.e. noadditional WiFi access points or Bluetooth devices were introduced into the environ-ment.

4.3 UBISPOT: OPPORTUNISTIC ONBOARD/EGOCENTRIC POSITIONING 153
!"##$%&$
'#(")**)+
$%&$'#(")**)+$%&$
'#(")**)+$%&$
'#(")*
*)+$%&$
'#(")**)+$%&$
,-!$-../"00$
,-!$-../
"00$
,-!$-../"00$
1"2"3.4$
!"##$5*6"/$
7898$-::"00$;*83)$'#(")**)+$&"<8:"$
!"##$%&$
=;>$>?)"##8)"0$
Figure 4.13: Sensors and senders of UBISPOT: GSM/UMTS cells, WiFi accesspoints and Bluetooth devices act as senders. For outdoor positioning, GPS is used inaddition.
4.3.1 Hardware
4.3.1.1 Senders and Sensors
UBISPOT uses the most common built-in data transmission transceivers of moderncell phones:
• GSM/UMTS commonly used for telephony and data transmission
• WiFi commonly used for Internet access
• Bluetooth commonly used for short-range voice/data transmission, e.g. wire-less headset or exchange of contact information
Although these technologies are able to communicate in both directions, for the usein positioning UBISPOT merely uses them as sensors. Figure 4.13 shows the respec-tive senders:

154 LOCATO: LOCALIZATION TOOLKIT
• Cell Towers broadcast a unique ID
• WiFi Access Points broadcast a unique MAC address
• Bluetooth Devices identify themselves with a unique Bluetooth ID
As described in Section 2.3.3, these senders are not installed into the environmentwith the purpose of positioning – they are already there, for either communication(cell towers, WiFi Access Points, Bluetooth) or to replace wires between devices andadditional hardware (Bluetooth).
4.3.1.2 Mobile Devices
UBISPOT was implemented for two mobile operating systems: Symbian OS v9.xPlatform S60 and Google Android. As testing platforms three mobile phones wereused: a Nokia E60, a Google/HTC Nexus One and a Google/Samsung Nexus S.The Nokia E60 provides GSM Tri-Band and UMTS Single-Band capabilities andhas integrated WiFi and Bluetooth transceivers. The mobile phone does not havea built-in GPS device, so a wireless Bluetooth GPS-receiver (Holux GPSlim 236)was attached for outdoor positioning. The E60’s ARM processor runs with only 220MHz, so it is the optimal platform to test the computational efficiency of the FOAalgorithm.
In addition to the built-in WiFi and Bluetooth transceivers, the Nexus One and NexusS phones have integrated GPS receivers and both provide GSM Tri-Band and UMTSTri-Band capabilities. The larger displays and the touch-screen functionality of bothdevices allow a better user-interface and usability. Furthermore, both Android de-vices run with a clock speed of 1 GHz. Figure 4.13 shows the Nexus One withrunning UBISPOT client as well as the senders that are used for positioning. UBIS-POT was tested on Android Version 2.3 (Gingerbread) and Version 4.0 (Ice CreamSandwich).
4.3.2 Methods
4.3.2.1 Frequency-Of-Appearance Fingerprinting
UBISPOT is based on the Frequency-Of-Appearance fingerprinting algorithm of LO-CATO, as described in Section 4.1.2. UBISPOT fingerprints contain a list of all sensedcell data, WiFi access point MAC (Media Access Control) addresses, Bluetooth de-vice IDs and the measured latitude and longitude of the GPS receiver, if available.Table 4.1 shows which data are captured for each sensor. Cells provide the most data,

4.3 UBISPOT: OPPORTUNISTIC ONBOARD/EGOCENTRIC POSITIONING 155
besides a unique cell ID, they also provide IDs for the local area, the country and thenetwork. As mentioned in Section 4.1.2.3, UBISPOT uses the cell data to providea pre-filtered list of candidates for the position determination through ranking. Ascells are available mostly everywhere and cover a large range, they are the optimalselection for this task.
Fingerprints are stored along with the semantic description of the position in whichthe measurements were taken in an XML format.
GPS GSM WiFi Access Point Bluetooth Device
Longitude
Latitude
Cell ID MAC Address Bluetooth ID
Local Area ID
Country ID
Network ID
Table 4.1: The collected data for each sensor in UbiSpot. Each Snapshot can containseveral instances of GSM, WiFi Access Point and Bluetooth Device.
4.3.2.2 Building and Sharing the Database
UBISPOT constantly calculates FOA fingerprints with the optimized FOA methoddescribed in Section 4.1.2. In order for users to train their system on a specific loca-tion, they indicate this by choosing the appropriate menu entry. UBISPOT uses thehierarchical location model of UBISEARTH to denominate the determined position(see also Section 2.4.2.1). The topmost hierarchy consists of Continent→ Country→ Region → City → Building. Moreover, users can share fingerprints via UBIS-WORLD. If a user enters a new area for which UBISPOT does not already providefingerprints, it tries to download them via UBISWORLD. In order to choose the cor-rect subtree of the spatial ontology in UBISEARTH, the currently sensed cell datais used. If no fingerprint data is available, users can train the system themselves.Moreover, users can add new nodes to represent different floors and specific areas orrooms of a building.
In order to do so, users can browse to their current location and refine the model totheir needs. Figure 4.14 shows how a user browses to the ’Chair of Prof. Wahlster’and adds a new location named ‘Office 118’. This new entry is then stored on the mo-bile phone together with the current FOA fingerprint. As can be seen in Figure 4.14e,each entry is also marked with a symbol: the orange dot denotes that an entry is ei-ther a parent node or an untrained child node. A green star shows that a child node’sfingerprints are up to date (at most seven days old), a yellow star shows that it isbetween seven and fourteen days old and a red star denotes that the fingerprint is

156 LOCATO: LOCALIZATION TOOLKIT
(a) (b) (c)
(d) (e) (f)
Figure 4.14: Training of a new location in UBISPOT: A user browses through theimported UBISEARTH location model and refines it by a new location. This locationis stored with the current fingerprint.

4.3 UBISPOT: OPPORTUNISTIC ONBOARD/EGOCENTRIC POSITIONING 157
(a) (b) (c) (d)
Figure 4.15: Output of the UI of UBISPOT: The confidence level of the system iscolor-coded: green for highest confidence, yellow for middle and gray for lowestconfidence.
older than fourteen days. If UBISPOT finds a data-connection, it automatically triesto update old fingerprints for the current area via UBISEARTH. In case that no newfingerprints are available, a user can choose to update them while being at locationand upload them to UBISEARTH. Figure 4.14e shows the details of a fingerprint thatwas taken in Office 118. The type of each sensed sender is shown (Cell, WiFi, Blue-tooth) as well as the obtained ID. The number after the ID shows the percentage ofhow often the according sender was observed.
4.3.3 Output to the User
After UBISPOT has determined the score points for the current measurement, itpresents the user its current position estimation. To depict the level of confidence– based on the derived score-points – a color coding is used:
1. Green, if the derived score-points for the location are above 85. This indicatesthat the system is certain that its estimation is correct.
2. Yellow, if the derived score-points for the location are between 75 and 84.
3. Gray, if the derived score-points for the location are between 45 and 74.
Examples for this color-coded output can be seen in Figure 4.15. Besides the nameof the current room, the overlying parts of the location hierarchy are also shown.

158 LOCATO: LOCALIZATION TOOLKIT
The direct parent and its predecessor node are shown directly above the room name(in these examples the Chair of Prof. Wahlster and the floor number). The otherancestor nodes are shown as a scrolling text (Germany>> Saarland>> Saarbrucken>> Saarland University >> Building E1 1). A statistical overview on the currentfingerprint is shown at the bottom of the screen. It contains the county ID (Country),network ID (Net), land area ID (LA) and number (Cell) of the strongest available cellas well as the number of currently sensed WiFi access points (IAP’s) and the numberof detected Bluetooth devices (BT’s). If a good GPS reception is given, the reportedlatitude and longitude will also be shown.
4.3.4 Evaluation
From the design of UBISPOT, a list of extrinsic and intrinsic factors that obviouslyinfluence the accuracy of the position estimation can be derived:
• available instrumentation (extrinsic)
– number of cell towers
– number of WiFi hotspots
– number of Bluetooth devices
• size of rooms or density of trained landmarks (extrinsic)
• number of trained landmarks in the system (intrinsic)
• TimeWindowSize used for the FOA fingerprinting (intrinsic)
The influence of single senders on UBISPOT can also be derived from the system’sdesign: if only a single cell tower is available, then UBISPOT will only be able toderive a rough location, e.g. Saarland University Campus. With only a single WiFihotspot, the derived area will be smaller, e.g. Building E11. The same holds for asingle detected Bluetooth device, only that the detection range will usually be muchsmaller. Regarding the extrinsic factors, the most interesting question is therefore ifUBISPOT can achieve room level accuracy in a highly instrumented environment butwith a high density of trained landmarks, i.e. small rooms. Since the lab of Prof.Wahlster in the computer science building of Saarland University provides such anenvironment, it was chosen as a test field for the evaluation.
The most interesting intrinsic factor is the used TimeWindowSize, since this pa-rameter can easily be modified. Since a larger TimeWindowSize contains more

4.3 UBISPOT: OPPORTUNISTIC ONBOARD/EGOCENTRIC POSITIONING 159
information, it is expected that the accuracy rises with larger values for this param-eter. On the other hand, a large TimeWindowSize also delays the detection of aposition change.
With respect to these considerations the evaluation should answer the following ques-tions:
1. How does TimeWindowSize influence the accuracy of UBISPOT?
2. Which TimeWindowSize gives a good trade-off between accuracy of posi-tion estimation and delay of a position change?
3. How close are false recognitions to the true location?
4. Do detected Bluetooth devices decrease or increase the accuracy?
5. How does the accuracy change according to the number of trained landmarks?
Since UBISPOT gives out location names rather than coordinates, accuracy heremeans how often the determined location name is equal to the real location name.
4.3.4.1 Evaluation Design
As indicated above, the lab of Prof. Wahlster provides an ideal testbed for evaluatingUBISPOT, since university campus is well equipped with WiFi hotspots and Blue-tooth devices are scattered over the offices in form of Bluetooth mice and Bluetoothenabled cell-phones. The floor plan of the lab is shown in Figure 4.16, the dots in-dicate learned landmarks. 19 landmarks were learned in this environment, includingtwo corridors and stairways. Four additional landmarks were learned in the attachedbuilding E13, so that a total of 23 landmarks were stored in the system. The numberof trained landmarks has a direct influence on the a-priori probability of guessingthe right room, i.e. the probability that a randomly chosen room is the right one.In the used test environment with 23 learned landmarks, this a-priori probability is123≈ 4.35%.
No instrumentation was added to the already existing WiFi hotspots and Bluetoothdevices. The evaluation was conducted using three Nokia E60 cell phones.
Regarding the variation of the TimeWindowSize parameter, the naıve approachwould be to bring the mobile phone in different locations and have it loggingits determined positions with varied TimeWindowSize. However, this methodwould consume a high amount of time: polling all required sensory data of theNokia E60 to calculate one snapshot takes 8 seconds. To create a fingerprint with

160 LOCATO: LOCALIZATION TOOLKIT
Figure 4.16: Floor plan of the evaluation environment, located in the first floor ofcomputer science building E11 of Saarland University, Germany. Red dots indicaterooms that were trained as landmarks, green stars indicate the tested rooms.
TimeWindowSize = tws, a number of tws snapshots has to be taken. Since onedetermined location would not be enough to deduce a meaningful accuracy statistic,this fingerprinting has to be repeated for the desired number of samples, e.g. 100times. Because each fingerprint is derived by using a FIFO, a total of n − 1 + twssnapshots is needed to calculate n fingerprints (see Figure 4.17). It follows that vary-ing the TimeWindowSize from 1 to 50 at a single location and taking 100 samplesfor each value of TimeWindowSize would need
50∑tws=1
(99 + tws) ∗ 8s = 49800s = 13 hours 50 minutes (4.11)
Besides the timely effort to collect the data, this approach could also compromise theevaluation. It is important to keep in mind that for the evaluation the question ’Whatwould the system’s output be, if it would use a different TimeWindowSize in theotherwise exact same situation?’ has to be answered. If the infrastructure changesthroughout these approximately 14 hours, e.g. some WiFi hotspots or Bluetooth de-vices get switched off during the measurement of some higher TimeWindowSize,it would give the impression that a lower TimeWindowSize performs better.
Fortunately, it is sufficient to collect 149 snapshots at one location – which takes149 ∗ 8s = 19 minutes 52 seconds – and then recalculate the FIFO outputs for allvarying TimeWindowSizes as depicted in Figure 4.17. This method minimizes the

4.3 UBISPOT: OPPORTUNISTIC ONBOARD/EGOCENTRIC POSITIONING 161
!"#$%&'()*++)
!"#$%&'()*)
!"#$%&'(),)
!"#$%&'()-)
!"#$%&'()./)
!"#$%&'()..)
!!!"
01"234$41"(*!
01"234$41"(-!
01"234$41"(,!
01"234$41"(./!
01"234$41"(..!
01"234$41"(*++!
(a) TimeWindowSize = 1
!"#$%&'()*)
!"#$%&'()+)
!"#$%&'(),)
!"#$%&'()--)
!"#$%&'()*..)!!!"
!"#$%&'()*.*)
/0"123$30"(*!
/0"123$30"(+!
/0"123$30"(*..!
/0"123$30"(,!
/0"123$30"(--!
(b) TimeWindowSize = 2
!"#$%&'()*+,)
!"#$%&'()*)
!"#$%&'()*--)
!"#$%&'()*-*)
!"#$%&'()*--)
./"012$2/"(*!
./"012$2/"(*--!
./"012$2/"(3!
!!!"!!!"
!!!"
(c) TimeWindowSize = 50
Figure 4.17: The calculation of 100 FOA fingerprints with differentTimeWindowSize. Since the fingerprints are calculated by using a FIFO, 99 +TimeWindowSize snapshots are needed.
probability of getting different base measurements for the evaluation and thus allowsto reproduce as exactly as possible which position would be derived by UBISPOT
with a specific TimeWindowSize. A similar argumentation holds for collectingthe measurements in different locations: The question to be answered here is ’Whatwould the system’s output be, if the measurements were taken at a different loca-tion?’. If data for different locations are collected in succession, there is a high riskthat the infrastructure has changed in the meantime. Therefore, the measurementswere taken simultaneously in three adjacent rooms (marked with stars in Figure 4.16)using three Nokia E60 devices.
Of course in a real world setting the infrastructure will change over time, especiallythe availability of Bluetooth devices. This effect is still taken care of in the evaluation,because the training of the system was done two weeks prior to taking the evaluationmeasurements. Moreover, the system’s training data were collected with only one

162 LOCATO: LOCALIZATION TOOLKIT
mobile phone and thus during different times of the day and over the course of twodays.
To perform the actual analysis, the core positioning-algorithm of UBISPOT was re-implemented in Java and complemented with an algorithm to calculate fingerprintswith different TimeWindowSize using exact real life measurements collected withthe Nokia E60 devices. This software – named UBISPOT SIM [Ji, 2011] – runs on astandard desktop PC and automatically calculates hit and miss statistics.
To summarize, the evaluation was done in three phases:
Phase 1: Train UBISPOT for 23 landmarks. This phase started two weeksbefore phase two on different times of day and over the course of two days.
Phase 2: Collect ≈ 150 real life measurements in three adjacent rooms usingthree Nokia E60 devices. For training and measuring, the devices were placedin the geometrical middle of each room. This step took ≈ 20 minutes.
Phase 3: Perform the evaluation off-line using the real life measurements col-lected in phase two and the trained landmark database from phase one.
4.3.4.2 Results
Figure 4.18 shows the measured accuracy plotted against the TimeWindowSize. Aposition estimation was count as hit, iff the derived room coincided with the roomwhere the measurements were taken in and as miss otherwise. Therefore, the plottedaccuracy represents the number of correct estimations out of the total number ofestimations for the given TimeWindowSize according to the formula
number of hitstotal number of estimations
.
Dashed lines in the graph represent position estimations without taking Bluetoothinto account, solid lines depict estimations including Bluetooth.
How does the TimeWindowSize influence the accuracy of UBISPOT? In re-spect of the first question the graph shows that the accuracy rises with increasingTimeWindowSize for most of the tested rooms and conditions (Bluetooth on oroff), except for the estimations derived for room 119-1 without Bluetooth. Room119-1 without Bluetooth is obviously an under-performer in comparison to the restand has to be examined closer.

4.3 UBISPOT: OPPORTUNISTIC ONBOARD/EGOCENTRIC POSITIONING 163
Figure 4.18: Recognition accuracy versus TimeWindowSize for three adjacentrooms. Solid lines indicate results including all available sensor data, dashed linesindicate the results when Bluetooth is not considered for the position calculation.
Do detected Bluetooth devices decrease or increase the accuracy? The graphshows that those position estimations that are considering Bluetooth devices are inall cases better than those without Bluetooth. This result is surprising, since most ofthe detected Bluetooth devices were mobile phones and as such can easily changetheir position. The fact that they still contribute in a positive way to the positionestimation maybe due to the owners of the phones being in their respective officesmost of the time. Most obviously, including Bluetooth helps to detect room 119-1,bringing the accuracy from 7.5% in the worst case (TimeWindowSize of 45) up to94% in the best case (TimeWindowSize of 40).
Which TimeWindowSize gives a good trade-off between accuracy of positionestimation and delay of a position change? A higher TimeWindowSize meansa longer time delay until a new position estimation has stabilized. Consideringthe graph in Figure 4.18, a TimeWindowSize of 25 seems to provide a goodtrade-off since three of the six locations do not gain in accuracy when rising theTimeWindowSize further. A value of 25 means a 200 second delay until a newposition has stabilized after changing the location.

164 LOCATO: LOCALIZATION TOOLKIT
!"
#!"
$!"
%!"
&!"
'!"
(!"
)!"
'" #!" #'" $!" $'" %!" %'" &!" &'" '!"
!"#$"%
&'(('("
)*+'",*-.#/"0*1'"23&+4'5"#$"0-67(8#9(:"
##*+#" ##," -.//01./" ##*+%" 2/0345/"6..7"
859/54:/;" #$$" #$%" 85703:/"6..7" <049=53"
#$&" 84:0/"!+#" 65>4/..7"
Figure 4.19: Hits and misses for office 119-1 not considering Bluetooth devices.Most of the time UBISPOT mistakes the office 119-1 for the corridor.
How close are incorrectly classified positions to their true position? Figure 4.19shows how room 119-1 was classified for each TimeWindowSize without takingBluetooth devices into account. The vertical axis shows the percentage of guessesfor each classified room, e.g. at TimeWindowSize 20, room 119-1 was classified ascorridor in 37% of all measurements, and as room 123 in 16%. The bars are orderedin distance to the actual location. Locations that do not appear in the graph were neverclassified as being the current location. It can be seen that most of the time room 119-1 was mistaken for the lab’s corridor, which is still close to the actual location. Faraway locations, like the restroom, only appear with low TimeWindowSize. Noneof the additional four landmarks of Building E1 3 ever appeared as classificationfor room 119-1. From this graph, it is also apparent that the number of confusionsdrastically reduces with higher TimeWindowSize, e.g. only three locations areconsidered by the system with a TimeWindowSize of 50.
Figure 4.20 shows the same type of graph, this time with Bluetooth devices includedin the position estimation. Apparently, the room is correctly classified most of thetime and the number of confused locations is reduced from 12 without Bluetoothto 8 including Bluetooth. As in the previous case, this number gets smaller withrising TimeWindowSize. The misclassification with the highest distance to room119-1 is the kitchen, which is only present in TimeWindowSize 5 and 10. WithTimeWindowSize 50, only one misclassification is left, which is the corridor.

4.3 UBISPOT: OPPORTUNISTIC ONBOARD/EGOCENTRIC POSITIONING 165
!"
#!"
$!"
%!"
&!"
'!"
(!"
)!"
*!"
+!"
#!!"
'" #!" #'" $!" $'" %!" %'" &!" &'" '!"
!"#$"%
&'(('("
)*+'",*-.#/"0*1'"23&+4'5"#$"0-67(8#9(:"
##+,#" ##*" -.//01./" ##+,%" 2/0345/"6..7" 859/54:/;" #$%" ##+,(" <049=53"
Figure 4.20: Hits and misses for office 119-1 including Bluetooth devices. Office119-1 is correctly classified most of the time, the number of incorrect classificationsis drastically reduced.
Figure 4.21: Accuracy plotted against TimeWindowSize when only three land-marks are stored in the trained database.

166 LOCATO: LOCALIZATION TOOLKIT
How does the accuracy change according to the number of trained landmarks?To answer this question all but the tested three rooms were deleted from the trainedlandmarks database. The reason behind this question is that UBISPOT was designedto spot the user’s personal landmarks and so it is reasonable that a user will not traineach and every room in a building, but only important ones, like the own office, thekitchen, a meeting room. Figure 4.21 shows the accuracy statistics for the reduced setof landmarks. As expected, the accuracy is higher for all measured rooms. Even atTimeWindowSize = 5 each room gained a higher accuracy than in the first test andthe accuracy ranges from 43% to 74% as compared to 11% – 66%. Moreover, witha TimeWindowSize ≥ 45, each room could be identified with 100% probability.
4.3.5 Summary
UBISPOT is an opportunistic onboard/egocentric positioning system following theAlways Best Positioned paradigm by combining cell info, WiFi access point MACsand Bluetooth addresses. It was implemented using the FOA core algorithm of LO-CATO and was rigorously evaluated in a dense environment with small rooms close toeach other. According to this evaluation, UBISPOT is capable to achieve room-levelwith a 68% accuracy (worst case) when all sensors are used.
The system is robust against environmental influences, like air humidity or the num-ber of people in the room, due to omitting the signal strength in the fingerprints. It ishowever sensible to changes in the infrastructure, e.g. changing WiFi access points.This sensibility can be overcome by updating the reference fingerprints, either peruser or through sharing fingerprints via UBISWORLD.
Regarding the cost of ownership, UBISPOT is a low-cost system for the operator,due to the opportunistic nature of the system, as well as for the user, as it runs onAndroid or Symbian smart phones with no additional hardware, which is also bene-ficial for the usability and applicability of the system. The algorithms are optimizedfor low computational resources, however the repeated inquiries of WiFi and Blue-tooth sensors have an impact on the battery consumption of the mobile device. Thepower consumption can be improved by choosing longer delays between successivemeasurements, which delays the position determination. As the system is onboard-/egocentric, it provides a high privacy protection.
Although UBISPOT is designed as an opportunistic positioning system, an operatorcan choose to increase the accuracy of the system in their building by deploying ad-ditional Bluetooth beacons. This will increase the cost of ownership for the operatorwhile maintaining the cost for the users.

4.4 LORIOT: HIGH ACCURACY ONBOARD/EGOCENTRIC POSITIONING 167
4.4 LORIOT: A High Accuracy Onboard/EgocentricPositioning System
!"#$%&#'(#)#*++,-%./&01#
!"#$%&#'(#)#
*++,-%./&01#
23#$%&#'(#
4050.-6#
789:0#;<'(#=/5#
';#>0/8+.#
!"#$%&#'(
#)#
*++,-%.
/&01#
!"#$%&#'(#)#*++,-%./&01#
?@A#4+.5%&B-0C4/D&B-0#
Figure 4.22: LORIOT uses active RFID tags and infrared beacons, which are dis-tributed into the environment, to estimate the current position of a Windows MobilePDA.
LORIOT is the acronym for Location and Orientation in Indoor and Outdoor Environ-ments. The system aims at high precision positioning using a dedicated instrumen-tation of the environment, which consists of active RFID tags and infrared beacons.LORIOT follows the Always Best Positioned paradigm, by being able to work witheither RFID or infrared alone, or by combining both if available. In outdoor scenar-ios, the system switches to a GPS receiver for obtaining positioning data. LORIOT
can also deliver WGS84 coordinates indoors and is thus compatible with GPS basedapplications.
In comparison to UBISPOT, which has a delay of about 200 seconds until a newlocation can be derived, LORIOT’s positioning is instantaneous and the system is thuscapable of providing real-time positioning information of a moving user. Since allpositioning calculations are performed on the mobile device of the user, their privacyis protected. Nonetheless, users can decide to share their position information withtrusted services or persons.
The positioning accuracy of LORIOT was rigorously evaluated and in contrast tomost positioning systems found in the literature, it was tested with moving users andcompared to highly accurate natural ground truth traces.

168 LOCATO: LOCALIZATION TOOLKIT
4.4.1 Hardware
4.4.1.1 Senders and Sensors
Figure 4.22 shows the senders as well as the mobile device that LORIOT uses toestimate its own position. The required sensors are either built-in or attached to thedevice. In detail, the technologies for indoor positioning by LORIOT are:
Infrared LORIOT uses infrared beacons (IR beacons), manufactured by eyeledGmbH3. These beacons are powered by three AA batteries and send out a 16-bitwide identification code that can individually be adjusted for each beacon throughDIP (dual in-line package) switches (blue boxes to the left and right of the infraredLEDs in Figure 4.23b).
The emitted infrared beam has a range of about 2 meters and has, due to the physicalattributes of light, conical sending characteristics. The price for such a beacon isabout 80 Euro. The required infrared sensor is often already integrated in mobiledevices for data exchanging purposes. Due to restrictions of the infrared protocol,only one IR beacon can be detected at a time.
IR beacons are usually attached to walls or ceilings, pointing downwards to ‘illu-minate’ a small spot on the floor, as depicted in Figure 4.23d. The position anddimensions of the infrared light cone can be adjusted by the mounting angles of thebeacon itself as well as by bending the LEDs inside the beacon to widen or narrowthe gauge of the light beam in the horizontal direction.
If the user’s mobile device detects such a light beam, it can infer that the user isstanding somewhere inside the illuminated spot. If the device knows the direction ofthe light beam, it can also derive direction information about the user.
On the downside, a free line of sight to the beacon is needed to detect it, meaning thatthe signal can be easily blocked by other persons or by users themselves, e.g whenwalking in the same direction as the light beam, as shown in Figure 4.23e.
To overcome this problem, several IR beacons pointing in opposing directions areoften installed at one location. Because of these properties – short sending range andincluded directional information – IR beacons are mainly used for signaling pointsof interests, like exhibits in a museum or particular shelves in a shop, or for signalingdecision points, like crossing corridors or doors on opposing walls.
3http://www.eyeled.de

4.4 LORIOT: HIGH ACCURACY ONBOARD/EGOCENTRIC POSITIONING 169
(a) IR beacon (b) IR beacon circuit (c) Built-in IR sensor
(d) Installation of an IR beacon (e) Blocking an IR beacon
Figure 4.23: IR beacon as manufactured by Eyeled (a). Each beacon sends out a16-bit wide ID, which can be configured by DIP switches. The circuit is poweredby 3 AA batteries (b). The beacons can be detected and identified by standard IRsensors, which are often already integrated into mobile devices (c). IR beacons areperfect to signal points of interests (d).
Active RFID The active RFID tags used by LORIOT are manufactured by IdentecSolutions AG4. These tags have a reading range of up to 6 meters and are poweredby coin cell batteries, as can be seen in Figure 4.24c. According to the manufacturer,the batteries last 6 years when accessed up to 600 times each day.
Each tag has a memory of 64 bytes, out of which 56 bytes can be used to storeapplication specific data. 6 bytes (48 bits) are used to store a unique ID for each tag,leading to over 281 trillion possible IDs. The IDs are hard-coded by the manufacturerand cannot be changed. The tags operate in the UHF band, or more specifically,at a frequency of 868 MHz for the European market and 915 MHz for the NorthAmerican market. The tags also provide an LED, which can be triggered by thereading device.
4http://www.identecsolutions.com

170 LOCATO: LOCALIZATION TOOLKIT
(a) Active RFID tagfront
(b) Active RFID tagback
(c) Active RFID tagcircuit
(d) Active RFID reader card
Figure 4.24: Active RFID tag by Identec Solutions as used in the LORIOT system.Each tag has a unique ID number that is also printed on the back of the housing (b).The tags are powered by coin cell batteries and the circuit contains an LED that canbe used to indicate activity of each tag (c).
Due to the physical attributes of radio waves, the RFID’s sending characteristics isradial. One active RFID tag costs about 20 Euro. Reading devices for these activeRFID tags are also available from Identec Solutions. In conjunction with the mobiledevice, the i-CARD III PCMCIA reader card (shown in Figure 4.24d) is used, whichcosts about 1500 Euro. (The high costs mainly arise from the fact that these readersare manufactured in very low quantities.) The i-CARD III can detect 100 tags persecond and through the use of a randomized anti-collision algorithm it can reliablyidentify up to 2000 tags in its reading range.
Active RFID tags overcome the restrictions of IR beacons by their high sending rangeand radial sending characteristics at the cost of lower precision and no immediatedirection information. For the use with LORIOT, the RFID tags can be installed atthe ceiling or the floor of a building and are usually ordered in a grid, so that multipletags can be detected in one measurement. Although the reader card provides signalstrength information for each detected tag, LORIOT does not directly rely on thesemeasurements, but uses a similar approach as UBISPOT by taking the frequency ofappearance into account.
4.4.1.2 Mobile Device
LORIOT was implemented in C++ for Windows Mobile devices. It was tested andevaluated on a Dell Axim X51v PDA. The Dell Axim uses Windows Mobile 5.0 butis unofficially upgradeable to Windows Mobile 6.0. A port of Android called Ax-

4.4 LORIOT: HIGH ACCURACY ONBOARD/EGOCENTRIC POSITIONING 171
Figure 4.25: Geo referenced dynamic Bayesian network and the corresponding con-ditional probability tables as used by LORIOT.
Droid is also available5. The Axim has an Intel PXA270 processor running at 624MHz and comes with 64 MB on-board RAM and 128 MB flash ROM. It features aCompactFlash (CF) Type II as well as a Secure Digital (SD) expansion slot and along-range Infrared Data Association (IrDA) interface. Drivers to read the IR bea-cons through the IrDA interface were provided by eyled GmbH. The active RFID tagreader card was attached via a PCMCIA-to-CF slot adapter. An API to the RFIDreader card is part of the development package of Identec Solutions. Since the PDAitself does not have an internal GPS, a Bluetooth GPS receiver was used for outdoorpurposes.
4.4.2 Methods
LORIOT overcomes the disadvantages of IR beacons and active RFID tags by com-bining both their advantages. In order to fuse the sensory data of these two sendertypes, LORIOT uses the geoDBN core-algorithm of LOCATO. Figure 4.25 shows theused Bayesian network and its conditional probability tables. The CPT entries forthe IR sensor are chosen to represent the high reliability of the IR technology: whenstanding in the range of an IR beacon, the probability to sense it is very high. For theRFID sensor, the values are chosen lower, because of the higher range of the activeRFID tags and the high probability of overreach.
4.4.2.1 Obtaining Tag and Beacon Positions
Since LORIOT needs the coordinates of detected beacons or tags, a way had to befound how to communicate this information to the system. In an early version thetag and beacon IDs and their coordinates were simply stored as an XML-File on themobile device, which was parsed when starting LORIOT. This approach is howeverimpractical in real world situations where hundreds or thousands of buildings couldbe equipped with theses senders. Either the list would have to contain all tags and
5http://axdroid.blogspot.com

172 LOCATO: LOCALIZATION TOOLKIT
beacons of all buildings or the system would have to download this information ac-cordingly when detecting an unknown ID. Current installations of LORIOT use theinternal memory of the active RFID tags to store the coordinates they are signalingfor. These coordinates can be of any kind, but in order to keep compatibility withexisting location-based applications, it is best to use WGS84 coordinates. Addition-ally, IDs and coordinates of nearby IR beacons can also be stored in the tags. Thus,if a user is walking into a new building LORIOT can obtain all necessary informationout of the current environment without the need of an additional data connection likeWiFi or UMTS.
4.4.2.2 Data Caching
The measurement step of the geoDBN algorithm (Step 1 in Algorithm 2) results in alist of active RFID and IR beacon IDs. To read the memory content of the detectedRFID tags, a special read-memory task has to be issued for each of the detected RFIDIDs. In a real world setting however, it often happens that the ID of an RFID tag canbe obtained, but the attempt to read the memory content fails. To overcome thisproblem and to reduce the amount of extra time that is needed to read the memory ofeach tag, a caching strategy is used, so that the memory-reading step only needs tobe performed once for each previously unseen RFID ID.
It is however noteworthy that the effect of not being able to read the memory contentsof an RFID tag could have a beneficial effect on the overall accuracy of the system,since it could act as a natural filter on tags that are too far away. The effect of thecaching algorithm on the accuracy will thus be further discussed in the evaluation(see Section 4.4.4). The caching algorithm is straight forward and is executed instep 2 of the main geoDBN algorithm:
Algorithm 3 Caching Algorithm for tag and beacon coordinates in LORIOT
1. Iterate through the list of received RFID IDs from the newest measurement
(a) If the current ID is already present in the database, retrieve the coordi-nates and proceed with the next ID.
(b) If the current ID is not present in the database:
i. Issue a read-memory command.ii. If not successful, proceed with the next ID.
iii. If successful, parse the memory to extract the RFID coordinates andoptional IR beacon IDs and their coordinates.
iv. Store the new gained information in the database.

4.4 LORIOT: HIGH ACCURACY ONBOARD/EGOCENTRIC POSITIONING 173
4.4.3 Output to the User
LORIOT is implemented as a background process and is not meant to provide directoutput to the user. Once it is started, it checks for available sensors and immediatelystarts collecting measurements and performing position calculations. The estimatedposition coordinates are sent to an internal socket, to which other applications run-ning on the mobile device can connect. There is however a simple user interface, thatallows the user to configure certain aspects, like enabling/disabling caching or givingpermission to send positioning data to a web service, e.g. UBISWORLD. Variousapplications that make use of LORIOT are described in Section 5.
4.4.4 Evaluation
First informal tests of LORIOT were conducted at the lab of Prof. Wahlster, wherean accuracy of approximately 1 to 1.5 meters could be observed. Although the labprovided an ideal test field for UBISPOT (Section 4.3.4), this does not apply forLORIOT, which is supposed to deliver more accurate, sub-room level positions: thesmall size of the rooms in the lab does not allow for a large field of RFID tagsand thus one of the main error sources – overreach of far-away RFID tags – couldnot be thoroughly tested. Moreover, since LORIOT is designed to position movingpersons, appropriate movement traces are needed as ground truth for the evaluation.A rigorous evaluation was planned with the following requirements:
• The instrumented area should be large and include obstacles but should bewithout attenuating walls to maximize the probability of overreach.
• As ground truth, moving traces should be used, which should be as naturalas possible to avert that users consciously or unconsciously adapt their move-ments to possible restrictions of the positioning system.
The evaluation should answer the following questions:
1. How accurate is LORIOT on average?
2. How is the accuracy influenced if
(a) only IR beacons are considered in the position estimation?
(b) only RFID tags are considered in the position estimation?
(c) RFID tags and IR beacons, are considered in the position estimation?
(d) the caching algorithm is enabled or disabled?
3. What is the influence of walking speed on the position accuracy?

174 LOCATO: LOCALIZATION TOOLKIT
Since LORIOT outputs numerical coordinates, the error of an estimated position canbe expressed as the distance to the position of the user in the ground truth trace. Theoverall accuracy can be expressed via statistical analysis of the measured distances.
4.4.4.1 Evaluation Design
In order to address the questions above, the evaluation was done in three phases:
Phase 1: Natural walking traces were recorded with a video camera and man-ually transcribed into coordinates for each observed footstep.
Phase 2: Ground truth traces were marked on the floor and then followedagain while carrying a mobile device with activated LORIOT. Each trace wasfollowed twice: once with the original walking speed and once with a very slowwalking speed. The calculated positions as well as all raw sensor data were loggedfor each trace.
Phase 3: Using the raw sensor data, all positions were recalculated using LO-RIOT’s positioning engine to obtain four different conditions:
1. using only IR data
2. using only RFID data, without caching
3. using only RFID data, with caching
4. using RFID and IR data, without caching
5. using RFID and IR data, with caching
Each step will be explained in detail in the next sections.
4.4.4.2 Ground Truth Acquisition
The main foyer of DFKI building in Saarbrucken was chosen as testfield for theevaluation because it provides a large area without attenuating walls (as can be seenin Figure 4.26a) and because it was built with an open architecture (Figure 4.26c),allowing to observe a large part of the area from the top level of the building (see Fig-ure 4.26b). Moreover, the tile seams on the floor provide a visual coordinate systemthat can be used to acquire the needed ground truth traces. An accurate 3D model ofthe foyer was created that also represents each tile, as can be seen in Figure 4.26d.

4.4 LORIOT: HIGH ACCURACY ONBOARD/EGOCENTRIC POSITIONING 175
(a) DFKI foyer (b) DFKI foyer top view
(c) DFKI foyer open architecture (d) 3D model of the DFKI foyer
Figure 4.26: The foyer of DFKI Saarbrucken was used a testfield, since it providesa large area and a visual coordinate system through the tiles.
To obtain the required natural walking traces, an HD camera was installed at thetop level such that a large part of the foyer could be observed (see Figure 4.27a).With permission of DFKI’s workers’ council, videos of walking people in the foyerwere recorded over the course of three days. On each day, about 0.5 hours of videowas recorded around lunchtime, which ensured that many people were crossing thefoyer. To enhance the visibility of the tile seams, white adhesive tape was appliedat selected spots (see Figure 4.27a). The tile seams and marked spots were used tooverlay a grid on the videos, to further enhance the visibility of each tile. The gridalso contained a unique ID for each tile.
To derive numerical coordinates for each single footstep of the recorded persons,the enhanced videos were manually analyzed. The quality of the videos was high

176 LOCATO: LOCALIZATION TOOLKIT
36 CHAPTER 4. THE PROPOSED EVALUATION METHOD
the system under natural environmental conditions but also under a natural tracesof different people walking. So we expect to get better realistic results that showhow the system will perform under real conditions.
Figure 4.1: DFKI Front Foyer
Figure 4.2: Real size 3D model of the front foyer - DFKI
After choosing the place where to conduct our experiment for evaluating thesystem, we took measurements of the foyer using a laser measuring device and laterwe designed a real size 3D model (see figure 4.2) of the foyer using Google SketchUp
(a) Adhesive tape wasused to enhance thevisibility of the tileseams.
(b) Video-overlay representing the coordinate system.
Figure 4.27: A grid overlay was used to annotate each step of a person with accord-ing coordinates.
(a) Foot rests on onetile
(b) Foot rests on twotiles
(c) Foot rests on threetiles
(d) Foot rests on fourtiles
Figure 4.28: Four basic cases were considered for obtaining coordinates of each stepof a person.
enough to discriminate four basic cases for each step, depending on how many tilesa person’s foot is resting on. Figure 4.28 shows these four different cases. The actualcoordinates were then derived by using the coordinates of the middle point of eachcovered tile and calculating the geometric middle according to the formula:
x =1
n
n∑i=1
xidi, y =
1
n
n∑i=1
yidi(4.12)
where n is the number of tiles covered and xidiand yidi
are the x and y coordinatesof the middle point of a tile with identification idi. The white dots in Figure 4.28indicate the resulting coordinates for each case.

4.4 LORIOT: HIGH ACCURACY ONBOARD/EGOCENTRIC POSITIONING 177
(a) Visualization of a single trace. Each square represents a single step.
(b) Visualization of all traces obtained in one day.
Figure 4.29: Example visualizations of extracted ground truth traces.
Using this method, [Saliba, 2011] extracted the coordinates and time-stamps for ev-ery single footstep of a recorded person. This lead to 119 highly accurate groundtruth traces. A tool was implemented to visualize the recorded traces and to performevaluation calculations. Figure 4.29 shows the visualization of a single trace as wellas all traces obtained in one day.
4.4.4.3 Obtaining System Traces
To keep the ground truth traces as natural as possible, none of the recorded personswore a mobile device. Thus, the acquisition of the system traces, i.e. LORIOT’s esti-mated positions, had to be done in a separated step. In this step 58 active RFID tagswere placed on the floor of DFKI foyer, with a distance of 105 centimeters betweentwo adjacent tags. Figure 4.30 shows the distribution of the tags. Coordinates of eachtag were stored on their internal memories using the same coordinate system as inthe ground truth acquisition process. In addition, 10 IR beacons were placed in theenvironment using microphone stands.
From the 119 available traces, 16 were randomly chosen. These traces were laidout one after the other, according to the coordinates obtained in the ground truthacquisition process.

178 LOCATO: LOCALIZATION TOOLKIT
Figure 4.30: 58 active RFID tags were distributed in the DFKI foyer.
Figure 4.31 shows one such laid out trace. Each trace was then followed step by stepwhile carrying a PDA with LORIOT running. Each trace was followed two times withtwo different speeds:
1. Original speed of the recorded trace. This was accomplished by playing backbeeps according to the original time-stamps of the trace.
2. In a very slow speed, where after each step a pause of approximately one sec-ond was made.
The LORIOT system was modified to log all calculated positions, their time-stampsand raw sensor data into text files. This process led to 32 log files including derivedpositions and all measured raw sensor data.
From each log file, five system traces were derived by using LORIOT’s position-ing algorithm in varying conditions: considering only IR beacons, considering onlyRFID tags without caching, considering RFID tags & IR beacons without caching,considering only RFID tags including caching and considering RFID tags & IR bea-cons including caching. This led to 160 system traces that were compared to theirrespective ground truth.

4.4 LORIOT: HIGH ACCURACY ONBOARD/EGOCENTRIC POSITIONING 179
Figure 4.31: Traces were laid out on the floor and followed while carrying a mobiledevice running LORIOT.
4.4.4.4 Calculation of the Error Distance
As indicated above, the extracted traces from the ground truth acquisition containhighly accurate data for each single footstep. LORIOT on the other hand, does notmeasure footprints. It was designed to estimate the position of the user. The questionarises what the position of a user is, if the positions of his feet are known. For theevaluation, it was assumed that the user’s position is somewhere on the line betweentwo successive foot positions.
This consideration is important, since LORIOT computes a new position every timea new measurement is taken, meaning that time-stamps of derived positions do notnecessarily coincide with time-stamps of ground truth traces. Thus, a way had to befound to find the user’s ground truth position at an arbitrary time-stamp.
Figure 4.32 exemplifies the situation. The two footprints indicate two subsequentfootsteps of a ground truth, TSR and TSL are the time-stamps for the right and leftfoot. The blue dot shows the position derived by LORIOT, derived at time-stampTSLORIOT. According to the exemplary given time-stamps, LORIOT’s position wasderived 0.325 seconds after the right foot reached the ground and 0.375 secondsbefore the left foot will reach the ground in the ground truth. The user’s position inthe ground truth is thus somewhere in between.

180 LOCATO: LOCALIZATION TOOLKIT
!"#$%&'()
!"*$%&+()!"*,-.,/$%&0%1()
2--,-)3
.(/4567)
Figure 4.32: Ground truth time-stamps of single footsteps and LORIOT time-stampsof user positions do not necessarily coincide.
To interpolate where the user’s position was in the ground truth at time TLORIOT, thecurrent velocity v is calculated by dividing the distance between the two footstepswith the time difference between the two footsteps:
v =
√(xL − xR)2 + (yL − yR)2
TSL − TSR(4.13)
where (xL, yL) and (xR, yR) are the coordinates of the left and right foot. By multi-plying this velocity with the time difference between TSLORIOT and TSR, the distanced that the user has covered since putting their right foot down can be derived:
d = v × (TSLORIOT − TSR) (4.14)
The user’s position Pgroundtruth at time TSLORIOT in the ground truth is estimated tobe at distance d from the right footstep on the line between the two footsteps. Thepositioning error is thus the distance from LORIOT’s derived position to Pgroundtruth.Pgroundtruth is indicated as a black dot in Figure 4.32.
4.4.4.5 Results
Figure 4.33 shows two comparisons of system traces with their respective groundtruth: Trace 2 in the only RFID, with cache condition and Trace 3 in the RFID &IR, with cache condition. The red squares represent the footsteps of the ground truth.The blue boxes depict the user position as derived by LORIOT. The black crossesshow the interpolated user position on the ground truth. Each interpolated user po-sition is connected via a black dotted line with the corresponding system position.The red and blue arrows show the general walking direction of the ground truth andsystem trace respectively. The average positioning error as well as the minimum

4.4 LORIOT: HIGH ACCURACY ONBOARD/EGOCENTRIC POSITIONING 181
(a) Trace 2 in the only RFID, with cache condi-tion.
(b) Trace 3 in the RFID & IR, with cache condi-tion.
Figure 4.33: Two example results from the evaluation. The red boxes depict theground-truth steps. The blue boxes represent the positions derived by LORIOT. Theblack crosses show the interpolated user steps, which are connected by black dottedlines with their respective user position.

182 LOCATO: LOCALIZATION TOOLKIT
0
100
200
300
400
Trace01
Trace02
Trace03
Trace04
Trace05
Trace06
Trace07
Trace08
Trace09
Trace10
Trace11
Trace12
Trace13
Trace14
Trace15
Trace16
TOTAL
Average Posi,on
ing Error in Cen
,meter
only IR RFID & IR no Cache only RFID no Cache
only RFID with Cache RFID & IR with Cache
Figure 4.34: The average positioning error of all traces with original velocities andwith respect to the five tested conditions.
and maximum positioning error of the trace is printed in the bottom left corner. Allgraphical representations of each trace in each of the five conditions can be found inAppendix A.1.1 and Appendix A.1.2.
The average positioning error in centimeters for each trace and each condition issummarized in Figure 4.34. The last column, labeled TOTAL, shows the averageerror over all traces for each condition. Table 4.2 summarizes the key values foreach condition. The entries are ordered top to bottom by their average positioningerror over all traces (from lowest to highest). The standard error as well as the 95%confidence interval is given for each condition. A repeated measures ANOVA wasperformed over the differences of each trace and for each condition, and showed anoverall significance with F (4, 180) = 47.3, p < .001.
How is the accuracy influenced if the caching algorithm is enabled or disabled?Table 4.2 shows that both cached conditions (‘only RFID with cache’ and ‘RFID &IR with cache’) outperform all other conditions. With 99.79 centimeters, the averagepositioning error in the ‘only RFID with cache’ condition is 20.57 centimeters lowerthan in the ‘only RFID no cache’ condition. A Bonferroni adjusted pairwise compar-ison shows that this difference is significant with p < .001. The difference betweenthe average positioning error of the two RFID & IR conditions amounts to 23.82 cen-

4.4 LORIOT: HIGH ACCURACY ONBOARD/EGOCENTRIC POSITIONING 183
95% Confidence Interval
Condition Average Std. Error Lower Bound Upper Boundin cm in cm in cm in cm
RFID & IR 96.31 (1) 4.00 88.42 104.20with cacheonly RFID 99.79 (2) 4.13 91.64 107.94with cacheRFID & IR 120.13 (3) 5.80 108.68 131.57no cacheonly RFID 120.36 (4) 4.97 110.55 130.17no cacheonly IR 276.67 (5) 14.03 248.99 304.36
Table 4.2: Comparison of positioning error when following the ground truth in orig-inal velocity. The numbers in parenthesis show the ranking of each value.
timeters in favor of the with cache condition and is also significant with p < .001. Itcan thus be concluded that the caching algorithm improves the positioning accuracyby approximately 20 centimeters in average.
How is the accuracy influenced if only IR beacons are considered in the position-ing evaluation? When only considering IR beacons, LORIOT could only achievean average accuracy of 2.77 meters, which is the highest measured average posi-tioning error measured in this evaluation. The difference to all other conditions issignificant with p < .001 for all pairwise comparisons.
The minimal positioning error was 14 centimeters and the maximum was 7.32 me-ters. Both values were achieved in Trace 8, which is shown in Figure 4.35a. Onlyone IR beacon was received in this test and thus only one position was fixed by LO-RIOT. Analyzing all IR only traces shows that in 11 out of the 16 traces only one IRbeacon was detected during the test walks. Two IR beacons were detected in threetraces. Three and four beacons where detected in only one trace each. In Trace 6,four beacons were detected and, with 1.48 meter, this trace also shows the lowestaverage positioning error for all traces in the ‘only IR’ condition.
The low accuracy in the ‘only IR’ condition was to be expected and is due to the com-parably sparse instrumentation of the testfield with IR beacons. IR beacons are ad-vantageous at precise points of interest, like exhibits in a museum, particular shelvesin a retail environment or decision points in a narrow corridor. Furthermore, the ‘onlyIR’ condition provides a special case since without active RFID tags no coordinate

184 LOCATO: LOCALIZATION TOOLKIT
(a) Result for Trace 8 in the ‘only IR’ condition. (b) Results for Trace 6 in the ‘only IR’condition.
Figure 4.35: The worst (a) and best (b) result for the ‘only IR’ condition. In Trace 8only one IR beacon was detected. Trace 6 contains 4 detected IR beacons.
information can be stored in the environment (as described in Section 4.4.2.1). Thus,a list containing the beacon IDs and their coordinates has to be stored on the mobiledevice. Installing only IR beacons in a large area with nearly no walking restrictionsis therefore only recommended for special applications, like museums or shops.
How is the accuracy influenced if only RFID tags are considered in the positionestimation? The ‘only RFID with cache’ condition shows the second best accu-racy, with an average positioning error of 99.79 centimeters. The minimum position-ing error in this condition was 3.88 centimeters (Trace 15) and the maximum was276.88 centimeters (Trace 5). The ‘only RFID no cache’ condition ranked secondto last, with an average positioning error of 120.36 centimeters and minimum andmaximum error of 65.91 (Trace 13) centimeters and 185.67 (Trace 9) centimeters re-spectively. The average is still 156.32 centimeters better than the ‘only IR’ conditionand this difference is significant with p < .001. Since caching already proved to beadvantageous, it can be concluded that LORIOT can achieve a positioning accuracy

4.4 LORIOT: HIGH ACCURACY ONBOARD/EGOCENTRIC POSITIONING 185
Condition Average Minimum Maximumin cm in cm in cm
RFID & IR, with cache 24.81 (1) 13.21 (2) 44.26 (3)only RFID, with cache 25.00 (2) 12.60 (1) 39.10 (1)only RFID, no cache 30.33 (3) 16.05 (3) 43.80 (2)RFID & IR, no cache 31.39 (4) 19.34 (4) 48.77 (4)
Table 4.3: Comparison of positioning errors when following the traces in slow ve-locity.
of approximately 1 meter in an environment that is densely instrumented with onlyactive RFID tags.
How is the accuracy influenced if RFID tags and IR beacons are consideredin the position estimation? Table 4.2 shows the lowest average positioning errorin the case of combined RFID and IR instrumentation and with enabled caching.With 96.31 centimeters, the average positioning error is approximately 3 centimeterslower than RFID alone (with enabled caching). However, a pairwise Bonferroniadjusted comparison shows that this difference is not significant. The difference of0.23 centimeter when comparing only RFID and RFID & IR, both with caching, isnegligible and also not significant. These low, not significant differences can also becontributed to the sparse IR beacon instrumentation as well as to the high walkingspeed of the ground truth, which makes it less probable that an IR beacon will beproperly detected.
What is the influence of walking speed on the position accuracy? To answer thisquestion, the raw sensor data log-files of the slowly walked traces where analyzed.Because of the different velocities of the ground traces and the re-walked traces, thereis no direct relation between their time-stamps, and thus the calculation of the errordistance had to be adapted accordingly.
For the slow velocity traces, for every calculated user position the nearest footstepin the ground truth was found and the distance to that footstep was taken as thepositioning error. If a footstep in the ground truth had already been used as referencepoint, it was not used again and only footsteps with a higher time-stamp than the lastfootstep were allowed. This method is thus analogous to a comparison of graphicalsimilarity.
Table 4.3 summarizes the average, minimum and maximum positioning error foreach of the four conditions. The results when walking slowly are greatly improved.

186 LOCATO: LOCALIZATION TOOLKIT
Condition Average Minimum Maximumcm cm cm
RFID & IR, with cache 57.48 (1) 27.24 (1) 135.76 (2)only RFID, with cache 61.69 (2) 28.77 (3) 159.63 (3)only RFID, no cache 73.11 (3) 33.44 (4) 127.73 (1)RFID & IR, no cache 83.73 (4) 27.30 (2) 219.23 (4)
Table 4.4: Comparison of positioning error when comparing the graphical similarityof the system to the ground truth.
The best result was achieved with RFID & IR and enabled caching. This conditionled to an average positioning error of only 24.81 centimeters. The highest averagepositioning error was measured in the condition where RFID and IR was used withoutcaching and amounts to 31.39 centimeters.
A part of this improvement is due to relaxed measurement of the positioning error.To test if the improvement can be attributed to the different measurement methodalone, the traces that were followed based on the time-stamps of the ground truthwere re-analyzed using the same method.
Table 4.4 shows the results of the analysis. The results are indeed an improvementover the time-stamp based analysis, but not as good as the measurements that werebased on the slow velocity traces. In the worst case (‘RFID & IR, no caching’), theaverage positioning error is 83.73 centimeters. Compared to the 31.39 centimeterswhen walking slowly, this average is approximately two times higher.
The lowest achieved average positioning-error was 57.48 centimeters and was mea-sured with RFID & IR and enabled caching. This positioning error is also approxi-mately two times higher than the best average when walking slowly.
It can thus be concluded that the accuracy of LORIOT is higher at slow walkingspeeds.
How accurate is LORIOT on average? Considering the above results, LORIOT
achieves its highest accuracy with enabled caching and with either RFID alone orwith combined RFID and IR instrumentation. The average positioning error overall traces of ‘only RFID with cache’ and ‘RFID & IR with cache’ results in 98.05centimeters at normal walking speed. The accuracy is higher at slow walking speeds.As a slower walking speed can be expected if a person is walking through unknownterritory, while exploring their surroundings or when trying to find their way, thishigher accuracy will most likely be available, when a person is using a location-based service.

4.4 LORIOT: HIGH ACCURACY ONBOARD/EGOCENTRIC POSITIONING 187
4.4.5 Summary
LORIOT is an onboard/egocentric positioning system designed for instrumented en-vironments. It follows the Always Best Positioned paradigm by sensor fusion ofan active RFID reader and an infrared sensor. LORIOT was rigorously evaluated byusing natural walking traces with step-accuracy as ground-truth. In a densely instru-mented environment, an accuracy of ≈ 1 meter can be achieved.
As the geoDBN core-algorithm of LOCATO does not incorporate signal-strength in-formation, LORIOT is robust against environmental factors, like air-humidity and thenumber of people in the environment. Furthermore, as no trilateration or triangula-tion is performed, a single RFID tag or IR beacon in the receiving range is sufficientto determine a position. The high accuracy of the system is traded against high costof ownership for the operator as well as for the user.
In low quantities, a single active RFID tag costs ≈ 20 Euro, a single IR beacon ≈ 80Euro. The needed active RFID reader on the user’s side costs ≈ 1, 500 Euro, whichis mainly due to the low manufacturing quantities of this type of RFID reader. Asactive RFID readers do not contain any costly parts, there is no obvious reason forthe high price, except the development costs. In large quantities, it should be possibleto manufacture such a reader in the range of tens of Euro.
Another cost factor for the operator are the batteries of the infrared beacons andthe active RFID tags, which includes the costs for the batteries themselves as wellas the costs for the manual labor to replace them. A possible to solution to reducethe maintenance costs is to either use solar cells or energy harvesting. The lattertechnology is available from the company Powercast6 and enables devices to drawtheir power from special RF-based power transmitters. However, further researchis needed to test the possible interference of the power transmitters with the activeRFID signals.
With respect to usability and applicability, LORIOT runs on any standard WindowsMobile device with infrared capabilities and the additional active RFID reader. Inorder to make use of the infrared beacons, the device has to have a line of sightto a beacon, i.e. it has to rest in the hand of the user. This is compensated by theactive RFID tags, which can also be read while carrying the device in a pocket or bag.Although the algorithms of LORIOT are optimized for low computational complexity,the repeated scanning of the active RFID reader has an impact on the device’s battery.This impact can be lowered, by decreasing the scanning frequency, which will delaythe position determination.
6http://www.powercastco.com

188 LOCATO: LOCALIZATION TOOLKIT

5LOCATION-BASED SERVICES
REALIZED WITH THE LOCATO
PLATFORM
Several applications and systems were realized using LOCATO and the examplepositioning-systems. In the following, first a scenario will be described that tiesselected realized applications together. In the second part, each application will bedescribed in more detail.
5.1 Example Scenario
5.1.1 Hermione’s Lazy Saturday
Preparations and a Nap
Imagine a sunny Saturday. Hermione, the example user in this scenario, is invitedto a friend’s party and she has promised to bring a good whiskey and the ingredientsof her favorite cocktail: White Russian. Since a new shopping mall has openednot far from her friend’s place, she has planned to spend a few hours there, beforeheading for her friend’s home. In preparation of her day, she sets an appointment inher location-aware task planner, pointing to the address of her friend and setting thetime she has promised to arrive. Because she still has to buy the whiskey and theingredients for the White Russian, she also enters a task, specifying the items she hasto buy. She doesn’t add a specific time or place to the task, but rather specifies thatany shop that carries the ingredients will do and that the task has to be completedbefore she arrives at the party. Hermione decides to take a short nap, before startingher trip. After she has lain down for a while in her bedroom, her mobile phonedetermines her position using UBISPOT and automatically sets itself to silent-mode.
189

190 LOCATION-BASED SERVICES REALIZED WITH THE LOCATO PLATFORM
An hour later, she wakes up refreshed and as she prepares for her trip to the mall, hermobile phone switches back into its normal mode.
Finding a Parking Spot
As Hermione enters her car, her mobile phone automatically connects to the car’sentertainment system via a Bluetooth connection. Because of the car’s BluetoothID, UBISPOT can infer that she is now in the car and asks the car to forward itsGPS coordinates. The phone navigates her to the shopping mall, using the car’sGPS, which has a better reception than the phone’s GPS receiver. When entering theparking deck, the car loses its GPS reception, but detects the presence of active RFIDtags. Using LORIOT to determine its position, the car navigates Hermione to a freeparking space. As she turns off the car’s engine, the Bluetooth connection gets lostand the mobile phone automatically stores the current position as the car’s parkingposition. With the help of active RFID tags and infrared beacons, the mobile phoneis able to guide Hermione to the next exit and the few hundred meters outdoors intothe shopping mall.
Finding a Malt in the Mall
As she enters the mall, her mobile phone informs her that she can use the publicinfrastructure by registering the phone’s Bluetooth address with the malls applica-tion server and allowing restricted access to her user profile. As Hermione likesexploratory shopping tours, she agrees because she knows that this will cause thepublic displays in her vicinity to display selected information to her, for example,special offers or things that she has stored in her ‘things I would buy if I wouldaccidentally stumble over them’-list.
After mindlessly poking around in the mall for quite a while, she passes by a grocerystore. Her mobile phone automatically checks if a good whiskey and the ingredientsfor White Russians are available and triggers an alarm, notifying Hermione that thisis a good opportunity to buy the items in her task list. The phone also periodicallychecks the distance of Hermione’s current position to her friend’s home, approxi-mates the driving time and automatically sets a reminder when she has to leave themall. Because of this, Hermione realizes that she has to hurry. She enters the grocerystore, which is an affiliate of her favorite department-store chain and grabs a shop-ping trolley. The trolley is equipped with a touch-screen and Hermione can identifyherself to the trolley as a loyal customer by quickly dragging her wallet, which con-tains her NFC enabled customer card, over the touch-screen. The shop’s floor isinstrumented with a grid of passive RFID tags and the trolley, which is equipped

5.2 UBIDOO: LOCATION-AWARE TASK PLANNER 191
with a passive RFID reader, can thus determine its exact location inside the store.Through the shop’s infrastructure, the trolley has access to Hermione’s shopping listand calculates an optimal route to buy the whiskey and needed ingredients. With thehelp of the trolley’s navigation instructions, Hermione is able to complete her shop-ping task in record-breaking time and leaves for the parking deck. ‘Good thing myphone remembers where I parked my car, because I bloody didn’t’, she mumbles asher phone guides her back.
I Can’t Hear You but I Can Hear my Phone
She arrives at the party right on schedule. Her friend – Ron – is an avid technologyfan and is burning to show Hermione his newest acquisition: a location-adaptiveaudio-notification service. As most of Ron’s friends are addicted to emails, SMS andtraditional phone calls, they are usually afraid to miss any message notifications and,very much to Ron’s dismay, tend to ask him to turn the music down so they can heartheir phones.
‘The location-adaptive audio-notification service’, Ron shouts at Hermione over theloud music, ‘changes that. If you connect your phone to this service, you can choose apersonal audio notification pattern. If you receive a message or phone call, this audiopattern will be seamlessly integrated into the music on the speaker that is nearestto you.’ After registering her phone with the notification service, Hermione headsstraight into the kitchen to mix her first White Russian of the evening. ‘A speakingcocktail shaker? Ron, you’re kidding me!’ (although the speaking cocktail shakeris not directly related to this thesis, interested readers can find more about this finepiece of gadgetry in [Schmitz, 2010]).
5.2 UBIDOO: Location-Aware Task Planner
The calendar, in which Hermione enters her appointment and the ingredients sheneeded to buy, was implemented by [Fickert, 2007] in his master’s thesis. The sys-tem is called UBIDOO, which stands for UBIquitous to-DO Organizer. It realizes aubiquitous task planner, which integrates a calendar and a to-do list. In contrast toconventional calendars and to-do lists, UBIDOO does not only allow to set remindersfor appointments and tasks to a specific date and time, but also to places. Moreover,since UBIDOO uses the spatial ontology of UBISWORLD (see Section 2.4.2.1), be-sides specific places also more general concepts, like ‘Store’ or ‘Grocery Store’ canbe specified. As indicated in the scenario, this enables UBIDOO to trigger a reminderif a user passes by a location that fulfills the specified role. Additionally, general ac-

192 LOCATION-BASED SERVICES REALIZED WITH THE LOCATO PLATFORM
(a) To-do list view in Saarbrucken (b) To-do list view in Munich
Figure 5.1: The here-and-now view of the same to-do list at different locations[Stahl et al., 2007].
tivities, e.g. ’Swimming’, can be specified in the same way, using an appropriateontology from UBISWORLD. In such a case, the system will automatically searchfor suitable locations for the activity, e.g. a nearby lake or swimming pool.
UBIDOO was implemented as a web-service and has direct access to UBISWORLD,where it can also retrieve the current position of the user from the user model.UBIDOO is therefore fully compatible to all positioning systems that report theirposition determination to UBISWORLD. With this position information, the to-domanager can constantly check for nearby places that could be used to fulfill any ofthe user’s tasks. Moreover, the service calculates a so-called ‘here-and-now’ view,which sorts the to-do list according to the current time and the current position of theuser.
Examples of the here-and-now view of the same to-do list at two different positionsare shown in Figure 5.1. The list contains three main tasks, Swim and relax, Refillthe fridge and Flight to Corfu. The Refill the fridge task has two specified sub-tasks: buying olives and buying milk. Buying olives was assigned to a specific shopin Saarbrucken by the user, whereas buying milk was just specified as a generalshopping task. Swim and relax was associated to any place that allows swimmingand the Flight to Corfu was of course assigned to a specific airport.
Figure 5.1a shows the to-do list when the user is in their office in Saarbrucken. Thelist is ordered according to the time that is needed to reach the associated location

5.3 PARKING-DECK NAVIGATION 193
(the time is shown in parenthesis next to the distance). As can be seen, the swimmingtask is on the top of the list, although the distance to the appropriate location is higherthan the distance to the shop, where the user intends to buy olives. This is due to thebetter (faster) reachability of the swimming-location. Figure 5.1b shows the sameto-do list, when the user is in Munich. The task to buy olives is omitted, since thespecified shop is too far away from the current location. The shop in which to buymilk has been replaced by a shop near to the user, and so was the location to ‘swimand relax’. It can also be seen, that the time to reach the flight to Corfu has beenadjusted from 31 minutes to 4 hours and 6 minutes.
UBIDOO derives these traveling times through a web-service called eRoute, whichis provided by the company PTV AG1. This service calculates routes between twogiven locations and estimates the driving time. Traveling times through buildings,e.g. from the current position to the exit, are estimated using YAMAMOTO. Besidesthe traveling time, UBIDOO also takes opening and closing times of places like shopsinto account and either choses places that are currently open or will add the time untila place is opening again to the traveling time.
Besides organizing tasks and appointments for single users, UBIDOO also allows tomanage group tasks. For example if a group of people is planning a party, they canset up several tasks and assign them to different people or subgroups of people. Ifsomebody in a subgroup marks a task as completed, this task will automatically beremoved from their task list (cf. [Stahl et al., 2007, Fickert, 2005]).
5.3 Parking-Deck NavigationIn his master thesis, [Gholamsaghaee, 2007] developed a parking-deck navigationcalled PARKNAVI, which uses LORIOT as positioning engine. PARKNAVI was de-signed to provide arriving cars with a route to an empty parking space in a car parkand to guide passengers from their parked car to the exit as well as to guide themfrom the entrance back to their parked car.
The application was tested in P20, a multistory car-park at Munich Airport Center(MAC), Germany. P20 has approximately 6400 indoor parking-spaces on 11 levelsand is the second biggest multistory car-park in Germany. This car park was alreadyequipped with optical sensors that are used by the operating company to detect emptyparking spaces. This information can be used by PARKNAVI to choose the nearestempty parking space to the passenger’s next destination, e.g. Terminal 2, to minimizetheir walking distance. To ensure position information while navigating the user fromtheir car to their destination, or back to their car, LORIOT is used in conjunction withactive RFID tags.
1http://www.ptv.de

194 LOCATION-BASED SERVICES REALIZED WITH THE LOCATO PLATFORM
Figure 5.2: Components of PARKNAVI. The current user position is read from LO-RIOT to update route instructions accordingly [Gholamsaghaee, 2007].
To test PARKNAVI, parts of the third and fourth story of the car park were modeledwith YAMAMOTO and equipped with 70 active RFID tags. These tags were installedat the ceiling using styrofoam blocks to insulate them from the ferroconcrete structureof the car park, which tends to attenuate the radio signal of the tags.
Figure 5.2 shows the components of the PARKNAVI system. The Central ControlUnit (CCU) retrieves the current user position via a socket connection to LORIOT,as described in Section 4.4.3. The CCU also reads and parses a YAMAMOTO model(YML, Yamamoto Modeling Language) of the car park and forwards this data toa VRML renderer. PARKNAVI uses the Pocket Cortona VRML-Viewer by ParallelGraphics2 to accomplish the rendering. A route planner calculates the shortest pathfrom the user’s current position to their destination. The route planner module wasoriginally developed by [Waßmuth, 2006] to plan pedestrian routes in YAMAMOTO
models. Car parks however represent a special case – unlike normal buildings theyare used by pedestrians as well as by vehicles. Since PARKNAVI should be able tonavigate both, YAMAMOTO and the route planner had to be extended accordingly:the first to represent one-way routes and the latter to take into account these routeswhen planning for a vehicle. Furthermore, the planner was extended to allow for theuse of elevators, which are also present in P20.Using the planned route and the model, PARKNAVI is then able to create graphicaland verbal route instructions. IBM’s Embedded ViaVoice©3 was used to providespoken instructions.
2http://www.parallelgraphics.com3http://www-01.ibm.com/software/pervasive/embedded viavoice/

5.4 HYBNAVI 195
(a) Plan view (b) Tethered view (c) Immersed view (d) Monitoring view
Figure 5.3: PARKNAVI screenshots [Gholamsaghaee, 2007]
For graphical route instructions, the user can choose between four options (shown inFigure 5.3): plan view, tethered view, immersed view or monitoring view. Accordingto [Baus, 2003], each of these visualizations meets different demands of user. Theplan view shows a part of the map from a bird’s eyes perspective. This view is bestin situations in which a user needs to gain knowledge about the structure and layoutof the current environment. The tethered view provides a visualization as if a camerawould be placed above and behind a user. The immersed view shows a representationof the environment from the perspective of the user itself. The latter two views arebest for efficient navigation presentations, as they show the environment in a fashionthat is close to the perception of a user. The monitoring view is a 3D representationof the map, shown from the perspective of a camera that is mounted at an arbitrarypoint. This view combines the advantages of a 3D representation, i.e. a view that isclose to the perception, with the advantage of the plan view, i.e. a good overview onthe structure and layout of the environment.
5.4 Hybrid Navigation-Visualization on Nomadic De-vices
HYBNAVI was developed by [Mutafchiev, 2008] and is an extension of PARKNAVI,and thus shares the basic software design (see Figure 5.4). HYBNAVI is an abbrevia-tion for HYBrid NAvigation VIsualization and it enables route finding and guiding notonly within one building, but also from rooms in one building to other rooms in dif-ferent buildings, e.g. on a university campus or large factory premises. This involves

196 LOCATION-BASED SERVICES REALIZED WITH THE LOCATO PLATFORM
Figure 5.4: HYBNAVI is an extension of PARKNAVI [Mutafchiev, 2008].
indoor as well as outdoor positioning and navigation. Hybrid positioning is alreadyintegrated in LORIOT, but to accomplish hybrid route-finding, several componentsof PARKNAVI had to be extended: to enable the user to choose destinations that areoutside of the currently loaded building model, HYBNAVI provides a connection toUBISWORLD which also allows to load missing models via a web connection. Fur-thermore, the route planner was extended by [Waßmuth, 2008] to dynamically loadand parse new models while searching the shortest route between points in differentbuildings.
Like PARKNAVI, HYBNAVI provides spoken route instructions and different cam-era perspectives for the visual route description: immersed, tethered and plan view(see Figures 5.5a to c). Moreover, the system is capable of rendering eye-catchingobjects that can act as landmarks, e.g. soda machines or lockers (as depicted in Fig-ures 5.5d and e). According to [Aginsky et al., 1997], the visual recognition of theconnection of landmarks and directions seems to be the dominant strategy for spatialorientation of humans. Experimental studies described in [Kruger et al., 2004] and[Aslan et al., 2006] support this hypothesis, thus the ability of showing landmarks– especially those that are close to decision points – provides additional help whilenavigating. Furthermore, these landmarks are used in the spoken route instructions,e.g. ‘turn left at the soda dispenser’.
To also allow for navigation in buildings that do not provide a positioning instru-mentation, planned routes can be played back as videos showing an egocentric 3Danimation of the movement through the building. Users can start, stop and rewindthe video at will and can thus use the system to memorize short parts of the route

5.4 HYBNAVI 197
(a) Immersed View (b) Tethered View (c) Plan View
(d) Soda dispenser machine (e) Yellow lockers
Figure 5.5: HYBNAVI supports three different navigation perspectives and is capa-ble of rendering eye-catching objects that can act as landmarks [Mutafchiev, 2008].
or try to walk the path in the same speed the video is showing it. The latter can beseen as ‘reversed positioning’: instead of the system recognizing where the user is,users try to position themselves where the system is showing them. Especially in thismode, HYBNAVI’s capability of showing landmarks plays an important role, since ithelps users to find the depicted positions.
The idea of using videos as indoor navigation aid was tested against traditional mapsand printed picture sequences of decision points by [Munzer and Stahl, 2008]. Anexperiment with 48 participants (24 male and 24 female) was conducted, where eachcondition was tested with 16 participants. The result showed that the number ofwayfinding errors made while using videos was significantly lower than in the twoother conditions (only two out of 16 participants made critical errors in the video

198 LOCATION-BASED SERVICES REALIZED WITH THE LOCATO PLATFORM
condition, in contrast to nine out of 16 in the picture sequence condition and sevenout of 16 in the map condition).
In the scenario above, it is HYBNAVI with the included PARKNAVI component thathelps Hermione to find a free parking space and that navigates her to the mall as wellas back to her parked car again.
5.5 IPLAY BLUE: User-Adaptive Public Displays
The technology that provides Hermione with personalized information while pok-ing around the shopping mall was realized by [Schottle, 2006] during an advancedpractical course. The implemented system is called IPLAY BLUE and is based on theOUT OF THE BLUE component of LOCATO.
The basic idea is to provide users with adapted content of public displays, as theyare now common in public buildings. As the system should be accessible to as manypeople as possible, the Bluetooth based exocentric positioning method was chosen,because even cheap cellphones provide Bluetooth functionality. In order for IPLAY
BLUE to work, each public display is itself Bluetooth enabled and runs the OUT
OF THE BLUE core algorithm, which scans its environment for nearby Bluetoothdevices and provides this information to the local infrastructure in form of events viathe blackboard architecture (see Section 4.2).
IPLAY BLUE runs on a server and subscribes to the OUT OF THE BLUE events.Without further knowledge about the received Bluetooth IDs, IPLAY BLUE can atleast approximate how many people are in its vicinity. In order to adapt the contentof single displays however, it needs further information about who the Bluetooth IDbelongs to and about special interests of the owner of the Bluetooth device. Userscan therefore register with IPLAYBLUE and provide restricted access to their userprofiles. For example, one might only reveal their gender in order to get informedabout gender-(stereo)typical items, e.g. electronic gadgets for males and more cloth-ing specific things for females.
In order to protect the privacy of users, their names will not appear on the publicdisplays. Instead users can freely choose icons or pictures, for example a picture oftheir favorite cartoon character, which will be displayed next to relevant information.In order to make it difficult for observers to assign pictures or icons to bypassingpeople, pseudo information can be shown of imaginative users, such that situationsare avoided in which only one picture or icon is shown.
IPLAY BLUE closely interacts with UBIDOO and can thus adapt the view of a publicdisplay in a shop to the tasks of a user or of a group of users. An example view is

5.5 IPLAY BLUE: USER-ADAPTIVE PUBLIC DISPLAYS 199
Figure 5.6: Example view of IPLAY BLUE on a public display [Schottle, 2006].
shown in Figure 5.6. Here a collaborative shopping list is depicted, which is adaptedto the group members that are currently in front of a public display. The tasks aregrouped according to the assignment of each task to individuals or subgroups. Theicon for each assigned group-member is shown besides a general task description.
The design of the presentation is such that more general information is shown in largefonts, so that users can grasp this information quickly while passing by a screen.More detailed information is shown in smaller fonts and are intended for users whowant to focus on a specific task.
Because of these collaborative features, IPLAY BLUE is also valuable at home, toorganize various household tasks. At work it can be used to organize and to informabout group meetings or about the availability of individual employees.
A special view, called Iplay Ad, was implemented for stores to show personalizedadvertisements. This view shows items that are on the shopping lists of users nearbythe public display, without assigning them to a specific user. If only one user isdetected, the list will be filled other items that are currently on sale.

200 LOCATION-BASED SERVICES REALIZED WITH THE LOCATO PLATFORM
(a) The IRL SmartCart (b) Screenshot of the IRL navigation service
Figure 5.7: The IRL SmartCart enables product-related navigation in shopping en-vironments [Kahl et al., 2011].
5.6 Navigation in Retail Environments
The Innovation Retail Lab (IRL) is a collaboration of between DFKI Saarbruckenand the German retailer GLOBUS SB-Warenhaus Holding. IRL is located at St.Wendel, Germany, and focuses on application-oriented research, mostly related tointelligent shopping assistance. Developed systems get thoroughly tested not only inthe lab itself, but also in a real retail store ([Spassova et al., 2009]).
Amongst various other innovations, a smart shopping cart was developed, dubbedthe IRL SmartCart. Figure 5.7a shows the SmartCart and its instrumentation. Toenable user interaction, a touchscreen with speakers, an NFC reader and a fingerprintscanner are mounted at the cart’s handle. A laptop is currently attached to the cart asthe main computing device, which also enables communication with the environmentvia WiFi.
Two passive RFID readers are mounted at the base of the cart to which two antennaeare attached: one that enables reading RFID tags of products that are placed insidethe cart, and one close to the floor, which is used for positioning via passive RFIDtags. Accordingly, the lab’s floor is instrumented with several hundred passive RFIDtags, which were laid out in a dense grid beneath the floor cover. The IDs of all RFIDtags and their position were modeled using YAMAMOTO. Unfortunately, some of theRFID tag got damaged during the installation of the floor cover, so that additionaltags had been attached directly to the shelves. As the SmartCart is intended to be

5.6 NAVIGATION IN RETAIL ENVIRONMENTS 201
used in a specific shop, the complete list of RFID IDs and their coordinates can bestored directly on the cart.
The position determination of the SmartCart was realized using the geoDBN pack-age of LOCATO, where the CPTs were adjusted to the higher confidence values ofpassive RFID technology, i.e. sensing a passive RFID tag results in a very high beliefthat the SmartCart is currently at the position of the tag. In Figure 5.7a two opticalmice are shown in addition to the lower RFID antenna. These mice are intended tobe used as inertial sensors, i.e. they provide information about the moving directionand velocity of the cart. The derived position information can then be fused withthe RFID information through the geoDBNs. The position calculation is done on theSmartCart itself and with the allowance of the user, this position can be communi-cated to the shops service-infrastructure via WiFi connection.
The positioning is used to provide customers with navigation support, similar to whatis described in the scenario above. Users can identify themselves by several means,e.g. with their fingerprint or with an NFC enabled customer card. This identificationenables a user adaption of the cart’s user interface, e.g. using bigger fonts for elderlypeople, as well as an adaption of the provided services, e.g. automatic warnings ifa user intends to buy a product they are allergic to. A further adaption is the syn-chronization with the user’s current shopping list. If such a shopping list is present,a user can either click on a specific item and is presented with a calculated route tothe appropriate shelf, or they can chose to be navigated to all items on their shoppinglist. For the latter situation, the items on the list are ordered according to a predefinedbasic route through the shop, and the complete route is calculated by subsequentlynavigating to each item on this ordered list. A screenshot of the IRL navigation ser-vice can be seen in Figure 5.7b. This view is presented to a user on the touchscreenof the SmartCart.
If a customer comes close to an item on their list, the shopping cart can trigger variousforms of public displays to show further navigation clues, e.g. by highlighting theproduct in question with a steerable projector ([Spassova, 2011]). The latter is calledMicro Navigation, in contrast to Macro Navigation, which is the former describedapproach of guiding a user to the correct shelf.
Both, the macro and the micro navigation are intended for users who are not familiarwith the shop’s layout, as it is the case with Hermione in the example scenario. Cus-tomers who are familiar with the shop, can switch to a so-called Passive Navigationmode. In this mode, the cart’s display shows an overview of their proximate envi-ronment and issues a reminder a soon as they come into the vicinity of an item ontheir shopping list. Customers can thus enjoy an exploratory shopping experience,while getting helpful assistance to do their weekly shopping (cf. [Kahl et al., 2011,Schwartz, 2010, Kahl et al., 2008, Kahl, 2007, Stahl et al., 2005]).

202 LOCATION-BASED SERVICES REALIZED WITH THE LOCATO PLATFORM
5.7 Location-Adaptive Human-Centered AudioEmail Notification Service
The location-adaptive audio-notification service that Ron uses to keep hisparty music at high volume without alienating his friends is described in[Jung and Schwartz, 2007a] and [Jung and Schwartz, 2007b], although its intendeduse is much broader. Audio notification sounds, like telephone ring-tones, stand outbecause they differ significantly from other sounds in the environment. This is ofcourse usually intended as such a sound should attract attention, however it shouldideally attract the attention of the addressee of the notification and not the attention ofeverybody in the vicinity. In some situations, like business meetings or conferences,notification sounds are highly inappropriate. The common solution is to use vibra-tion alerts, but since sound is pressure oscillation transmitted through air (or anyother medium), even vibration alerts are audible, especially in quiet surroundings.Awkward moments usually occur in these situations because the source of the soundis clearly locatable and even if not, the following actions, like desperately trying tocancel a call or leaving the room, give away the culprit of the diversion.
The basic idea of the audio notification system is to mask audio-signals by integrat-ing them into artificial ambient soundscapes, i.e. soundscapes that are played throughan audio system, such as functional music or so-called Muzak. Functional music islow in complexity, only slightly above the environmental noise level and in a tempothat is close to the resting pulse rate. It is especially composed to not distract peo-ple and to have a calm and smoothing effect. For the implemented Ambient EmailNotification service (AEMN) three such compositions were recorded and the servicehas full control over single tracks of these recordings, i.e. the service can switch onor off specific instruments, like piano, guitar, strings or even the hi-hat of the drumsection. Users can choose their personal notification instrument and can choose theirpreferred ambient music. The AEMN service is web-based and is connected to thelocal blackboard architecture as well as to a multi-speaker sound-system, over whichthe ambient soundscapes can be played back. The current location of each user is de-termined through LORIOT, which runs on the mobile device of the user and forwardsthe positioning information to the blackboard (if allowed by the user).
If a user enters an empty room, their preferred ambient soundscape will be started. Ifother people are already present, the current soundscape will be kept, but the notifi-cation instrument of the user will from now on be omitted from the currently playingsoundscape. AEMN constantly checks the inbox of user-specified email accountsand checks via configurable filters if an email arrives that requires notification of theuser. If this happens, AEMN will insert the user’s notification instrument into thesoundscape at the speaker that is nearest to the user and in a musical fashion, such

5.7 LOCATION-ADAPTIVE AUDIO-NOTIFICATION SERVICE 203
that other people in the room will perceive the audio signal as a part of the composi-tion. The nearest speaker to the user is chosen in order to ease the perception of thesignal.
The perception of these embedded audio signals was tested in a user study with 25persons. Each participant learned two notification instruments (piano and drums) anda conventional alarm sound (a knocking sound) in a preparatory phase. During theexperiment, the participants had to perform mental arithmetic under time-pressure,while soundscapes where played, which contained the learned notification instru-ments as well as the conventional alarm sound. The participants were instructed toclick on a specific button as soon as they perceived either one of the notificationinstruments or the conventional alarm sound. The conventional alarm sound wasrecognized in 79% of all cases. The drum-sound notification was even recognizedin 86% of all cases, while the piano notification reached 78% and was thus slightlylower than the conventional alarm sound. The reaction times, i.e. the time it took par-ticipants to click on the button after the notification sound was first played, were alsomeasured. As it was the case with the perception of the sounds, the drum notificationprovided the best result: 2.1 seconds in average. With 2.54 seconds, the conven-tional sound provided a slightly higher average reaction time. The piano notificationled to an average reaction time of 6.59 seconds. All in all, the performance of thistype of notification is comparable or even better than conventional audio notification,without the risk of embarrassing moments (cf. [Jung, 2009]).

204 LOCATION-BASED SERVICES REALIZED WITH THE LOCATO PLATFORM

Part IV
Conclusion
205


6 CONCLUSION
In this thesis, the Always Best Positioned paradigm was defined (see Section 1.1.6)and the Localization Toolkit LOCATO was developed, which enables the efficientdevelopment of egocentric and exocentric positioning systems that can be executedeither onboard or offboard. LOCATO provides two novel core algorithms, which aredesigned according to the Always Best Positioned paradigm:
• Frequency-Of-Appearance Fingerprinting omits the usage of signal-strength information in fingerprints. It thus provides higher robustness againstenvironmental influences and allows to create and share device-independentfingerprints.
• Geo-Referenced Dynamic Bayesian Networks enable the easy fusion of dif-ferent sensor technologies. They mimic the behavior of particle filters by cre-ating hypotheses for possible positions, but in contrast to regular particle filtersthey automatically adapt the number of hypotheses according to the sensors inthe environment and are easy to extend with additional sensor technologies.
Both algorithms are optimized for resource-limited devices, such as mobile phones.Three positioning systems were implemented using LOCATO:
• Out of the Blue is a cost effective offboard/exocentric indoor-positioning sys-tem, designed for user-adaptive public displays.
• UbiSpot is an opportunistic onboard/egocentric outdoor/indoor positioningsystem following the Always Best Positioning paradigm. It uses mobile-phonenetwork-cells, WiFi access points and Bluetooth devices to determine its ownposition and reaches room-level accuracy.
• Loriot is a high accuracy onboard/egocentric outdoor/indoor positioning sys-tem for instrumented environments, which uses infrared beacons and active
207

208 CONCLUSION
RFID tags. The system’s accuracy is highly configurable through variationof the density and mixture of the deployed senders. LORIOT can achieve anaverage position-accuracy of 1 meter.
Both onboard/egocentric positioning systems were rigorously evaluated, according totheir specifications. As UBISPOT was designed to reach room-level accuracy, it wasevaluated in a dense environment with small rooms. LORIOT was designed for highaccuracy, real-time positioning and was thus evaluated using natural, step-accuratetraces as ground-truth. Since the used senders tend to overreach, the evaluation tookplace in a wide-spaced environment, which encouraged overreach.
Furthermore, six applications were presented that either base on one of the developedpositioning systems or were designed using LOCATO. The parking-deck navigationwas developed in cooperation with BMW and was deployed and tested in the P20multistory car park at Munich Airport Center. The shopping-cart positioning wasdeveloped in cooperation with the IRL in St. Wendel.
6.1 Scientific Contributions
In order to develop the toolkit LOCATO, the following research questions were an-swered:
• What are the basic methods for position determination in natural organ-isms? In Section 2.1.1, concepts of neuropsychology were examined to derivea classification of senses, which were identified as a basic component for self-positioning. Furthermore, proximity sensing was identified as a fundamentalpositioning method, and the occurrence and importance of sensor fusion inanimals was explored on the example of ants.
• How can natural self-position awareness be replicated through methodsof Artificial Intelligence? In Section 2.2, the findings from natural positiondetermination were transferred into the field of Artificial Intelligence throughthe use of agent theory. Based on the classification of senses, a classificationof sensors was derived.
• How can technical positioning methods be classified and what are the im-plications of the classification? In Section 2.3, positioning systems were clas-sified by analyzing the possible spatial distributions of sensors, senders andcomputational devices. Four basic designs for positioning systems could bederived:

6.1 SCIENTIFIC CONTRIBUTIONS 209
– egocentric (or onboard/egocentric)
– exocentric (or offboard/exocentric)
– offboard/egocentric
– onboard/exocentric
• How should a positioning system be designed to protect the privacy of itsusers? In Section 2.3.2.5, the data-flow of the four basic designs was analyzedwith respect to the implications on the privacy protection of users. The on-board/egocentric approach was identified as being the most privacy-protectingdesign.
• What are possible methods to build positioning systems following the Al-ways Best Positioned paradigm ? In Section 2.6, Kalman filters, particlefilters and dynamic Bayesian networks were analyzed with respect to their suit-ability for the Always Best Positioned Paradigm. Dynamic Bayesian networkswere identified as being the most general concept and thus being the preferredcandidate.
• How far do state-of-the-art positioning systems comply with the deriveddesign criteria and the Always Best Positioned paradigm? In Chapter 3, thestate of the art of positioning systems was analyzed, and the discussed systemswere classified regarding the four basic designs and their ability for sensorfusion.
• How can positioning systems be evaluated? Based on the analysis in Chap-ter 3, two new systematic evaluation-methods for positioning systems weredeveloped. Each method was designed to emphasize the possible weak spots:
– Section 4.3.4 describes an evaluation method for positioning systemsbased on fingerprinting. As fingerprinting provides an accuracy of sev-eral meters, such systems should be evaluated according to their abil-ity to determine if a user is in a specific meaningful area, e.g. a room.In contrast to other evaluation methods in literature, which measure thedistance of the derived position to known reference points, this evalua-tion tested the success rate of determining the correct room in subsequentmeasurements. The evaluation was conducted in an environment withsmall rooms, which were close to each other and thus maximizing theprobability of failure.
– Section 4.4.4 describes an evaluation method for real-time high accu-racy positioning systems. For the first time in literature, natural footstep-accurate traces were used as ground truth for the evaluation. The footstepaccuracy ensures that the ground truth has a higher accuracy than what

210 CONCLUSION
can be derived by the positioning system and the natural traces ensurethat test users do not consciously or unconsciously adapt their positionsto the capabilities of the positioning system.
6.2 Impact on Industry, Press and Research Commu-nity
A first prototype of LORIOT was presented at the industrial congress AdvancedNavigation at the Kempinski Hotel, Berlin (invited speaker together with NorbertReithinger). LORIOT was also presented on the CeBit’07 exhibition in Hanoverwith follow-up press coverage in radio (WDR Computer Club), television (RTLNachtjournal), and newspapers (FAZ). LOCATO is also one of the building-blocksof the startup company Schwartz&Stahl indoor navigation solutions1, which wasfounded in December 2008.
Furthermore, the Always Best Positioned paradigm as well as UBISPOT and LORIOT
were presented on the seventh info-forum of the SmartFactoryKL in Kaiserslautern,Germany.
Together with researchers from DFKI Saarbrucken, the Helsinki Institute for Infor-mation Technology and the University of Haifa, the international workshop on Lo-cation Awareness for Mixed and Dual Reality (LAMDa) was founded in conjunctionwith IUI’11, in which the impact of positioning systems on mixed and dual realitywas discussed. The workshop will be repeated in conjunction with IUI’12. An invita-tion to present the findings of this thesis at the Ubiquitous User Modeling Workshopat the University of Haifa followed the fruitful collaboration at LAMDa’11.
6.3 Outlook
• UBISPOT is currently extended through NFC readers, which are becomingmore common in smart phones. The basic idea is to provide NFC tags at doorsills, which a user can read in by swiping their phone over them. The readingof such an NFC tag will be incorporated into the current fingerprint with a veryhigh weight, causing UBISPOT to choose that fingerprint as the current loca-tion and automatically updating the fingerprint with the most current readingsof all other sensors. As a user will not always read NFC tags when chang-ing their location, the weight will be gradually reduced over time. The rate of
1http://schwartz-stahl.de/

6.3 OUTLOOK 211
this weight decline will be a function of accelerometer measurements, i.e. theweight will be kept up so long as a user does not move. The incorporation ofthe NFC sensor will ease the process of crowd-sourcing up-to-date referencefingerprints.
• The upcoming 4G cells will provide higher data-rates, opening up new pos-sibilities for Always Best Positioning systems. LOCATO will be extended toautomatically download new sensor extensions on the fly, i.e. new geoDBNtemplates incorporating new sensors when they become available. This couldalso be done in a Web2.0 fashion, or in the sense of application stores, wheredevelopers can upload their designed geoDBNs for the community.
• The geoDBN core algorithm will more over be refined to further ease the pro-cess of adding new sensors. This can possibly be done by adding new sensornodes as time-slices rather than as evidence nodes. The inter-time-slice CPTswould then have to be adapted accordingly, which needs further research. Thisapproach would also ease the process of sharing new sensor nodes.
• IMU sensors can already be integrated using the geoDBN core algorithm.Modern smart phones already provide some of the sensors that can usuallybe found in IMUs, but the accuracy of the sensors is not as high as a commer-cial grade IMU. Further research is needed on how to refine inertial positioningusing smart phone sensors and what would be a good complementary sensorto gain the required position fixes.
• In analogy to Car2Car, where highly equipped cars can share their sensordata with less capable cars, the Always Best Positioned paradigm can be ex-tended to incorporate other users’ position information. [Rosa et al., 2011](see Section 3.1.11) proposed a relative positioning system using the WiFicapabilities of mobile devices. If one or more of these devices know andshare their own position, this approach can be extended such that other de-vices can calculate their position in the same coordinate system as these al-ready positioned devices. When using a standardized protocol to exchangesuch data, such as proposed by [Gschwandtner and Schindhelm, 2011] (seeSection 3.1.3), geoDBNs can be used to realize such a positioning.

212 CONCLUSION

Part V
Appendix
213


A APPENDIX - LORIOT
A.1 Evaluation Traces
The following figures show the results of the evaluation of LORIOT. For each of the16 traces the four conditions (only RFID with cache, RFID & IR with cache, onlyRFID no cache, RFID & IR no cache) are shown in separate figures. Each figureshows the ground-truth as red squares connected by a red line. The interpolatedpositions are marked as black crosses. The blue squares show the user positions asderived by LORIOT (system positions). The dotted black lines lead from each systemposition to their corresponding interpolated user position on the ground-truth. Inthe top left corner of each figure, the general direction of the system trace and theground-truth trace is shown. In the bottom left corner, the maximum, minimum andaverage error distance are shown.
215

216 APPENDIX - LORIOT
A.1.1 Traces for only RFID and RFID & IR ConditionsA.1EVALUATIONTRACES217
(a)onlyR
FIDw
ithcache
(b)RFID
&IR
with
cache
(c)onlyR
FIDno
cache(d)R
FID&
IRno
cache
FigureA
.1:Trace01

A.1 EVALUATION TRACES 217
(a)o
nly
RFI
Dw
ithca
che
(b)R
FID
&IR
with
cach
e
(c)o
nly
RFI
Dno
cach
e(d
)RFI
D&
IRno
cach
e
Figu
reA
.2:T
race
02

218 APPENDIX - LORIOT
(a) onlyR
FIDw
ithcache
(b) RFID
&IR
with
cache
(c) onlyR
FIDno
cache(d) R
FID&
IRno
cache
FigureA
.3:Trace03

A.1 EVALUATION TRACES 219
(a)o
nly
RFI
Dw
ithca
che
(b)R
FID
&IR
with
cach
e
(c)o
nly
RFI
Dno
cach
e(d
)RFI
D&
IRno
cach
e
Figu
reA
.4:T
race
04

220 APPENDIX - LORIOT
(a) onlyR
FIDw
ithcache
(b) RFID
&IR
with
cache
(c) onlyR
FIDno
cache(d) R
FID&
IRno
cache
FigureA
.5:Trace05

A.1 EVALUATION TRACES 221
(a)o
nly
RFI
Dw
ithca
che
(b)R
FID
&IR
with
cach
e
(c)o
nly
RFI
Dno
cach
e(d
)RFI
D&
IRno
cach
e
Figu
reA
.6:T
race
06
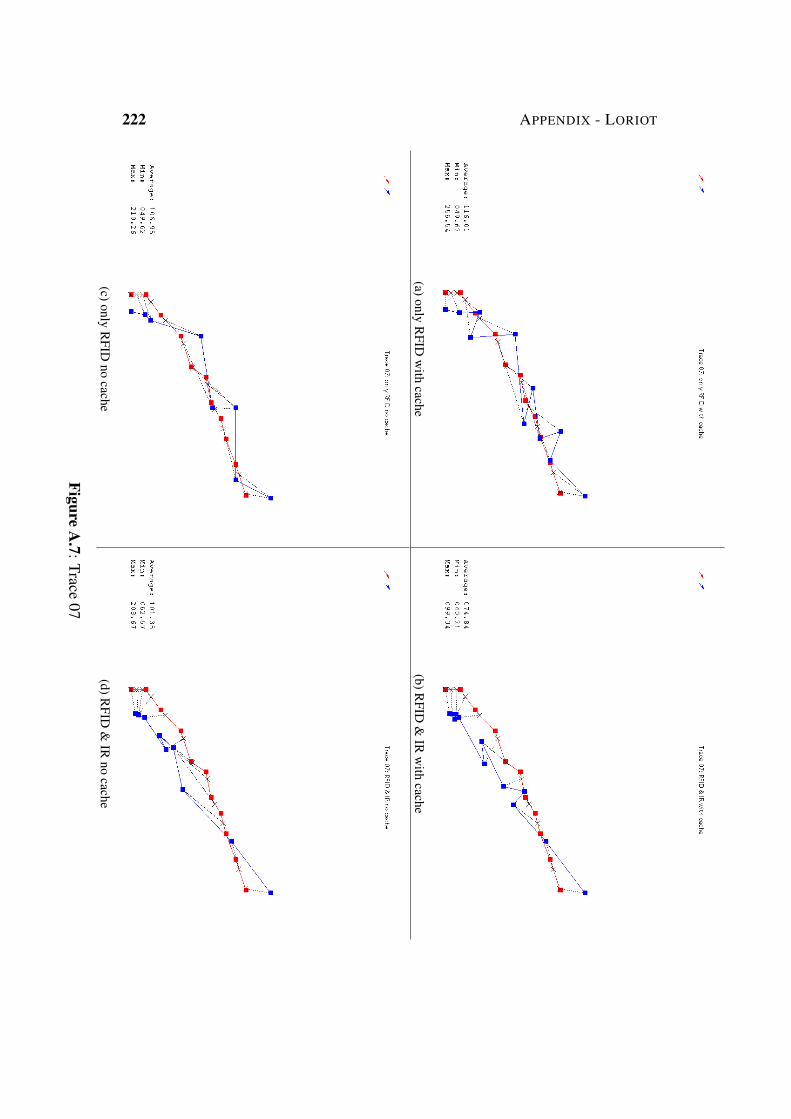
222 APPENDIX - LORIOT
(a) onlyR
FIDw
ithcache
(b) RFID
&IR
with
cache
(c) onlyR
FIDno
cache(d) R
FID&
IRno
cache
FigureA
.7:Trace07

A.1 EVALUATION TRACES 223
(a)o
nly
RFI
Dw
ithca
che
(b)R
FID
&IR
with
cach
e
(c)o
nly
RFI
Dno
cach
e(d
)RFI
D&
IRno
cach
e
Figu
reA
.8:T
race
08

224 APPENDIX - LORIOT
(a) onlyR
FIDw
ithcache
(b) RFID
&IR
with
cache
(c) onlyR
FIDno
cache(d) R
FID&
IRno
cache
FigureA
.9:Trace09

A.1 EVALUATION TRACES 225
(a)o
nly
RFI
Dw
ithca
che
(b)R
FID
&IR
with
cach
e
(c)o
nly
RFI
Dno
cach
e(d
)RFI
D&
IRno
cach
e
Figu
reA
.10:
Trac
e10

226 APPENDIX - LORIOT
(a) onlyR
FIDw
ithcache
(b) RFID
&IR
with
cache
(c) onlyR
FIDno
cache(d) R
FID&
IRno
cache
FigureA
.11:Trace11

A.1 EVALUATION TRACES 227
(a)o
nly
RFI
Dw
ithca
che
(b)R
FID
&IR
with
cach
e
(c)o
nly
RFI
Dno
cach
e(d
)RFI
D&
IRno
cach
e
Figu
reA
.12:
Trac
e12

228 APPENDIX - LORIOT
(a) onlyR
FIDw
ithcache
(b) RFID
&IR
with
cache
(c) onlyR
FIDno
cache(d) R
FID&
IRno
cache
FigureA
.13:Trace13

A.1 EVALUATION TRACES 229
(a)o
nly
RFI
Dw
ithca
che
(b)R
FID
&IR
with
cach
e
(c)o
nly
RFI
Dno
cach
e(d
)RFI
D&
IRno
cach
e
Figu
reA
.14:
Trac
e14

230 APPENDIX - LORIOT
(a) onlyR
FIDw
ithcache
(b) RFID
&IR
with
cache
(c) onlyR
FIDno
cache(d) R
FID&
IRno
cache
FigureA
.15:Trace15

A.1 EVALUATION TRACES 231
(a)o
nly
RFI
Dw
ithca
che
(b)R
FID
&IR
with
cach
e
(c)o
nly
RFI
Dno
cach
e(d
)RFI
D&
IRno
cach
e
Figu
reA
.16:
Trac
e16

232 APPENDIX - LORIOT
A.1.2 Traces for only IR ConditionsA.1EVALUATIONTRACES233
(a)onlyIR
forTrace01
(b)onlyIR
forTrace02
(c)onlyIR
forTrace03
(d)onlyIR
forTrace04
FigureA
.17:IRTraces
01,02,03and
04

A.1 EVALUATION TRACES 233
(a)o
nly
IRfo
rTra
ce05
(b)o
nly
IRfo
rTra
ce06
(c)o
nly
IRfo
rTra
ce07
(d)o
nly
IRfo
rTra
ce08
Figu
reA
.18:
IRTr
aces
05,0
6,07
and
08

234 APPENDIX - LORIOT
(a) onlyIR
forTrace09
(b) onlyIR
forTrace10
(c) onlyIR
forTrace11
(d) onlyIR
forTrace12
FigureA
.19:IRTraces
09,10,11and
12

A.1 EVALUATION TRACES 235
(a)o
nly
IRfo
rTra
ce13
(b)o
nly
IRfo
rTra
ce14
(c)o
nly
IRfo
rTra
ce15
(d)o
nly
IRfo
rTra
ce16
Figu
reA
.20:
IRTr
aces
13,1
4,15
and
16

236 APPENDIX - LORIOT

References
[3GPP, 1999] 3GPP (1999). 3GPP TS 05.10; Technical Specification GroupGSM/EDGE Radio Access Network; Digital cellular telecommunications system(Phase 2+); Radio subsystem synchronization (Release 1999). Technical report,3GPP.
[3GPP, 2010] 3GPP (2010). 3GPP TS 45.010; Technical Specification GroupGSM/EDGE Radio Access Network; Radio subsystem synchronization (Release10). Technical report, 3GPP.
[Addlesee et al., 2001] Addlesee, M., Curwen, R., Hodges, S., Newman, J.,Steggles, P., Ward, A., and Hopper, A. (2001). Implementing a Sentinent Com-puting System. IEEE Computer Magazine, 34(8):50–56.
[Aginsky et al., 1997] Aginsky, V., Harris, C., Rensink, R., and Beusmans, J. (1997).Two Strategies for Learning a Route in a Driving Simulator. Journal of Environ-mental Psychology, 17:317–331.
[Akyildiz et al., 2002] Akyildiz, I., Su, W., Sankarasubramaniam, Y., and Cayirci,E. (2002). Wireless Sensor Networks: a Survey. Computer Networks, 38(4):393–422.
[Allen et al., 1978] Allen, G. L., Siegel, A. W., and Rosinski, R. R. (1978). The Roleof Perceptual Context in Structuring Spatial Knowledge. Journal of ExperimentalPsychology: Human Learning and Memory, 4(6):617–630.
[Appleyard et al., 1988] Appleyard, S., Linford, R., and Yarwood, J. (1988). MarineElectronic Navigation. New York: Routledge & Kegan Paul, second enlargededition.
[Arulampalam et al., 2002] Arulampalam, S., Maskell, S., Gordon, N., and Clapp,T. (2002). A Tutorial on Particle Filters for Online Nonlinear/Non-GaussianBayesian Tracking. IEEE Transactions on Signal Processing, 50(2):174–188.
237

238 REFERENCES
[Ascher et al., 2011] Ascher, C., Zwirello, L., Zwick, T., and Trommer, G. (2011).Integrity Monitioring for UWB/INS Tightly Coupled Pedestrian Indoor Scenarios.In Proceedings of the International Conference on Indoor Positioning and IndoorNavigation (IPIN’11), pages 1–6 (online publication, no pagination). IEEE.
[Aslan et al., 2006] Aslan, I., Schwalm, M., Baus, J., Kruger, A., and Schwartz, T.(2006). Acquisition of Spatial Knowledge in Location Aware Mobile PedestrianNavigation Systems. In Proceedings of the 8th International Conference on Hu-man Computer Interaction with Mobile Devices and Services (Mobile HCI 2006),pages 105–108. ACM.
[Bahl and Padmanabhan, 2000] Bahl, P. and Padmanabhan, V. (2000). RADAR: AnIn-Building RF-based User Location and Tracking System. In Proceedings of theAnnual Joint Conference of the IEEE Computer and Communications Societies(INFOCOM 2000), volume 2, pages 775–784. IEEE.
[Bartelmus, 2002] Bartelmus, C. (2002). Entwurf und Bau einer Kommunikati-onsinfrastruktur fur ein ein verteiltes Prasentationssystem auf Basis von Infrarot-Datenubertragung. Diploma thesis, Saarland University.
[Baunach et al., 2007] Baunach, M., Kolla, R., and Muhlberger, C. (2007). SNoWBat: A High Precise WSN Based Location System. Technical report, Universityof Wurzburg.
[Baus, 2003] Baus, J. (2003). Ressourcenadaptierende hybride Personennavigation,volume 268 of DISKI. Berlin: Aka.
[Ben-Gal, 2008] Ben-Gal, I. (2008). Bayesian Networks. In Ruggeri, F., Faltin, F.,and Kenett, R., editors, Encyclopedia of Statistics in Quality and Reliability. NewJersey: Wiley.
[Blankenbach et al., 2011] Blankenbach, J., Norrdine, A., and Hellmers, H. (2011).Adaptive Signal Processing for a Magnetic Indoor Positioning System. In Pro-ceedings of the International Conference on Indoor Positioning and Indoor Navi-gation (IPIN’11), pages 1–4 (online publication, no pagination). IEEE.
[Bluetooth SIG, 2008] Bluetooth SIG (2008). About the Bluetooth Special InterestGroup. http://www.bluetooth.com/Bluetooth/SIG.
[Bluetooth SIG, 2010] Bluetooth SIG (2010). Specification of the Bluetooth Sys-tem. http://developer.bluetooth.org/.
[Borio et al., 2011] Borio, D., O’Driscoll, C., and Fortuny-Guasch, J. (2011). PulsedPseudolite Signal Effects on Non-Participating GNSS Receivers. In Proceed-ings of the International Conference on Indoor Positioning and Indoor Navigation(IPIN’11), pages 1–6 (online publication, no pagination). IEEE.

REFERENCES 239
[Borkowski and Lempiainen, 2006] Borkowski, J. and Lempiainen, J. (2006). Prac-tical Network-Based Techniques for Mobile Positioning in UMTS. EURASIPJournal on Advances in Signal Processing, 2006:1–15. Article ID 12930.
[Borkowski et al., 2004] Borkowski, J., Niemela, J., and Lempiainen, J. (2004). Per-formance of Cell ID+RTT Hybrid Positioning Method for UMTS Radio Net-works. In Proceedings of the 5th European Wireless Conference Mobile and Wire-less Systems beyond 3G, pages 232–238. VDE.
[Brandherm, 2006] Brandherm, B. (2006). Eingebettete dynamische BayesscheNetze n-ter Ordnung. PhD thesis, Saarland University.
[Brandherm and Schwartz, 2005] Brandherm, B. and Schwartz, T. (2005). Geo Ref-erenced Dynamic Bayesian Networks for User Positioning on Mobile Systems. InStrang, T. and Linnhoff-Popien, C., editors, Proceedings of the First InternationalWorkshop on Location- and Context-Awareness (LoCA), volume 3479 of LNCS,pages 223–234. Berlin, Heidelberg: Springer.
[Brunelli et al., 2007] Brunelli, R., Brutti, A., Chippendale, P., Lanz, O., Omologo,M., Svaizer, P., and Tobia, F. (2007). A Generative Approach to Audio-VisualPerson Tracking. In Multimodal Technologies for Perception of Humans: Interna-tional Evaluation Workshop on Classification of Events, Activities and Relation-ships (CLEAR 2006), volume 4122 of LNCS, pages 55–68. Berlin, Heidelberg:Springer. revised selected papers.
[Bucher and Misra, 2002] Bucher, R. and Misra, D. (2002). A Synthesizable VHDLModel of the Exact Solution for Three-dimensional Hyperbolic Positioning Sys-tem. VLSI Design, 15(2):507–520.
[Chawathe, 2009] Chawathe, S. S. (2009). Low-Latency Indoor Localization UsingBluetooth Beacons. In Proceedings of the International Conference on IntelligentTransportation Systems, pages 1–7 (online publication, no pagination). IEEE.
[Chernoff and Nielsen, 2010] Chernoff, K. and Nielsen, M. (2010). Weighting of thek-Nearest-Neighbors. In Proceedings of the International Conference on PatternRecognition (ICPR’10), pages 666–669. IEEE.
[China Satellite Navigation Office, 2011] China Satellite Navigation Office (2011).BeiDou Navigation Satellite System – Signal in Space Interface Control Docu-ment. Technical Report BeiDou-SIS-ICD-Test, China Satellite Navigation Office.
[Clauss and Ebner, 1975] Clauss, G. and Ebner, H. (1975). Statistische Maßzahlenfur bivariable Verteilungen: Grundlagen der Statistik. Frankfurt am Main: HarriDeutsch.

240 REFERENCES
[Cohen, 1988] Cohen, J. (1988). Differences between Correlation Coefficients: Sta-tistical Power Analysis for the Behavioral Sciences. New Jersey: Lawrence Erl-baum, 2nd edition.
[Cole, 1995] Cole, J. O. (1995). Pride and a Daily Marathon. Cambridge: MITPress, first edition.
[Cooper, 1990] Cooper, G. F. (1990). The Computational Complexity of Proba-bilistic Inferences using Bayesian Belief Networks. Artificial Intelligence, 42(2-3):393–405.
[Dempsey et al., 2011] Dempsey, S., Jennings, B., Brazil, J., and Madigan, J.(2011). Using Ambient Intelligence to Infer Availability and Meta-status in a Pi-cocell Environment. In Proceedings of the International Conference on IntelligentEnvironments (IE’11), pages 25–31. IEEE.
[Dempster, 2009] Dempster, A. (2009). QZSS’s Indoor Messaging System – GNSSFriend or Foe? InsideGNSS, 4(1):37–40.
[Dettori, 2008] Dettori, E. (2008). Optical Trackingsystem with 3D Position- andOrientation-Estimation. Diploma thesis, Saarland University.
[Dey, 2001] Dey, A. K. (2001). Understanding and Using Context. Personal andUbiquitous Computing, 5(1):4–7.
[Diard et al., 2003] Diard, J., Bessiere, P., and Mazer, E. (2003). A Survey of Prob-abilistic Models, Using the Bayesian Programming Methodology as a UnifyingFramework. In Proceedings of the International Conference on ComputationalIntelligence, Robotics and Autonomous Systems (CIRAS’03), pages 1–8 (onlinepublication, no pagination). IEEE.
[Dim et al., 2011] Dim, E., Kuflik, T., Lanir, J., Stock, O., and Corra’, M. (2011).Indoor Positioning: Group Mutual Positioning. In Kahl, G., Schwartz, T.,Nurmi, P., Dim, E., Brandherm, B., and Forsblom, A., editors, Proceed-ings of the IUI’11 Workshop on Location Awareness for Mixed and DualReality, pages 1–4 (online publication, no pagination). DFKI. available athttp://www.dfki.de/LAMDa/2011/accepted/LAMDa11.pdf.
[Dimitrov, 2007] Dimitrov, V. (2007). An In-/Out-door Positioning Client for Sym-bian OS. Master’s thesis, Saarland University.
[Dressen, 2004] Dressen, D. (2004). Considerations for RFID Technology Selec-tion. Atmel Applications Journal, 3:45–47.

REFERENCES 241
[E. D’Atri and et al., 2007] E. D’Atri and, C. M., Serbanati, A., and Ceipidor, U.(2007). A System to Aid Blind People in the Mobility: A Usability Test andits Results. In Proceedings of the Second International Conference on Systems(ICONS’07), pages 35–35. IEEE.
[Endres et al., 2010] Endres, C., Feld, M., Schwartz, T., and Mu, C. (2010). Cin-ematic Analysis of Automotive Personalization. In Proceedings of the In-ternational Workshop on Multimodal Interfaces for Automotive Applications(MIAA’10) in Conjunction with IUI’10, pages 1–6 (online publication, no pagi-nation). ACM.
[Endres et al., 2011] Endres, C., Schwartz, T., and Muller, C. (2011). Geremin: 2DMicogestures for Drivers Based on Electric Field Sensing. In Proceedings of theInternational Conference on Intelligent User Interfaces (IUI’11), pages 327–330.ACM.
[Fang, 1986] Fang, B. T. (1986). Trilateration and Extension to Global PositioningSystem Navigation. Journal of Guidance, Control and Dynamics, 9(6):715–717.
[Faria et al., 2010] Faria, J., Lopes, S., Fernandes, H., Martins, P., and Barroso, J.(2010). Electronic White Cane for Blind People Navigation Assistance. In Pro-ceedings of the World Automation Congress (WAC’10), pages 1–7. IEEE.
[Feld et al., 2010] Feld, M., Schwartz, T., and Muller, C. (2010). This Is Me: UsingAmbient Voice Patterns for In-Car Positioning. In Proceedings of the Interna-tional Joint Conference on Ambient Intelligence (AmI’10), volume 6439 of LNCS,pages 290–294. Berlin, Heidelberg: Springer.
[Fickert, 2005] Fickert, O. (2005). Ein Ubiquitarer Aufgabenplaner fur Benutzer-gruppen. Bachelor’s thesis, Saarland University.
[Fickert, 2007] Fickert, O. (2007). Ein Ortsbezogener Termin- und Aufgabenplanermit Routenwissen. Master’s thesis, Saarland University.
[Fox et al., 2001] Fox, D., Thrun, S., Burgard, W., and Dellaert, F. (2001). ParticleFilters for Mobile Robot Localization. In Doucet, A., de Freitas, N., and Gordon,N., editors, Sequential Monte Carlo Methods in Practice, pages 499–516. NewYork: Springer.
[Fung and Chang, 1989] Fung, R. M. and Chang, K.-C. (1989). Weighting and In-tegrating Evidence for Stochastic Simulation in Bayesian Networks. In Proceed-ings of the Annual Conference on Uncertainty in Artificial Intelligence (UAI ’89),pages 209–220. Amsterdam: North-Holland.

242 REFERENCES
[Gallagher et al., 2011] Gallagher, T., Li, B., Dempster, A. G., and Rizos, C. (2011).Power Efficient Indoor/Outdoor Positioning Handover. In Proceedings of the In-ternational Conference on Indoor Positioning and Indoor Navigation (IPIN’11),pages 1–4 (online publication, no pagination). IEEE.
[Ghinamo and Gangyi, 2011] Ghinamo, G. and Gangyi, T. (2011). Accuracy En-hancement in High Sensitivity GNSS with Particle Filter Approach. In Proceed-ings of the International Conference on Indoor Positioning and Indoor Navigation(IPIN’11), pages 1–4 (online publication, no pagination). IEEE.
[Gholamsaghaee, 2007] Gholamsaghaee, E. (2007). Entwicklung eines mobilenParkhaus-Navigationssystems basierend auf aktiven RFID-Tags. Master’s thesis,Saarland University.
[Gibson, 1979] Gibson, J. J. (1979). The Ecological Approach to Visual Perception.Hillsdale: Lawrence Erlbaum.
[Gordon et al., 1993] Gordon, N., Salmond, D., and Smith, A. (1993). Novel Ap-proach to Nonlinear/Non-Gaussian Bayesian State Estimation. IEE ProceedingsF – Radar and Signal Processing, 140(2):107–113.
[Gschwandtner and Schindhelm, 2011] Gschwandtner, F. and Schindhelm, C. K.(2011). Spontaneous Privacy-friendly Indoor Positioning Using Enhanced WLANBeacons. In Proceedings of the International Conference on Indoor Positioningand Indoor Navigation (IPIN’11), pages 1–4 (online publication, no pagination).IEEE.
[Gustafsson and Jonsson, 2003] Gustafsson, E. and Jonsson, A. (2003). AlwaysBest Connected. IEEE Wireless Communications, 10(1):49–55.
[Gustafsson et al., 2002] Gustafsson, F., Gunnarsson, F., Bergman, N., Forssell, U.,Jansson, J., Karlsson, R., and Nordlund, P.-J. (2002). Particle Filters for Po-sitioning, Navigation and Tracking. IEEE Transactions on Signal Processing,50(2):425–437.
[Haddad and Porrat, 2009] Haddad, Y. and Porrat, D. (2009). Femtocell: Opportuni-ties and Challenges of the Home Cellular Base Station for the 3G. In Proceedingsof the International Conference on Informatics 2009, pages 209–213. IADIS.
[Haidinger, 1844] Haidinger, W. (1844). Uber das directe Erkennen des polarisirtenLichts und der Lage der Polarisationsebene. Annalen der Physik, 139(9):29–39.
[Hare et al., 2008] Hare, J., Lewis, P., Gordon, L., and Hart, G. (2008). MapSnap-per: Engineering an Efficient Algorithm for Matching Images of Maps from Mo-bile Phones. In Society of Photo-Optical Instrumentation Engineers (SPIE) Con-ference Series, volume 6820, pages 21–31. SPIE.

REFERENCES 243
[Harter et al., 1999] Harter, A., Hopper, A., Steggles, P., Ward, A., and Webster, P.(1999). The Anatomy of a Context-Aware Application. In Proceedings of theAnnual International Conference on Mobile Computing and Networking (MOBI-COM ’99), pages 59–68. IEEE.
[Hauschildt and Kirchhof, 2010] Hauschildt, D. and Kirchhof, N. (2010). Advancesin Thermal Infrared Localization: Challenges and Solutions. In Proceedings of theInternational Conference on Indoor Positioning and Indoor Navigation (IPIN’10),pages 1–8 (online publication, no pagination). IEEE.
[Hecht, 1994] Hecht, D. (1994). Embedded Data Glyph Technology for Hard-copy Digital Documents. In Society of Photo-Optical Instrumentation Engineers(SPIE) Conference Series, volume 2171, pages 341–352. SPIE.
[Heckmann, 2006] Heckmann, D. (2006). Ubiquitous User Modeling, volume 297of DISKI. Berlin: Aka.
[Heckmann et al., 2005a] Heckmann, D., Brandherm, B., Schmitz, M., Schwartz,T., and von Wilamowitz-Moellendorf, M. (2005a). GUMO - the General UserModel Ontology. In Proceedings of the International Conference on User Model-ing, volume 3538 of LNAI, pages 428–432. Berlin, Heidelberg: Springer.
[Heckmann et al., 2005b] Heckmann, D., Schwartz, T., Brandherm, B., and Kroner,A. (2005b). Decentralized User Modeling with UserML and GUMO. InDolog, P. and Vassileva, J., editors, Decentralized, Agent Based and Social Ap-proaches to User Modeling, Workshop DASUM-05 at 9th International Confer-ence on User Modelling, UM2005, pages 61–66, Edinburgh, Scotland. Online.http://people.cs.aau.dk/dolog/dasum/DASUM-proceedings.pdf.
[Henrion, 1986] Henrion, M. (1986). Propagating Uncertainty in Bayesian Net-works by Probabilistic Logic Sampling. In Proceedings of the Annual Confer-ence on Uncertainty in Artificial Intelligence (UAI-86), pages 149–163. ElsevierScience.
[Henze and Boll, 2008] Henze, N. and Boll, S. (2008). Snap and Share YourPhotobooks. In Proceedings of the International Conference on Multimedia(ACMMM’08), pages 409–418. ACM.
[Herranz et al., 2011] Herranz, F., Muthukrishnan, K., and Langendoen, K. (2011).Camera Pose Estimation using Particle Filters. In Proceedings of the InternationalConference on Indoor Positioning and Indoor Navigation (IPIN’11), pages 1–4(online publication, no pagination). IEEE.
[Hornyak, 2008] Hornyak, T. (2008). RFID Powder. Scientific American,298(2):68–71.

244 REFERENCES
[IEEE, 1999] IEEE (1999). IEEE Standard for Information Technology – Telecom-munications and Information Exchange Between Systems– Local and Metropoli-tan Area Networks – Specific Requirements; Part 11: Wireless LAN MediumAccess Control (MAC) and Physical Layer (PHY) Specifications.
[Itoh et al., 2003] Itoh, H., Nakada, T., Hiratsuka, S., Nakamura, Y., Nishimura, T.,Kunifuji, S., Nakashima, H., and Iwasaki, N. (2003). Indoor Location and Com-munication System for the Last-Ten-Meter Information Services. In Proceedingsof the Pacific Rim Conference on Communications, Computers and Signal Pro-cessing (PACRIM’03), pages 482–485. IEEE.
[Ji, 2011] Ji, H. (2011). Simulation and Evaluation of UbiSpot. Bachelor’s thesis,Saarland University.
[Johanson and Fox, 2002] Johanson, B. and Fox, A. (2002). The Event Heap: ACoordination Infrastructure for Interactive Workspaces. In Proceedings of theWorkshop on Mobile Computing Systems and Applications, pages 83–93. IEEE.
[Johanson et al., 2002] Johanson, B., Fox, A., and Winograd, T. (2002). The In-teractive Workspaces Project: Experiences with Ubiquitous Computing Rooms.Pervasive Computing, 1(2):67–74.
[Juels, 2006] Juels, A. (2006). RFID Security and Privacy: A Research Survey.IEEE Journal on Selected Areas in Communications, 24(2):381–394.
[Jung, 2009] Jung, R. (2009). Ambiente Audionotifikation - Ein System zur kontext-sensitiven Integration von nicht-intrusiven Notifikationssignalen in emotionsklas-sifizierten Soundscapes. PhD thesis, Saarland University.
[Jung and Schwartz, 2007a] Jung, R. and Schwartz, T. (2007a). A Location-Adaptive Human-Centered Audio Email Notification Service for Multi-User En-vironments. In Jacko, J. A., editor, Human-Computer Interaction, volume 4552of LNCS, pages 340–348. Berlin, Heidelberg: Springer.
[Jung and Schwartz, 2007b] Jung, R. and Schwartz, T. (2007b). Peripheral Notifi-cation With Customized Embedded Audio Cues. In Martens, W. L., editor, Pro-ceedings of the International Conference on Auditory Display (ICAD’07), pages221–228. Schulich School of Music McGill University.
[Kahl, 2007] Kahl, G. (2007). PEG and MaMiNa: Erkennung von Zeigegesten ineiner instrumentierten Umgebung und auf Landmarken basierte Wegsuche zurNavigation. Master’s thesis, Saarland University.
[Kahl et al., 2011] Kahl, G., Spassova, L., Schoning, J., Gehring, S., and Kruger, A.(2011). IRL SmartCart – A User-adaptive Context-aware Interface for Shopping

REFERENCES 245
Assistance. In Proceedings of the International Conference on Intelligent UserInterfaces (IUI’11), pages 359–362. ACM.
[Kahl et al., 2008] Kahl, G., Wasinger, R., Schwartz, T., and Spassova, L. (2008).Three Output Planning Strategies for Use in Context-Aware Computing Scenarios.In Proceedings of the AISB 2008 Symposium on Multimodal Output Generation(MOG 2008), pages 46–49. University of Aberdeen.
[Kalman, 1960] Kalman, R. E. (1960). A New Approach to Linear Filtering andPredicition Problems. Transactions of the ASME – Journal of Basic Engineering,82(Series D):35–45.
[Kato and Billinghurst, 1999] Kato, H. and Billinghurst, M. (1999). Marker Track-ing and HMD Calibration for a Video-Based Augmented Reality ConferencingSystem. In Proceedings of the International Workshop on Augmented Reality ’99,pages 85–94. IEEE Press.
[Kiers et al., 2011] Kiers, M., Krajnc, E., Dornhofer, M., and Bischof, W. (2011).Evaluation and Improvements of an RFID Based Indoor Navigation System forVisually Impaired and Bild People. In Proceedings of the International Confer-ence on Indoor Positioning and Indoor Navigation (IPIN’11), pages 1–4 (onlinepublication, no pagination). IEEE.
[Kirchhof, 2011] Kirchhof, N. (2011). Approximation of Spatial and Temporal Tem-perature Behavior for Indoor Devices based on Thermal Recordings. In Proceed-ings of the International Conference on Indoor Positioning and Indoor Navigation(IPIN’11), pages 1–4 (online publication, no pagination). IEEE.
[Klebesadel et al., 1982] Klebesadel, R. W., Evans, W. D., Fenimore, E. E., Laros,J. G., and Terrell, J. (1982). Cosmic Gamma Ray Bursts – A Continuing Mystery.Los Alamos Science, 3(2):5–23.
[Kohtake et al., 2011] Kohtake, N., Morimoto, S., Kogure, S., and Manandhar, D.(2011). Indoor and Outdoor Seamless Positioning using Indoor Messaging Systemand GPS. In Proceedings of the International Conference on Indoor Positioningand Indoor Navigation (IPIN’11), pages 1–4 (online publication, no pagination).IEEE.
[Kolb and Whishaw, 2003] Kolb, B. and Whishaw, I. Q. (2003). Fundamentals ofHuman Neuropsychology. New York: W.H. Freeman, 5th revised edition.
[Koppe et al., 2011] Koppe, E., Bartolmai, M., Liers, A., and Schiller, J. (2011).Tracking Persons using a Radio-Based Multi-Sensor System. In Proceedingsof the International Conference on Indoor Positioning and Indoor Navigation(IPIN’11), pages 1–4 (online publication, no pagination). IEEE.

246 REFERENCES
[Kray, 2003] Kray, C. (2003). Situated Interaction on Spatial Topics, volume 274 ofDISKI. Berlin: Aka.
[Kruger et al., 2004] Kruger, A., Aslan, I., and Zimmer, H. (2004). The Effects ofMobile Pedestrian Navigation Systems on the Concurrent Aquisition of Route andSurvey Knowledge. In Mobile Human-Computer Interaction – MobileHCI 2004,volume 3160 of LNCS, pages 446–450. Berlin, Heidelberg: Springer.
[Kuflik et al., 2011a] Kuflik, T., Lanir, J., Dim, E., Wecker, A., Corra’, M., Zanca-naro, M., and Stock, O. (2011a). Indoor Positioning: Challenges and Solutionsfor Indoor Cultural Heritage Site. In Proceedings of the International Conferenceon Intelligent User Interfaces (IUI’11), pages 375–378. ACM.
[Kuflik et al., 2011b] Kuflik, T., Stock, O., Zancanaro, M., Gorfinkel, A., Jbara, S.,Kats, S., and Kashtan, J. S. N. (2011b). A Visitor’s Guide in an Active Museum:Presentations, Communications, and Reflection. ACM Journal on Computing andCultural Heritage, 3(3):11:1–11:25.
[Landt, 2005] Landt, J. (2005). The History of RFID. IEEE Potentials, 24(4):8–1.
[Laoudias et al., 2011] Laoudias, C., Michaelides, M., and Panayiotou, C. (2011).Fault Detection and Mitigation in WLAN RSS Fingerprint-Based Positioning. InProceedings of the International Conference on Indoor Positioning and IndoorNavigation (IPIN’11), pages 1–7 (online publication, no pagination). IEEE.
[Lauritzen and Spiegelhalter, 1988] Lauritzen, S. and Spiegelhalter, D. (1988). Lo-cal Computations with Probabilities on Graphical Structures and Their Applica-tion to Expert Systems. Journal of the Royal Statistical Society, B 50(2):157–224.
[Ledlie et al., 2011] Ledlie, J., geun Park, J., Curtis, D., Calvacante, A., Camara,L., and Vieira, R. (2011). Mole: A Scalable, User-Generated WiFi PositioningEngine. In Proceedings of the International Conference on Indoor Positioningand Indoor Navigation (IPIN’11), pages 1–10 (online publication, no pagination).IEEE.
[Link et al., 2011] Link, J. A. B., Smith, P., and Wehrle, K. (2011). FootPath: Ac-curate Map-based Indoor Navigation Using Smartphones. In Proceedings of theInternational Conference on Indoor Positioning and Indoor Navigation (IPIN’11),pages 1–8 (online publication, no pagination). IEEE.
[Lochtefeld et al., 2009] Lochtefeld, M., Schoning, J., Rohs, M., and Kruger, A.(2009). Marauders Light : Replacing the Wand with a Mobile Camera ProjectorUnit. In Proceedings of the International Conference on Mobile and UbiquitousMultimedia (MUM’09), pages 1–4 (online publication, no pagination). ACM.

REFERENCES 247
[Loskyll et al., 2009] Loskyll, M., Heckmann, D., and Glahn, C. (2009). Visual-ization of Spatial Knowledge with Ontology Trees and Adaptable Search ResultGrids in the Era of Web 3.0. In Tochtermann, K. and Maurer, H., editors, Proceed-ings of the International Conference on Knowledge Management and KnowledgeTechnologies (I-Know’09), pages 385–390. Verlag der Technischen UniversitatGraz.
[Lynch, 1960] Lynch, K. (1960). The Image of the City. Cambridge: MIT Press.
[Martınez et al., 2011] Martınez, M., Villanueva, F., Santofımia, M., and Lopez, J.(2011). A Multimodal Distributed Architecture for Indoor Localization. In Pro-ceedings of the International Conference on Indoor Positioning and Indoor Navi-gation (IPIN’11), pages 1–4 (online publication, no pagination). IEEE.
[Masters and Michael, 2005] Masters, A. and Michael, K. (2005). HumancentricApplications of RFID Implants: The Usability Contexts of Control, Convencienceand Care. In Proceedings of the International Workshop on Mobile Commerce andServices (WMCS’05). IEEE.
[Maybeck, 1979] Maybeck, P. S. (1979). Stochastic Models, Estimation and Con-trol, volume 1, chapter Chapter 1. New York, San Francisco, London: AcademicPress.
[Moghtadaiee et al., 2011] Moghtadaiee, V., Dempster, A. G., and Lim, S. (2011).Indoor Localization Using FM Radio Signals: A Fingerprinting Approach. InProceedings of the International Conference on Indoor Positioning and IndoorNavigation (IPIN’11), pages 1–7 (online publication, no pagination). IEEE.
[Munzer and Stahl, 2008] Munzer, S. and Stahl, C. (2008). Learning of VisualRoute Instructions for Indoor Wayfinding. In Holscher, C., editor, Spatial Cog-nition 2008 Poster Proceedings. International Conference on Spatial Cognition,SFB/TR8 Report No. 016-08/2008, pages 1–4 (online publication, no pagination).University of Bremen / University of Freiburg.
[Murphy and Hereman, 1995] Murphy, W. S. and Hereman, W. (1995). Determi-nation of a Position in Three Dimensions using Trilateration and ApproximateDistances. Tech. report mcs-95-07, Mathematical and Computer Sciences De-partment, Colorado School of Mines. 21 pages.
[Mutafchiev, 2008] Mutafchiev, S. (2008). Hybride Navigationsvisualisierung aufmobilen Geraten. Diploma thesis, Saarland University.
[Musicki and Koch, 2008] Musicki, D. and Koch, W. (2008). Geolocation usingTDOA and FDOA Measurements. In Proceedings of the International Conferenceon Information Fusion, pages 1987–1994. IEEE.

248 REFERENCES
[Najib et al., 2011] Najib, W., Klepal, M., and Wibowo, S. B. (2011). MapUme:Scalable Middleware for Location Aware Computing Applications. In Proceed-ings of the International Conference on Indoor Positioning and Indoor Navigation(IPIN’11), pages 1–6 (online publication, no pagination). IEEE.
[Nakamura et al., 2003] Nakamura, Y., Nishimura, T., Itoh, H., and Nakashima, H.(2003). ID-CoBIT: A Battery-Less Information Terminal with Data Upload Ca-pacity. In Conference of the IEEE Industrial Electronics Societey (IECON’03,volume 3, pages 2511–2516. IEEE.
[Nakashima, 2007] Nakashima, H. (2007). Cyber Assist Project for Ambient In-telligence. In Augusto, J. C. and Shapiro, D., editors, Advances in Ambient In-telligence, volume 164 of Frontiers in Artificial Intelligence and Applications.Amsterdam: IOS.
[Nakashima and Hasida, 2010] Nakashima, H. and Hasida, K. (2010). Cyber AssistProject as Service Science. Synthesiology – English Edition, 3(2):107–123.
[National Communications System Technology & Standards Division, 1996]National Communications System Technology & Standards Division (1996).Federal Standard 1037C: Telecommunications: Glossary of Telecommunica-tion Terms. Technical report, General Services Administration InformationTechnology Service, Arlington, USA.
[National Imagery and Mapping Agency, 2000] National Imagery and MappingAgency (2000). Department of Defense World Geodetic System 1984. TechnicalReport Third Edition, National Imagery and Mapping Agency.
[NavCen, 1996] NavCen (1996). NAVSTAR GPS User Equipment Introduc-tion. US Department of Homeland Security, public release edition.http://www.navcen.uscg.gov/pubs/gps/gpsuser/gpsuser.pdf.
[NavCen, 2001] NavCen (2001). 2001 Federal Radionavigation Sys-tems. US Department of Defence and US Department of Transportation.http://www.navcen.uscg.gov/pdf/frp/frp2001/FRS2001.pdf.
[Ndili, 1994] Ndili, A. (1994). GPS Pseudolite Signal Design. In Proceedings ofthe ION Global Positioning System GPS’94 Conference, pages 1375–1382. ION(Institute of Navigation).
[Nekoogar, 2011] Nekoogar, F. (2011). Ultra-Wideband Communications: Funda-mentals and Applications. New Jersey: Pearson.
[Ni et al., 2004] Ni, L., Liu, Y., Lau, Y., and Patil, A. (2004). LANDMARC: IndoorLocation Sensing using Active RFID. Wireless Networks, 10(6):701–710.

REFERENCES 249
[Omologo et al., 1998] Omologo, M., Svaizer, P., and Mori, R. D. (1998). AcousticTransduction. In Mori, R. D., editor, Spoken Dialogues with Computers, pages24–68. London: Academic Press.
[Ordnance Survey, 2010] Ordnance Survey (2010). A Guide to Coordinate Systemsin Great Britain. Technical Report D00659 v2.1, Southampton: Ordnance Survey.
[Passas et al., 2006] Passas, N., Paskalis, S., Kaloxylos, A., Bader, F., Narcisi, R.,Tsontsis, E., Jahan, A. S., Aghvami, H., O’Droma, M., and Ganchev, I. (2006).Enabling Technologies for the ‘Always Best Connected Concept’. Wireless Com-munications and Mobile Computing, 6(4):523–540.
[Patton et al., 2005] Patton, B. K., Aukerman, R., and Shorter, J. D. (2005). Wire-less Technologies, Wireless Fidelity (Wi-Fi) & Worldwide Interoperability for Mi-crowave Access (WiMax). Issues in Information Systems, VI(2):364–370.
[Pearl, 1985] Pearl, J. (1985). Bayesian Networks: A Model of Self-Activated Mem-ory for Evidential Reasoning. In Proceedings of the 7th Conference of the Cogni-tive Science Society, pages 329–334. University of California.
[Pearl, 1986] Pearl, J. (1986). Fusion, Propagation and Structuring in Belief Net-works. Artificial Intelligence, 29(3):241–288.
[Pearl, 1987] Pearl, J. (1987). Evidential Reasoning Using Stochastic Simulation ofCausal Models. Artificial Intelligence, 32(2):245–257.
[Peng et al., 2011] Peng, J., Zhu, M., and Zhang, K. (2011). New Algorithms Basedon Sigma Point Kalman Filter Technique for Multi-Sensor Integrated RFID In-door/Outdoor Positioning. In Proceedings of the International Conference on In-door Positioning and Indoor Navigation (IPIN’11), pages 1–4 (online publication,no pagination). IEEE.
[Pereira et al., 2011a] Pereira, C., Guenda, L., and Carvalho, N. B. (2011a). ASmart-Phone Indoor/Outdoor Localization System. In Proceedings of the Interna-tional Conference on Indoor Positioning and Indoor Navigation (IPIN’11), pages1–4 (online publication, no pagination). IEEE.
[Pereira et al., 2011b] Pereira, F., Theis, C., Moreira, A., and Ricardo, M. (2011b).Evaluating Location Fingerprinting Methods for Underground GSM NetworksDeployed over Leaky Feeder. In Proceedings of the International Conferenceon Indoor Positioning and Indoor Navigation (IPIN’11), pages 1–4 (online publi-cation, no pagination). IEEE.
[Piekarski et al., 2003] Piekarski, W., Avery, B., Thomas, B., and Malbezin, P.(2003). Hybrid Indoor and Outdoor Tracking for Mobile 3D Mixed Reality. In

250 REFERENCES
International Symposium on Mixed and Augmented Reality (ISMAR’03), pages266–267. IEEE.
[Poole et al., 1998] Poole, D., Mackworth, A., and Goebel, R. (1998). Computa-tional Intelligence, A Logical Approach. New York: Oxford University.
[Pottie and Kaiser, 2000] Pottie, G. and Kaiser, W. (2000). Wireless Integrated Net-work Sensors. Communications of the ACM, 43(5):51–58.
[QZSS, 2009] QZSS (2009). Interface Specification for QZSS (IS-QZSS Ver. 1.1).Japan Aerospace Exploration Agency.
[Rabinowitz and Spilker, 2005] Rabinowitz, M. and Spilker, J. J. (2005). A newPositioning System using Television Synchronization Signals. IEEE Transactionson Broadcasting, 51(1):51–61.
[Ranta-aho, 2010] Ranta-aho, K. (2010). Performance of 3GPP Rel-9 LTE Position-ing Methods. http://www.cwins.wpi.edu/workshop10/pres/std 2.pdf. PresentationSlides of the Invitational Workshop on Opportunistic RF Localization for NextGeneration Wireless Devices.
[Rofer et al., 2009a] Rofer, T., Laue, T., and Gersdorf, B. (2009a). iWalker – AnIntelligent Walker providing Services for the Elderly. In Proceedings of the Eu-ropean Conference on Technically Assisted Rehabilitation (TAR’09), pages 1–4(online publication, no pagination). VDe/VDI.
[Rofer et al., 2009b] Rofer, T., Mandel, C., and Laue, T. (2009b). Controlling anAutomated Wheelchair via Joystick/Head-Joystick Supported by Smart DrivingAssistance. In Proceedings of the International Conference on RehabilitationRobotics (ICORR’09), pages 743–748. IEEE.
[Ropars et al., 2011] Ropars, G., Gorre, G., Floch, A. L., Enoch, J., and Lakshmi-narayanan, V. (2011). A Depolarizer as a Possible Precise Sunstone for VikingNavigation by Polarized Skylight. Proceedings of the Royal Society A: Mathe-matical, Physical and Engineering Sciences. published online before print.
[Rosa et al., 2011] Rosa, F. D., Xu, L., Leppakoski, H., and Nurmi, J. (2011). Rela-tive Positioning of Mass Market Devices in Ad-hoc Networks. In Proceedingsof the International Conference on Indoor Positioning and Indoor Navigation(IPIN’11), pages 1–7 (online publication, no pagination). IEEE.
[Roth, 2005] Roth, J. (2005). Mobile Computing: Grundlagen, Technik, Konzepte.Heidelberg: dpunkt, second edition.

REFERENCES 251
[Runge et al., 2011] Runge, A., Baunach, M., and Kolla, R. (2011). Precise Self-Calibration of Ultrasound Based Indoor Localization Systems. In Proceedingsof the International Conference on Indoor Positioning and Indoor Navigation(IPIN’11), pages 1–8 (online publication, no pagination). IEEE.
[Ruotsalainen et al., 2011] Ruotsalainen, L., Kuusniemi, H., and Chen, R. (2011).Heading Change Detection for Indoor Navigation with a Smartphone Camera. InProceedings of the International Conference on Indoor Positioning and IndoorNavigation (IPIN’11), pages 1–7 (online publication, no pagination). IEEE.
[Russel and Norvig, 1995] Russel, S. J. and Norvig, P. (1995). Artificial Intelli-gence, A Modern Approach. New Jersey: Prentice Hall International.
[Russell and Norvig, 2003] Russell, S. J. and Norvig, P. (2003). Artificial Intelli-gence, A Modern Approach, chapter 14 and 15, pages 492–580. New Jersey:Pearson Education, second edition.
[Sadalla et al., 1980] Sadalla, E. K., Burroughs, W. J., and Staplin, L. J. (1980). Ref-erence Points in Spatial Cognition. Journal of Experimental Psychology: HumanLearning and Memory, 6(5):516–528.
[Sakamoto et al., 2011] Sakamoto, Y., Arie, H., Ebinuma, T., Fujii, K., and Sugano,S. (2011). High-accuracy IMES Localization Using a Movable Reveiver Antenna.In Proceedings of the International Conference on Indoor Positioning and IndoorNavigation (IPIN’11), pages 1–6 (online publication, no pagination). IEEE.
[Saliba, 2011] Saliba, B. (2011). An Evaluation Method For Indoor Positioning Sys-tems On the Example of LORIOT. Master’s thesis, Saarland University.
[Scarth, 1999] Scarth, R. N. (1999). Echoes from the Sky: A Story of Acoustic De-fence. Hythe: Civic Society.
[Schilit et al., 1994] Schilit, B. N., Adams, N., and Want, R. (1994). Context-AwareComputing Applications. In First International Workshop on Mobile ComputingSystems and Applications, pages 85–90. IEEE.
[Schmitz, 2010] Schmitz, M. (2010). Tangible Interaction with AnthropomorphicSmart Objects in Instrumented Environments. PhD thesis, Saarland University.
[Schmitz et al., 2008] Schmitz, M., Endres, C., and Butz, A. (2008). A Survey ofHuman-Computer Interaction Design in Science Fiction Movies. In Proceedingsof the International Conference on Intelligent Technologies for Interactive Enter-tainment (ICST INTETAIN’ 08), pages 1–10 (online publication, no pagination).ICST.

252 REFERENCES
[Schottle, 2006] Schottle, F. (2006). IPlay Blue: Interaktive Displays mit Bluetooth-basierter Benutzererkennung. Fortgeschrittenen praktikum, Saarland University.
[Schwartz, 2010] Schwartz, T. (2010). Shopping Assistance. In May, M. and Saitta,L., editors, Ubiquitous Knowledge Discovery, volume 6202 of LNAI, chapterA Blueprint for Ubiquitous Knowledge Discovery – Application Challenges forUbiquitous Knowledge Discovery, pages 120–122. Springer, Berlin, Heidelberg,New York.
[Schwartz et al., 2005] Schwartz, T., Brandherm, B., and Heckmann, D. (2005).Calculation of the User-Direction in an Always Best Positioned Mobile Local-ization System. In Proceedings of the International Workshop on Artificial Intel-ligence in Mobile Systems (AIMS 2005), pages 1–4 (online publication, no pagi-nation), Salzburg, Austria. AIMS.
[Schwartz et al., 2006] Schwartz, T., Heckmann, D., and Baus, J. (2006). SharingSensor Data in Instrumented Environments. In Proceedings of the Workshop onUbiquitous Knowledge Discovery for Users (UKDU’06), pages 81–88. HumboldtUniversity Berlin.
[Schwartz and Jung, 2006] Schwartz, T. and Jung, R. (2006). A Development Cyclefor Ambient System Design. In Pederson, T., Pinto, H., Schmitz, M., Stahl, C., andTerrenghi, L., editors, Proceedings of Modelling and Designing User Assistancein Intelligent Environments (MODIE 2006), pages 13–17. Saarland University.
[Schwartz et al., 2010a] Schwartz, T., Stahl, C., Baus, J., and Wahlster, W. (2010a).Seamless Resource-Adaptive Navigation. In Crocker, M. W. and Siekmann, J.,editors, Resource-Adaptive Cognitive Processes, Cognitive Technologies, pages239 – 265. Berlin, Heidelberg, New York: Springer.
[Schwartz et al., 2010b] Schwartz, T., Stahl, C., Muller, C., Dimitrov, V., and Ji, H.(2010b). UbiSpot – A User-Trained Always Best Positioned Engine for MobilePhones. In Proceedings of Ubiquitous Positioning Indoor Navigation and Loca-tion Based Services (UPINLBS’10), pages 1–8 (online publication, no pagination).IEEE.
[Scientific American, 1880] Scientific American (1880). Navigation in Fogs. Scien-tific American, XLIII(1):8.
[Silventoinen and Rantalainen, 1996] Silventoinen, M. and Rantalainen, T. (1996).Mobile Station Locating in GSM. In Proceedings of the International Conferenceon Personal Wireless Communications (ICPWC’96), pages 53–59. IEEE.
[Silventoinen et al., 1996] Silventoinen, M. I., Kuusela, M., and Ranta, P. A. (1996).Analysis of a new Channel Access Method for Home Base Station. In Proceedings

REFERENCES 253
of the 5th International Universal Personal Communications, volume 2, pages930–935. IEEE.
[Singh and Ismail, 2005] Singh, K. and Ismail, M. (2005). OTDOA Location De-termining Technology for Universal Intelligent Positioning System (UIPS) Im-plementation in Malaysia. In Proceedings of the International Conference onCommunication, pages 1057–1061. IEEE.
[Spassova, 2011] Spassova, L. (2011). Interactive Ubiquitous Displays Based onSteerable Projection. PhD thesis, Saarland University.
[Spassova et al., 2009] Spassova, L., Schoning, J., Kahl, G., and Kruger, A. (2009).Innovative Retail Laboratory. In Adjunct Proceedings of the European Conferenceon Ambient Intelligence (AmI’09), pages 1–4 (online publication, no pagination).AmI.
[Stahl, 2009] Stahl, C. (2009). Spatial Modeling of Activity and User Assistance inInstrumented Environments. PhD thesis, Saarland University.
[Stahl et al., 2005] Stahl, C., Brandherm, B., Schmitz, M., and Schwartz, T. (2005).Navigational and Shopping Assistance on the Basis of User Interactions in Intel-ligent Environments. In Proceedings of the International Workshop on IntelligentEnvironments, pages 182–191. IEEE.
[Stahl and Haupert, 2006] Stahl, C. and Haupert, J. (2006). Taking Location Mod-elling to new Levels: A Map Modelling Toolkit for Intelligent Envirionments.In Hazas, M., Krumm, J., and Strang, T., editors, Proceedings of the Interna-tional Workshop on Location- and Context-Awareness (LoCA’06), volume 3987of LNCS, pages 74–85. Berlin, Heidelberg, New York: Springer.
[Stahl et al., 2007] Stahl, C., Heckmann, D., Schwartz, T., and Fickert, O. (2007).Here and Now: A User-Adaptive and Location-Aware Task Planner. In Proceed-ings of the International Workshop on Ubiquitous and Decentralized User Mod-eling (UbiDeUM’2007), pages 52–63. UBIDEUM.
[Stahl and Schwartz, 2010] Stahl, C. and Schwartz, T. (2010). Modeling and Sim-ulating Assisitive Environments in 3-D with the YAMAMOTO Toolkit. In Mautz,R., Kunz, M., and Ingensand, H., editors, Proceedings of the 2010 InternationalConference on Indoor Positioning and Indoor Navigation (IPIN’10), pages 1–6(online publication, no pagination). IEEE.
[Steggles and Gschwind, 2005] Steggles, P. and Gschwind, S. (2005). The UbisenseSmart Space Platform. In Adjunct Proceedings of the International Conferenceon Pervasive Computing (Percom’05), pages 73–76. Austrian Computer Society.

254 REFERENCES
[Stephan et al., 2009] Stephan, P., Heck, I., Kraus, P., and Frey, G. (2009). Evalu-ation of Indoor Positioning Technologies under industrial application conditionsin the SmartFactoryKL based on EN ISO 9283. In Proceedings of the IFAC Sym-posium on Information Control Problems in Manufacturing (INCOM’09), pages870–875. IFAC.
[Stockman, 1948] Stockman, H. (1948). Communication by Means of ReflectedPower. Proceedings of the IRE, 36(10):1196–1204.
[Storms et al., 2010] Storms, W., Shockley, J., and Raquet, J. (2010). Magnetic FieldNavigation in an Indoor Environment. In Proceedings of Ubiquitous PositioningIndoor Navigation and Location Based Services (UPINLBS’10), pages 1–10 (on-line publication, no pagination). IEEE.
[Takaragi et al., 2002] Takaragi, K., Usami, M., Imura, R., Itsuki, R., and Satoh,T. (2002). An Ultra Small Individual Recognition Security Chip. IEEE Micro,21(6):4349.
[Tam and Lee, 2009] Tam, S. and Lee, H. (2009). MSF Whitepaper on LocationServices in LTE Networks. White paper, MultiService Forum.
[Teunissen and Kleusberg, 1996] Teunissen, P. and Kleusberg, A. (1996). GPS Ob-servation Equations and Positioning Concepts. In Kleusberg, A. and Teunissen,P., editors, GPS for Geodesy, volume 60 of Lecture Notes in Earth Sciences, pages175–217. Berlin, Heidelberg: Springer.
[Thomas and Ros, 2005] Thomas, F. and Ros, L. (2005). Revisiting Trilateration forRobot Localization. IEEE Transactions on Robotics, 21(1):93–101.
[Vaitl, 1996] Vaitl, D. (1996). Interoception. Biological Psychology, 42:1–27.
[van Diggelen, 1997] van Diggelen, F. (1997). GPS and GPS+GLONASS RTK. InProceedings of the International Technical Meeting of the Satellite Division ofThe Institute of Navigation (ION GPS 1997), pages 139–144. ION (Institute ofNavigation).
[van Waterschoot van der Gracht et al., 1928] van Waterschoot van der Gracht, W.,Willis, B., Chamberlin, R. T., Joly, J., Molengraaff, G., Gregory, J., Wegener,A., Schuchert, C., Longwell, C. R., Taylor, F. B., Bowie, W., White, D., Singe-wald, J. T., and Berry, E. W., editors (1928). Theory of Continental Drift: ASymposium on the Origin and Movement of Land Masses, both Inter-Continaland Itra-Continal, as proposed by Alfred Wegener. The American Association ofPetroleum Geologists.

REFERENCES 255
[Vesely, 2010] Vesely, J. (2010). Differential Doppler Target Position Fix Comptu-ing Model. In Proceedings of the International Conference on Circuits, Systems,Signals, pages 284–287. WSEAS Press.
[Virrantaus et al., 2001] Virrantaus, K., Markkula, J., and Garmash, A. (2001). De-veloping GIS-Supported Location-Based Services. In Proceedings of the Interna-tional Workshop on Web Geographical Information Systems (WHIS’ 2001), pages423–432. IEEE.
[Wagner et al., 2006] Wagner, M., Wehner, R., and Wolf, H. (2006). The AntOdometer: Stepping on Stilts and Stumps. Science, 312(5782):1965–1967.
[Wahlster et al., 2001] Wahlster, W., Baus, J., Kray, C., and Kruger, A. (2001).REAL: Ein ressourcenadaptierendes mobiles Navigationssystem. InformatikForschung und Entwicklung, 16(4):233–241.
[Wahlster et al., 2006] Wahlster, W., Schwarzkopf, E., Sauermann, L., Roth-Berghofer, T., Pfalzgraf, A., Kiesel, M., Heckmann, D., Dengler, D., Dengel,A., and Sintek, M. (2006). Web 3.0: Convergence of Web 2.0 and the SemanticWeb. Technology Radar, II:1–23.
[Wahlster and Tack, 1997] Wahlster, W. and Tack, W. (1997). Ressourcenadaptivekognitive Prozesse. In Jarke, M., Pasedach, K., and Pohl, K., editors, Infor-matik 97 – Informatik als Innovationsmotor, pages 51–57. Berlin, Heidelberg,New York: Springer.
[Want and Hopper, 1992] Want, R. and Hopper, A. (1992). Active Badges and Per-sonal Interactive Computing Objects. IEEE Transactions on Consumer Electron-ics, 38(1):10–20.
[Want et al., 1992] Want, R., Hopper, A., Falcao, V., and Gibbons, J. (1992). TheActive Badge Location System. ACM Transactions on Information Systems,10(1):91–102.
[Ward, 1998] Ward, A. (1998). Sensor-driven Computing. PhD thesis, University ofCambridge.
[Ward et al., 1997] Ward, A., Jones, A., and Hopper, A. (1997). A New LocationTechnique for the Active Office. IEEE Personal Communications, 4(5):42–47.
[Waßmuth, 2006] Waßmuth, S. (2006). Wegsuche in polygonbasierten Umge-bungsmodellen. Fortgeschrittenen Praktikum, Saarland University.
[Waßmuth, 2008] Waßmuth, S. (2008). Wegsuche mit dem A*-Algorithmus in hier-archischen polygonbasierten Umgebungsmodellen. Master’s thesis, Saarland Uni-versity.

256 REFERENCES
[Waters et al., 2011] Waters, D. W., Xhafa, A. E., Vedantham, R., and Ramasub-ramanian, K. (2011). Fine-Time Assistance for GNSS using Wi-Fi. In Proceed-ings of the International Conference on Indoor Positioning and Indoor Navigation(IPIN’11), pages 1–4 (online publication, no pagination). IEEE.
[Wehner and Lanfranconi, 1981] Wehner, R. and Lanfranconi, B. (1981). What dothe Ants Know about the Rotation of the Sky? Nature, 293(29):731–733.
[Weidmann, 1993] Weidmann, U. (1993). Transporttechnik der Fussganger. Tech-nical Report 90, IVT – Institut fur Verkehrsplanung, Transporttechnik, Strassen-und Eisenbahnbau, ETH Zurich. second edition, 109 pages.
[Welch and Bishop, 2006] Welch, G. and Bishop, G. (2006). An Introduction to theKalman Filter. Technical report, University of North Carolina at Chapel Hill.
[Wolpert and Ghahramani, 2000] Wolpert, D. M. and Ghahramani, Z. (2000). Com-putational Principles of Movement Neuroscience. Nature Neuroscience, 3:1212–1217.
[Xiao et al., 2011] Xiao, W., Ni, W., and Toh, Y. K. (2011). Integrated Wi-Fi Fin-gerprinting and Inertial Sensing for Indoor Positioning. In Proceedings of the In-ternational Conference on Indoor Positioning and Indoor Navigation (IPIN’11),pages 1–6 (online publication, no pagination). IEEE.
Related Documents