PREVALENCE OF DEMENTIA IN THE UNITED STATES: THE AGING, DEMOGRAPHICS, AND MEMORY STUDY B.L. Plassman, PhD 1 K.M. Langa, MD, PhD 2,3,4 G.G. Fisher, PhD 4 S.G. Heeringa, PhD 4 D.R. Weir, PhD 4 M.B. Ofstedal, PhD 4 J.R. Burke, MD, PhD 5 M.D. Hurd, PhD 6 G.G. Potter, PhD 1 W.L. Rodgers, PhD 4 D.C. Steffens, MD, MHS 1 R.J. Willis, PhD 4 R.B. Wallace, MD 7 ***The citation for the original publication should be used when referencing this manuscript. The citation is: Plassman, B.L., Langa, K.M., Fisher, G.G., Heeringa, S.G., Weir, D.R., Ofstedal, M.B., Burke, J.R., Hurd, M.D., Potter, G.G., Rodgers, W.L., Steffens, D.C., Willis, R.J., Wallace, R.B. (2007). Prevalence of Dementia in the United States: The Aging, Demographics, and Memory Study. Neuroepidemiology. 29:125-132 Please see next page for author affiliations Running Head: Dementia Prevalence in the United States Key Words: dementia, aging, epidemiology, population-based research Disclosure: The authors have reported no conflicts of interest. Send correspondence and reprint requests to : Brenda Plassman, PhD 905 W. Main Street Ste 25-D, Box 41 Duke University Medical Center Durham, NC 27701 Phone: 919-682-6722 FAX: 919-687-0424 [email protected]

Welcome message from author
This document is posted to help you gain knowledge. Please leave a comment to let me know what you think about it! Share it to your friends and learn new things together.
Transcript

PREVALENCE OF DEMENTIA IN THE UNITED STATES:
THE AGING, DEMOGRAPHICS, AND MEMORY STUDY
B.L. Plassman, PhD 1
K.M. Langa, MD, PhD 2,3,4
G.G. Fisher, PhD 4
S.G. Heeringa, PhD 4
D.R. Weir, PhD 4
M.B. Ofstedal, PhD 4
J.R. Burke, MD, PhD 5
M.D. Hurd, PhD 6
G.G. Potter, PhD 1
W.L. Rodgers, PhD 4
D.C. Steffens, MD, MHS 1
R.J. Willis, PhD 4
R.B. Wallace, MD 7
***The citation for the original publication should be used when referencing this manuscript. The citation is:
Plassman, B.L., Langa, K.M., Fisher, G.G., Heeringa, S.G., Weir, D.R., Ofstedal, M.B., Burke, J.R., Hurd, M.D., Potter, G.G., Rodgers, W.L., Steffens, D.C., Willis, R.J., Wallace, R.B. (2007). Prevalence of Dementia in the United States: The Aging, Demographics, and Memory Study. Neuroepidemiology. 29:125-132
Please see next page for author affiliations Running Head: Dementia Prevalence in the United States Key Words: dementia, aging, epidemiology, population-based research Disclosure: The authors have reported no conflicts of interest.
Send correspondence and reprint requests to:
Brenda Plassman, PhD 905 W. Main Street Ste 25-D, Box 41 Duke University Medical Center Durham, NC 27701 Phone: 919-682-6722 FAX: 919-687-0424 [email protected]

Author Affiliations:
1 Department of Psychiatry and Behavioral Sciences, Duke University Medical Center, Durham,
NC
2 Division of General Medicine, Department of Medicine, University of Michigan, Ann Arbor,
MI
3 Veterans Affairs Center for Practice Management and Outcomes Research, Ann Arbor, MI
4 Institute for Social Research, University of Michigan, Ann Arbor, MI
5 Department of Medicine (Neurology), Duke University Medical Center, Durham, NC
6 RAND, Santa Monica, CA
7 Colleges of Public Health and Medicine, University of Iowa, Iowa City, IA
Funding / Support: The National Institute on Aging provided funding for the Health and
Retirement Study and the Aging, Demographics, and Memory Study (U01 AG09740). The
Health and Retirement Study is performed at the Survey Research Center, Institute for Social
Research, University of Michigan. Except for providing the funding for the study, the sponsor
did not have a role in the collection, management, analysis, and interpretation of the data; and
preparation, review or approval of the manuscript.
Dr. Langa was supported by a Career Development Award from the National Institute on
Aging (K08 AG019180), a New Investigator Research Grant from the Alzheimer’s
Association, and a Paul Beeson Physician Faculty Scholars in Aging Research award.
Acknowledgements: The ADAMS required the collaboration of a large number of
investigators and research staff. In addition to all of the ADAMS subjects and informants, we
thank the other members of the expert diagnostic panel: John Breitner, MD; Norman Foster,
MD; Hugh Hendrie, MB, ChB; Bruno Giordani, PhD; Frederick Unverzagt, PhD; and Kathleen
2

Welsh-Bohmer, PhD. We also thank the research staff: Kent Anglin; Carolyn Bellion; Carol
Bowen; Candace Boyette; Jackie Cardenas; Deborah Chestnutt; Jennifer Copp; Kelly Cutshall;
Munira Dhanani; Debbie Drosdick; Norman Edwards; Larry Ellefson; Ella Faircloth;; Shannon
Foster; Carri Fuller; Deanna Hamilton; Heather Hewett; Eva Hildreth; Myca Jeter; Leslie
Johnson; Janet Keller; Colleen Kelly; Josh Kittinger; Nicole Kirgis; Laurie Leeson; Cathy
Liebowitz; Pauline Moore; Roberta Moore; Tiffany Newman; Kristin Olver; Vicki Robertson;
Karen Rodin; Cuancha Serrant; Madeline Schoberl; Katie Szilagyi; Pat Titus; and Courtnee
Willetts.
3

Abstract
Aim: To estimate prevalence of Alzheimer’s disease (AD) and other dementias in the United
States using a nationally representative sample.
Methods: The Aging, Demographic and Memory Study (ADAMS) sample was composed of
856 individuals age 71 and older from the nationally representative Health and Retirement Study
(HRS) who were evaluated for dementia using a comprehensive in-home assessment. An expert
consensus panel used this information to assign a diagnosis of normal cognition, cognitive
impairment but not demented, or dementia (and dementia sub-type). Using sampling weights
derived from the HRS, we estimated the national prevalence of dementia, Alzheimer’s disease,
and vascular dementia by age and gender.
Results: The prevalence of dementia among individuals age 71 and older was 13.7%,
comprising about 3.3 million individuals in the US in 2002. The corresponding values for AD
were 9.5% and 2.3 million individuals. Dementia prevalence increased with age, from 5% of
those aged 71–79 years to 37.2% of those aged 90 and older.
Conclusions: Dementia prevalence estimates from this first nationally representative population-
based study of dementia in the United States to include subjects from all regions of the country
can provide essential information for effective planning for the impending healthcare needs of
the large and increasing number of individuals at risk for dementia as our population ages.
4

Background
The elderly population (those age 65 or older) in the United States (U.S.) is expected to
double from approximately 35 million today to more than 70 million by 2030.[1] With this rapid
growth in the number of older Americans, prevention and treatment of chronic diseases of aging
will take on growing importance. Dementia is a disease of particular concern because the
decline in memory and other cognitive functions that characterize this condition also lead to a
loss of independent function that has a wide-ranging impact on individuals, families, and
healthcare systems. Accurate national estimates of the current and future prevalence of dementia
are essential for effective planning for the long-term care and medical costs that will fall to the
Social Security, Medicare, and other insurance programs for elderly adults in the U.S. To date,
five important reports have estimated prevalence of dementia or AD in the U.S. [2-6], all
employing extrapolations from a few U.S. communities or from European and Canadian studies.
However, studies of other medical conditions, such as stroke, hypertension, and cancer, suggest
substantial regional variation in occurrence of these conditions throughout the U.S. [7,8].
Similar regional variability may occur for dementia as well. In an attempt to directly determine
the dementia prevalence rate in the US, we conducted the Aging, Demographics, and Memory
Study (ADAMS), the first population-based study of dementia to include individuals from all
regions of the country.
5
Methods
Sample
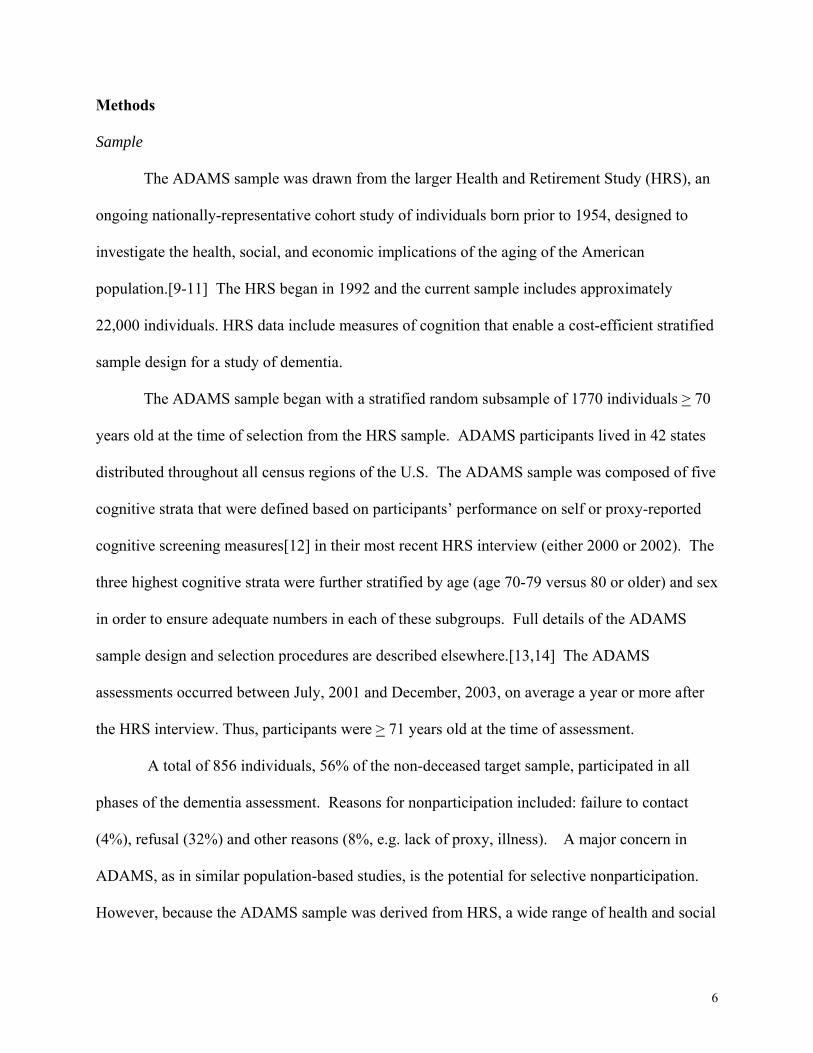
The ADAMS sample was drawn from the larger Health and Retirement Study (HRS), an
ongoing nationally-representative cohort study of individuals born prior to 1954, designed to
investigate the health, social, and economic implications of the aging of the American
population.[9-11] The HRS began in 1992 and the current sample includes approximately
22,000 individuals. HRS data include measures of cognition that enable a cost-efficient stratified
sample design for a study of dementia.
The ADAMS sample began with a stratified random subsample of 1770 individuals > 70
years old at the time of selection from the HRS sample. ADAMS participants lived in 42 states
distributed throughout all census regions of the U.S. The ADAMS sample was composed of five
cognitive strata that were defined based on participants’ performance on self or proxy-reported
cognitive screening measures[12] in their most recent HRS interview (either 2000 or 2002). The
three highest cognitive strata were further stratified by age (age 70-79 versus 80 or older) and sex
in order to ensure adequate numbers in each of these subgroups. Full details of the ADAMS
sample design and selection procedures are described elsewhere.[13,14] The ADAMS
assessments occurred between July, 2001 and December, 2003, on average a year or more after
the HRS interview. Thus, participants were > 71 years old at the time of assessment.
A total of 856 individuals, 56% of the non-deceased target sample, participated in all
phases of the dementia assessment. Reasons for nonparticipation included: failure to contact
(4%), refusal (32%) and other reasons (8%, e.g. lack of proxy, illness). A major concern in
ADAMS, as in similar population-based studies, is the potential for selective nonparticipation.
However, because the ADAMS sample was derived from HRS, a wide range of health and social
6

information was available to assess and correct for potential selection bias in our sample. Using
logistic regression, the probability that a sample subject participated in the ADAMS assessment
was modeled as a function of covariates including: age, gender, education, marital status, HRS
cognition scores, nursing home residency, and indicators of prior or existing major health
conditions such as cancer, heart disease, stroke, diabetes or psychiatric disorders. Among
persons who were able to complete the previous HRS interview without the aid of a proxy (self-
reporters), male gender and a previous diagnosis of cancer or stroke were associated with higher
rates of ADAMS participation. For subjects who required assistance of a caregiver or other
proxy to complete the previous HRS interview, higher ADAMS participation rates were
observed for women, nursing home residents and subjects with generally lower cognitive
function status. The results of this response propensity analysis were used to develop
nonresponse adjustments to the ADAMS sample selection weights.[15] Population sample
weights were then constructed to take into account the probabilities of selection in the stratified
sample design and to adjust for differential nonparticipation in ADAMS.[13]
All analyses were conducted in SAS V9.1.3 using the special Survey procedures that
account for the influence of this weighting and other complex sample design features on the
standard errors and confidence intervals of sample estimates, as well as the values of test
statistics. The ADAMS data are publicly available and can be obtained from the HRS
website.[16]
All study procedures were approved by the Institutional Review Boards at Duke
University Medical Center and the University of Michigan, and informed consent was obtained
from study participants or their surrogates.
7
Dementia Assessment and Diagnosis
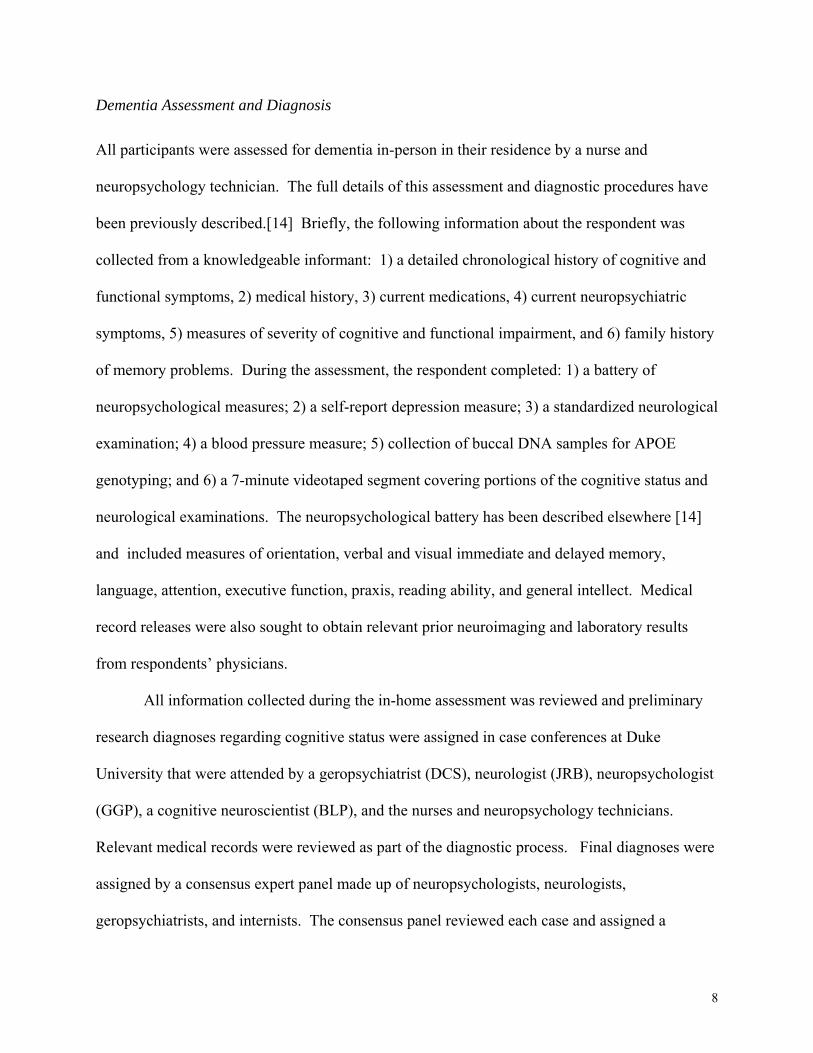
All participants were assessed for dementia in-person in their residence by a nurse and
neuropsychology technician. The full details of this assessment and diagnostic procedures have
been previously described.[14] Briefly, the following information about the respondent was
collected from a knowledgeable informant: 1) a detailed chronological history of cognitive and
functional symptoms, 2) medical history, 3) current medications, 4) current neuropsychiatric
symptoms, 5) measures of severity of cognitive and functional impairment, and 6) family history
of memory problems. During the assessment, the respondent completed: 1) a battery of
neuropsychological measures; 2) a self-report depression measure; 3) a standardized neurological
examination; 4) a blood pressure measure; 5) collection of buccal DNA samples for APOE
genotyping; and 6) a 7-minute videotaped segment covering portions of the cognitive status and
neurological examinations. The neuropsychological battery has been described elsewhere [14]
and included measures of orientation, verbal and visual immediate and delayed memory,
language, attention, executive function, praxis, reading ability, and general intellect. Medical
record releases were also sought to obtain relevant prior neuroimaging and laboratory results
from respondents’ physicians.
All information collected during the in-home assessment was reviewed and preliminary
research diagnoses regarding cognitive status were assigned in case conferences at Duke
University that were attended by a geropsychiatrist (DCS), neurologist (JRB), neuropsychologist
(GGP), a cognitive neuroscientist (BLP), and the nurses and neuropsychology technicians.
Relevant medical records were reviewed as part of the diagnostic process. Final diagnoses were
assigned by a consensus expert panel made up of neuropsychologists, neurologists,
geropsychiatrists, and internists. The consensus panel reviewed each case and assigned a
8

diagnosis in two stages, first without the medical records and then with the medical records. All
individuals involved in the clinical assessments or diagnosis of ADAMS participants were blind
to the participants’ HRS cognitive screening scores.
Diagnoses fell within the three general categories: normal cognitive function, cognitively
impaired but not demented (CIND), and dementia. Dementia diagnosis was based on guidelines
from DSM-III-R [17] and DSM-IV [18] criteria; however, if the two sets of criteria resulted in
discrepant outcomes, the final diagnosis was based on the clinical judgment of the consensus
panel. Currently accepted diagnostic criteria for subtypes of dementia were used.[19-21, 27]
DSM criteria for dementia require memory impairment, however some subtypes of dementia do
not present with prominent memory problems. To account for this, the diagnostic process was
anchored by the criteria, but the consensus panel used clinical judgments to assign the final
diagnosis. To reflect that dementia is often the consequence of more than one pathological
process, we assigned a primary and secondary diagnosis denoting these multiple etiologies. Our
assessment and diagnostic procedures have been validated against neuropathological
diagnoses.[22]
Analyses
Using the ADAMS population weights described above, we estimated the national
prevalence of dementia, AD and VaD in 2002 for all individuals age 71 and older, stratified by 9
or 10-year age categories. We then re-ran the analyses grouping the ‘dementia, undetermined
etiology’ as AD because this diagnostic category includes AD in the differential diagnosis and
post-mortem examinations have shown that the majority of individuals with this clinical
diagnosis have neuropathology consistent with Definite AD.[22]
9

We then estimated the total number of individuals age 71 and older in the U.S. in 2002
with dementia, AD, and VaD using the ADAMS population weights. The total size of the age 71
and older population for 2002 derived using the ADAMS population weights matched closely
the population estimates from the U.S. Census Bureau and Current Population Survey.[23,24]
To examine purported predictors of dementia reported by other studies, we used logistic
regression to estimate the likelihood of dementia and AD first as a function of age and each of
the following variables individually: years of education, gender, race, and APOE genotype. We
then ran models that included age, education, and gender, and sequentially added the other
variables to identify predictors of the outcome (dementia, AD). In these models, race was
dichotomized as African American or Caucasian. Other ethnic and racial groups were not
included in these analyses due to the small sample sizes.
Results
Prevalence of dementia, AD, and VaD
Table 1 provides sample characteristics for the 856 ADAMS participants based on
dementia status. The sample is well-distributed across the range of age and education levels with
a significant number of individuals age 90+ and also a large percentage with 8 or fewer years of
education.
Table 2 shows the overall national prevalence estimates for AD, VaD, and all dementia
and additionally stratified by gender and 9 or 10-year age ranges. As expected, the national
prevalence of AD, VaD, and all dementia increased with age, reaching 37.2% dementia
prevalence among individuals age 90 and older.
Overall, AD accounted for approximately 69.6% of all dementia, while VaD accounted
for 17.5%. Other types of dementia such as ‘dementia, undetermined etiology’, Parkinson’s
10

dementia, normal pressure hydrocephalus, frontal lobe dementia, alcoholic dementia, traumatic
brain injury, and Lewy body dementia accounted for the remaining 12.9% of cases. With
increasing age, AD accounted for progressively more of the dementia cases so that in the age
90+ group, AD accounted for 79.6% of the dementia cases compared to 46.6% among those age
71-79.
When those diagnosed with ‘dementia, undetermined etiology’(n= 23) were categorized
as AD, the overall prevalence of AD increased to 10.9% (95% C.I. = 8.70 – 13.11%), with
corresponding values of 8.3% (5.86 – 10.74%) for males and 12.60% (9.35 – 15.86%) for
females.
The estimated number of individuals nationwide age 71 years and older with dementia
and AD are reported in Table 3. The corresponding estimate for the overall number of cases of
VaD is 577,000 (319,000 – 834,000).
Predictors of Dementia or AD
In a series of logistic models that included age and one additional variable (i.e.,
education, gender, race, or APOE genotype), older age was consistently associated with
increased risk of dementia (p < 0.0001). In these trivariate models, more years of education was
associated with lower risk of dementia (p < 0.0001). There was no significant difference in
dementia risk between males and females (p = 0.24). African Americans were at greater risk for
dementia (p= 0.009). As expected, the presence of one (O.R.= 2.1; 95% C.I. = 1.45 – 3.08) or
two APOE e4 alleles (O.R. = 7.1; 2.93 – 17.25.) was significantly associated with increased risk
of dementia.
11

As shown in Table 4, in the multivariate models, dementia risk increased with older age,
fewer years of education, and the presence of at least one APOE e4 allele. In the presence of
these variables, gender and race were not significantly associated with risk of dementia.
In a series of parallel logistic regression models for AD that included age and one
additional term, increasing age consistently was associated with AD (p < 0.0001). In these
models, more years of education was associated with lower risk of AD (p = 0.001), but there was
no difference between risk of AD for males and females (p = 0.12). African Americans were
more likely to have AD than Caucasians (p= 0.002). As expected, the presence of one APOE e4
allele (O.R.= 1.9; 1.17 - 3.16) or two e4 alleles (O.R. = 10.2; 3.85 – 26.96) was associated with
significantly increased AD risk. As shown in Table 5, the results of the multivariate logistic
models for AD were similar to those for dementia as a whole.
Discussion
The ADAMS has produced the first prevalence estimates of dementia and AD in a
nationally representative sample in the U.S to include individuals from all regions of the country.
To allow comparison with findings from previous studies using a lower minimum age (i.e. either
age 60+ or 65+), we combined the estimates from ADAMS for ages 71 and greater with those
from other studies for ages 60 to 70.[3, 6,25] This resulted in an estimated total of 3.7 million
individuals with dementia and just over 2.5 million with AD in the U.S. The sole previous
national estimate of dementia prevalence was 2.9 million, based on a Delphi consensus review of
previously published studies in the U.S.[3] The four previous national estimates of AD
prevalence estimates differed by greater than two-fold and ranged from 2.1 million [6] to 4.5
million.[5,26] The lowest estimate came from a meta-analysis of 18 US and European studies;
the highest from the East Boston and Chicago community studies.[5,26] Variability in
12

prevalence estimates of AD due to geographic factors has been discussed. In addition to the
issue of extrapolation from regional samples, one likely source for variation among AD
prevalence estimates is the use of different criteria for dementia. Some studies used criteria that
do not require evidence of impaired functional performance,[27] while most use criteria
requiring significant impairment in social or occupational functioning.[17,18] Another likely
source of study variation is the use of different methods to identify the “border” between
cognitive impairment that is not severe enough to meet criteria for dementia. This intermediate
state between normal cognitive function and dementia is often referred to as Cognitive
Impairment, not Demented (CIND)[28] or Mild Cognitive Impairment (MCI).[29] Future
analyses of ADAMS data, including analyses of longitudinal follow-up assessments of those
diagnosed with CIND, will be important to help clarify the border between CIND and dementia
in population-based settings.
Comparisons of prevalence estimates across studies are also difficult due to differences in
the age brackets reported. However, a general comparison of age-specific prevalence rates from
ADAMS with those from local and regional samples in the U.S.[30-33] suggests that, as a group,
findings from the other studies span the estimates produced in the ADAMS, possibly reflecting
its more complete representation of the U.S. population. The completion of the ADAMS will
also facilitate international comparisons of dementia prevalence between other countries and the
United States. A comparison to the Canadian population [34] shows that the two countries have
similar rates of dementia.
Few predictors of AD and other dementias have been consistently identified across
studies. One explanation often cited for these incongruent results is the lack of sufficient sample
size spanning the variable range. On this point, the ADAMS representative sample likely has
13

advantages. Not surprisingly, age was the strongest predictor of both AD and other dementias in
the ADAMS. Consistent with several (for review [35,36]), but not all [37] other studies, more
years of education was associated with lower risk of dementia. Several studies have reported
that females are at greater risk of AD than males;[34,38,39] however others have reported no
such difference.[40,41] In the ADAMS, women were not at higher risk for AD and other
dementias. Results have been discrepant from the few regional studies that have examined race
as a predictor for dementia. Some studies reported higher frequency of AD or dementia among
African Americans compared to Caucasians,[42,43] while another reported no such
difference.[44] In ADAMS, African Americans had a higher frequency of dementia and AD,
but once education, gender and APOE genotype were controlled, the odds ratio was still
elevated, but no longer statistically significant. These findings were similar to those from two
other studies.[45,46] Consistent with many other studies,[47] we found that the APOE e4 allele
was associated with increased risk of AD and dementia in general.
This study has several strengths: a representative, directly assessed sample of the U.S.
population age 71 and older; the inclusion of large numbers of individuals with few years of
education; a sizeable sample over age 90; and the inclusion of long term care residents. All of
these groups have a high prevalence of dementia. In addition, employing a single, experienced
assessment team, successfully used in other population studies, and one common expert case
review panel likely minimized diagnostic variability.
Some limitations also exist. The ADAMS participation rate was lower than hoped for but
comparable to other population studies of this age group, such as the Cardiovascular Health
Study (participation rate of 57.3% [48]) and the Canadian Study of Health and Aging (68.5%
[34]). Both studies have made major scientific contributions to our understanding of health and
14

memory in late life. Nonparticipation in all such studies could result in selection bias. ADAMS
has addressed potential non-response bias using detailed archived information from prior
interviews, although models based on measures collected 6-18 months prior to the ADAMS
assessment may not fully capture selection bias. However, given the range of available measures,
it is likely that the response propensity models and the associated weighting adjustments do
capture the major factors that could contribute to any significant selection bias in population
estimates based on the ADAMS data. We also note that the lack of neuroimaging and other
medical tests for all participants may have influenced the accuracy with which non-AD
dementias were identified. However, for the 39% of individuals with dementia for whom
neuroimaging results were available, in no instance was a solely non-VaD diagnosis that was
assigned prior to review of neuroimaging subsequently changed to a solely VaD diagnosis after
review of these records. Finally, our supplemental analyses grouping those with ‘dementia,
undetermined etiology’ with the AD group may somewhat overestimate the prevalence of AD.
Our previous research [22] justifying this analysis included only Caucasian subjects. Although
16 of the 23 individuals with ‘dementia, undetermined etiology’ in ADAMS were Caucasian, it
is not clear whether these findings would generalize to the minority of African Americans with
this diagnosis in ADAMS.
As the elderly U.S. population grows, the number of individuals with dementia will also
increase, making planning for the long term care needs of these individuals increasingly
important. The value of the ADAMS, the first study of dementia in a nationally representative
sample in the U.S., extends beyond just estimating prevalence of dementia to being able to
address many of the key questions in preparing for the care of the demented and their families.
These prevalence estimates provide the framework necessary to assess the impact of treatment
15

16
advances as they become available.[49] In the years to come, the ADAMS methodology can
provide a marker of how well the country is doing with respect to the control and treatment of
AD and other dementias. Regional studies in the U.S. will now have a national estimate with
which to compare when exploring regional differences in disease patterns. The ADAMS data
also can be enriched with other data collected from the ongoing HRS [14] and as part of the
linkage of HRS to Medicare records allowing researchers to explore questions that might
increase our understanding of, and ability to successfully address, the needs of an aging U.S.
population.
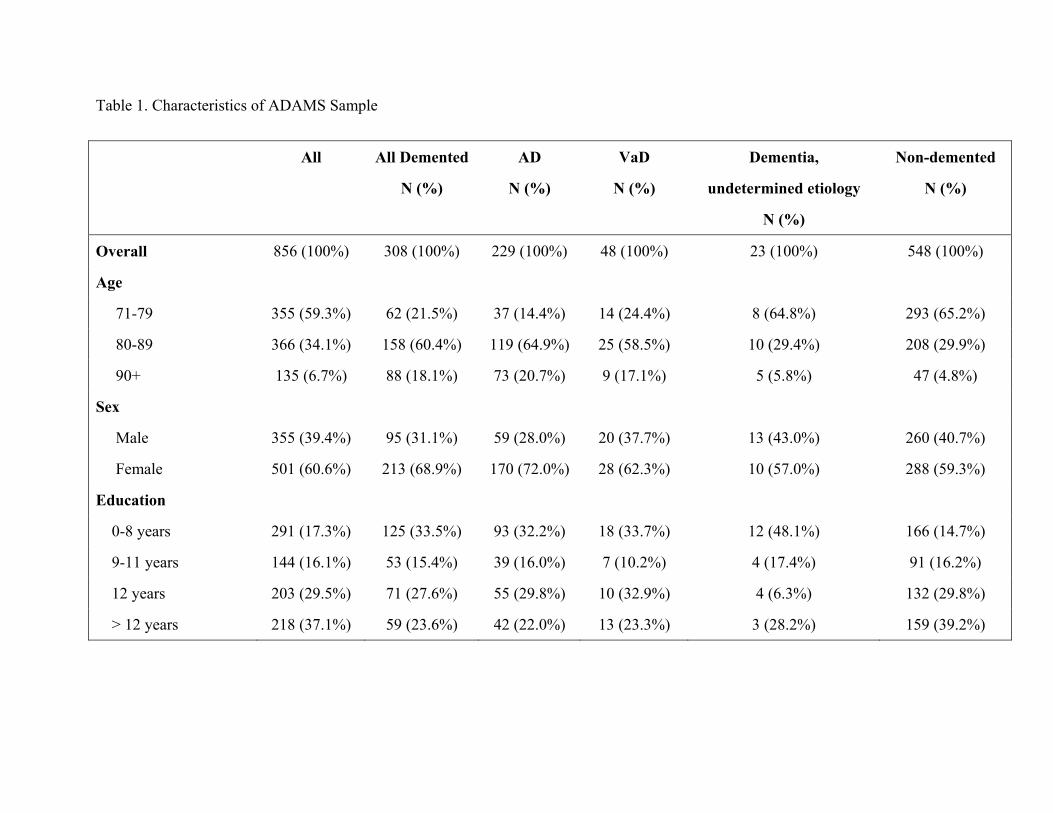
Table 1. Characteristics of ADAMS Sample
All All Demented
N (%)
AD
N (%)
VaD
N (%)
Dementia,
undetermined etiology
N (%)
Non-demented
N (%)
Overall 856 (100%) 308 (100%) 229 (100%) 48 (100%) 23 (100%) 548 (100%)
Age
71-79 355 (59.3%) 62 (21.5%) 37 (14.4%) 14 (24.4%) 8 (64.8%) 293 (65.2%)
80-89 366 (34.1%) 158 (60.4%) 119 (64.9%) 25 (58.5%) 10 (29.4%) 208 (29.9%)
90+ 135 (6.7%) 88 (18.1%) 73 (20.7%) 9 (17.1%) 5 (5.8%) 47 (4.8%)
Sex
Male 355 (39.4%) 95 (31.1%) 59 (28.0%) 20 (37.7%) 13 (43.0%) 260 (40.7%)
Female 501 (60.6%) 213 (68.9%) 170 (72.0%) 28 (62.3%) 10 (57.0%) 288 (59.3%)
Education
0-8 years 291 (17.3%) 125 (33.5%) 93 (32.2%) 18 (33.7%) 12 (48.1%) 166 (14.7%)
9-11 years 144 (16.1%) 53 (15.4%) 39 (16.0%) 7 (10.2%) 4 (17.4%) 91 (16.2%)
12 years 203 (29.5%) 71 (27.6%) 55 (29.8%) 10 (32.9%) 4 (6.3%) 132 (29.8%)
> 12 years 218 (37.1%) 59 (23.6%) 42 (22.0%) 13 (23.3%) 3 (28.2%) 159 (39.2%)

18
Table 1. (cont.) Race/Ethnicity
Non-Hispanic White 613 (87.1%) 218 (83.5%) 162 (82.1%) 36 (87.0%) 15 (86.7%) 395 (87.7%)
Non-Hispanic Black 159 (7.6%) 67 (12.4%) 49 (12.9%) 9 (10.8%) 7 (12.0%) 92 (6.9%)
Hispanic 84 (5.2%) 23 (4.1%) 18 (5.0%) 3 (2.3%) 1 (1.3%) 61 (5.4%) Ns are unweighted, percentages are weighted and calculated within columns. AD- Alzheimer’s disease, VaD – vascular dementia,

Table 2. National Prevalence of Dementia, Alzheimer’s Disease, and Vascular Dementia, By Age Categories
All Dementia AD
Age Combined
Male
Female
Combined
Male
Female
71-79 4.97
(2.61–7.32)
5.25
(1.25–9.25)
4.76
(1.82–7.70)
2.32
(1.26–3.37)
2.30
(0.80–3.81)
2.33
(0.95–3.70)
80-89 24.19
(19.28-29.11)
17.68
(11.66–23.70)
27.84
(20.41–35.28)
18.10
(13.47–22.74)
12.33
(5.82-18.84)
21.34
(14.44-28.24)
90+ 37.20
(25.36–49.03)
44.59
(21.70–67.47)
34.69
(23.36– 46.02)
29.60
(18.59–40.61)
33.89
(10.00–57.77)
28.15
(17.61-38.69)
Total 13.67
(11.21–16.12)
10.80
(7.55–14.05)
15.53
(12.23–18.83)
9.51
(7.41–11.61)
6.77
(4.16– 9.39)
11.29
(8.35–14.23)
Percent and (95% confidence interval) provided.
19

20
Table 2. (cont.)
VaD
Combined
Male
Female
0.98
(0.07-1.89)
1.27
(0.00–3.19)
0.76
(0.18–1.35)
4.09
(1.52–6.67)
3.58
(1.37–5.79)
4.38
(0.71–8.05)
6.14
(2.16–10.12)
8.14
(0.00-16.75)
5.46
(1.49–9.44)
2.38
(1.32–3.45)
2.28
(0.69–3.87)
2.45
(1.08–3.82)

Table 3. National Estimates of Number of Individuals with Dementia or Alzheimer’s Disease Age All Dementia AD 71-79 712,000
(375,000 – 1,050,000) 332,000
(181,000 – 483,000) 80-89 1,996,000
(1,590,000 – 2,401,000) 1,493,000
(1,111,000 – 1,875,000) 90+ 598,000
(408,000 – 789,000) 476,000
(299,000 – 653,000) Total 3,306,000
(2,712,000 – 3,900,000) 2,301,000
(1,794,000 – 2,809,000) 95% confidence intervals in parentheses.
21

Table 4. Logistic Regression Models for Dementia
Model
1
Odds Ratio
(95% C. I.)
2
Odds Ratio
(95% C. I.)
3
Odds Ratio
(95% C. I.)
Age 1.16 1.16 1.17
(1.12 – 1.20) (1.12 – 1.20) (1.13 – 1.22)
Education 0.90 0.92 0.91
(0.86 – 0.94) (0.87 – 0.97) (0.86 – 0.96)
Sex* 1.27 1.23 1.28
(0.89 – 1.82) (0.85 – 1.78) (0.88 – 1.86)
Race** 1.65 1.37
(0.93 – 2.92) (0.78 – 2.41)
Any APOE e4+ 2.57
(1.72 – 3.86)
Wald χ2 (df)
p value
2.95 (1)
0.09
20.87 (1)
<0.001
* Male = 0, Female = 1; ** Caucasian = 0, African American = 1; + Any APOE e4 = 1. Wald χ2
compares the fit of the model to the prior model. Significant p values indicate a significant
improvement in model fit.
22

Table 5. Logistic Regression Models for Alzheimer’s Disease
Model
1
Odds Ratio
(95% C. I.)
2
Odds Ratio
(95% C. I.)
3
Odds Ratio
(95% C. I.)
Age 1.19 1.19 1.20
(1.15 – 1.23) (1.15 – 1.22) (1.16 – 1.24)
Education 0.90 0.92 0.91
(0.86 – 0.95) (0.86 – 0.98) (0.86 – 0.97)
Sex* 1.42 1.28 1.32
(0.90 – 2.23) (0.81 – 2.03) (0.82 – 2.14)
Race** 1.75 1.47
(1.00 – 3.05) (0.82 – 2.65)
Any APOE e4+ 2.68
(1.59 – 4.51)
Wald χ2 (df)
p value
3.84 (1)
0.05
13.81 (1)
<0.001
* Male = 0, Female = 1; ** Caucasian = 0, African American = 1; + Any APOE e4 = 1; Wald
χ2 compares the fit of the model to the prior model. Significant p values indicate a significant
improvement in model fit.
23
References
1. Federal Interagency Forum on Aging Related Statistics: Older Americans 2004: Key
Indicators of Well-Being. http://www.agingstats.gov/chartbook2004/population.html.
Accessed on June 28, 2007.
2. Brookmeyer R, Gray S, Kawas S: Projections of Alzheimer's disease in the United States
and the public health impact of delaying disease onset. American Journal of Public
Health 1998;88:1337-1342.
3. Ferri CP, Prince M, Brayne C, Brodaty H, Fratiglioni L, Ganguli M, Hall K, Hasegawa
K, Hendrie H, Huang Y, Jorm A, Mathers C, Menezes PR, Rimmer E, Scazufca M:
Global prevalence of dementia: a Delphi consensus study. Lancet 2005;366:2112-2117.
4. Hebert LE, Scherr PA, Bienias JL, Bennett DA, Evans DA: Alzheimer disease in the US
population: prevalence estimates using the 2000 census. Archives of Neurology
2003;60:1119-1122.
5. Evans DA, Scherr PA, Cook NR, Albert MS, Funkenstein HH, Smith LA, Hebert LE,
Wetle TT, Branch LG, Chown M, Hennekens CH, Taylor JO: Estimated prevalence of
Alzheimer's disease in the United States. Milbank Quarterly 1990;68:267-289.
6. United States General Accounting Office: Alzheimer's disease: Estimates of prevalence
in the United States. Washington, DC, United States General Accounting Office, 1998.
7. Obisesan TO, Vargas CM, Gillum RF: Geographic variation in stroke risk in the United
States. Region, Urbanization, and Hypertension in the Third National Health and
Nutrition Examination Survey. Stroke 2000;31:19-25.
8. Center for Disease Control: Regional and racial differences in prevalence of stroke - 23
states and the District of Columbia, 2003.
24

www.cdc.gov/mmwR/preview/mmwrhtml/mm5419a3.htm. Accessed on February 2,
2007.
9. Juster FT, Suzman R: An overview of the Health and Retirement Study. Journal of
Human Resources 1995;30(suppl):135-145.
10. Willis RJ: Theory confronts data: How the HRS is shaped by the economics of aging and
how the economics of aging will be shaped by the HRS. Labour Economics 1999;6:119-
145.
11. Soldo BJ, Hurd MD, Rodgers WL, Wallace RB: Asset and health dynamics among the
oldest old: An overview of the AHEAD study. Journals of Gerontology. Series B:
Psychological Sciences and Social Sciences 1997;52B:1-20.
12. Ofstedal MB, Fisher GG, Herzog AR: Documentation of cognitive functioning measures
in the Health and Retirement Study. http://hrsonline.isr.umich.edu/docs/userg/dr-006.pdf.
Accessed on February 15, 2007.
13. Heeringa SG, Fisher GG, Hurd MD, Langa KM, Ofstedal MB, Plassman BL, Rodgers W,
Weir DR: Aging, Demographics and Memory Study (ADAMS). Sample design, weights,
and analysis for ADAMS.
http://hrsonline.isr.umich.edu/meta/adams/desc/ADAMSSampleWeights.pdf. Accessed
on September 24, 2007.
14. Langa KM, Plassman BL, Wallace RB, Herzog AR, Heeringa SG, Ofstedal MB, Burke
JR, Fisher GG, Fultz NH, Hurd MD, Potter GG, Rodgers WL, Steffens DC, Willis RJ:
The Aging, Demographics, and Memory Study: Study Design and Methods.
Neuroepidemiology 2005;25:181-191.
25

15. Little RJA, Rubin DB: Statistical Analysis with Missing Data. ed 2nd, New York, John
Wiley and Sons, 2002.
16. The Health and Retirement Study. http://hrsonline.isr.umich.edu/. Accessed on February
15, 2007.
17. American Psychiatric Association: Diagnostic and Statistical Manual of Mental
Disorders. Third Edition-Revised. ed 3, Washington, D.C., American Psychiatric
Association, 1987.
18. American Psychiatric Association: Diagnostic and Statistical Manual of Mental
Disorders. Fourth Edition. ed 4th, Washington, DC, American Psychiatric Association,
1994.
19. Roman GC, Tatemichi TK, Erkinjuntti T, Cummings JL, Masdeu JC, Garcia JH,
Amaducci L, Orgogozo JM, Brun A, Hofman A, Moody DM, O'Brien MD, Yamaguchi
T, Grafman J, Drayer BP, Bennett DA, Fisher M, Ogata J, Kokmen E, Bermejo F, Wolf
PA, Gorelick PB, Bick KL, Pajeau AK, Bell MA, DeCarli C, Culebras A, Korczyn AD,
Bogousslavsky J, Hartmann A, Scheinberg P: Vascular dementia: diagnostic criteria for
research studies. Report of the NINDS-AIREN International Workshop. Neurology
1993;43:250-260.
20. Lund and Manchester Groups: Clinical and neuropathological criteria for frontotemporal
dementia. Journal of Neurology, Neurosurgery and Psychiatry 1994;57:416-418.
21. McKeith IG, Galasko D, Kosaka K, Perry EK, Dickson DW, Hansen LA, Salmon DP,
Lowe J, Mirra SS, Byrne EJ, Lennox G, Quinn NP, Ewardson JA, Ince PG, Bergeron C,
Burns A, Miller BL, Lovestone S, Collerton D, Jansen ENH, Ballard C, de Vos RAI,
Wilcock GK, Jellinger KA, Perry RH: Consensus guidelines for the clinical and
26

pathologic diagnosis of dementia with Lewy bodies (DLB): Report of the consortium on
DLB international workshop. Neurology 1996;47:1113-1124.
22. Plassman BL, Khachaturian AS, Townsend JJ, Ball MJ, Steffens DC, Leslie CE, Tschanz
JT, Norton MC, Burke JR, Welsh-Bohmer KA, Hulette CM, Nixon RR, Tyrey M,
Breitner JCS: Comparison of clinical and neuropathological diagnoses of AD in three
epidemiological samples. Alzheimer's and Dementia 2006;2:2-11.
23. U.S. Census Bureau: Table 1: Annual estimates of the population by five-year age
groups and sex for the United States: April 1, 2000 to July 1, 2006.
http://www.census.gov/popest/national/asrh/NC-EST2006-sa.html. Accessed on October
19, 2007.
24. Bureau of Labor Statistics and the Bureau of the Census: Current Population Survey.
http://www.bls.census.gov/cps/cpsmain.htm. Accessed on June 28, 2007.
25. Hofman A, Rocca WA, Brayne C, Breteler MMB, Clarke M, Cooper B, Copeland JRM,
Dartigues JF, da Silva Droux A, Hagnell O, Heeren TJ, Engedal K, Jonker C, Lindesay J,
Lobo A, Mann AH, Molsa PK, Morgan K, O'Connor DW, Sulkava R, Kay DWK,
Amaducci L: The prevalence of dementia in Europe: a collaborative study of 1980-1990
findings. International Journal of Epidemiology 1991;20:736-748.
26. Hebert LE, Scherr PA, Bienias JL, Bennett DA, Evans DA: Alzheimer disease in the US
population. Prevalence estimates using the 2000 census. Archives of Neurology
2003;60:1119-1122.
27. McKhann G, Drachman D, Folstein M, Katzman R, Price D, Stadlan EM: Clinical
diagnosis of Alzheimer's disease: report of the NINCDS-ADRDA Work Group under the
27

auspices of the Department of Health and Human Services Task force on Alzheimer's
disease. Neurology 1984;34:939-944.
28. Graham JE, Rockwood K, Beattie BL, Eastwood R, Gauthier S, Tuokko H, McDowell I:
Prevalence and severity of cognitive impairment with and without dementia in an elderly
population. Lancet 1997;349:1793-1796.
29. Petersen RC, Smith GE, Waring SC, Ivnik RJ, Tangalos EG, Kokmen E: Mild cognitive
impairment: clinical characterization and outcome. Archives of Neurology 1999;56:303-
308.
30. Breitner JCS, Wyse BW, Anthony JC, Welsh-Bohmer KA, Steffens DC, Norton MC,
Tschanz JT, Plassman BL, Meyer MR, Skoog I, Khachaturian A: APOE-epsilon4 count
predicts age when prevalence of AD increases, then declines: the Cache County Study.
Neurology 1999;53:321-331.
31. Hendrie H, Osuntokun B, Hall K, Ogunniyi A, Hui S, Unverzagt F, Gureje O, Rodenberg
C, Baiyewu O, Musick B, Adeyinka A, Farlow M, Oluwole S, Class C, Komolafe O,
Brashear A, Burdine V: Prevalence of Alzheimer's disease and dementia in two
communities: Nigerian Africans and African Americans. American Journal of Psychiatry
1995;152:1485-1492.
32. Breteler MMB, Claus JJ, van Duijn CM, Launer LJ, Hofman A: Epidemiology of
Alzheimer's disease. Epidemiologic Reviews 1992;14:59-82.
33. Jorm AF, Korten AE, Henderson AS: The prevalence of dementia: a quantitative
integration of the literature. Acta Psychiatrica Scandinavica 1987;76:465-479.
28
34. Canadian Study of Health and Aging Working Group: Canadian Study of Health and
Aging: study methods and prevalence of dementia. Canadian Medical Association
Journal 1994;150:899-913.
35. Katzman R: Education and the prevalence of dementia and Alzheimer's disease.
Neurology 1993;43:12-20.
36. Friedland RP: Epidemiology, education, and the ecology of Alzheimer's disease.
Neurology 1993;43:246-249.
37. Beard CM, Kokmen E, Offord KP, Kurland LT: Lack of association between Alzheimer's
disease and education, occupation, marital status, or living arrangement. Neurology
1992;42:2063-2068.
38. Bachman DL, Wolf PA, Linn R, Knoefel JE, Cobb J, Belanger A, D'Agostino RB, White
LR: Prevalence of dementia and probable senile dementia of the Alzheimer type in the
Framingham Study. Neurology 1992;42:115-119.
39. Launer LJ, Andersen K, Dewey ME, Letenneur L, Ott A, Amaducci LA, Brayne C,
Copeland JRM, Dartigues J-F, Kragh-Sorensen P, Lobo A, Martinez-Lage JM, Stijnen T,
Hofman A, EURODEM Incidence Research Group and Work Groups: Rates and risk
factors for dementia and Alzheimer's disease. Neurology 1999;52:78-84.
40. Hebert LE, Scherr PA, McCann JJ, Beckett LA, Evans DA: Is the risk of developing
Alzheimer's disease greater for women than for men? American Journal of Epidemiology
2001;153:132-136.
41. Paykel ES, Brayne C, Huppert FA, Gill C, Barkley C, Gehlhaar E, Beardsall L, Girling
DM, Pollitt P, O'Connor D: Incidence of dementia in a population older than 75 years in
the United Kingdom. Archives of General Psychiatry 1994;51:325-332.
29
42. Tang MX, Cross P, Andrews H, Jacobs DM, Small S, Bell K, Merchant C, Lantigua R,
Costa R, Stern Y, Mayeux R: Incidence of AD in African-Americans, Caribbean
Hispanics, and Caucasians in northern Manhattan. Neurology 2001;56:49-56.
43. Perkins P, Annegers JF, Doody RS, Cooke N, Aday L, Vernon SW: Incidence and
prevalence of dementia in a multiethnic cohort of municipal retirees. Neurology
1997;49:44-50.
44. Fillenbaum GG, Heyman A, Huber MS, Woodbury MA, Schmader KE, Bohannon A,
Trapp-Moen B: The prevalence and 3-year incidence of dementia in older Black and
White community residents. Journal of Clinical Epidemiology 1998;51:587-595.
45. Fitzpatrick AL, Kuller LH, Ives DG, Lopez OL, Jagust W, Breitner JCS, Jones B,
Lyketsos C, Dulberg C: Incidence and prevalence of dementia in the Cardiovascular
Health Study. Journal of the American Geriatrics Society 2004;52:195-204.
46. Evans DA, Bennett DA, Wilson RS, Bienias JL, Morris MC, Scherr PA, Hebert LE,
Aggarwal N, Beckett LA, Joglekar R, Berry-Kravis E, Schneider J: Incidence of
Alzheimer disease in a biracial urban community. Archives of Neurology 2003;60:185-
189.
47. Farrer LA, Cupples LA, Haines JL, Hyman B, Kukull WA, Mayeux R, Myers RH,
Pericak-Vance MA, Risch N, van Duijn CM: Effects of age, sex, and ethnicity on the
association between apolipoprotein E genotype and Alzheimer disease: a meta-analysis.
Journal of the American Medical Association 1997;278:1349-1356.
48. Tell GS, Fried LP, Hermanson B, Manolio TA, Newman AB, Borhani NO: Recruitment
of adults 65 years and older as participants in the Cardiovascular Health Study. Annals of
Epidemiology 1993;3:358-366.
30

31
49. Sloane PD, Zimmerman S, Suchindran C, Reed P, Wang L, Boustani M, Sudha S: The
public health impact of Alzheimer's disease, 2000-2050: Potential implication of
treatment advances. Annual Review of Public Health 2002;23:213-231.
Related Documents