The Age of Turbulence, Credit Derivatives Style Hans NE Byström Lund University

The Age of Turbulence, Credit Derivatives Style Hans NE Byström Lund University.
Dec 17, 2015
Welcome message from author
This document is posted to help you gain knowledge. Please leave a comment to let me know what you think about it! Share it to your friends and learn new things together.
Transcript
The Age of Turbulence, Credit Derivatives Style
Hans NE Byström
Lund University
The paper focuses on• the many extreme credit default swap spread movements
observed during the credit crisis 2007-08
• how the tails of the spread change distribution significantly differ from those of the normal distribution.
• how not even extreme value theory methods are able to satisfactorily capture the extreme behavior of the credit derivatives market at the peak of the credit crisis.
• how the credit market of July 2007 is comparable only to that of the equity market of October 1987.

Companion papers
• This paper, Byström (2008), “The Age of Turbulence, Credit Derivatives Style”, 2008.
and
• Byström (2007), “Back to the Future: Futures Margins in a Future Credit Default Swap Index Futures Market”, The Journal of Futures Markets, 27(1), pp. 85-104.

Quote from Byström (2007)
“Although the General Motors episode [of 2005] might not repeat itself, it should nonetheless be a lesson for the future; whether or not the credit environment becomes riskier over the next couple of years, similar sudden changes in CDS spreads most likely will strike the CDS index market from time to time.”
This was written in 2006 (i.e. well before the credit crisis) and today few would argue against the importance of an explicit focus on low-probability tail events!
The market• The European credit default swap index market.
• More exactly, we look at the 5-year iTraxx Europe index. This is an index of 125 European investment-grade credit default swaps.
• This is the most widely used “animal” in the credit derivatives world.
• The credit default swaps are selected based on their trading volume over the last six months and every six months the index is updated.
Data
• Daily 5-year iTraxx Europe CDS index spread over the time period June 2004-March 2008.
• We divide the sample into a pre-crisis period and a crisis period. The crisis period is the period July18, 2007 (the day Bear Stearns reported large losses in two of its hedge funds) to March 18, 2008 (the day JP Morgan bought Bear Stearns).
• In addition to these CDS spread changes we also study daily returns of a typical stock market index (S&P500) over the same time period.

Some Descriptive Statistics
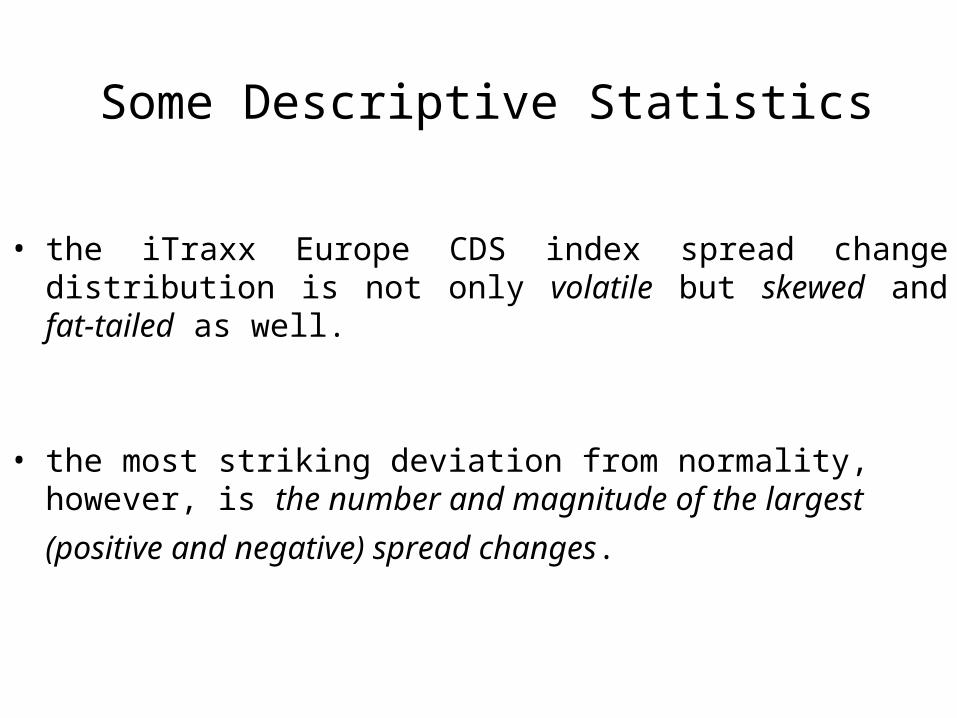
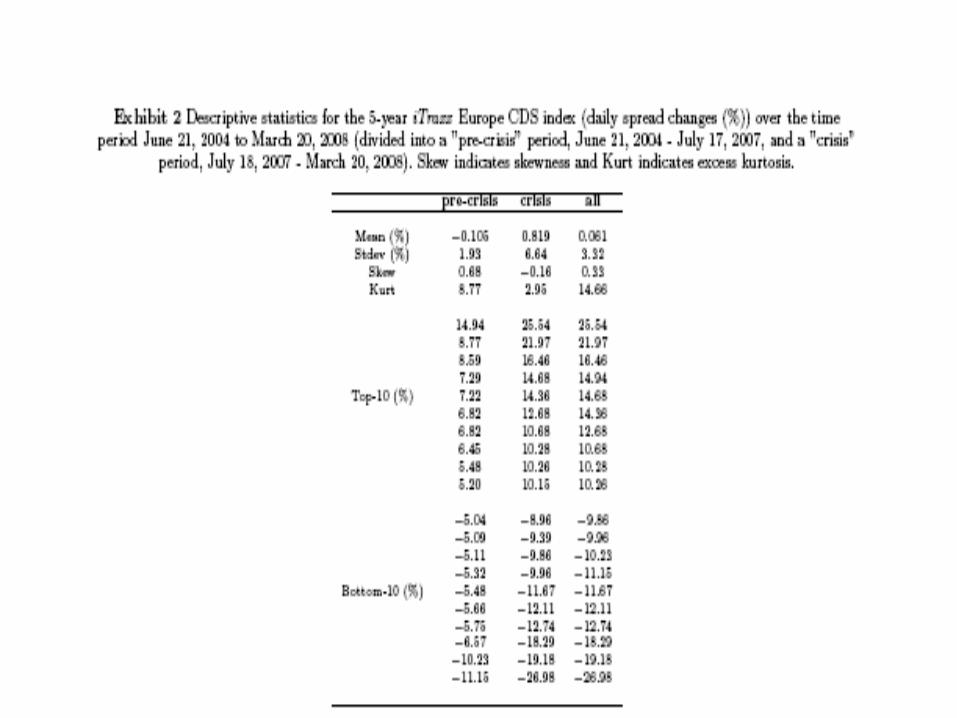
• the iTraxx Europe CDS index spread change distribution is not only volatile but skewed and fat-tailed as well.
• the most striking deviation from normality, however, is the number
and magnitude of the largest (positive and negative) spread changes.

Extreme Spread Changes in the Credit Default Swap Index Market
During the crisis, many CDS index spread changes are larger than +/-10%:
During the 8-month crisis period there are 11 daily spread changes that are larger than +10% and 6 daily spread changes that are larger than -10%. Meanwhile, during the four times longer pre-crisis period there are only 1 spread change that is larger than +10% and 2 spread changes that are larger than -10%.
Extreme Spread Changes in the Credit Default Swap Index Market
During the crisis, many CDS index spread changes are much larger than the largest spread changes ever seen before the crisis.
During the 8-month short crisis period, a total of 3(6) positive (negative) daily spread changes are larger than any spread change seen during the 36-month long pre-crisis period. Moreover, 18 (7) spread changes are larger than the second-largest spread change ever observed before the crisis.

Extreme Spread Changes in the Credit Default Swap Index Market
During the crisis, the most extreme CDS index spread changes are very large.
The most extreme daily spread changes during the crisis are +/-26%.
Extreme Spread Changes in the Credit Default Swap Index Market
A comparison of multi-sigma events in the credit derivatives market and in the stock market reveals large differences
The largest daily spread changes during the crisis represent spread movements of more than 13 (pre-crisis) standard deviations. If we had seen one or two daily S&P500 stock returns of the same magnitude (i.e., 13-sigma events) during the crisis months they would have been around +/-9%.
Extreme Spread Changes in the Credit Default Swap Index Market
Out of the first 30 days of the credit crisis, every second day sees a 5-sigma, or larger, CDS index spread change
Over the first month (22 trading days) of the credit crisis 11 daily spread changes are larger than +/-5 standard deviations. The corresponding return history in the US stock market (S&P500) would be -9.1%, -6.5%, -4.1%,-3.9%, -3.4%, 3.4%, 3.6%, 4.3%, 5.5%, 7.4% and 8.6%. And that is in July only!
Extreme Spread Changes in the Credit Default Swap Index Market
The cost of insuring corporate debt against default in the iTraxx Europe CDS index market has increased eight-fold since the start of the crisis.
In mid-June 2007, the cost of insuring corporate debt in Europe against default hit a low-point at about 20bp. Since then, the cost has gone up eightfold to reach a high of 160bp in mid-March 2008 (never before in the history of the iTraxx indexes has one observed costs above 60bp.)
Value At Risk Estimates in the Credit Default Swap Index Market
• The extreme (non-normal) spread changes in the credit derivatives market might be a problem in risk management of credit derivatives portfolios and we therefore investigate the usefulness of the normal distribution in Value at Risk (VaR) calculations of credit default swap portfolios (proxied by the iTraxx Europe CDS index).
• Moreover, as an alternative to the normal distribution we suggest a simple and easy-to-implement extreme value theory-based approach as an alternative in VaR calculations of credit derivatives positions.

Extreme Value Theory
• Extreme value theory (EVT) focuses on the tails of a distribution.
• It has sound theoretical underpinnings (Fisher and Tippett [1928], Gnedenko [1943], Gumbel [1958]), Embrechts, Kluppelberg and Mikosh [1997], and Reiss and Thomas [1997]).
• EVT models can be divided into two broad groups; peaks-over threshold (POT) methods, and block maxima methods.
• In this paper we use the POT method.

Extreme Value Theory
• POT methods focus solely on the observations that exceed a certain high threshold, u, and Balkema and de Haan [1974] and Pickands [1975] have shown that for a large class of distributions the excess distribution of observations above the threshold can be approximated by the so-called generalized Pareto distribution (GPD).
• This GPD distribution contains two parameters, the tail index ξ and the scale parameter α, and by fitting it to historical observations above the threshold u we try to infer the ”true” shape of the extreme tail(s) of the CDS index spread change distribution.
Extreme Value Theory
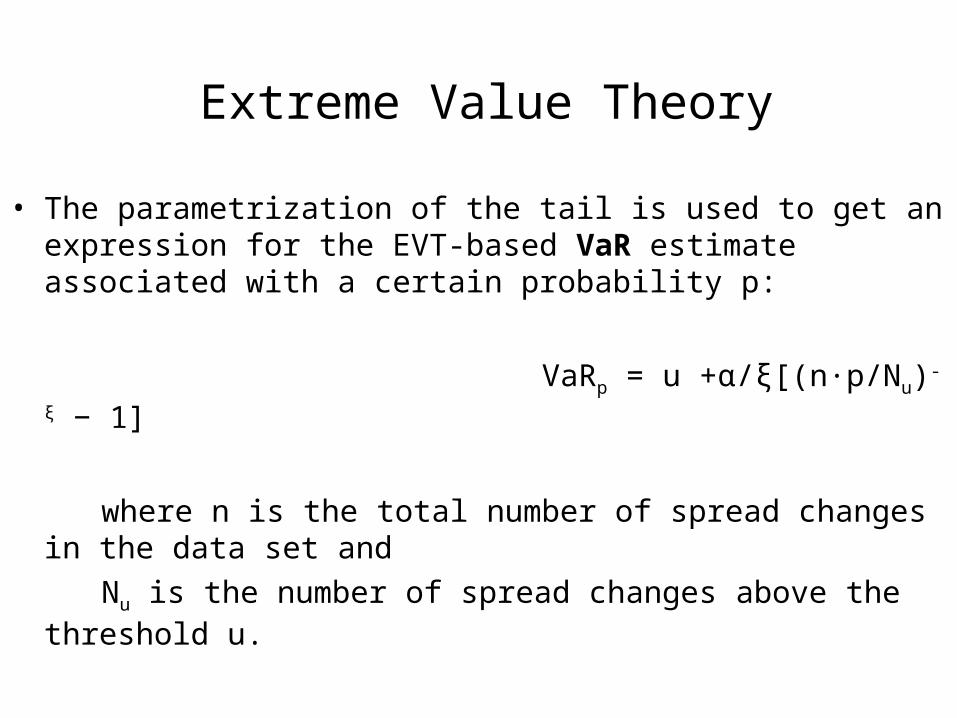
• The parametrization of the tail is used to get an expression for the EVT-based VaR estimate associated with a certain probability p:
VaRp = u +α/ξ[(n∙p/Nu)-ξ − 1]
where n is the total number of spread changes in the data set and
Nu is the number of spread changes above the threshold u.

Value At Risk Estimates in the Credit Default Swap Index Market
• Our purpose is to compare the EVT-based VaR estimates to corresponding VaR estimates implied by the normal and the historical distributions.
• Our hypothetical investor holds a well-diversified portfolio of credit default swaps (as a protection buyer or protection seller) and we define the VaR estimate/forecast as the potential percentage daily change in a long or short position in the iTraxx Europe index (i.e., the quantile at a certain small probability ranging from 0.01% to 5%).
• A good VaR estimator produces accurate estimates in tranquil as well as in turbulent times. We acknowledge this by looking both at the pre-crisis period (in-sample) and the crisis period (out-of-sample).


Conclusion
• Compared to, for instance, the S&P500 stock index the number and magnitude of extreme observations in the credit derivatives market is striking.
• Extreme value theory (EVT) based VaR estimates are much more accurate, in the European CDS market, than those based on the normal or historical distribution. The difference is particularly significant at more conservative VaR levels.
• However, not even EVT is able to satisfactorily capture the extreme behavior of the credit derivatives market at the peak of the credit crisis. Not even at the aggregated (index) level.
Related Documents