African Alliance Pan-African Securities Research Equity Research I Pan-Africa I Weekly Market Indicators THE AFRICA WEEKLY The Africa Weekly Equity Research | Pan-Africa | News & Analysis African Alliance Securities is a leading African institutional-focused securities firm, and is able to transact for clients in 18 markets across Africa. We provide agency-only equity and bond trading, sales and in-depth, independent research to local, regional and international clients. Key to our value proposition is an on-the-ground presence with exchange membership licenses in 11 African countries which allows us to provide our clients with investment research and corporate access of the highest quality. Our award winning research includes fundamental research on most of Sub-Sahara Africa’s leading listed companies and sectors, as well as market data & analysis and market news & information services that span the whole continent. African Alliance Securities is part of the African Alliance Group, which provides investment banking and related services across the African continent. For more information please visit www.africanalliance.com

Welcome message from author
This document is posted to help you gain knowledge. Please leave a comment to let me know what you think about it! Share it to your friends and learn new things together.
Transcript

African Alliance Pan-African Securities Research
Equity Research I Pan-Africa I Weekly Market Indicators
THE AFRICA WEEKLY
The Africa WeeklyEquity Research | Pan-Africa | News & Analysis
African Alliance Securities is a leading African institutional-focused securities firm, and is able to transact for clients in 18 markets across Africa. We provide agency-only equity and bond trading, sales and in-depth, independent research to local, regional and international clients. Key to our value proposition is an on-the-ground presence with exchange membership licenses in 11 African countries which allows us to provide our clients with investment research and corporate access of the highest quality. Our award winning research includes fundamental research on most of Sub-Sahara Africa’s leading listed companies and sectors, as well as market data & analysis and market news & information services that span the whole continent. African Alliance Securities is part of the African Alliance Group, which provides investment banking and related services across the African continent.
For more information please visit www.africanalliance.com
African Alliance Pan-African Securities Research
Equity Research I Pan-Africa I Weekly Market Indicators
THE AFRICA WEEKLY
MTD YTD
Botswana BSE DCI 10,017 1.82 3.33 5.43 10,017 8,835 9.74 2.70 2.60 -2.38 4.57 6.02 2.92 3,535.9 4,966BRVM IC Comp 264.7 -0.50 0.82 2.57 267.4 219.8 588.5 4.18 3.91 -8.29 3.66 4.75 -5.93 6,770.1 10,043Egypt*** EGX 30 8,672 -0.68 -5.06 -2.85 10,046 7,895 7.62 -0.55 -0.57 -6.19 -1.23 -5.60 -8.86 233,740 36,842Ghana GSE ALSI 2,273 0.59 2.36 0.52 2,393 2,144 3.85 0.16 -1.39 -16.57 0.76 0.93 -16.14 229.0 4,298Kenya FTSE NSE15 229.9 0.24 -0.48 6.67 234.8 189.6 94.65 -0.69 -2.43 -4.28 -0.45 -2.90 2.10 34,495.2 24,875Malawi MSE ALSI 16,025 0.62 4.30 7.65 16,025 13,089 440.1 0.02 -0.64 6.22 0.64 3.63 14.34 605.5 1,518Mauritius SEMDEX 1,956 1.27 -0.98 -5.68 2,171 1,930 34.75 3.67 4.92 -8.63 4.98 3.89 -13.83 11,241.7 6,221Morocco MORALSI 9,937 0.23 -3.24 3.30 10,527 9,204 9.70 2.81 2.75 -6.85 3.05 -0.58 -3.78 23,086 50,482Namibia Local 427.4 -0.11 3.31 9.86 430.6 340.7 11.83 3.65 3.28 -2.23 3.54 6.70 7.41 157.8 2,068Nigeria NIG ALSI 34,708 0.62 9.31 0.15 43,039 27,585 199.0 -0.12 -0.64 -8.14 0.50 8.61 -8.01 79,479 56,620Rwanda RSE Index 230.7 -0.82 -1.51 -2.57 267.5 222.2 715.0 0.00 0.00 -3.12 -0.82 -1.51 -5.61 4 741South Africa JSE ALSI 54,440 -0.45 4.33 9.38 55,188 46,673 11.83 3.65 3.28 -2.23 3.19 7.75 6.95 3,525,283 396,272Swaziland SSX ALSI 286.8 0.00 0.00 0.00 0.00 0.00 11.83 3.65 3.28 -2.23 3.65 3.28 -2.23 0.0 203Tanzania DAR ALSI 2,700 0.94 3.98 7.14 2,779 1,924 1,980 -1.01 -9.19 -12.37 -0.08 -5.58 -6.11 5,117.7 5,005Tunisia TUNIS 5,545 1.21 4.37 8.94 5,545 4,502 1.91 2.41 2.63 -2.66 3.64 7.12 6.04 10,275 8,044Uganda USE ALSI 1,991 -2.36 -4.09 3.34 2,098 1,556 2,993 0.27 -0.70 -7.28 -2.10 -4.77 -4.19 2,220.3 1,188Zambia LuSE ALSI 5,994 -0.11 -1.72 -2.70 6,287 5,925 7.45 -1.51 1.74 -14.43 -1.62 -0.01 -16.74 483.1 3,554Zimbabwe ZSE IND 156.3 -0.83 -1.24 -4.01 201.3 155.3 1.00 0.00 0.00 -0.83 -1.24 -4.01 1,724.9 4,209
1 year price chartsLocal USD
20.2 23.117.9 22.916.7 19.915.4 19.615.7 15.6
Local USD
-20.3 -20.7-16.1 -16.2-14.0 -14.4-11.4 -11.4-13.8 -11.3
* See individual country pages for more details about the indices. ** USD market cap is that of the whole market, not the respective index. ***Note that Egypt consists only of the EGX30 and EGX 70 constituents
AA Indes (1.5; -0.6% w/w)Gold (1,203.1; +1.1% w/w) MSCI WORLD (1,778.4; -0.8% w/w)
Crude Oil (66.8; +3.0% w/w) MSCI EM (1,047.8; -0.6% w/w)
MSCI AFRICA (598.5; +0.4% w/w)
S&P 500 (2,085.5; -1.3% w/w)
FTSE 100 (6,960.6; -1.3% w/w)Copper (6,364.5; +7.1% w/w)
STB
Top 5 gainers
Top 5 decliners
Bank of Africa BNLetshego
South AfricaNigeria
1 YearLow
YTD%Chg
Alliances
Company
LNC for Maize ProductsDangote Sugar RefineryDelta SugarHippo Valley Estates
Bell EquipmentPresco
Country Index*IndexLevel
Company
FX-Rateper USD
YTD% Chg
1 MTD% Chg
1 Wk%Chg 1 week
Dollar Return (% chg) Mkt CapUSDm**
TradeUSD'000
30 Apr 2015
Morocco
MTD%Chg
% chg
Country
EgyptNigeriaEgyptZimbabwe
1 Wk%Chg
Country
TunisiaBRVMBotswana
1 YearHigh

African Alliance Pan-African Securities Research
Equity Research I Pan-Africa I Weekly Market Indicators
THE AFRICA WEEKLY
1 month price chartsBotswana BRVM
Key
Egypt*** Ghana Up8.189 5.795 3.53 7.738 4.694 4.872 Flat
15.174 15.463 17.16 18.39 19.36 19.978 Down10.54 14.341 14.921 25.254 19.198 19.985Kenya Malawi 170.651 231.6 248.19 264.2 286.47 316.04
6.96 7.976 7.356 6.584 6.265 7.1341123.63 1484.1 1547.9 1603.6 1692.3 1816.913.935 11.742 10.333 11.984 7.938 7
Mauritius Morocco
Namibia Nigeria
South Africa Tanzania
Tunisia Uganda
Zambia Zimbabwe
-0.45%
1.82%
South Africa
BotswanaNamibiaNamibia
1.27%
Mauritius
0.23%Morocco
1.21%
Tunisia
-0.68%Egypt
0.24%Kenya
-0.11%Zambia
-2.36%Uganda:
Swaziland
Ghana
0.94%Tanzania
-0.50%BRVM
0.62%Malawi
Zimbabwe
-0.11%-0.83%
0.62%Nigeria
0.59%
Rwanda:-0.82%

African Alliance Pan-African Securities Research
Equity Research I Pan-Africa I Weekly Market Indicators
THE AFRICA WEEKLY
Inflation and Interest Rate Summary
Country Bond Rate (%) Maturity Date Bond Maturity Prime (%) CPI (%) MonthSouthern Africa
Angola 9.00 7.73 FebBotswana 5.67 Mar-25 BW007 11.4 yrs 9.00 2.80 FebLesotho 8.25 Feb-19 LS000A1GZ7W0 5.3 yrs 10.25 2.10 FebMalawi 25.00 19.70 FebMauritius 7.07 Sep-23 10 year 9.9 yrs 2.48 2.00 FebNamibia 8.55 Oct-24 GC24 11.0 yrs 10.00 3.60 FebSouth Africa 7.60 Dec-26 R186 13.2 yrs 9.25 3.90 FebSwaziland 8.87 Jan-24 SG018 10.3 yrs 8.75 6.60 NovZambia 21.75 Feb-23 10 year 9.3 yrs 12.50 7.40 FebZimbabwe -1.40 Feb
East AfricaKenya 12.40 Jun-22 FXD 1/2014/10Yr 8.7 yrs 15.47 6.31 MarRwanda 11.15 Sep-16 FXD2/2011/5yr 3.0 yrs 17.37 0.80 MarTanzania 16.50 Oct-23 10 year 10.0 yrs 15.37 4.20 FebUganda 16.87 Apr-23 UG0000001244 9.5 yrs 20.82 1.90 Mar
West AfricaBRVM average 0.02 JanGhana 23.50 Aug-17 5005 3.9 yrs 21.00 16.50 FebNigeria 10.96 Jan-22 9th FGN Series 1 8.3 yrs 16.77 8.50 Mar
North AfricaEgypt 12.58 Feb-17 EGBGR00541F5 3.4 yrs 9.75 10.56 FebMorocco 3.64 Apr-16 MA0002010249 2.5 yrs 6.03 1.30 FebTunisia 6.17 Mar-19 10 year 5.4 yrs 4.75 5.60 Feb
Source: Central banks, statistical agencies
African Alliance Pan-African Securities Research
Equity Research I Pan-Africa I Weekly Market Indicators
THE AFRICA WEEKLY
Nigerian Stock Exchange (Nigerian Naira) Nigeria
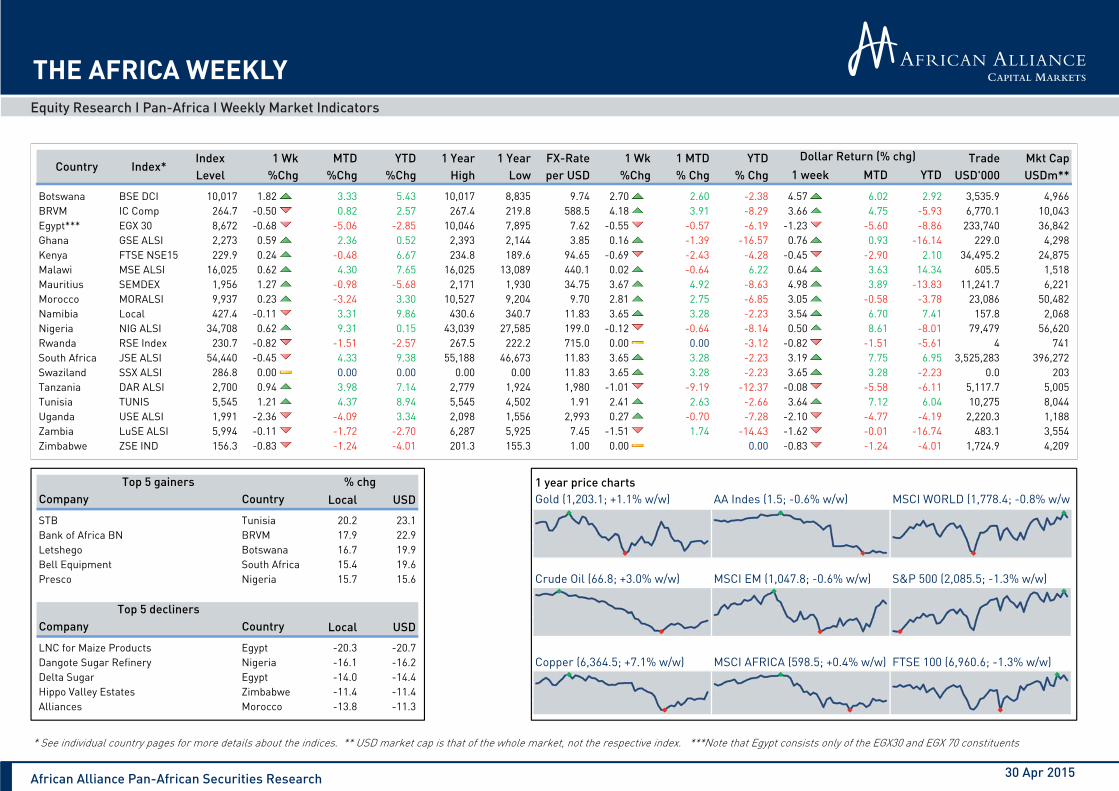
2012 2013 2014 2015 2016E 2017F4.4 4.0 3.7 2.2 1.7 1.6
10.4 10.4 10.6 11.1 11.2 11.67.3 9.2 22.3 11.1 10.4 11.3
467.1 521.8 594.3 657.2 702.2 749.14.3 5.4 7.0 7.3 7.2 7.1
2,835.3 3,082.5 3,416.5 3,677.3 3,824.1 3,970.212.0 7.9 9.0 8.5 8.0 7.0
Company Reporting period Expected reporting date Year DPSRT BRISCOE NIGERIA PLC Full Year 06-May-15 Ecobank Transnat 2014 0.00NIGERIAN ROPES PLC Full Year 08-May-15 Fbn Holdings Plc 2015 0.1ARBICO PLC Full Year 08-May-15 Consolidated Hal 2013 0.03MULTIVERSE PLC Full Year 07-May-15 Nestle Nigeria P 17.5EKOCORP PLC Full Year 20-May-15 United Capital A 2015 0.2INTERNATIONAL ENERGY INSURAN Full Year 06-May-15STANDARD ALLIANCE INSURANCE Full Year 01-May-15JAPAUL OIL AND MARITIME SERV Full Year 04-May-15RAK UNITY PET CO PLC Full Year 12-May-15
3
TypeOmitted
FinalFinalFinal
Market Commentary
Govt net debt (% GDP)Nominal GDP (USDbn)GDP growth (%, constant prices)GDP per capita (USD)Inflation (%, end of period)
Current account balance (% GDP)Govt gross debt (% GDP)
Dividends Last Cum date07-Jul-14
30 Apr 2015
04-May-1523-Jul-1327-Apr-1523-Mar-15Final
The NSE ALSI gained 0.6% to close the week at 34,708.1 on the back of gains in Unity Bank (+678.0%),Presco (+15.7%) and Unilever Nigeria (+11.3%). During the week, losses were recorded in Dangote SugarRefinery (-16.1%), Forte Oil (-10.6%) and Access Bank (-10.6%). The top traders by value were GuarantyTrust Bank (USD 9.2m), Zenith Bank (USD 8.8m) and Nigerian Breweries (USD 8.7m). Trading in theseshares accounted for 33.5% of this week’s turnover of NGN 15.8bn (USD 79.5m). The average weeklyvalue traded in the last six months is NGN 22.5bn (USD 113.3m). The NSE ALSI is up 0.1% ytd (-8.0% USD)and the total market capitalisation is currently USD 56.6bn.

African Alliance Pan-African Securities Research
Equity Research I Pan-Africa I Weekly Market Indicators
THE AFRICA WEEKLY
Nigerian Stock Exchange (Nigerian Naira) Nigeria
NIGSE ALSI Level % chg Level % chg % chg Company Week % chg PriceCurrent 34,708.1 199.00 H: 09-Jul-14 43,039.5 Unity Bank 3.89This week 34,494.4 0.62 198.77 -0.12 0.50 L: 13-Feb-15 27,585.3 Presco 15.7 30.09Prev week 34,832.6 -0.97 198.95 0.09 -0.88 Off peak -19.4% A.G. Leventis Nigeria 11.8 1.70MTD 31,753.2 9.31 197.73 -0.64 8.61 At High 33/199 Unilever Nigeria 11.3 42.31YTD 34,657.2 0.15 182.80 -8.14 -8.01 At Low 44/199 Vitafoam Nig 10.0 4.83
15,807 7.01% NGNm 22,546.4 Company Week % chg Price-122 135 USDm 113.3 Dangote Sugar Refinery -16.1 6.11
68% Forte Oil -10.6 177.77,398 32 Access Bank -10.6 5.997,520 39 NGNm 11,267,336 Oando -9.8 18.00-1.6% -7 USDm 56,620 May & Baker Nigeria -9.4 1.63
Company NGN'000 % of totalGuaranty Trust Bank 1,821,202 11.52Zenith Bank 1,742,161 11.02Nigerian Breweries 1,739,135 11.00Lafarge Africa 1,195,112 7.56UBA 1,100,001 6.96
*The index is the NSE ALSI, an all share index ** Value Traded numbers are given in millions of Nigerian Naira See the notes page for more information about calculations 30 Apr 2015 4
Total value Value Traded / Mkt Cap (%)
NGN/USD USD returnsIndex performance *
Turnover analysis ** Avg weekly value traded
Market highs and lows
Top 5 declinersTrading numbers
Advance - Decline
Stocks traded (%)Stocks up Total Market cap
Top 5 gainers
Top 5 (value) traders Rebased Index Performance
Net value Stocks traded (absolute)
Upside valueDownside value Stocks downUpside/downside ratio
-60%
-45%
-30%
-15%
0%
15%
30%
Apr-14 Jul-14 Oct-14 Jan-15 Apr-15
USD NGN
0 5,000 10,000 15,000
09 Jul 2014
30-Apr
Market Cap (NGN bn) : Current vs Peak

African Alliance Pan-African Securities Research
Equity Research I Pan-Africa I Weekly Market Indicators
THE AFRICA WEEKLY
Nigerian Stock Exchange (Nigerian Naira) Nigeria
Price Value Volume 6 mthsCompany Name Sector NGN % chg Move NGN '000 '000 High Low Off high YTD 12 mths NGN m USD m Val (000)Dangote Cement BUIL 184.5 5.4 Up 800,922 4,505 250.0 141.9 -26.2 -7.8 -18.4 3,143,974 15,799 5,701.0Nigerian Breweries BREW 157.0 2.6 Up 1,739,135 11,391 186.9 128.0 -16.0 -5.0 4.7 1,187,420 5,967 12,137.6Guaranty Trust Bank BANK 28.75 2.7 Up 1,821,202 64,047 31.88 17.00 -9.8 14.2 9.6 846,146 4,252 15,186.3Nestle Nigeria CONS 950.0 0.2 Up 474,314 504 1,150 746.3 -17.4 -6.1 -8.7 753,023 3,784 6,686.9Zenith Bank BANK 21.15 -4.1 Down 1,742,161 81,358 25.60 15.00 -17.4 14.9 -6.8 664,036 3,337 13,275.2ETI (Nigeria) BANK 20.70 -0.5 Down 834,003 40,484 20.90 12.81 -1.0 11.4 53.3 330,221 1,659 5,462.3Lafarge Africa BANK 9.80 -5.8 Down 1,195,112 118,131 16.29 6.37 -39.8 11.4 -30.8 319,794 1,607 8,995.5Stanbic IBTC Holdings BANK 29.45 7.9 Up 113,760 3,920 35.00 21.20 -15.9 9.1 28.0 294,500 1,480 1,908.3Lafarge WAPCO BUIL 94.00 3.3 Up 503,703 5,365 131.0 66.50 -28.2 16.8 -13.4 282,150 1,418 2,540.3Guinness Nigeria BREW 170.0 1.2 Up 211,378 1,276 215.0 113.4 -20.9 1.1 -3.4 256,001 1,286 1,722.7Forte Oil UTIL 177.7 -10.6 Down 147,758 790 257.0 149.0 -30.9 -22.0 19.2 191,912 964 1,382.4UBA BANK 5.29 -5.5 Down 1,100,001 212,606 8.14 2.99 -35.0 23.0 -21.6 174,472 877 3,150.2Union Bank Nig. BANK 10.22 -7.3 Down 47,861 4,535 11.50 6.82 -11.1 20.2 2.7 173,084 870 5,377.5Unilever Nigeria CONS 42.31 11.3 Up 148,370 3,622 55.00 27.00 -23.1 18.2 -10.9 160,071 804 1,181.3Unity Bank BANK 3.89 - 1,250 291 5.00 0.50 -22.2 678.0 678.0 149,558 752 142.1Access Bank BANK 5.99 -10.6 Down 625,028 102,641 10.10 4.71 -40.7 -9.2 -26.9 137,069 689 4,233.7Cadbury Nigeria CONS 39.90 1.8 Up 35,831 880 81.89 34.82 -51.3 -0.3 -46.8 124,902 628 165.1TransCorp Nigeria INVE 3.20 - Flat 797,059 249,081 6.50 2.28 -50.8 -1.5 -7.2 123,907 623 2,269.3Oando UTIL 18.00 -9.8 Down 588,140 31,219 33.47 12.83 -46.2 11.7 12.5 122,802 617 3,070.2P Z Cussons Nigeria CONS 28.50 -4.2 Down 130,941 4,376 39.00 17.50 -26.9 19.7 -20.8 113,159 569 953.67-Up Bottling Comp. BREW 162.0 -9.0 Down 36,133 213 188.5 82.00 -14.1 -2.1 80.0 103,776 521 632.2Flour Mills Nig. CONS 35.74 -3.4 Down 240,100 6,642 80.90 27.67 -55.8 -8.8 -47.8 85,264 428 1,735.0U A C N CONS 42.00 5.0 Up 698,632 17,390 67.85 26.22 -38.1 23.5 -25.7 80,676 405 2,557.4Dangote Sugar Refinery CONS 6.11 -16.1 Down 68,397 10,031 9.99 4.94 -38.8 -3.8 -38.3 73,320 368 693.8Intl Breweries BREW 21.49 -1.0 Down 7,498 349 32.00 17.10 -32.8 -8.0 -17.3 70,112 352 372.5Diamond Bank BANK 4.60 2.0 Up 275,483 60,145 6.85 3.45 -32.8 -17.6 -24.1 66,586 335 2,524.6FCMB BANK 3.34 -1.8 Down 264,548 79,388 4.55 2.00 -26.6 34.1 -5.6 66,141 332 1,712.8Julius Berger BUIL 51.70 - Flat 19,022 368 76.45 38.08 -32.4 -14.8 -27.1 62,040 312 388.6Mobil Oil Nig UTIL 150.0 -1.3 Down 91,376 600 180.0 115.0 -16.7 -5.1 26.9 54,089 272 197.4Fidelity Bank BANK 1.86 -6.5 Down 96,640 51,201 2.16 1.15 -13.9 14.8 -4.6 53,893 271 531.8
530 Apr 2015
Movement (% chg) Market cap12 MonthWeekly

African Alliance Pan-African Securities Research
Equity Research I Pan-Africa I Weekly Market Indicators
THE AFRICA WEEKLY
Ghana Stock Exchange (Ghana Cedi) Ghana
2012 2013 2014 2015 2016E 2017F-11.8 -11.9 -9.9 -8.5 -7.2 -6.649.8 55.6 65.3 71.1 70.8 68.347.7 53.2 63.3 69.3 69.2 65.441.7 47.8 35.5 32.6 34.7 38.2
8.8 7.1 4.5 4.7 7.2 6.31,674.6 1,871.1 1,353.2 1,212.8 1,257.2 1,349.4
8.1 13.5 18.5 15.1 13.9 12.8
Company Reporting period Expected reporting date Year DPSAFRICAN CHAMPION INDUSTRIES Full Year 07-May-15 Hfc Bank (Ghana) 2015 0.06CLYDESTONE GHANA LTD Full Year 21-May-15 Starwin Products 2013 0.00
Standard Charter 2015 0.4Benso Oil Palm 0.07Enterprise Group 2014 0.2
6
TypeFinalFinalFinal
Regular Cash
Market Commentary
Govt net debt (% GDP)Nominal GDP (USDbn)GDP growth (%, constant prices)GDP per capita (USD)Inflation (%, end of period)
Current account balance (% GDP)Govt gross debt (% GDP)
Dividends Last Cum date20-Apr-15
30 Apr 2015
24-Sep-1313-May-1505-May-1503-Dec-14Interim
The GSE Composite gained 0.6% to close the week at 2,272.8 on the back of gains in Ghana Oil (+7.1%),SocGen (Ghana) (+6.4%) and CAL Bank (+3.0%). During the week, losses were recorded in HFC Bank (-2.3%) and Total Petroleum (-0.2%).The top traders by value were Stanchart Ghana (USD 53.0k), GhanaCommercial Bank (USD 39.7k) and Ecobank Ghana (USD 32.6k). Trading in these shares accounted for54.7% of this week’s turnover of GHS 883.4k (USD 229.0k). The average weekly value traded in the last sixmonths is GHS 7.1m (USD 1.8m). The GSE Composite is up 0.5% ytd (-16.1% USD) and the total marketcapitalisation is currently USD 4.3bn.

African Alliance Pan-African Securities Research
Equity Research I Pan-Africa I Weekly Market Indicators
THE AFRICA WEEKLY
Ghana Stock Exchange (Ghana Cedi) Ghana
GSE CI Level % chg Level % chg % chg Company Week % chg PriceCurrent 2,272.8 3.85 H: 04-Jul-14 2,392.7 Ghana Oil 7.1 1.20This week 2,259.4 0.59 3.86 0.16 0.76 L: 03-Feb-15 2,143.5 SocGen (Ghana) 6.4 1.00Prev week 2,263.0 -0.16 3.82 -1.04 -1.19 Off peak -5.0% CAL Bank 3.0 1.04MTD 2,220.4 2.36 3.80 -1.39 0.93 At High 3/34 Ghana Commercial Bank 0.7 5.39YTD 2,261.0 0.52 3.22 -16.57 -16.14 At Low 0/34 Ecobank Ghana 0.4 8.00
0.9 0.27% GHSm 7.1 Company Week % chg Price0.6 19 USDm 1.8 Cocoa Processing -50.0 0.01
56% Tullow Oil -5.6 33.000.7 6 HFC Bank -2.3 1.710.1 4 GHSm 16,565 Total Petroleum -0.2 6.14
1061.1% 2 USDm 4,298 --
Company GHS'000 % of totalStanchart Ghana 204.2 23.12Ghana Commercial Bank 153.1 17.33Ecobank Ghana 125.8 14.24Ghana Oil 117.8 13.34Fan Milk 98.2 11.12
*The index is the GSE ALSI, an all share index ** Value Traded numbers are given in millions of Ghanaian Cedi See the notes page for more information about calculations 30 Apr 2015 7
Total value Value Traded / Mkt Cap (%)
GHS/USD USD returnsIndex performance *
Turnover analysis ** Avg weekly value traded
Market highs and lowsTop 5 gainers
Top 5 decliners
Advance - Decline
Stocks traded (%)Stocks up Total Market cap
Trading numbers
Top 5 (value) tradersRebased Index Performance
Net value Stocks traded (absolute)
Upside valueDownside value Stocks downUpside/downside ratio
-40%
-30%
-20%
-10%
0%
10%
20%
Apr-14 Jul-14 Oct-14 Jan-15 Apr-15
USD GHS
0 5,000 10,000 15,000 20,000
04 Jul 2014
30-Apr
Market Cap (GHS m) : Current vs Peak

African Alliance Pan-African Securities Research
Equity Research I Pan-Africa I Weekly Market Indicators
THE AFRICA WEEKLY
Ghana Stock Exchange (Ghana Cedi) Ghana
Price Value Volume 6 mthsCompany Name Sector GHS % chg Move GHS '000 '000 High Low Off high YTD 12 mths GHS m USD m Val (000)ETI (Ghana) BANK 0.30 - Flat 16 54.83 0.43 0.17 -30.2 7.1 36.4 4,789 1,243 15.7Stanchart Ghana BANK 20.31 0.2 Up 204 10.06 21.25 17.80 -4.4 -0.2 7.1 2,346 609 170.6Ecobank Ghana BANK 8.00 0.4 Up 126 15.76 8.00 6.19 - 5.3 33.3 2,346 609 204.0Ghana Commercial Bank BANK 5.39 0.7 Up 153 28.52 5.85 4.00 -7.9 1.7 34.4 1,428 371 278.6Total Petroleum OILG 6.14 -0.2 Down 17 2.78 6.57 6.10 -6.5 0.7 -5.5 687 178 58.2Guinness Ghana BREW 3.20 5.78 2.45 -44.6 - -44.6 676 175 8.3Fan Milk CONS 5.30 - Flat 98 18.53 7.48 4.89 -29.1 1.0 -29.5 616 160 57.4Golden Star RESO 2.34 2.34 2.34 0.0 - -14.9 598 155 -CAL Bank BANK 1.04 3.0 Up 53 51.86 1.15 0.85 -9.6 3.0 20.9 570 148 446.7HFC Bank BANK 1.71 -2.3 Down 39 23.15 1.75 1.15 -2.3 14.0 36.8 507 132 4.7Unilever Ghana CONS 7.50 - Flat 1 0.16 18.08 7.31 -58.5 -29.9 -58.5 469 122 29.1SocGen (Ghana) BANK 1.00 6.4 Up 22 23.04 1.08 0.62 -7.4 - 47.1 334 87 39.9Ghana Oil OILG 1.20 7.1 Up 118 99.79 1.20 0.89 -0.0 14.3 34.8 303 79 164.4Enterprise Group INSU 1.65 - Flat 5 3.30 2.29 1.40 -27.9 -5.7 -27.9 211 55 240.1Benso Oil Palm AGRI 5.00 - Flat 2 0.40 5.00 2.30 - 22.0 100.0 174 45 41.3Tullow Oil OILG 33.00 -5.6 Down 1 0.03 36.00 30.08 -8.3 -5.7 9.7 117 30 0.1UT Bank BANK 0.18 - Flat 24 131.50 0.42 0.17 -57.1 -28.0 -57.1 82 21 13.3Produce Buying AGRI 0.12 - Flat 2 16.20 0.15 0.11 -20.0 - -20.0 58 15 0.5Trust Bank (Gambia) BANK 0.24 0.31 0.24 -22.6 - -4.0 48 12 2.6PZ Cussons Ghana CONS 0.24 0.60 0.23 -60.0 -20.0 -60.0 40 10 0.4SIC Insurance INSU 0.20 - Flat 0 0.50 0.45 0.14 -55.6 -45.9 -50.0 39 10 24.3Mega African Capital INVE 4.50 4.50 3.10 - - 28.6 39 10 49.0Ayrton Drug PHAR 0.18 0.18 0.17 -0.0 - 5.9 39 10 0.0Cocoa Processing INDU 0.01 -50.0 Down 1 60.07 0.02 0.01 -50.0 -50.0 -50.0 20 5 0.2Mechanical Lloyd CONS 0.20 0.34 0.20 -41.2 -28.6 -41.2 10 3 0.2Aluworks Ghana RESO 0.04 - Flat 0 0.14 0.06 0.02 -33.3 100.0 -33.3 9 2 0.1Transol TELE 0.03 0.03 0.03 0.0 - - 2 1 0.0Pioneer Kitchenware. INDU 0.06 0.06 0.06 0.0 - - 2 1 0.0Starwin Products PHAR 0.02 0.04 0.02 -50.0 - -50.0 1 0 0.1Golden Web CONS 0.03 0.04 0.03 -25.0 - -25.0 1 0 -
830 Apr 2015
Movement (% chg) Market cap12 MonthWeekly

African Alliance Pan-African Securities Research
Equity Research I Pan-Africa I Weekly Market Indicators
THE AFRICA WEEKLY
BRVM Stock Exchange (CFA Franc) BRVM
2012 2013 2014 2015 2016E 2017F-10.8 -10.4 -9.8 -9.4 -9.3 -9.043.4 46.8 50.3 51.0 51.0 50.9
14.0 14.8 15.9 16.9 18.2 19.73.4 3.5 4.5 4.6 5.1 5.1
1,023.3 1,047.5 1,092.3 1,126.1 1,181.5 1,244.91.1 -0.1 1.4 1.5 1.4 1.3
2012 2013 2014 2015 2016E 2017F-0.2 -2.1 -3.0 -3.1 -3.2 -3.3
Company Reporting period Expected reporting date 44.8 39.9 36.5 34.3 33.1 32.1NESTLE COTE D IVOIRE Full Year 01-Jun-15BANK OF AFRICA-BURKINA FASO Full Year 13-Aug-15 27.7 32.1 34.0 38.2 42.0 45.9BOA-COTE D'IVOIRE Full Year 20-Aug-15 10.7 8.7 8.5 7.9 7.8 7.5BANK OF AFRICA NG Full Year 13-Aug-15 1,332.1 1,370.0 1,494.8 1,596.9 1,695.3SOC AFRICAINE DE PLANTATIONS Full Year 16-Apr-15 3.4 0.4 1.6 1.6 2.5 2.5
Year TypeSonatel 1,440.0Palmci 2013 1,440.0Cie 2015 2,957.5Sogb 2014 0.0Bollore Africa L 2013 7,562.0
9
Last Cum date
11-Jun-13N.A.
29-Apr-1524-Jul-14
04-Jun-13
Govt net debt (% GDP)Nominal GDP (USDbn)GDP growth (%, constant prices)GDP per capita (USD)Inflation (%, end of period)
Ivory CoastCurrent account balance (% GDP)Govt gross debt (% GDP)Govt net debt (% GDP)
Market Commentary Senegal
Current account balance (% GDP)Govt gross debt (% GDP)
30 Apr 2015
Dividends Amount
Regular CashRegular CashRegular CashRegular Cash
Nominal GDP (USDbn)GDP growth (%, constant prices)GDP per capita (USD)Inflation (%, end of period)
Regular Cash
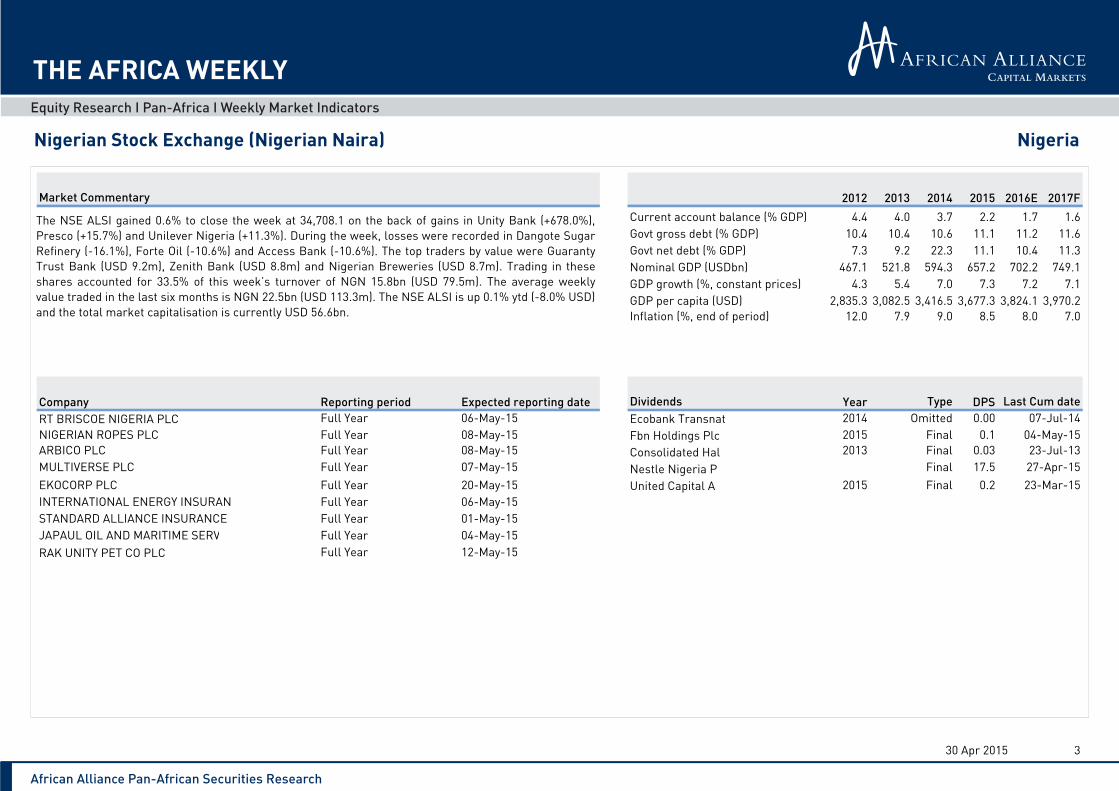
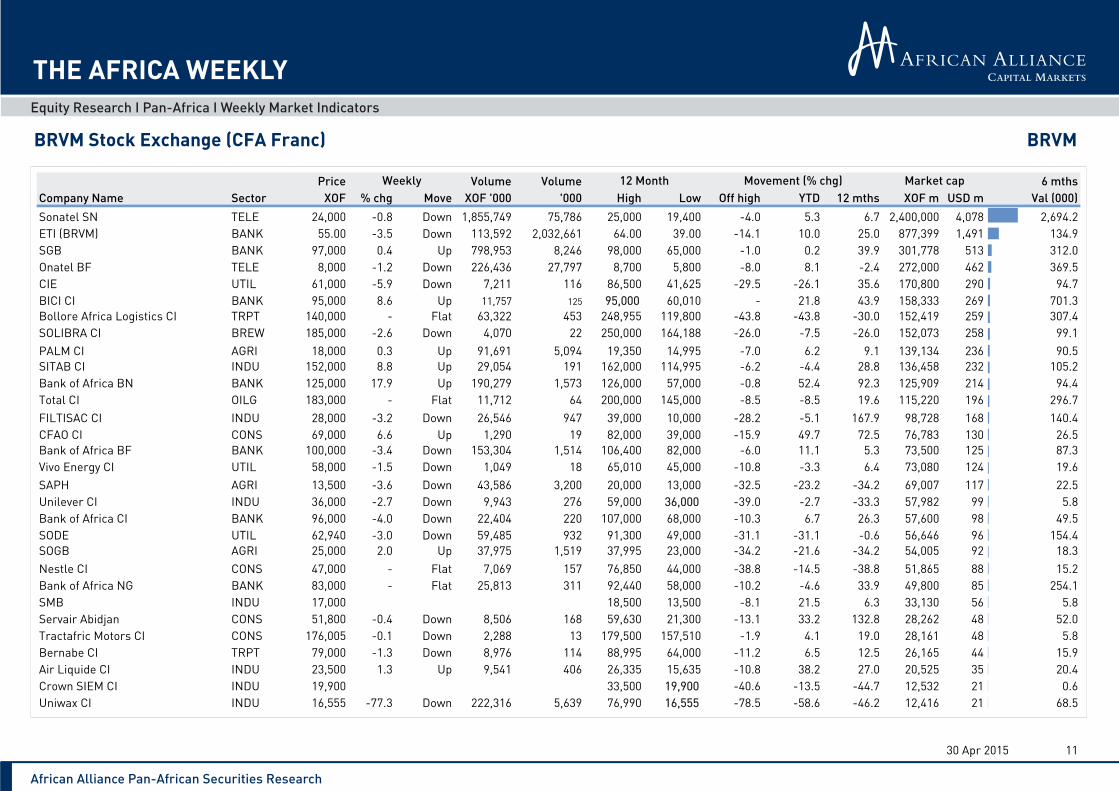
The IC Composite declined 0.5% to close the week at 264.7 on the back of losses in CIE (-5.9%), Bank ofAfrica CI (-4.0%) and SAPH (-3.6%). During the week, gains were recorded in Bank of Africa BN (+17.9%),SITAB CI (+8.8%) and BICI CI (+8.6%). The top traders by value were Sonatel SN (USD 3.1m), SGB (USD1.3m) and Onatel BF (USD 0.4m). Trading in these shares accounted for 70.8% of this week’s turnover ofXOF 4.1bn (USD 6.8m). The average weekly value traded in the last six months is XOF 3.7bn (USD 6.3m).The IC Composite is up 2.6% ytd (-5.9% USD) and the total market capitalisation is currently USD 10.0bn.
African Alliance Pan-African Securities Research
Equity Research I Pan-Africa I Weekly Market Indicators
THE AFRICA WEEKLY
BRVM Stock Exchange (CFA Franc) BRVM
IC Composite Level % chg Level % chg Company Week % chg PriceCurrent 264.7 588.54 H: 24-Apr-15 267.4 Bank of Africa BN 17.9 125,000This week 266.0 -0.50 613.15 4.18 3.66 L: 06-May-14 219.8 SITAB CI 8.8 152,000Prev week 263.2 1.09 614.69 0.25 1.34 Off peak -1.0% BICI CI 8.6 95,000MTD 262.6 0.82 611.53 3.91 4.75 At High 2/37 CFAO CI 6.6 69,000YTD 258.1 2.57 539.77 -8.29 -5.93 At Low 4/37 SICable 5.4 62,000
4,067.8 3.44% XOFm 3,711.3 Company Week % chg Price-1,573.6 32 USDm 6.3 Uniwax CI -77.3 16,555
86% CIE -5.9 61,0001,192.6 9 Bank of Africa CI -4.0 96,0002,766.2 17 XOFm 5,910,937 SAPH -3.6 13,500-56.9% -8 USDm 10,043 ETI (BRVM) -3.5 55.00
Company XOF'000 % of totalSonatel SN 1,855,749 45.62SGB 798,953 19.64Onatel BF 226,436 5.57Uniwax CI 222,316 5.47Bank of Africa BN 190,279 4.68
*The index is the BRVM Composite, an all share index ** Value Traded numbers are given in millions of CFA Francs (BCEAO) See the notes page for more information about calculations 30 Apr 2015 10
Total value Value Traded / Mkt Cap (%)
XOF/USD USD returnsIndex performance *
Turnover analysis ** Avg weekly value traded
Market highs and lowsTop 5 gainers
Top 5 decliners
Advance - Decline
Stocks traded (%)Stocks up Total Market cap
Stocks traded (absolute)
Trading numbers
Top 5 (value) tradersRebased Index Performance
Net value
Upside valueDownside value Stocks downUpside/downside ratio
-29%
-20%
-11%
-2%
7%
16%
Apr-14 Jul-14 Oct-14 Jan-15 Apr-15
USD XOF
0 5,000,000 10,000,000
24 Apr 2015
30-Apr
Market Cap (XOF bn): Current vs Peak
African Alliance Pan-African Securities Research
Equity Research I Pan-Africa I Weekly Market Indicators
THE AFRICA WEEKLY
BRVM Stock Exchange (CFA Franc) BRVM
Price Volume Volume 6 mthsCompany Name Sector XOF % chg Move XOF '000 '000 High Low Off high YTD 12 mths XOF m USD m Val (000)Sonatel SN TELE 24,000 -0.8 Down 1,855,749 75,786 25,000 19,400 -4.0 5.3 6.7 2,400,000 4,078 2,694.2ETI (BRVM) BANK 55.00 -3.5 Down 113,592 2,032,661 64.00 39.00 -14.1 10.0 25.0 877,399 1,491 134.9SGB BANK 97,000 0.4 Up 798,953 8,246 98,000 65,000 -1.0 0.2 39.9 301,778 513 312.0Onatel BF TELE 8,000 -1.2 Down 226,436 27,797 8,700 5,800 -8.0 8.1 -2.4 272,000 462 369.5CIE UTIL 61,000 -5.9 Down 7,211 116 86,500 41,625 -29.5 -26.1 35.6 170,800 290 94.7BICI CI BANK 95,000 8.6 Up 11,757 125 95,000 60,010 - 21.8 43.9 158,333 269 701.3Bollore Africa Logistics CI TRPT 140,000 - Flat 63,322 453 248,955 119,800 -43.8 -43.8 -30.0 152,419 259 307.4SOLIBRA CI BREW 185,000 -2.6 Down 4,070 22 250,000 164,188 -26.0 -7.5 -26.0 152,073 258 99.1PALM CI AGRI 18,000 0.3 Up 91,691 5,094 19,350 14,995 -7.0 6.2 9.1 139,134 236 90.5SITAB CI INDU 152,000 8.8 Up 29,054 191 162,000 114,995 -6.2 -4.4 28.8 136,458 232 105.2Bank of Africa BN BANK 125,000 17.9 Up 190,279 1,573 126,000 57,000 -0.8 52.4 92.3 125,909 214 94.4Total CI OILG 183,000 - Flat 11,712 64 200,000 145,000 -8.5 -8.5 19.6 115,220 196 296.7FILTISAC CI INDU 28,000 -3.2 Down 26,546 947 39,000 10,000 -28.2 -5.1 167.9 98,728 168 140.4CFAO CI CONS 69,000 6.6 Up 1,290 19 82,000 39,000 -15.9 49.7 72.5 76,783 130 26.5Bank of Africa BF BANK 100,000 -3.4 Down 153,304 1,514 106,400 82,000 -6.0 11.1 5.3 73,500 125 87.3Vivo Energy CI UTIL 58,000 -1.5 Down 1,049 18 65,010 45,000 -10.8 -3.3 6.4 73,080 124 19.6SAPH AGRI 13,500 -3.6 Down 43,586 3,200 20,000 13,000 -32.5 -23.2 -34.2 69,007 117 22.5Unilever CI INDU 36,000 -2.7 Down 9,943 276 59,000 36,000 -39.0 -2.7 -33.3 57,982 99 5.8Bank of Africa CI BANK 96,000 -4.0 Down 22,404 220 107,000 68,000 -10.3 6.7 26.3 57,600 98 49.5SODE UTIL 62,940 -3.0 Down 59,485 932 91,300 49,000 -31.1 -31.1 -0.6 56,646 96 154.4SOGB AGRI 25,000 2.0 Up 37,975 1,519 37,995 23,000 -34.2 -21.6 -34.2 54,005 92 18.3Nestle CI CONS 47,000 - Flat 7,069 157 76,850 44,000 -38.8 -14.5 -38.8 51,865 88 15.2Bank of Africa NG BANK 83,000 - Flat 25,813 311 92,440 58,000 -10.2 -4.6 33.9 49,800 85 254.1SMB INDU 17,000 18,500 13,500 -8.1 21.5 6.3 33,130 56 5.8Servair Abidjan CONS 51,800 -0.4 Down 8,506 168 59,630 21,300 -13.1 33.2 132.8 28,262 48 52.0Tractafric Motors CI CONS 176,005 -0.1 Down 2,288 13 179,500 157,510 -1.9 4.1 19.0 28,161 48 5.8Bernabe CI TRPT 79,000 -1.3 Down 8,976 114 88,995 64,000 -11.2 6.5 12.5 26,165 44 15.9Air Liquide CI INDU 23,500 1.3 Up 9,541 406 26,335 15,635 -10.8 38.2 27.0 20,525 35 20.4Crown SIEM CI INDU 19,900 33,500 19,900 -40.6 -13.5 -44.7 12,532 21 0.6Uniwax CI INDU 16,555 -77.3 Down 222,316 5,639 76,990 16,555 -78.5 -58.6 -46.2 12,416 21 68.5
1130 Apr 2015
Movement (% chg) Market cap12 MonthWeekly

African Alliance Pan-African Securities Research
Equity Research I Pan-Africa I Weekly Market Indicators
THE AFRICA WEEKLY
Nairobi Securities Exchange (Kenyan Shilling) Kenya
2012 2013 2014 2015 2016E 2017F-8.4 -8.7 -8.0 -8.1 -7.5 -6.540.8 41.0 44.7 46.6 46.6 46.637.0 38.7 41.5 41.9 42.4 42.650.4 55.0 62.7 70.0 76.5 87.5
4.6 4.6 5.3 6.2 6.4 6.51,237.5 1,315.6 1,461.1 1,587.6 1,689.8 1,883.5
3.2 7.1 7.7 5.2 5.0 5.0
Company Reporting period Expected reporting date Year DPSCAR & GENERAL (K) LTD Half Year 15-May-15 Kenya Electric 2014 0.4EVEREADY EAST AFRICA LTD Half Year 05-May-15 Mumias Sugar Co 2013 0.00SAFARICOM LTD Full Year 12-May-15 Transcentury Ltd 2014 0.4
Scan Group 0.4Cic Insurance Gr 2015 0.1
12
TypeFinal
OmittedFinalFinal
Market Commentary
Govt net debt (% GDP)Nominal GDP (USDbn)GDP growth (%, constant prices)GDP per capita (USD)Inflation (%, end of period)
Current account balance (% GDP)Govt gross debt (% GDP)
Dividends Last Cum date17-Dec-14
30 Apr 2015
05-Nov-1317-Jun-1403-Jun-1421-May-15Final
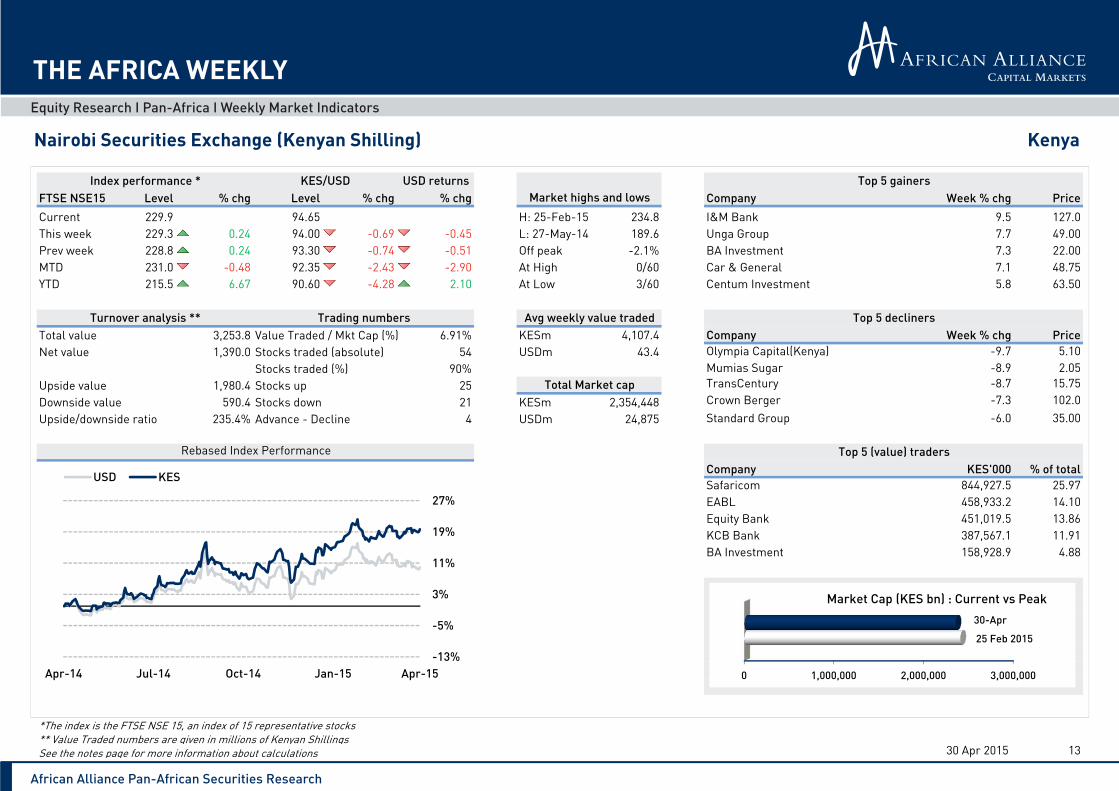
The FTSE NSE Kenya 15 gained 0.2% to close the week at 229.9 on the back of gains in I&M Bank (+9.5%),BA Investment (+7.3%) and Centum Investment (+5.8%). During the week, losses were recorded in NBK (-5.4%), Scan Group (-4.4%) and Kenya Airways (-4.1%). The top traders by value were Safaricom (USD9.0m), EABL (USD 4.9m) and Equity Bank (USD 4.8m). Trading in these shares accounted for 54.0% of thisweek’s turnover of KES 3.2bn (USD 34.4m). The average weekly value traded in the last six months is KES4.1bn (USD 43.2m). The FTSE NSE Kenya 15 is up 6.7% ytd (+2.1% USD) and the total marketcapitalisation is currently USD 24.8bn.
African Alliance Pan-African Securities Research
Equity Research I Pan-Africa I Weekly Market Indicators
THE AFRICA WEEKLY
Nairobi Securities Exchange (Kenyan Shilling) Kenya
FTSE NSE15 Level % chg Level % chg % chg Company Week % chg PriceCurrent 229.9 94.65 H: 25-Feb-15 234.8 I&M Bank 9.5 127.0This week 229.3 0.24 94.00 -0.69 -0.45 L: 27-May-14 189.6 Unga Group 7.7 49.00Prev week 228.8 0.24 93.30 -0.74 -0.51 Off peak -2.1% BA Investment 7.3 22.00MTD 231.0 -0.48 92.35 -2.43 -2.90 At High 0/60 Car & General 7.1 48.75YTD 215.5 6.67 90.60 -4.28 2.10 At Low 3/60 Centum Investment 5.8 63.50
3,253.8 6.91% KESm 4,107.4 Company Week % chg Price1,390.0 54 USDm 43.4 Olympia Capital(Kenya) -9.7 5.10
90% Mumias Sugar -8.9 2.051,980.4 25 TransCentury -8.7 15.75
590.4 21 KESm 2,354,448 Crown Berger -7.3 102.0235.4% 4 USDm 24,875 Standard Group -6.0 35.00
Company KES'000 % of totalSafaricom 844,927.5 25.97EABL 458,933.2 14.10Equity Bank 451,019.5 13.86KCB Bank 387,567.1 11.91BA Investment 158,928.9 4.88
*The index is the FTSE NSE 15, an index of 15 representative stocks ** Value Traded numbers are given in millions of Kenyan Shillings See the notes page for more information about calculations 30 Apr 2015 13
Total value Value Traded / Mkt Cap (%)
KES/USD USD returnsIndex performance *
Turnover analysis ** Avg weekly value traded
Market highs and lowsTop 5 gainers
Top 5 decliners
Advance - Decline
Stocks traded (%)Stocks up Total Market cap
Trading numbers
Top 5 (value) tradersRebased Index Performance
Net value Stocks traded (absolute)
Upside valueDownside value Stocks downUpside/downside ratio
-13%
-5%
3%
11%
19%
27%
Apr-14 Jul-14 Oct-14 Jan-15 Apr-15
USD KES
0 1,000,000 2,000,000 3,000,000
25 Feb 2015
30-Apr
Market Cap (KES bn) : Current vs Peak
African Alliance Pan-African Securities Research
Equity Research I Pan-Africa I Weekly Market Indicators
THE AFRICA WEEKLY
Nairobi Securities Exchange (Kenyan Shilling) Kenya
Price Value Volume 6 mthsCompany Name Sector KES % chg Move KES '000 '000 High Low Off high YTD 12 mths KES m USD m Val (000)Safaricom TELE 17.40 1.2 Up 844,927 48,855.3 17.40 11.95 0.0 23.8 32.8 696,776 7,362 8,213.4EABL BREW 321.0 0.6 Up 458,933 1,435.1 350.0 267.0 -8.3 4.2 9.6 253,839 2,682 5,564.9KCB Bank BANK 62.50 -2.3 Down 387,567 6,194.3 65.00 46.50 -3.8 9.6 27.6 186,509 1,971 6,695.3Equity Bank BANK 49.25 - Flat 451,019 9,060.0 59.00 37.75 -16.5 -1.5 28.8 182,362 1,927 5,524.6Stanchart Kenya BANK 344.0 -0.3 Down 27,569 79.8 355.0 294.0 -3.1 2.7 11.7 106,351 1,124 481.3Co-Op Bank BANK 20.75 -1.2 Down 53,460 2,633.8 24.00 17.55 -13.5 3.8 -8.8 86,960 919 1,106.7Barclays Kenya BANK 15.95 3.6 Up 20,299 1,291.4 18.20 15.30 -12.4 -4.5 -6.2 86,633 915 654.4BAT (Kenya) CONS 719.0 2.0 Up 42,351 59.1 1,048 566.0 -31.4 -20.8 24.2 71,900 760 835.1Bamburi Cement BUIL 150.0 - Flat 47,361 314.7 185.0 139.0 -18.9 7.9 -11.8 54,444 575 711.9Diamond Trust BANK 230.0 1.3 Up 41,569 181.2 275.0 218.0 -16.4 -2.1 -2.5 50,623 535 810.4I&M Bank BANK 127.0 9.5 Up 158,079 1,302.7 147.0 116.0 -13.6 3.3 -0.8 49,830 526 328.2CFC Stanbic BANK 124.0 - Flat 108,905 878.0 148.0 118.0 -16.2 - -3.9 49,020 518 364.3Nation Media MEDI 234.0 4.5 Up 18,131 80.3 322.0 223.0 -27.3 -11.0 -23.8 44,119 466 304.1Centum Investment INVE 63.50 5.8 Up 97,726 1,550.1 78.00 38.00 -18.6 4.1 60.8 42,256 446 2,379.2BA Investment INVE 22.00 7.3 Up 158,929 7,212.8 37.00 17.40 -40.5 -26.1 21.5 41,612 440 1,078.8ARM Cement Ltd RESO 76.00 3.4 Up 33,684 443.3 92.50 73.50 -17.8 -11.6 -11.1 37,641 398 821.4Jubilee Holdings INSU 570.0 - Flat 62,226 106.4 598.0 310.0 -4.7 26.7 85.1 34,140 361 262.9KPLC UTIL 17.10 -1.4 Down 10,672 619.1 18.40 12.90 -7.1 18.3 14.8 33,370 353 592.5NIC Bank BANK 59.00 1.7 Up 20,747 351.0 81.50 55.50 -27.6 2.6 -6.3 32,036 338 621.8KenGen UTIL 9.95 2.6 Up 17,907 1,800.3 13.00 8.90 -23.5 -3.4 -14.6 21,874 231 268.7CIC Insurance INSU 9.20 - Flat 9,747 1,054.9 11.90 7.95 -22.7 -4.2 -8.5 20,052 212 318.6Scan Group MEDI 43.75 -4.4 Down 11,055 244.9 51.50 40.75 -15.0 -3.3 -28.9 16,575 175 1,093.0KenolKobil OILG 9.45 5.0 Up 14,643 1,572.0 10.30 8.00 -8.3 8.6 6.2 13,908 147 424.2KenyaRe INSU 17.80 -0.6 Down 28,986 1,614.5 20.00 16.25 -11.0 4.4 -10.1 12,460 132 313.0Pan Africa Insurance INSU 122.0 1.7 Up 2,872 23.3 141.0 102.0 -13.5 1.7 -9.6 11,712 124 1,004.8Liberty Kenya BANK 22.50 -2.2 Down 11,393 484.1 25.25 17.05 -10.9 -3.2 2.3 11,594 122 71.5Kenya Airways TRPT 7.10 -4.1 Down 6,194 850.9 12.80 7.05 -44.5 -18.4 -43.2 10,625 112 131.8Housing Finance BANK 33.75 3.1 Up 38,084 1,116.1 50.25 32.75 -32.8 -26.2 -5.6 7,957 84 283.4CMC Holdings CONS 13.50 0.00 0.00 - - 7,867 83 -TPS East Africa HOTL 34.50 1.5 Up 817 23.5 41.50 32.50 -16.9 -6.8 -14.3 6,285 66 94.2
1430 Apr 2015
Movement (% chg) Market cap12 MonthWeekly

African Alliance Pan-African Securities Research
Equity Research I Pan-Africa I Weekly Market Indicators
THE AFRICA WEEKLY
Dar es Salaam Stock Exchange (Tanzanian Shilling) Tanzania
2012 2013 2014 2015 2016E 2017F-15.9 -13.8 -13.7 -13.1 -12.5 -11.840.4 40.5 42.1 42.8 42.8 43.0
28.5 33.3 36.6 40.2 44.3 48.46.9 7.0 7.2 7.0 7.1 7.0
633.3 719.3 768.3 819.7 876.4 929.312.1 5.6 5.0 5.0 5.0 5.0
Company Reporting period Expected reporting date Year DPSCRDB BANK PLC Full Year 12-May-15 Tanzania Breweri 2015 300.0
Tanzania Cigaret 2015 400.0Crdb Bank Plc 2014 14.0Tanzania Portlan 70.0Microfinance Ban 2014 90.0
15
TypeInterim
FinalRegular CashRegular Cash
Market Commentary
Govt net debt (% GDP)Nominal GDP (USDbn)GDP growth (%, constant prices)GDP per capita (USD)Inflation (%, end of period)
Current account balance (% GDP)Govt gross debt (% GDP)
Dividends Last Cum date13-Apr-15
30 Apr 2015
02-Apr-1525-Apr-1404-Sep-1429-May-14Regular Cash
The DSE ALSI gained 0.9% to close the week at 2,699.6 on the back of gains in TOL (+0.9%) and NMB(+0.3%). During the week, losses were recorded in DCB (-10.0%), Swissport (-6.0%) and Simba Cement (-4.8%). The top traders by value were Tanzania Breweries (USD 4.6m), CRDB Bank (USD 0.4m) and NMB(USD 0.1m). Trading in these shares accounted for 98.5% of this week’s turnover of TZS 10.1bn (USD5.1m). The average weekly value traded in the last six months is TZS 15.6bn (USD 7.9m). The DSE ALSI isup 7.1% ytd (-6.1% USD) and the total market capitalisation is currently USD 5.0bn.

African Alliance Pan-African Securities Research
Equity Research I Pan-Africa I Weekly Market Indicators
THE AFRICA WEEKLY
Dar es Salaam Stock Exchange (Tanzanian Shilling) Tanzania
DAR ALSI Level % chg Level % chg % chg Company Week % chg PriceCurrent 2,699.6 1,980.00 H: 24-Feb-15 2,779.1 TOL 0.9 585.0This week 2,674.5 0.94 1,960.00 -1.01 -0.08 L: 13-May-14 1,924.2 NMB 0.3 3,610Prev week 2,739.6 -2.37 1,885.00 -3.83 -6.11 Off peak -2.9% --MTD 2,596.3 3.98 1,798.00 -9.19 -5.58 At High 2/11 --YTD 2,519.6 7.14 1,735.00 -12.37 -6.11 At Low 1/11 --
10,081.9 5.09% TZSm 15,643.6 Company Week % chg Price-9,856.1 9 USDm 7.9 DCB -10.0 720.0
82% Swissport -6.0 5,500107.9 2 Simba Cement -4.8 3,800
9,964.1 6 TZSm 9,909,271 Tanzania Breweries -1.5 14,500-98.9% -4 USDm 5,005 CRDB Bank -1.2 415.0
Company TZS'000 % of totalTanzania Breweries 9,026,935.6 89.54CRDB Bank 798,005.7 7.92NMB 107,773.1 1.07TWIGA 68,046.6 0.67Simba Cement 37,678.4 0.37
*The index is the DAR ALSI, an all share index ** Value Traded numbers are given in millions of Tanzanian Shillings See the notes page for more information about calculations 30 Apr 2015 16
Total value Value Traded / Mkt Cap (%)
TZS/USD USD returnsIndex performance *
Turnover analysis ** Avg weekly value traded
Market highs and lowsTop 5 gainers
Top 5 decliners
Advance - Decline
Stocks traded (%)Stocks up Total Market cap
Trading numbers
Top 5 (value) traders Rebased Index Performance
Net value Stocks traded (absolute)
Upside valueDownside value Stocks downUpside/downside ratio
-23%
-10%
3%
16%
29%
42%
Apr-14 Jul-14 Oct-14 Jan-15 Apr-15
USD TZS
0 5,000,000 10,000,000 15,000,000
24 Feb 2015
30-Apr
Market Cap (TZS bn) : Current vs Peak

African Alliance Pan-African Securities Research
Equity Research I Pan-Africa I Weekly Market Indicators
THE AFRICA WEEKLY
Dar es Salaam Stock Exchange (Tanzanian Shilling) Tanzania
Price Value Volume 6 mthsCompany Name Sector TZS % chg Move TZS '000 '000 High Low Off high YTD 12 mths TZS m USD m Val (000)Tanzania Breweries BREW 14,500 -1.5 Down 9,026,936 618.51 18,580 8,100 -22.0 2.9 81.3 4,276,463 2,160 5,654.3NMB BANK 3,610 0.3 Up 107,773 29.87 4,780 2,860 -24.5 6.2 27.1 1,805,000 912 164.7Tanzania Cigarette CONS 16,500 - Flat 9,900 0.60 20,000 550.0 -17.5 -1.4 65.0 1,650,000 833 940.9CRDB Bank BANK 415.0 -1.2 Down 798,006 1,923.62 520.0 305.0 -20.2 -3.5 33.9 903,261 456 551.2TWIGA BUIL 3,800 -0.5 Down 68,047 17.95 4,600 2,318 -17.4 -5.0 54.5 683,708 345 69.8Simba Cement BUIL 3,800 -4.8 Down 37,678 9.76 6,900 2,360 -44.9 -15.6 57.0 241,950 122 497.3Swissport HOTL 5,500 -6.0 Down 32,016 5.82 6,180 2,640 -11.0 9.8 103.7 198,000 100 5.3Precision Air TRPT 470.0 470.0 470.0 - - - 91,113 46 0.0TOL INDU 585.0 0.9 Up 175 0.30 600.0 450.0 -2.5 6.4 46.3 24,846 13 7.0DCB BANK 720.0 -10.0 Down 1,377 1.91 1,000 480.0 -28.0 - 50.0 23,323 12 10.3Tanzania Tea Packers AGRI 650.0 650.0 600.0 - - - 11,607 6 0.0
1730 Apr 2015
Movement (% chg) Market cap12 MonthWeekly
African Alliance Pan-African Securities Research
Equity Research I Pan-Africa I Weekly Market Indicators
THE AFRICA WEEKLY
Rwanda Stock Exchange (Rwandan Franc) Rwanda
2012 2013 2014 2015 2016E 2017F-11.3 -7.1 -12.3 -12.4 -10.0 -9.523.5 28.7 29.1 29.7 30.8 32.3
7.3 7.6 8.0 8.8 9.7 10.78.8 4.7 6.0 6.7 7.5 7.5
694.4 703.8 721.2 768.4 832.4 892.73.9 3.6 4.5 5.0 5.0 5.0
Company Reporting period Expected reporting date Year DPSBRALIRWA SA Full Year 06-May-15
18
Market Commentary
Current account balance (% GDP)Govt gross debt (% GDP)Govt net debt (% GDP)Nominal GDP (USDbn)GDP growth (%, constant prices)GDP per capita (USD)Inflation (%, end of period)
Dividends Type Last Cum date
30 Apr 2015
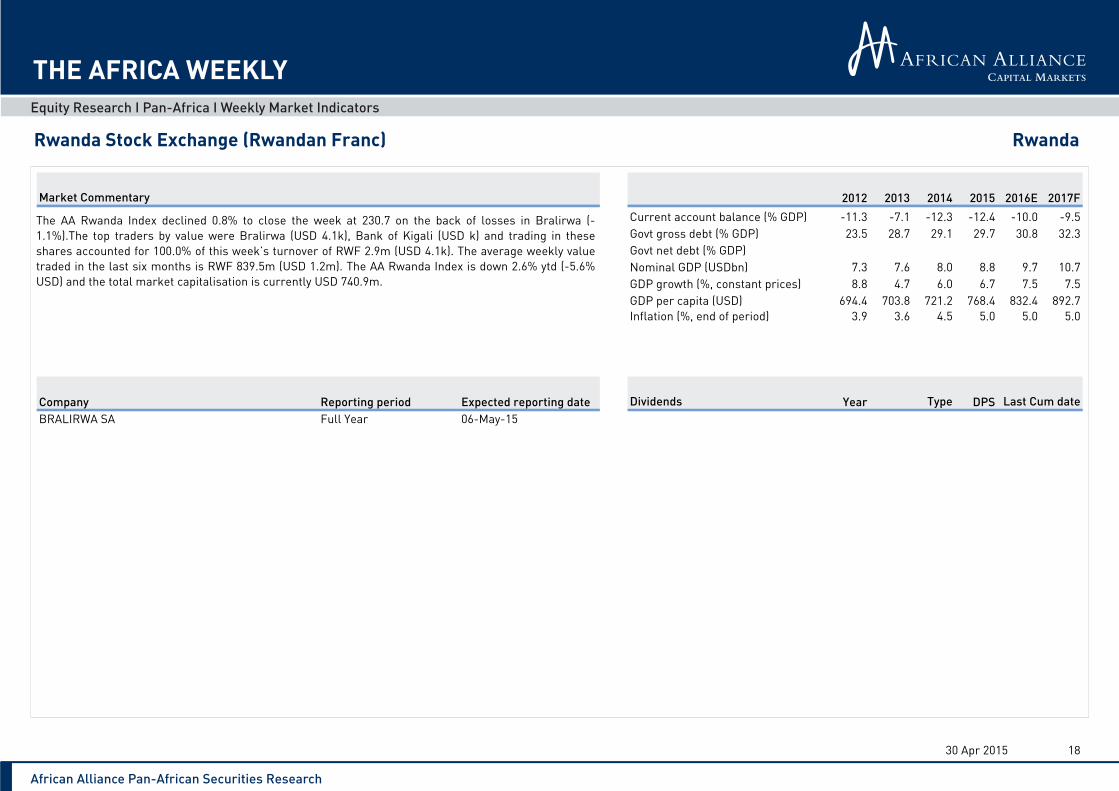
The AA Rwanda Index declined 0.8% to close the week at 230.7 on the back of losses in Bralirwa (-1.1%).The top traders by value were Bralirwa (USD 4.1k), Bank of Kigali (USD k) and trading in theseshares accounted for 100.0% of this week’s turnover of RWF 2.9m (USD 4.1k). The average weekly valuetraded in the last six months is RWF 839.5m (USD 1.2m). The AA Rwanda Index is down 2.6% ytd (-5.6%USD) and the total market capitalisation is currently USD 740.9m.

African Alliance Pan-African Securities Research
Equity Research I Pan-Africa I Weekly Market Indicators
THE AFRICA WEEKLY
Rwanda Stock Exchange (Rwandan Franc) Rwanda
RSE SI Level % chg Level % chg % chg Company Week % chg PriceCurrent 230.7 715.04 H: 18-Jul-14 267.5 No GainersThis week 232.6 -0.82 715.04 0.00 -0.82 L: 27-Nov-14 222.2 -- -Prev week 233.0 -0.18 700.16 -2.08 -2.25 Off peak -13.8%MTD 234.2 -1.51 715.04 0.00 -1.51 At High 0/2YTD 236.8 -2.57 692.71 -3.12 -5.61 At Low 0/2
2.9 0.03% RWFm 839.5 Company Week % chg Price-2.9 1 USDm 1.2 Bralirwa -1.1 371.0
50% --- 0
2.9 1 RWFm 529,747-100.0% -1 USDm 741
Company RWF'000 % of totalBralirwa 2,948.6 100.00-- - -
*The index is the RSE Share Index, Rwanda's all share index ** Value Traded numbers are given in millions of Rwandan FrancsSee the notes page for more information about calculations 30 Apr 2015 19
Index performance * RWF/USD USD returns Top 5 gainersMarket highs and lows
Total value Value Traded / Mkt Cap (%)Turnover analysis ** Trading numbers Avg weekly value traded Top 5 decliners
Net value Stocks traded (absolute)Stocks traded (%)
Upside value Stocks up Total Market capDownside value Stocks down
Top 5 (value) tradersRebased Index Performance
Upside/downside ratio Advance - Decline
-26%
-20%
-14%
-8%
-2%
4%
10%
Apr-14 Jul-14 Oct-14 Jan-15 Apr-15
USD RWF
0 200,000 400,000 600,000 800,000
18 Jul 2014
30-Apr
Market Cap (RWF bn) : Current vs Peak

African Alliance Pan-African Securities Research
Equity Research I Pan-Africa I Weekly Market Indicators
THE AFRICA WEEKLY
Rwanda Stock Exchange (Rwandan Franc) Rwanda
Price Value Volume 6 mthsCompany Name Sector RWF % chg Move RWF '000 '000 High Low Off high YTD 12 mths RWF m USD m Val (000)Bralirwa BREW 371.0 -1.1 Down 2,949 7.9 465.0 350.0 -20.2 -2.4 -13.8 381,599 534 803.5Bank of Kigali BANK 296.0 324.0 250.0 -8.6 -1.3 -9.2 148,148 207 370.5
20
Weekly 12 Month Movement (% chg) Market cap
30 Apr 2015
African Alliance Pan-African Securities Research
Equity Research I Pan-Africa I Weekly Market Indicators
THE AFRICA WEEKLY
Uganda Securities Exchange (Uganda Shilling) Uganda
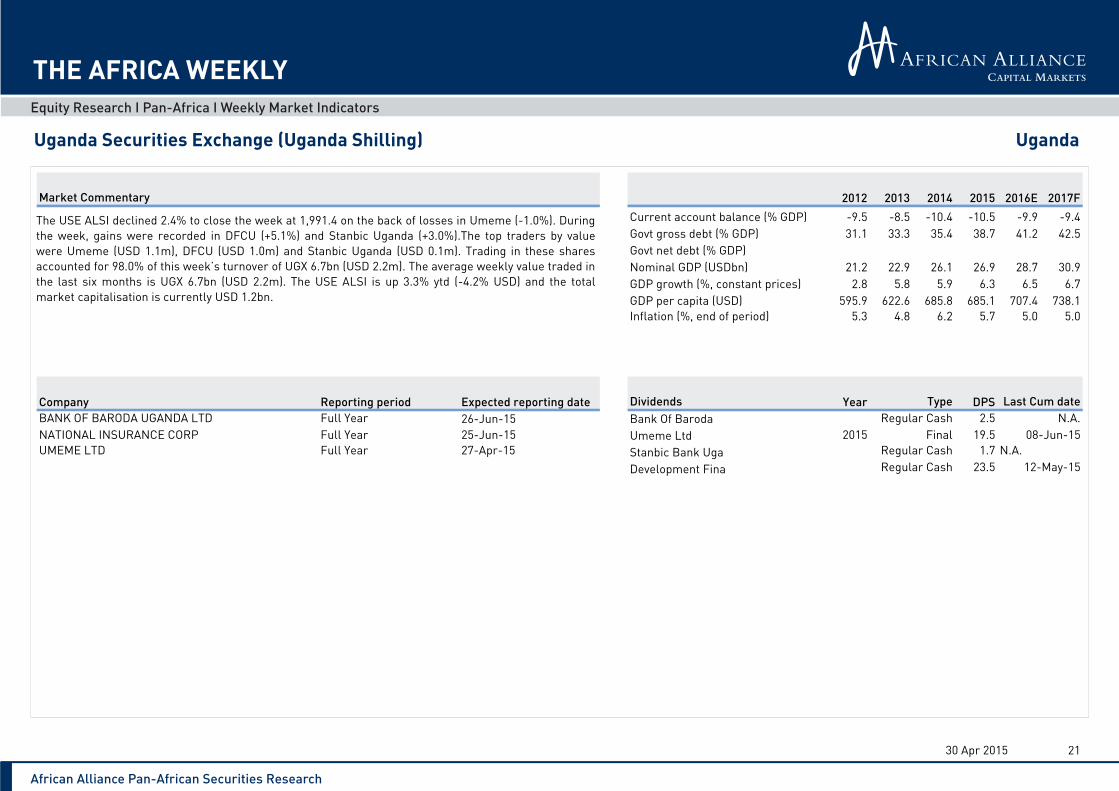
2012 2013 2014 2015 2016E 2017F-9.5 -8.5 -10.4 -10.5 -9.9 -9.431.1 33.3 35.4 38.7 41.2 42.5
21.2 22.9 26.1 26.9 28.7 30.92.8 5.8 5.9 6.3 6.5 6.7
595.9 622.6 685.8 685.1 707.4 738.15.3 4.8 6.2 5.7 5.0 5.0
Company Reporting period Expected reporting date Year DPSBANK OF BARODA UGANDA LTD Full Year 26-Jun-15 Bank Of Baroda 2.5NATIONAL INSURANCE CORP Full Year 25-Jun-15 Umeme Ltd 2015 19.5UMEME LTD Full Year 27-Apr-15 Stanbic Bank Uga 1.7
Development Fina 23.5
21
TypeRegular Cash
FinalRegular CashRegular Cash
Market Commentary
Govt net debt (% GDP)Nominal GDP (USDbn)GDP growth (%, constant prices)GDP per capita (USD)Inflation (%, end of period)
Current account balance (% GDP)Govt gross debt (% GDP)
Dividends Last Cum dateN.A.
30 Apr 2015
08-Jun-15N.A.
12-May-15
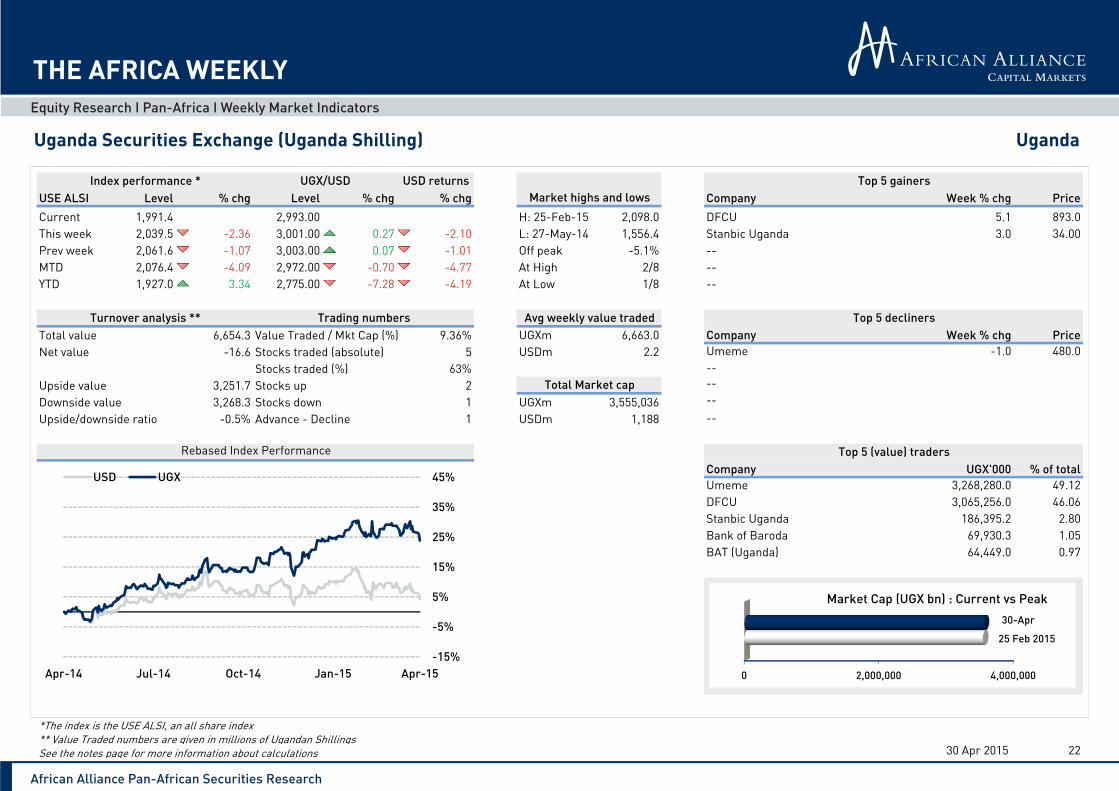
The USE ALSI declined 2.4% to close the week at 1,991.4 on the back of losses in Umeme (-1.0%). Duringthe week, gains were recorded in DFCU (+5.1%) and Stanbic Uganda (+3.0%).The top traders by valuewere Umeme (USD 1.1m), DFCU (USD 1.0m) and Stanbic Uganda (USD 0.1m). Trading in these sharesaccounted for 98.0% of this week’s turnover of UGX 6.7bn (USD 2.2m). The average weekly value traded inthe last six months is UGX 6.7bn (USD 2.2m). The USE ALSI is up 3.3% ytd (-4.2% USD) and the totalmarket capitalisation is currently USD 1.2bn.
African Alliance Pan-African Securities Research
Equity Research I Pan-Africa I Weekly Market Indicators
THE AFRICA WEEKLY
Uganda Securities Exchange (Uganda Shilling) Uganda
USE ALSI Level % chg Level % chg % chg Company Week % chg PriceCurrent 1,991.4 2,993.00 H: 25-Feb-15 2,098.0 DFCU 5.1 893.0This week 2,039.5 -2.36 3,001.00 0.27 -2.10 L: 27-May-14 1,556.4 Stanbic Uganda 3.0 34.00Prev week 2,061.6 -1.07 3,003.00 0.07 -1.01 Off peak -5.1% --MTD 2,076.4 -4.09 2,972.00 -0.70 -4.77 At High 2/8 --YTD 1,927.0 3.34 2,775.00 -7.28 -4.19 At Low 1/8 --
6,654.3 9.36% UGXm 6,663.0 Company Week % chg Price-16.6 5 USDm 2.2 Umeme -1.0 480.0
63% --3,251.7 2 --3,268.3 1 UGXm 3,555,036 --
-0.5% 1 USDm 1,188 --
Company UGX'000 % of totalUmeme 3,268,280.0 49.12DFCU 3,065,256.0 46.06Stanbic Uganda 186,395.2 2.80Bank of Baroda 69,930.3 1.05BAT (Uganda) 64,449.0 0.97
*The index is the USE ALSI, an all share index ** Value Traded numbers are given in millions of Ugandan Shillings See the notes page for more information about calculations 30 Apr 2015 22
Total value Value Traded / Mkt Cap (%)
UGX/USD USD returnsIndex performance *
Turnover analysis ** Avg weekly value traded
Market highs and lowsTop 5 gainers
Top 5 decliners
Advance - Decline
Stocks traded (%)Stocks up Total Market cap
Trading numbers
Top 5 (value) tradersRebased Index Performance
Net value Stocks traded (absolute)
Upside valueDownside value Stocks downUpside/downside ratio
-15%
-5%
5%
15%
25%
35%
45%
Apr-14 Jul-14 Oct-14 Jan-15 Apr-15
USD UGX
0 2,000,000 4,000,000
25 Feb 2015
30-Apr
Market Cap (UGX bn) : Current vs Peak

African Alliance Pan-African Securities Research
Equity Research I Pan-Africa I Weekly Market Indicators
THE AFRICA WEEKLY
Uganda Securities Exchange (Uganda Shilling) Uganda
Price Value Volume 6 mthsCompany Name Sector UGX % chg Move UGX '000 '000 High Low Off high YTD 12 mths UGX m USD m Val (000)Stanbic Uganda BANK 34.00 3.0 Up 186,395 5,592.9 35.00 30.00 -2.9 - 13.3 1,740,415 581 354.6Umeme UTIL 480.0 -1.0 Down 3,268,280 6,806.7 511.0 340.0 -6.1 -5.0 33.3 779,461 260 1,176.8BAT (Uganda) AGRI 8,525 - Flat 64,449 7.6 8,525 6,500 - 13.6 31.2 418,407 140 1.4Bank of Baroda BANK 130.0 - Flat 69,930 537.9 140.0 106.0 -7.1 10.2 18.2 325,000 109 11.3DFCU BANK 893.0 5.1 Up 3,065,256 3,440.1 893.0 600.0 - 27.4 47.0 222,001 74 657.1New Vision MEDI 605.0 610.0 550.0 -0.8 0.8 0.8 46,283 15 7.0Uganda Clays BUIL 18.00 25.00 18.00 -28.0 -10.0 -28.0 16,200 5 0.9NIC INSU 18.00 35.00 16.00 -48.6 -10.0 -40.0 7,270 2 17.1
2330 Apr 2015
Movement (% chg) Market cap12 MonthWeekly

African Alliance Pan-African Securities Research
Equity Research I Pan-Africa I Weekly Market Indicators
THE AFRICA WEEKLY
Johannesburg Stock Exchange (South African rand) South Africa
2012 2013 2014 2015 2016E 2017F-5.2 -5.8 -5.7 -5.6 -5.4 -5.242.1 45.2 47.9 50.8 53.7 55.836.1 39.2 42.8 46.5 50.1 52.9
382.3 350.8 341.2 352.5 369.3 387.72.5 1.9 1.4 2.3 2.8 2.7
7,314.0 6,621.1 6,354.3 6,477.3 6,695.4 6,934.45.7 5.4 6.3 5.8 5.5 5.3
Year DPSMarshall Monteag 0.02Growthpoint Prop 2015 44.5Pick'N Pay Store 2015 98.5Pick'N Pay Hldgs 47.9Tsogo Sun Holdin 2014 29.0
24
Market Commentary
Current account balance (% GDP)Govt gross debt (% GDP)Govt net debt (% GDP)Nominal GDP (USDbn)GDP growth (%, constant prices)GDP per capita (USD)Inflation (%, end of period)
Dividends Type Last Cum dateFinal 26-Jan-15
Special Cash 20-Apr-15Final 08-Jun-15Final 08-Jun-15
Interim 08-Dec-14
30 Apr 2015
For South Africa, we include a hand-picked selection of JSE listed shares with African exposure. Thereare 60 companies included in the list, and the top 30 are shown here. This data is for informational andreference purposes, and thus we do not provide market commentary.
Please feel free to get in touch with us with any comments, suggestions, or queries relating to thisinformation.

African Alliance Pan-African Securities Research
Equity Research I Pan-Africa I Weekly Market Indicators
THE AFRICA WEEKLY
Johannesburg Stock Exchange (South African rand) South Africa
JSE ALSI Level % chg Level % chg % chg Company Week % chg PriceCurrent 54,440 11.83 H: 24-Apr-15 55,188 BSI Steel 16.0 0.58This week 54,687 -0.45 12.27 3.65 3.19 L: 15-Oct-14 46,673 Bell Equipment 15.4 9.69Prev week 54,262 0.78 12.03 -1.91 -1.14 Off peak -1.4% Metmar 14.1 0.89MTD 52,182 4.33 12.22 3.28 7.75 At High 0/60 Group Five 7.0 27.40YTD 49,771 9.38 11.57 -2.23 6.95 At Low 0/60 Pick N Pay 6.2 57.10
42,480 45.29% ZARm 47,221 Company Week % chg Price-16,914 57 USDm 3,990 Truworths International -6.7 86.72
95% Eqstra Holdings -6.4 3.7812,782 28 Mediclinic International -5.2 126.129,696 28 ZARbn 4,689 Tiger Brands -4.9 310.0-57.0% 0 USDbn 396 Aspen Pharmacare -4.8 362.0
Company ZAR'm % of totalNaspers 7,664 18.04MTN Group 6,526 15.36Aspen Pharmacare 3,068 7.22Standard Bank Group 2,901 6.83SABMiller 2,713 6.39
*The index is the NSE ALSI, an all share index ** Value Traded numbers are given in millions of South African Rands See the notes page for more information about calculations 30 Apr 2015 25
Index performance * ZAR/USD USD returns Top 5 gainersMarket highs and lows
Total value Value Traded / Mkt Cap (%)Turnover analysis ** Trading numbers Avg weekly value traded Top 5 decliners
Net value Stocks traded (absolute)Stocks traded (%)
Upside value Stocks up Total Market capDownside value Stocks downUpside/downside ratio Advance - Decline
Rebased Index Performance Top 5 (value) traders
-23%
-15%
-7%
1%
9%
17%
Apr-14 Jul-14 Oct-14 Jan-15 Apr-15
USD ZAR
0 2,000 4,000 6,000
24 Apr 2015
30-Apr
Market Cap (ZAR bn) : Current vs Peak

African Alliance Pan-African Securities Research
Equity Research I Pan-Africa I Weekly Market Indicators
THE AFRICA WEEKLY
Johannesburg Stock Exchange (South African rand) South Africa
Price Value Volume 6 mthsCompany Name Sector ZAR % chg Move ZAR 'm '000 High Low Off high YTD 12 mths ZAR m USD m Val (000)SABMiller BREW 636.0 -2.8 Down 2,713 4,239 680.5 555.1 -6.5 5.1 11.3 1,015,565 85,818 249,951Naspers MEDI 1,871 -2.6 Down 7,664 4,018 1,980 1,020 -5.5 23.5 88.6 775,327 65,517 886,869MTN Group TELE 239.0 3.5 Up 6,526 26,982 260.1 198.1 -8.1 7.9 13.4 450,153 38,039 487,651Firstrand BANK 56.83 -2.0 Down 1,804 31,650 58.00 38.90 -2.0 12.4 47.0 320,404 27,075 214,095Standard Bank Group BANK 174.6 -0.2 Down 2,901 16,617 176.3 125.4 -0.9 21.7 26.4 280,458 23,700 259,972Vodacom Group TELE 148.3 2.1 Up 1,883 12,456 154.9 121.6 -4.3 15.5 18.2 220,649 18,645 82,621Aspen Pharmacare PHAR 362.0 -4.8 Down 3,068 8,417 443.0 272.0 -18.3 -10.8 29.3 164,911 13,936 248,163Steinhoff Intl CONS 75.58 -3.5 Down 2,587 33,615 78.51 48.52 -3.7 27.2 38.4 138,777 11,727 298,577Absa Group BANK 190.6 -0.1 Down 942 4,931 199.5 152.0 -4.5 4.7 23.8 136,876 11,566 96,972Nedbank Group BANK 256.8 0.4 Up 1,008 3,923 261.4 213.0 -1.8 3.1 14.0 130,318 11,012 66,889Bidvest Group INVE 322.7 -0.4 Down 935 2,908 337.3 276.2 -4.3 6.2 11.8 105,754 8,936 94,148Mediclinic International PHAR 126.1 -5.2 Down 658 5,189 133.0 72.15 -5.2 25.3 71.6 104,312 8,815 63,917Shoprite Holdings CONS 170.2 1.3 Up 1,103 6,494 188.0 132.3 -9.5 1.2 -3.1 97,113 8,206 101,722Mondi INDU 241.2 -0.1 Down 1,104 4,511 250.0 166.9 -3.5 27.3 37.8 88,575 7,485 51,198Woolworths Holdings CONS 89.52 -1.6 Down 877 9,696 94.04 67.74 -4.8 16.1 25.2 67,435 5,698 105,833Mr Price Group CONS 254.3 -3.1 Down 684 2,683 282.5 157.5 -10.0 8.2 60.7 63,806 5,392 76,983Tiger Brands CONS 310.0 -4.9 Down 954 3,034 399.3 276.0 -22.4 -15.8 10.3 59,271 5,009 107,582Telkom SA TELE 82.00 -1.0 Down 405 4,952 85.00 35.83 -3.5 17.1 118.1 42,704 3,609 47,091Foschini Group CONS 176.2 -4.5 Down 831 4,616 199.0 107.7 -11.5 32.2 62.4 42,376 3,581 84,799Imperial Holdings INVE 199.5 3.4 Up 949 4,789 207.4 166.0 -3.8 7.8 1.8 41,886 3,539 55,127Truworths International CONS 86.72 -6.7 Down 476 5,307 95.50 65.70 -9.2 12.2 2.8 40,048 3,384 65,475Massmart Holdings CONS 150.0 -3.8 Down 151 984 173.5 117.0 -13.5 5.0 7.7 32,539 2,750 23,059Nampak INDU 42.65 -0.8 Down 257 6,045 45.70 35.80 -6.7 -2.2 8.8 29,735 2,513 28,626Pick N Pay CONS 57.10 6.2 Up 240 4,292 59.82 49.00 -4.5 8.5 -4.8 27,431 2,318 19,452Barloworld INVE 95.10 2.3 Up 261 2,739 114.9 84.51 -17.3 -0.7 -17.0 21,969 1,856 23,411AECI INDU 129.5 -4.1 Down 72 540 138.2 110.8 -6.3 -3.2 10.2 15,071 1,274 6,286Tongaat Hulett CONS 132.5 1.5 Up 128 972 174.0 121.1 -23.9 -23.4 6.0 14,374 1,215 12,577Oceana Group CONS 106.3 5.3 Up 31 297 115.0 70.00 -7.5 1.4 18.1 12,697 1,073 5,296Super Group TRPT 35.99 1.7 Up 36 1,010 37.10 28.20 -3.0 5.2 27.0 11,349 959 4,925Omnia Holdings INDU 164.1 -1.1 Down 64 383 242.0 164.1 -32.2 -9.3 -27.4 11,036 933 13,435
26
Weekly 12 Month Movement (% chg) Market cap
30 Apr 2015
African Alliance Pan-African Securities Research
Equity Research I Pan-Africa I Weekly Market Indicators
THE AFRICA WEEKLY
Stock Exchange of Mauritius (Mauritian Rupee) Mauritius
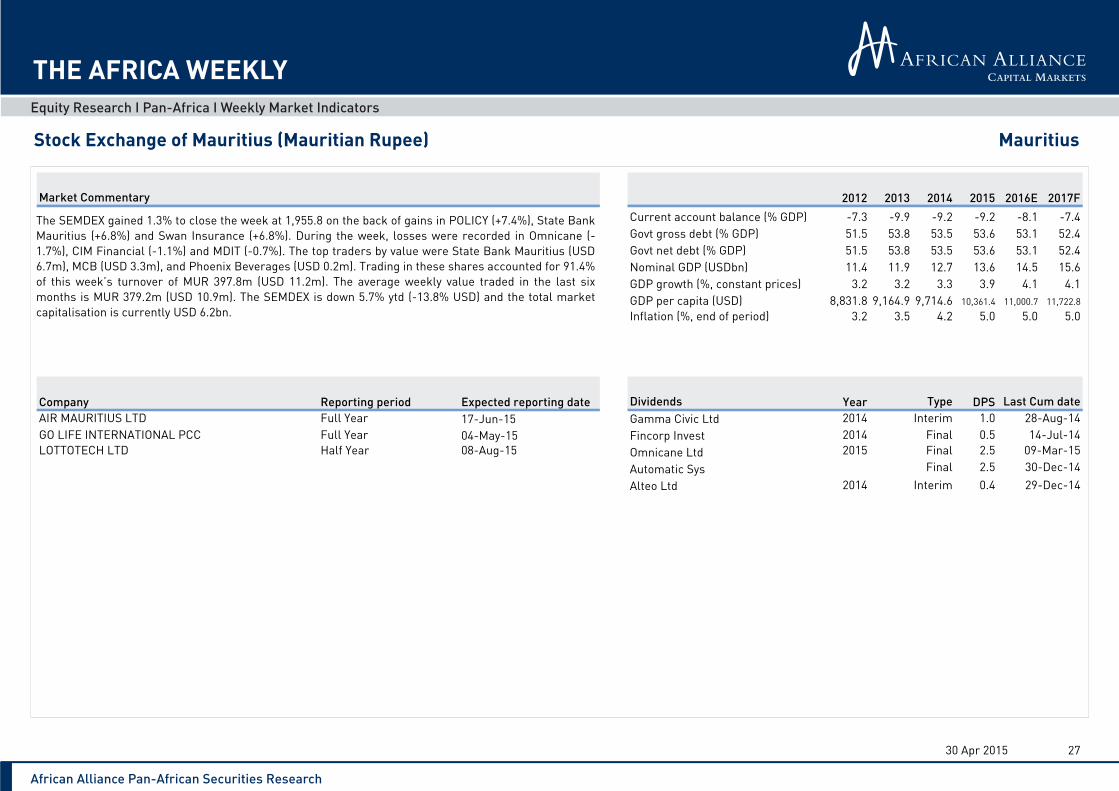
2012 2013 2014 2015 2016E 2017F-7.3 -9.9 -9.2 -9.2 -8.1 -7.451.5 53.8 53.5 53.6 53.1 52.451.5 53.8 53.5 53.6 53.1 52.411.4 11.9 12.7 13.6 14.5 15.6
3.2 3.2 3.3 3.9 4.1 4.18,831.8 9,164.9 9,714.6 10,361.4 11,000.7 11,722.8
3.2 3.5 4.2 5.0 5.0 5.0
Company Reporting period Expected reporting date Year DPSAIR MAURITIUS LTD Full Year 17-Jun-15 Gamma Civic Ltd 2014 1.0GO LIFE INTERNATIONAL PCC Full Year 04-May-15 Fincorp Invest 2014 0.5LOTTOTECH LTD Half Year 08-Aug-15 Omnicane Ltd 2015 2.5
Automatic Sys 2.5Alteo Ltd 2014 0.4
27
TypeInterim
FinalFinalFinal
Market Commentary
Govt net debt (% GDP)Nominal GDP (USDbn)GDP growth (%, constant prices)GDP per capita (USD)Inflation (%, end of period)
Current account balance (% GDP)Govt gross debt (% GDP)
Dividends Last Cum date28-Aug-14
30 Apr 2015
14-Jul-1409-Mar-1530-Dec-1429-Dec-14Interim
The SEMDEX gained 1.3% to close the week at 1,955.8 on the back of gains in POLICY (+7.4%), State BankMauritius (+6.8%) and Swan Insurance (+6.8%). During the week, losses were recorded in Omnicane (-1.7%), CIM Financial (-1.1%) and MDIT (-0.7%). The top traders by value were State Bank Mauritius (USD6.7m), MCB (USD 3.3m), and Phoenix Beverages (USD 0.2m). Trading in these shares accounted for 91.4%of this week’s turnover of MUR 397.8m (USD 11.2m). The average weekly value traded in the last sixmonths is MUR 379.2m (USD 10.9m). The SEMDEX is down 5.7% ytd (-13.8% USD) and the total marketcapitalisation is currently USD 6.2bn.

African Alliance Pan-African Securities Research
Equity Research I Pan-Africa I Weekly Market Indicators
THE AFRICA WEEKLY
Stock Exchange of Mauritius (Mauritian Rupee) Mauritius
SEMDEX Level % chg Level % chg % chg Company Week % chg PriceCurrent 1,955.8 34.75 H: 08-Oct-14 2,170.7 POLICY 7.4 7.82This week 1,931.3 1.27 36.03 3.67 4.98 L: 24-Apr-15 1,930.4 State Bank Mauritius 6.8 0.94Prev week 1,949.4 -0.93 36.20 0.49 -0.45 Off peak -9.9% Swan Insurance 6.8 345.0MTD 1,975.2 -0.98 36.46 4.92 3.89 At High 2/44 LOTTOTECH 4.2 5.94YTD 2,073.7 -5.68 31.75 -8.63 -13.83 At Low 5/44 Phoenix Beverages 2.7 300.0
397.8 9.20% MURm 379.2 Company Week % chg Price366.2 37 USDm 10.9 Go Life (USD) -20.0 0.04
84% Mauritius Union Assurance -2.6 74.00378.3 10 Omnicane -1.7 74.00
12.1 12 MURm 216,183 CIM Financial -1.1 8.883026.6% -2 USDm 6,221 MDIT -0.7 5.32
Company MUR'000 % of totalState Bank Mauritius 237,724.2 59.76MCB 118,399.6 29.76Phoenix Beverages 7,285.2 1.83Sun Resorts 6,945.6 1.75Swan Insurance 3,484.5 0.88
*The index is the SEMDEX, an all share index ** Value Traded numbers are given in millions of Mauritian Rupees See the notes page for more information about calculations 30 Apr 2015 28
Total value Value Traded / Mkt Cap (%)
MUR/USD USD returnsIndex performance *
Turnover analysis ** Avg weekly value traded
Market highs and lowsTop 5 gainers
Top 5 decliners
Advance - Decline
Stocks traded (%)Stocks up Total Market cap
Trading numbers
Top 5 (value) tradersRebased Index Performance
Net value Stocks traded (absolute)
Upside valueDownside value Stocks downUpside/downside ratio
-33%
-25%
-17%
-9%
-1%
7%
Apr-14 Jul-14 Oct-14 Jan-15 Apr-15
USD MUR
0 100,000 200,000 300,000
08 Oct 2014
30-Apr
Market Cap (MUR bn) : Current vs Peak

African Alliance Pan-African Securities Research
Equity Research I Pan-Africa I Weekly Market Indicators
THE AFRICA WEEKLY
Stock Exchange of Mauritius (Mauritian Rupee) Mauritius
Price Value Volume 6 mthsCompany Name Sector MUR % chg Move MUR '000 '000 High Low Off high YTD 12 mths MUR m USD m Val (000)MCB BANK 201.3 1.6 Up 118,400 593.44 223.0 195.0 -9.8 1.6 -7.9 50,388 1,450 3,694.9State Bank Mauritius BANK 0.94 6.8 Up 237,724 260,928.44 1.08 0.88 -13.0 -7.8 -8.7 28,552 822 1,558.5CIEL INSU 6.82 - Flat 1,894 277.75 7.80 6.00 -12.6 FALSE 5.2 10,750 309 492.8Alteo LTD CONS 32.50 -0.3 Down 401 12.31 37.75 30.10 -13.9 -4.4 -7.9 10,351 298 83.0ENL Land AGRI 44.90 -0.2 Down 435 9.30 54.50 42.50 -17.6 -2.4 -12.4 10,350 298 48.5New Mauritius Hotels HOTL 61.00 - Flat 2,912 47.74 89.00 57.25 -31.5 -23.5 -29.5 9,847 283 1,428.9Ireland Blyth INVE 115.0 -0.2 Down 587 5.10 116.0 100.0 -0.9 1.8 7.5 8,215 236 99.5Rogers & Co INVE 29.20 -0.7 Down 1,227 42.02 197.0 19.33 -85.2 12.3 49.5 7,360 212 172.9Terra Mauricia INVE 31.45 -0.2 Down 619 19.64 37.50 30.30 -16.1 -4.7 -15.0 7,156 206 152.5Lux Island Resorts HOTL 58.50 -0.4 Down 2,312 39.51 61.50 37.60 -4.9 -2.5 46.3 6,671 192 269.8CIM Financial BANK 8.88 -1.1 Down 466 52.18 10.00 7.70 -11.2 -1.3 12.1 6,043 174 189.8Omnicane AGRI 74.00 -1.7 Down 2,920 39.20 89.00 74.00 -16.9 -15.4 -14.7 4,959 143 33.9Phoenix Beverages BREW 300.0 2.7 Up 7,285 24.30 300.0 188.0 - 29.9 58.7 4,934 142 139.5Sun Resorts HOTL 39.00 0.5 Up 6,946 178.77 46.95 34.00 -16.9 -13.3 -2.3 4,422 127 126.6Gamma Civic BUIL 32.50 - Flat 59 1.80 53.00 31.00 -38.7 -20.7 -25.3 4,331 125 1,216.0Lottotech OILG 135.0 - Flat 405 3.00 145.0 123.0 -6.9 -2.9 -6.6 3,959 114 30.9Bramer Bank BANK 4.30 7.20 3.78 -40.3 -40.3 -39.4 3,876 112 66.0Promotion & Development INVE 95.00 - Flat 95 1.00 102.8 82.00 -7.5 -1.6 13.1 3,695 106 62.6Swan Insurance INSU 345.0 6.8 Up 3,485 10.10 345.0 296.0 - 3.0 16.6 2,855 82 24.9Dale Capital (USD) INVE 2.80 - Flat 30 0.30 2.80 2.40 0.0 - -20.0 2,508 72 0.1United Basalt Products INDU 86.00 - Flat 43 0.50 89.00 73.50 -3.4 9.2 3.0 2,280 66 74.1MDIT INVE 5.32 -0.7 Down 2,072 389.45 6.06 5.30 -12.2 -8.6 -6.0 2,252 65 45.2Fincorp CONS 21.50 - Flat 1,262 58.71 24.00 18.50 -10.4 -10.4 13.2 2,222 64 24.7LOTTOTECH INVE 5.94 4.2 Up 2,820 484.92 12.25 5.60 -51.5 FALSE 2,020 58 92.0INNODIS CONS 53.00 - Flat 133 2.51 62.00 53.00 -14.5 -5.4 -6.2 1,947 56 31.5POLICY INVE 7.82 7.4 Up 1,305 175.40 8.20 6.14 -4.6 4.3 -2.5 1,775 51 406.6Mauritius Union Assurance INSU 74.00 -2.6 Down 533 7.18 135.5 66.50 -45.4 5.0 9.2 1,483 43 79.9Air Mauritius TRPT 13.80 - Flat 233 16.85 18.20 13.10 -24.2 -21.6 -14.8 1,412 41 37.4Harel Mallac INVE 101.5 - Flat 2 0.02 120.3 101.5 -15.6 -7.3 -14.7 1,143 33 0.5Belle Mare INVE 258.0 - Flat 103 0.40 302.0 250.0 -14.6 -2.6 -0.8 1,101 32 5.1
2930 Apr 2015
Movement (% chg) Market cap12 MonthWeekly

African Alliance Pan-African Securities Research
Equity Research I Pan-Africa I Weekly Market Indicators
THE AFRICA WEEKLY
Botswana Stock Exchange (Botswana Pula) Botswana
2012 2013 2014 2015 2016E 2017F-3.8 10.4 5.8 4.4 2.4 2.119.2 16.9 14.8 13.0 11.3 9.9
14.6 14.8 16.3 17.7 19.1 20.94.3 5.9 4.4 4.2 4.0 4.1
7,081.7 7,119.9 7,749.8 8,331.5 8,849.7 9,568.57.4 4.1 5.4 5.4 5.3 5.3
Company Reporting period Expected reporting date Year TypeCHOBE HOLDINGS LTD Full Year 01-Jun-15 New African Prop 2015 8.6FSG LTD Full Year 28-May-15 Cresta Marakanel 2015 6.0FURNITURE MART Half Year 29-Apr-15 Turnstar 2015 8.2IMARA HOLDINGS LTD Full Year 31-Jul-15 African Bk Hldgs 4.5
Standard Charter 2015 10.1
30
Current account balance (% GDP)Govt gross debt (% GDP)Govt net debt (% GDP)Nominal GDP (USDbn)GDP growth (%, constant prices)GDP per capita (USD)Inflation (%, end of period)
Dividends
Market Commentary
AmountRegular CashRegular CashRegular CashRegular Cash
Interim
30 Apr 2015
Last Cum date18-May-1511-May-1518-May-1522-Apr-1409-Feb-15
The BSE DCI gained 1.8% to close the week at 10,017.2 on the back of gains in Letshego (+16.7%), NewAfrica Properties (+2.3%) and Turnstar (+1.8%). During the week, losses were recorded in ImaraBotswana (-0.3%). The top traders by value were Letshego (USD 5.7m), Imara Botswana (USD 0.2m) andChoppies (USD 0.1m). Trading in these shares accounted for 97.1% of this week’s turnover of BWP 34.9m(USD 6.2m). The average weekly value traded in the last six months is BWP 375.7m (USD 38.6m). The BSEDCI is up 5.4% ytd (+2.9% USD) and the total market capitalisation is currently USD 4.96bn.

African Alliance Pan-African Securities Research
Equity Research I Pan-Africa I Weekly Market Indicators
THE AFRICA WEEKLY
Botswana Stock Exchange (Botswana Pula) Botswana
BSE DCI Level % chg Level % chg % chg Company Week % chg PriceCurrent 10,017.2 9.74 H: 30-Apr-15 10,017.2 Letshego 16.7 3.07This week 9,838.5 1.82 10.00 2.70 4.57 L: 05-May-14 8,834.8 New Africa Properties 2.3 2.25Prev week 9,804.2 0.35 9.91 -0.89 -0.55 Off peak 0.0% Turnstar 1.8 2.25MTD 9,693.9 3.33 9.99 2.60 6.02 At High 2/24 Choppies 1.5 4.04YTD 9,501.6 5.43 9.51 -2.38 2.92 At Low 1/24 Cresta 1.1 0.96
34.9 3.61% BWPm 42.9 Company Week % chg Price30.5 19 USDm 4.4 Imara Botswana -0.3 2.99
79% --32.6 11 --
2.0 1 BWPm 48,354 --1494.5% 10 USDm 4,966 --
Company BWP'000 % of totalLetshego 31,167.4 89.32Imara Botswana 2,041.8 5.85Choppies 612.0 1.75New Africa Properties 395.1 1.13Barclays Botswana 158.0 0.45
*The index is the DCI, the domestic companies index ** Value Traded numbers are given in millions of Pula See the notes page for more information about calculations 30 Apr 2015 31
Top 5 decliners
Top 5 (value) traders
Stocks traded (%)
Trading numbersTotal valueNet value
Upside value
Upside/downside ratioDownside value
Advance - Decline
Turnover analysis **
Top 5 gainers
Avg weekly value traded
Index performance *
Total Market cap
Value Traded / Mkt Cap (%)Stocks traded (absolute)
Stocks down
USD returnsBWP/USDMarket highs and lows
Stocks up
Rebased Index Performance
-16%
-10%
-4%
2%
8%
14%
20%
Apr-14 Jul-14 Oct-14 Jan-15 Apr-15
USD BWP
0 20,000 40,000 60,000
30 Apr 2015
30 Apr 2015
Market Cap (BWPm) : Current vs Peak

African Alliance Pan-African Securities Research
Equity Research I Pan-Africa I Weekly Market Indicators
THE AFRICA WEEKLY
Botswana Stock Exchange (Botswana Pula) Botswana
Price Value Volume 6 mthsCompany Name Sector BWP % chg Move BWP '000 '000 High Low Off high YTD 12 mths BWP m Val (000)FNB Botswana BANK 3.79 0.5 Up 81 21.53 3.81 3.47 -0.5 4.7 8.6 9,716 998 608.1Letshego BANK 3.07 16.7 Up 31,167 10,744.15 3.07 1.98 0.0 15.4 41.5 6,682 686 1,619.9Choppies CONS 4.04 1.5 Up 612 152.45 4.20 3.97 -3.8 -0.5 -0.2 4,744 487 669.1Sechaba BREW 28.70 - Flat 58 2.02 29.50 21.76 -2.7 2.1 31.8 3,818 392 391.3Stanchart Botswana BANK 12.55 - Flat 5 0.38 12.60 11.74 -0.4 -0.2 6.9 3,744 385 79.4BIHL Botswana INSU 12.28 0.2 Up 140 11.39 12.28 10.70 0.0 6.7 14.8 3,452 354 61.2Barclays Botswana BANK 4.05 - Flat 158 39.01 4.80 3.40 -15.6 17.4 -4.9 3,451 354 46.9Sefalana CONS 11.52 0.3 Up 82 7.14 11.52 7.40 -0.0 24.8 48.5 2,140 220 335.2ABCH Botswana BANK 7.14 7.20 7.00 -0.8 - 38.1 1,834 188 -New Africa Properties PROP 2.25 2.3 Up 395 175.60 2.25 2.05 - 3.7 6.6 1,360 140 15.8Engen Botswana OILG 8.50 - Flat 59 6.99 10.15 8.50 -16.3 -10.5 -8.8 1,358 139 19.6Turnstar PROP 2.25 1.8 Up 47 20.71 2.25 1.85 - 8.2 19.7 1,287 132 219.2Furnmart CONS 1.85 2.31 1.85 -19.9 -12.3 -19.6 1,122 115 4.1Wilderness HOTL 3.51 0.3 Up 8 2.40 3.51 2.70 0.0 11.4 35.0 811 83 2.2Letlole La Rona PROP 2.18 - Flat 4 1.84 2.28 1.85 -4.4 1.4 17.8 610 63 106.8Primetime PROP 2.71 - Flat 2 0.72 2.85 2.30 -4.9 4.2 16.3 488 50 22.0Chobe HOTL 4.61 0.2 Up 3 0.60 4.65 3.40 -0.9 8.0 35.6 412 42 10.2RDCP PROP 2.21 2.21 2.00 -0.0 7.8 10.5 391 40 34.4FSG INSU 2.45 - Flat 8 3.40 2.45 2.34 -0.0 3.4 2.9 296 30 6.8G4S CONS 3.38 0.3 Up 17 5.09 3.75 2.39 -9.9 -9.1 32.5 270 28 4.6Cresta HOTL 0.96 1.1 Up 5 4.86 0.96 0.80 0.0 7.9 20.0 177 18 1.5Imara Botswana INVE 2.99 -0.3 Down 2,042 682.88 3.00 1.70 -0.3 42.4 86.9 177 18 143.1RPC Data TELE 0.30 0.00 0.00 - - 9 1 -Olympia Capital (Botswana) BUIL 0.20 0.00 0.00 - - 6 1 -
32
12 MonthWeeklyUSD m
Market capMovement (% chg)
30 Apr 2015

African Alliance Pan-African Securities Research
Equity Research I Pan-Africa I Weekly Market Indicators
THE AFRICA WEEKLY
Zimbabwe Stock Exchange (US Dollar) Zimbabwe
2012 2013 2014 2015 2016E 2017F-24.4 -27.4 -28.1 -26.2 -22.4 -19.656.7 55.2 58.5 58.5 55.6 54.9
12.5 13.2 13.7 14.4 15.3 16.310.6 3.3 3.1 3.2 3.9 4.3
961.4 1,006.8 1,036.1 1,072.6 1,130.4 1,193.02.9 0.3 1.2 1.7 2.0 2.5
Company Reporting period Expected reporting date Year DPSCAFCA LTD Half Year 13-May-15 Padenga Holdings 2015 0.00DELTA CORPORATION LTD Full Year 08-May-15 Natl Foods Hold 2015 0.03ECONET WIRELESS ZIMBABWE LTD Full Year 06-May-15 Econet Wireless 2014 0.01HIPPO VALLEY ESTATES LTD Full Year 29-May-15 Meikles 0.02MASHONALAND HOLDINGS LTD Half Year 29-May-15 Innscor Africa 2015 0.01MEDTECH HOLDINGS LTD Full Year 07-May-15SEED CO Full Year 22-May-15TA HOLDINGS LTD Full Year 20-May-15ZECO HOLDINGS LTD Full Year 08-May-15
33
Market Commentary
Current account balance (% GDP)Govt gross debt (% GDP)Govt net debt (% GDP)Nominal GDP (USDbn)GDP growth (%, constant prices)GDP per capita (USD)Inflation (%, end of period)
30 Apr 2015
10-Nov-1419-Jan-15
Interim
Dividends Last Cum date15-Apr-1523-Mar-15
TypeRegular CashRegular CashRegular CashRegular Cash
23-Mar-15
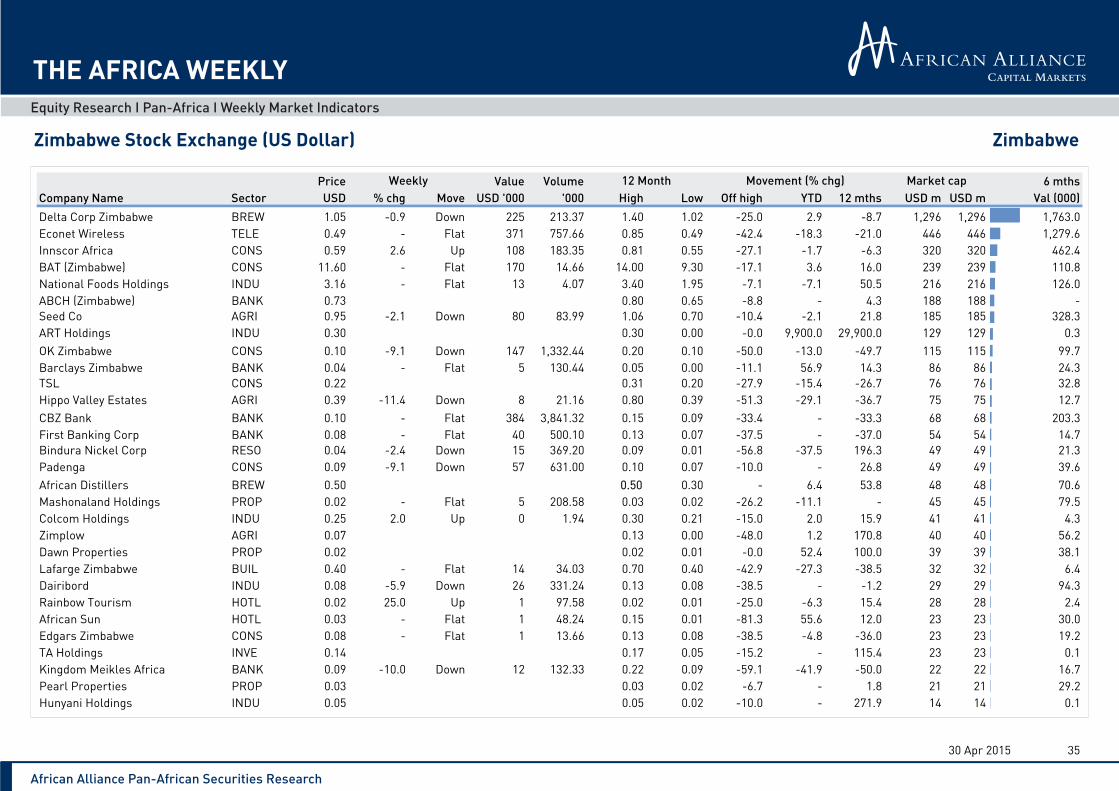
The ZSE Industrial declined 0.8% to close the week at 156.3 on the back of losses in Hippo Valley Estates(USD) (-11.4%), OK Zimbabwe (USD) (-9.1%), Seed Co (USD) (-2.1%). During the week, gains wererecorded in Innscor Africa (USD) (+2.6%).The top traders by value were CBZ Bank (USD 384.1k), EconetWireless (USD 371.3k), and Delta Corp Zimbabwe (USD 225.0k). Trading in these shares accounted for56.8% of this week’s turnover of USD 1.7m. The average weekly value traded in the last six months is USD5.1m. The ZSE Industrial is down 4.0% ytd and the total market capitalisation is currently USD 4.2bn.

African Alliance Pan-African Securities Research
Equity Research I Pan-Africa I Weekly Market Indicators
THE AFRICA WEEKLY
Zimbabwe Stock Exchange (US Dollar) Zimbabwe
ZSE INDUST Level % chg Level % chg % chg Company Week % chg PriceCurrent 156.3 1.00 H: 05-Sep-14 201.3 Truworths Zimbabwe 63.6 0.02This week 157.6 -0.83 1.00 0.00 -0.83 L: 09-Apr-15 155.3 Rainbow Tourism 25.0 0.02Prev week 156.6 0.63 1.00 0.00 0.63 Off peak -22.4% CFI Holdings 25.0 0.02MTD 158.2 -1.24 1.00 0.00 -1.24 At High 1/74 Zimre Property 23.5 0.01YTD 162.8 -4.01 1.00 0.00 -4.01 At Low 0/74 Astra Industries 4.9 0.04
1.7 2.05% USDm 5.1 Company Week % chg Price-0.5 31 USDm 5.1 ZB Financial Holdings -16.7 0.03
42% Hippo Valley Estates -11.4 0.390.1 7 Kingdom Meikles Africa -10.0 0.090.6 9 USDm 4,209 Padenga -9.1 0.09
-78.2% -2 USDm 4,209 OK Zimbabwe -9.1 0.10
Company USD'000 % of totalCBZ Bank 384.1 22.27Econet Wireless 371.3 21.52Delta Corp Zimbabwe 225.0 13.05BAT (Zimbabwe) 170.0 9.86OK Zimbabwe 146.6 8.50
*The index is the ZSE industrial, an all share index ** Value Traded numbers are given in millions of USD See the notes page for more information about calculations 30 Apr 2015 34
Index performance * USD/USD USD returns Top 5 gainers (Top 40)
Stocks traded (%)Upside value Stocks up
Rebased Index Performance
Downside value Stocks downUpside/downside ratio Advance - Decline
Turnover analysis ** Trading numbers Avg weekly value traded Top 5 decliners (Top 40)
Market highs and lows
Top 5 (value) traders
Total Market cap
Total value Value Traded / Mkt Cap (%)Net value Stocks traded (absolute)
-24%
-15%
-6%
3%
12%
21%
Apr-14 Jul-14 Oct-14 Jan-15 Apr-15
USD USD
0 2,000 4,000 6,000
05 Sep 2014
30-Apr
Market Cap (USD m) : Current vs Peak
African Alliance Pan-African Securities Research
Equity Research I Pan-Africa I Weekly Market Indicators
THE AFRICA WEEKLY
Zimbabwe Stock Exchange (US Dollar) Zimbabwe
Price Value Volume 6 mthsCompany Name Sector USD % chg Move USD '000 '000 High Low Off high YTD 12 mths USD m USD m Val (000)Delta Corp Zimbabwe BREW 1.05 -0.9 Down 225 213.37 1.40 1.02 -25.0 2.9 -8.7 1,296 1,296 1,763.0Econet Wireless TELE 0.49 - Flat 371 757.66 0.85 0.49 -42.4 -18.3 -21.0 446 446 1,279.6Innscor Africa CONS 0.59 2.6 Up 108 183.35 0.81 0.55 -27.1 -1.7 -6.3 320 320 462.4BAT (Zimbabwe) CONS 11.60 - Flat 170 14.66 14.00 9.30 -17.1 3.6 16.0 239 239 110.8National Foods Holdings INDU 3.16 - Flat 13 4.07 3.40 1.95 -7.1 -7.1 50.5 216 216 126.0ABCH (Zimbabwe) BANK 0.73 0.80 0.65 -8.8 - 4.3 188 188 -Seed Co AGRI 0.95 -2.1 Down 80 83.99 1.06 0.70 -10.4 -2.1 21.8 185 185 328.3ART Holdings INDU 0.30 0.30 0.00 -0.0 9,900.0 29,900.0 129 129 0.3OK Zimbabwe CONS 0.10 -9.1 Down 147 1,332.44 0.20 0.10 -50.0 -13.0 -49.7 115 115 99.7Barclays Zimbabwe BANK 0.04 - Flat 5 130.44 0.05 0.00 -11.1 56.9 14.3 86 86 24.3TSL CONS 0.22 0.31 0.20 -27.9 -15.4 -26.7 76 76 32.8Hippo Valley Estates AGRI 0.39 -11.4 Down 8 21.16 0.80 0.39 -51.3 -29.1 -36.7 75 75 12.7CBZ Bank BANK 0.10 - Flat 384 3,841.32 0.15 0.09 -33.4 - -33.3 68 68 203.3First Banking Corp BANK 0.08 - Flat 40 500.10 0.13 0.07 -37.5 - -37.0 54 54 14.7Bindura Nickel Corp RESO 0.04 -2.4 Down 15 369.20 0.09 0.01 -56.8 -37.5 196.3 49 49 21.3Padenga CONS 0.09 -9.1 Down 57 631.00 0.10 0.07 -10.0 - 26.8 49 49 39.6African Distillers BREW 0.50 0.50 0.30 - 6.4 53.8 48 48 70.6Mashonaland Holdings PROP 0.02 - Flat 5 208.58 0.03 0.02 -26.2 -11.1 - 45 45 79.5Colcom Holdings INDU 0.25 2.0 Up 0 1.94 0.30 0.21 -15.0 2.0 15.9 41 41 4.3Zimplow AGRI 0.07 0.13 0.00 -48.0 1.2 170.8 40 40 56.2Dawn Properties PROP 0.02 0.02 0.01 -0.0 52.4 100.0 39 39 38.1Lafarge Zimbabwe BUIL 0.40 - Flat 14 34.03 0.70 0.40 -42.9 -27.3 -38.5 32 32 6.4Dairibord INDU 0.08 -5.9 Down 26 331.24 0.13 0.08 -38.5 - -1.2 29 29 94.3Rainbow Tourism HOTL 0.02 25.0 Up 1 97.58 0.02 0.01 -25.0 -6.3 15.4 28 28 2.4African Sun HOTL 0.03 - Flat 1 48.24 0.15 0.01 -81.3 55.6 12.0 23 23 30.0Edgars Zimbabwe CONS 0.08 - Flat 1 13.66 0.13 0.08 -38.5 -4.8 -36.0 23 23 19.2TA Holdings INVE 0.14 0.17 0.05 -15.2 - 115.4 23 23 0.1Kingdom Meikles Africa BANK 0.09 -10.0 Down 12 132.33 0.22 0.09 -59.1 -41.9 -50.0 22 22 16.7Pearl Properties PROP 0.03 0.03 0.02 -6.7 - 1.8 21 21 29.2Hunyani Holdings INDU 0.05 0.05 0.02 -10.0 - 271.9 14 14 0.1
35
Weekly 12 Month Movement (% chg) Market cap
30 Apr 2015

African Alliance Pan-African Securities Research
Equity Research I Pan-Africa I Weekly Market Indicators
THE AFRICA WEEKLY
Lusaka Stock Exchange (Zambian Kwacha) Zambia
2012 2013 2014 2015 2016E 2017F3.1 0.7 1.9 2.3 2.6 2.1
25.5 28.7 32.4 31.4 31.2 31.520.0 24.9 28.6 29.3 29.4 29.724.9 26.8 25.6 28.9 31.8 34.9
6.8 6.7 6.5 7.2 7.7 7.01,771.9 1,845.4 1,705.0 1,859.8 1,985.9 2,106.4
7.3 7.1 8.5 7.0 6.0 5.0
Company Reporting period Expected reporting date Year DPSBRITISH AMERICAN TOBACCO ZAM Half Year 23-Jul-15 Copperbelt Energ 2015 0.06AIRTEL NETWORKS ZAMBIA PLC Full Year 22-May-15 Zamefa 2015 14.0NATIONAL BREWERIES PLC Full Year 30-Jun-15 Puma Energy Zamb 2013 0.01ZAMBIA SUGAR PLC Full Year 11-May-15 Zanaco 0.00
Standard Charter 2015 0.06
36
Current account balance (% GDP)Govt gross debt (% GDP)Govt net debt (% GDP)Nominal GDP (USDbn)GDP growth (%, constant prices)GDP per capita (USD)Inflation (%, end of period)
Market Commentary
Dividends Last Cum date24-Feb-15
TypeInterim
06-May-1525-Sep-1328-Apr-15
Regular CashRegular Cash
Final22-Apr-15Final
30 Apr 2015
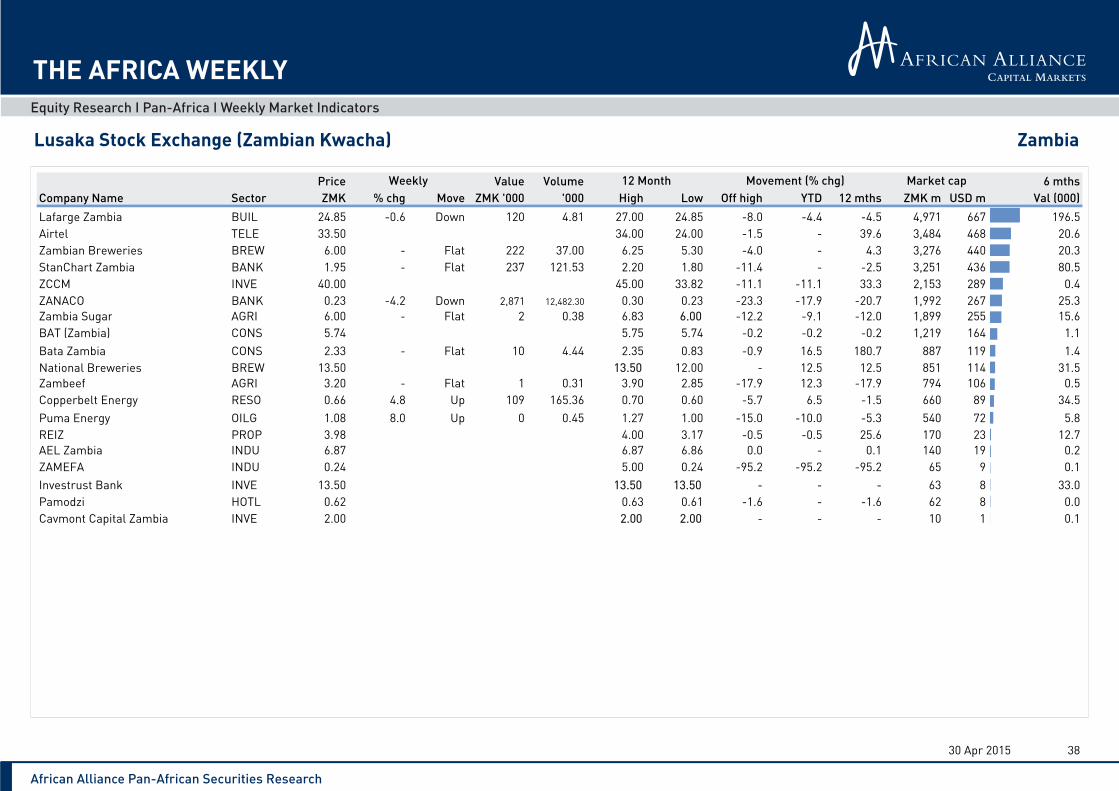
The LuSE ALSI declined 0.1% to close the week at 5,994.0 on the back of losses in ZANACO (-4.2%) andLafarge Zambia (-0.6%). During the week, gains were recorded in Puma Energy (+8.0%) and CopperbeltEnergy (+4.8%).The top traders by value were ZANACO (USD 388.2k), StanChart Zambia (USD 32.0k) andZambian Breweries (USD 30.0k). Trading in these shares accounted for 93.2% of this week’s turnover ofZMK 3.6m (USD 483.2k). The average weekly value traded in the last six months is ZMK 5.0m (USD676.6k). The LuSE ALSI is down 2.7% ytd (-16.7% USD) and the total market capitalisation is currentlyUSD 3.6bn.

African Alliance Pan-African Securities Research
Equity Research I Pan-Africa I Weekly Market Indicators
THE AFRICA WEEKLY
Lusaka Stock Exchange (Zambian Kwacha) Zambia
LuSE ALSI Level % chg Level % chg % chg Company Week % chg PriceCurrent 5,994.0 7.45 H: 21-Jan-15 6,287.0 Puma Energy 8.0 1.08This week 6,000.8 -0.11 7.34 -1.51 -1.62 L: 02-May-14 5,925.2 Copperbelt Energy 4.8 0.66Prev week 6,106.7 -1.73 7.42 1.10 -0.65 Off peak -4.7% --MTD 6,099.1 -1.72 7.58 1.74 -0.01 At High 3/19 --YTD 6,160.7 -2.70 6.38 -14.43 -16.74 At Low 3/19 --
3.6 0.67% ZMKm 3.6 Company Week % chg Price-2.9 9 USDm 0.5 ZANACO -4.2 0.23
47% Lafarge Zambia -0.6 24.850.1 2 --3.0 2 ZMKm 26,487 --
-96% 0 USDm 3,554 --
Company ZMK'000 % of totalZANACO 2,871 80.35StanChart Zambia 237 6.63Zambian Breweries 222 6.21Lafarge Zambia 120 3.35Copperbelt Energy 109 3.06
*The index is the LuSE, an all share index ** Value Traded numbers are given in millions of Zambian Kwacha See the notes page for more information about calculations 30 Apr 2015 37
Net value Stocks traded (absolute)
Avg weekly value traded
Top 5 gainers
Top 5 (value) tradersRebased Index Performance
Upside value Stocks up Total Market capStocks traded (%)
Downside value Stocks downUpside/downside ratio Advance - Decline
Total value Value Traded / Mkt Cap (%)
ZMK/USD USD returnsMarket highs and lows
Top 5 decliners
Index performance *
Turnover analysis ** Trading numbers
-28%
-20%
-12%
-4%
4%
12%
Apr-14 Jul-14 Oct-14 Jan-15 Apr-15
USD ZMK
0 10,000 20,000 30,000
21 Jan 2015
30-Apr
Market Cap (ZMK bn) : Current vs Peak
African Alliance Pan-African Securities Research
Equity Research I Pan-Africa I Weekly Market Indicators
THE AFRICA WEEKLY
Lusaka Stock Exchange (Zambian Kwacha) Zambia
Price Value Volume 6 mthsCompany Name Sector ZMK % chg Move ZMK '000 '000 High Low Off high YTD 12 mths ZMK m USD m Val (000)Lafarge Zambia BUIL 24.85 -0.6 Down 120 4.81 27.00 24.85 -8.0 -4.4 -4.5 4,971 667 196.5Airtel TELE 33.50 34.00 24.00 -1.5 - 39.6 3,484 468 20.6Zambian Breweries BREW 6.00 - Flat 222 37.00 6.25 5.30 -4.0 - 4.3 3,276 440 20.3StanChart Zambia BANK 1.95 - Flat 237 121.53 2.20 1.80 -11.4 - -2.5 3,251 436 80.5ZCCM INVE 40.00 45.00 33.82 -11.1 -11.1 33.3 2,153 289 0.4ZANACO BANK 0.23 -4.2 Down 2,871 12,482.30 0.30 0.23 -23.3 -17.9 -20.7 1,992 267 25.3Zambia Sugar AGRI 6.00 - Flat 2 0.38 6.83 6.00 -12.2 -9.1 -12.0 1,899 255 15.6BAT (Zambia) CONS 5.74 5.75 5.74 -0.2 -0.2 -0.2 1,219 164 1.1Bata Zambia CONS 2.33 - Flat 10 4.44 2.35 0.83 -0.9 16.5 180.7 887 119 1.4National Breweries BREW 13.50 13.50 12.00 - 12.5 12.5 851 114 31.5Zambeef AGRI 3.20 - Flat 1 0.31 3.90 2.85 -17.9 12.3 -17.9 794 106 0.5Copperbelt Energy RESO 0.66 4.8 Up 109 165.36 0.70 0.60 -5.7 6.5 -1.5 660 89 34.5Puma Energy OILG 1.08 8.0 Up 0 0.45 1.27 1.00 -15.0 -10.0 -5.3 540 72 5.8REIZ PROP 3.98 4.00 3.17 -0.5 -0.5 25.6 170 23 12.7AEL Zambia INDU 6.87 6.87 6.86 0.0 - 0.1 140 19 0.2ZAMEFA INDU 0.24 5.00 0.24 -95.2 -95.2 -95.2 65 9 0.1Investrust Bank INVE 13.50 13.50 13.50 - - - 63 8 33.0Pamodzi HOTL 0.62 0.63 0.61 -1.6 - -1.6 62 8 0.0Cavmont Capital Zambia INVE 2.00 2.00 2.00 - - - 10 1 0.1
38
Weekly Movement (% chg) Market cap12 Month
30 Apr 2015
African Alliance Pan-African Securities Research
Equity Research I Pan-Africa I Weekly Market Indicators
THE AFRICA WEEKLY
Malawi Stock Exchange (Malawian Kwacha) Malawi
2012 2013 2014 2015 2016E 2017F-4.5 -2.8 -6.0 -5.2 -3.8 -3.753.4 72.9 57.9 48.6 42.2 37.749.7 64.9 53.7 45.5 39.5 35.4
4.2 3.8 4.4 5.0 5.6 6.21.9 5.2 5.7 6.0 5.5 5.2
251.1 223.4 250.4 275.1 299.4 325.834.6 23.5 14.7 9.6 6.3 5.2
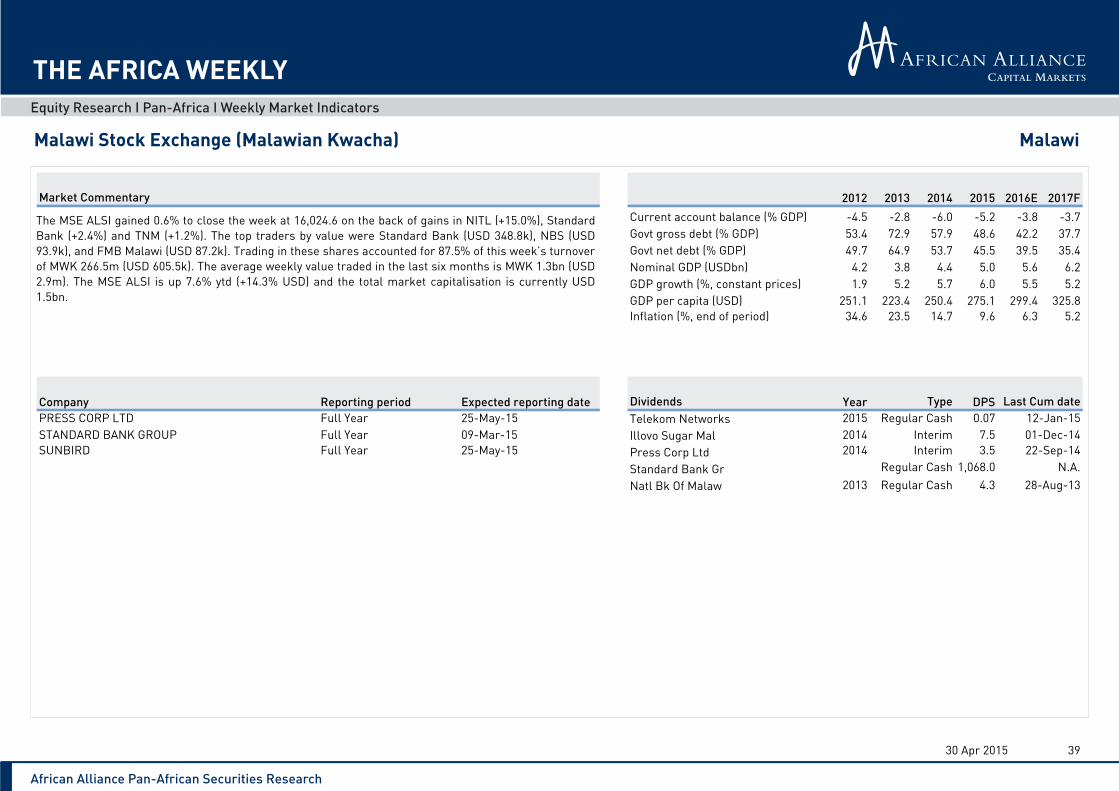
Company Reporting period Expected reporting date Year DPSPRESS CORP LTD Full Year 25-May-15 Telekom Networks 2015 0.07STANDARD BANK GROUP Full Year 09-Mar-15 Illovo Sugar Mal 2014 7.5SUNBIRD Full Year 25-May-15 Press Corp Ltd 2014 3.5
Standard Bank Gr 1,068.0Natl Bk Of Malaw 2013 4.3
39
TypeRegular Cash
InterimInterim
Regular Cash
Market Commentary
Govt net debt (% GDP)Nominal GDP (USDbn)GDP growth (%, constant prices)GDP per capita (USD)Inflation (%, end of period)
Current account balance (% GDP)Govt gross debt (% GDP)
Dividends Last Cum date12-Jan-15
30 Apr 2015
01-Dec-1422-Sep-14
N.A.28-Aug-13Regular Cash
The MSE ALSI gained 0.6% to close the week at 16,024.6 on the back of gains in NITL (+15.0%), StandardBank (+2.4%) and TNM (+1.2%). The top traders by value were Standard Bank (USD 348.8k), NBS (USD93.9k), and FMB Malawi (USD 87.2k). Trading in these shares accounted for 87.5% of this week’s turnoverof MWK 266.5m (USD 605.5k). The average weekly value traded in the last six months is MWK 1.3bn (USD2.9m). The MSE ALSI is up 7.6% ytd (+14.3% USD) and the total market capitalisation is currently USD1.5bn.
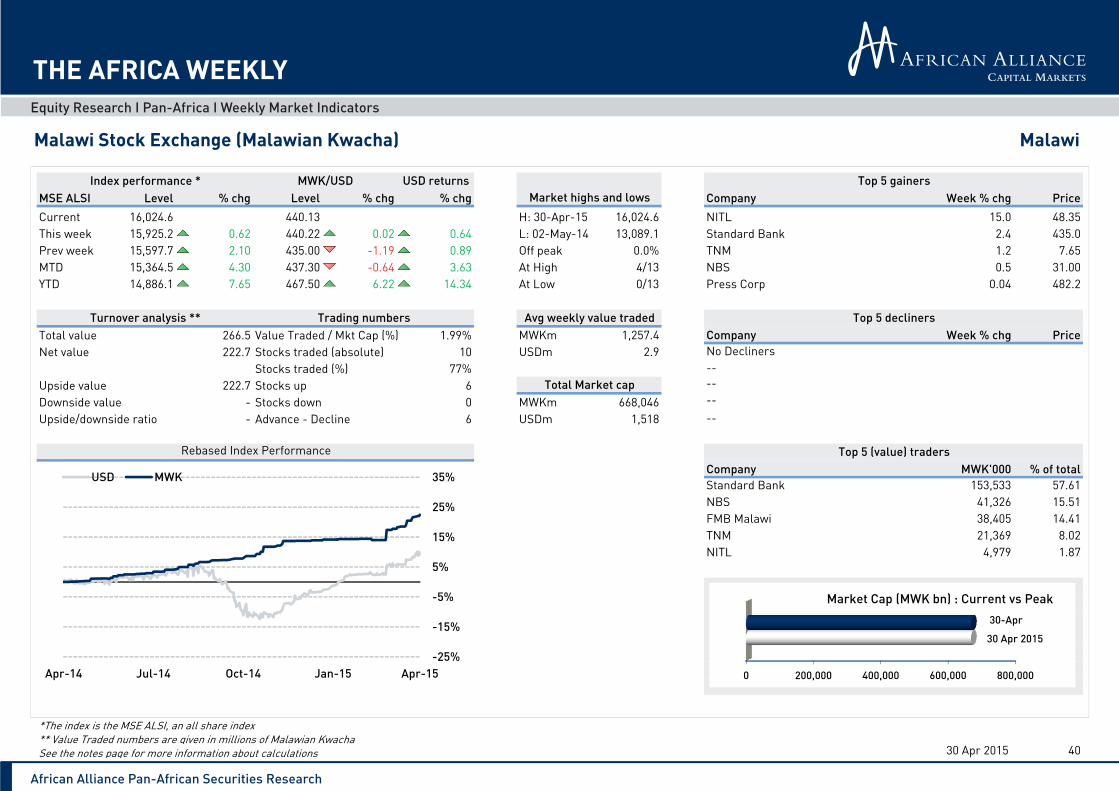
African Alliance Pan-African Securities Research
Equity Research I Pan-Africa I Weekly Market Indicators
THE AFRICA WEEKLY
Malawi Stock Exchange (Malawian Kwacha) Malawi
MSE ALSI Level % chg Level % chg % chg Company Week % chg PriceCurrent 16,024.6 440.13 H: 30-Apr-15 16,024.6 NITL 15.0 48.35This week 15,925.2 0.62 440.22 0.02 0.64 L: 02-May-14 13,089.1 Standard Bank 2.4 435.0Prev week 15,597.7 2.10 435.00 -1.19 0.89 Off peak 0.0% TNM 1.2 7.65MTD 15,364.5 4.30 437.30 -0.64 3.63 At High 4/13 NBS 0.5 31.00YTD 14,886.1 7.65 467.50 6.22 14.34 At Low 0/13 Press Corp 0.04 482.2
266.5 1.99% MWKm 1,257.4 Company Week % chg Price222.7 10 USDm 2.9 No Decliners
77% --222.7 6 --
- 0 MWKm 668,046 --- 6 USDm 1,518 --
Company MWK'000 % of totalStandard Bank 153,533 57.61NBS 41,326 15.51FMB Malawi 38,405 14.41TNM 21,369 8.02NITL 4,979 1.87
*The index is the MSE ALSI, an all share index ** Value Traded numbers are given in millions of Malawian Kwacha See the notes page for more information about calculations 30 Apr 2015 40
Total value Value Traded / Mkt Cap (%)
MWK/USD USD returnsIndex performance *
Turnover analysis ** Avg weekly value traded
Market highs and lowsTop 5 gainers
Top 5 decliners
Advance - Decline
Stocks traded (%)Stocks up Total Market cap
Trading numbers
Top 5 (value) tradersRebased Index Performance
Net value Stocks traded (absolute)
Upside valueDownside value Stocks downUpside/downside ratio
-25%
-15%
-5%
5%
15%
25%
35%
Apr-14 Jul-14 Oct-14 Jan-15 Apr-15
USD MWK
0 200,000 400,000 600,000 800,000
30 Apr 2015
30-Apr
Market Cap (MWK bn) : Current vs Peak

African Alliance Pan-African Securities Research
Equity Research I Pan-Africa I Weekly Market Indicators
THE AFRICA WEEKLY
Malawi Stock Exchange (Malawian Kwacha) Malawi
Price Value Volume 6 mthsCompany Name Sector MWK % chg Move MWK '000 '000 High Low Off high YTD 12 mths MWK m USD m Val (000)Illovo Malawi AGRI 294.2 - Flat 2,135 7.26 294.2 292.0 -0.0 - 0.8 209,895 477 44.1NBM BANK 251.0 0.0 Up 1,267 5.05 251.0 228.0 - 4.1 10.1 117,199 266 26.3Standard Bank BANK 435.0 2.4 Up 153,533 352.95 435.0 395.0 - 2.4 10.1 92,800 211 38.2TNM TELE 7.65 1.2 Up 21,369 2,796.31 7.65 3.20 -0.0 87.0 139.1 76,809 175 24.2Press Corp INVE 482.2 0.0 Up 241 0.50 482.2 311.8 -0.0 6.4 55.0 57,987 132 31.2FMB Malawi BANK 19.00 - Flat 38,405 2,021.32 19.00 4.05 - 0.2 26.7 44,389 101 2,621.2NICO INSU 30.00 - Flat 3,021 100.68 32.50 19.15 -7.7 -7.7 63.0 31,291 71 27.0NBS BANK 31.00 0.5 Up 41,326 1,338.10 31.00 15.50 - 14.8 93.8 22,557 51 33.3NITL INVE 48.35 15.0 Up 4,979 102.97 48.35 32.00 0.0 16.5 53.3 6,527 15 6.8MPICO PROP 4.90 - Flat 231 47.07 5.01 2.00 -2.2 21.9 145.0 5,630 13 4.2Sunbird HOTL 8.10 8.10 7.55 -0.0 1.3 7.3 2,119 5 0.0Real Insurance INSU 2.30 2.30 1.20 0.0 - 100.0 575 1 0.4Blantyre Hotels HOTL 8.10 8.10 8.00 -0.0 1.3 1.3 267 1 0.0
4130 Apr 2015
Movement (% chg) Market cap12 MonthWeekly

African Alliance Pan-African Securities Research
Equity Research I Pan-Africa I Weekly Market Indicators
THE AFRICA WEEKLY
Namibian Stock Exchange (Namibian Dollar) Namibia
2012 2013 2014 2015 2016E 2017F-2.6 -5.1 -7.0 -4.9 -0.2 -0.124.4 25.5 27.6 29.1 29.7 31.318.3 22.5 26.3 0.0 27.5 27.713.1 12.3 12.0 13.1 14.0 15.0
5.0 4.3 4.3 4.5 4.6 4.76,063.8 5,636.1 5,466.7 5,914.4 6,268.7 6,680.6
6.4 4.9 5.8 5.7 5.5 5.5
Company Reporting period Expected reporting date Year DPSBANK WINDHOEK HOLDINGS LTD Full Year 17-Aug-15 Oryx Properties 2015 0.7
Stimulus Invest 2013 82.0Namibian Asset M 2014 0.05Fnb Namibia Hold 0.7Namibian Asset M 2014 0.05
42
TypeDistribution
Special CashRegular Cash
Interim
Market Commentary
Govt net debt (% GDP)Nominal GDP (USDbn)GDP growth (%, constant prices)GDP per capita (USD)Inflation (%, end of period)
Current account balance (% GDP)Govt gross debt (% GDP)
Dividends Last Cum date09-Mar-15
30 Apr 2015
14-Jun-1317-Nov-1402-Mar-1517-Nov-14Regular Cash
The NSX Local declined 0.1% to close the week at 427.4 on the back of losses in Bank Windhoek (-0.7%).During the week, gains were recorded in FNB Namibia (+0.1%).The top traders by value were BankWindhoek (USD 149.9k), FNB Namibia (USD 8.0k) and Oryx Properties (USD k). Trading in these sharesaccounted for 100.0% of this week’s turnover of NAD 1.9m (USD 157.8k). The average weekly value tradedin the last six months is NAD 4.0m (USD 335.8k). The NSX Local is up 9.9% ytd (+7.4% USD) and the totalmarket capitalisation is currently USD 2.1bn.

African Alliance Pan-African Securities Research
Equity Research I Pan-Africa I Weekly Market Indicators
THE AFRICA WEEKLY
Namibian Stock Exchange (Namibian Dollar) Namibia
NMB Local Level % chg Level % chg % chg Company Week % chg PriceCurrent 427.4 11.83 H: 02-Apr-15 430.6 FNB Namibia 0.1 32.25This week 427.9 -0.11 12.27 3.65 3.54 L: 02-May-14 340.7 --Prev week 430.2 -0.56 12.03 -1.91 -2.45 Off peak -0.7% --MTD 413.7 3.31 12.22 3.28 6.70 At High 1/8 --YTD 389.0 9.86 11.57 -2.23 7.41 At Low 0/8 --
1.9 0.39% NADm 4.0 Company Week % chg Price-1.7 2 USDm 0.3 Bank Windhoek -0.7 15.20
25% --0.1 1 --1.8 1 NADm 24,471 --
-94.7% 0 USDm 2,068 --
Company NAD'000 % of totalBank Windhoek 1,806.0 94.96FNB Namibia 95.9 5.04-- - --- - --- - -
*The index is the NMB Local, a local companies index ** Value Traded numbers are given in millions of Namibian Dollars See the notes page for more information about calculations 30 Apr 2015 43
Total value Value Traded / Mkt Cap (%)
NAD/USD USD returnsIndex performance *
Turnover analysis ** Avg weekly value traded
Market highs and lowsTop 5 gainers
Top 5 decliners
Advance - Decline
Stocks traded (%)Stocks up Total Market cap
Trading numbers
Top 5 (value) tradersRebased Index Performance
Net value Stocks traded (absolute)
Upside valueDownside value Stocks downUpside/downside ratio
-14%
-5%
4%
13%
22%
31%
Apr-14 Jul-14 Oct-14 Jan-15 Apr-15
USD NAD
0 10,000 20,000 30,000
02 Apr 2015
30-Apr
Market Cap (NAD m) : Current vs Peak

African Alliance Pan-African Securities Research
Equity Research I Pan-Africa I Weekly Market Indicators
THE AFRICA WEEKLY
Namibian Stock Exchange (Namibian Dollar) Namibia
Price Value Volume 6 mthsCompany Name Sector NAD % chg Move NAD '000 '000 High Low Off high YTD 12 mths NAD m USD m Val (000)FNB Namibia BANK 32.25 0.1 Up 96 2.97 32.25 22.70 - 21.4 42.3 8,630 729 29.9Bank Windhoek BANK 15.20 -0.7 Down 1,806 118.75 15.30 10.71 -0.7 15.2 42.3 7,665 648 84.8Namibia Breweries BREW 20.15 20.16 16.31 -0.0 8.9 23.5 4,162 352 76.8Bidvest Namibia INDU 11.40 13.26 11.40 -14.0 -13.4 -10.3 2,416 204 60.1Oryx Properties PROP 18.66 18.66 17.61 0.0 1.3 7.2 1,232 104 44.4Nictus Holding CONS 2.40 2.40 2.40 -0.0 - - 128 11 0.4Stimulus Investments INVE 121.3 121.3 110.1 -0.0 - 10.1 121 10 39.0Namibian Asset Mgmt INVE 0.58 0.65 0.55 -10.8 -10.8 20.8 116 10 0.5
4430 Apr 2015
Movement (% chg) Market cap12 MonthWeekly

African Alliance Pan-African Securities Research
Equity Research I Pan-Africa I Weekly Market Indicators
THE AFRICA WEEKLY
Swaziland Stock Exchange (Swazi Lilangeni) Swaziland
2012 2013 2014 2015 2016E 2017F3.8 5.3 0.8 -1.4 -1.9 -2.4
17.4 17.8 17.2 19.4 22.6 25.75.6 4.0 4.5 7.6 11.7 15.54.1 3.8 3.8 4.0 4.2 4.41.9 2.8 2.1 2.0 2.1 1.8
3,751.0 3,473.4 3,475.1 3,602.0 3,716.7 3,829.28.3 4.4 6.7 5.6 5.4 5.2
45
Market Commentary
30 Apr 2015
Govt net debt (% GDP)Nominal GDP (USDbn)GDP growth (%, constant prices)GDP per capita (USD)Inflation (%, end of period)
Current account balance (% GDP)Govt gross debt (% GDP)
There was no trading in Swaziland this week.

African Alliance Pan-African Securities Research
Equity Research I Pan-Africa I Weekly Market Indicators
THE AFRICA WEEKLY
Swaziland Stock Exchange (Swazi Lilangeni) Swaziland
SSX ALSI Level % chg Level % chg % chg Company Week % chg PriceCurrent 286.8 11.83 H: 00-Jan-00 0.0 No GainersThis week 286.8 0.00 12.27 3.65 3.65 L: 00-Jan-00 0.0 --Prev week 286.8 0.00 12.03 -1.91 -1.91 Off peak --MTD 286.8 0.00 12.22 3.28 3.28 At High 2/7 --YTD 286.8 0.00 11.57 -2.23 -2.23 At Low 1/7 --
- 0.00% SZLm 0.0 Company Week % chg Price- 0 USDm 0.0 No Decliners
0% --- 0 --- 0 SZLm 2,405 --- 0 USDm 203 --
Company SZL'000 % of totalNo Trade - --- - --- - --- - --- - -
*The index is the SSX ALSI, an all share index ** Value Traded numbers are given in millions of Swazi Lilangeni See the notes page for more information about calculations 30 Apr 2015 46
Total value Value Traded / Mkt Cap (%)
SZL/USD USD returnsIndex performance *
Turnover analysis ** Avg weekly value traded
Market highs and lowsTop 5 gainers
Top 5 decliners
Advance - Decline
Stocks traded (%)Stocks up Total Market cap
Trading numbers
Top 5 (value) traders Rebased Index Performance
Upside valueDownside value Stocks downUpside/downside ratio
Net value Stocks traded (absolute)
-26%
-20%
-14%
-8%
-2%
4%
10%
Apr-14 Jul-14 Oct-14 Jan-15 Apr-15
USD SZL
0 1,000 2,000 3,000
00 Jan 1900
30-Apr
Market Cap (SZL m) : Current vs Peak

African Alliance Pan-African Securities Research
Equity Research I Pan-Africa I Weekly Market Indicators
THE AFRICA WEEKLY
Swaziland Stock Exchange (Swazi Lilangeni) Swaziland
Price Value Volume 6 mthsCompany Name Sector SZL % chg Move SZL '000 '000 High Low Off high YTD 12 mths SZL m USD m Val (000)Royal Swazi Sugar AGRI 13.00 13.00 13.00 - - - 1,148 97 -Swazi Empowerment INVE 24.00 24.00 23.00 - - 4.3 444 38 -SBC Limited BANK 3.92 0.00 0.00 - - 378 32 -Nedbank BANK 6.40 6.40 6.20 -0.0 - 3.2 153 13 -Swaprop PROP 5.40 0.00 0.00 - - 126 11 -Greystone Partners INVE 1.35 0.00 0.00 - - 115 10 -Swazispa HOTL 6.00 0.00 0.00 - - 42 4 -
4730 Apr 2015
Movement (% chg) Market cap12 MonthWeekly

African Alliance Pan-African Securities Research
Equity Research I Pan-Africa I Weekly Market Indicators
THE AFRICA WEEKLY
Egyptian Stock Exchange (Egyptian Pound) Egypt
2012 2013 2014 2015 2016E 2017F-3.9 -2.7 -0.4 -4.0 -4.5 -4.678.9 89.2 93.8 94.5 94.4 94.667.8 78.2 84.1 86.2 87.2 88.4
262.3 271.4 284.9 324.3 365.9 408.02.2 2.1 2.2 3.5 3.8 3.9
3,221.8 3,242.9 3,336.6 3,723.7 4,119.9 4,503.87.3 9.8 8.2 15.0 12.1 11.8
Company Reporting period Expected reporting date Year DPSEGYPTIAN RESORTS CO Full Year 04-May-15 Delta Insurance 2014 0.7EGYPT FOR POULTRY Full Year 21-May-15 Juhayna Food Ind 2015 0.1ELSAEED CONTRACTING & REAL E Full Year 03-May-15 Cairo Pharmaceut 2014 1.3ROWAD TOURISM CO Full Year 04-May-15 Egyptian Gulf Bk 0.3EL KAHERA HOUSING Full Year 03-May-15 Aracemco 2015 0.4EGYPTIAN MEDIA PRODUCTION Full Year 04-May-15SOUTH VALLEY CEMENT Full Year 04-May-15GMC GROUP FOR INDUSTRIAL COM Full Year 03-May-15INTL CO FOR INVEST & DEVELOP Full Year 06-May-15UNIVERSAL (UNIPACK) Full Year 06-May-15MARIDIVE & OIL SERVICE Full Year 03-May-15
48
Current account balance (% GDP)Govt gross debt (% GDP)Govt net debt (% GDP)Nominal GDP (USDbn)GDP growth (%, constant prices)GDP per capita (USD)Inflation (%, end of period)
Dividends Last Cum date
Market Commentary
Regular CashType
27-Oct-14
30 Apr 2015
10-Apr-1428-Apr-15
Regular CashRegular Cash
14-Apr-1515-Oct-14
Regular CashRegular Cash
The EGX 30 declined 0.7% to close the week at 8,672.3 on the back of losses in LNC for Maize Products (-20.3%), Delta Sugar (-14.0%) and HandD Bank (-8.3%). During the week, gains were recorded in GhabbourAuto (+7.9%), Egyptian Kuwaiti Holding (USD) (+4.8%) and United H&D (+3.6%). The top traders by valuewere CIB Egypt (USD 48.2m), Orascom Telecom M&T (USD 31.5m) and Palm Hills Development (USD14.9m). Trading in these shares accounted for 40.5% of this week’s turnover of EGP 1.8bn (USD 233.7m).The average weekly value traded in the last six months is EGP 2.3bn (USD 297.6m). The EGX 30 is down2.8% ytd (-8.9% USD) and the total market capitalisation is currently USD 36.8bn.

African Alliance Pan-African Securities Research
Equity Research I Pan-Africa I Weekly Market Indicators
THE AFRICA WEEKLY
Egyptian Stock Exchange (Egyptian Pound) Egypt
EGX 30 Level % chg Level % chg % chg Company Week % chg PriceCurrent 8,672.3 7.62 H: 04-Feb-15 10,045.9 Cairo Oil & Soap 7.9 8.59This week 8,731.3 -0.68 7.58 -0.55 -1.23 L: 01-Jun-14 7,894.7 Ghabbour Auto 7.9 4.93Prev week 8,886.8 -1.75 7.58 -0.03 -1.78 Off peak -13.7% Egyptian Kuwaiti Holding (USD) 4.8 0.66MTD 9,134.8 -5.06 7.58 -0.57 -5.60 At High Misr Oils & Soap 4.0 10.00YTD 8,926.6 -2.85 7.15 -6.19 -8.86 At Low 1/101 United H&D 3.6 14.49
1,777 31.63% EGPm 2,268.8 Company Week % chg Price-608 95 USDm 297.6 LNC for Maize Products -20.3 17.05
94% Delta Sugar -14.0 11.39584 19 Rowad Tourism Co -10.7 5.84
1,192 74 EGPm 280,899 TransOceans Tours (USD) -10.0 0.09-51.0% -55 USDm 36,842 Gulf Canadian Real Estate -8.9 12.44
Company EGP'000 % of totalCIB Egypt 366,560.2 20.63Orascom Telecom M&T 239,435.1 13.47Palm Hills Development 113,569.0 6.39Citadel Capital 105,665.7 5.95TMG Holding 104,413.3 5.88
*The index is the EGX 30, an index consting of the top 30 most active Egyptian stocks ** Value Traded numbers are given in millions of Egyptian Pounds See the notes page for more information about calculations 30 Apr 2015 49
Total value Value Traded / Mkt Cap (%)
EGP/USD USD returnsIndex performance *
Turnover analysis ** Avg weekly value traded
Market highs and lowsTop 5 gainers
Top 5 declinersTrading numbers
Advance - Decline
Stocks traded (%)Stocks up Total Market cap
Stocks traded (absolute)
Top 5 (value) tradersRebased Index Performance
Downside value Stocks downUpside/downside ratio
Net value
Upside value
-19%
-10%
-1%
8%
17%
26%
Apr-14 Jul-14 Oct-14 Jan-15 Apr-15
USD EGP
0 100,000 200,000 300,000 400,000
04 Feb 2015
30-Apr
Market Cap (EGPbn) : Current vs Peak

African Alliance Pan-African Securities Research
Equity Research I Pan-Africa I Weekly Market Indicators
THE AFRICA WEEKLY
Egyptian Stock Exchange (Egyptian Pound) Egypt
Price Value Volume 6 mthsCompany Name Sector EGP % chg Move EGP '000 '000 High Low Off high YTD 12 mths EGP m USD m Val (000)Orascom Construction BUIL 284.2 424.6 245.4 -33.1 3.9 0.5 59,382 7,788 48.7CIB Egypt BANK 55.32 1.2 Up 366,560 6,750.01 58.38 35.10 -5.2 12.5 47.6 49,801 6,532 46,912.3TMG Holding PROP 10.06 -1.2 Down 104,413 10,578.37 11.98 8.46 -16.0 2.0 12.4 20,759 2,723 18,422.5Global Telecom Holding TELE 3.24 -4.1 Down 88,685 27,531.91 5.70 3.17 -43.2 -20.4 -37.6 16,996 2,229 15,561.8Telecom Egypt TELE 9.87 -3.1 Down 60,928 6,186.62 15.18 9.70 -35.0 -17.2 -33.4 16,849 2,210 7,541.0MOBINIL TELE 126.1 -2.2 Down 905 7.19 183.3 109.4 -31.2 -26.1 0.5 12,611 1,654 525.4Elswedy Cables INDU 47.37 0.8 Up 7,493 163.94 54.03 30.85 -12.3 13.7 39.3 10,583 1,388 4,494.3EFG Hermes BANK 14.30 -3.7 Down 97,749 7,011.85 19.61 12.98 -27.1 -8.0 11.3 8,208 1,076 14,788.5Sidi Kerir Petrochemicals OILG 14.76 -1.3 Down 31,112 2,104.42 20.06 13.99 -26.4 -2.8 -24.6 7,749 1,016 2,467.2El Ezz Steel BUIL 12.88 0.2 Up 35,201 2,788.23 19.17 12.19 -32.8 -7.8 -22.5 6,997 918 7,395.9Heliopolis Housing PROP 61.22 2.1 Up 76,764 1,297.12 71.44 32.05 -14.3 5.5 90.5 6,811 893 11,705.6Orascom Telecom M&T TELE 0.96 -5.9 Down 239,435 250,442.34 1.43 0.93 -32.9 -27.3 -23.8 5,036 660 39,355.4Medinet Nasr Housing PROP 32.67 0.2 Up 42,747 1,351.25 48.62 25.75 -32.8 10.0 3.4 4,410 578 8,748.3Pioneers Holding INVE 8.73 -5.1 Down 62,415 7,262.02 16.05 8.24 -45.6 -30.9 -31.9 4,365 573 10,433.7Egyptian Kuwaiti Holding (USD) INVE 0.66 4.8 Up 10,738 2,199.76 1.14 0.58 -42.1 -12.0 -37.1 4,223 554 3,363.8Palm Hills Development PROP 2.70 -6.2 Down 113,569 43,351.78 4.65 2.51 -41.9 -34.6 -34.0 3,640 477 16,685.1Citadel Capital INVE 2.32 -1.7 Down 105,666 46,670.12 4.71 2.20 -50.7 -19.7 -48.0 2,784 365 16,990.3Egyptian Iron & Steel BUIL 5.67 -5.8 Down 5,861 1,039.15 10.93 5.40 -48.1 -17.6 -46.9 2,769 363 1,557.2South Valley Cement BUIL 5.52 -2.3 Down 7,025 1,304.32 9.45 5.18 -41.6 -24.3 -27.2 2,720 357 2,722.9HandD Bank BANK 21.09 -8.3 Down 1,011 46.29 29.49 18.16 -28.5 -26.2 11.0 2,425 318 753.8Cairo Poultry CONS 12.80 -1.5 Down 613 47.45 14.02 10.56 -8.7 0.1 15.7 2,230 292 187.0Sinai Cement BUIL 29.86 -1.2 Down 281 9.50 36.99 29.00 -19.3 -6.6 -10.9 2,090 274 160.0Delta Sugar AGRI 11.39 -14.0 Down 401 32.52 16.77 10.26 -32.1 -24.0 -0.8 1,620 212 118.1National Development Bank BANK 7.62 -0.7 Down 429 56.41 8.48 6.38 -10.1 3.5 15.8 1,524 200 807.2Maridive & Oil (USD) OILG 0.53 1.9 Up 7,062 1,787.15 1.15 0.48 -53.9 -5.4 -48.5 1,448 190 1,382.9Canal Shipping Agencies TRPT 7.01 -4.0 Down 1,410 204.80 13.97 6.63 -49.8 -18.5 -37.4 1,402 184 426.1Al Baraka Bank BANK 10.87 0.2 Up 2,437 221.92 13.49 9.97 -19.4 -6.2 -1.4 1,264 166 150.7United H&D PROP 14.49 3.6 Up 10,432 743.84 18.74 13.23 -22.7 -13.0 3.5 1,261 165 1,387.9Six of October DandI PROP 11.56 -6.8 Down 78,641 6,860.53 18.03 8.00 -35.9 -19.7 33.8 1,048 137 11,676.7EG Tourism Resorts PROP 0.98 -3.9 Down 25,913 26,772.69 2.04 0.92 -52.0 -19.7 -45.6 1,029 135 5,962.0
50
Movement (% chg) Market cap12 MonthWeekly
30 Apr 2015

African Alliance Pan-African Securities Research
Equity Research I Pan-Africa I Weekly Market Indicators
THE AFRICA WEEKLY
Casablanca Stock Exchange (Moroccan Dirham) Morocco
2012 2013 2014 2015 2016E 2017F-9.7 -7.6 -6.8 -5.8 -5.1 -4.460.4 64.6 66.0 66.2 65.5 64.459.9 64.0 65.5 65.7 64.9 63.995.9 103.8 112.6 121.9 131.8 141.8
2.7 4.4 3.5 4.7 5.0 5.32,948.9 3,160.3 3,392.3 3,638.0 3,896.2 4,153.5
2.6 0.4 2.2 1.8 2.3 2.3
Company Reporting period Expected reporting date Year DPSAGMA-LAHOU TAZI S.A. Full Year 04-May-15 Afriquia Gaz 2015 105.0ALLIANCES DEVELOPPEMENT IMMO Full Year 04-May-15 Maroc Telecom 6.9SOCIETE DES BRASSERIES DU MA Full Year 04-May-15 Residences Dar 6.4EQDOM Full Year 04-May-15 Delattre Levivie 5.0IB MAROC.COM Full Year 04-May-15 Maghreb Oxygene 2015 4.0INVOLYS SA Full Year 04-May-15M2M GROUP Full Year 04-May-15MAGHREBAIL Full Year 04-May-15MANAGEM Full Year 04-May-15COMPAGNIE MINIERE DE TOUISSI Full Year 04-May-15ZELLIDJA SA Full Year 04-May-15
51
TypeRegular CashRegular CashRegular CashRegular Cash
Market Commentary
Govt net debt (% GDP)Nominal GDP (USDbn)GDP growth (%, constant prices)GDP per capita (USD)Inflation (%, end of period)
Current account balance (% GDP)Govt gross debt (% GDP)
Dividends Last Cum date18-Mar-15
30 Apr 2015
N.A.N.A.
05-Aug-1418-Mar-15Regular Cash
The MASI gained 0.2% to close the week at 9,937.4 on the back of gains in Maroc Leasing (+5.0%), DoujaProm Addoha (+3.3%) and Ciments Du Maroc (+3.1%). During the week, losses were recorded in Alliances(-13.8%), Delta Holding (-6.6%) and Managem (-4.1%). The top traders by value were Attijariwafa Bank(USD 5.8m), Maroc Telecom (USD 5.5m) and Cosumar (USD 2.1m). Trading in these shares accounted for55.4% of this week’s turnover of MAD 237.1m (USD 24.1m). The average weekly value traded in the lastsix months is MAD 768.8m (USD 79.3m). The MASI is up 3.3% ytd (-3.8% USD) and the total marketcapitalisation is currently USD 51.0bn.

African Alliance Pan-African Securities Research
Equity Research I Pan-Africa I Weekly Market Indicators
THE AFRICA WEEKLY
Casablanca Stock Exchange (Moroccan Dirham) Morocco
MORALSI Level % chg Level % chg % chg Company Week % chg PriceCurrent 9,937.4 9.70 H: 09-Mar-15 10,527.3 Stokvis Nord Afrique 7.2 29.29This week 9,914.9 0.23 9.97 2.81 3.05 L: 24-Jun-14 9,203.7 Maroc Leasing 5.0 380.0Prev week 9,912.3 0.03 9.98 0.12 0.14 Off peak -5.6% SNEP 4.4 140.0MTD 10,269.8 -3.24 9.97 2.75 -0.58 At High 0/78 Maghreb Oxygene 3.7 141.0YTD 9,620.1 3.30 9.03 -6.85 -3.78 At Low 4/78 Douja Prom. Addoha 3.3 31.00
227.1 2.32% MADm 751.2 Company Week % chg Price74.5 57 USDm 77.4 Alliances -13.8 124.2
73% Delta Holding -6.6 27.00146.6 23 Zellidja S.A -5.8 242.0
72.2 26 MADm 489,648 Aluminium Du Maroc -5.8 1,036103.2% -3 USDm 50,482 Med Paper -4.2 16.23
Company MAD'000 % of totalAttijariwafa Bank 57,129.6 25.16Maroc Telecom 53,745.5 23.67Cosumar 20,564.6 9.06Douja Prom. Addoha 20,267.4 8.93Brasseries Dumaroc 18,803.6 8.28
*The index is the MORALSI, the (new) all share index ** Value Traded numbers are given in millions of Moroccan Dirhams See the notes page for more information about calculations 30 Apr 2015 52
Total value Value Traded / Mkt Cap (%)
MAD/USD USD returnsIndex performance *
Turnover analysis ** Avg weekly value traded
Market highs and lowsTop 5 gainers
Top 5 decliners
Advance - Decline
Stocks traded (%)Stocks up Total Market cap
Trading numbers
Top 5 (value) tradersRebased Index Performance
Net value Stocks traded (absolute)
Upside valueDownside value Stocks downUpside/downside ratio
-29%
-20%
-11%
-2%
7%
16%
Apr-14 Jul-14 Oct-14 Jan-15 Apr-15
USD MAD
0 200,000 400,000 600,000
09 Mar 2015
30-Apr
Market Cap (MAD bn) : Current vs Peak
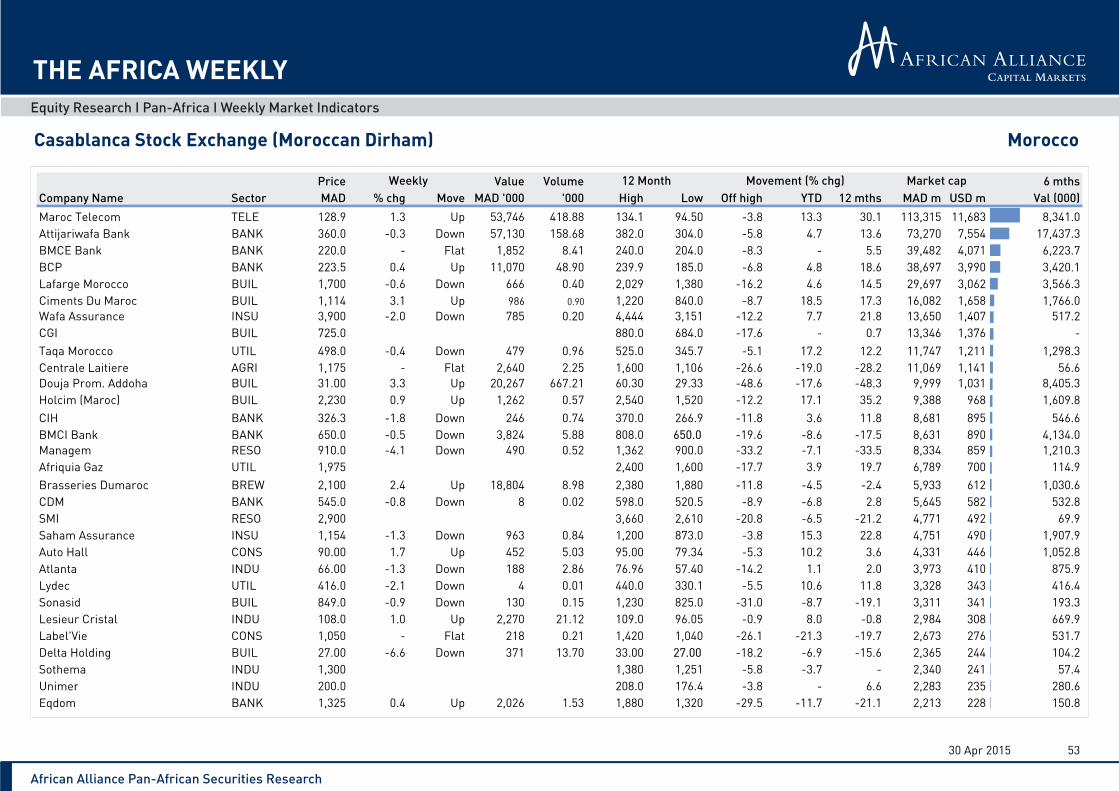
African Alliance Pan-African Securities Research
Equity Research I Pan-Africa I Weekly Market Indicators
THE AFRICA WEEKLY
Casablanca Stock Exchange (Moroccan Dirham) Morocco
Price Value Volume 6 mthsCompany Name Sector MAD % chg Move MAD '000 '000 High Low Off high YTD 12 mths MAD m USD m Val (000)Maroc Telecom TELE 128.9 1.3 Up 53,746 418.88 134.1 94.50 -3.8 13.3 30.1 113,315 11,683 8,341.0Attijariwafa Bank BANK 360.0 -0.3 Down 57,130 158.68 382.0 304.0 -5.8 4.7 13.6 73,270 7,554 17,437.3BMCE Bank BANK 220.0 - Flat 1,852 8.41 240.0 204.0 -8.3 - 5.5 39,482 4,071 6,223.7BCP BANK 223.5 0.4 Up 11,070 48.90 239.9 185.0 -6.8 4.8 18.6 38,697 3,990 3,420.1Lafarge Morocco BUIL 1,700 -0.6 Down 666 0.40 2,029 1,380 -16.2 4.6 14.5 29,697 3,062 3,566.3Ciments Du Maroc BUIL 1,114 3.1 Up 986 0.90 1,220 840.0 -8.7 18.5 17.3 16,082 1,658 1,766.0Wafa Assurance INSU 3,900 -2.0 Down 785 0.20 4,444 3,151 -12.2 7.7 21.8 13,650 1,407 517.2CGI BUIL 725.0 880.0 684.0 -17.6 - 0.7 13,346 1,376 -Taqa Morocco UTIL 498.0 -0.4 Down 479 0.96 525.0 345.7 -5.1 17.2 12.2 11,747 1,211 1,298.3Centrale Laitiere AGRI 1,175 - Flat 2,640 2.25 1,600 1,106 -26.6 -19.0 -28.2 11,069 1,141 56.6Douja Prom. Addoha BUIL 31.00 3.3 Up 20,267 667.21 60.30 29.33 -48.6 -17.6 -48.3 9,999 1,031 8,405.3Holcim (Maroc) BUIL 2,230 0.9 Up 1,262 0.57 2,540 1,520 -12.2 17.1 35.2 9,388 968 1,609.8CIH BANK 326.3 -1.8 Down 246 0.74 370.0 266.9 -11.8 3.6 11.8 8,681 895 546.6BMCI Bank BANK 650.0 -0.5 Down 3,824 5.88 808.0 650.0 -19.6 -8.6 -17.5 8,631 890 4,134.0Managem RESO 910.0 -4.1 Down 490 0.52 1,362 900.0 -33.2 -7.1 -33.5 8,334 859 1,210.3Afriquia Gaz UTIL 1,975 2,400 1,600 -17.7 3.9 19.7 6,789 700 114.9Brasseries Dumaroc BREW 2,100 2.4 Up 18,804 8.98 2,380 1,880 -11.8 -4.5 -2.4 5,933 612 1,030.6CDM BANK 545.0 -0.8 Down 8 0.02 598.0 520.5 -8.9 -6.8 2.8 5,645 582 532.8SMI RESO 2,900 3,660 2,610 -20.8 -6.5 -21.2 4,771 492 69.9Saham Assurance INSU 1,154 -1.3 Down 963 0.84 1,200 873.0 -3.8 15.3 22.8 4,751 490 1,907.9Auto Hall CONS 90.00 1.7 Up 452 5.03 95.00 79.34 -5.3 10.2 3.6 4,331 446 1,052.8Atlanta INDU 66.00 -1.3 Down 188 2.86 76.96 57.40 -14.2 1.1 2.0 3,973 410 875.9Lydec UTIL 416.0 -2.1 Down 4 0.01 440.0 330.1 -5.5 10.6 11.8 3,328 343 416.4Sonasid BUIL 849.0 -0.9 Down 130 0.15 1,230 825.0 -31.0 -8.7 -19.1 3,311 341 193.3Lesieur Cristal INDU 108.0 1.0 Up 2,270 21.12 109.0 96.05 -0.9 8.0 -0.8 2,984 308 669.9Label'Vie CONS 1,050 - Flat 218 0.21 1,420 1,040 -26.1 -21.3 -19.7 2,673 276 531.7Delta Holding BUIL 27.00 -6.6 Down 371 13.70 33.00 27.00 -18.2 -6.9 -15.6 2,365 244 104.2Sothema INDU 1,300 1,380 1,251 -5.8 -3.7 - 2,340 241 57.4Unimer INDU 200.0 208.0 176.4 -3.8 - 6.6 2,283 235 280.6Eqdom BANK 1,325 0.4 Up 2,026 1.53 1,880 1,320 -29.5 -11.7 -21.1 2,213 228 150.8
5330 Apr 2015
Movement (% chg) Market cap12 MonthWeekly

African Alliance Pan-African Securities Research
Equity Research I Pan-Africa I Weekly Market Indicators
THE AFRICA WEEKLY
Bourse de Tunis (Tunisian Dinar) Tunisia
2012 2013 2014 2015 2016E 2017F-8.2 -8.4 -7.7 -6.6 -5.6 -4.644.5 44.8 50.5 54.1 55.1 55.3
45.2 47.0 49.1 50.0 51.5 53.33.7 2.3 2.8 3.7 4.5 4.5
4,198.0 4,316.8 4,466.5 4,502.7 4,585.6 4,703.95.9 6.0 5.5 4.5 4.0 4.0
Company Reporting period Expected reporting date Year DPSSOC NOUVELLE MAISON DE LA VI Full Year 08-May-15 New Body Line 2014 0.4TUNISIE LEASING Full Year 08-May-15 Tunis Re 2013 0.4UNION INTERNATIONALE DE BANQ Full Year 04-May-15 Soc Tunsienne D' 2014 3.4SOC DES IND PHARM DE TUNISIE Half Year 08-May-15 Cie Intl De Leas 0.8
Banq Tunisie 2013 0.2
54
TypeRegular CashRegular CashRegular CashRegular Cash
Market Commentary
Govt net debt (% GDP)Nominal GDP (USDbn)GDP growth (%, constant prices)GDP per capita (USD)Inflation (%, end of period)
Current account balance (% GDP)Govt gross debt (% GDP)
Dividends Last Cum date17-Jul-14
30 Apr 2015
21-Jun-13N.A.
30-May-1330-Jun-14Regular Cash
The Tunis ALSI gained 1.2% to close the week at 5,544.9 on the back of gains in STB (+20.2%), Monoprix(+8.5%) and Banque de l'Habitat (+7.2%). During the week, losses were recorded in Poulina Group (-2.3%), STAR (-2.2%) and SPDIT (-1.6%). The top traders by value were SFBT (USD 2.3m), BNA (USD 0.9m)and STB (USD 0.9m). Trading in these shares accounted for 39.5% of this week’s turnover of TND 19.9m(USD 10.3m). The average weekly value traded in the last six months is TND 24.9m (USD 13.0m). TheTunis ALSI is up 8.9% ytd (+6.0% USD) and the total market capitalisation is currently USD 8.0bn.

African Alliance Pan-African Securities Research
Equity Research I Pan-Africa I Weekly Market Indicators
THE AFRICA WEEKLY
Bourse de Tunis (Tunisian Dinar) Tunisia
TUNIS Index Level % chg Level % chg % chg Company Week % chg PriceCurrent 5,544.9 1.91 H: 29-Apr-15 5,545.0 STB 20.2 5.83This week 5,478.6 1.21 1.96 2.41 3.64 L: 29-May-14 4,502.0 Monoprix 8.5 20.99Prev week 5,413.8 1.20 1.97 0.58 1.79 Off peak 0.0% Banque de l'Habitat 7.2 14.20MTD 5,312.7 4.37 1.96 2.63 7.12 At High 1/58 ARTES 5.8 7.48YTD 5,090.0 8.94 1.86 -2.66 6.04 At Low 2/58 BNA 5.1 9.88
19.9 6.46% TNDm 24.9 Company Week % chg Price12.7 55 USDm 13.0 Assurances SALIM -8.1 19.40
95% SOTETEL -6.7 2.2316.0 28 Servicom SA -4.3 11.50
3.2 21 TNDm 15,377 BTE (ADP) -3.0 21.02393.3% 7 USDm 8,044 Placements de Tunisie -3.0 46.50
Company TND'000 % of totalSFBT 4,462.2 22.45BNA 1,710.4 8.60STB 1,676.6 8.43SOMOCER 1,617.0 8.13Monoprix 1,008.5 5.07
*The index is the TUNIS index, an all share index ** Value Traded numbers are given in millions of Tunisian Dinars See the notes page for more information about calculations 30 Apr 2015 55
Total value Value Traded / Mkt Cap (%)
TND/USD USD returnsIndex performance *
Turnover analysis ** Avg weekly value traded
Market highs and lowsTop 5 gainers
Top 5 decliners
Advance - Decline
Stocks traded (%)Stocks up Total Market cap
Trading numbers
Top 5 (value) tradersRebased Index Performance
Net value Stocks traded (absolute)
Upside valueDownside value Stocks downUpside/downside ratio
-19%
-10%
-1%
8%
17%
26%
Apr-14 Jul-14 Oct-14 Jan-15 Apr-15
USD TND
0 5,000 10,000 15,000 20,000
29 Apr 2015
30-Apr
Market Cap (TND m) : Current vs Peak

African Alliance Pan-African Securities Research
Equity Research I Pan-Africa I Weekly Market Indicators
THE AFRICA WEEKLY
Bourse de Tunis (Tunisian Dinar) Tunisia
Price Value Volume 6 mthsCompany Name Sector TND % chg Move TND '000 '000 High Low Off high YTD 12 mths TND m USD m Val (000)SFBT BREW 31.01 0.0 Up 4,462 143.59 31.39 14.27 -1.2 37.8 96.9 2,481 1,298 4,326.2Banque de Tunisie BANK 10.84 1.7 Up 575 53.49 11.10 9.50 -2.3 2.7 14.2 1,626 851 451.0BIAT BANK 83.00 1.0 Up 318 3.84 85.40 60.63 -2.8 6.4 31.9 1,411 738 486.6Attijari Bank BANK 27.80 0.4 Up 850 30.62 28.00 17.12 -0.7 16.3 61.4 1,105 578 821.1Poulina Group INVE 5.20 -2.3 Down 145 27.51 5.79 5.05 -10.2 -7.5 - 936 490 171.9Amen Bank BANK 25.44 1.0 Up 147 5.74 28.70 23.00 -11.4 -2.9 -9.8 622 325 121.9UBCI BANK 25.50 - Flat 147 5.82 26.00 24.74 -1.9 0.4 -0.8 510 267 33.8Arab Tunisian Bank BANK 4.68 4.0 Up 72 15.72 5.30 4.00 -11.7 7.1 11.4 468 245 68.3STAR INSU 176.0 -2.2 Down 510 2.86 180.0 132.5 -2.2 21.2 23.5 406 212 199.4Magasin Général CONS 30.50 1.7 Up 265 8.72 32.74 23.37 -6.8 -4.3 15.7 350 183 66.2Monoprix CONS 20.99 8.5 Up 1,008 49.73 24.39 17.83 -13.9 -4.6 -12.5 349 183 221.4Carthage Cement BUIL 1.97 -1.0 Down 632 321.32 3.47 1.82 -43.2 -18.6 -37.5 339 177 1,258.8SPDIT BANK 12.50 -1.6 Down 29 2.28 12.70 7.37 -1.6 36.0 61.9 336 176 48.6Ennakl Auto (Tunis) CONS 10.80 2.9 Up 326 30.42 10.80 9.30 -0.0 5.9 14.9 324 169 86.0BNA BANK 9.88 5.1 Up 1,710 173.36 9.97 6.15 -0.9 30.0 30.9 316 165 221.1UIB BANK 16.09 - Flat 397 24.70 16.40 10.29 -1.9 9.1 7.3 315 165 262.5ARTES CONS 7.48 5.8 Up 204 27.81 8.08 6.80 -7.4 -6.5 -0.5 286 150 96.8Air Liquide CONS 212.0 -0.9 Down 27 0.13 297.6 212.0 -28.8 -9.8 -28.8 257 134 16.7Banque de l'Habitat BANK 14.20 7.2 Up 304 21.73 14.20 10.10 0.0 38.5 26.8 256 134 40.7Ciments de Bizerte BUIL 5.70 3.6 Up 17 3.04 7.08 5.50 -19.5 -11.6 -14.7 251 131 25.9ASTREE INSU 54.00 57.80 47.51 -6.6 -1.1 12.5 216 113 1.6TPR INDU 4.45 -0.4 Down 354 79.47 4.48 4.05 -0.7 3.5 5.5 200 105 140.2Tunisie Leasing BANK 21.60 2.9 Up 25 1.15 22.60 18.53 -4.4 -0.4 7.5 179 94 55.9STB BANK 5.83 20.2 Up 1,677 311.89 5.83 4.15 0.0 16.6 12.1 145 76 51.2Tunis Re INSU 8.27 3.5 Up 581 70.82 10.68 7.60 -22.6 -16.9 -15.6 124 65 367.8Adwya CONS 8.50 1.8 Up 218 25.82 8.79 6.30 -3.3 3.9 4.3 112 59 114.1ALKIMIA INDU 57.49 0.9 Up 15 0.27 67.25 53.01 -14.5 -2.6 -8.0 112 59 13.6SOTUVER INDU 5.18 2.2 Up 288 56.41 6.63 4.60 -21.9 -1.9 -20.1 104 54 127.8Tunisair TRPT 0.95 -1.0 Down 86 90.59 1.22 0.93 -22.1 -15.9 -21.5 101 53 80.8Assad INDU 7.93 -0.8 Down 153 19.43 8.77 7.00 -9.6 -0.9 6.7 95 50 157.8
5630 Apr 2015
Movement (% chg) Market cap12 MonthWeekly

African Alliance Pan-African Securities Research
Equity Research I Pan-Africa I Weekly Market Indicators
THE AFRICA WEEKLY
Stocks making 12 month highs
Made Off Low MCap 6 mthsCompany Name Country Sector Crncy Price % chg Move YTD 12 mths High** % chg Local m USDm USDm Val (000)Safaricom Kenya TELE KES 17.40 1.2 Up 23.8 32.8 0 45.6 696,776 7,362 8,213.4FNB Namibia Namibia BANK ZAr 32.25 0.1 Up 21.4 42.3 2 42.1 8,630 729 29.9Letshego Botswana BANK BWp 3.07 16.7 Up 15.4 41.5 0 55.1 6,682 686 1,619.9Ecobank Ghana Ghana BANK GHS 8.00 0.4 Up 5.3 33.3 0 29.2 2,346 609 204.0BIHL Botswana Botswana INSU BWp 12.28 0.2 Up 6.7 14.8 0 14.8 3,452 354 61.2BICI CI BRVM BANK XOF 95,000 8.6 Up 21.8 43.9 0 58.3 158,333 269 701.3NBM Malawi BANK MWk 251.0 0.0 Up 4.1 10.1 0 10.1 117,199 266 26.3Standard Bank Malawi BANK MWk 435.0 2.4 Up 2.4 10.1 0 10.1 92,800 211 38.2Golden Star Ghana RESO GHS 2.34 - Flat - -14.9 265 0.0 598 155 -Phoenix Beverages Mauritius BREW MUR 300.0 2.7 Up 29.9 58.7 0 59.6 4,934 142 139.5BAT (Uganda) Uganda AGRI UGX 8,525 - Flat 13.6 31.2 2 31.2 418,407 140 1.4New Africa Properties Botswana PROP BWp 2.25 2.3 Up 3.7 6.6 1 9.8 1,360 140 15.8Banque de l'Habitat Tunisia BANK TND 14.20 7.2 Up 38.5 26.8 0 40.6 256 134 40.7Turnstar Botswana PROP BWp 2.25 1.8 Up 8.2 19.7 0 21.6 1,287 132 219.2National Breweries Zambia BREW ZMK 13.50 - Flat 12.5 12.5 10 12.5 851 114 31.5Oryx Properties Namibia PROP ZAr 18.66 - Flat 1.3 7.2 7 6.0 1,232 44.4FMB Malawi Malawi BANK MWk 19.00 - Flat 0.2 26.7 2 369.1 44,389 101 2,621.2Wilderness Botswana HOTL BWp 3.51 0.3 Up 11.4 35.0 0 30.0 811 83 2.2CMC Holdings Kenya CONS KES 13.50 - Flat - - 1322 -- 7,867 83 -Swan Insurance Mauritius INSU MUR 345.0 6.8 Up 3.0 16.6 0 16.6 2,855 82 24.9STB Tunisia BANK TND 5.83 20.2 Up 16.6 12.1 0 40.5 145 76 51.2DFCU Uganda BANK UGX 893.0 5.1 Up 27.4 47.0 0 48.8 222,001 74 657.1Dale Capital (USD) Mauritius INVE USD 2.80 - Flat - -20.0 6 16.7 2,508 72 0.1NBS Malawi BANK MWk 31.00 0.5 Up 14.8 93.8 0 100.0 22,557 51 33.3African Distillers Zimbabwe BREW USD 0.50 - Flat 6.4 53.8 20 66.7 48 48 70.6Precision Air Tanzania TRPT TZS 470.0 - Flat - - 16 - 91,113 46 0.0Benso Oil Palm Ghana AGRI GHS 5.00 - Flat 22.0 100.0 1 117.4 174 45 41.3AEL Zambia Zambia INDU ZMK 6.87 - 0.1 34 0.1 140 19 0.2Cresta Botswana HOTL BWp 0.96 1.1 Up 7.9 20.0 1 20.0 177 18 1.5NITL Malawi INVE MWk 48.35 15.0 Up 16.5 53.3 0 51.1 6,527 15 6.8
** # of days since the stock last traded at this price
54
Movement (% chg)
30 Apr 2015

African Alliance Pan-African Securities Research
Equity Research I Pan-Africa I Weekly Market Indicators
THE AFRICA WEEKLY
Stocks making 12 month lows
Made Off High MCap 6 mthsCompany Name Country Sector Crncy Price % chg Move YTD 12 mths Low** % chg Local m USDm USDm Val (000)Omnia Holdings South Africa INDU ZAr 164.1 -1.1 Down -9.3 -27.4 0 -32.2 11,036 933 13,435.3BMCI Bank Morocco BANK MAD 650.0 -0.5 Down -8.6 -17.5 0 -19.6 8,631 890 4,134.0Lafarge Zambia Zambia BUIL ZMK 24.85 -0.6 Down -4.4 -4.5 2 -8.0 4,971 667 196.5Econet Wireless Zimbabwe TELE USD 0.49 - Flat -18.3 -21.0 0 -42.4 446 446 1,279.6ZANACO Zambia BANK ZMK 0.23 -4.2 Down -17.9 -20.7 3 -23.3 1,992 267 25.3Zambia Sugar Zambia AGRI ZMK 6.00 - Flat -9.1 -12.0 3 -12.2 1,899 255 15.6Delta Holding Morocco BUIL MAD 27.00 -6.6 Down -6.9 -15.6 0 -18.2 2,365 244 104.2Omnicane Mauritius AGRI MUR 74.00 -1.7 Down -15.4 -14.7 0 -16.9 4,959 143 33.9Engen Botswana Botswana OILG BWp 8.50 - Flat -10.5 -8.8 3 -16.3 1,358 139 19.6Air Liquide Tunisia CONS TND 212.0 -0.9 Down -9.8 -28.8 2 -28.8 257 134 16.7OK Zimbabwe Zimbabwe CONS USD 0.10 -9.1 Down -13.0 -49.7 0 -50.0 115 115 99.7Furnmart Botswana CONS BWp 1.85 - Flat -12.3 -19.6 8 -19.9 1,122 115 4.1Unilever CI BRVM INDU XOF 36,000 -2.7 Down -2.7 -33.3 1 -39.0 57,982 99 5.8NBK Kenya BANK KES 22.00 -5.4 Down -11.1 -24.8 0 -34.3 6,160 65 44.3INNODIS Mauritius CONS MUR 53.00 - Flat -5.4 -6.2 3 -14.5 1,947 56 31.5Precision Air Tanzania TRPT TZS 470.0 - Flat - - 16 - 91,113 0.0Harel Mallac Mauritius INVE MUR 101.5 - Flat -7.3 -14.7 3 -15.6 1,143 33 0.5Lafarge Zimbabwe Zimbabwe BUIL USD 0.40 - Flat -27.3 -38.5 3 -42.9 32 32 6.4Kingdom Meikles Africa Zimbabwe BANK USD 0.09 -10.0 Down -41.9 -50.0 1 -59.1 22 22 16.7Crown SIEM CI BRVM INDU XOF 19,900 - Flat -13.5 -44.7 13 -40.6 12,532 21 0.6Uniwax CI BRVM INDU XOF 16,555 -77.3 Down -58.6 -46.2 0 -78.5 12,416 21 68.5Nictus Holding Namibia CONS NAD 2.40 - Flat - - 157 -0.0 128 11 0.4Investrust Bank Zambia INVE ZMK 13.50 - Flat - - 120 - 63 8 33.0Uganda Clays Uganda BUIL UGX 18.00 - Flat -10.0 -28.0 7 -28.0 16,200 5 0.9Mechanical Lloyd Ghana CONS GHS 0.20 - Flat -28.6 -41.2 28 -41.2 10 3 0.2Cavmont Capital Zambia Zambia INVE ZMK 2.00 - Flat - - 22 - 10 1 0.1
** # of days since the stock last traded at this price
55
Movement (% chg)
30 Apr 2015

African Alliance Pan-African Securities Research
Equity Research I Pan-Africa I Weekly Market Indicators
THE AFRICA WEEKLY
Notes
General stock exclusions include secondary listings, stocks that have missing information, and those that have not traded on more than a year.Detailed information is given per country on the top 30 stocks by market capitalisation.Please note that the Egyptian market watchlist is limited to the EGX30 and EGX 70 constituents
Value traded numbers are given in thousands, quoted in the local currency.Value traded is estimated as vwap or closing price, times volume traded. There will therefore be slight variations between actual value traded and our estimate.
Calculations are as follows:Turnover Analysis
Total value - is the sum of the value traded, for the entire market.Net value - value traded for stocks trading up less stocks trading down.6 mth weekly value traded - the average weekly value traded (taken over a 6 month period), adjusted for trade frequency.USD Value traded numbers are converted at the latest fx-rate to indicate today's expected USD value traded (shown in 000).Upside value - value traded for stocks that moved up.Downside value - value traded for stocks that moved down.Upside/downside ratio - Upside volume divided by downside volume.
Trading NumbersValue Traded / Mkt Cap (%) - value traded as a percentage of total market cap, annualised using 50 trading weeks per year.Stocks traded (absolute) - number of stocks that traded.Stocks traded (%) - %of stocks that traded per market.Stocks up - number of stocks that moved up.Stocks down - number of stocks that moved up.Advance - Decline - Stock up - stocks down.
Each of the country graphs is designed to show index performance in local currency, vs. performance in USD terms.The market capitalisation graph represents graphically the difference in current market capitalisation, and market capitalisation at the (local) index peak.
Sources: Bloomberg, Company reports, Various stock exchange daily reports, African Alliance database, Economic data from IMF WEO Oct 2013
African Alliance Pan-African Securities Research
Equity Research I Pan-Africa I Weekly Market Indicators
THE AFRICA WEEKLY
African Alliance Botswana Securities African Alliance Securities Ghana African Alliance Kenya Investment BankExchange House, Plot 64511 2nd Floor, Heritage Tower 1st Floor, Transnational HouseFairgrounds Office Park 6th Avenue, Ridge Ambassadorial Enclave Mama Ngina StreetGaborone, Botswana Accra, Ghana Nairobi, KenyaTelephone: +267 318 8958 Telephone: +233 30 267 9761-2 Telephone: +254 20 276 2000
African Alliance Lesotho African Alliance Securities (Malawi) African Alliance RwandaSuite 4, Metropolitan Building 4th Floor, Livingstone Towers 1st Floor, Kigali City Tower214 Moshoeshoe Road Glyn Jones Road Avenue du CommerceMaseru, Lesotho Blantyre, Malawi Kigali, RwandaTelephone: +266 22 312 673 Telephone: +265 183 1995 Telephone: +250 785 694 490
African Alliance Stockbrokers African Alliance Stockbroking Holdings African Alliance Swaziland SecuritiesWing 4, First Floor, Kaita Gardens, 1st Floor, Ebene Heights 2nd Floor, Nedbank CentrePlot 1676, Oladele, Olashore Street, 32 Ebene Cybercity Cnr Sishayi and Sozisa RoadsVictoria Island, Lagos, Nigeria Ebene, Mauritius Mbabane, SwazilandTelephone: +234 1 460 5065 Telephone: +230 404 7400 Telephone: +268 2 404 2002
African Alliance Securities Trading African Alliance Uganda African Alliance Securities Zambia4th Floor, 23 Melrose Boulevard 1st Floor, Worker’s House The Colosseum, Block A, Ground FloorMelrose Arch 2196 1 Pilkington Road Bwinjimfumu RoadJohannesburg, South Africa Kampala, Uganda Lusaka, ZambiaTelephone: +27 11 214 8300 Telephone: +256 417 777700 Telephone: +260 211 840 512
This document is confidential and issued for the information of internal and external clients of African Alliance Ltd (Reg no 79171C, Isle of Man) and its subsidiaries (African Alliance). It issubject to copyright and may not be reproduced in whole or in part without written permission from the author. The information, opinions and recommendations contained herein are and mustbe construed solely as statements of opinion and not statements of fact. No warranty, express or implied, as to the accuracy, timeliness, completeness, merchantability or fitness for anyparticular purpose of any such recommendation or information is given or made by African Alliance in any form or manner whatsoever. Each recommendation or opinion must be weighedsolely as one factor in any investment or other decision made by or on behalf of any user of the information contained herein and such user must accordingly make its own study and evaluationof each strategy / security that it may consider purchasing, holding or selling and should appoint its own investment or financial or other advisors to assist the user in reaching any decision.African Alliance will accept no responsibility of whatsoever nature in respect of any statement, opinion, recommendation or information contained in this document. African Alliance is aninvestment bank, and provides a full range of investment banking services. It and its affiliate companies conduct investment banking business that relates to companies covered in its research,including market making, proprietary trading, fund management and providing investment services. African Alliance has a policy in place to avoid or manage conflicts of interest that may arisedue to its diverse activities. Our traders or other professional staff may provide oral or written market commentary or trading strategies to our clients that reflect opinions that are contrary tothe opinions expressed in this research. Our asset management area, our proprietary trading desks and investing businesses may make investment decisions that are inconsistent with therecommendations or views expressed in this research.
Related Documents