The Advent of Internet Surveys for Political Research: A Comparison of Telephone and Internet Samples by Robert P. Berrens and Alok K. Bohara Department of Economics University of New Mexico Hank Jenkins-Smith and Carol Silva Institute for Public Policy and Department of Political Science University of New Mexico David L. Weimer Department of Political Science and La Follette School of Public Affairs University of Wisconsin-Madison May 2001 Correspondence: Dave Weimer La Follette School of Public Affairs University of Wisconsin-Madison 1225 Observatory Drive Madison, WI 53706 [email protected] * The authors thank the National Science Foundation (NSF Grant Number 9818108) for financial support for the project reported on in this paper. The authors also thank Harris Interactive and Knowledge Networks for their contributions of survey samples. John Bremer, Hui Li, and Zachary Talarek provided valuable assistance at various stages of the project. We also thank Charles Franklin, Ken Goldstein, Dana Mukamel, William Howell, Aidan vining, and John Witte, as well as participants in the Public Affairs Seminar and the Methodology Workshop at the University of Wisconsin-Madison for helpful comments. Of course, the opinions expressed are solely those of the authors.

Welcome message from author
This document is posted to help you gain knowledge. Please leave a comment to let me know what you think about it! Share it to your friends and learn new things together.
Transcript
The Advent of Internet Surveys for Political Research:
A Comparison of Telephone and Internet Samples
by
Robert P. Berrens and Alok K. BoharaDepartment of EconomicsUniversity of New Mexico
Hank Jenkins-Smith and Carol SilvaInstitute for Public Policy and Department of Political Science
University of New Mexico
David L. WeimerDepartment of Political Science and La Follette School of Public Affairs
University of Wisconsin-Madison
May 2001
Correspondence: Dave WeimerLa Follette School of Public AffairsUniversity of Wisconsin-Madison1225 Observatory DriveMadison, WI [email protected]
* The authors thank the National Science Foundation (NSF Grant Number 9818108) for financial supportfor the project reported on in this paper. The authors also thank Harris Interactive and KnowledgeNetworks for their contributions of survey samples. John Bremer, Hui Li, and Zachary Talarek providedvaluable assistance at various stages of the project. We also thank Charles Franklin, Ken Goldstein, DanaMukamel, William Howell, Aidan vining, and John Witte, as well as participants in the Public AffairsSeminar and the Methodology Workshop at the University of Wisconsin-Madison for helpful comments. Of course, the opinions expressed are solely those of the authors.
The Advent of Internet Surveys for Political Research:A Comparison of Telephone and Internet Samples
Abstract
The authors present the results of parallel telephone and Internet surveys to investigate theircomparability. The telephone survey was administered to a national probability sample based on randomdigit dialing. The contemporaneous Internet survey was administered to a random sample of the database of willing respondents assembled by Harris Interactive. The survey was replicated by HarrisInteractive six months later, and by Knowledge Networks, which employs a randomly recruited panel,nine months later. The data facilitate comparisons in terms of demographic characteristics, environmentalknowledge, and political opinions across survey modes. Knowledge and opinion questions generallyshow statistically significant but substantively modest difference across modes. With inclusion ofstandard demographic controls, typical relational models of interest to political scientists produce similarestimates of parameters across modes. The use of commercial Internet samples may thus already bereasonable for many types of social science research.
1
INTRODUCTION
The data available to social scientists describing the attitudes, beliefs, and even behaviors of
individuals come mainly from surveys.1 These data often provide the most direct, and sometimes the
only, basis for the description of population characteristics or the testing of hypotheses derived from
theories. Consequently, the availability and quality of survey data have fundamental relevance to social
science research. The research presented here assesses the characteristics of samples form two prominent
commercial Internet panels by comparing them to a national probability sample of respondents to a
telephone survey on knowledge of and attitudes toward global climate change and a related international
treaty (Kyoto Protocol).
Survey design involves tradeoffs among validity, representativeness, and cost. During the 1970s
a number of factors changed the nature of design tradeoffs so that telephone surveys replaced in-person
interviews as the dominant mode of survey administration. Rising fuel and labor prices made in-person
interviews more expensive, and increased labor market participation by women made it more difficult to
complete interviews with sampled households. At the same time, telephone technology improved, the
percentage of households with telephones surpassed 90 percent, and the introduction of sampling through
random digit dialing (RDD) provided a way of reaching unlisted telephone numbers and more easily
drawing national probability samples. The relative advantages of telephone administration (lower cost,
less risk of interviewer bias, avoidance of cluster sampling, and greater ease of supervising interviewers)
had to be balanced against the relative advantages of in-person interviews (potentially greater coverage of
households, greater feasibility of long or complex survey instruments, and provision of non-verbal
informational aids to respondents). The acceptance of telephone administration by academic researchers
lagged somewhat behind its use by survey researchers – as late as the mid-1970s, many survey research
texts ignored telephone administration (Klecka and Tuchfarber, 1978). Though a number of very
prominent on-going social science surveys, such as the National Election Studies (NES) and the Survey
2
of Income and Program Participation (SIPP) continue to be administered through in-person interviews,
the majority of national surveys conducted for research purposes are now administered by telephone,
taking advantage of list-assisted RDD to sample and computer assisted telephone interview (CATI)
systems to collect data and monitor the quality of interviews.
Social and technological trends appear to be making it more costly to conduct valid and
representative telephone surveys. At the same time, the Internet has emerged as an important
communications technology. In terms of survey administration, it offers several advantages relative to the
telephone: dramatically lower marginal costs of producing completed surveys, superior capability for
providing information, including visual displays, to respondents and for asking complex questions, and
the minimization of interviewer bias. Its primary weakness involves the nature of the samples that it can
currently provide. One problem, which current trends are making much less important, is the incomplete
penetration of Internet use among U.S. adults. The other, more serious, problem is the difficulty of
drawing representative samples from among Internet users. The current absence of a feasible analog to
RDD, and norms and legal prohibitions against message broadcasting (spamming), prevent random
sampling of the universe of Internet users.
The potential uses of the Internet fall into three broad categories demanding different levels of
sample representativeness. First, Internet surveys might be used to estimate population characteristics
such as means and proportions. As classically formulated, the reliable inference of population
characteristics requires true probability samples, suggesting that as currently organized, Internet surveys
are ill suited to serve this function unless supplemented in some way with data from non-Internet sources.
Second, and potentially of most interest to social scientists, Internet surveys might be used to
investigate relationships among variables. In this context, true probability samples may not be necessary
to make valid inferences about relationships, especially when the variables are based on “treatments” that
are randomly applied to respondents. Indeed, witness the extensive use of convenience samples, such as
3
students in psychology courses, to test hypothesis implied by social science theories. Much econometric
analysis deals with estimating models based on data not generated through probability samples.
Additionally, studies in the rapidly growing area of experimental economics rarely employ samples
randomly drawn from the general population.
Third, Internet surveys might be used to investigate methodological issues in survey design that
can be reasonably treated as independent of mode. The low marginal cost of completed surveys
facilitates the comparison of such design issues as question order and format. The inferences about
design issues are unlikely to be highly sensitive to the characteristics of the sample. Consequently,
Internet surveys may prove useful both in investigating general methodological issues and as components
of pre-tests for surveys to be administered by other modes.
Clearly, survey researchers have much to gain if the hurdles facing Internet surveying can be
overcome.
In an attempt to solve the problem of randomly sampling Internet users, several commercial firms
have developed proprietary data bases of willing respondents, typically recruited at the time people select
Internet providers. The largest such data base has been developed by Harris Interactive. In January 2000,
the authors administered a survey on knowledge and attitudes related to global climate change and U.S.
ratification of the Kyoto Protocol to a national RDD sample of U.S. adults through telephone interviews
and to a sample of the Harris Interactive panel of willing respondents through web-based questionnaires.
A second Internet sample using the same instrument was collected in July 2000 from the Harris
Interactive panel. In November 2000, the instrument was administered by Knowledge Networks, which
uses Web TV technology to survey panels of respondents originally recruited through RDD. The
knowledge and attitude data collected in parallel by telephone and Internet provide a unique opportunity
for a more general assessment of the uses of the Internet for administration of social science surveys.
The comparisons of the samples address several different questions. Because the Knowledge
4
Networks sample is based on standard sampling theory, any differences between it and the telephone
sample can be interpreted as likely resulting from either the technology of survey administration or
conditioning of those in the panel. In contrast, the samples from the Harris Interactive panel are not
consistent with standard sampling theory (that is, they are not probability samples). Similarities between
the first Harris sample and the telephone sample, therefore, must be interpreted with caution as there is no
theoretical basis to believe that these similarities would be found in the administration of surveys asking
different sorts of questions. The second Harris Interactive sample, however, employs weights based on
information from an RDD telephone survey to correct for sample selection bias. Although this approach
cannot provide the robust protection against sampling bias provided by true probability samples, it does
provide a theoretical basis for believing that similarities between the telephone and second Harris
Interactive samples are likely to generalize to similar sorts of surveys.
Our objective is to provide insight into potential uses of surveys of Internet panels in social
science research. We begin by documenting two trends that are likely to make Internet surveys relatively
more attractive in the future: the increasing difficulty of doing valid telephone surveys and the increasing
representativeness of the population of Internet users. After describing the structure and purpose of the
survey on global climate change, we make several comparisons between survey modes. First, we
compare the socioeconomic characteristics of respondents. Second, as concern about sampling bias is
based on possible differences in knowledge, attitudes, and behaviors not directly observable in the
population being sampled, we compare the samples in terms of knowledge about global climate change,
degree of engagement in the survey as measured by the use and assessment of information offered to
splits of the Internet samples, and political attitudes. Third, as the focus of much social science research
is the testing of hypotheses about relationships among variables, we investigate the relationship between
political ideology and environmental attitudes, and support for ratification of the Kyoto Protocol as a
function of household costs. We conclude with some observations about the likely current and future
5
uses of Internet surveys.
INCREASING DIFFICULTY OF ADMINISTERING TELEPHONE SURVEYS
Three factors suggest that telephone surveys will become more difficult to administer in the
future: the gradual but long-term trend of increasing nonresponse rates in both in-person and telephone
surveys; technological changes in telecommunications; and public responses to surveys and pseudo-
surveys.
General Trends in Nonresponse
Unit nonresponse, or nonparticipation, refers to the failure to obtain a survey from a sampled
respondent. It consists of refusals to participate by sampled persons as well as sampled persons who are
not interviewed for reasons other than explicit refusal to be interviewed. Unit nonresponse appears to
have been increasing in the United States and Europe over the last two decades (de Leeuw, 1999: 127),
though documenting the trend is difficult for reasons of definition, comparability, and endogeniety of
effort.
Until fairly recently, most survey research organizations developed their own response
classifications, making it difficult to compare nonresponse rates across different surveys or over time.
Widespread adoption of the standardized definitions developed by the American Association for Public
Opinion Research (AAPOR, 1998) should increase comparability in the future. Nevertheless, some
discretion will remain in the classification of cases into the various response categories.
Surveys generally differ in terms of subject matter, format, respondent incentives, and sponsors,
all factors that are likely to affect response rates. Political and economic conditions prevalent at the time
may also affect response rates (Harris-Kojetin and Tucker, 1999). Consequently, inferences about trends
in nonresponse rates must generally be based on a limited number of on-going surveys, mainly
6
government sponsored, that change little in content and format over extended periods of time.
There are tradeoffs between survey effort and response rates that may allow survey organizations
to counter trends with increasing investments in costly efforts (Groves and Couper, 1998:164-165).
Better training and supervision, costly activities, may make interviewers more effective in overcoming
initial refusals. More call-backs can reduce the proportion of sampled persons who are never reached,
and longer survey periods may reduce the proportion of sampled persons who do not respond because
they postpone interviews for reasons of illness, family crisis, vacations, or work schedules. Monetary
incentives may produce higher response rates (Singer, et al., 1999). Unfortunately, descriptions of
surveys rarely provide enough information to take account of differences in costs to permit statistical
meta-analyses.
Despite these limitations, several studies provide plausible evidence of long-term increases in
nonresponse rates. Using data from the first three decades of the National Election Studies and the
Surveys of Consumer Attitudes, Charlotte Steeh (1981) documented a steady increase in the nonresponse
rate in in-person interviews, primarily due to an increasing percentage of sampled individuals who
refused to be interviewed. She also found that the switch of the Surveys of Consumer Attitudes to
telephone interviews accelerated the trend (Steeh, 1981: 54). Subsequent analysis of the Surveys of
Consumer Attitudes showed that the nonresponse trend, including disproportionate increases in refusals
continued over the period 1980 to 1998 (Steeh et al., 2000). The Surveys of Consumer Attitudes still
achieves an exceptionally high response rate of about 70 percent as compared to more commonly
achieved rates in the 30 to 50 percent range (Steeh et al, 2000).
Although not directly relevant to the question of nonresponse rates in telephone surveys, an
analysis of six large, and immensely important, household surveys administered primarily through in-
person interviews (Current Population Survey, Consumer Expenditure Diary Survey, Consumer
Expenditure Quarterly Survey, National Health Interview Survey, National Crime Victimization Survey,
7
and Survey of Income and Program Participation) showed increases in nonresponse rates over the period
1990 to 1998; all but one survey showed an increase in the percentage of nonresponses due to refusals
(Atrostic et al., 1999).
Technological Changes in Telephone Services
Telecommunications have become much more complex over the last decade, and are likely to
continue to evolve in ways that will complicate telephone surveying. Some changes that had large
potential for interfering with telephone surveys, such as the increased use of answering machines or
caller-ID to screen calls, so far appear not to pose substantial problems in practice (Link and Oldendick,
1999; Oldendick and Link, 1994; Piazza, 1994; Tuckel and Feinberg, 1991). The practical implications
of the increase in the pool of residential numbers and in the number of cell phone subscriptions are still
unclear.
RDD sampling results in “wasted” calls to non-residential or non-working numbers. Between
1988 and 1998 the pool of possible residential telephone numbers increased by 89 percent while the
number of households with telephones increased by only 11 percent, reducing the likelihood of reaching a
working residential number through RDD from about 21 percent to about 13 percent (Piekarski, 1999).
Further decreases in the percentage of working residential numbers will result as plans for new area codes
are implemented. To reduce the costs of wasted calls, survey organizations now often use two-stage
cluster designs that attempt to eliminate banks (typically numbers with the same first eight digits) with
few residential numbers in the first stage (Pothoff, 1987). As two-stage sampling has a number of
disadvantages, it is likely that list-assisted methods, which sample only from banks that contain a listed
residential number, will be used more commonly in the future despite some bias due to the elimination of
banks that have no listed numbers (Brick et al., 1995). Despite these strategies for reducing the number
of wasted calls, further increases in possible residential numbers will almost certainly increase the costs of
8
administering telephone surveys in the future.
Recent years have also shown a dramatic increase in the number of U.S. cellular telephone
subscribers, from 3.5 million by the end of 1989 to 86 million by the end of 1999 (CTIA, 2000).
Currently, only about 2 percent of cellular subscribers in the U.S. have “cut the cord” and no longer have
regular telephone service (TRAC, 2000). A substantial increase in this percentage would pose serious
problems for RDD sampling. Continued exclusion of cellular numbers from sampling frames would risk
substantial bias, while their inclusion would raise sampling costs and greatly complicate geographic-
based sampling and sample weighting. Of course, if two-way tariffs were to remain common in the U.S.,
respondents would have to pay for the time they spend answering telephone surveys, which would likely
reduce response rates.
Public Responses to Surveys and Pseudo-Surveys
With small sample sizes relative to the population, surveys rarely compete with each other for the
attention of respondents. Yet they must compete with telemarketing and push-polls that are often
presented to respondents as surveys, as well as solicitations for charities and telephone scams that
increase the number of unsolicited telephone calls received. With employment in the U.S. telemarketing
industry growing at three times the rate of employment overall, it is likely that households will be
subjected to even more unsolicited calls in the future
(Brubaker, 2000). Public annoyance with telemarketing is evidenced by the over one-million households
that have joined a “do not call” registry that requires telemarketing firms soliciting in New York State to
strike registry numbers from their call lists (Fried, 2001), as well as by proposed federal legislation to
restrict telemarketing, such as the Telemarketing Victims Protection Act (H.R. 3180, 106th Congress),
which would have prohibited solicitations from 5 p.m. to 7 p.m. Getting beyond instinctive refusals is
likely to pose an increasing problem for survey researchers. University-based surveys face the added
9
difficulty of keeping potential respondents on the line long enough to get through increasingly detailed
informed consent statements.
Surveys themselves have come under attack on at least two counts. First, some observers of
politics believe that politicians pay too much attention to polls. Second, some of these observers also
believe that polls have a liberal bias. Conservative commentators, such as Arianna Huffington (2000:
284), who urge their audiences to refuse to participate in polls, may create a liberal bias even if it does not
now exist.
INCREASING OPPORTUNITY FOR INTERNET SURVEYS
Errors in surveys can stem from a number of sources: coverage, sampling, nonresponse, and
measurement (Couper, 2000: 466). Internet coverage of U.S. households, although currently much less
complete than the approximately 95 percent telephone coverage, is steadily increasing. The commercial
potential of the Internet creates strong incentives for innovative efforts to find ways of reducing sampling,
nonresponse, and measurement errors. Trends in each of these areas suggest that the Internet will become
a more viable survey mode in the future.
Coverage: Increasing Internet Penetration
Internet use in the United States has been growing rapidly, and is becoming more
demographically representative. As recently as 1995, only about 10 percent of households were
connected to the Internet (eMarketer, 2000: 26). Estimates of the current fraction of households with
Internet connections range from between 26 and 44 percent (eMarketer, 2000: 25-26). A survey
conducted in the early 1999 found that among adults over 18 years of age, 34.0 percent had used the
Internet at some time, and 42.4 percent had access to the Internet at either work or home (United States
Bureau of the Census, 1999: 582). A national survey conducted by the Pew Internet & American Life
10
Project found that between May-June and November-December 2000, the fraction of U.S. adult men with
Internet access rose from 50 to 58 percent, and the fraction of U.S. adult women with Internet access rose
from 45 to 54 percent (Rainie et al., 2001: 2).
The population of adult Internet users in the United States has different demographic
characteristics than the general population. Specifically, it is on average younger, better educated, more
male, in households with higher income, and disproportionately white and Asian. These differences,
however, appear to be diminishing rapidly. For example, as recently as 1997, women comprised only
about 17 percent of Internet users, but they now comprise 49 percent of users, close to 52 percent, their
percentage of the population (eMarketer, 2000: 56). By the end of 2000, the fraction of age cohorts with
Internet access were as follows: 18-29 years, 75 percent; 30-49 years, 65 percent; 50-64 years, 51 percent;
and 65 years and over, 15 percent (Rainie et al., 2001: 2). As those over 55 comprise the fastest growing
Internet age group, their currently substantial under-representation is likely to diminish well before it is
inevitably reduced by the aging of current users in the 35-54 age group (eMarketer, 2000: 49). Despite
recent declines in the median household income of Internet users, those with household incomes below
$20,000 remain under-represented among Internet users at 6 percent versus 19 percent in the population;
those with household incomes above $150,000 remain over-represented at 8 percent versus 4 percent
(Mediamark Research, June 2000 as reported in eMarketer, 2000: 72-73). Large-sample mail surveys of
U.S. household conducted in January 1999 and January 2000 by Forrester Research show substantial
convergence in Internet access across ethnic groups, with African-Americans, whites, and Hispanics each
gaining about ten percentage points over the year (Walsh, Gazala, and Ham, 2000: 2). Access estimates
at the end of 2000 were as follows: whites, 57 percent; African-American, 43 percent; and Hispanic, 47
percent (Rainie et al., 2000: 2).
11
Sampling: Commercial Incentives to Create Panels of Willing Respondents
Internet surveying has several features that make it commercially attractive and provide strong
economic incentives for its development. These features are also likely to be attractive to researchers.
First, it has extremely low marginal costs.2 Telephone surveys have relatively high marginal
costs because they involve the time of interviewers and supervisors. Time costs accumulate not only in
proportion to time spent on the telephone with respondents, but also in proportion to the time spent by
interviewers trying to reach respondents. In contrast, server technology makes the marginal costs of
distributing surveys and receiving responses by Internet extremely low.
Low marginal costs imply that, for any given research budget, larger sample sizes are possible.
Larger sample size may be useful to social scientists interested in methodological issues, because it allows
for the comparison of multiple designs within the same sample. Indeed, one motivation for the project
described in this study was to investigate methodological questions in contingent valuation surveys,
where the preferred method for eliciting willingness-to-pay responses, the dichotomous-choice
referendum method, requires relatively large sample sizes to produce reliable estimates.
Second, Internet surveying allows for the provision of more, and more varied, information to
respondents than does telephone surveying. The capability to provide respondents with audiovisual
information during the survey allows for more representative and systematic evaluations of
advertisements and new products than can be obtained from the commonly employed focus groups.
Social scientists interested in the effects of the provision of information on respondent attitudes and
beliefs can provide much stronger “treatments” than are possible with telephone surveying. Tracking
respondents’ utilization of information can also provide a basis for assessing the degree of respondent
effort devoted to the survey. For example, the study reported on here gave roughly half of the Internet
respondents access to a menu of 27 one-page entries on global climate change prior to eliciting their
willingness to pay for ratification of the Kyoto Protocol.
12
Third, Internet surveying permits rapid collection of data. When surveys are components of
product design cycles or political campaigns, the capability to collect data rapidly may permit more
frequent consideration of alternative strategies. Rapid data collection also has value in political polling
and electoral research, especially in elections where large numbers of voters make candidate decisions
close to the election date. Social scientists interested in the effect of events on short-term public opinion
are also likely to find the capacity for rapidly drawing large samples valuable in matching public opinion
to specific events.
Fourth, the low marginal costs of Internet surveying facilitates the identification of respondents
with relatively rare characteristics. Social scientists studying a wide range of rare populations, including
those with specific combinations of demographic and political attributes, typically face a serious needle-
in-the-hay-stack sampling problem. For example, if one were interested in identifying a sample of people
who have volunteered in political campaigns to learn more about the motivations for this type of political
participation, Internet sampling might be feasible where RDD would be prohibitively expensive.
Of course, the major problem with Internet surveying is sampling. No technology comparable to
RDD exists for sampling Internet users. Further, if one did exist, it would almost certainly violate
prohibitions against spamming. Two methods for dealing with the sampling problem have been
developed: large panel and random panel assembly.
Large Panel Assembly
Large panel assembly has been pioneered by Harris Interactive (HI), formerly Harris Black
International, under the leadership of political scientist Gordon S. Black. The approach involves
recruiting Internet users into a panel of willing respondents. This has been done through a variety of
means and sources, including advertisements and sweepstakes, the Harris/Excite poll, telephone surveys,
and product registrations on Excite and Netscape (Taylor et al., 2001). Currently, the panel includes
13
about seven million adults. It is this panel of willing respondents that is randomly sampled for particular
surveys.
From the perspective of traditional survey research methodology, the HI approach seems unlikely
to provide representative samples of the U.S. population. Coverage error is obviously a major concern
given that only about half of U.S. adults currently have Internet access. In addition, the practice of
sending out large numbers of invitations with relatively short periods for response leads to low response
rates and hence raises concerns about nonresponse error. As one prominent survey researcher noted, “At
best, we end up with a large sample representing nothing but itself” (Mitofsky, 1999: 24).
Nevertheless, HI recently had an exceptionally strong showing in one of the few survey
applications in which there is an objective measure of performance – election forecasting. From October
30 through November 6 it polled 300,000 adults, processing over 40,000 interviews per hour. Overall,
the Internet poll did better in predicting state-level presidential votes than did the final telephone polls of
other firms conducted on or after October 27: for the 38 states in which HI polled by Internet, its polls
were off an average of 1.8 percentage points for Gore and 2.5 percentage points for Bush, while the
telephone polls were off an average of 3.9 percentage points for Gore and 4.4 percentage points for Bush
(RFL Communications, 2000; Rademacher and Smith, 2001). The Internet polls also correctly called 26
of 27 Senate races with an average error for the two major candidates of 2.2 percent, and correctly called
seven out of seven governors’ races with an average error for the two major candidates of 1.9 percent
(Taylor, 2001: 38). Although success in election polling depends on more than just the data collected, the
exceptionally strong performance of HI in predicting 2000 election races relative to established telephone
polling firms suggests that it has found a way to control survey error.
Recognizing that, because the panel is not a probability sample, the resulting samples are not
probability samples, HI has developed a method of applying propensity weights (on propensity
weighting, see Rosenbaum and Rubin, 1984; Rubin, 1997; D’Agostino and Rubin, 2000) to make the
14
sample representative in terms of selected covariates. The method involves adding attitudinal and
behavioral questions to RDD telephone and Internet surveys being conducted contemporaneously, though
typically for different purposes. The telephone and Internet data are merged and the attitudinal questions
and standard demographic variables are used to predict the probability of being in one sample rather than
the other. These probabilities, or propensities, then serve as the basis for weighting the Internet sample so
that its pattern of covariates, including the attitudinal and behavioral questions, match those in the
telephone sample.
Random Panel Assembly
Formerly known as Intersurvey, Knowledge Networks (KN), founded by political scientists
Norman Nie and Douglas Rivers in1998, has adopted an alternative approach based on random sampling
of the general population into a panel of WebTV-enabled respondents.3 List-assisted RDD is used to
identify random samples of households. Efforts are made to recruit the 84 percent of sampled households
located in geographic areas with Web TV ISP Network coverage. Mailing addresses for about 60 percent
of the sampled numbers are identified and advance letters, containing either $5 or $10, are sent just prior
to telephone contact. Sample numbers are called up to 15 times in an effort to reach one adult respondent
per household. Recruited households are provided, free of charge, a Web TV unit (an Internet appliance
that connects to a telephone and television), Web access, e-mail accounts for all those in the household 13
years and older, and ongoing technical support. The panel members thus take surveys on standardized
equipment. Panel members agree to participate in at most one survey of approximately 10 to 15 minutes
duration per week. Various incentives, including cash and prizes, are intermittently given to households
that stay in the panel.
Approximately 56 percent of contacted households initially agree to join the panel. Of these, 72
percent allow Web TVs to be installed, and 83 percent of those with installed Web TVs complete the core
15
member and core household profiles needed to enter the panel. On average, surveys assigned to panel
members have a response rate of approximately 75 percent. Taking attrition at each stage into account
yields an overall response rate of about 25 percent (21 percent if Web TV non-coverage is taken into
account). Currently, the panel consists of over 100,000 members and KN expects it to grow eventually to
250,000 members.
Though perhaps not “the most perfect sample of Americans in the history of polling,” as an
article in the New York Times Magazine claimed (Lewis, 2000: 64), the Knowledge Network panel has a
very strong basis for providing nationally representative samples comparable to those provided by
telephone surveys. The coverage and sampling frame are essentially the same as for RDD telephone
surveys. Although the overall response rate is probably lower than for the better telephone surveys, this
is mitigated to some extent because information known about panel members who do not complete
assigned surveys can be used to control statistically for that component of nonresponse error. In terms of
measurement error, there is a risk of panel conditioning, or time-in-sample effects – changes in item
responses resulting from the experience of having been previously surveyed. There have been a small
number of investigations of economic (Silberstein and Jacobs, 1989 on the Consumer Expenditure
Interview Survey; Citro and Kalton, 1993, on the Survey of Income and Program Participation) and
political (Bartels, 1999, on the National Election Study) surveys that have found some evidence of panel
conditioning. Although the evidentiary base is limited, overall, it appears that “conditioning effects do
sometimes occur, but they are not pervasive” (Kalton and Citro, 1993: 211). KN currently anticipates
keeping participants in the panel for no more than three years to reduce the risks of panel conditioning.
PROJECT PURPOSES
In addition to assessing public attitudes concerning global climate change, the study design
included application of a commonly used method for valuing environmental changes and policies. As
16
developed over the last 30 years, the contingent valuation (CV) method has become a prominent survey-
based approach for valuing goods that are not priced or traded in markets. Statements of willingness-to-
pay (or be paid) are elicited from respondents, using various question formats, for proposed changes in
public goods or public policies.4 Where there are no observable behavioral traces associated with the
public goods, CV may be the only way to value them. CV, which is most commonly applied to the
valuation of changes in environmental quality, has been the subject of much methodological debate.
Environmental damage estimates based on CV now have the status of “rebuttable presumption” in federal
court (Kopp et al., 1990). In 1993 a blue ribbon panel of social scientists convened by the National
Oceanic and Atmospheric Administration further legitimized the use of CV for public policy purposes by
concluding that it could be the basis for estimating passive use values in natural resource damage
assessment cases (Arrow et al., 1993). Although most applications and methodological research into CV
deals with environmental issues, it is increasingly seeing use in other areas of public policy where
researchers seek a money metric for public goods. It is conceivable that political scientists might
someday find it useful for assessing people’s willingness-to-pay for changes in such things as the
distribution of income or political processes.
One of the purposes of this study it answer several methodological questions through analysis of
samples collected in parallel surveys administered by telephone and to a samples from the HI (two waves)
and KN panels. First, could the lower cost Internet sample produce estimates of willingness-to-pay
functions comparable to those from the more expensive telephone survey? Second, could splits within
the Internet sample be reasonably used to investigate methodological issues? In particular, does the
inclusion of questions that encourage respondents to think more carefully about their discretionary
income affect their willingness-to-pay? Does the provision of extensive information related to the policy
being evaluated affect respondents’ willingness-to-pay? Third, what is the willingness of the U.S.
population to pay for ratification of the Kyoto Protocol or a modified version of it? These specific
17
questions are addressed elsewhere. Here, we take advantage of a number of questions asked of
respondents to assess more generally whether Internet surveying has progressed sufficiently to be a viable
alternative to telephone surveys in social science research.
The study involves three “treatments” across the survey modes in a 2x2x2 design. First,
approximately half of the respondents in each survey mode were given two “mental accounts” questions
that asked them to estimate their disposable income and their contributions to environmental
organizations and causes, while the others received only the standard CV reminder that payments for the
public good would come at the expense of other items in their budgets. Second, approximately half of the
Internet respondents were given access to “enhanced information” (27 one-page entries) of information
about the science of global climate change (GCC) and the Kyoto Protocol, while the others received only
the descriptive information about the Kyoto Protocol. Third, approximately half of the Internet
respondents were given a referendum question on the actual Kyoto Protocol, while the others were given
a referendum question on a version of the Kyoto Protocol modified to include mandatory reductions in
greenhouse gases for developing countries.
SURVEY INSTRUMENT
The survey instrument had three major sections.5 The first section asked questions to elicit some
basic demographic information, attitudes toward the environment, and knowledge about global climate
change and the Kyoto Protocol. The next section implemented the mental accounts and enhanced
information treatments. The section then asked questions related to household willingness-to-pay for
Senate ratification of the Kyoto Protocol, or the modified Kyoto Protocol, including how respondents
would vote in an advisory referendum for their senators if ratification would cost their households a
specified annual dollar amount in higher taxes and energy prices. The dollar amount, or “bid” price, was
drawn with equal probability from the following list of dollar amounts (6, 12, 25, 75, 150, 225, 300, 500,
18
700, 900, 1200, 1800, and 2400). Follow-up questions asked respondents about their certainty in their
referendum answers. The final section asked questions about the fairness of making public policy
decisions on the basis of willingness-to-pay, political attitudes and participation, additional demographic
data, and, for those who were given access to the enhanced information on global climate and the Kyoto
Protocol, their perceptions of the usefulness and fairness of the information. The survey questions can be
viewed at http://www.unm.edu/instpp/gcc/.6
With only a few exceptions, the wording and order of questions in the telephone script were
exactly replicated in the Internet instrument. Several attitudinal questions were added to the end of the
second HI sample to facilitate propensity weighting; the KN sample also included some standard
proprietary questions at the end.
DATA FROM PARALLEL SURVEYS
The project as originally funded by the National Science Foundation called for an RDD national
telephone sample of approximate 1,200 completed surveys to be collected by the Institute for Public
Policy at the University of New Mexico, and a contemporaneous Internet sample of 6,000 to be collected
by HI from its panel of willing respondents. Subsequently, HI provided a replication gratis and KN
provided a sample from its panel gratis. Consequently, four samples are available for comparison.
The Telephone Sample (January 2000)
The telephone sample, including an initial pretest, was collected between November 23, 1999 and
January 27, 2000. It was drawn using an RDD frame, with non-working numbers stripped, that was
purchased from Survey Sampling, Inc. of Fairfield, Connecticut. The surveys were administered by
weekday evening and weekend shifts using a 19 station CATI laboratory at the Institute for Public Policy.
Sampled numbers were called up to 12 times before being abandoned; hanging appointments were called
19
up to 20 times. Surveys took approximately 15 minutes to complete on average. The yield was 1,699
completed surveys. The response rate was 45.6 percent based on an APPOR (1998) response rate
calculation.7
Probability weights were constructed for two purposes. First, the weights were inversely
proportional to the number of telephone lines of the household to take account of over-sampling due to
multiple telephone numbers. Second, the weights were proportional to the number of adults in the
household to facilitate comparison with samples of individuals.
First Harris Interactive Internet Sample (January 2000)
In January 2000 HI sent invitations to participate in the study to a random sample of its panel of
4.4 million willing U.S. adult respondents. Those invited to participate were given the address of a web
page containing the survey and a password to access it. Those beginning the survey could exit and
reenter the web page until they completed the survey. The survey was closed shortly after quotas for all
of the survey splits were obtained. The total yield was 13,034 completed surveys collected between
January 11 and 19. The response rate, calculated as the ratio of completed surveys to invitations sent, was
4.0 percent.
In order to weight the sample to match the demographics of U.S. adults better, HI employed a
raking procedure (Deville et al., 1993; Zieschang, 1990; Deming and Stephan, 1940). The weights were
selected to match 32 known demographic marginals: four age groups, four regions, and sex.
Subsequently, the same procedure was applied to the telephone sample to create a second set of telephone
weights for comparison purposes.
Second Harris Interactive Internet Sample (July 2000)
In July 2000, HI invited a random sample of its 4.8 million willing U.S. adult respondents to
20
participate in a replication of the survey, yielding a sample size of 11,160 collected between July 10 and
17. The response rate, based on invitations sent and completed surveys, was 5.5 percent. This sample
was propensity-weighted based on attitudinal and behavioral questions concurrently being asked in HI
RDD telephone surveys.8
Knowledge Networks Sample (November 2000)
From November 25, 2000 to December 11, 2000, KN administered the survey to a random
sample of its panel based on previously estimated probability weights to correct for nonresponses in the
selection stages in the panel. Only one respondent was selected per household. Of those sampled, 76
percent completed surveys yielding a sample size of 2,162 and a multi-stage response rate of 24.1 percent
(20.2 taking account of Web TV non-coverage). For this analysis, raking weights based on the Current
Population Survey were estimated for the sample with respect to age, gender, race, ethnicity, region,
education, and metropolitan versus non-metropolitan household location to correct further for
nonresponse bias. These weights also convert the data from a household to a population sample.
SURVEY MODE COMPARISONS
In the following sections we present a number of comparisons across the survey modes. In
general, the telephone sample is taken as the basis of comparison. Two important caveats are worth
noting. First, the telephone sample should not be viewed as a perfect sample. It certainly has all the
flaws common to RDD telephone samples.9 Consequently, the comparisons should be viewed as
answering the question: How do the Internet samples compare to a high-quality telephone sample of the
sort commonly used in social science research? Second, although all four surveys were collected within a
span of 11 months, only the first HI sample is contemporaneous with the telephone sample.
Consequently, underlying changes in the population cannot be ruled out as explanations for differences
21
between these two samples and the two collected subsequently.
Socioeconomic
Demographic comparisons across the modes are presented in Table 1. The first two rows show
mean age and percent male. The weighted data (shown in bold) produce fairly close figures for all four
samples. The next row, percent of respondents with at least a college degree, shows considerable
difference between the telephone and Internet samples. As is often the case in telephone surveys, the
telephone sample overestimates the percentage of adults with a college degree – 41.4 percent as opposed
to 23.2 percent estimated in the March 2000 Current Population Survey. The percentages for the Internet
samples are very close to the Census Bureau estimate. Interestingly, while the HI unweighted sample
percentages for college degree are also gross overestimates, the KN sample percentage is very close,
reflecting to some degree the use of probability weights in sampling from its panel.
The three Internet samples slightly underestimate the population percentages of Hispanics and
African-Americans (both percentages appear close to 12.9 percent in the 2000 Census), while the
telephone sample substantially underestimates these percentages. One striking, but not unexpected
difference is in the percentage of households with a computer – the HI sample percentages are much
larger than those in the telephone and KN sample. Looking just at those in the telephone sample who use
the Internet at least weekly, the percentage with home computers is much closer to the HI samples.
Some caution is needed in interpreting the income figures as this variable, unlike the others
shown, had substantial item nonresponse.10 The mean household income was largest for the telephone
sample, and smallest for the first HI sample. As would be expected, the HI households, with universal
Internet use and high rates of home computer ownership, have substantially larger mean numbers of
telephone lines than do either the telephone or KN samples.
Overall, the weighted Internet samples do quite well in terms of matching the population in terms
22
of basic demographic information, though they show the expected differences in terms of computer and
telephone ownership. As is commonly the case, the telephone sample appears to substantially
overestimate the percentage of the population with college degrees and to underestimate the African-
American and Hispanic percentages in the population.
Environmental Knowledge
Socioeconomic differences among the samples do not necessarily impose a fundamental problem
in that statistical adjustments can be made in analyses to take account of the observable differences. At
the same time, even if the samples were identical in terms of socioeconomic characteristics, they could
still produce different inferences about relationships among variables in the population because they
differ in terms of unobservable characteristics. Although it is never possible to know which unobservable
characteristics are relevant to any particular analysis, it is interesting to explore differences in knowledge,
motivations, and attitudes across the samples where possible. To the extent that the samples appear
similar in terms of the knowledge and attitudes that we can measure, it gives us at least some confidence
in their external validity.
Survey questions intended to elicit respondents’ knowledge about scientific views on the likely
causes and consequences of global climate change provide a basis for comparison. Table 2 compares the
percentage of sample respondents with correct answers to ten environmental knowledge questions,
recognition of the Kyoto Protocol, and an overall knowledge score constructed as the sum of correct
answers and recognition of the Kyoto Protocol. When “don’t know” responses are treated as incorrect
answers (leftmost column under each mode), the KN sample percentages appear substantially and
systematically smaller than those for the telephone or HI samples. When “don’t know” is treated as a
missing value (the rightmost columns under each mode), the KN sample percentages are no longer
systematically smaller than those for the other modes.11 Figure 1 displays the correspondence between
23
the percentages of the Internet samples correctly answering each knowledge question and the percentage
of telephone respondents answering the question correctly. The large number of pluses that lie below the
line, representing equality, are the KN percentages when “don’t know” is taken as an incorrect response.
In order to investigate statistical significance, individual-level probit models for each of the
eleven knowledge questions in Table 2 were estimated: the dependent variable was whether or not the
respondent correctly answered the question (1 if yes, 0 if no), and the independent variables were
indicator variables for the three Internet samples.12 (The 11-point knowledge score, listed in the last row
of Table 2, was modeled as an ordered probit.) For any given knowledge question, asterisks indicate
those that are statistically significant at the 5 percent level. The large sample sizes for these estimations
means that they have large power for finding statistically significant differences. Inclusion of
demographic variables in the estimations generally did not wash out the mode effects.
Table 3 investigates the pattern of correct responses over the eleven knowledge questions. The
six possible Wilcoxon matched-pairs signed-rank tests are shown for the percentages of correct responses
with the different handling of the “don’t know” response. When “don’t know” is treated as an incorrect
answer, the patterns of responses do not statistically differ between the telephone and HI samples at the 5
percent level. Substantively, they show relatively small average percentage differences. The KN sample
differs statistically from all three of the others and shows large average percentage differences. The
picture changes substantially when “don’t know” is treated as a missing value. The KN distribution is no
longer statistically different from the telephone sample, but is statistically different from the second HI
sample. Additionally, although the percentage difference remains small, the distribution of the telephone
sample is statistically different from the distribution of the first HI sample.
Overall, there appear to be statistically significant differences in environmental knowledge among
the survey modes, but these differences generally appear to be substantively small. The higher rates of
“don’t know” in the Knowledge Network sample could possibly be an indication of panel conditioning –
24
either fatigue or changing norms of response (i.e. greater willingness to admit a lack of knowledge
associated with greater exposure to surveys).13
Information Use in Internet Modes
The Internet respondents access to enhanced information provides an opportunity for comparing
survey motivation among the HI and KN samples. The first row of Table 4 shows the percentage of those
who viewed one or more pages of information. The use rates were relatively close (ranging from 72.7
percent for the first HI sample to 66.2 percent for the KN sample), indicating similar initial motivations
across the samples. The HI samples showed more intensity of use in terms of pages visited than did the
KN sample, but all three samples showed similar use times for those who visited at least one page.
Perceptions of the usefulness of the information and its perceived bias varied much less across the
samples.
Do the distributions of responses to the usefulness and bias questions show similar patterns across
the Internet samples? Figures 2 and 3 display response frequencies for these two evaluative questions.
The three samples show roughly similar patterns. Overall, information users in the Internet samples
appear to have perceived the information they accessed in roughly the same way.
Political Variables and Environmental Attitudes
Of particular interest to political scientists is the comparability of the samples with respect to
political attitudes and behavior. Table 5 compares the samples in terms of a number of politically
relevant variables. A number of difference appear. The KN sample has a lower rate of voter registration
than the other samples. It also seems to have a substantially lower rate of membership in environmental
groups than the other samples. All three of the Internet samples seem to be more liberal and have higher
fractions of identification with the Democrat party than the telephone sample. The first HI sample has a
25
noticeably lower percentage of Republican party identifiers and a higher percentage of third party
identifiers.
Relationships between Environmental Views and Ideology
While making estimates of population parameters is often important in social science research,
much empirical work is directed at testing hypotheses about the relationships among variables of interest.
Only when analyses are based on probability samples can we be highly confident about their
generalization to the larger population. As the representativeness of at least the large panel Internet
samples is questionable, it is interesting to ask how inferences might differ across modes. In this spirit
we investigate the following general hypothesis: political ideology affects environmental attitudes.
Specifically, we investigate the relationship between ideology and the three general environmental
attitudes: (1) perceptions of environmental threat, (2) tradeoffs between property rights, and (3) reliance
on qinternational treaties to deal with environmental problems.
Table 6 shows the effect of ideology on perception of environmental threat (11 point scale) as
estimated in three ordered probit specifications.14 In the first specification, ideology and its interaction
with each of the three Internet modes are the explanatory variables (with the telephone survey mode as
the base category). There are a large negative and statistically significant coefficients for ideology under
all four of the survey modes. The small and statistically insignificant coefficient for the ideology-KN
interaction indicates that we would reach the same conclusion using either sample. The interaction terms
for the HI samples show statistically significant impacts of ideology that are about 50 percent larger than
in the other two samples.
As shown in the second column, however, the introduction of a set of standard covariates reduces
the size of the coefficients on the interaction terms for the HI samples, and washes out their statistical
significance. As there was substantial item nonresponse for income, the third column shows the model
26
estimated with all the demographic covariates except income. The ideology interactions for HI do not
lose statistical significance, but they are statistically indistinguishable from the ideology interaction for
the KN sample. Nevertheless, across all modes we find a large negative statistically significant
relationship between ideology and perception of environmental threat.
Table 7 repeats the analysis with perceptions of the validity of tradeoffs between property rights
and the environment as the dependent variable. In the absence of controls, the effect of ideology on the
perception of tradeoffs is statistically indistinguishable between the telephone sample and the first HI
sample, as well as between the telephone sample and the KN sample. With the introduction of the
demographic controls, the relationship also becomes statistically indistinguishable between the telephone
sample and the second HI sample. Removing income from among the demographic controls leaves a
statistically significant difference between the ideology effects for the telephone and second HI sample.
Table 8 tells virtually the same story as Table 7 for the perception of international environmental
treaties. There is no mode interaction for the first HI sample or the KN sample, and the mode interaction
for the second HI sample washes out statistically with a full set of demographic controls including
income.
To summarize, at least in these applications, researchers would not make different statistical
inferences using either the telephone or the KN samples. Further, if one included income and other
demographic controls in the estimation models, one would not make different statistical inferences using
the telephone, or either of the HI samples.
Referendum Voting Models
As a final comparison we investigate mode effects in the basic referendum voting model that
underlies CV analysis.15 We exclude respondents in the Internet studies who were either given access to
enhanced information or were asked to value the modified Kyoto protocol because these treatments did
27
not occur in the telephone sample. The mental accounts treatment, which asked respondents to estimate
the percentage of their monthly income that was available for discretionary spending and how much of
that discretionary income goes toward environmental causes and organizations, was included in all four
samples.16
The “elicitation method” for obtaining information about valuation from respondents employed in
this study was the advisory referendum format.17 After going through a series of questions that were used
as vehicles to explain the provisions and likely consequences of ratification of the Kyoto Protocol,
respondents were asked the following question:
The US Senate has not yet voted on whether to ratify the Kyoto Protocol. If the US does notratify the treaty, it is very unlikely that the Protocol can be successfully implemented. Suppose that a national vote or referendum were held today in which US residents couldvote to advise their Senators whether to support or oppose ratifying the Kyoto Protocol. IfUS compliance with the treaty would cost your household X dollars per year in increasedenergy and gasoline prices, would you vote for or against having your Senators supportratification of the Kyoto Protocol? Keep in mind that the X dollars spent on increased energyand gasoline prices could not be spent on other things, such as other household expenses,charities, groceries, or car payments.
(X is randomly chosen from: 6 12 25 75 150 225 300 500 700 900 1200 1800 2400)
In this case, we consider the simplest possible model: a logistic regression with the response to the vote
question as the dependent variable (yes=1, no=0) and the bid price, income, an indicator for the mental
accounts treatment, an interaction between the mental accounts indicator and bid price (X), and, in some
models, basic demographic controls, as the explanatory variables. If the focus of the analysis were
actually on the estimation of willingness-to-pay, then many additional variables would be included and
estimation would involve more complicated models that would blur our focus here on comparison across
modes. Nevertheless, this simple model, which is representative of the type typically estimated in CV
studies as an initial check to see if the data meets minimal construct validity requirements (most
importantly declining probability of voting yes as the bid price increases), allows us to focus clearly on
mode effects.
28
The first column of Table 9 shows the basic model without demographic controls. It shows
similar patterns of coefficients as the models for the individual modes shown in the last four columns.
Bid price and income have the expected signs and statistical significance; the statistically significant
coefficients for the mental accounts indicator and its interaction with bid price shows that the mental
accounts treatment reduces the probability of voting yes for bid amounts up to about $1375, which is near
the upper extreme of the bid range. Thus, it appears that asking respondents to answer questions about
their discretionary income (and perhaps focusing their attention on their budget contraints) generally
lowers their probability of voting yes for the referendum. The negative and statistically significant
coefficients for the Internet samples indicates that, other things equal, Internet respondents are less likely
to vote yes. The first HI sample shows a relatively small effect whose statistical significance washes out
with the addition of demographic controls (column 2). The second HI and the KN samples have roughly
the same size and remain statistically significant with the addition of the demographic controls.
When the model in first column of Table 9 is saturated with mode interactions for bid price,
income, mental accounts indicator, and the mental accounts-bid price interaction (not shown), the only
statistically significant mode effect is the constant shift for the KN sample, which cannot be statistically
distinguished from the shift effect for the second HI sample. None of the adjusted Wald tests for the
interaction triplets being simultaneously zero can be rejected. Consequently, with the exception of a
generally lower acceptance rate for the KN sample, it appears that there are no consistent mode effects in
the referendum model. Further, across all four samples, the analyst would make the same policy
inference for the validity test – the probability of voting yes on the referendum is significantly and
inversely related to the respondent’s price for the policy.
CONCLUSION
All survey methods involve errors. The appropriate question, therefore, is not, Can the Internet
29
replace the telephone as the primary mode of administration in social science survey research? Rather, it
is, Under what circumstances is use of Internet surveys appropriate? We have explored this question by
making a variety of inferential comparisons among a standard RDD sample, and samples from the leading
firm in the development of a large panel of willing Internet users (Harris Interactive) and the leading firm
in the development of a random panel of Web TV-enabled respondents (Knowledge Networks).
Although many differences arose, across a variety of tests on attitudes and voting intentions, the Internet
samples produced relational inferences quite similar to the telephone sample. Readers will have to judge
for themselves if the similarity we found gives them sufficient confidence to use Internet samples for their
particular research questions.
At the same time, Internet surveys based on either large panels or random panels offer
possibilities for some types of research that were previously prohibitively expensive. One of these
possibilities is the generation of large sample sizes to permit the investigation of methodological
questions within the context of the same survey – the large HI sample sizes that allowed us to use a three-
treatment design make this point clear. A second possibility is the opportunity to provide much more
information to respondents than is feasible in any other survey mode. Both Internet firms were able to
support our enhanced information treatment, and KN was also able to track visits to and time spent on
particular information pages. A third possibility, not explored in this study, is the capability to generate
samples of the population with rare characteristics. Finally, the extension of the HI panel to include
willing respondents from other countries opens up intriguing possibilities for comparative analysis.
We expect that the dialogue and debate over the use of Internet samples will continue, and, with
time, the weight of evidence will allow judgment to be made. Political and other social scientists who
rely on survey data for their research should be concerned about these developments. We hope that the
analysis presented here provides a catalyst for future inquiry.
30
1. Between January 1990 and April 2001, for example, 21 percent, 35 percent, and 33 percent of thearticles in the American Political Science Review, the American Journal of Political Science, and theJournal of Politics, respectively, were based on survey data.
2. Although we do not have information on the marginal costs of sampling from the Harris Interactive orKnowledge Networks panels, we can provide the following comparison of commercial rates for an 18minute survey: Knowledge Networks ($60 thousand for 2000 completions); Harris Interactive ($35thousand for 2000 completions; $72 thousand for 6000 completions). By way of comparison, ourtelephone survey with about 1,700 completions cost approximately $50 thousand. The first HarrisInteractive sample actually cost the project $40 thousand; as noted in the text, the second HarrisInteractive and the Knowledge Networks samples were provided free of charge, suggesting relatively lowmarginal costs.
3. CentERdata, an affiliate of Tilburg University, The Netherlands, has maintained a panel of Internetrespondents since 1991. Its panel consists of 2000 Dutch households, each of which completes a weeklysurvey (centerdata.kub.nl).
4. For overviews of CV, see Mitchell and Carson (1989), Bishop and Heberlein (1990), Bateman andWillis (2000), Boardman et al. (2001). Critical views are thoroughly reviewed in Hausman (1993).
5. Development of the survey instrument began in the summer of 1998 as part of the preparation of agrant application to the National Science Foundation. On short notice, HI generated an Internet sample(N=869) to provide comparisons with questions on global climate change that had appeared in a nationaltelephone survey focusing on global climate change conducted by the Institute of Public Policy at theUniversity of New Mexico in November and December 1997. After receipt of the grant, a focus groupwas held at the Institute for Public Policy to help determine question format and content. A “beta”version web survey instrument was constructed by the authors to help in the process of designing a surveyinstrument that could be administered by both telephone and Internet. The beta version included the 27pages of information on global climate change and the Kyoto Protocol developed collaboratively by theauthors and reviewed by students and others with varying degrees of knowledge about global climatechange. A CATI version of the survey was prepared and provided to HI (and subsequently to KN). HIprepared and pre-tested its survey instrument in December 1999. Implementation of the telephone surveybegan prior to administration of the Internet version to allow for adjustment of the random bid prices.
6. Visitors to the web site are randomly assigned to treatments. Those wishing to see specific treatments,such as the enhanced information pages, may thus have to visit the site several times.
7. The formula used for the response rate is completes plus partials divided by completes plus partialsplus “break offs” plus unfinished appointments plus refusals plus those not interviewed due to a languagebarrier plus those too ill to be surveyed.
8. HI uses several different question sets for propensity weighting. In this study, in additional to threeattitudinal questions about whether Washington was in touch with the rest of the country, personalefficacy, and information overload, respondents were asked if they owned a retirement account andwhether they had read a book, traveled, or participated in a team or individual sport over the last month.
NOTES
31
9. The Institute for Public Policy has been conducting RDD polls for over a decade. Its surveys haveprovided data for studies published in a variety of social science journals.
10. The item response rates for income were as follows: telephone, 84.9 percent; first HI 79.8 percent,Second HI, 82.1 percent, and KN, 70.9 percent.
11. Mondak (1999) argues against the common practice of treating “don’t knows” as incorrect answers inthe construction of knowledge scales. His analysis suggests that treating “don’t know” as missingprovides a more meaningful comparison.
12. All statistical estimations presented in this paper treat the modes as survey strata, each with their ownset of probability weights. The estimations were done using the STATA Version 6 statistical softwarepackage.
13. Only the number of previous surveys competed (as opposed to number requested) are available in theKN data set. The number of previous completions does not appear to have any statistically significanteffect on the total number of “don’t knows” in the eleven-question set for males. There appears to be aweak quadratic relationship between “don’t knows” and previous completions for females – suggestingthat don’t knows fall during the first 14 completions and rise thereafter. In the sample, the mean numberof previous completions was 18.
14. The results in this section would be qualitative the same if linear regression rather than ordered probitmodels were estimated. The results would not hold if the analyses were done using unweighted data –demographic controls generally do not wash out the mode interactions when the data are not weighted.
15. Although not done here, estimates of mean willingness-to-pay can be derived from models withrandomly assigned bid prices (see Cameron and James, 1987).
16. The mental accounts treatment had two compartments. First level compartment: “Now think aboutyour average monthly income and expenses. After you have paid all the necessary bills for such things ashousing, transportation, groceries, insurance, debt, and taxes, what percent of your income is left over foroptional uses on things like recreation, savings, and giving for charity and other causes?” Second levelcompartment: “Now think about the portion of your total income available for optional uses. On average,what percent of that amount do you use for contributions to environmental causes, such as donations forspecific programs or contributions and memberships to environmental advocacy groups?”
17. In the case of a public good, such as reduction in the emissions of greenhouse gases, only a questionof this sort which elicits a binary response to a specific price can be incentive compatible with honestrevelation, and then only if the respondent anticipates having to pay the stated price upon provision of thepublic good. See Carson et al. (1999).
32
REFERENCES
AAPOR, Standard Definitions: Final Dispositions of Case Codes and Outcome Rates for RDD Telephone
Surveys and In-Person Household Surveys, American Association for Public Opinion Research
(1998).
Arrow, Kenneth, Robert Solow, Paul Portney, Edward Leamer, Roy Radner, and Howard Schulman,
“Report fo the NOAA Panel on Contingent Valuation,” Federal Register, 58:10 (1993), 4601-
4614.
Atrostic, B. K., Nancy Bates, Geraldine Burt, Adriana Silberstein, and Franklin Winters, “Nonresponse in
U.S. Government Household Surveys: Consistent Measures and New Insights,” Paper presented
at the International Conference on Survey Nonresponse, Portland, Oregon, October 28-31 (1999).
Bartels, Larry M., “Panel Effects in the American National Election Studies,” Political Analysis, 8:1
(1999), 1-20.
Bateman, Ian J. and Ken G. Willis, eds., Valuing Environmental Preferences: Theory and Practice of the
Contingent Valuation Method in the U.S., EC, and Developing Countries (Oxford, UK: Oxford
University Press, 2000).
Bishop, Richard C. and Thomas A. Heberlein, “The Contingent Valuation Method,” in Rebecca L.
Johnson and Gary V. Johnson, eds., Economic Valuation of Natural Resources: Issues, Theory,
and Application (Boulder, CO: Westview Press, 1990), 81-104.
Boardman, Anthony E., David H. Greenberg, Aidan R. Vining, and David L. Weimer, Cost-Benefit
Analysis: Concepts and Practice (Upper Saddle River, NJ: Prentice Hall, 2001).
Brick, J. Michael, Joseph Waksberg, Dale Kulp, and Amy Starer, “Bias in List-Assisted Telephone
Samples,” Public Opinion Quarterly, 59:2 (1995), 218-235.
Brubaker, Steven, Statement on Behalf of the American Teleservices Association before the
Subcommittee on Telecommunications, Trade and Consumer Protection, Committee on
33
Commerce, U.S. House of Representatives, June 13, 2000.
Cameron, Trudy Ann and Michelle D. James, “Efficient Estimation Methods for ‘Closed-Ended’
Contingent Valuation Surveys,” Review of Economics and Statistics, 69:2 (1987), 269-276.
Carson, Richard T., Theodore Groves, and Mark J. Machina, “Incentives and Informational Properties of
Preference Questions,” Plenary Address, European Association of Resource and Environmental
Economists, Oslo, Norway, June (1999).
Citro, Constance F. and Graham Kalton, eds., The Future of the Survey of Income and Program
Participation (Washington, D.C.: National Academy Press, 1993).
Couper, Nick P., “Web Surveys: A Review of Issues and Approaches,” Public Opinion Quarterly, 64:4
(2000), 464-494.
CTIA, “Wireless Industry Indices: 1985-1999,” Cellular Telecommunications Industry Association
(2000).
D’Agosting, Ralph B. Jr., and Donald B. Rubin, “Estimating and Using Propensity Scores With Partially
Missing Data,” Journal of the American Statistical Association, 95:451 (2000), 749-759.
de Leeuw, Edith D., “Preface,” Journal of Official Statistics, 15:2 (1999), 127-128.
Deming, W. Edwards, and Frederick F. Stephan, “On a Least Squares Adjustment of a Sampled
Frequency Table When the Expected Marginal Totals are Known,” Annals of Mathematical
Statistics, 11:4 (1940), 427-444.
Deville, Jean-Claude, Carl-Erik Sarndal, and Oliver Sautory, ‘Generalized Raking Procedures in Survey
Sampling,” Journal of the American Statistical Association, 88:423 (1993), 1013-1020.
eMarketer, The eDemographics and Usage Patterns Report, eMarketer, Inc., New York, September
(2000).
Fried, Joseph P., “Anti-Telemarketing Registry In State Goes Into Effect Today,” New York Times, April
1 (2000), 22.
34
Groves, Robert M. and Mick P. Couper, Nonresponse in Household Interview Surveys. New York: John
Wiley & Sons (1998).
Harris-Kojetin, Brian and Clyde Tucker, “Exploring the Relation of Economic and Political Conditions
with Refusal Rates to a Government Survey,” Journal of Official Statistics, 15:2 (1999), 167-184.
Hausman, J.A., ed., Contingent Valuation: A Critical Assessment (New York: North-Holland, 1993).
Huffington, Arianna, How to Overthrow the Government. New York: Regan Books (2000).
Kalton, Graham and Constance F. Citro, “Panel Surveys: Adding the Fourth Dimension,” Survey
Methodology, 19:2 (1993), 205-215.
Klecka, William R. and Alfred J. Tuchfarber, “Random Digit Dialing: A Comparison to Personal
Interviews, Public Opinion Quarterly, 42:1 (1978), 105-114.
Kopp, Raymond J., Paul R. Portney, and V. Kerry Smith, “The Economics of Natural Resource Damages
after Ohio v. U.S. Department of the Interior,” Environmental Law Reporter, 20:4 (1990),
10,127-10,131.
Lewis, Michael, “The Two-Bucks-a-Minute Democracy,” New York Times Magazine, November 5
(2000), 64-67.
Link, Michael W. and Robert W. Oldendick, “Call Screening: Is It Really a Problem for Survey
Research?” Public Opinion Quarterly, 63:4 (1999), 577-589.
Mondak, Jeffery J., “Reconsidering the Measurement of Political Knowledge,” Political Analysis, 8:1
(1999), 57-82.
Mitchell, Robert C. and Richard T. Carson, Using Surveys to Value Public Goods: The Contingent
Valuation Method (Washington, D.C.: Resources for the Future, 1989).
Mitofsky, Warren J., “Pollsters.com,” Public Perspective, June/July (1999), 24-26.
Oldendick, Robert W. and Michael W. Link, “The Answering Machine Generation: Who Are They and
What Problem Do They Pose for Survey Research?” Public Opinion Quarterly, 58:2 (1994), 264-
35
273.
Piazza, Thomas, “Meeting the Challenge of Answering Machines,” Public Opinion Quarterly, 57:2
(1993), 219-231.
Piekarski, Linda, “Telephony and Telephone Sampling: The Dynamics of Change,” Paper presented at
the International Conference on Survey Nonresponse, Portland, Oregon, October 28-31 (1999).
Pothoff, Richard F., “Generalizations of the Mitofsky-Waksberg Technique for Random Digit Dialing,”
Journal of the American Statistical Association, 82:398 (1987), 309-418.
Rademacher, Eric W. and Andrew E. Smith, “Poll Call,” Public Perspective, March/April (2001), 36-37.
Rainie, Lee, Dan Packel, Susannah Fox, John Horrigan, Amanda Lenhart, Tom Spooner, Oliver Lewis,
and Cornelia Carter, “More On Line, Doing More,” The Pew Internet & American Life Project,
Washington, D.C., February 18 (2001).
RFL Communications, “Harris Interactive Uses Election 2000 to Prove Its Online MR Efficacy and
Accuracy,” Research Business Report, November (2000), 1-2.
Rosenbaum, Paul R. and Donald B. Rubin, “Reducing Bias in Observational Studies Using
Subclassification on the Propensity Score,” Journal of the American Statistical Association,
79:387 (1984), 517-524.
Rubin, Donald B., “Estimating Causal Effects From Large Data Sets Using Propensity Scores,” Annals of
Internal Medicine, 127 (1997), 757-763.
Silberstein, Adriana R. and Curtis A. Jacobs, “Symptoms of Repeated Interview Effects in the Consumer
Expenditure Interview Survey,” in Daniel Kasprzyk, Greg Duncan, Graham Kalton, and M. P.
Singh, Panel Surveys (New York: John Wiley & Sons, 1989), 289-303.
Singer, Eleanor, John Van Hoewyk, Nancy Gebler, Trivellore Raghunathan, and Katherine McGonagle,
“The Effect of Incentives on Response Rates in Interviewer-Mediated Surveys,” Journal of
Official Statistics, 15:2 (1999), 217-230.
36
Steeh, Charlotte, “Trends in Nonresponse Rates, 1952-1979,” Public Opinion Quarterly, 45:1 (1981), 40-
57.
Steeh, Charlotte, Nicole Kirgis, Brian Cannon, Jeff DeWitt, “Are They Really As Bad As They Seem?
Nonresponse Rates at the End of the Twentieth Century,” Revision of paper presented to the
International Conference on Survey Nonresponse, Portland Oregon, October 28-31,1999: Georgia
State University (2000).
Taylor, Humphrey, John Brenner, Gary Overmeyer, Jonathan W. Siegel, and George Terhanian,
“Touchdown! Online Polling Scores Big in November 2000,” Public Perspective, March/April
(2001), 38-39.
TRAC, “Consumer Tips for Cutting the Cord,” (www.trac.org/tips/wiretips.html), Telecommunications
Research and Action Center, Washington, D.C. (2000).
Tuckel, Peter S. and Barry M. Feinberg, “The Answering Machine Poses Many Questions for Telephone
Survey Researchers,” Public Opinion Quarterly, 55:2 (1991), 200-217.
United States Bureau of the Census, Statistical Abstract of the United States,119th Ed. Washington, D.C.:
U.S. Department of Commerce (1999).
Walsh, Ekaterina O, Michael E. Gazala, and Christine Ham, “The Truth about the Digital Divide,” The
Forrester Brief, April 11 (2000). www.forrester.com/ER/Research/Brief/0,1317,9208.FF.htm.
Zieschang, Kimberly D., “ Sample Weighting Methods and Estimation of Totals in the Consumer
Expenditure Survey,” Journal of the American Statistical Association, 85:412 (1990), 986-1001.
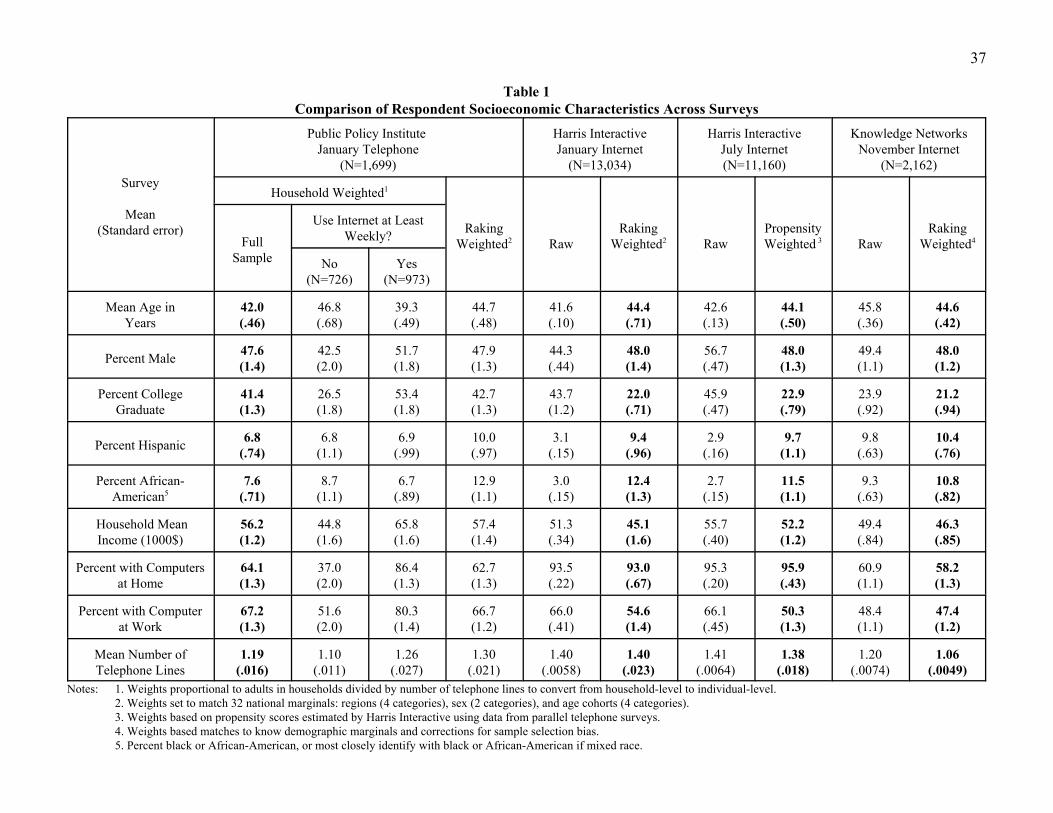
37
Table 1Comparison of Respondent Socioeconomic Characteristics Across Surveys
Survey
Mean(Standard error)
Public Policy Institute January Telephone
(N=1,699)
Harris InteractiveJanuary Internet
(N=13,034)
Harris InteractiveJuly Internet(N=11,160)
Knowledge NetworksNovember Internet
(N=2,162)
Household Weighted1
RakingWeighted2 Raw
RakingWeighted2 Raw
PropensityWeighted 3 Raw
RakingWeighted4Full
Sample
Use Internet at LeastWeekly?
No(N=726)
Yes(N=973)
Mean Age inYears
42.0(.46)
46.8(.68)
39.3(.49)
44.7(.48)
41.6(.10)
44.4(.71)
42.6(.13)
44.1(.50)
45.8(.36)
44.6(.42)
Percent Male 47.6(1.4)
42.5(2.0)
51.7(1.8)
47.9(1.3)
44.3(.44)
48.0(1.4)
56.7(.47)
48.0(1.3)
49.4(1.1)
48.0(1.2)
Percent CollegeGraduate
41.4(1.3)
26.5(1.8)
53.4(1.8)
42.7(1.3)
43.7(1.2)
22.0(.71)
45.9(.47)
22.9(.79)
23.9(.92)
21.2(.94)
Percent Hispanic 6.8(.74)
6.8(1.1)
6.9(.99)
10.0(.97)
3.1(.15)
9.4(.96)
2.9(.16)
9.7(1.1)
9.8(.63)
10.4(.76)
Percent African-American5
7.6(.71)
8.7(1.1)
6.7(.89)
12.9(1.1)
3.0(.15)
12.4(1.3)
2.7(.15)
11.5(1.1)
9.3(.63)
10.8(.82)
Household MeanIncome (1000$)
56.2(1.2)
44.8(1.6)
65.8(1.6)
57.4(1.4)
51.3(.34)
45.1(1.6)
55.7(.40)
52.2(1.2)
49.4(.84)
46.3(.85)
Percent with Computersat Home
64.1(1.3)
37.0(2.0)
86.4(1.3)
62.7(1.3)
93.5(.22)
93.0(.67)
95.3(.20)
95.9(.43)
60.9(1.1)
58.2(1.3)
Percent with Computerat Work
67.2(1.3)
51.6(2.0)
80.3(1.4)
66.7(1.2)
66.0(.41)
54.6(1.4)
66.1(.45)
50.3(1.3)
48.4(1.1)
47.4(1.2)
Mean Number ofTelephone Lines
1.19(.016)
1.10(.011)
1.26(.027)
1.30(.021)
1.40(.0058)
1.40(.023)
1.41(.0064)
1.38(.018)
1.20(.0074)
1.06(.0049)
Notes: 1. Weights proportional to adults in households divided by number of telephone lines to convert from household-level to individual-level.2. Weights set to match 32 national marginals: regions (4 categories), sex (2 categories), and age cohorts (4 categories). 3. Weights based on propensity scores estimated by Harris Interactive using data from parallel telephone surveys.4. Weights based matches to know demographic marginals and corrections for sample selection bias.5. Percent black or African-American, or most closely identify with black or African-American if mixed race.
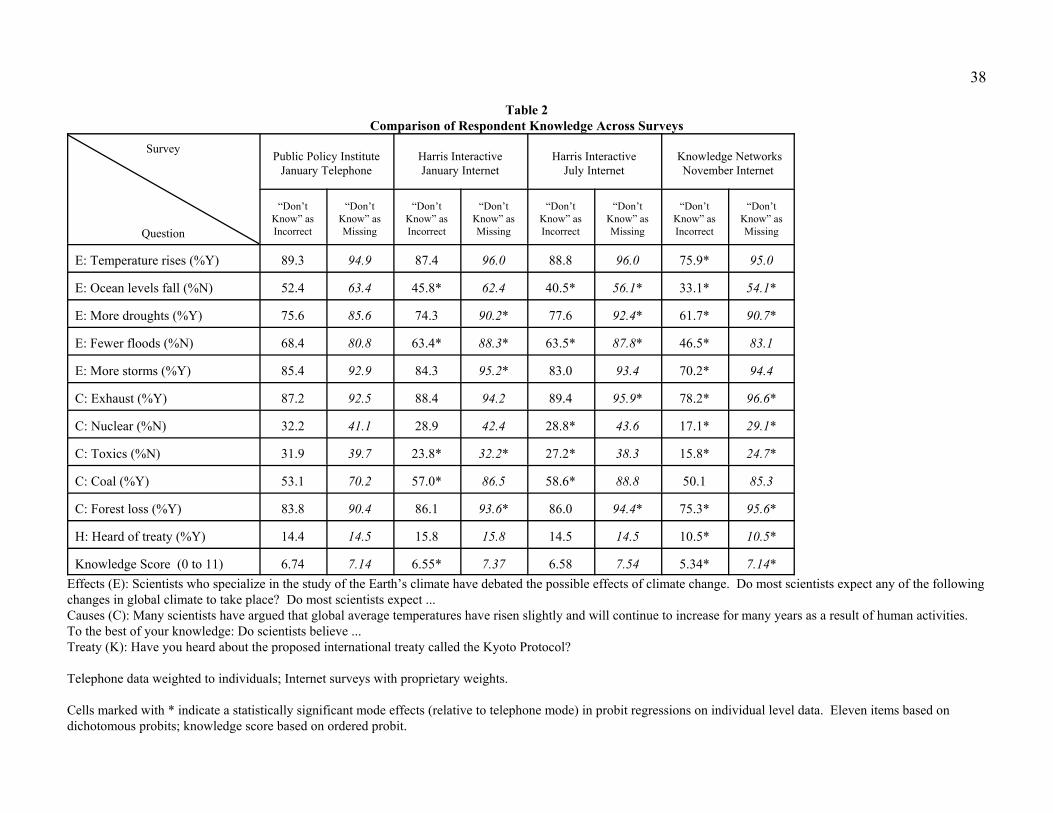
38
Table 2Comparison of Respondent Knowledge Across Surveys
Survey
Question
Public Policy InstituteJanuary Telephone
Harris InteractiveJanuary Internet
Harris InteractiveJuly Internet
Knowledge NetworksNovember Internet
“Don’tKnow” asIncorrect
“Don’tKnow” asMissing
“Don’tKnow” asIncorrect
“Don’tKnow” asMissing
“Don’tKnow” asIncorrect
“Don’tKnow” asMissing
“Don’tKnow” asIncorrect
“Don’tKnow” asMissing
E: Temperature rises (%Y) 89.3 94.9 87.4 96.0 88.8 96.0 75.9* 95.0
E: Ocean levels fall (%N) 52.4 63.4 45.8* 62.4 40.5* 56.1* 33.1* 54.1*
E: More droughts (%Y) 75.6 85.6 74.3 90.2* 77.6 92.4* 61.7* 90.7*
E: Fewer floods (%N) 68.4 80.8 63.4* 88.3* 63.5* 87.8* 46.5* 83.1
E: More storms (%Y) 85.4 92.9 84.3 95.2* 83.0 93.4 70.2* 94.4
C: Exhaust (%Y) 87.2 92.5 88.4 94.2 89.4 95.9* 78.2* 96.6*
C: Nuclear (%N) 32.2 41.1 28.9 42.4 28.8* 43.6 17.1* 29.1*
C: Toxics (%N) 31.9 39.7 23.8* 32.2* 27.2* 38.3 15.8* 24.7*
C: Coal (%Y) 53.1 70.2 57.0* 86.5 58.6* 88.8 50.1 85.3
C: Forest loss (%Y) 83.8 90.4 86.1 93.6* 86.0 94.4* 75.3* 95.6*
H: Heard of treaty (%Y) 14.4 14.5 15.8 15.8 14.5 14.5 10.5* 10.5*
Knowledge Score (0 to 11) 6.74 7.14 6.55* 7.37 6.58 7.54 5.34* 7.14*Effects (E): Scientists who specialize in the study of the Earth’s climate have debated the possible effects of climate change. Do most scientists expect any of the followingchanges in global climate to take place? Do most scientists expect ...Causes (C): Many scientists have argued that global average temperatures have risen slightly and will continue to increase for many years as a result of human activities. To the best of your knowledge: Do scientists believe ...Treaty (K): Have you heard about the proposed international treaty called the Kyoto Protocol?
Telephone data weighted to individuals; Internet surveys with proprietary weights.
Cells marked with * indicate a statistically significant mode effects (relative to telephone mode) in probit regressions on individual level data. Eleven items based ondichotomous probits; knowledge score based on ordered probit.
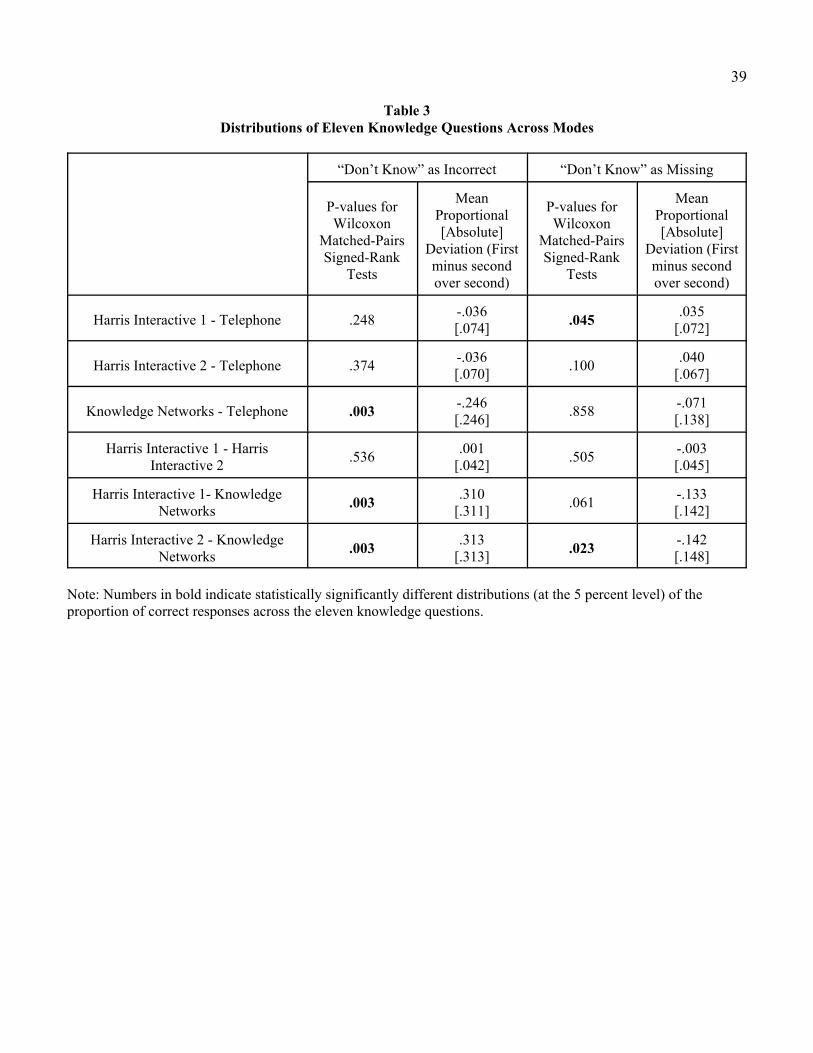
39
Table 3Distributions of Eleven Knowledge Questions Across Modes
“Don’t Know” as Incorrect “Don’t Know” as Missing
P-values forWilcoxon
Matched-PairsSigned-Rank
Tests
MeanProportional[Absolute]
Deviation (Firstminus secondover second)
P-values forWilcoxon
Matched-PairsSigned-Rank
Tests
MeanProportional[Absolute]
Deviation (Firstminus secondover second)
Harris Interactive 1 - Telephone .248 -.036[.074] .045 .035
[.072]
Harris Interactive 2 - Telephone .374 -.036[.070] .100 .040
[.067]
Knowledge Networks - Telephone .003 -.246[.246] .858 -.071
[.138]
Harris Interactive 1 - HarrisInteractive 2 .536 .001
[.042] .505 -.003[.045]
Harris Interactive 1- KnowledgeNetworks .003 .310
[.311] .061 -.133[.142]
Harris Interactive 2 - KnowledgeNetworks .003 .313
[.313] .023 -.142[.148]
Note: Numbers in bold indicate statistically significantly different distributions (at the 5 percent level) of theproportion of correct responses across the eleven knowledge questions.
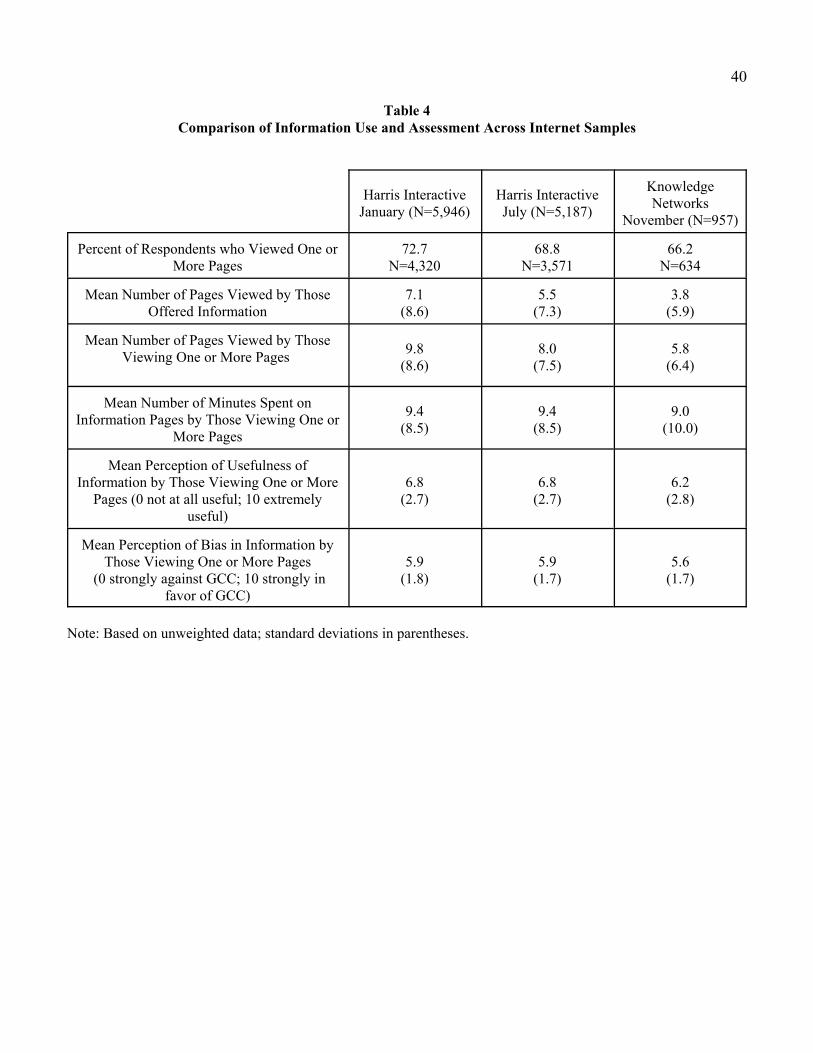
40
Table 4Comparison of Information Use and Assessment Across Internet Samples
Harris InteractiveJanuary (N=5,946)
Harris InteractiveJuly (N=5,187)
KnowledgeNetworks
November (N=957)
Percent of Respondents who Viewed One orMore Pages
72.7N=4,320
68.8N=3,571
66.2N=634
Mean Number of Pages Viewed by ThoseOffered Information
7.1(8.6)
5.5(7.3)
3.8(5.9)
Mean Number of Pages Viewed by ThoseViewing One or More Pages 9.8
(8.6)8.0
(7.5)5.8
(6.4)
Mean Number of Minutes Spent onInformation Pages by Those Viewing One or
More Pages
9.4(8.5)
9.4(8.5)
9.0(10.0)
Mean Perception of Usefulness ofInformation by Those Viewing One or More
Pages (0 not at all useful; 10 extremelyuseful)
6.8(2.7)
6.8(2.7)
6.2(2.8)
Mean Perception of Bias in Information byThose Viewing One or More Pages
(0 strongly against GCC; 10 strongly infavor of GCC)
5.9(1.8)
5.9(1.7)
5.6(1.7)
Note: Based on unweighted data; standard deviations in parentheses.
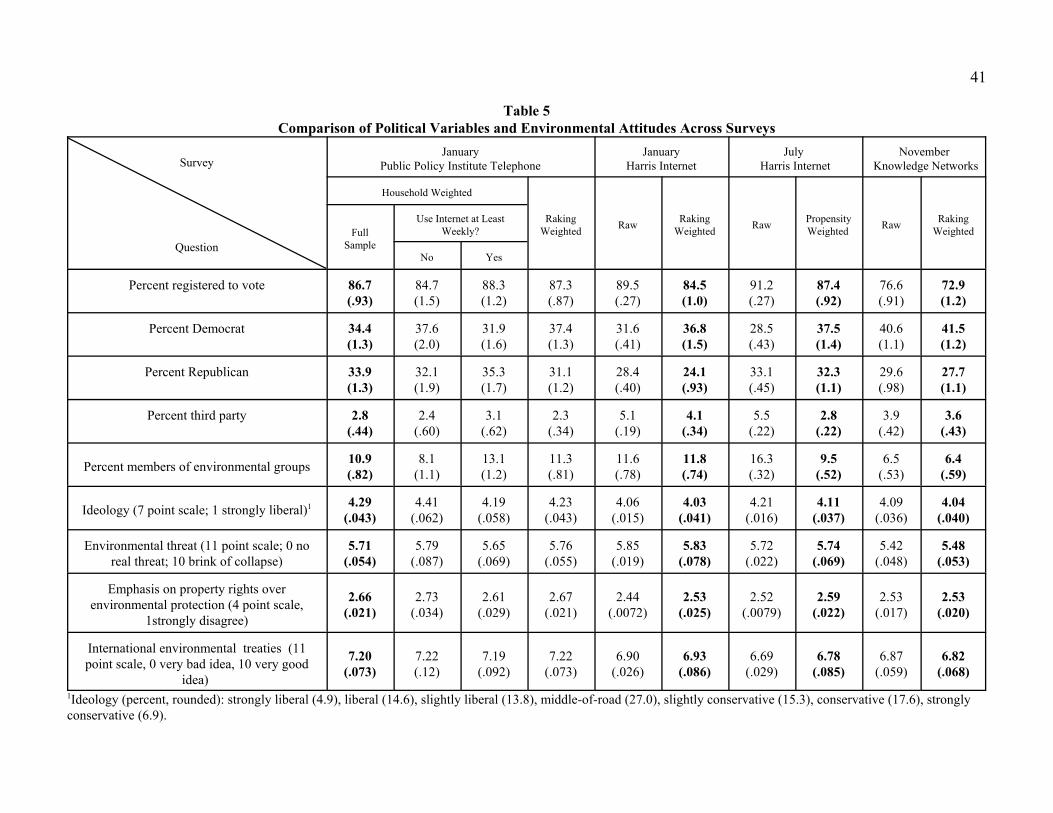
41
Table 5Comparison of Political Variables and Environmental Attitudes Across Surveys
Survey
Question
JanuaryPublic Policy Institute Telephone
JanuaryHarris Internet
July Harris Internet
November Knowledge Networks
Household Weighted
RakingWeighted Raw Raking
Weighted Raw PropensityWeighted Raw Raking
WeightedFullSample
Use Internet at LeastWeekly?
No Yes
Percent registered to vote 86.7(.93)
84.7(1.5)
88.3(1.2)
87.3(.87)
89.5(.27)
84.5(1.0)
91.2(.27)
87.4(.92)
76.6(.91)
72.9(1.2)
Percent Democrat 34.4(1.3)
37.6(2.0)
31.9(1.6)
37.4(1.3)
31.6(.41)
36.8(1.5)
28.5(.43)
37.5(1.4)
40.6(1.1)
41.5(1.2)
Percent Republican 33.9(1.3)
32.1(1.9)
35.3(1.7)
31.1(1.2)
28.4(.40)
24.1(.93)
33.1(.45)
32.3(1.1)
29.6(.98)
27.7(1.1)
Percent third party 2.8(.44)
2.4(.60)
3.1(.62)
2.3(.34)
5.1(.19)
4.1(.34)
5.5(.22)
2.8(.22)
3.9(.42)
3.6(.43)
Percent members of environmental groups 10.9(.82)
8.1(1.1)
13.1(1.2)
11.3(.81)
11.6(.78)
11.8(.74)
16.3(.32)
9.5(.52)
6.5(.53)
6.4(.59)
Ideology (7 point scale; 1 strongly liberal)1 4.29(.043)
4.41(.062)
4.19(.058)
4.23(.043)
4.06(.015)
4.03(.041)
4.21(.016)
4.11(.037)
4.09(.036)
4.04(.040)
Environmental threat (11 point scale; 0 noreal threat; 10 brink of collapse)
5.71(.054)
5.79(.087)
5.65(.069)
5.76(.055)
5.85(.019)
5.83(.078)
5.72(.022)
5.74(.069)
5.42(.048)
5.48(.053)
Emphasis on property rights overenvironmental protection (4 point scale,
1strongly disagree)
2.66(.021)
2.73(.034)
2.61(.029)
2.67(.021)
2.44(.0072)
2.53(.025)
2.52(.0079)
2.59(.022)
2.53(.017)
2.53(.020)
International environmental treaties (11point scale, 0 very bad idea, 10 very good
idea)
7.20(.073)
7.22(.12)
7.19(.092)
7.22(.073)
6.90(.026)
6.93(.086)
6.69(.029)
6.78(.085)
6.87(.059)
6.82(.068)
1Ideology (percent, rounded): strongly liberal (4.9), liberal (14.6), slightly liberal (13.8), middle-of-road (27.0), slightly conservative (15.3), conservative (17.6), stronglyconservative (6.9).
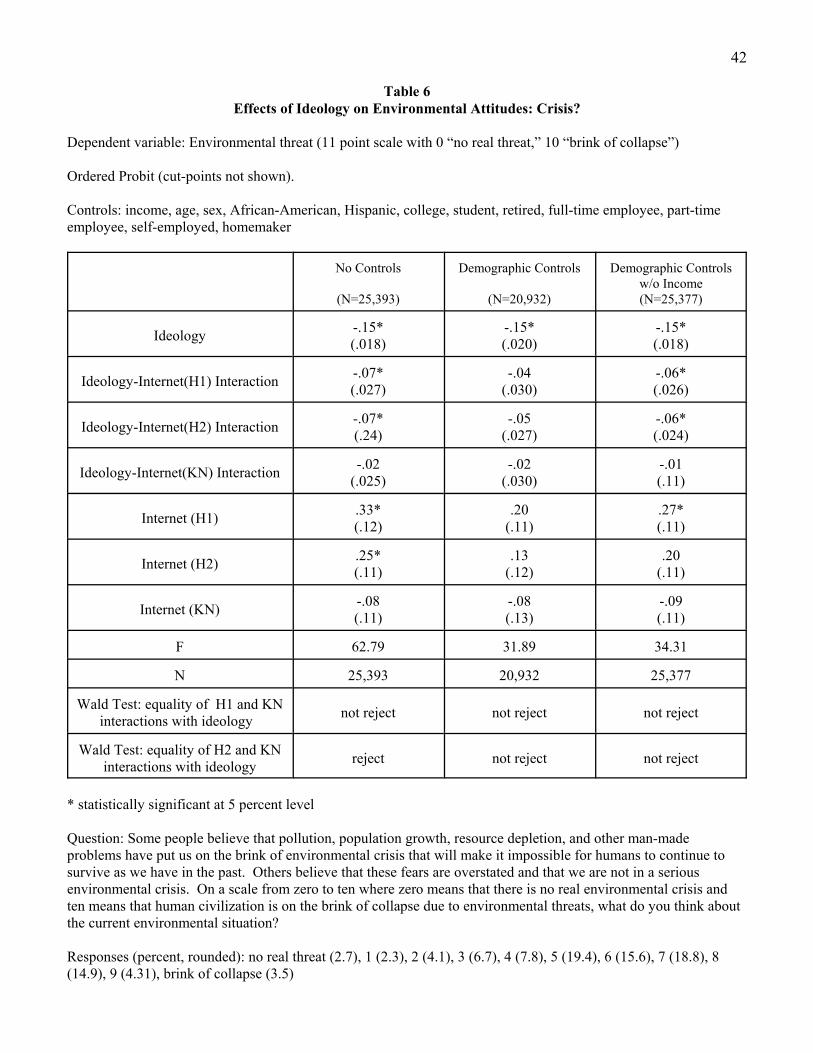
42
Table 6Effects of Ideology on Environmental Attitudes: Crisis?
Dependent variable: Environmental threat (11 point scale with 0 “no real threat,” 10 “brink of collapse”)
Ordered Probit (cut-points not shown).
Controls: income, age, sex, African-American, Hispanic, college, student, retired, full-time employee, part-timeemployee, self-employed, homemaker
No Controls
(N=25,393)
Demographic Controls
(N=20,932)
Demographic Controlsw/o Income(N=25,377)
Ideology -.15*(.018)
-.15*(.020)
-.15*(.018)
Ideology-Internet(H1) Interaction -.07*(.027)
-.04(.030)
-.06*(.026)
Ideology-Internet(H2) Interaction -.07*(.24)
-.05(.027)
-.06*(.024)
Ideology-Internet(KN) Interaction -.02(.025)
-.02(.030)
-.01(.11)
Internet (H1) .33*(.12)
.20(.11)
.27*(.11)
Internet (H2) .25*(.11)
.13(.12)
.20(.11)
Internet (KN) -.08(.11)
-.08(.13)
-.09(.11)
F 62.79 31.89 34.31
N 25,393 20,932 25,377
Wald Test: equality of H1 and KNinteractions with ideology not reject not reject not reject
Wald Test: equality of H2 and KNinteractions with ideology reject not reject not reject
* statistically significant at 5 percent level
Question: Some people believe that pollution, population growth, resource depletion, and other man-madeproblems have put us on the brink of environmental crisis that will make it impossible for humans to continue tosurvive as we have in the past. Others believe that these fears are overstated and that we are not in a seriousenvironmental crisis. On a scale from zero to ten where zero means that there is no real environmental crisis andten means that human civilization is on the brink of collapse due to environmental threats, what do you think aboutthe current environmental situation?
Responses (percent, rounded): no real threat (2.7), 1 (2.3), 2 (4.1), 3 (6.7), 4 (7.8), 5 (19.4), 6 (15.6), 7 (18.8), 8(14.9), 9 (4.31), brink of collapse (3.5)
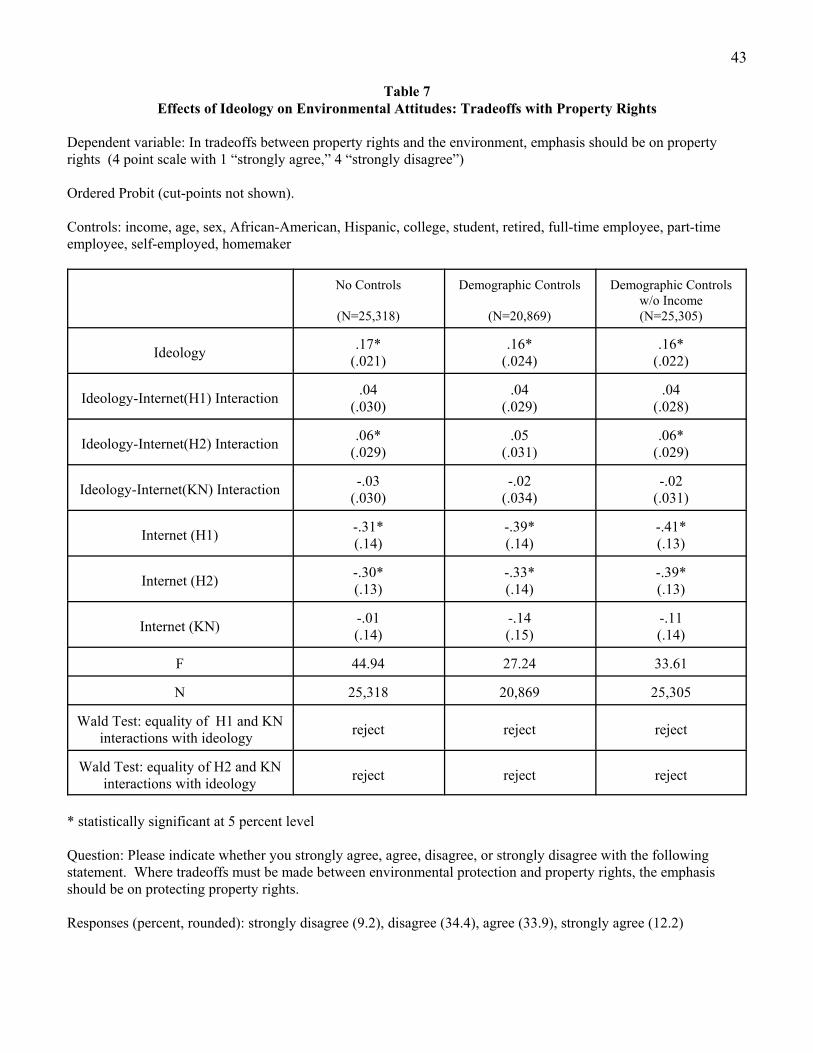
43
Table 7Effects of Ideology on Environmental Attitudes: Tradeoffs with Property Rights
Dependent variable: In tradeoffs between property rights and the environment, emphasis should be on propertyrights (4 point scale with 1 “strongly agree,” 4 “strongly disagree”)
Ordered Probit (cut-points not shown).
Controls: income, age, sex, African-American, Hispanic, college, student, retired, full-time employee, part-timeemployee, self-employed, homemaker
No Controls
(N=25,318)
Demographic Controls
(N=20,869)
Demographic Controlsw/o Income(N=25,305)
Ideology .17*(.021)
.16*(.024)
.16*(.022)
Ideology-Internet(H1) Interaction .04(.030)
.04(.029)
.04(.028)
Ideology-Internet(H2) Interaction .06*(.029)
.05(.031)
.06*(.029)
Ideology-Internet(KN) Interaction -.03(.030)
-.02(.034)
-.02(.031)
Internet (H1) -.31*(.14)
-.39*(.14)
-.41*(.13)
Internet (H2) -.30*(.13)
-.33*(.14)
-.39*(.13)
Internet (KN) -.01(.14)
-.14(.15)
-.11(.14)
F 44.94 27.24 33.61
N 25,318 20,869 25,305
Wald Test: equality of H1 and KNinteractions with ideology reject reject reject
Wald Test: equality of H2 and KNinteractions with ideology reject reject reject
* statistically significant at 5 percent level
Question: Please indicate whether you strongly agree, agree, disagree, or strongly disagree with the followingstatement. Where tradeoffs must be made between environmental protection and property rights, the emphasisshould be on protecting property rights.
Responses (percent, rounded): strongly disagree (9.2), disagree (34.4), agree (33.9), strongly agree (12.2)
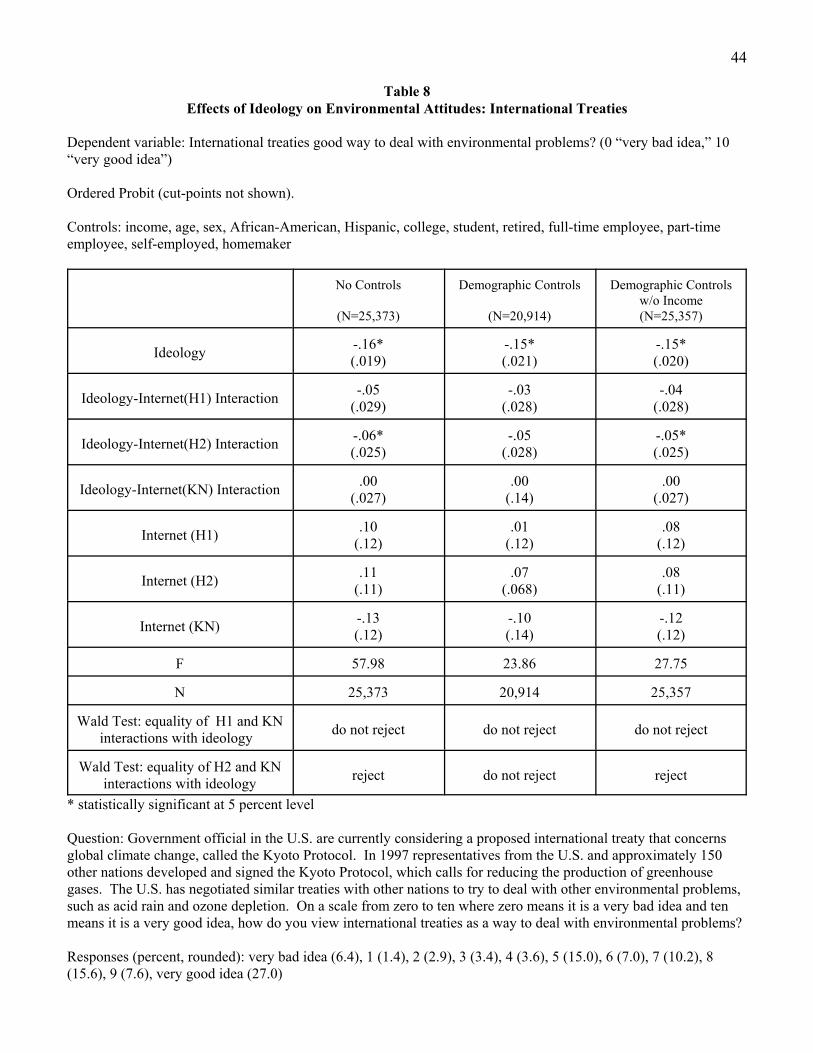
44
Table 8Effects of Ideology on Environmental Attitudes: International Treaties
Dependent variable: International treaties good way to deal with environmental problems? (0 “very bad idea,” 10“very good idea”)
Ordered Probit (cut-points not shown).
Controls: income, age, sex, African-American, Hispanic, college, student, retired, full-time employee, part-timeemployee, self-employed, homemaker
No Controls
(N=25,373)
Demographic Controls
(N=20,914)
Demographic Controlsw/o Income(N=25,357)
Ideology -.16*(.019)
-.15*(.021)
-.15*(.020)
Ideology-Internet(H1) Interaction -.05(.029)
-.03(.028)
-.04(.028)
Ideology-Internet(H2) Interaction -.06*(.025)
-.05(.028)
-.05*(.025)
Ideology-Internet(KN) Interaction .00(.027)
.00(.14)
.00(.027)
Internet (H1) .10(.12)
.01(.12)
.08(.12)
Internet (H2) .11(.11)
.07(.068)
.08(.11)
Internet (KN) -.13(.12)
-.10(.14)
-.12(.12)
F 57.98 23.86 27.75
N 25,373 20,914 25,357
Wald Test: equality of H1 and KNinteractions with ideology do not reject do not reject do not reject
Wald Test: equality of H2 and KNinteractions with ideology reject do not reject reject
* statistically significant at 5 percent level
Question: Government official in the U.S. are currently considering a proposed international treaty that concernsglobal climate change, called the Kyoto Protocol. In 1997 representatives from the U.S. and approximately 150other nations developed and signed the Kyoto Protocol, which calls for reducing the production of greenhousegases. The U.S. has negotiated similar treaties with other nations to try to deal with other environmental problems,such as acid rain and ozone depletion. On a scale from zero to ten where zero means it is a very bad idea and tenmeans it is a very good idea, how do you view international treaties as a way to deal with environmental problems?
Responses (percent, rounded): very bad idea (6.4), 1 (1.4), 2 (2.9), 3 (3.4), 4 (3.6), 5 (15.0), 6 (7.0), 7 (10.2), 8(15.6), 9 (7.6), very good idea (27.0)
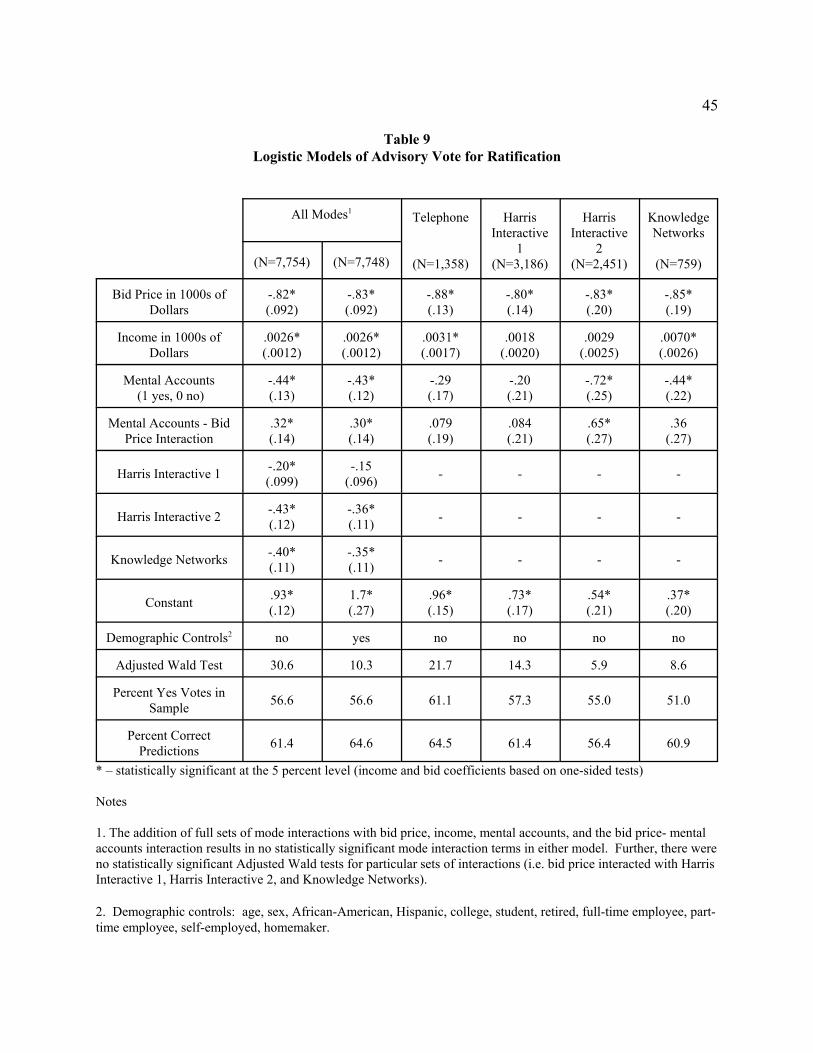
45
Table 9Logistic Models of Advisory Vote for Ratification
All Modes1 Telephone
(N=1,358)
HarrisInteractive
1(N=3,186)
HarrisInteractive
2(N=2,451)
KnowledgeNetworks
(N=759)(N=7,754) (N=7,748)
Bid Price in 1000s ofDollars
-.82*(.092)
-.83*(.092)
-.88*(.13)
-.80*(.14)
-.83*(.20)
-.85*(.19)
Income in 1000s ofDollars
.0026*(.0012)
.0026*(.0012)
.0031*(.0017)
.0018(.0020)
.0029(.0025)
.0070*(.0026)
Mental Accounts (1 yes, 0 no)
-.44*(.13)
-.43*(.12)
-.29(.17)
-.20(.21)
-.72*(.25)
-.44*(.22)
Mental Accounts - BidPrice Interaction
.32*(.14)
.30*(.14)
.079(.19)
.084(.21)
.65*(.27)
.36(.27)
Harris Interactive 1 -.20*(.099)
-.15(.096) - - - -
Harris Interactive 2 -.43*(.12)
-.36*(.11) - - - -
Knowledge Networks -.40*(.11)
-.35*(.11) - - - -
Constant .93*(.12)
1.7*(.27)
.96*(.15)
.73*(.17)
.54*(.21)
.37*(.20)
Demographic Controls2 no yes no no no no
Adjusted Wald Test 30.6 10.3 21.7 14.3 5.9 8.6
Percent Yes Votes inSample 56.6 56.6 61.1 57.3 55.0 51.0
Percent CorrectPredictions 61.4 64.6 64.5 61.4 56.4 60.9
* – statistically significant at the 5 percent level (income and bid coefficients based on one-sided tests)
Notes
1. The addition of full sets of mode interactions with bid price, income, mental accounts, and the bid price- mentalaccounts interaction results in no statistically significant mode interaction terms in either model. Further, there wereno statistically significant Adjusted Wald tests for particular sets of interactions (i.e. bid price interacted with HarrisInteractive 1, Harris Interactive 2, and Knowledge Networks).
2. Demographic controls: age, sex, African-American, Hispanic, college, student, retired, full-time employee, part-time employee, self-employed, homemaker.
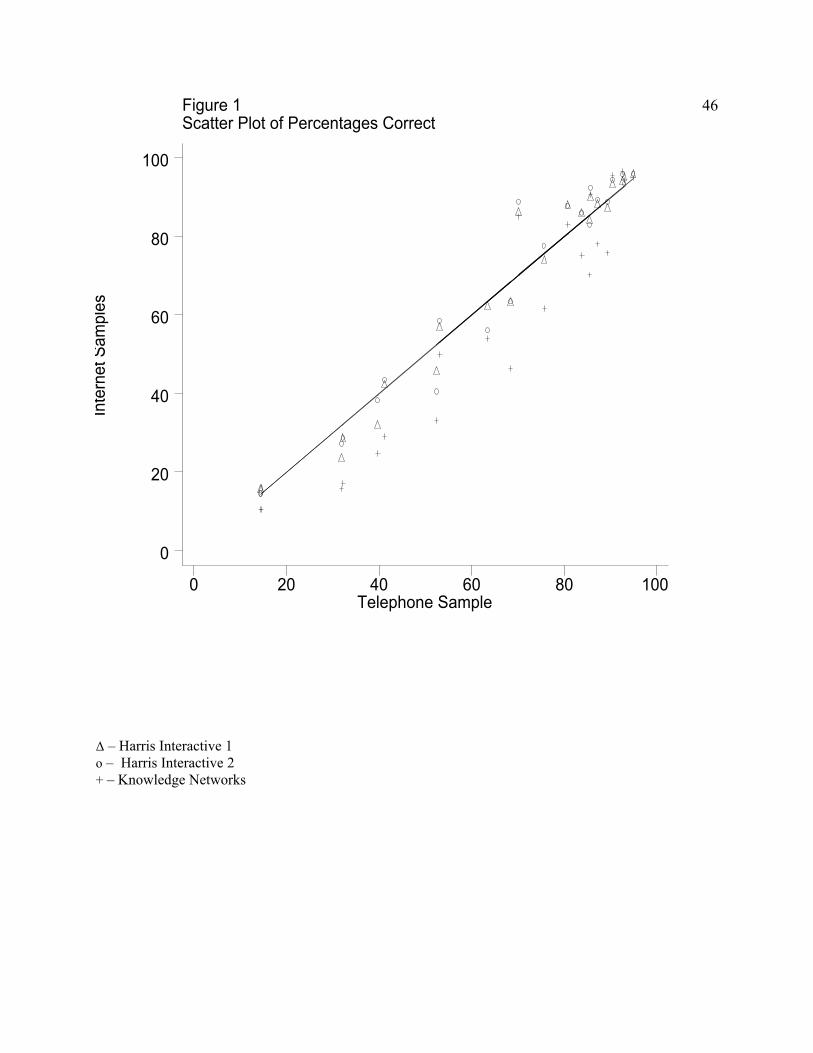
46Figure 1Scatter Plot of Percentages Correct
Inte
rnet
Sam
ples
Telephone Sample0 20 40 60 80 100
0
20
40
60
80
100
∆ – Harris Interactive 1o – Harris Interactive 2+ – Knowledge Networks
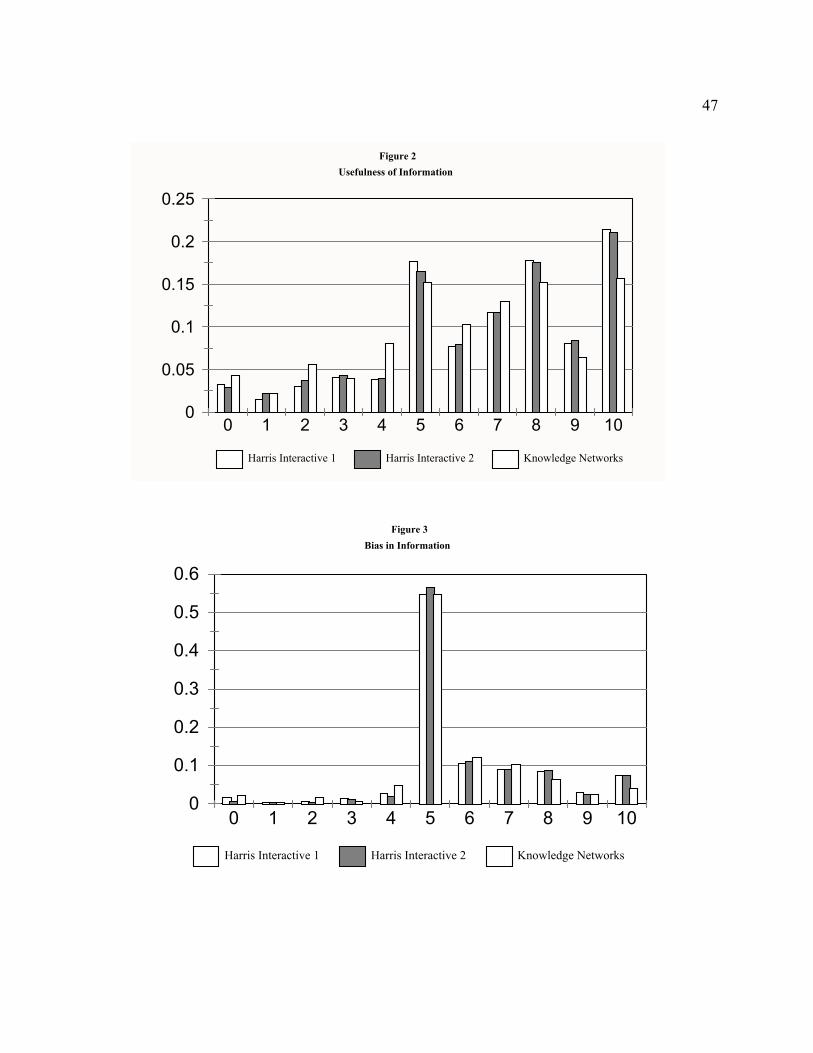
47
0
0.05
0.1
0.15
0.2
0.25
0 1 2 3 4 5 6 7 8 9 10
Harris Interactive 1 Harris Interactive 2 Knowledge Networks
Figure 2Usefulness of Information
0
0.1
0.2
0.3
0.4
0.5
0.6
0 1 2 3 4 5 6 7 8 9 10
Harris Interactive 1 Harris Interactive 2 Knowledge Networks
Figure 3Bias in Information
Related Documents