The Advantages of Entry in the Growth Stage of the Product Life Cycle: An Empirical Analysis Author(s): Venkatesh Shankar, Gregory S. Carpenter and Lakshman Krishnamurthi Source: Journal of Marketing Research, Vol. 36, No. 2 (May, 1999), pp. 269-276 Published by: American Marketing Association Stable URL: http://www.jstor.org/stable/3152098 . Accessed: 20/02/2014 09:47 Your use of the JSTOR archive indicates your acceptance of the Terms & Conditions of Use, available at . http://www.jstor.org/page/info/about/policies/terms.jsp . JSTOR is a not-for-profit service that helps scholars, researchers, and students discover, use, and build upon a wide range of content in a trusted digital archive. We use information technology and tools to increase productivity and facilitate new forms of scholarship. For more information about JSTOR, please contact [email protected]. . American Marketing Association is collaborating with JSTOR to digitize, preserve and extend access to Journal of Marketing Research. http://www.jstor.org This content downloaded from 91.224.27.228 on Thu, 20 Feb 2014 09:47:33 AM All use subject to JSTOR Terms and Conditions

Welcome message from author
This document is posted to help you gain knowledge. Please leave a comment to let me know what you think about it! Share it to your friends and learn new things together.
Transcript
The Advantages of Entry in the Growth Stage of the Product Life Cycle: An EmpiricalAnalysisAuthor(s): Venkatesh Shankar, Gregory S. Carpenter and Lakshman KrishnamurthiSource: Journal of Marketing Research, Vol. 36, No. 2 (May, 1999), pp. 269-276Published by: American Marketing AssociationStable URL: http://www.jstor.org/stable/3152098 .
Accessed: 20/02/2014 09:47
Your use of the JSTOR archive indicates your acceptance of the Terms & Conditions of Use, available at .http://www.jstor.org/page/info/about/policies/terms.jsp
.JSTOR is a not-for-profit service that helps scholars, researchers, and students discover, use, and build upon a wide range ofcontent in a trusted digital archive. We use information technology and tools to increase productivity and facilitate new formsof scholarship. For more information about JSTOR, please contact [email protected].
.
American Marketing Association is collaborating with JSTOR to digitize, preserve and extend access toJournal of Marketing Research.
http://www.jstor.org
This content downloaded from 91.224.27.228 on Thu, 20 Feb 2014 09:47:33 AMAll use subject to JSTOR Terms and Conditions
VENKATESH SHANKAR, GREGORY S. CARPENTER, and LAKSHMAN KRISHNAMURTHI*
In this article, the authors examine how the stage of product life cycle in which a brand enters affects its sales through brand growth and mar- ket response, after controlling for the order-of-entry effect and time in market. The authors develop a dynamic brand sales model in which brand growth and market response parameters vary by stage of life cycle entry, namely, by pioneers, growth-stage entrants, and mature-stage entrants. The authors estimate the model using data on 29 brands from six phar- maceutical markets.
The results reveal advantages associated with entering during the growth stage. Growth-stage entrants reach their asymptotic sales level faster than pioneers or mature-stage entrants, are not hurt by competitor diffusion, and enjoy a higher response to perceived product quality than pioneers and mature-stage entrants. Pioneers reach their asymptotic sales levels more slowly than later entrants, and pioneer's sales, unlike later entrants' sales, are hurt by competitor diffusion over time. On the positive side for pioneers, buyers are most responsive to marketing spending by pioneers. Mature-stage entrants are most disadvantaged; they grow more slowly than growth-stage entrants, have lower response to product quality than growth-stage entrants, and have the lowest response to marketing spending.
The Advantages of Entry in the Growth
Stage of the Product Life Cycle: An
Empirical Analysis
Empirical studies on sequential brand entry demonstrate a link among order of entry, timing of entry, and brand market shares that favors pioneers over later entrants (Bowman and Gatignon 1996; Brown and Lattin 1994; Huff and Robinson 1994; Kalyanaram and Urban 1992; Robinson 1988; Robin- son and Fornell 1985; Urban et al. 1986). The advantages that pioneers enjoy have been shown in these studies to be associated with a direct effect of order of entry and an indi-
*Venkatesh Shankar is Director, Quality Enhancement Systems and Teams (QUEST) Program, and Assistant Professor of Marketing, Robert H. Smith School of Business, University of Maryland (e-mail: [email protected]). Gregory S. Carpenter is Associate Professor of Marketing (e-mail: [email protected]), and Lakshman Krishnamurthi is Chairperson and A. Montgomery Ward Professor of Marketing (e-mail: [email protected]), J.L. Kellogg Graduate School of Management, Northwestern University. The authors are grateful to Vijay Mahajan, Russ Winer, four anonymous JMR reviewers, and participants of the 1996 Marketing Science Conference at Gainesville, Fla., for valuable suggestions and to [MS America for providing the data used in this research. To interact with colleagues on specific articles in this issue, see "Feedback" on the JMR Web site at www.ama.org/pubs/jmr.
rect effect on marketing mix effectiveness (e.g., Bowman and Gatignon 1996; Kalyanaram and Urban 1992). For example, Bowman and Gatignon (1996) show that buyer response to product quality declines with order of entry; later entrants must offer higher quality to generate the same response as earlier entrants. Studies demonstrating these effects implicitly assume that a brand's growth rate and mar- keting mix effectiveness are independent of the stage of the product life cycle in which the brand enters.
The life cycle stage in which a brand enters, however, may significantly affect its market response, rate of growth, and, ultimately, its sales. The classic life cycle concept sug- gests differences in brand sales and growth over a market's life (e.g., Levitt 1965), and econometric studies report sys- tematic variation in market response parameters due to dif- ferent stages of the life cycle (e.g., Winer 1979). Studies of sequential brand entry suggest a role for the life cycle as an influence on brand success. For example, Golder and Tellis (1993) report that brands that enter after the pioneer, during the growth phase of the product life cycle, outsell pioneers in many markets. These findings are consistent with the widely successful "fast follower" strategy (Schnaars 1994).
Journal of Marketing Research Vol. XXXVI (May 1999), 269-276 269
This content downloaded from 91.224.27.228 on Thu, 20 Feb 2014 09:47:33 AMAll use subject to JSTOR Terms and Conditions
JOURNAL OF MARKETING RESEARCH, MAY 1999
Thus, later entrants may enjoy certain advantages that depend on the effects of the stage of life cycle entry on a brand's growth and on the response of its sales to marketing activities. These effects, however, remain unexplored.
In this article, we examine how a brand's growth rate and market response parameters vary by the stage of the market life cycle in which the brand enters, after controlling for order of entry and time in market. To do so, we build a dynamic model of brand sales in which brand sales depend on the order of brand entry and on the growth and market- ing mix (product quality levels and marketing spending) of the brand and its competitors. To model the impact of stage of life cycle entry on brand sales, we allow the model's growth, competitor diffusion, and market response parame- ters to vary by the stage of the life cycle in which the brand enters. We cluster brands as pioneers, growth-stage entrants, and mature-stage entrants, and we examine how growth and market response vary for each type of entrant. We estimate our model using data on 29 brands drawn from six U.S. pre- scription drug markets.
Our results show that, controlling for order of entry and time in market, stage of life cycle entry has a significant impact on growth in brand sales and market response, result- ing in three important sources of advantage for growth-stage entrants. First, we show that growth-stage entrants grow faster than entrants at other stages of the life cycle. Previous findings suggest that brand growth rate increased with order of entry (e.g., Kalyanaram and Urban 1992), which indi- cates no advantage to early following. In contrast, we find an advantage of entering in the growth stage. Second, we find that buyer response to product quality is greatest for growth-stage entrants. Previous studies report a monotoni- cally declining pattern of buyer response to quality, which suggests a source of pioneering advantage (e.g., Bowman and Gatignon 1996). In contrast, our result suggests a previ- ously unidentified source of growth-stage entrant advan- tage. Third, we find that diffusion of competitors affects brands differently, according to their stage of life cycle entry. Pioneers' sales are hurt, whereas growth-stage entrants' sales are not hurt, and mature-stage entrant sales are helped by the diffusion of competitors. Previous studies have not examined the impact of competitor diffusion on brand sales. Our result suggests a potential source of pio- neering disadvantage and late-entrant advantage, consistent with the so-called "fast follower" strategy. In addition, our analysis reports that buyers are most responsive to market- ing spending by pioneers and least responsive to spending by mature-stage entrants. Previous studies have not reported an advantage for pioneers associated with differential pro- motion effectiveness. Our result on this aspect implies a potential new source of pioneering advantage and late- entrant disadvantage. We explore the implications of our results.
MODEL AND HYPOTHESES
To study the impact of life cycle stage of entry on brand sales, we build a dynamic response model in which brand sales is a multiplicative function of order of entry, time in market, the diffusion of competitors, and marketing mix variables, such as product quality and marketing spending (own and competitor).1 These elements are critical determi-
lOur analysis can be expanded to include other marketing mix variables.
nants of a brand's sales (e.g., Bowman and Gatignon 1996; Gatignon, Weitz, and Bansal 1990; Kalyanaram and Urban 1992; Robinson and Fornell 1985; Shankar, Carpenter, and Krishnamurthi 1998). The brand sales response model is as follows:
N
(1) lnSit = a1 + E aklk + 01nOj - (?/Tit) + tCSit + pInQit k=2
+ 'lnMKjt + 6lnCMit + ?it,
where lnSjt is the log sales of brand i at time t, ak is a cate- gory-specific parameter for category k, Ik is a dummy vari- able for category k (I if category is k, 0 otherwise), 0 is the order-of-entry parameter, lnOi is the log of order of entry of brand i, ( is the brand growth parameter, Tit is time in mar- ket for brand i until time t, xv is the competitor diffusion parameter, CSit is cumulative sales of the competitor(s) for brand i until time t, P is the perceived product quality para- meter, lnQit is the log of perceived product quality of brand i at time t, y is the marketing spending parameter, lnMKit is the log of marketing mix expenditures of brand i, 6 is the cross-elasticity of competitors' marketing mix, lnCMit is the log of total marketing mix expenditures of competitors, and ?it is the error term assumed to be distributed normal inde- pendent with mean 0 and variance ai2. The functional form of Equation 1 is consistent with prior models incorporating growth and marketing mix effects (e.g., Kalyanaram and Urban 1992; Urban et al. 1986).2 We expect a negative para- meter reflecting a penalty for later entry (0 < 0), positive sales growth and quality parameters (i.e., 4 > 0 and P1 > 0), diminishing returns to own marketing expenditures (i.e., 0 < Y < 1), and diminishing positive or negative returns to com- petitive marketing expenditures (i.e., 0 < 161 < 1).
To capture differences with the stage of life cycle entry, we allow the parameters for time in market, competitor dif- fusion, perceived product quality, and marketing spending in Equation I to vary with the stage of the life cycle in which the brand enters. We allow each parameter, Z = {o), Av, P, y}, to vary depending on whether the brand is the pioneer or entered in the growth or mature stage of the life cycle. To do so, we define the following:
(2) Z(i) = Zp + ZGGi + ZMMi,
where Zp is the parameter value for a pioneer; Gi and Mi are dummy variables indicating entry of brand i during the growth and mature stage, respectively; and ZG and ZM are the associ- ated parameters. Incorporating these varying entry parameters into Equation I produces our sales response model, as follows:
N
(3) InSit = oai + akik + 01n0i - (p + OGGi + mMMi}/Tit
+ (Vp + vGGi + VMMi)CSit
+ { p + P3GGi + PIMMi}lnQit
+ (yp + YGGi + YMMi}lnM Kit + 6lnCMit + cit-
2The reason CSit is not in log form is because the variable is 0 for the pio- neer until a second entrant enters. Also, a plot of own sales versus cumula- tive competitor sales suggested a semi-log rather than log-log relationship.
270
This content downloaded from 91.224.27.228 on Thu, 20 Feb 2014 09:47:33 AMAll use subject to JSTOR Terms and Conditions
Entry in the Growth Stage
Equation 3 has four important properties. First, it explic- itly incorporates the stage in the product life cycle in which the brand enters through the parameters introduced in Equation 2 while including the direct effects of time in mar- ket and order of entry, similar to prior studies (e.g., Bowman and Gatignon 1996; Brown and Lattin 1994; Huff and Robinson 1994; Kalyanaram and Wittink 1994). Second, Equation 3 allows for both monotonic and nonmonotonic effects of stage of life cycle entry on the growth and market response parameters. In contrast, previous models only incorporate monotonic effects of entry. Equation 3, there- fore, is a generalization of previous models in this sense. Third, Equation 3 captures asymmetries in brand growth, competitor diffusion, and market response parameters cre- ated by the stage of the life cycle in which the brand enters. Each brand has unique growth and market response para- meters; these differences are due to stage of life cycle entry and can be the basis for asymmetric competition. Fourth, we also control for any category-specific or market size effect on a brand's sales by including category-specific intercepts. For a comparison with previous models, see Table 1.
Brand Growth
We capture the effect of brand growth on sales of brand i through exp(-4(i)/Tit) (Shankar 1997). This term captures the main effect of time in market similarly to prior studies (e.g., Brown and Lattin 1994), and in this form, ?(i) implies brand i's rate of growth, in that brand i approaches its asymptotic level faster (slower) as the magnitude of +(i) gets larger (smaller). The impact of stage of life cycle entry on brand growth is captured by 4p + ~GGi + 4MMi. Kalyanaram and Urban (1992) show that later entrants grow more quickly than early entrants, which suggests a monotonic pat- tern of growth with respect to order of entry-that is, <p > 0, dG > 0, and OM > 4G-and a disadvantage for growth- stage entrants relative to mature-stage entrants. The impact of stage of entry, however, may produce a nonmonotonic pattern of results. Pioneers face skeptical consumers, mak- ing trial inducement difficult, whereas brands that enter in the growth stage of the life cycle face an established market, and brands that enter in the mature stage face a more com-
petitive market (Gatignon and Robertson 1985). As a result, growth-stage entrants may grow faster than the pioneer and mature-stage entrants. In that case, we may observe a non- monotonic pattern of parameters in which Op > 0, OG > 0 and OM < %G-
Competitor Diffusion The impact of competitor diffusion on brand i's sales is
captured by the term xr(i). In this form, competitor diffusion increases (decreases) brand i's sales if x(i) is positive (neg- ative). Differences in the impact of competitor diffusion on the sales of brand i, captured in Equation 3 by the parame- ters vp, IVG, and ,IM, reflect the presence or absence of free- rider effects (Shankar 1995). Free-rider effects exist if late entrants can benefit from (i.e., free ride on) the success of earlier entrants (Lieberman and Montgomery 1988). In the case of Equation 3, free-rider effects exist if growth-stage entrants and mature-stage entrants' sales increase as a result of competitor diffusion, whereas pioneers' sales decline as competitor diffusion increases. This implies that xVp < 0, iVp + }VG > 0, and [Vp + AVM > 0.
Perceived Product Quality The impact of perceived product on brand sales is cap-
tured by the variable Qit and its exponent P(i). Market response to perceived quality may differ by stage of life cycle entry, as reflected by the parameters [p, PG, and PM. Although the pioneer faces a market of skeptical and, in many cases, uninformed buyers, higher levels of perceived quality may increase the pioneer's sales (Carpenter and Nakamoto 1989), meaning that Pp > 0. Compared with the pioneer, growth-stage entrants face more knowledgeable buyers who can evaluate better differences in perceived product quality (Bayus, Jain, and Rao 1997), which implies that the market responsiveness to growth-stage entrants' quality is higher than the pioneers', that is, PG > 0. Conversely, if the pioneer's success creates a barrier to trial for growth-stage entrants, then PG < 0, consistent with Bowman and Gatignon's (1996) study on the effect of order of entry on quality. Finally, mature-stage entrants face a market of established brands and may have to compete
Table 1 COMPARISON OF SEQUENTIAL ENTRY MODELS
Measure of Type of Form of Model Sequential Entry Sequential Entry Effect Sequential Entry Effect Source of Asymmetry
Bowman and Gatignon Time in market, order of entry Direct: Order and timing of entry Direct: Monotonic Market response (1996) Indirect: Order of entry Indirect: Monotonic
Brown and Lattin (1994) Time in market, order of entry Direct: Order and timing of entry Direct: Monotonic None
Huff and Robinson Lead time, years of competitive Direct: Order and timing of entry Direct: Monotonic None (1994) rivalry, order of entry
Kalyanaram and Wittink Time between entries, order of Direct: Order and timing of entry Direct: Monotonic None (1994) entry
Urban et al. (1986) Time between entries, order of Direct: Order and timing of entry Direct: Monotonic None entry
This article (1998) Time in market, stage of life Direct: Order and timing of entry Direct: Monotonic Brand growth, cycle entry, order of entry Indirect: Life cycle stage of entry Indirect: Monotonic competitor diffusion,
and nonmonotonic and market response
271
This content downloaded from 91.224.27.228 on Thu, 20 Feb 2014 09:47:33 AMAll use subject to JSTOR Terms and Conditions
JOURNAL OF MARKETING RESEARCH, MAY 1999
fiercely for a place in the consumer's consideration set, making trial and repeat purchase inducements more diffi- cult. With lower trial and repeat purchases, buyers may be unaware of mature-stage entrants' product quality levels, making differences less important. Thus, the response to mature-stage entrants' perceived product quality is lower than earlier entrants, so that PG > PM-
Marketing Spending In Equation 3, the impact of marketing expenditures,
MKit, is captured by y(i). Variations in Y(i) with the stage of the life cycle in which the brand enters are captured by Yp, YG, and YM. We expect that marketing spending will increase the pioneers' sales so that yp > 0. Brands that enter in the growth stage can exploit the category awareness created by the pioneer and enjoy higher response to their marketing spending (Lieberman and Montgomery 1988), which sug- gests that yG > 0. Mature-stage entrants, however, may face a different situation. The number of brands can be large, making it necessary for later entrants to spend more or "shout louder" to be heard. Marketing efforts by multiple brands can lead to a high level of cognitive processing for later entrants, leading to a lower consumer response com- pared with previous entrants. If so, this implies a nonmo- notonic effect of sequential entry with respect to marketing spending response that favors growth-stage entrants, namely, YG > 0, YM < 0, and YG > YM-
Empirical results on advertising and promotion elastici- ties by order of entry are mixed. Parker and Gatignon (1996) find that advertising elasticity of brands decreases as the number of competitors increases. Bowman and Gatignon (1996) do not find any differences in advertising elasticities between pioneers and later entrants but show that promotion elasticities are higher for pioneers than later entrants. These studies suggest a monotonic pattern in marketing spending elasticity, namely, yp > 0 and YM < yG < 0, which implies an advantage for pioneers. Because of contradicting theory and evidence, we cannot make a strong prediction about the expected parameter pattern.
The impact of competitors' marketing efforts on brand sales is captured in Equation 3 through the total competitive marketing expenditures variable CMit and its exponent 8. Equation 3 can be expanded to include separate marketing expenditure variables for each competitor if needed. Com- petitor marketing spending can have either a "rivalrous" or an "industry expansion" effect (Hanssens 1980). If the impact of competitor marketing expands the category more than it reduces own market share, as in a growing market, then a positive competitor spending elasticity is produced. If, however, own market share is reduced more than the cat-
egory volume increase, as in a mature market, the competi- tor spending elasticity will be negative.
DATA AND ESTIMATION
Data
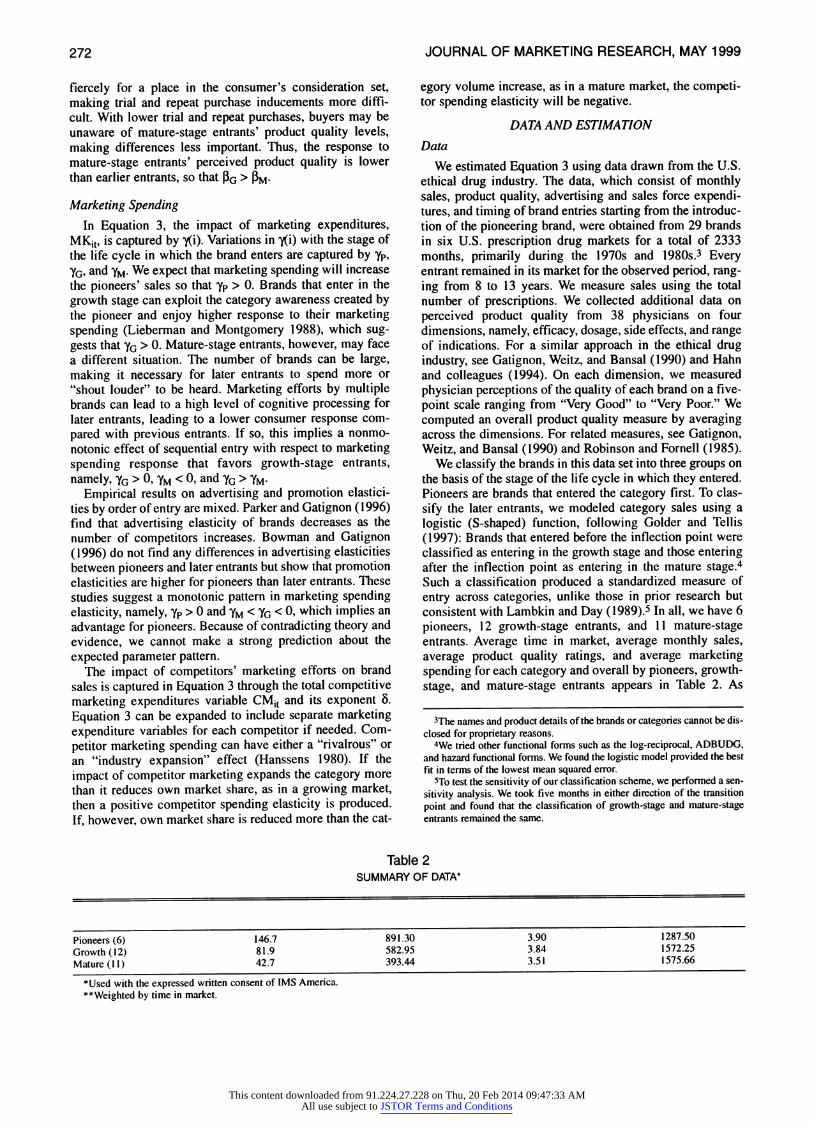
We estimated Equation 3 using data drawn from the U.S. ethical drug industry. The data, which consist of monthly sales, product quality, advertising and sales force expendi- tures, and timing of brand entries starting from the introduc- tion of the pioneering brand, were obtained from 29 brands in six U.S. prescription drug markets for a total of 2333 months, primarily during the 1970s and 1980s.3 Every entrant remained in its market for the observed period, rang- ing from 8 to 13 years. We measure sales using the total number of prescriptions. We collected additional data on perceived product quality from 38 physicians on four dimensions, namely, efficacy, dosage, side effects, and range of indications. For a similar approach in the ethical drug industry, see Gatignon, Weitz, and Bansal (1990) and Hahn and colleagues (1994). On each dimension, we measured physician perceptions of the quality of each brand on a five- point scale ranging from "Very Good" to "Very Poor." We computed an overall product quality measure by averaging across the dimensions. For related measures, see Gatignon, Weitz, and Bansal (1990) and Robinson and Fornell (1985).
We classify the brands in this data set into three groups on the basis of the stage of the life cycle in which they entered. Pioneers are brands that entered the category first. To clas- sify the later entrants, we modeled category sales using a logistic (S-shaped) function, following Golder and Tellis (1997): Brands that entered before the inflection point were classified as entering in the growth stage and those entering after the inflection point as entering in the mature stage.4 Such a classification produced a standardized measure of entry across categories, unlike those in prior research but consistent with Lambkin and Day (1989).5 In all, we have 6 pioneers, 12 growth-stage entrants, and 11 mature-stage entrants. Average time in market, average monthly sales, average product quality ratings, and average marketing spending for each category and overall by pioneers, growth- stage, and mature-stage entrants appears in Table 2. As
3The names and product details of the brands or categories cannot be dis- closed for proprietary reasons.
4We tried other functional forms such as the log-reciprocal, ADBUDG, and hazard functional forms. We found the logistic model provided the best fit in terms of the lowest mean squared error.
5To test the sensitivity of our classification scheme, we performed a sen- sitivity analysis. We took five months in either direction of the transition point and found that the classification of growth-stage and mature-stage entrants remained the same.
Table 2 SUMMARY OF DATA*
Pioneers (6) 146.7 891.30 3.90 1287.50
Growth (12) 81.9 582.95 3.84 1572.25
Mature (I 1) 42.7 393.44 3.51 1575.66
*Used with the expressed written consent of IMS America. **Weighted by time in market.
272
This content downloaded from 91.224.27.228 on Thu, 20 Feb 2014 09:47:33 AMAll use subject to JSTOR Terms and Conditions
Entry in the Growth Stage
Table 2 shows, on average, pioneers outsell later entrants, offer higher quality products, and spend less on marketing.
Estimation
We estimated the pooled time-series cross-sectional model in Equation 3. Before pooling, we tested for homo- geneity of coefficients across categories using the Chow test but did not find heterogeneity in slope parameters.6 The likelihood ratio test of groupwise (brandwise) heteroscedas- ticity (Greene 1993, p. 395) rejected equal error variances, so we used Groupwise Weighted Least Squares estimation.
RESULTS
The results of estimating Equation 3 appear in the second column of Table 3. Overall, the model fits well; the correla- tion between actual and predicted values of the dependent variable is .977. The parameter estimates show significant mean differences in category sales, as reflected in the inter- cept terms of Equation 3, that is, acl, ca2, ..., and c6, four of which are significant.
Brand Growth
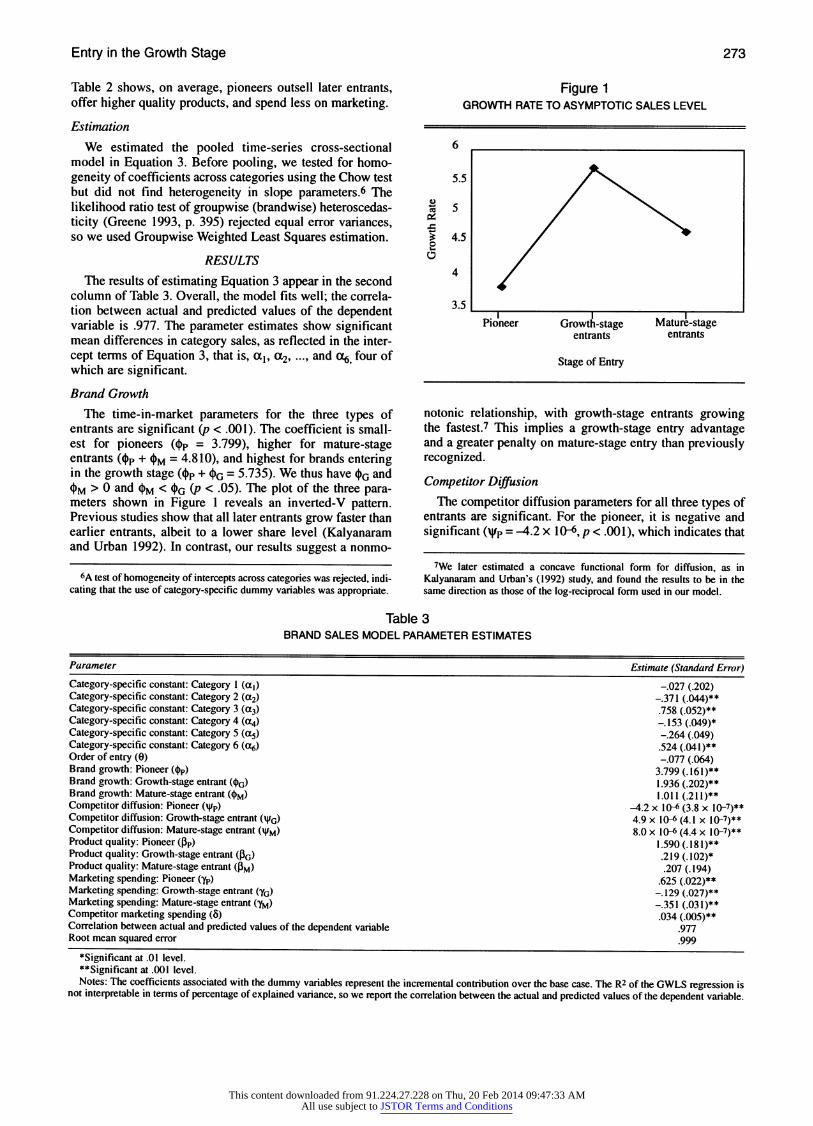
The time-in-market parameters for the three types of entrants are significant (p < .001). The coefficient is small- est for pioneers ('p = 3.799), higher for mature-stage entrants (<p + OM = 4.810), and highest for brands entering in the growth stage (Op + 'G = 5.735). We thus have OG and O>M > 0 and OM < OG (P < .05). The plot of the three para- meters shown in Figure 1 reveals an inverted-V pattern. Previous studies show that all later entrants grow faster than earlier entrants, albeit to a lower share level (Kalyanaram and Urban 1992). In contrast, our results suggest a nonmo-
6A test of homogeneity of intercepts across categories was rejected, indi- cating that the use of category-specific dummy variables was appropriate.
Figure 1 GROWTH RATE TO ASYMPTOTIC SALES LEVEL
6
5.5
0
2
5
4.5
4
3.5
Pioneer Pioneer Growth-stage Mature-stage entrants entrants
Stage of Entry
notonic relationship, with growth-stage entrants growing the fastest.7 This implies a growth-stage entry advantage and a greater penalty on mature-stage entry than previously recognized.
Competitor Diffusion The competitor diffusion parameters for all three types of
entrants are significant. For the pioneer, it is negative and significant (Vp = -4.2 x 10⁻⁶, p < .001), which indicates that
7We later estimated a concave functional form for diffusion, as in Kalyanaram and Urban's (1992) study, and found the results to be in the same direction as those of the log-reciprocal form used in our model.
Table 3 BRAND SALES MODEL PARAMETER ESTIMATES
Category-specific constant: Category I (al) Category-specific constant: Category 2 (a2) Category-specific constant: Category 3 (a3) Category-specific constant: Category 4 (a4) Category-specific constant: Category 5 (a5) Category-specific constant: Category 6 (a6) Order of entry (0) Brand growth: Pioneer (?p) Brand growth: Growth-stage entrant (4G) Brand growth: Mature-stage entrant ($M) Competitor diffusion: Pioneer (Wp) Competitor diffusion: Growth-stage entrant (WG) Competitor diffusion: Mature-stage entrant (fM) Product quality: Pioneer (pp) Product quality: Growth-stage entrant (PG) Product quality: Mature-stage entrant (3M) Marketing spending: Pioneer (yp) Marketing spending: Growth-stage entrant (yG) Marketing spending: Mature-stage entrant (yM) Competitor marketing spending (5) Correlation between actual and predicted values of the dependent variable Root mean squared error
-.027 (.202) -.371 (.044)** .758 (.052)** -.153 (.049)* -.264 (.049) .524 (.041)** -.077 (.064)
3.799 (.161)** 1.936 (.202)** 1.011 (.211)**
-4.2 x 10⁻⁶ (3.8 x 10⁻⁷)** 4.9 x 10⁻⁶ (4.1 x 10⁻⁷)** 8.0 x 10⁻⁶ (4.4 x 10⁻⁷)**
1.590 (.181)** .219 (.102)* .207 (.194)
.625 (.022)** -.129 (.027)** -.351 (.031)** .034 (.005)**
.977
.999
*Significant at .01 level. **Significant at .001 level. Notes: The coefficients associated with the dummy variables represent the incremental contribution over the base case. The R2 of the GWLS regression is
not interpretable in terms of percentage of explained variance, so we report the correlation between the actual and predicted values of the dependent variable.
273
Parameter Estimate (Standard Error)
I4I
-- 1-1 --- - -1 - I /
This content downloaded from 91.224.27.228 on Thu, 20 Feb 2014 09:47:33 AMAll use subject to JSTOR Terms and Conditions
JOURNAL OF MARKETING RESEARCH, MAY 1999
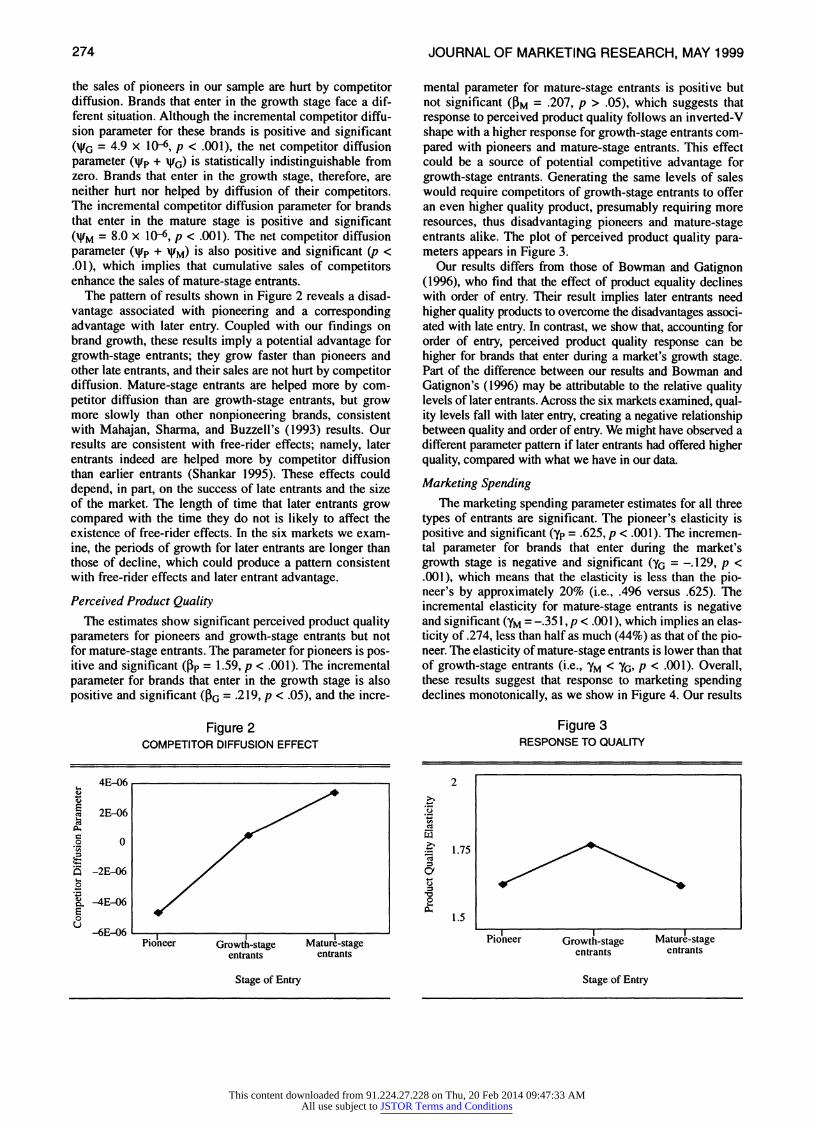
the sales of pioneers in our sample are hurt by competitor diffusion. Brands that enter in the growth stage face a dif- ferent situation. Although the incremental competitor diffu- sion parameter for these brands is positive and significant (VG = 4.9 x 10⁻⁶, p < .001), the net competitor diffusion parameter (Nyp + VG) is statistically indistinguishable from zero. Brands that enter in the growth stage, therefore, are neither hurt nor helped by diffusion of their competitors. The incremental competitor diffusion parameter for brands that enter in the mature stage is positive and significant (WM = 8.0 x 10⁻⁶, p < .001). The net competitor diffusion parameter (Wp + WM) is also positive and significant (p < .01), which implies that cumulative sales of competitors enhance the sales of mature-stage entrants.
The pattern of results shown in Figure 2 reveals a disad- vantage associated with pioneering and a corresponding advantage with later entry. Coupled with our findings on brand growth, these results imply a potential advantage for growth-stage entrants; they grow faster than pioneers and other late entrants, and their sales are not hurt by competitor diffusion. Mature-stage entrants are helped more by com- petitor diffusion than are growth-stage entrants, but grow more slowly than other nonpioneering brands, consistent with Mahajan, Sharma, and Buzzell's (1993) results. Our results are consistent with free-rider effects; namely, later entrants indeed are helped more by competitor diffusion than earlier entrants (Shankar 1995). These effects could depend, in part, on the success of late entrants and the size of the market. The length of time that later entrants grow compared with the time they do not is likely to affect the existence of free-rider effects. In the six markets we exam- ine, the periods of growth for later entrants are longer than those of decline, which could produce a pattern consistent with free-rider effects and later entrant advantage.
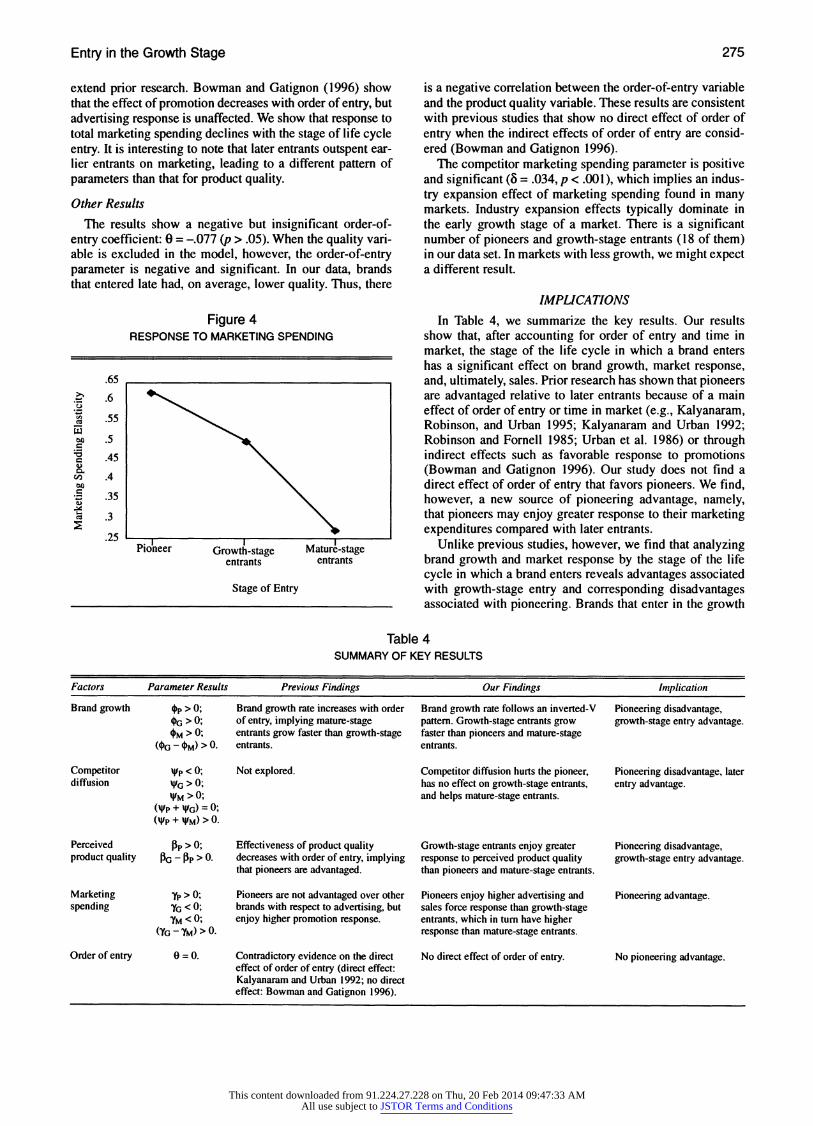
Perceived Product Quality The estimates show significant perceived product quality
parameters for pioneers and growth-stage entrants but not for mature-stage entrants. The parameter for pioneers is pos- itive and significant (Pp = 1.59, p < .001). The incremental parameter for brands that enter in the growth stage is also positive and significant (PG = .219, p < .05), and the incre-
Figure 2 COMPETITOR DIFFUSION EFFECT
t.
0 0.
U
4E-06
2E-06
0
-2E-06
-4E-06
-6E-06
mental parameter for mature-stage entrants is positive but not significant (P3M = .207, p > .05), which suggests that response to perceived product quality follows an inverted-V shape with a higher response for growth-stage entrants com- pared with pioneers and mature-stage entrants. This effect could be a source of potential competitive advantage for growth-stage entrants. Generating the same levels of sales would require competitors of growth-stage entrants to offer an even higher quality product, presumably requiring more resources, thus disadvantaging pioneers and mature-stage entrants alike. The plot of perceived product quality para- meters appears in Figure 3.
Our results differs from those of Bowman and Gatignon (1996), who find that the effect of product equality declines with order of entry. Their result implies later entrants need higher quality products to overcome the disadvantages associ- ated with late entry. In contrast, we show that, accounting for order of entry, perceived product quality response can be higher for brands that enter during a market's growth stage. Part of the difference between our results and Bowman and Gatignon's (1996) may be attributable to the relative quality levels of later entrants. Across the six markets examined, qual- ity levels fall with later entry, creating a negative relationship between quality and order of entry. We might have observed a different parameter pattern if later entrants had offered higher quality, compared with what we have in our data.
Marketing Spending The marketing spending parameter estimates for all three
types of entrants are significant. The pioneer's elasticity is positive and significant (yp = .625, p < .001). The incremen- tal parameter for brands that enter during the market's growth stage is negative and significant (YG = -.129, p < .001), which means that the elasticity is less than the pio- neer's by approximately 20% (i.e., .496 versus .625). The incremental elasticity for mature-stage entrants is negative and significant (YM = -.351, p < .001), which implies an elas- ticity of .274, less than half as much (44%) as that of the pio- neer. The elasticity of mature-stage entrants is lower than that of growth-stage entrants (i.e., yM < yG, p < .001). Overall, these results suggest that response to marketing spending declines monotonically, as we show in Figure 4. Our results
Figure 3 RESPONSE TO QUALITY
2
>4
u
>4-
0
Pioneer Pioneer
1.75
1.5
Pioneer Growth-stage Mature-stage
entrants entrants
I I
Growth-stage Mature-stage entrants entrants
Stage of Entry
I I i
w
Stage of Entry
274
This content downloaded from 91.224.27.228 on Thu, 20 Feb 2014 09:47:33 AMAll use subject to JSTOR Terms and Conditions
Entry in the Growth Stage
extend prior research. Bowman and Gatignon (1996) show that the effect of promotion decreases with order of entry, but advertising response is unaffected. We show that response to total marketing spending declines with the stage of life cycle entry. It is interesting to note that later entrants outspent ear- lier entrants on marketing, leading to a different pattern of parameters than that for product quality.
Other Results
The results show a negative but insignificant order-of- entry coefficient: 0 = -.077 (p > .05). When the quality vari- able is excluded in the model, however, the order-of-entry parameter is negative and significant. In our data, brands that entered late had, on average, lower quality. Thus, there
Figure 4 RESPONSE TO MARKETING SPENDING
.o
O-
ac
0
c:i
.65
.6
.55
.5
.45
.4
.35
.3
.25 Pioneer Growth-stage Mature-stage
entrants entrants
Stage of Entry
is a negative correlation between the order-of-entry variable and the product quality variable. These results are consistent with previous studies that show no direct effect of order of entry when the indirect effects of order of entry are consid- ered (Bowman and Gatignon 1996).
The competitor marketing spending parameter is positive and significant (8 = .034, p < .001), which implies an indus- try expansion effect of marketing spending found in many markets. Industry expansion effects typically dominate in the early growth stage of a market. There is a significant number of pioneers and growth-stage entrants (18 of them) in our data set. In markets with less growth, we might expect a different result.
IMPLICATIONS
In Table 4, we summarize the key results. Our results show that, after accounting for order of entry and time in market, the stage of the life cycle in which a brand enters has a significant effect on brand growth, market response, and, ultimately, sales. Prior research has shown that pioneers are advantaged relative to later entrants because of a main effect of order of entry or time in market (e.g., Kalyanaram, Robinson, and Urban 1995; Kalyanaram and Urban 1992; Robinson and Fornell 1985; Urban et al. 1986) or through indirect effects such as favorable response to promotions (Bowman and Gatignon 1996). Our study does not find a direct effect of order of entry that favors pioneers. We find, however, a new source of pioneering advantage, namely, that pioneers may enjoy greater response to their marketing expenditures compared with later entrants.
Unlike previous studies, however, we find that analyzing brand growth and market response by the stage of the life cycle in which a brand enters reveals advantages associated with growth-stage entry and corresponding disadvantages associated with pioneering. Brands that enter in the growth
Table 4 SUMMARY OF KEY RESULTS
Factors Parameter Results Previous Findings Our Findings Implication
Brand growth 4p > 0; Brand growth rate increases with order Brand growth rate follows an inverted-V Pioneering disadvantage, |G > 0; of entry, implying mature-stage pattern. Growth-stage entrants grow growth-stage entry advantage.
*M > 0; entrants grow faster than growth-stage faster than pioneers and mature-stage (<G - qM) > 0. entrants. entrants.
Competitor iVp < 0; Not explored. Competitor diffusion hurts the pioneer, Pioneering disadvantage, later diffusion VG > 0; has no effect on growth-stage entrants, entry advantage.
?lM > 0; and helps mature-stage entrants. (WP + VG) = 0;
(IP + -?M) > 0.
Perceived jp > 0; Effectiveness of product quality Growth-stage entrants enjoy greater Pioneering disadvantage, product quality PG - p > 0- decreases with order of entry, implying response to perceived product quality growth-stage entry advantage.
that pioneers are advantaged. than pioneers and mature-stage entrants.
Marketing 'yp > 0; Pioneers are not advantaged over other Pioneers enjoy higher advertising and Pioneering advantage. spending YG < 0; brands with respect to advertising, but sales force response than growth-stage
'YM < 0; enjoy higher promotion response. entrants, which in turn have higher (YG - YM) > 0. response than mature-stage entrants.
Order of entry 0 = 0. Contradictory evidence on the direct No direct effect of order of entry. No pioneering advantage. effect of order of entry (direct effect: Kalyanaram and Urban 1992; no direct effect: Bowman and Gatignon 1996).
275
This content downloaded from 91.224.27.228 on Thu, 20 Feb 2014 09:47:33 AMAll use subject to JSTOR Terms and Conditions
JOURNAL OF MARKETING RESEARCH, MAY 1999
stage achieve their asymptotic sales levels faster than the pioneer and mature-stage entrants, are unaffected by the dif- fusion of competitors, and face a market that is more respon- sive to perceived higher quality products offered by them than by others. In comparison, pioneers grow more slowly, competitor diffusion can slow the growth of pioneers fur- ther, and buyers are less responsive to the pioneer's per- ceived product quality. Brands that enter in the mature stage grow most slowly, but their growth is aided by competitor diffusion; buyer responses to perceived product quality and marketing expenditures, however, are lowest for these brands. Thus, brands that enter after the pioneer but in the growth stage enjoy competitive advantages, according to our analysis. These results are consistent with the evidence offered by Bayus, Jain, and Rao (1997), Golder and Tellis (1993), Lilien and Yoon (1990), and Shankar (1995). The generalizability of our findings is limited because all six markets come from the same industry and only certain pat- terns of marketing mix were observed (e.g., falling quality levels and rising marketing spending with delayed entry). Even so, our results add to mounting evidence that shows that pioneers may suffer from disadvantages and that some later entrants, particularly growth-stage entrants, enjoy sources of advantage.
These findings have important implications for the strate- gies of pioneers, growth-stage entrants, and mature-stage entrants. Although pioneers grow more slowly and are more hurt by competitor diffusion than later entrants, the greater response to their marketing spending enables them to spend less to achieve the same sales levels or spend on parity with later entrants but enjoy higher sales. At the same time, growth-stage entrants enjoy advantages in buyer response to quality relative to pioneers and in marketing spending rela- tive to later entrants. Although they may need to spend more on marketing to achieve the same sales level as pioneers, they can shift resources between quality improvements and marketing spending to overtake pioneers and other late entrants. For mature-stage entrants, however, the picture on growth rate, response to perceived quality, and marketing spending appears more bleak than previous studies have suggested. Nevertheless, they may be able to benefit from diffusion of their competitors. As a whole, our findings sug- gest that, though there are advantages associated with pio- neering, growth-stage entry has advantages that, when understood and exploited, can make following an attractive alternative to pioneering.
REFERENCES
Bayus, B.L., S. Jain, and A. Rao (1997), "Too Little and Too Early: A Competitive Analysis of the Personal Digital Assistant Indus- try," Journal of Marketing Research, 34 (February), 50-63.
Bowman, D. and H. Gatignon (1996), "Order of Entry as a Modera- tor of the Effect of Marketing Mix on Market Share," Marketing Science, 15 (3), 222-42.
Brown, C. and J. Lattin (1994), "Investigating the Time-Varying Component of Pioneering Advantage Using Regional Roll-Out Data," Management Science, 40 (10), 1361-69.
Carpenter, G.S. and K. Nakamoto (1989), "Consumer Preference Formation and Pioneering Advantage," Journal of Marketing Research, 26 (August), 285-98.
Gatignon, H. and T Robertson (1985), "A Propositional Inventory for Diffusion Research," Journal of Consumer Research, 11 (March), 849-67.
, B. Weitz, and P. Bansal (1990), "Brand Introduction Strate-
gies and Competitive Environment," Journal of Marketing Research, 27 (November), 390-401.
Golder, P. and G. Tellis (1993), "Pioneering Advantage: Marketing Logic or Marketing Legend," Journal of Marketing Research, 30 (May), 158-70.
and (1997), "When Will It Fly?: Modeling the Take- off of Really New Consumer Durables," Marketing Science, 16 (3), 256-70.
Greene, W.H. (1993), Econometric Analysis. New York: Macmillan Publishing Company.
Hahn, M., S. Park, L. Krishnamurthi, and A. Zoltners (1994), "A Model of New Product Diffusion Using a Four Segment Trial- Repeat Model," Marketing Science, 13 (3), 224-47.
Hanssens, D.M. (1980), "Market Response, Competitive Behavior, and Time Series Analysis," Journal of Marketing Research, 17 (November), 470-85.
Huff, L.C. and W.T. Robinson (1994), "The Impact of the Market Pioneer's Leadtime on Market Share," Management Science, 40 (10), 1370-77.
Kalyanaram, G., W.T. Robinson, and G.L. Urban (1995), "Order of Market Entry: Established Empirical Generalizations, Emerging Empirical Generalizations, and Future Research," Marketing Sci- ence, 14 (3, Part 2), G212-21.
and G.L. Urban (1992), "Dynamic Effects of the Order of Entry on Market Share, Trial Penetration, and Repeat Purchases for Frequently Purchased Consumer Goods," Marketing Science, 11 (3), 235-50.
and D. Wittink (1994), "Heterogeneity in Entry Effects Between Nondurable Consumer Product Categories," Interna- tional Journal of Research in Marketing, 11 (June), 219-31.
Lambkin, M. and G.S. Day (1989), "Evolutionary Processes in Competitive Markets: Beyond the Product Life Cycle," Journal of Marketing, 53 (July), 4-20.
Levitt, T. (1965), "Exploit the Product Life Cycle," Harvard Busi- ness Review, 43 (December), 81-94.
Lieberman, M.B. and D.B. Montgomery (1988), "First-Mover Advantages," Strategic Management Journal, 9, 41-58.
Lilien, G.L. and E. Yoon (1990), "The Timing of Competitive Mar- ket Entry: An Exploratory Study of New Industrial Products," Management Science, 36 (5), 568-85.
Mahajan, V., S. Sharma, and R. Buzzell (1993), "Assessing the Impact of Competitive Entry on Market Expansion and Incum- bent Sales," Journal of Marketing, 57 (July), 39-52.
Parker, P.M. and H. Gatignon (1996), "Order-of-Entry, Trials Diffu- sion and Elasticity Dynamics: An Empirical Case," Marketing Letters, 7 (January), 95-109.
Robinson, W. (1988), "Sources of Market Pioneer Advantages: The Case of Industrial Goods Industries," Journal of Marketing Research, 25 (1), 87-94.
and C. Fornell (1985), "Sources of Market Pioneer Advan- tages in Consumer Goods Industries," Journal of Marketing Research, 22 (August), 305-17.
Schnaars, S.P. (1994), Managing Imitation Strategies: How Later Entrants Seize Market Shares from Pioneers. New York: The Free Press.
Shankar, V. (1995), "Essays in Pioneer-Late Mover Competition," doctoral dissertation, J.L. Kellogg Graduate School of Manage- ment, Northwestern University.
(1997), "Pioneers' Marketing Mix Reactions to Entry in Dif- ferent Competitive Game Structures: Theoretical Analysis and Empirical Illustration," Marketing Science, 16 (3), 271-93.
, G.S. Carpenter, and Lakshman Krishnamurthi (1998), "Late Mover Advantage: How Innovative Late Entrants Outsell Pio- neers," Journal of Marketing Research, 35 (February), 54-70.
Urban, G.L., T. Carter, S. Gaskin, and Z. Mucha (1986), "Market Share Rewards to Pioneering Brands: An Empirical Analysis of Strategic Implications," Management Science, 32 (June), 645-59.
Winer, R. (1979), "An Analysis of the Time-Varying Effects of Advertising," Journal of Business, 52 (October), 415-22.
276
This content downloaded from 91.224.27.228 on Thu, 20 Feb 2014 09:47:33 AMAll use subject to JSTOR Terms and Conditions
Related Documents