THE ADOPTION OF ARTIFICIAL INTELLIGENCE BY SOUTH AFRICAN BANKING FIRMS: A TECHNOLOGY, ORGANISATION AND ENVIRONMENT (TOE) FRAMEWORK A research report submitted in partial fulfilment of the requirements for the degree of Master of Commerce in the field of Information Systems Student: Clayton Mariemuthu Student Number: 1734168 Supervisor: Professor Jason Cohen Ethics Protocol Number: CINFO/1174 Date: 28 February 2019

Welcome message from author
This document is posted to help you gain knowledge. Please leave a comment to let me know what you think about it! Share it to your friends and learn new things together.
Transcript

THE ADOPTION OF ARTIFICIAL INTELLIGENCE BY SOUTH
AFRICAN BANKING FIRMS: A TECHNOLOGY, ORGANISATION
AND ENVIRONMENT (TOE) FRAMEWORK
A research report submitted in partial fulfilment of the requirements for the degree of
Master of Commerce in the field of Information Systems
Student: Clayton Mariemuthu
Student Number: 1734168
Supervisor: Professor Jason Cohen
Ethics Protocol Number: CINFO/1174
Date: 28 February 2019

DECLARATION
I declare that this research report is my own, unaided work. It is being submitted for the degree of Master of
Commerce in Information Systems (by Research and coursework) to the University of the Witwatersrand,
Johannesburg.
It has not been submitted before for any other degree or examination at this or any other University.
_________________________
Clayton Mariemuthu
_________________________
Date
ACKNOWLEDGEMENTS
I am grateful for the support, insight and motivation of my supervisor, Professor Jason Cohen, who was always
available to assist on questions and provide constructive feedback throughout the research process. Without
your guidance, this research would have not been possible.
I dedicate this research to my wife, Nazema who provided unflinching support and motivation. Your
unconditional love and attention inspired me to complete this research.
A special thanks to my friends, colleagues and participants who contributed to this research.
Finally, all praise and thanks to you God for blessing me throughout this study.
ABSTRACT
Artificial intelligence (AI) is the creation of intelligent machines that have the ability to work and act like humans
and comprises various technologies. AI-powered technology is having a transformative effect on industries such
as banking.
This study investigated the adoption of AI technologies by South African banking firms. The investigation into
the factors that explain the current extent of adoption was focused through the lens of the Technological,
Organisational and Environmental (TOE) framework.
Through a review of existing literature and online resources, this study firstly identified a basket of AI
technologies perceived as relevant for South African banking firms. Six technologies that represent the basket
of AI technologies were identified, namely: machine learning, robotic process automation, expert systems,
virtual assistants, natural language processing, and pattern recognition. Secondly, the study aimed to determine
the current state of adoption of the AI technologies. Thirdly, the study aimed to determine the factors
influencing the adoption of AI technologies by banking firms. A systematic literature review was undertaken to
determine the technological, organisational and environmental factors that influence technology adoption. A
model using pre-determined TOE factors was developed and tested. The cross-sectional, quantitative study was
undertaken via a self-administered, online questionnaire to a sample of 307 respondents from South African
banking business units, resulting in 62 responses. Diffusion curves were used to illustrate the current adoption
of AI technologies. The results revealed that robotic process automation is the most diffused technology, while
natural language processing was the least diffused technology. The results also revealed a significant intention
to adopt AI technologies in the next three years.
The data was subjected to reliability and validity tests which established that the construct measures rendered
consistent and reproducible results, and accurately depicted the constructs they were assigned to measure.
Thereafter, correlations analysis was utilised to test the model’s hypotheses, and a multiple and stepwise
regression were used as further tests of the model.
Results revealed that AI technology skills, top management support, firm size and competitive pressure were
positively related to the adoption of AI technologies, while perceived benefits, information technology
infrastructure, cost, competitive pressure, regulation and mimetic pressure were not supported.
AI technologies is a contemporary topic and is gathering a great deal of attention in both academia and practice.
By applying the TOE framework, this study has provided a theoretical contribution and addressed a research gap
in existing literature, specifically demonstrating that AI adoption is a function of all three contexts, i.e.
technological, organisational and environmental. This study also provides a practical contribution for banking
firms as they can understand the current adoption status of the average South African bank. Furthermore, for
firms considering the adoption of AI technologies, this study offers insights into the relative influence of the TOE
factors, and provides guidance to facilitate benchmarking and processes of adoption.
Keywords: artificial intelligence, banking, adoption, technology-organisation-environment (TOE) framework,
basket of AI technology

TABLE OF CONTENTS
LIST OF FIGURES ........................................................................................................................... 1
LIST OF TABLES ............................................................................................................................ 2
LIST OF ABBREVIATIONS ............................................................................................................... 5
CHAPTER 1: INTRODUCTION ............................................................................................. 6
1.1 BACKGROUND ............................................................................................................... 6
1.2 RESEARCH PROBLEM ..................................................................................................... 7
1.3 AIMS AND OBJECTIVES OF THE STUDY ........................................................................... 8
1.4 IMPORTANCE AND CONTRIBUTIONS OF THE RESEARCH ................................................. 8
1.4.1 IMPORTANCE TO ACADEMIC RESEARCH ............................................................................................... 8
1.4.2 IMPORTANCE TO PRACTICE .................................................................................................................. 9
1.5 DELIMITATIONS AND ASSUMPTIONS ............................................................................. 9
1.6 STRUCTURE OF THE REPORT ........................................................................................ 10
CHAPTER 2: LITERATURE REVIEW .................................................................................... 11
2.1 DEFINITION OF ARTIFICIAL INTELLIGENCE ..................................................................... 11
2.2 BASKET OF AI TECHNOLOGIES ...................................................................................... 12
2.2.1 BASKET AND APPLICATION OF AI TECHNOLOGIES .............................................................................. 17
2.3 ORGANISATIONAL LEVEL ADOPTION OF TECHNOLOGIES .............................................. 26
2.3.1 TECHNOLOGY ADOPTION USING THE TOE FRAMEWORK ................................................................... 28
2.4 ARTIFICIAL INTELLIGENCE IN THE SOUTH AFRICAN CONTEXT ........................................ 35
2.5 CHAPTER SUMMARY ................................................................................................... 35
CHAPTER 3: THEORETICAL BACKGROUND AND RESEARCH MODEL .................................. 36
3.1 THE TECHNOLOGY–ORGANISATION–ENVIRONMENT (TOE) FRAMEWORK ..................... 36
3.1.1 THE TECHNOLOGICAL CONTEXT .......................................................................................................... 37
3.1.2 THE ORGANISATIONAL CONTEXT ........................................................................................................ 37
3.1.3 THE ENVIRONMENTAL CONTEXT ........................................................................................................ 37
3.2 RESEARCH MODEL ....................................................................................................... 38
3.2.1 THE TECHNOLOGICAL CONTEXT .......................................................................................................... 39
3.2.2 THE ORGANISATIONAL CONTEXT ........................................................................................................ 40
3.2.3 THE ENVIRONMENTAL CONTEXT ........................................................................................................ 41
3.3 CHAPTER SUMMARY ................................................................................................... 42

CHAPTER 4: RESEARCH METHODOLOGY .......................................................................... 43
4.1 RESEARCH DESIGN....................................................................................................... 43
4.2 PHASE 1 – CONFIRMATION OF AI BASKET..................................................................... 44
4.2.1 INTERVIEWS ........................................................................................................................................ 44
4.2.2 ANALYSIS ON INTERVIEW DATA .......................................................................................................... 45
4.2.3 REVISED BASKET .................................................................................................................................. 45
4.3 PHASE 2 – STATE OF ADOPTION AND TESTING OF MODEL ............................................ 45
4.3.1 SAMPLING AND DATA COLLECTION .................................................................................................... 46
4.3.2 INSTRUMENT DEVELOPMENT ............................................................................................................. 47
4.3.3 ANALYSIS ............................................................................................................................................. 57
4.4 ETHICAL CONSIDERATIONS .......................................................................................... 58
4.5 LIMITATIONS AND THREATS TO INTERNAL AND EXTERNAL VALIDITY ............................ 59
4.6 CHAPTER SUMMARY ................................................................................................... 59
CHAPTER 5: RESEARCH FINDINGS .................................................................................... 60
5.1 DATA SCREENING ........................................................................................................ 60
5.1.1 MISSING DATA..................................................................................................................................... 60
5.1.2 REVERSE SCORING ............................................................................................................................... 61
5.1.3 OUTLIER ANALYSIS .............................................................................................................................. 61
5.2 RESPONSE PROFILE ...................................................................................................... 62
5.2.1 JOB TITLE OF RESPONDENTS ............................................................................................................... 63
5.2.2 RESPONDENTS BY YEARS EMPLOYED AT ORGANISATION .................................................................. 63
5.2.3 RESPONDENTS BY YEARS AT CURRENT ROLE ...................................................................................... 64
5.2.3 RESPONDENTS BY NUMBER OF EMPLOYEES ...................................................................................... 64
5.2.4 RESPONDENTS BY NUMBER OF IT STAFF ............................................................................................ 65
5.2.5 RESPONDENTS BY BANK CATEGORY ................................................................................................... 65
5.2.6 SUMMARY OF DEMOGRAPHICS .......................................................................................................... 66
5.3 RESEARCH QUESTION 2: STATE OF AI TECHNOLOGY ADOPTION WITHIN SOUTH AFRICAN
BANKING FIRMS ......................................................................................................................... 67
5.3.1 MACHINE LEARNING ........................................................................................................................... 69
5.3.2 ROBOTIC PROCESS AUTOMATION ...................................................................................................... 69
5.3.3 EXPERT SYSTEMS ................................................................................................................................. 70
5.3.4 VIRTUAL ASSISTANT | CHATBOTS ....................................................................................................... 71
5.3.5 NATURAL LANGUAGE PROCESSING .................................................................................................... 71
5.3.6 PATTERN RECOGNITON ....................................................................................................................... 72
5.4 PLANS TO ADOPT AI TECHNOLOGIES ............................................................................ 73

5.5 RESEARCH QUESTION 3: FACTORS THAT INFLUENCE THE ADOPTION OF AI TECHNOLOGIES
................................................................................................................................... 73
5.5.1 VALIDITY AND RELIABILITY .................................................................................................................. 73
5.5.2 RELIABILITY MEASUREMENT – CRONBACH’S APLHA .......................................................................... 76
5.5.3 CORRELATION ANALYSIS ..................................................................................................................... 77
5.5.4 MULTIPLE REGRESSION ....................................................................................................................... 80
5.5.5 ADDITIONAL ADOPTION MEASURE ..................................................................................................... 86
5.6 CHAPTER SUMMARY ................................................................................................... 88
CHAPTER 6: DISCUSSION OF RESULTS.............................................................................. 90
6.1 BASKET OF AI TECHNOLOGIES ...................................................................................... 90
6.2 STATE OF ADOPTION ................................................................................................... 91
6.3 EFFECTS OF TECHNOLOGICAL FACTORS ON AI TECHNOLOGY ADOPTION ....................... 92
6.3.1 PERCEIVED BENEFITS ........................................................................................................................... 92
6.3.2 IT INFRASTRUCTURE ............................................................................................................................ 93
6.3.3 AI TECHNOLOGY SKILLS ....................................................................................................................... 93
6.4 EFFECTS OF ORGANISATIONAL FACTORS ON AI TECHNOLOGY ADOPTION ..................... 94
6.4.1 TOP MANAGEMENT SUPPORT ............................................................................................................ 94
6.4.2 FIRM SIZE ............................................................................................................................................. 94
6.4.3 COST .................................................................................................................................................... 95
6.5 EFFECTS OF ENVIRONMENTAL FACTORS ON AI TECHNOLOGY ADOPTION ..................... 95
6.5.1 COMPETITIVE PRESSURE ..................................................................................................................... 95
6.5.2 REGULATORY REQUIREMENTS ............................................................................................................ 95
6.5.3 MIMETIC PRESSURE ............................................................................................................................ 96
6.6 CHAPTER SUMMARY ................................................................................................... 96
CHAPTER 7: CONCLUSION ............................................................................................... 97
7.1 SUMMARY OF FINDINGS ............................................................................................. 97
7.2 IMPLICATIONS FOR ACADEMIA .................................................................................... 97
7.3 IMPLICATIONS FOR PRACTICE ...................................................................................... 98
7.4 LIMITATIONS ............................................................................................................... 98
7.5 FUTURE RESEARCH ...................................................................................................... 99
7.6 CONCLUSION............................................................................................................. 100
BIBLIOGRAPHY ............................................................................................................. 101
APPENDIX A: SUMMARY OF INTERVIEW QUESTIONS .................................................... 108

APPENDIX B: ONLINE QUESTIONNAIRE ......................................................................... 110
APPENDIX C: SURVEY COVER LETTER ............................................................................ 116
APPENDIX D: ETHICS CLEARENCE CERTIFICATE .............................................................. 117
APPENDIX E: ASSUMPTIONS OF MULTIPLE REGRESSION ............................................... 118

1
LIST OF FIGURES
Figure 2.1: Systematic literature review results for basket of AI technologies .................................................... 15
Figure 2.2: Basket of AI technologies ................................................................................................................... 18
Figure 2.3: Machine learning architecture ........................................................................................................... 19
Figure 2.4: RPA in customer ordering architecture .............................................................................................. 20
Figure 2.5: Expert systems architecture ............................................................................................................... 22
Figure 2.6: Chatbot architecture .......................................................................................................................... 23
Figure 2.7: Speech recognition system architecture ............................................................................................ 24
Figure 2.8: Image recognition system architecture .............................................................................................. 25
Figure 2.9: Systematic literature review results for TOE organisational studies .................................................. 28
Figure 3.1: The TOE framework ............................................................................................................................ 36
Figure 3.2: Conceptual model of the factors influencing a banking firm’s adoption of AI ................................... 38
Figure 4.1: Different phases for research questions ............................................................................................ 43
Figure 5.1: Response breakdown after data screening ........................................................................................ 62
Figure 5.2: Adoption status of AI technologies (n=58) ......................................................................................... 67
Figure 5.3: Diffusion curve .................................................................................................................................... 68
Figure 5.4: Machine learning diffusion (2010-2018) ............................................................................................ 69
Figure 5.5: Robotic process automation diffusion (2006-2018) ........................................................................... 70
Figure 5.6: Expert systems diffusion (2008-2018) ................................................................................................ 70
Figure 5.7: Virtual assistant diffusion (2010-2018) ............................................................................................... 71
Figure 5.8: Natural language processing diffusion (2010-2018) ........................................................................... 72
Figure 5.9: Pattern recognition diffusion (2010-2018) ......................................................................................... 72
Figure A1: Technological homoscedasticity plot ................................................................................................ 118
Figure A2: Technological residual p-p plot ........................................................................................................ 119
Figure A3: Technological residual histogram ...................................................................................................... 119
Figure A4: Organisational homoscedasticity plot .............................................................................................. 120

2
Figure A5: Organisational residual p-p plot ........................................................................................................ 121
Figure A6: Organisational residual histogram .................................................................................................... 121
Figure A7: Organisational homoscedasticity plot .............................................................................................. 122
Figure A8: Environmental residual p-p plot ........................................................................................................ 123
Figure A9: Environmental residual histogram .................................................................................................... 123
Figure A10: Stepwise homoscedasticity plot ...................................................................................................... 124
Figure A11: Stepwise residual p-p plot .............................................................................................................. 125
Figure A12: Stepwise residual histogram .......................................................................................................... 125
LIST OF TABLES
Table 2.1: Definitions of artificial intelligence ...................................................................................................... 12
Table 2.2: Adapted systematic literature review methodology steps .................................................................. 13
Table 2.3: Literature results for basket of AI technologies ................................................................................... 16
Table 2.4: Preliminary basket of AI technologies ................................................................................................. 18
Table 2.5: Applications of natural language processing ....................................................................................... 21
Table 2.6: Past TOE studies on innovative technology adoption ......................................................................... 30
Table 3.1: Summary of hypotheses ...................................................................................................................... 42
Table 4.1: AI basket after interviews with expert panel ....................................................................................... 45
Table 4.2: Benefits of surveys and web-survey tools ........................................................................................... 47
Table 4.3: Item construction summary for questionnaire .................................................................................... 50
Table 4.4: Summary of pre-test changes .............................................................................................................. 53
Table 4.5: Summary of pilot test changes ............................................................................................................ 56
Table 5.1: Missing values ...................................................................................................................................... 61
Table 5.2: Respondents per job title ..................................................................................................................... 63
Table 5.3: Respondents by years at organisation ................................................................................................. 63

3
Table 5.4: Respondents by years at current role .................................................................................................. 64
Table 5.5: Total employees in business unit ......................................................................................................... 64
Table 5.6: IT employees in business unit .............................................................................................................. 65
Table 5.7: Respondents by bank category ............................................................................................................ 66
Table 5.8: State of AI technology adoption (n=58) ............................................................................................... 67
Table 5.9: Banking firm plans to adopt AI technologies ....................................................................................... 73
Table 5.10: Principal component analysis of adoption of AI technology (dependent variable) ........................... 74
Table 5.11: Principal component analysis of technological factors (loadings less than 0.4 suppressed) ............. 75
Table 5.12: Principal component analysis of organisational factors (loadings less than 0.4 suppressed) ........... 75
Table 5.13: Principal component analysis of environmental factors (loadings less than 0.4 suppressed)........... 76
Table 5.14: Reliability by means of Cronbach’s alpha .......................................................................................... 77
Table 5.15: Correlation matrix *** p<0.001 ** p<0.01 * p<0.05 # p<0.10 (n=55) ............................................... 78
Table 5.16: Technological model summary – multiple regression ....................................................................... 80
Table 5.17: Technological ANOVA – multiple regression ..................................................................................... 80
Table 5.18: Technological coefficients – multiple regression ............................................................................... 81
Table 5.19: Organisational model summary – multiple regression ...................................................................... 82
Table 5.20: Organisational ANOVA – multiple regression .................................................................................... 82
Table 5.21: Organisational coefficients – multiple regression ............................................................................. 82
Table 5.22: Environmental model summary – multiple regression ...................................................................... 83
Table 5.23: Environmental ANOVA – multiple regression .................................................................................... 83
Table 5.24: Environmental coefficients – multiple regression ............................................................................. 84
Table 5.25: Stepwise multiple regression – model summary ............................................................................... 84
Table 5.26: Stepwise multiple regression – ANOVA ............................................................................................. 85
Table 5.27: Stepwise multiple regression – coefficients ...................................................................................... 85
Table 5.28: Count of additional adoption measure .............................................................................................. 86
Table 5.29: Correlation matrix *** p<0.001 ** p<0.01 * p<0.05 # p<0.10 (n=55) ............................................... 87
Table 5.30: Stepwise multiple regression with additional adoption measure – model summary ....................... 87

4
Table 5.31: Stepwise multiple regression with additional adoption measure – ANOVA ..................................... 88
Table 5.32: Stepwise multiple regression with additional adoption measure – coefficients ............................... 88
Table 5.33: Correlation and multiple regression summary .................................................................................. 89
Table A1: Technological VIF and tolerance scores .............................................................................................. 118
Table A2: Organisational VIF and tolerance scores ............................................................................................ 120
Table A3: Environmental VIF and tolerance scores ............................................................................................ 122
Table A4: Stepwise VIF and tolerance scores ..................................................................................................... 124

5
LIST OF ABBREVIATIONS
AI Artificial intelligence
EDI Electronic data interchange
ERP Enterprise resource planning
IS Information systems
IT Information technology
KMO Kaiser-Meyer-Olkin
NLP Natural language processing
RFID Radio-frequency identification
RPA Robotic process automation
RQ1 Research question 1
RQ2 Research question 2
RQ3 Research question 3
SLR Systematic literature review
TOE Technology, organisation and environment

6
CHAPTER 1: INTRODUCTION
1.1 BACKGROUND
The technology and financial services sector, government institutions and the media have displayed a compelling
interest in artificial intelligence (AI), with significant research and development now being carried out into AI-
based technologies worldwide (Accenture, 2017). AI is defined as information technology (IT) systems that
sense, comprehend, act and learn (Kolbjørnsrud, Amico and Thomas, 2017). Machine’s capabilities have, of late,
extended, and will without a doubt keep on doing so. AI can be used to solve humanities problems in fields of
education, sanitation, government, food, water, security and space exploration (Brynjolfsson and McAfee,
2012). Consequently, there is a firm belief in various industry sectors that AI can present tremendous benefits
(Makridakis, 2017).
The banking industry is no exception as AI is moving beyond just automating processes; it is revolutionising the
way banks transact, advise and interact with their customers. Banks are institutions that function in the financial
services sector, relating to activities such as financial and deposit transactions, loans, investments and asset
management (Accenture, 2017). The banking industry is fundamental to the economy and, as such, is of great
interest to researchers and practitioners (ibid.). In recent years, technological innovation has turned out to be
progressively essential to the evolution of banking systems by creating value for banks and their clients. AI
promises to provide banks with the capacity to provide innovative products, which has long been seen as a focal
point in their marketing strategies (Furst, Lang and Nolle, 1998). Berger and Bouwman (2013) discovered
evidence of a positive relationship between the technologies that a bank implements and the bank's
productivity. According to Gartner (2017), AI has influenced the banking industry by innovating products and
services that enhance efficiency while reducing the operation time of banking firms by utilising AI technologies
such as machine learning, deep neural networks, natural language processing (NLP), predictive analytics, and
voice recognition. An Infosys (2017) study highlights five examples of how AI is influencing banking:
1) Intelligent digital assistants amplify customer service,
2) Data-backed lending decisions predict and prevent defaulters,
3) Fraud detection through machine learning and pattern recognition,
4) Biometric identification through speech and image recognition, and
5) Financial analytics and AI-enabled services through digital channels.
Banks have launched AI-based pilots for applications in customer services, fraud management and credit scoring.
These applications of AI can benefit banks in several ways to enhance banking products, improve transaction
security and real-time fraud detection, and introduce chatbots for augmented customer service (Gartner, 2017).
However, despite this potential, there remains varying rates of adoption and diffusion of AI technologies into
the banking industry.

7
1.2 RESEARCH PROBLEM AND RESEARCH QUESTIONS
AI is an extensive concept and previous research has not defined a distinct basket of technologies that constitute
AI. Haton (2006) describes the domains of AI as NLP, speech recognition, robotics and expert systems. An Infosys
(2017) survey describes AI stack as technologies comprising machine learning, NLP, speech recognition, smart
virtual assistants and bots, expert systems, optical character recognition, and robotic process automation (RPA).
There is a need to clearly define the basket of technologies that constitute AI in banking firms.1 Therefore, the
following research question is postured:
RQ1: What constitutes the basket of AI technologies perceived as relevant for banking firms?
Research by the Financial Brand (2017) highlights that the explosive evolution of big data, accessibility of
advanced technologies (e.g. cloud computing and machine learning algorithms), increased pressure by
competitors, expanded governance, and amplified customer expectancies has crafted the ideal opportunity for
the extended utilisation of AI in the banking industry. However, that argument only espouses the vast potential
of AI for banking firms. The 2017 Infosys survey on 250 organisations in the financial services sectors revealed
that only 23% of the respondents confirmed the actual adoption of AI in their firms. The survey further revealed
that the AI technologies implemented were delivering on their expectations, with 47% of the respondents
viewing AI as essential for successfully achieving the goals of the firm. This study therefore also investigates:
RQ2: What is the current state of adoption of AI technologies by banking firms in South Africa?
According to Pan (2016), technology giants such as Apple, Intel, Microsoft, Google, Facebook and Twitter have
secured 140 AI start-ups, which together represent over a billion US dollars in investment. However, financial
institutions lag in AI research and investment. The Infosys (2017) survey revealed that 44% of senior managers
articulated that prolonging AI adoption would make their organisations vulnerable to disruption by start-up
companies. The survey also revealed that those organisations currently using AI technologies projected revenue
to increase by 39% by 2020. There is consequently huge pressure and responsibility on senior leadership to drive
the adoption of AI within their organisations. Further research is required to increase the knowledge of the
significance of AI in banking, and to recognise those areas in which firms lag behind and which factors influence
their AI adoption. In a survey conducted by PWC (2017), IT executives declared that only 20% of organisations
had the required skills to be successful with AI. This is despite the pressure to adopt AI technologies to enhance
competitiveness and deliver other benefits. Moreover, there are other organisational considerations such as
how quickly banks can implement AI technology, especially when they are incompatible with current IT
infrastructure. Unfortunately, there is no clear understanding of the relative effects of these technological,
organisational and environmental factors on AI adoption within the South African banking context. Accordingly,
this study also addresses the current gap in the literature on factors that may influence the adoption of AI in
banking firms. The ensuing research question is presented:
RQ3: What are the relative effects of technological, organisational and environmental factors on banking
firms to adopt AI?
1 Within this study, a banking firm refers to banks as financial institutions and their individual business units, such as a credit card business unit, online banking business unit etc.

8
1.3 OBJECTIVES OF THE STUDY
To address the above research questions, this research study is focused on identifying a relevant basket of AI
technologies, describing the state of adoption in the South African banking sector, and examining the factors
that drive organisations to adopt AI. To address the latter purpose, there is a need to develop and then test a
model of AI adoption by banking organisations. By referencing the TOE framework in the development of that
model, this research offers a more extensive empirical study assessing factors that banking firms consider in
their adoption of AI.
Taken together, the purpose of this research is to:
• Identify a relevant basket of AI technologies for banking by drawing on a systematic literature review
and expert judgement through interviews.
• Describe the current state of the adoption of those technologies in banking firms through a survey.
• Develop a research model by drawing on extant literature and TOE theory in organisational adoption
of innovations as a basis for the empirical study of factors that influence the adoption of AI by banking
firms,
• Test the research model using correlation and regression analysis.
• Collect data from a sample of South African banking firms using a survey methodology.
• Set the foundation for further studies that contribute to understanding of the factors of AI adoption by
firms.
1.4 IMPORTANCE AND CONTRIBUTIONS OF THE RESEARCH
This study contributes to both theory and practice. The following sections highlight the contributions.
1.4.1 IMPORTANCE TO ACADEMIC RESEARCH
Quantitative empirical studies on AI adoption at firm level are limited. This study applies the TOE framework as
a theoretical lens to evaluate AI adoption by banking firms. By utilising the TOE framework, this paper addresses
a gap in the information systems (IS) literature where the TOE framework has not significantly been utilised to
understand AI adoption. For instance, Oliveira and Martins (2011) conducted a literature review of IT adoption
models at the firm level. In their paper, the TOE framework was identified as having been used to understand
electronic data interchange (EDI) adoption (Kuan and Chau, 2001), enterprise resource planning (ERP) adoption
(Pan and Jang, 2008), B2B e-commerce (Teo, Ranganathan and Dhaliwal, 2006), and open systems (Chau and
Tam, 1997), among others. The TOE framework has been investigated by many studies on various IS domains
(Zhu and Kraemer, 2002); however, none of the studies focus on AI. While the TOE framework has been used in
various contexts, the relative effects of various technological, organisational and environmental factors on
adoption differ across technologies and across contexts of use. TOE highlights that, to a greater or less degree,
technological, organisational and environmental factors are important to explanations of adoption.
Technological factors are typically considered to influence diffusion of innovations (Rogers, 2004), but their
salience relative to other factors is necessary to explore. For example, top management support is often
highlighted as a key contributor to the success or failure of adoption (Lee and Kim, 2007), but in the context of
9
AI and banking the effects of top management support are not yet clear. Moreover, from an IT adoption
perspective, mimetic pressures can influence firms to imitate the adoption behaviours of well-established peers
as a response to uncertainty regarding the potential of an IT innovation (Cohen, Mou and Trope, 2014).
Therefore, given the potential of AI technologies, there is a need for a holistic view of the TOE elements
impacting the technology’s adoption. This paper contributes by defining variables within a conceptual model
relevant to the study of AI adoption decisions within banks.
1.4.2 IMPORTANCE TO PRACTICE
The research undertaken in this study will contribute practically by identifying the portfolio of AI technologies
that are utilised by banking institutions. AI technologies include machine learning, RPA, expert systems, NLP,
speech and image recognition. However, banks may not be clear on which are the most important and in which
they should invest and develop capacity. Expert judgement in this regard may be helpful.
The study will contribute further by examining the current state of adoption by South African banking firms of
the technologies identified in the basket of AI technologies. Performing this research develops a case for AI
adoption by banking firms. The surge in financial technology organisations continues to take profitable market
share away from traditional banks (Mackenzie, 2015). By using technology innovation, AI financial technology
organisations are using technology to lower costs of banking and are passing these savings to the customer
(ibid.). Successful adoption of AI technology could benefit banking firms by enabling them to keep up with non-
traditional competitors, who continue to disrupt the banking industry. According to Van Bommel and Blanchard
(2017), banks that harness AI technology will benefit from faster digitisation and the ability to offer customers
omni-channel, customer centric products and services timeously. Finally, the results of this study can provide
banks with greater insights and lessons learnt of other organisations regarding which TOE factors can help
promote adoption or act as facilitators with adopting AI.
1.5 DELIMITATIONS AND ASSUMPTIONS
• This is an organisational-level study, and therefore focuses on adoption within banking units, rather
than adoption by individuals operating within banks, or by their customers.
• This study will confine itself to AI adoption in South African banking firms. Future work might extend
this to developing countries or banking more broadly, or even to broader sectors such as retail,
healthcare, manufacturing or mining.
• The TOE framework is the organisational-level theory that is used as the lens to explain the factors in
the adoption of AI by South African banking firms. TOE as a framework allows for the complementary
consideration of other theories such as the diffusion of innovations (Rogers, 2004) and institutional
theory (DiMaggio and Powell, 1983). While considered inclusive and having offered useful explanations
in other studies of IT adoption, the framework is itself reductionist and does not provide for the unique
and rich experiences of specific banking firms to be explored over time. Such longitudinal case study
work is left to future studies.
• This study is deductive and draws on TOE and past literature to develop the research model and, as
such, factors not a priori included in the hypothesised research model are not going to be examined.

10
1.6 STRUCTURE OF THE REPORT
The background to the research on adoption of AI technologies by South African banking firms was described in
this chapter. The research problem was broken down into three research questions with the aims of identifying
a basket of technologies for AI in banking; determining the current state of AI adoption; and testing a set of
hypotheses based on the TOE framework. The value that this research will contribute to academia and practice
was also highlighted. The research report is structured in the following chapters:
Chapter 2: Literature Review
The examination of the current body of knowledge on AI technologies and AI adoption are reviewed. The
objective of the systematic literature review is to assess what is available regarding the concept being studied.
The literature review also forms the basis for answering research question 1 (RQ1) by identifying a preliminary
basket of AI technologies relevant for banking firms. The chapter concludes with a detailed review of empirical
studies on technological adoption by firms using the TOE framework.
Chapter 3: Theoretical Background and Research Hypotheses
The theoretical groundwork of the proposed TOE framework is examined in the first section. The research model
employed in this study is developed. This chapter concludes by examining each construct and factor in detail
and develops the hypotheses that are tested in the empirical research.
Chapter 4: Research Methodology
RQ1 is finalised with expert judgement. The chapter provides an overview of the quantitative research design
utilised in this study to address research question 2 (RQ2) (to determine the current levels of AI technology
adoption) and research question 3 (RQ3) (to test the effects of the nominated TOE factors on technology
adoption).
Chapter 5: Research Findings
This chapter presents a summary of the data screening, which includes reverse scoring, missing data and outliers.
Response profiling together with a summary of AI technology adoption are presented, which includes diffusion
curves for each AI technology. Data is analysed and decoded from which deductions are drawn.
Chapter 6: Discussion of Results
The discussion and deductions drawn from the data analysis with reference to prior literature are discussed in
this chapter.
Chapter 7: Conclusion
The concluding chapter discusses the results of the study and describes the outcomes for academia and practice.
The shortcomings of the study and prospective directions for research are highlighted.
Appendices
Aspects of the interview questions, questionnaire, the cover letter sent to the sample population, and ethics
clearance certificates are included in the appendices.

11
CHAPTER 2: LITERATURE REVIEW
This chapter identifies the current body of knowledge regarding AI technologies, AI adoption and the TOE
framework. The chapter begins by providing various definitions of AI and proceeds to describe the approach
taken to the systematic literature review for the basket of AI technologies. The search strategy is defined, and
the databases and journals searched to obtain the literature are listed. A preliminary basket of AI technologies
is identified from the literature which forms the foundation for answering RQ1. AI technologies are described
with adoption examples. A second SLR was conducted to explore existing literature into the organisational
adoption of IT using the TOE framework. The shortcomings of AI adoption in the South African context are
highlighted and the research gap identified. Past empirical studies of technological adoption using the TOE
framework and its associated factors are highlighted.
2.1 DEFINITION OF ARTIFICIAL INTELLIGENCE
The innovation of technology has undoubtedly enhanced the lives of people and made their jobs much simpler.
Similarly, AI has the capability to achieve extraordinary benefits to diverse sectors of industries (Makridakis,
2017). AI comprises several advances that empower digital machines to see the world (such as image
recognition, audio processing and sensory processing), to examine and comprehend the data gathered, to
formulate conclusions, and to learn from experience (Kolbjørnsrud, Amico and Thomas, 2017). The research and
development of AI includes RPA, machine learning, expert systems, biometrics and pattern recognition.
The theoretical and technological foundation of AI was developed in the 1950s and as such, is not a new field in
modern technology. Organisations have invested billions of US Dollars in AI start-ups offering AI technologies
and applications to their customers and the marketplace (Metz, 2016).
The exact definition of AI is a topic of considerable discussion, with more definitions speaking of AI as "imitating
intelligent human behaviour" (Kok et al., 2009). Definitions of AI are organised into four categories in Table 2.1
below.

12
Systems that think like humans Systems that think rationally
"The exciting new effort to make computers think
… machines with minds, in the full and literal
sense" (Haugeland, 1985)
"[The automation of] activities that we associate
with human thinking, activities such as decision-
making, problem solving, learning ..." (Bellman,
1978)
"The study of mental faculties using computational
models" (Charniak and McDermott, 1985)
"The study of the computations that make it
possible to perceive, reason, and act" (Winston,
1992)
Systems that act like humans Systems that act rationally
"The art of creating machines that perform
functions that require intelligence when performed
by people" (Kurzweil et al., 1990)
"The study of how to make computers do things at
which, at the moment, people are better" (Rich and
Knight, 1991)
“A field of study that seeks to explain and emulate
intelligent behaviour in terms of computational
processes" (Schalkoff, 1990)
"The branch of computer science that is concerned
with the automation of intelligent behaviour"
(Luger and Stubblefield, 1993)
Table 2.1: Definitions of artificial intelligence
(Source: Russell and Norvig, 1995)
Gartner (2017) attempts to provide an overarching definition of AI for practice as follows: “Technology that
appears to emulate human performance typically by learning, coming to its own conclusions, appearing to
understand complex content, engaging in natural dialogues with people, enhancing human cognitive
performance or replacing people on the execution of non-routine tasks.” The practitioner definition of AI focuses
on applications of AI as opposed to the theoretical and research-oriented perspective.
2.2 BASKET OF AI TECHNOLOGIES
In order to identify a basket of AI technologies from the literature, a systematic literature review (SLR) method
was followed.
The SLR methodology provides a systematic and thorough guide in understanding the current body of knowledge
of a specific phenomenon of interest. Another aspect of the SLR methodology is the ability for results to be
replicated. The methodology followed in this research paper is similar to that of Okoli and Schabram (2010) but
adapts their methodology into six steps. Table 2.2 below highlights the steps of the methodology undertaken in
this paper.

13
Steps Purpose
1. Purpose of the review and research question The purpose and research question provide the focal
point to the SLR
2. Selection of the data sources Highlight the electronic academic databases which host
research papers and studies of top-ranked information
systems journals
3. Searching for literature Describe details of the literature including search
strings
4. Quality appraisal Apply inclusion and exclusion criteria and review
articles to ensure they are of sufficient quality
5. Data extraction and synthesis Once studies have been identified after applying the
above steps, key information is extracted and analysed
6. Writing the review The SLR needs to be reported in sufficient detail so it
can be reproduced
Table 2.2: Adapted systematic literature review methodology steps
The steps of the SLR translated as follows for the purposes of the search for literature on a basket of AI
technologies.
Step 1:
The purpose of SLR 1 was to identify the basket of AI technologies used by banking firms.
Step 2:
The following data sources were used for SLR 1:
• EBSCO Host
• IEEE Xplore
• JSTOR
• ProQuest ABI INFORM
• Google search engine
The use of Google scholar was utilised as a supplementary academic search engine.
Step 3:
As part of the SLR methodology, the following were applied to the search strings:
a) Unit of analysis:
• Banking Organisation OR

14
• Banking Organization OR
• Banking Firm OR
• Banking Business
b) IT artefact:
• Artificial Intelligence Technologies OR
• AI Technologies OR
c) Phenomenon of interest:
• Basket
• Portfolio
• List
Examples of search strings used:
• Banking Organisation AND Artificial Intelligence Technologies AND Basket
• Banking Organisation AND Artificial Intelligence Technologies AND Portfolio
• Banking Organisation AND Artificial Intelligence Technologies AND List
• Banking Organisation AND AI Technologies AND Basket
• Banking Organisation AND AI Technologies AND Portfolio
• Banking Organisation AND AI Technologies AND List
• Banking Firm AND Artificial Intelligence Technologies AND Basket
• Banking Firm AND Artificial Intelligence Technologies AND Portfolio
• Banking Firm AND Artificial Intelligence Technologies AND List
• Banking Business AND AI Technologies AND Basket
Step 4:
For SLR 1, the following inclusion and exclusion criteria were applied to ensure the selected studies were of
sufficient quality for the study:
a) Inclusion criteria
• Organisational-level study
• Quantitative studies using empirical research
• Practitioner-based research
• Research papers from conferences and journals
• Papers in English
b) Exclusion criteria
• Individual-level study
• Qualitative research methods
15
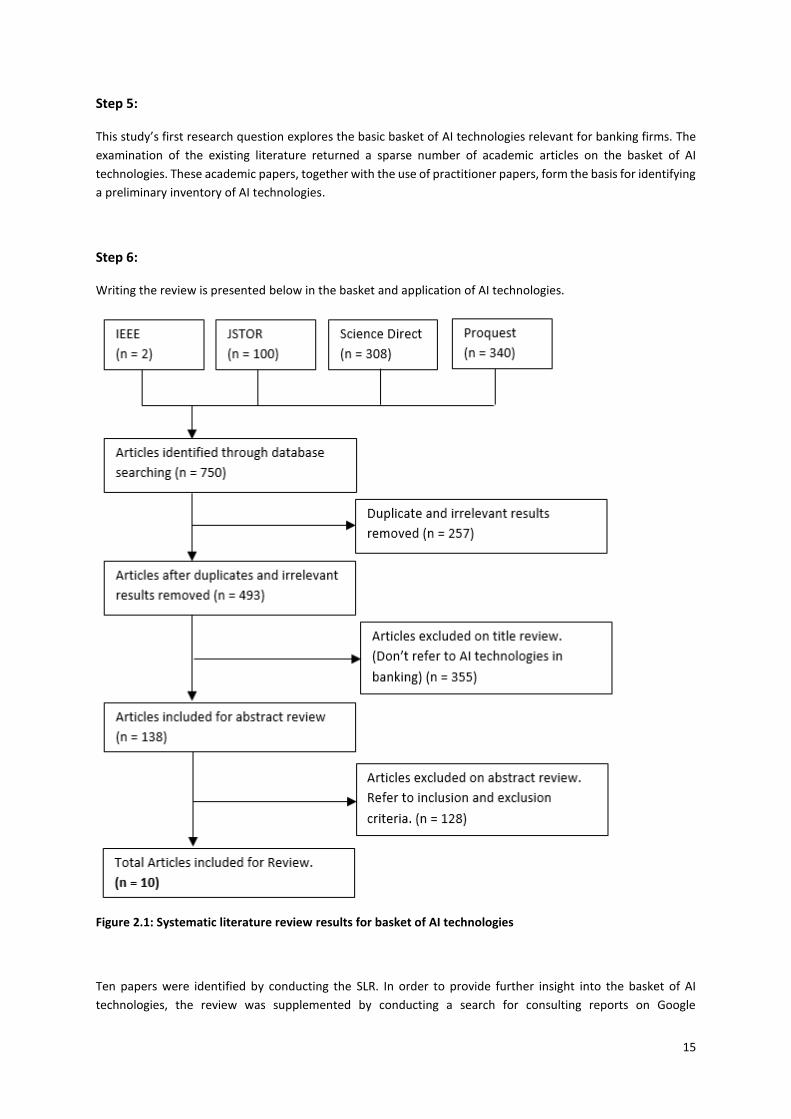
Step 5:
This study’s first research question explores the basic basket of AI technologies relevant for banking firms. The
examination of the existing literature returned a sparse number of academic articles on the basket of AI
technologies. These academic papers, together with the use of practitioner papers, form the basis for identifying
a preliminary inventory of AI technologies.
Step 6:
Writing the review is presented below in the basket and application of AI technologies.
Figure 2.1: Systematic literature review results for basket of AI technologies
Ten papers were identified by conducting the SLR. In order to provide further insight into the basket of AI
technologies, the review was supplemented by conducting a search for consulting reports on Google

16
(www.google.com). Table 2.3 below highlights the sources utilised for the consulting reports, with each paper
providing information on all seven AI technologies. The left-hand column indicates the sources of literature.
Table 2.3: Literature results for basket of AI technologies
Machine learning was mentioned within four literature sources and all consulting reports as shown. RPA, NLP
and expert systems were mentioned within three literature sources and all consulting papers as shown. Virtual
assistants, image recognition and speech recognition have received relatively less attention, with only one or
two literature sources each. The most frequently discussed AI technology was found to be machine learning.
The technologies are described in more detail next.
17
2.2.1 BASKET AND APPLICATION OF AI TECHNOLOGIES
The collection of technologies denoted as AI over the last decade has established itself as an important
technological innovation in various sectors. Advancements in the field of AI such as machine learning, NLP, RPA
and voice recognition are making major contributions to the products and service offerings by banking firms
(Hager et al., 2017).
There is a substantial volume of data generated by the banking segment which consists of consumer account
information, transaction details and financial information (Patil and Dharwadkar, 2017). Valuable information
can be extracted from these large volumes of data by analytics which sift through the data to uncover hidden
patterns. There many challenges facing banking firms such as fraud recognition, risk mitigation and consumer
retention (ibid.). It important for banks to identify customers’ behaviour and to predict their patterns in order
to assist the bank to retain customers, and avoid fraud and risk posed to the institution. Machine learning has
the ability to handle copious amounts of data intelligently by developing algorithms to produce insights. The
Union Bank of Switzerland has utilised machine learning technologies when providing customised financial
advice to its affluent clients by deriving in excess of 79 million individuals’ behavioural models (Deloitte, 2015).
Banks are faced with the threat of disruption and are required to transform their in-house applications and IT
systems to remain current and competitive. However, due to complexities in legacy systems, banks are forced
to delve into innovative ways to direct internal efficiencies (Chandrashekar, Kumar and Saxena, 2017). RPA is a
classification of software that incorporates AI and machine learning to automate routine, repetitive tasks that
are often vulnerable to human error (Lacity and Willcocks, 2017). Banks are already using RPA to populate data
forms to increase processing speeds for all components containing structured data (Van Bommel and Blanchard,
2017). Customers expect faster service levels and constant availability which are propelling banks to converge
on automation for repetitive tasks.
Banks are using NLP to enable faster and more efficient customer service delivered through AI-centred digital
assistants. Via the interactions between the AI digital assistant and the customer, the system would learn to
resolve certain issues automatically. NLP is a technique that machines use to analyse, comprehend and make
sense of the text and human language (Haton, 2006). Capital One bank in the United States uses a chatbot called
Eno which utilises NLP to provide customised services to clients consistently.
When providing investment advice in the financial services industry, expert systems are being used extensively
(Van Bommel and Blanchard, 2017). Expert systems proactively collect and digest big data in a selected domain
area and then present users with recommendations (Haton, 2006). Financial technology companies Wealthfront
and Betterment have deployed such software to provide expert investment advice to their clients.
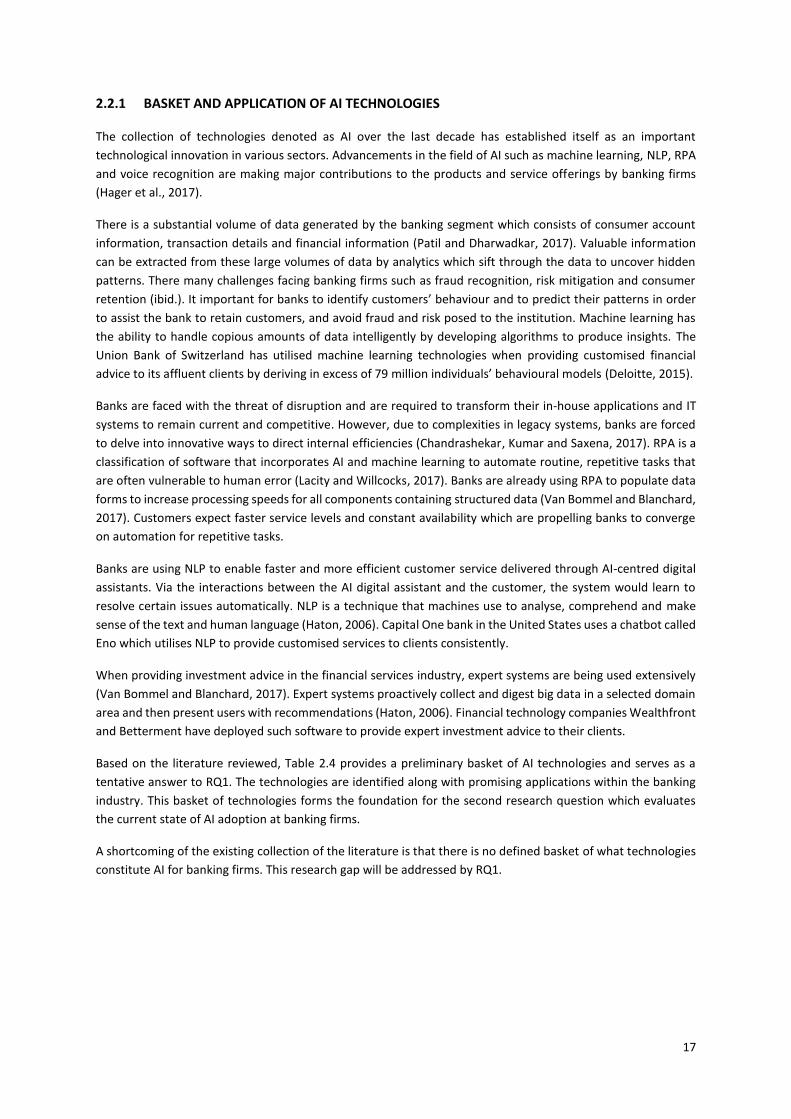
Based on the literature reviewed, Table 2.4 provides a preliminary basket of AI technologies and serves as a
tentative answer to RQ1. The technologies are identified along with promising applications within the banking
industry. This basket of technologies forms the foundation for the second research question which evaluates
the current state of AI adoption at banking firms.
A shortcoming of the existing collection of the literature is that there is no defined basket of what technologies
constitute AI for banking firms. This research gap will be addressed by RQ1.
18
AI technology Use in banking
Machine learning Fraud detection by constructing patterns based on customer
spending and flags anomalies
Robotic automation process Customer on-boarding, workflow acceleration, data entry and
validation, reconciliations, data enrichment
Natural language processing Classify and structure information for automatic summarisation
and answering, text mining, and sentiment analysis
Expert systems Investment advice
Virtual assistants | chatbots 24/7 customer service, customised content delivery
Image recognition Pay bills and authenticate documents
Speech recognition Recognises unique customer voice for authentication
Table 2.4: Preliminary basket of AI technologies
Figure 2.2: Basket of AI technologies
(Source: Adapted from www.contino.io)
Figure 2.2 summarises the technologies that form the AI basket with each AI technology having a specific branch.
For example, machine learning uses deep learning or predictive analytics to discover patterns in data and makes
forecasts. Each AI technology is described below with adoption examples in the international banking sector.

19
Machine learning
Machine learning is a branch of AI that uses statistical methods to allow IT systems the ability to “learn” with
data, without being explicitly coded. The core of machine learning is to automatically discover patterns in data,
and then to use the patterns to make predictions. Machine learning has broadly been used in banking in various
activities which generate large amounts of data. The more data generated from transactions processed, the
better its ability to make predictions to a point where machine learning can predict outcomes before they occur
(Gartner, 2017).
Adoption example
Goldman Sachs have utilised machine learning that can obtain solutions in excess of 65 million query
permutations instantly by examining over 90 000 actions such as monetary policy, economic trends and reports.
This enables the bank and their traders and investors to track stock prices on their portfolios in real-time to
enable efficient decision-making (Deloitte, 2015). The Union Bank of Switzerland has utilised machine learning
to deliver personalised financial advice to their wealthy client base by modelling 85 million individuals’
behavioural patterns (ibid.). In the South African context, Capitec bank is using machine learning to understand
the customer as an individual and customising product offerings relevant to the customer (mybroadband, 2019).
Figure 2.3: Machine learning architecture
(Source: Adapted from Imarticus, 2018)
In Figure 2.3, with every interaction by a customer, machine learning analyses the customer’s actions and
behavioural pattern and memorises it. The machine learning system will then utilise that information to make it
easier for the customer the next time they use the system. This allows firms in identifying patterns across vast
amount of customer data and target audiences. This automatic learning without the need for human
intervention increases efficiency and ensures an enhanced user experience (Imarticus, 2018).

20
Robotic process automation
RPA is a branch of AI in which applications and systems are programmed to perform simple tasks that a person
can do (ibid.). With the recent breakthroughs in computing and bandwidth power and new types of software,
RPA has made a significant impact in banking. It interacts at the interface layer of any system and replicates the
steps by human interaction across multiple applications. RPA is ideally suited to all processes that have defined
rules, and minimum or no human judgement aspect to them. The input into these processes should be electronic
rather than paper, and these processes should be of a high volume to justify the automation (CIO, 2018).
Adoption example
In a use case by global banks, RPA has considerably enhanced the quality of complex manual processes by
reducing errors, which has enhanced the customer experience. Argentinean bank, Banco Bilbao Vizcaya
Argentaria has used RPA in their analysis and trading solutions to pre-emptively observe and prevent trading
malpractice at its headquarters in New York and London (Deloitte, 2015). In the South African context, Rand
Merchant bank applies RPA in taking over repetitive tasks and for capturing new client information and ongoing
maintenance of that information (Businesslive, 2018).
Figure 2.4: RPA in customer ordering architecture
(Source: Adapted from PWC, 2017)
In Figure 2.4, RPA is utilised to automate repetitive manual tasks in a customer ordering system. In this particular
adoption example, RPA resulted in an 80% cost reduction while reducing the time taken by 34%. there is no
human intervention unless there is an exception flagged in the process.
21
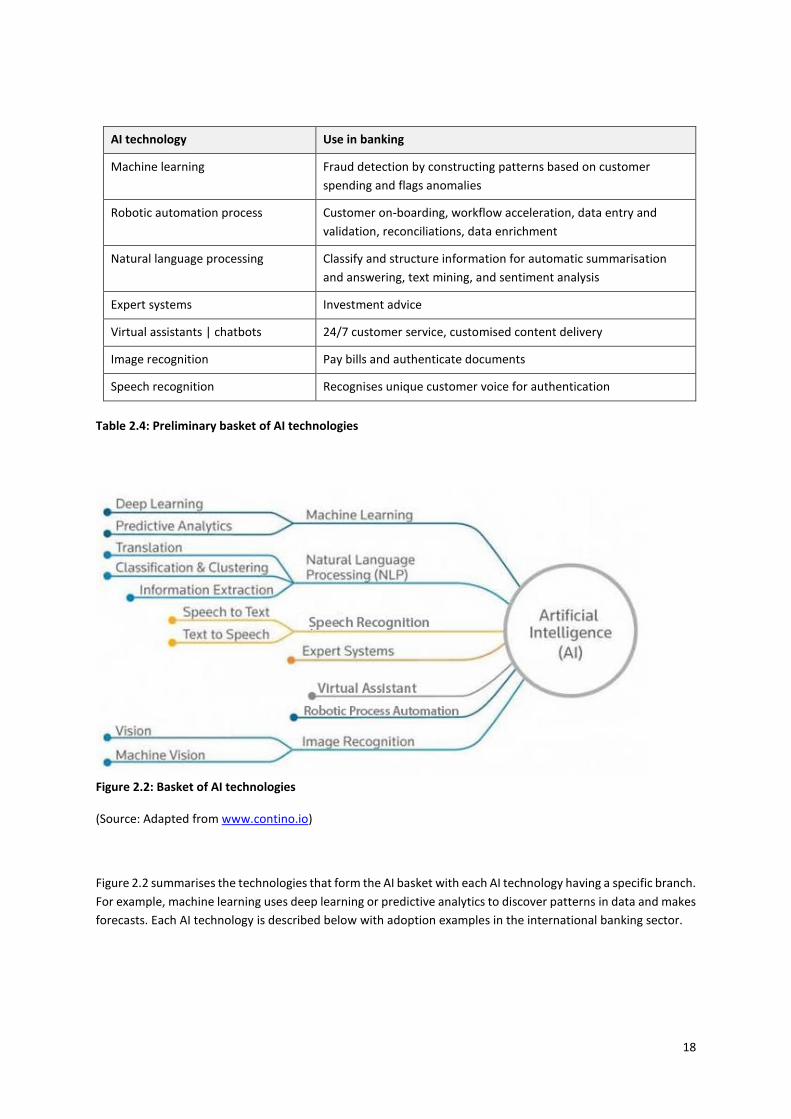
Natural language processing
NLP is branch of AI that helps computers “understand, interpret and manipulate human language” (Collobert
and Weston, 2008). Current applications of NLP include extraction of information, machine translation,
summarisation and human interfaces (ibid.). The benefits to organisations are much wider than cost savings and
include efficient use of technology experts and enhanced decision-making.
Adoption example
Banking firms utilise NLP technologies to create semantic rules, are effective in extracting customer information
on customer forms, and are used by firms such as Credit Suisse and United Services Automobile Association
(USAA) (Deloitte, 2015). Table 2.5 below highlights the various applications of NLP in banking firms. In the South
African context, Standard Bank adopted IBM's Watson by utilising NLP to increase the speed of which it handles
customer queries (Computerworld, 2014). Staff can identify customers, asses and react quickly to their needs.
Application Description
Machine translation Machine translation helps banking firms to conquer language barriers that are
often encountered by translating technical manuals, support content or
catalogues at a significantly reduced cost
Information extraction Taking information from events in financial markets, and extracting the
pertinent information in a format that can be factored into algorithmic trading
decisions
Summarisation Summarisation for banks is relevant not only for digesting the meaning of
documents and information, but to also understand the emotional meanings
inside the information, such as in collecting data from social media
Question answering A question and answering application is an efficient system capable of
coherently answering a human request. It may be used as a text-only interface
or as a spoken dialog system.
Table 2.5: Applications of natural language processing
(Source: Adapted from Techemergence.com, 2018)
Expert systems
Expert systems are a branch of AI where applications simulate the decision making and performance of a human
or an organisation that has expert understanding and expertise in a particular field. Expert systems are typically
used in banking for advising, diagnosing, interpreting results, predicting results and formulating alternative
options to problems (Accenture, 2017). Figure 2.5 displays the basic architecture for expert systems in which
key components comprise the knowledge base, interface engine and user interface (Smith and Eckroth, 2017).
The knowledge bases contain high quality knowledge of a specific domain and require great accuracy and
precision. The interface engine obtains and directs the knowledge from the knowledge base to reach a precise
solution. The user’s interface is a mechanism which allows the user to communicate with the expert system. It
describes how the expert system arrived at a particular solution.

22
Figure 2.5: Expert systems architecture
(Source: Al-Tarawneh, 2017)
Adoption example
CitiBank has utilised expert systems which operate to instantly recognise and eliminate fraud in branch and
online banking. Fraudulent or suspicious behaviour is identified, and the client is immediately alerted (Deloitte,
2015).
Virtual assistants and chatbots
Virtual assistants and chatbots are applications designed to simulate communications between the application
and human users. Figure 2.6 displays the basic architecture of chat bot technology, which utilizes natural
conversation to give users customised access and content (Yan, Castro, Cheng and Ishakian, 2016). Users will no
longer have to search and navigate for information that is relevant to them.
Adoption example
JP Morgan Chase piloted a virtual assistant in 2016 to respond to provide assistance to employee system and
application requests. The virtual assistant managed to efficiently resolve 120 000 employee requests without
human intervention. Banking firm, Wells Fargo utilised chatbots through social media messenger platform,
Facebook, which interacted with customers to present account information and assist in resetting their
passwords (Deloitte, 2015). In the South African context, ABSA bank has utilised chatbots to solve simple
customer queries, freeing up bankers to focus on more complex customer problems (Businesstech, 2016).

23
Figure 2.6: Chatbot architecture
(Source: Yan et al., 2016)
Speech recognition
Speech recognition is technology that has the ability to identify spoken words which can be converted into text
(Alhawiti, 2015). Speech recognition has become one of the widely-used AI technologies as it offers the ability
to interact and communicate with automated machines (Alhawiti, 2015). Speech recognition innovation has
already begun replacing traditional means of input like writing, typing, clicking and other selection methods.
Figure 2.7 presents the basic speech recognition system architecture. Applications interact with the decoder to
acquire recognition results that are used to adapt other components in the speech recognition system. The
acoustic model represents knowledge about acoustics, microphones and phonetics while the language model
component determines what constitutes a possible word (Huang and Deng, 2010).
Adoption example
Santander Bank revealed that its banking application can provide secure transactions using voice recognition.
The Royal Bank of Scotland makes use of speech recognition to assist customers’ queries. Swedbank is piloting
speech recognition to handle over 350 diverse customer questions and answers which has realised a 78%
resolution in three months (Deloitte, 2015). Investec private bank deploys voice recognition to analyse and
verify private banking clients and allow them to execute financial transactions (Techfinancials, 2015).

24
Figure 2.7: Speech recognition system architecture
(Source: Alhawiti, 2015)
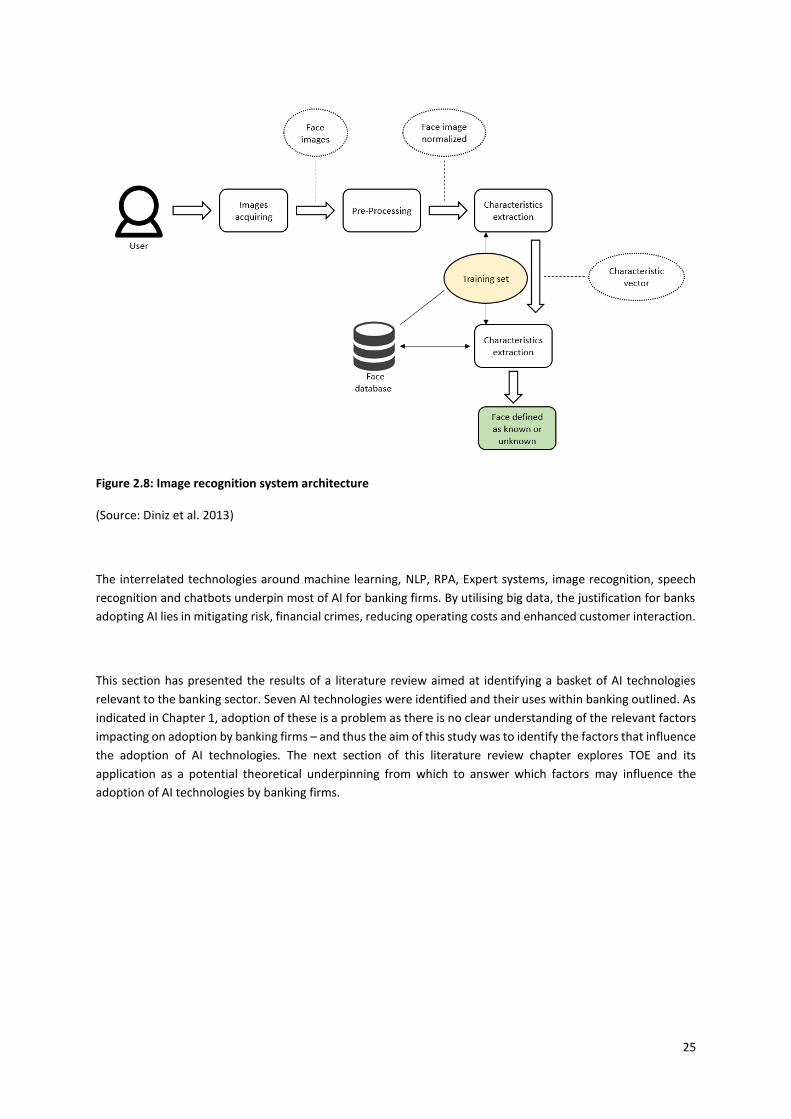
Image recognition
Image recognition is the ability of software to recognise objects, writing, people, places and actions in images
(Gartner, 2017). Image recognition is utilised to operate a great number of machine-based visual tasks, such as
labelling the content search and guiding robotics and self-driving cars. Figure 2.8 represents the image
recognition architecture. The process starts from acquiring the image module via an appropriate mechanism,
thereafter, the algorithm attempts to find any features that encode any data of the class to be detected. Images
are analysed frame by frame, thereafter image pre-processing normalises the image to improve the image
recognition. Individual images are then transformed into a matrix containing the pixel dimensions which are
classified and stored on a database (Diniz et al. 2013).
Adoption example
HSBC allows clients to access its banking application by Face ID which speeds up login time to a second. The Face
ID login connects the bank’s mobile Application Programming Interface (API) to the phone’s software to
authenticate the user – “with less than a one-in-a-million chance of mistaken identity.” Oversea-Chinese Banking
Corporation (OCBC) uses facial recognition to identify key clients at its branch in real-time without the client
looking into the camera, thereby enhancing customer service (Forbes, 2017). Nedbank has piloted opening bank
accounts when customers send a selfie on their banking application (Businesstech, 2016).
25
Figure 2.8: Image recognition system architecture
(Source: Diniz et al. 2013)
The interrelated technologies around machine learning, NLP, RPA, Expert systems, image recognition, speech
recognition and chatbots underpin most of AI for banking firms. By utilising big data, the justification for banks
adopting AI lies in mitigating risk, financial crimes, reducing operating costs and enhanced customer interaction.
This section has presented the results of a literature review aimed at identifying a basket of AI technologies
relevant to the banking sector. Seven AI technologies were identified and their uses within banking outlined. As
indicated in Chapter 1, adoption of these is a problem as there is no clear understanding of the relevant factors
impacting on adoption by banking firms – and thus the aim of this study was to identify the factors that influence
the adoption of AI technologies. The next section of this literature review chapter explores TOE and its
application as a potential theoretical underpinning from which to answer which factors may influence the
adoption of AI technologies by banking firms.

26
2.3 ORGANISATIONAL LEVEL ADOPTION OF TECHNOLOGIES
A systematic review method was also used to explore past literature into the organisational adoption of IT. This
review was necessary because the TOE framework is a useful framework for technology adoption and some of
the factors are universally applicable to adoption regardless of technology. There are no studies on AI technology
adoption drawing on the TOE framework and hence presents a research gap.
Step 1:
The purpose of SLR 2 was to identify what empirical research has drawn on the TOE framework to describe
organisational adoption of technological innovations.
Step 2:
The following data sources were used for SLR 2:
• EBSCO Host
• IEEE Xplore
• JSTOR
• ScienceDirect
The use of Google scholar was utilised as a supplementary academic search engine.
Step 3:
As part of the SLR methodology, the following were applied to the search strings:
a) Unit of analysis:
• Organisation OR
• Organization OR
• Firm OR
• Business OR
• Bank
b) Theoretical framework:
• TOE OR
• TOE Framework OR
• Technology, Organisational and Environmental OR
• Technology, Organisational and Environmental Framework
c) Phenomenon of interest:
• Adoption OR
• Usage OR
• Decision to use
27
Examples of search strings used:
• Organisation AND TOE AND Adoption
• Firm AND TOE AND Adoption
• Business AND TOE AND Adoption
• Bank ANDxTOExANDxAdoption
• Organisation AND Technology, Organisational and Environmental AND Adoption
• Firm AND Technology, Organisational and Environmental AND Adoption
• Business AND Organisation AND Technology, Organisational and Environmental AND Adoption
• Bank AND Organisation AND Technology, Organisational and Environmental AND Adoption
• Organisation AND Technology, Organisational and Environmental Framework AND Adoption
• Firm AND Technology, Organisational and Environmental Framework AND Adoption
Step 4:
For SLR 2, the following inclusion and exclusion criteria were applied to ensure that the selected studies were of
sufficient quality for the study:
a) Inclusion criteria
• Organisational-level study
• Quantitative studies using empirical research
• Peer-reviewed papers
• Research papers from conferences and journals
• Research relating to a technological innovation involving decision to adopt or use
• Papers in English
b) Exclusion criteria
• Individual-level study
• Qualitative research methods
• Practitioner-based studies where no research method was adhered to
• Duplicate papers relating to the research question
Step 5:
This step provided a view of the remaining papers following the application of the inclusion and exclusion
criteria. Based on the content of the research question, 15 papers where selected to be used in this study.
Step 6:
Writing the review is presented highlighting the numerous studies on technological adoption drawing on the
TOE framework.
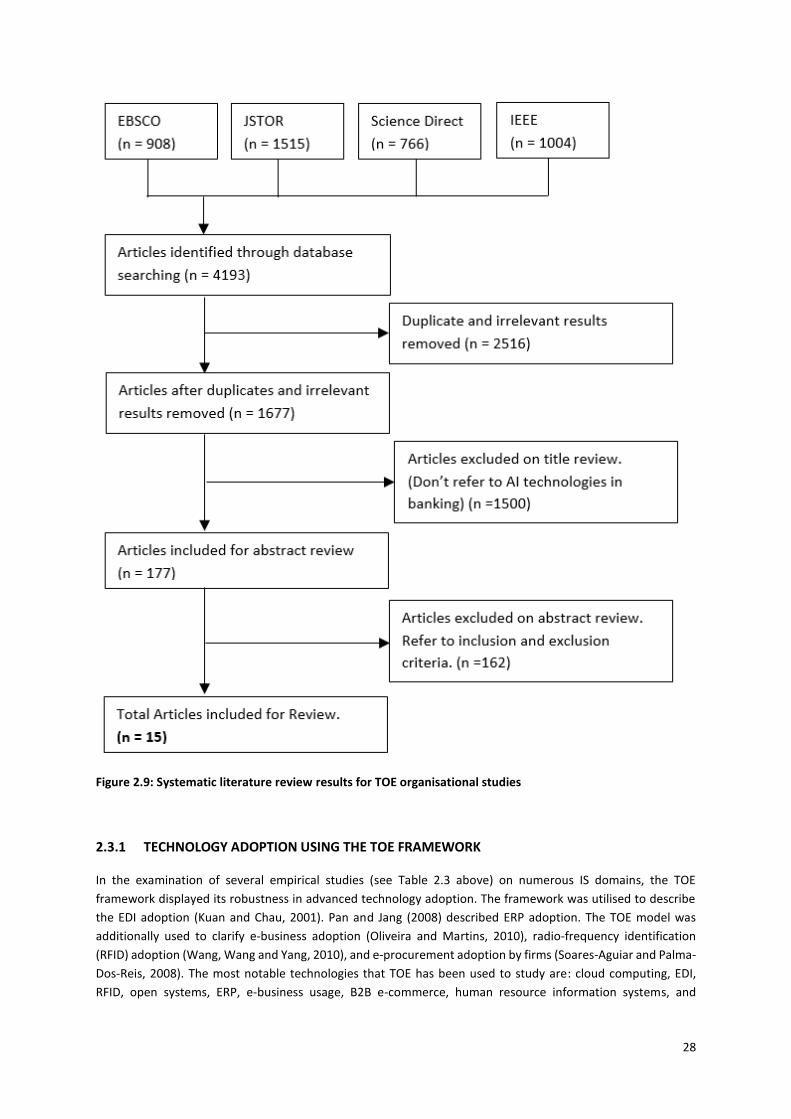
28
Figure 2.9: Systematic literature review results for TOE organisational studies
2.3.1 TECHNOLOGY ADOPTION USING THE TOE FRAMEWORK
In the examination of several empirical studies (see Table 2.3 above) on numerous IS domains, the TOE
framework displayed its robustness in advanced technology adoption. The framework was utilised to describe
the EDI adoption (Kuan and Chau, 2001). Pan and Jang (2008) described ERP adoption. The TOE model was
additionally used to clarify e-business adoption (Oliveira and Martins, 2010), radio-frequency identification
(RFID) adoption (Wang, Wang and Yang, 2010), and e-procurement adoption by firms (Soares-Aguiar and Palma-
Dos-Reis, 2008). The most notable technologies that TOE has been used to study are: cloud computing, EDI,
RFID, open systems, ERP, e-business usage, B2B e-commerce, human resource information systems, and
29
knowledge management systems. Empirical discoveries from these investigations affirmed that the TOE
methodology is an important framework through which to comprehend the adoption of IT innovation.
Based on reviewing the literature, several quantitative studies using the TOE framework were used to study the
adoption of advanced technology at the firm level. Taken together, these studies suggest that the adoption of
innovations by firms can suitably be described through the TOE model. More specifically, these studies have
aided in the foundation for developing a research model for the adoption of AI by firms. The investigation of
these studies has distinguished factors that will guide the adoption of AI. What we have learned from these
studies is the TOE framework is well-established, extensively applied, and a useful theoretical lens for studying
the adoption of diverse innovative technologies. Considering the theme of this study denotes the adoption of
technological innovations through the banking firm’s perspective, the TOE framework is selected as the research
model.
Perceived benefits have typically been defined as the probable advantages that an innovative technology can
deliver to the organisation and have been found to be important to the adoption of EDI, open systems, cloud,
RFID and ERP technologies (Chau and Tam, 1997; Kuan and Chau, 2001; Pan and Jang, 2008; Wang, Wang and
Yang, 2010).
In the successful adoption of technological innovations such as EDI, ERP and e-commerce, it was found in current
literature that technological resources are recognised as a significant factor (Kuan and Chau, 2001; Pan and Jang,
2008). Like the approach taken by Soares-Aguiar and Palma-dos-Reis (2008), this study postulates technology
competence as an adoption factor which incorporates two sub-constructs: (1) IT infrastructure – technologies
that enable innovative technology, and (2) IT expertise – an employee’s knowledge and skills of using innovative
technologies.
Top management support has usually been considered to take the form of top management providing vision,
promotion and a commitment to forging a positive environment correlated for innovation, and has consistently
been found to be important across technologies of RFID, e-commerce, B2B e-commerce, and knowledge
management systems technologies (Lee et al., 2009; Liu, 2008; Soares-Aguiar and Palma-dos-Reis, 2008; Teo,
Ranganathan and Dhaliwal, 2006).
Firm size has been used in many studies on the adoption of various technologies, such as e-procurement, e-
commerce development, ERP, e-business, RFID and cloud computing (Liu, 2008; Pan and Jang, 2008; Soares-
Aguiar and Palma-dos-Reis, 2008; Zhu, Kraemer and Xu, 2003).
Competitive pressure represents the amount of pressure felt by the organisation from competing organisations
within the industry (Oliveira and Martins, 2010), and found to be important to the adoption of e-business, e-
commerce, RFID and e-procurement (Oliveira and Martins, 2009; Pan and Jang, 2008; Zhu, Kraemer and Xu,
2003; Zhu and Kraemer, 2005).
Regulatory requirements have been accredited as a considerable factor influencing innovation diffusion (Zhu,
Kraemer and Xu, 2003; Zhu et al., 2006; Zhu and Kraemer, 2005). Regulatory support is the way government
regulation and laws could affect innovation diffusion (Zhu and Kraemer, 2005). Studies have found that the
following technologies have been affected by regulatory requirements: EDI, ERP and e-business usage (Kuan and
Chau, 2001; Pan and Jang, 2008; Zhu and Kraemer, 2005; Zhu et al., 2006).
A shortcoming of the existing collection of literature conducted to date is that there are no studies on the
adoption of AI technologies. This research gap has been identified and will be addressed by RQ3.
The key finds of the review of the TOE literature and the variables identified are summarised in Table 2.6 below.

30
Source IT artefact Key findings and variables
Determinants of the
Adoption of Enterprise
Resource Planning within
the Technology-
Organization-Environment
Framework
(Pan and Jang, 2008)
Enterprise resource
planning
TOE correctly classified 79.8% of the decisions made with respect to ERP adoption.
The following 8 variables were used:
• Technological context - IT infrastructure; technology readiness
• Organisational context - size; perceived barriers
• Environmental context - production and operations improvement; enhancement of products and services;
competitive pressure; regulatory policy
A Perception-Based Model
for EDI Adoption in Small
Businesses Using a
Technology-Organization-
Environment Framework
(Kuan and Chau, 2001)
Electronic data
interchange
TOE framework was used to demonstrate that adopter firms perceive lower financial costs and higher technical
competence than non-adopter firms.
The following 6 variables were used:
• Technological context - perceived direct benefits; perceived indirect benefits
• Organisational context - perceived financial cost; perceived technical competence
• Environmental context - perceived industry pressure; perceived government pressure
Firms Patterns of E-
Business Adoption:
Evidence for the European
Union-27
(Oliveira and Martins,
2010)
E-business Used the TOE and lacovou, Benbasat and Dexter (1995) model to examine adoption of e-business across multi-
industries.
The following 7 variables were used:
• Perceived benefits - perceived benefits and obstacles of e-business
• Technology and organisation readiness - technology readiness; technology integration; firm size
• Environment and external pressure - competitive pressure; trading partner collaboration
• Controls - country and industry effects

31
Understanding the
Determinants of RFID
Adoption in the
Manufacturing Industry.
(Wang, Wang and Yang,
2010)
Radio-frequency
identification
TOE is a valuable framework in helping to predict RFID adoption.
The following 9 variables were used:
• Technology - relative advantage; complexity; compatibility
• Organisation - top management support; firm size; technology competence
• Environment - competitive pressure; trading partner pressure; information intensity
Why Do Firms Adopt E-
Procurement Systems?
Using Logistic Regression
to Empirically Test a
Conceptual Model.
(Soares-Aguiar and Palma-
Dos-Reis, 2008)
E-procurement
systems
Provides evidence that TOE provides a reasonable estimate for a firm’s likelihood to adopt e-procurement
systems.
The following 9 variables were used:
• Technological context - technology competence; IT expertise; B2B know-how
• Organisational context - firm size; firm scope
• Environmental context - trading partner readiness; extent of adoption amongst competitors; perceived
success of competitor adopters
• Controls - industry effects
Factors Affecting the
Adoption of Open
Systems: An Exploratory
Study.
(Chau and Tam, 1997)
Open systems Successful adoption of open systems is believed to provide an organisation with competitive advantages and
flexibility to cope with the dynamic business environment.
The following 9 variables were used:
• Technology - perceived benefits; perceived barriers; perceived importance of compliance to stands;
interoperability; interconnectivity
• Organisation - complexity of IT infrastructure; satisfaction with existing systems; formalisation on system
development and management
• Environment - market uncertainty
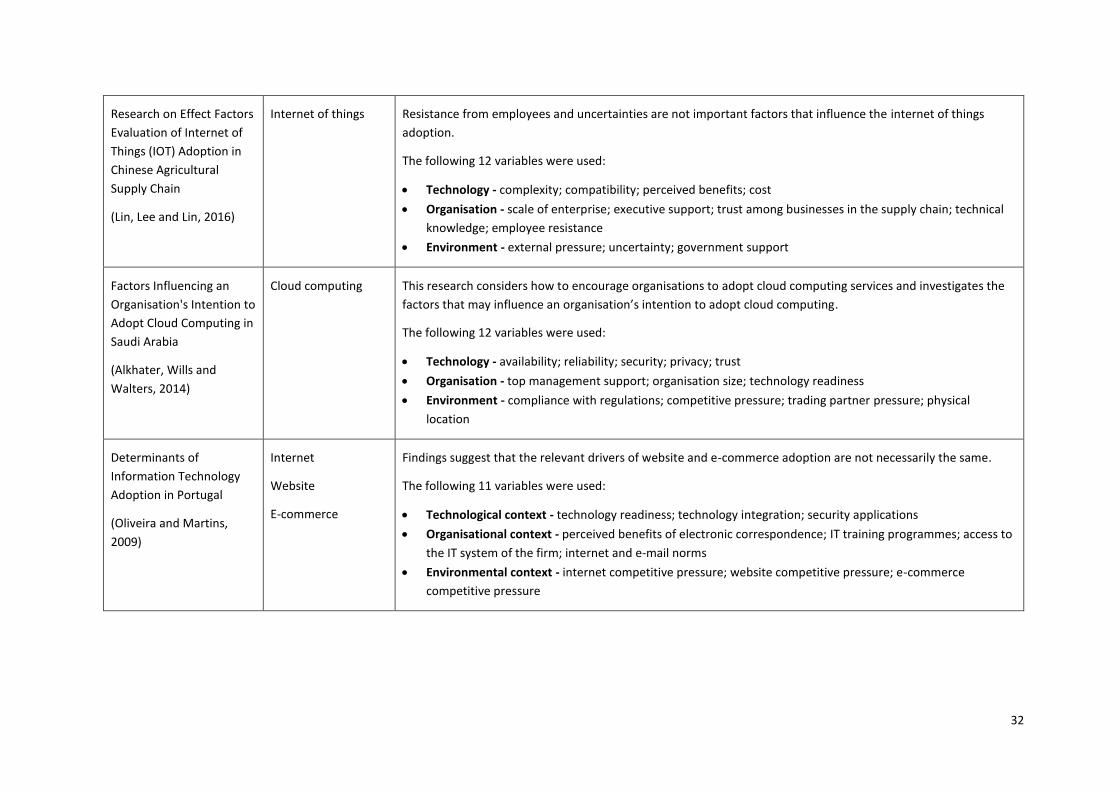
32
Research on Effect Factors
Evaluation of Internet of
Things (IOT) Adoption in
Chinese Agricultural
Supply Chain
(Lin, Lee and Lin, 2016)
Internet of things Resistance from employees and uncertainties are not important factors that influence the internet of things
adoption.
The following 12 variables were used:
• Technology - complexity; compatibility; perceived benefits; cost
• Organisation - scale of enterprise; executive support; trust among businesses in the supply chain; technical
knowledge; employee resistance
• Environment - external pressure; uncertainty; government support
Factors Influencing an
Organisation's Intention to
Adopt Cloud Computing in
Saudi Arabia
(Alkhater, Wills and
Walters, 2014)
Cloud computing This research considers how to encourage organisations to adopt cloud computing services and investigates the
factors that may influence an organisation’s intention to adopt cloud computing.
The following 12 variables were used:
• Technology - availability; reliability; security; privacy; trust
• Organisation - top management support; organisation size; technology readiness
• Environment - compliance with regulations; competitive pressure; trading partner pressure; physical
location
Determinants of
Information Technology
Adoption in Portugal
(Oliveira and Martins,
2009)
Internet
Website
E-commerce
Findings suggest that the relevant drivers of website and e-commerce adoption are not necessarily the same.
The following 11 variables were used:
• Technological context - technology readiness; technology integration; security applications
• Organisational context - perceived benefits of electronic correspondence; IT training programmes; access to
the IT system of the firm; internet and e-mail norms
• Environmental context - internet competitive pressure; website competitive pressure; e-commerce
competitive pressure

33
Key Dimensions of
Inhibitors for the
Deployment of Web-
Based Business-to-
Business Electronic
Commerce
(Teo, Ranganathan and
Dhaliwal, 2006)
B2B e-commerce The results suggest that key inhibitors in B2B deployment are the lack of top management support, unresolved
technical issues, the lack of e-commerce strategy, and the difficulties in cost-benefit assessment of e-commerce
investments.
The following 10 variables were used:
• Technological context - unresolved technical issues; lack of IT expertise and infrastructure; lack of
interoperability
• Organisational context - difficulties in organisational change; problems in project management; lack of top
management support; lack of e-commerce strategy; difficulties in cost-benefit assessment
• Environmental context - unresolved legal issues; fear and uncertainty
Predicting E-Readiness at
Firm-Level: An Analysis of
Technological,
Organizational and
Environmental (TOE)
Effects on E-Maintenance
Readiness in
Manufacturing Firms
(Aboelmaged, 2014)
E-maintenance The dimensions of e-maintenance technology readiness in manufacturing firms are mainly influenced by
technological and organisational determinants involving technological infrastructure and competence, expected
benefits and challenges of e-maintenance, and firm size and ownership.
The following 7 variables were used:
• Technological context - technology infrastructure; technology competence
• Organisational context - perceived benefits; perceived challenges; maintenance priority; firm size
• Environmental context - competitive pressure
Cloudrise: Exploring Cloud
Computing Adoption and
Governance With the TOE
Framework
(Borgman et al., 2013)
Cloud computing The results indicate that the technology and organisation context affect implementation decisions of global
enterprises across various industries.
The following 8 variables were used:
• Technological context - relative advantage; technology complexity; technology compatibility
• Organisational context - firm size; top management support; IT expertise of business users
• Environmental context - competition intensity; regulatory environment
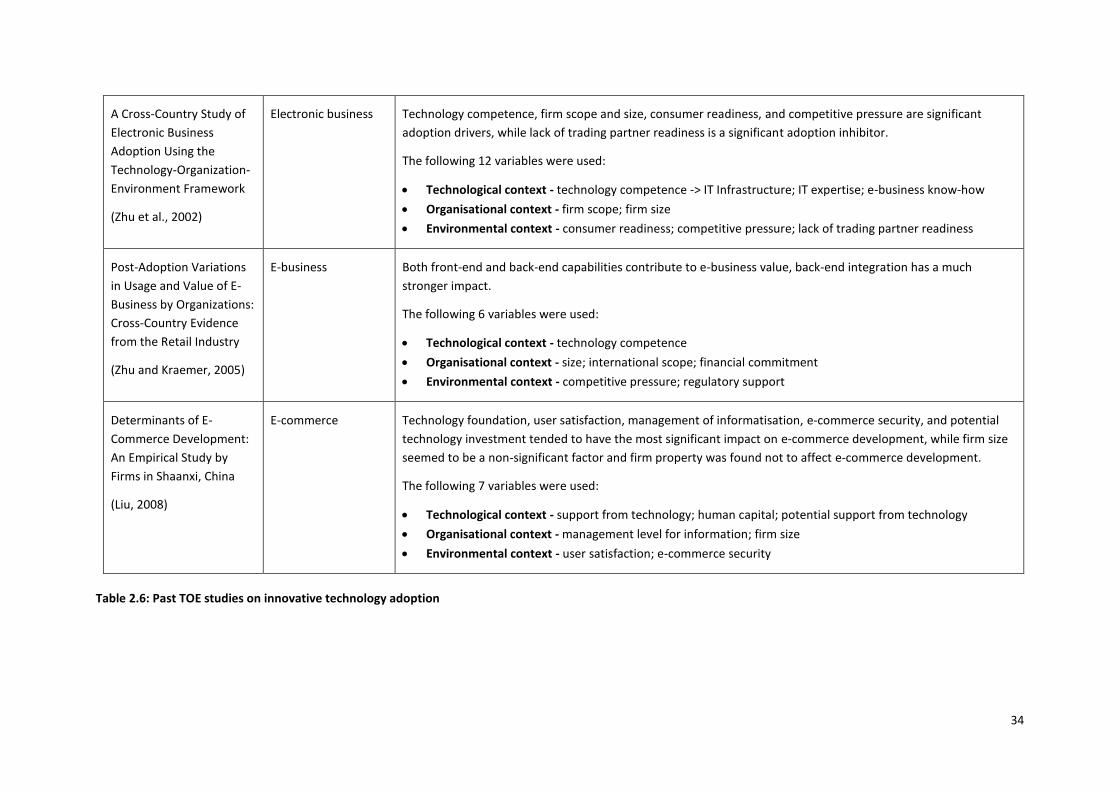
34
A Cross-Country Study of
Electronic Business
Adoption Using the
Technology-Organization-
Environment Framework
(Zhu et al., 2002)
Electronic business Technology competence, firm scope and size, consumer readiness, and competitive pressure are significant
adoption drivers, while lack of trading partner readiness is a significant adoption inhibitor.
The following 12 variables were used:
• Technological context - technology competence -> IT Infrastructure; IT expertise; e-business know-how
• Organisational context - firm scope; firm size
• Environmental context - consumer readiness; competitive pressure; lack of trading partner readiness
Post-Adoption Variations
in Usage and Value of E-
Business by Organizations:
Cross-Country Evidence
from the Retail Industry
(Zhu and Kraemer, 2005)
E-business Both front-end and back-end capabilities contribute to e-business value, back-end integration has a much
stronger impact.
The following 6 variables were used:
• Technological context - technology competence
• Organisational context - size; international scope; financial commitment
• Environmental context - competitive pressure; regulatory support
Determinants of E-
Commerce Development:
An Empirical Study by
Firms in Shaanxi, China
(Liu, 2008)
E-commerce
Technology foundation, user satisfaction, management of informatisation, e-commerce security, and potential
technology investment tended to have the most significant impact on e-commerce development, while firm size
seemed to be a non-significant factor and firm property was found not to affect e-commerce development.
The following 7 variables were used:
• Technological context - support from technology; human capital; potential support from technology
• Organisational context - management level for information; firm size
• Environmental context - user satisfaction; e-commerce security
Table 2.6: Past TOE studies on innovative technology adoption
35
2.4 ARTIFICIAL INTELLIGENCE IN THE SOUTH AFRICAN CONTEXT
A systematic search was carried out to identify literature on AI adoption in South Africa. However, results reveal
no studies into AI adoption and no studies into AI adoption in the banking context. Global banks such as JP
Morgan Chase, Wells Fargo, CitiBank and Bank of America have recognised AI technology implementations in
areas such as AI-driven chatbots, machine learning for client equity offerings, and virtual assistants for enhanced
customer interaction. There is no clear indication from the literature of the extent to which AI technologies have
diffused in South African industries, and banking in particular. However, there are more general studies into AI
from a practitioner perspective into machine learning, virtual advisors and AI start-ups (Accenture, 2017), thus
providing further impetus to this study.
2.5 CHAPTER SUMMARY
This chapter presented a summary of what is in the current body of knowledge regarding a basket of AI
technologies and organisational adoption of innovative technologies. Past work has established the relevance
of TOE as a framework through which to study the adoption of IT. Prior studies have no applications of TOE to
study the adoption of AI technologies and none in the banking context. Quantitative and qualitative studies from
the literature review, supplemented with website reviews, were used to develop a basket of AI technologies.
Quantitative studies were reviewed to determine organisational adoption of innovative technologies drawing
on the TOE framework. It was found that although TOE was used to describe technology adoption, AI
technologies have not been researched. This was identified as a research gap. Hence, this research will provide
a meaningful academic contribution to the pool of knowledge on AI adoption.

36
CHAPTER 3: THEORETICAL BACKGROUND AND RESEARCH MODEL
Technology adoption in IS research has numerous theories, such as the technology acceptance model (Davis,
1986), the unified theory of acceptance and use of technology (Venkatesh et al., 2003), the theory of planned
behaviour (Ajzen, 1985), diffusion of innovations (Rogers, 1995), and the TOE framework (Tornatzky and
Fleischer, 1990). The first three of these are grounded in social psychology and are therefore typically linked
with studies of technology adoption at the individual level. The diffusion of innovations and the TOE framework
have been associated with organisational-level adoption studies.
3.1 THE TECHNOLOGY–ORGANISATION–ENVIRONMENT (TOE) FRAMEWORK
The TOE framework is a firm-level theory that clarifies three distinct components of organisations’ adoption
choices (Oliveira and Martins, 2011). The three components are the technological context, the organisational
context, and the environmental context, where every one of the three is conceived as influencing technological
innovation. These components influence the approach firms take in the adoption of new technology (ibid.)
Figure 3.1: The TOE framework
(Source: Tornatzky and Fleischer, 1990)
37
3.1.1 THE TECHNOLOGICAL CONTEXT
The technological context refers to all the technologies that are applicable to the organisation, which include
technology already in use within the organisation, and those not currently in use but available in the marketplace
(Baker, 2012). An organisation’s current technology is a benchmark when adopting new technology as it
determines the boundaries of the range and velocity of the technology transformation that the organisation can
take on (Collins, Hage and Hull, 1988). Technological innovations that are available in the market but not used
by the organisation have an influence on adoption – both by establishing boundaries in what the firm can
achieve, and by revealing to firms how technology can guide them in achieving their goals (Baker, 2012). Factors
such as perceived benefits, technology competence, IT infrastructure and IT expertise are typically considered
relevant technological factors. Studies have revealed that organisations with sophisticated IT infrastructure have
a higher likelihood of successfully implementing innovative technology (Chau and Tam, 1997; Zhu and Kraemer,
2005). The existence of empirical evidence suggests that organisations and employees that possess the essential
expertise, and technical experience, are more likely to develop innovative technologies (Lin and Lin, 2008).
3.1.2 THE ORGANISATIONAL CONTEXT
The organisational context denotes the attributes and assets of the firm, including relationships amongst
employees, top management support, the size of the organisation, and the number of slack resources (Baker,
2012). There are numerous ways in which the organisational context influences adoption and implementation
decisions and include the following variables: organisation size in the study by Pan and Jang (2008); perceived
technical competence by Kuan and Chau (2001); and top management support and firm size by Wang, Wang
and Yang (2010). Senior managers can promote innovation within an organisational environment by encouraging
change and innovation that expands the organisation’s core strategy and vision (Tushman and Nadler, 1986).
Matta, Koonce and Jeyaraj (2012) indicated the significance of the role of firm size during experimentation and
implementing innovations. Factors such as firm size and top management support are typically considered
relevant organisational factors.
3.1.3 THE ENVIRONMENTAL CONTEXT
The context in which the firm conducts its business activities includes the firm’s competitors, macroeconomic
context, and the regulatory environment (Baker, 2012). Intense competition within the industry sector boosts
the adoption of technology (Mansfield et al., 1977). Baker (2012) goes on to state that organisations in rapidly
developing sectors manage to innovate sooner. The accessibility of technology specialists and technology
consultancies also nurtures innovation (Rees, Briggs and Hicks, 1984). Regulations by governmental agencies can
develop an advantageous or an unfavourable impact on innovation when these authorities enforce new
restrictions on the industry sectors (Baker, 2012). The high-tech industries are associated with rapid changes, as
such organisations encounter pressure and become progressively mindful, and accompany their competitors'
strategy of adopting new innovations (Low, Chen and Wu, 2011). Factors such as competitive pressure, and
regulatory and legal polices, are typically considered to be relevant environmental factors.
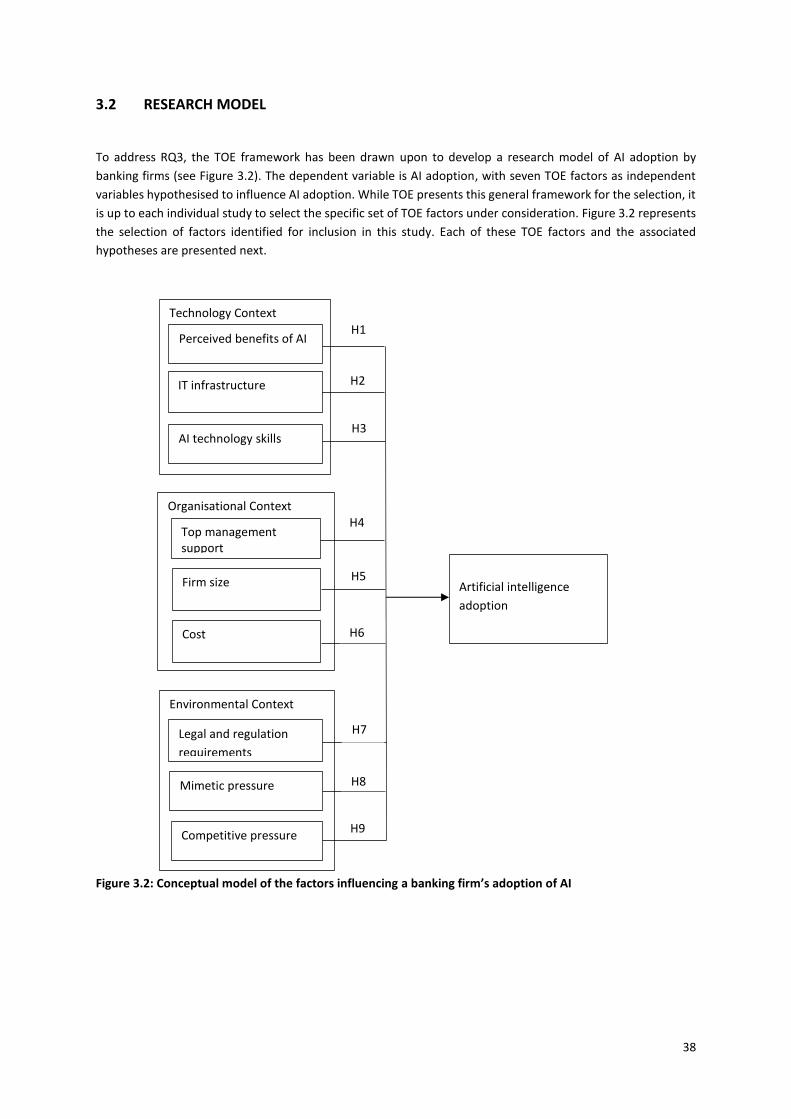
38
3.2 RESEARCH MODEL
To address RQ3, the TOE framework has been drawn upon to develop a research model of AI adoption by
banking firms (see Figure 3.2). The dependent variable is AI adoption, with seven TOE factors as independent
variables hypothesised to influence AI adoption. While TOE presents this general framework for the selection, it
is up to each individual study to select the specific set of TOE factors under consideration. Figure 3.2 represents
the selection of factors identified for inclusion in this study. Each of these TOE factors and the associated
hypotheses are presented next.
Figure 3.2: Conceptual model of the factors influencing a banking firm’s adoption of AI
Artificial intelligence
adoption
H5
H2
Technology Context
Perceived benefits of AI
Environmental Context
Legal and regulation
requirements
Competitive pressure
Organisational Context
Top management support
Firm size
AI technology skills
H1
H4
H7
H8 Mimetic pressure
H9
IT infrastructure
H3
Cost H6
39
3.2.1 THE TECHNOLOGICAL CONTEXT
Perceived benefits of AI
The predicted benefits that the adoption of AI provides to the firm are known as perceived benefits (Oliveira
and Martins, 2010). When top management understands the relative benefits of the associated innovation, the
probability of other functional areas within the organisation – such as operations and finance to adopt that
innovation – increases (Iacovou, Benbasat and Dexter, 1995; Rogers, 2004). AI activities can empower firms to
enhance their operations by lowering errors, enhancing quality and delivery, and at times accomplishing tasks
that go beyond human capacities (Manyika et al., 2017). By utilising machine learning and advanced algorithms,
AI has helped banking firms to detect patterns of suspicious behaviour, thereby limiting fraud and money
laundering which can have a negative effect on the firm’s reputation (Marous, 2016). Banking firms can take
advantage of RPA, which automates customer engagement in an intelligent manner and, in turn, provides
enhanced customer experience and greater cost savings for the bank (Pan, 2016). With the reduction in costs
and certain return on investments, banking firms have a motivation to participate in AI for their banking products
and services (Manyika et al., 2017). The following hypothesis is proposed:
H1. The greater the perceived benefits of AI adoption by banking firms, the more likely will be the adoption of
AI.
IT infrastructure
Infrastructure refers to technology platforms such as computer hardware, servers, software and networking
technologies that are required to implement new technology solutions throughout a firm (Wang, Wang and
Yang, 2010). Tornatzky and Fleischer (1990) highlight the substantial role of IT infrastructure as an intramural
competitive resource that influences technology adoption in the firm. The availability of highly designed IT
infrastructure indicates IT readiness and promotes its effectiveness, which leads to enhancement in cycle time
and costs associated with new innovations (Aboelmaged, 2014). In contrast, a lack of a highly developed IT
infrastructure may hinder and limit the firm’s future technological selections, adoption and success (ibid.). In
this study, IT infrastructure denotes technologies that provide a foundation for AI-based technologies.
H2. The greater the availability of highly developed IT infrastructure, the more likely will be the adoption of AI.
AI technology skills
The TOE framework draws our attention to the inclusion of IT expertise which can be referred to as the firm-
level specialised IT expertise of a specific technology (Pudjianto and Hangjung, 2009). The specific technology in
this study is on AI expertise, which can be defined as the firm-level of AI technology skills in banking firms. IT
specialists provide the expertise and necessary organisational aptitude to develop complex AI applications
(Wang, Wang and Yang, 2010). Developing AI systems is complex and requires sophisticated skills that
continually evolve as the technology advances. IT professionals should be retrained regularly to keep abreast of
the evolving technologies, as they work alongside machines, and as their skills are required to develop and
integrate AI systems for organisations to continually adopt (Manyika et al., 2017). Brynjolfsson and McAfee
(2012) report that there is already a shift in the labour market that has created a growing demand for highly
skilled AI experts. The following hypothesis is proposed:
H3. The greater the levels of AI technology skills of banking firms, the more likely will be the adoption of AI.
40
3.2.2 THE ORGANISATIONAL CONTEXT
Top management support
Top management support is an essential factor in the implementation of new technology and has been found
previously to be strongly related to adoption (Lee and Kim, 2007). The provision of vision, strategy and support
by top management creates an environment that fosters innovation (Wang, Wang and Yang, 2010). The value
that top management is increasingly placing on innovation, collaboration, and creative and social intelligence,
will grow in importance as AI takes on more responsibilities within the firm (Kolbjørnsrud, Amico and Thomas,
2017). Implementing AI requires substantial resources, re-engineering of business processes, and aligning users
– all of which require support from top management (Wang, Wang and Yang, 2010). Top management can
communicate the significance of the innovation to the firm, which reiterates the belief in the new technology
(Lee and Kim, 2007). Accordingly, the following hypothesis is proposed:
H4. The greater the perceived support for AI by top management within banking firms, the more likely will be
the adoption of AI.
Firm size
Several studies have discovered that firm size promotes innovation (Wang, Wang and Yang, 2010). A proxy
measure for firm size is typically the number of employees within the organisation (Aboelmaged, 2014). The
larger organisations have additional resources to experiment and pilot with innovations and can mitigate the
risks and cost of implementing new innovations (Borgman et al., 2013). There is a significant cost of
implementing in-house AI technologies which are available to larger firms. The following hypothesis is proposed:
H5. The larger the size of the banking firm, the more likely will be the adoption of AI.
Financial cost
Prior studies have revealed that financial costs are an essential factor in technological adoption and
implementation (Zhu et al., 2004). Adopting AI technologies requires significant investment in infrastructure,
software, system integration and employee training. Apart from the technology adoption costs, setup costs and
maintaining AI require a high cost, which affects the adoption of a technological innovation (Teo et al., 2009).
Firms that devote larger financial outlays in hardware, software and technical training are more likely to adopt
AI technologies. Hence the following hypothesis is proposed:
H6. The greater the perceived cost of adopting AI technologies, the less likely will be the adoption.

41
3.2.3 THE ENVIRONMENTAL CONTEXT
Competitive pressure
Competitive pressure has been recognised as an influential dynamic in IT adoption in the banking industry
(Wang, Wang and Yang, 2010). As competition increases in the industry, organisations can pursue competitive
advantage over their rivals through technological innovations (ibid.). By adopting AI-developed products, firms
may profit by better innovation visibility, more noteworthy operation proficiency, and more accurate
information collection (Chao, Yang and Jen, 2007). According to Forbes (2017), technology has fostered a
competitive environment in the banking industry, and therefore banking firms which implement advanced
technologies such as AI will have a competitive edge over their rivals. Thus, the following hypothesis is proposed:
H7. The greater the perceived competitive pressure among banking firms, the more likely will be the adoption
of AI.
Legal and regulatory requirements
Authorities in the banking industry have recognised the key difficulties posed by the rapid advancement of
technology, which has resulted in increased focus on technology-related concerns (Furst, Lang and Nolle, 1998).
Furst, Lang and Nolle (ibid.) highlight that advanced technology such as AI may raise a wide variety of risks and
an assortment of threats, and that governmental authorities are expected to implement contingencies to
mitigate these risks. A significant concern for implementing AI technology is the security risks, and governments
can impose constraining regulations for organisations to manage these risks, which could make AI adoption less
attractive (Borgman et al. 2013). The following hypothesis is proposed:
H8. The greater the perceived legal and regulatory requirements on AI, the less likely will be the adoption of AI.
Mimetic pressure
Mimetic pressure is included as the third environmental context variable and arises from institutional theory,
which argues that when technologies are not entirely understood, or when return on investments are uncertain,
organisations will develop their responses to these innovative technologies based on organisations that they
recognise to be successful (Cohen, Mou and Trope, 2014). The activities of successful organisations can be
considered legitimate. In the event of adopting new technology, mimetic pressures may guide an organisation
to pursue other organisations that are fundamentally similar to themselves, as the organisation will avoid costs
associated with research and first-mover risks by pursuing adoption that appears to have been successful (Teo
et al., 2003). By drawing on the institutional theory, organisations are inclined to adopt AI technologies if they
identify adoption as legitimate and as a contributing factor to peer organisation success. The following
hypothesis is proposed:
H9. The greater the mimetic pressure, the more likely will be the adoption of AI technologies.
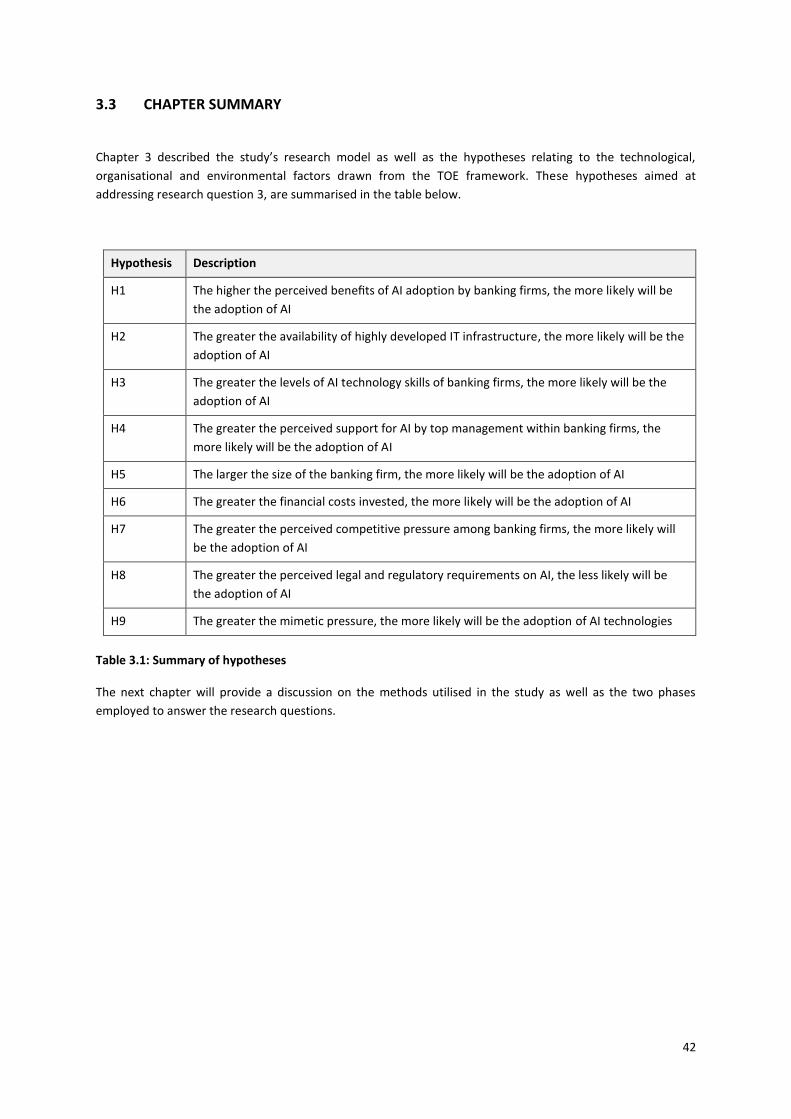
42
3.3 CHAPTER SUMMARY
Chapter 3 described the study’s research model as well as the hypotheses relating to the technological,
organisational and environmental factors drawn from the TOE framework. These hypotheses aimed at
addressing research question 3, are summarised in the table below.
Hypothesis Description
H1 The higher the perceived benefits of AI adoption by banking firms, the more likely will be
the adoption of AI
H2 The greater the availability of highly developed IT infrastructure, the more likely will be the
adoption of AI
H3 The greater the levels of AI technology skills of banking firms, the more likely will be the
adoption of AI
H4 The greater the perceived support for AI by top management within banking firms, the
more likely will be the adoption of AI
H5 The larger the size of the banking firm, the more likely will be the adoption of AI
H6 The greater the financial costs invested, the more likely will be the adoption of AI
H7 The greater the perceived competitive pressure among banking firms, the more likely will
be the adoption of AI
H8 The greater the perceived legal and regulatory requirements on AI, the less likely will be
the adoption of AI
H9 The greater the mimetic pressure, the more likely will be the adoption of AI technologies
Table 3.1: Summary of hypotheses
The next chapter will provide a discussion on the methods utilised in the study as well as the two phases
employed to answer the research questions.
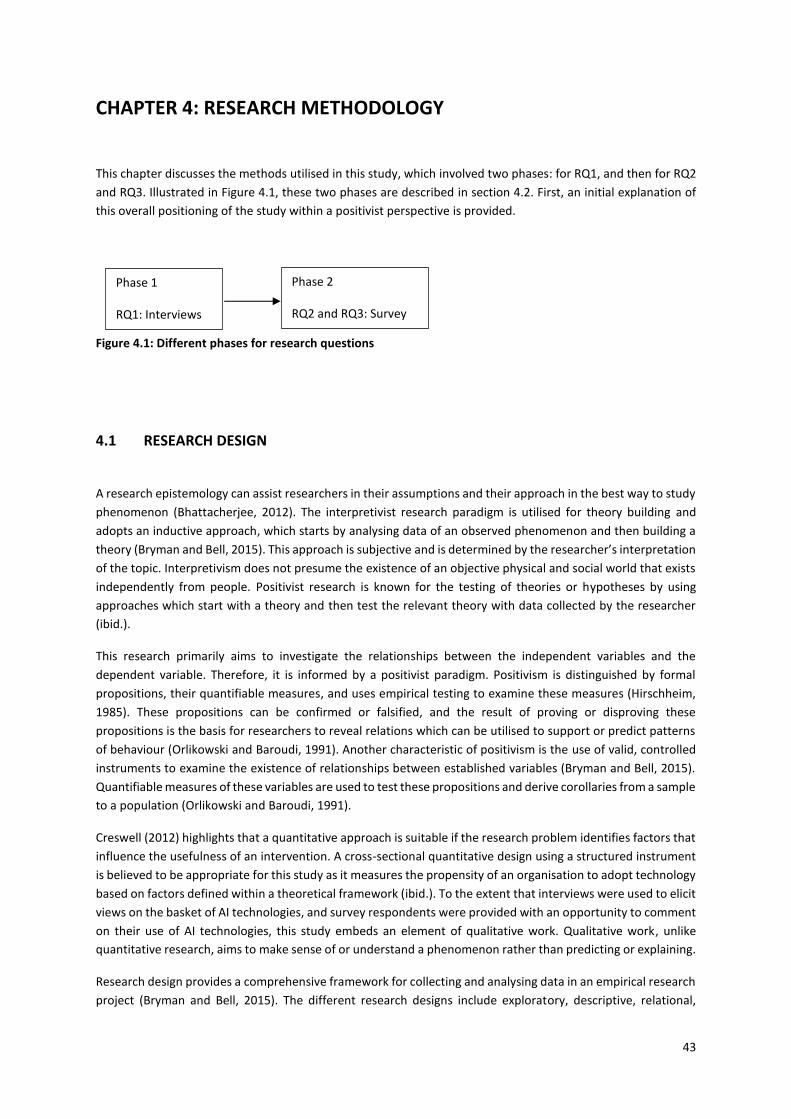
43
CHAPTER 4: RESEARCH METHODOLOGY
This chapter discusses the methods utilised in this study, which involved two phases: for RQ1, and then for RQ2
and RQ3. Illustrated in Figure 4.1, these two phases are described in section 4.2. First, an initial explanation of
this overall positioning of the study within a positivist perspective is provided.
Figure 4.1: Different phases for research questions
4.1 RESEARCH DESIGN
A research epistemology can assist researchers in their assumptions and their approach in the best way to study
phenomenon (Bhattacherjee, 2012). The interpretivist research paradigm is utilised for theory building and
adopts an inductive approach, which starts by analysing data of an observed phenomenon and then building a
theory (Bryman and Bell, 2015). This approach is subjective and is determined by the researcher’s interpretation
of the topic. Interpretivism does not presume the existence of an objective physical and social world that exists
independently from people. Positivist research is known for the testing of theories or hypotheses by using
approaches which start with a theory and then test the relevant theory with data collected by the researcher
(ibid.).
This research primarily aims to investigate the relationships between the independent variables and the
dependent variable. Therefore, it is informed by a positivist paradigm. Positivism is distinguished by formal
propositions, their quantifiable measures, and uses empirical testing to examine these measures (Hirschheim,
1985). These propositions can be confirmed or falsified, and the result of proving or disproving these
propositions is the basis for researchers to reveal relations which can be utilised to support or predict patterns
of behaviour (Orlikowski and Baroudi, 1991). Another characteristic of positivism is the use of valid, controlled
instruments to examine the existence of relationships between established variables (Bryman and Bell, 2015).
Quantifiable measures of these variables are used to test these propositions and derive corollaries from a sample
to a population (Orlikowski and Baroudi, 1991).
Creswell (2012) highlights that a quantitative approach is suitable if the research problem identifies factors that
influence the usefulness of an intervention. A cross-sectional quantitative design using a structured instrument
is believed to be appropriate for this study as it measures the propensity of an organisation to adopt technology
based on factors defined within a theoretical framework (ibid.). To the extent that interviews were used to elicit
views on the basket of AI technologies, and survey respondents were provided with an opportunity to comment
on their use of AI technologies, this study embeds an element of qualitative work. Qualitative work, unlike
quantitative research, aims to make sense of or understand a phenomenon rather than predicting or explaining.
Research design provides a comprehensive framework for collecting and analysing data in an empirical research
project (Bryman and Bell, 2015). The different research designs include exploratory, descriptive, relational,
Phase 1
RQ1: Interviews
Phase 2
RQ2 and RQ3: Survey
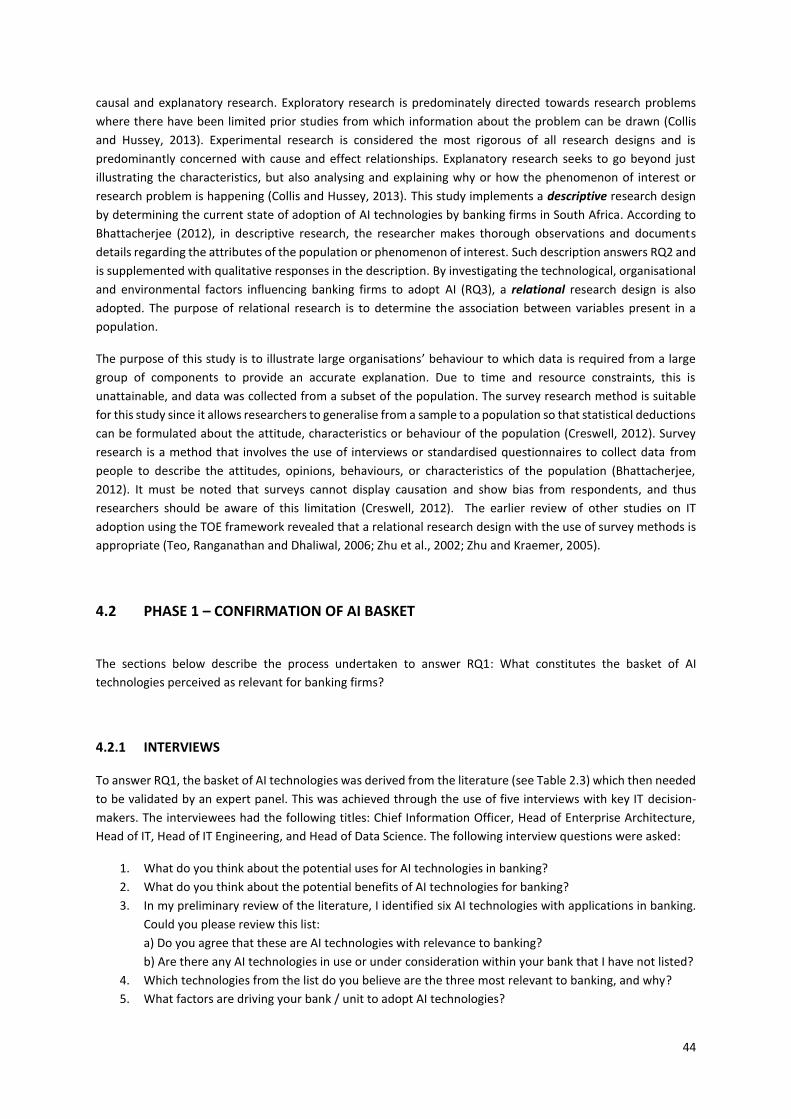
44
causal and explanatory research. Exploratory research is predominately directed towards research problems
where there have been limited prior studies from which information about the problem can be drawn (Collis
and Hussey, 2013). Experimental research is considered the most rigorous of all research designs and is
predominantly concerned with cause and effect relationships. Explanatory research seeks to go beyond just
illustrating the characteristics, but also analysing and explaining why or how the phenomenon of interest or
research problem is happening (Collis and Hussey, 2013). This study implements a descriptive research design
by determining the current state of adoption of AI technologies by banking firms in South Africa. According to
Bhattacherjee (2012), in descriptive research, the researcher makes thorough observations and documents
details regarding the attributes of the population or phenomenon of interest. Such description answers RQ2 and
is supplemented with qualitative responses in the description. By investigating the technological, organisational
and environmental factors influencing banking firms to adopt AI (RQ3), a relational research design is also
adopted. The purpose of relational research is to determine the association between variables present in a
population.
The purpose of this study is to illustrate large organisations’ behaviour to which data is required from a large
group of components to provide an accurate explanation. Due to time and resource constraints, this is
unattainable, and data was collected from a subset of the population. The survey research method is suitable
for this study since it allows researchers to generalise from a sample to a population so that statistical deductions
can be formulated about the attitude, characteristics or behaviour of the population (Creswell, 2012). Survey
research is a method that involves the use of interviews or standardised questionnaires to collect data from
people to describe the attitudes, opinions, behaviours, or characteristics of the population (Bhattacherjee,
2012). It must be noted that surveys cannot display causation and show bias from respondents, and thus
researchers should be aware of this limitation (Creswell, 2012). The earlier review of other studies on IT
adoption using the TOE framework revealed that a relational research design with the use of survey methods is
appropriate (Teo, Ranganathan and Dhaliwal, 2006; Zhu et al., 2002; Zhu and Kraemer, 2005).
4.2 PHASE 1 – CONFIRMATION OF AI BASKET
The sections below describe the process undertaken to answer RQ1: What constitutes the basket of AI
technologies perceived as relevant for banking firms?
4.2.1 INTERVIEWS
To answer RQ1, the basket of AI technologies was derived from the literature (see Table 2.3) which then needed
to be validated by an expert panel. This was achieved through the use of five interviews with key IT decision-
makers. The interviewees had the following titles: Chief Information Officer, Head of Enterprise Architecture,
Head of IT, Head of IT Engineering, and Head of Data Science. The following interview questions were asked:
1. What do you think about the potential uses for AI technologies in banking?
2. What do you think about the potential benefits of AI technologies for banking?
3. In my preliminary review of the literature, I identified six AI technologies with applications in banking.
Could you please review this list:
a) Do you agree that these are AI technologies with relevance to banking?
b) Are there any AI technologies in use or under consideration within your bank that I have not listed?
4. Which technologies from the list do you believe are the three most relevant to banking, and why?
5. What factors are driving your bank / unit to adopt AI technologies?
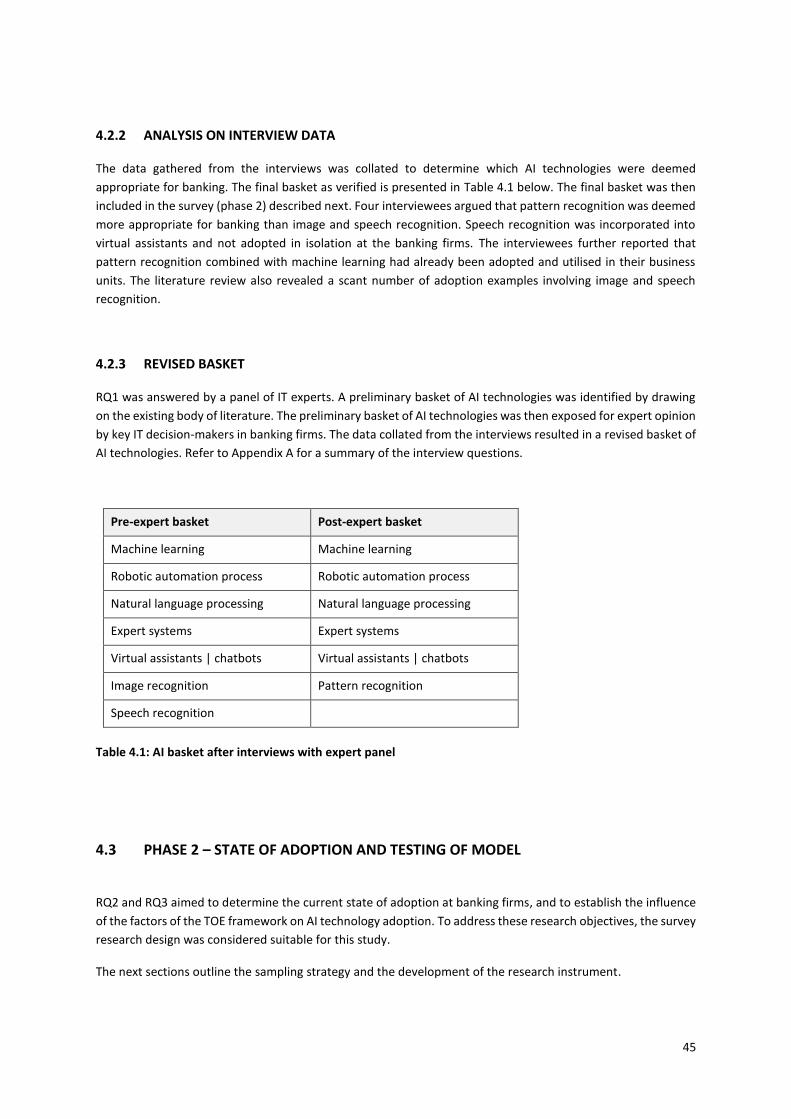
45
4.2.2 ANALYSIS ON INTERVIEW DATA
The data gathered from the interviews was collated to determine which AI technologies were deemed
appropriate for banking. The final basket as verified is presented in Table 4.1 below. The final basket was then
included in the survey (phase 2) described next. Four interviewees argued that pattern recognition was deemed
more appropriate for banking than image and speech recognition. Speech recognition was incorporated into
virtual assistants and not adopted in isolation at the banking firms. The interviewees further reported that
pattern recognition combined with machine learning had already been adopted and utilised in their business
units. The literature review also revealed a scant number of adoption examples involving image and speech
recognition.
4.2.3 REVISED BASKET
RQ1 was answered by a panel of IT experts. A preliminary basket of AI technologies was identified by drawing
on the existing body of literature. The preliminary basket of AI technologies was then exposed for expert opinion
by key IT decision-makers in banking firms. The data collated from the interviews resulted in a revised basket of
AI technologies. Refer to Appendix A for a summary of the interview questions.
Pre-expert basket Post-expert basket
Machine learning Machine learning
Robotic automation process Robotic automation process
Natural language processing Natural language processing
Expert systems Expert systems
Virtual assistants | chatbots Virtual assistants | chatbots
Image recognition Pattern recognition
Speech recognition
Table 4.1: AI basket after interviews with expert panel
4.3 PHASE 2 – STATE OF ADOPTION AND TESTING OF MODEL
RQ2 and RQ3 aimed to determine the current state of adoption at banking firms, and to establish the influence
of the factors of the TOE framework on AI technology adoption. To address these research objectives, the survey
research design was considered suitable for this study.
The next sections outline the sampling strategy and the development of the research instrument.

46
4.3.1 SAMPLING AND DATA COLLECTION
The unit of analysis is referred to as the primary entity that is being examined in a study (Creswell, 2012).
Sampling is the process of choosing a subsection of a population of interest to make observations and statistical
inferences of that population (Bhattacherjee, 2012). This study investigates the adoption behaviour of banking
firms. More specifically, the unit of analysis for this study is the business units within South African banking firms.
A sampling frame is an accessible section of the target population and is often accompanied by a list of contact
information (Bhattacherjee, 2012). Due to the chosen unit of analysis for this study, there is a lack of a sampling
frame. For this study, purposive non-probabilistic sampling techniques will be used to construct the sampling
frame. Non-probability sampling is a sampling technique in which the researcher selects participants because
they are available, and because they represent characteristics that the researcher wishes to study (Creswell,
2012). As an example, First National Bank has a federated IT model that has multiple business units, each with
an IT decision-maker who is responsible for their own technology decisions.
The sampling frame used was the directory of banks listed in the South African Reserve Bank, which contains
the names of 15 South African banking firms. Due to the list not having the contact details of the IT decision-
makers within the banking firm, an online search tool such as the professional network website LinkedIn
(https://www.linkedin.com) was utilised to gather the contact details of the IT decision-makers.
The survey is aimed at IT decision-makers within the business units of banking firms. IT decision-makers are
classified as those who have the mandate to approve AI systems and technology within their business units. The
IT decision-makers included chief information officers, chief technology officers, chief data officers, chief
information security officers, IT executives, IT heads and IT managers. The use of IT decision-makers such as
chief information officers, IT executives and IT Heads as respondents is quite typical of adoption studies including
those by Gibbs and Kraemer (2004) on the scope of e-commerce use; Zhu, Kraemer and Xu (2003) on electronic
business adoption; Oliveira and Martins (2010) on e-business adoption; Low, Chen and Wu (2011) on cloud
computing adoption; Wang, Wang and Yang (2010) on RFID adoption; and Mudzana and Kotze (2015) on
business intelligence adoption. These IT decisions-makers are considered to be well-positioned to understand
the current situation of their organisations and future trends.
A search was conducted on LinkedIn using the names of South African banks and the titles of IT decision-makers.
The search criteria produced a total of 3072 IT decision-makers, who were identified to participate in the survey.
A pre-notification for email surveys aimed to increase the response rate (Murphy, Daley and Dalenberg, 1991;
Sheehan and McMillan, 1999; Taylor and Lynn, 1998).
Adopting a non-experimental research design approach for this study, the data collection method utilised is a
cross-sectional field survey where the dependent and independent variables are measured using a single
questionnaire administered online via a web-survey tool. The online survey method is a researcher-independent
technique which offers a range of benefits as highlighted in Table 4.2 below.
2 The 307 IT decision-makers do not represent 307 business units as certain LinkedIn profiles did not specify the business unit name. Only one sample was taken from each business unit and was verified during the data screening process.
47
Survey research benefits Web-survey tool benefits
Unobservable data can be measured, such as
individual’s preferences, traits and attitudes
Respondents’ data are securely stored in an online
database
Questionnaire surveys permit the ability for large-
scale, remote data collection
It is a low-cost method to administer
They are cost, time and effort effective due to the
researcher-independent nature of questionnaires
Interactive forms are accessed via link and
administered over the Internet
Questionnaires are unobtrusive for respondents The survey items can be modified and adapted, or
new survey items can be added
Table 4.2: Benefits of surveys and web-survey tools
(Source: Bhattacherjee, 2012)
4.3.2 INSTRUMENT DEVELOPMENT
The instrument used to examine the adoption of AI by banking firms was a structured questionnaire.
Operationalisation is the process of establishing precise indicators for measuring theoretical constructs
(Bhattacherjee, 2012). The measurement items were formed by assessing appropriate and relevant existing
instruments from the IS literature. To measure the model’s independent variables, 7-point Likert-type scales
(1=Strongly disagree to 7=Strongly agree) were used. The Likert scale has proven to be a popular rating scale in
IS research for measuring ordinal data. A benefit of the Likert scale is that it allocates more granularity than
binary items as it includes the possibility for neutral statements by respondents (ibid.). The questionnaire’s
content validity was warranted using existing literature as the foundation for operationalising the scales.
The questionnaire included the following five sections:
1. Demographic data (Q1 to Q5)
2. Adoption of AI technologies with the banking firm (Q6 – Q12)
3. Technological factors (Q13 to Q 23)
4. Organisational factors (Q24 to Q 31)
5. Environmental factors (Q32 to Q40)
4.3.2.1 INDEPENDENT VARIABLES
The independent variables used in thus study are summarised in Table 4.3 below.
Perceived benefits
According to Oliveira and Martins (2010), firms using AI may obtain benefits such as sales increases, new market
penetration (especially for non-banked customers) and a reduction in costs. Five items were used to measure
the perceived benefits of AI.

48
IT infrastructure
IT infrastructure refers to the technology – hardware, software and architecture – that provides a foundation
for AI technology-related operations (Lin and Lin, 2008). Three items are used to measure the IT infrastructure
of the firm (Lin and Lin, 2008; Wang, Wang and Yang 2010).
AI technology skills
AI technology skills are defined as the firm-level of specialised IT expertise in AI technologies (Wang, Wang and
Yang 2010). Developing AI systems is complex and requires sophisticated skills that continually evolve as the
technology advances. Three items are used to measure AI technology skills of the organisation.
Top management support
Top management support is an essential factor in the implementation of a new technology which has been
strongly related to adoption (Lee and Kim, 2007). Top management support is an essential factor in the
implementation of new technology that’s been strongly related to adoption (Lee and Kim, 2007). Top
management support includes provision of strategy, support, resource allocation, redesign core business
processes and aligning users to promote the innovation. Four items from Wang, Wang and Yang (2010) and Lee
and Kim (2007) are adapted to measure top management support for AI adoption.
Firm size
Several empirical studies reveal a positive relationship between firm size and innovative technologies (Pan and
Jang, 2008; Soares-Aguiar and Palma-Dos-Reis, 2008; Wang, Wang and Yang, 2010; Zhu, Kraemer and Xu, 2003).
Firm size is measured by the number of employees – and particularly IT employees – in the business unit. Two
items are used to measure firm size.
Cost
As with all technological adoption, cost considerations by firms play a major role in the adoption of AI
technologies. Costs include setup costs of the specific AI technologies, maintenance costs of running the AI
technologies, and training costs to ensure employees are skilled with AI technologies. Three items are used to
measure financial cost (Lin, Lee and Lin, 2016; Teo et al., 2003).
Competitive pressure
Competitive pressure has been recognised as an influential dynamic in IT adoption in the banking industry
(Wang, Wang and Yang, 2010). Competitive pressure is measured by the pressure imposed by market
competitors as the organisation seeks to gain advantage (Kuan and Chau, 2001). Two items are used to measure
competitive pressure (Wang, Wang and Yang, 2010).

49
Legal and regulatory requirements
Legal and regulatory requirements are measured by the policies used to mitigate risks and threats, regulations
imposed by government, and banking regulators that can inhibit innovation (Furst, Lang and Nolle, 1998).
Mimetic pressure
Organisations can learn about the behaviours of successful firms through observation and mimic these
organisational behaviours or evade certain behaviours based on their perceived impact of the observed
organisation (Teo et al., 2003). Three items are used to measure mimetic pressure (Liang et al., 2007).

50
Variable Definition Items Primary sources
Perceived benefits The predicted benefits that the
adoption of AI provides to the firm
are known as perceived benefits
Why is adopting AI important to your business unit? Awa, Ukoha and Emecheta
(2016); Beatty, Shim and
Jones (2001) PB1. Reduced operating costs
PB2. Improved operational efficiency
PB3. Improved customer service
PB4. Improved customer relationship
PB5. Reaching new customers
IT infrastructure IT infrastructure denotes
technologies that provide a
foundation for AI-based
technologies.
IF1. The technology infrastructure of my business unit can support AI-
related technology
Lin and Lin (2008); Wang,
Wang and Yang (2010)
IF2. AI technology is compatible with existing information infrastructure
IF3. AI development is compatible with my firm's existing experiences with
similar systems
AI technology skills IT specialists with AI knowledge
provide the expertise and
necessary organisational aptitude
to develop complex AI
applications
AS1. My business unit is dedicated to ensuring that employees are familiar
and trained with AI technology
Molla and Licker (2005)
AS2. My business unit contains a high level of AI-related knowledge
AS3. My business unit hires highly specialised or knowledgeable personnel
for AI technologies

51
Top management
support
The provision of vision, strategy
and support by top management
creates an environment that
fosters innovation
TM1. My top management is likely to invest funds in AI Lee and Kim (2007); Wang,
Wang and Yang (2010)
TM2. My top management is willing to take risks involved in the adoption
of AI
TM3. My top management is likely to consider the adoption of AI to gain
competitive edge
TM4. My top management is likely to consider adopting AI as strategically
important
Cost Costs include setup costs of the
specific AI technologies,
maintenance costs of running the
AI technologies, and training costs
to ensure employees are skilled
with AI technologies
CT1. AI technologies have high setup costs Lin, Lee and Lin (2016); Teo
et al. (2003)
CT2. AI technologies have running costs
CT3. AI technologies have training costs
Firm size A proxy measure for firm size is
typically the number of employees
within the firm
FS1. Approximately how many total employees work within your business
unit serviced by your IT function?
Oliveira and Martins (2010)
FS2. Approximately how many IT employees work in your banking unit?
Competitive
pressure
As competition increases in the
industry, organisations can pursue
competitive advantage over their
rivals through technological
innovations
CP1. My business unit will experience competitive pressure to adopt AI Kuan and Chau (2001)
CP2. My business unit will experience a competitive disadvantage by not
adopting AI
CP3. Our competitors are adopting AI technologies

52
Mimetic pressure When technologies are not
entirely understood or when
return on investments are
uncertain, firms will develop their
responses to these innovative
technologies based on firms that
they recognise to be successful
MP1. Our main competitors who have adopted AI technologies have
benefitted greatly
Liang et al. (2007)
MP2. Our main competitors who have adopted AI are favourably perceived
by others in the same industry.
MP3. Our main competitors who have adopted AI are favourably perceived
by their suppliers and customers
Legal and regulatory
requirements
AI may raise a wide variety of risks
and threats and governmental
authorities are expected to
implement contingencies to
mitigate this risk
RR1. Regulation and policies will inhibit the adoption of AI in my business
unit
Furst, Lang and Nolle
(1998); Zhu et al. (2006)
RR2. Current business laws and regulations support AI operations and
adoption among firms
RR3. The government provides support for AI technology adoption
Table 4.3: Item construction summary for questionnaire
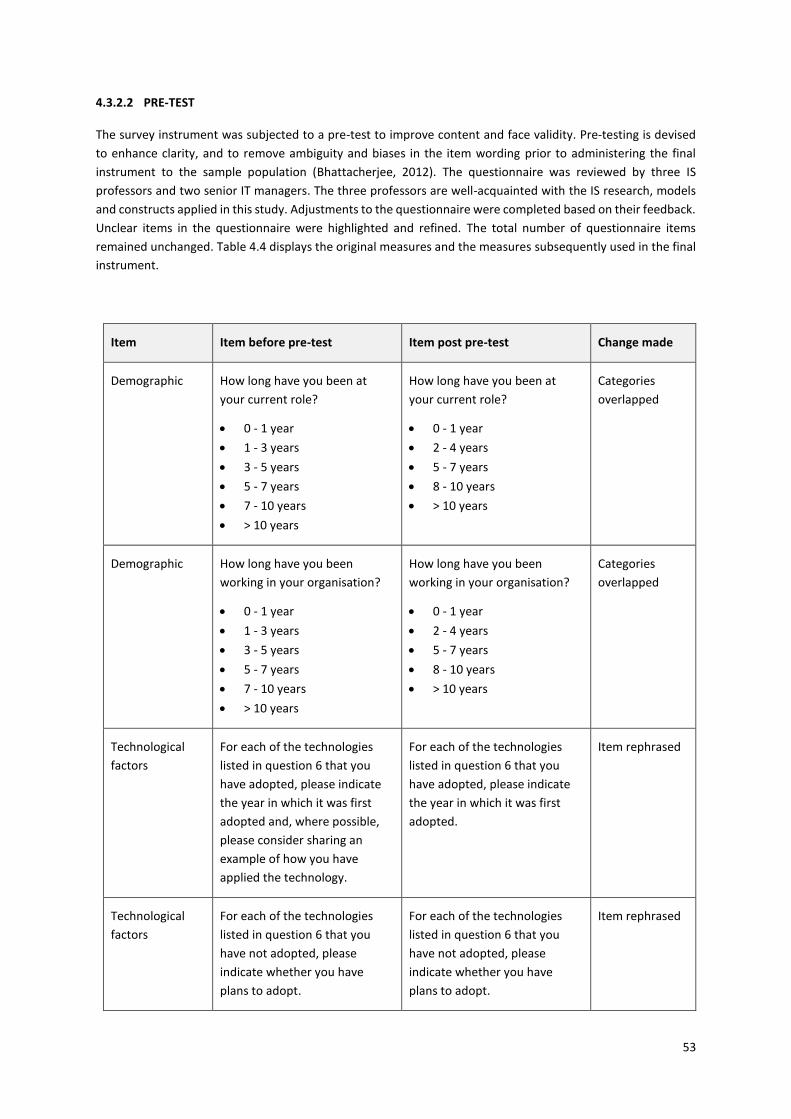
53
4.3.2.2 PRE-TEST
The survey instrument was subjected to a pre-test to improve content and face validity. Pre-testing is devised
to enhance clarity, and to remove ambiguity and biases in the item wording prior to administering the final
instrument to the sample population (Bhattacherjee, 2012). The questionnaire was reviewed by three IS
professors and two senior IT managers. The three professors are well-acquainted with the IS research, models
and constructs applied in this study. Adjustments to the questionnaire were completed based on their feedback.
Unclear items in the questionnaire were highlighted and refined. The total number of questionnaire items
remained unchanged. Table 4.4 displays the original measures and the measures subsequently used in the final
instrument.
Item Item before pre-test Item post pre-test Change made
Demographic How long have you been at
your current role?
• 0 - 1 year
• 1 - 3 years
• 3 - 5 years
• 5 - 7 years
• 7 - 10 years
• > 10 years
How long have you been at
your current role?
• 0 - 1 year
• 2 - 4 years
• 5 - 7 years
• 8 - 10 years
• > 10 years
Categories
overlapped
Demographic How long have you been
working in your organisation?
• 0 - 1 year
• 1 - 3 years
• 3 - 5 years
• 5 - 7 years
• 7 - 10 years
• > 10 years
How long have you been
working in your organisation?
• 0 - 1 year
• 2 - 4 years
• 5 - 7 years
• 8 - 10 years
• > 10 years
Categories
overlapped
Technological
factors
For each of the technologies
listed in question 6 that you
have adopted, please indicate
the year in which it was first
adopted and, where possible,
please consider sharing an
example of how you have
applied the technology.
For each of the technologies
listed in question 6 that you
have adopted, please indicate
the year in which it was first
adopted.
Item rephrased
Technological
factors
For each of the technologies
listed in question 6 that you
have not adopted, please
indicate whether you have
plans to adopt.
For each of the technologies
listed in question 6 that you
have not adopted, please
indicate whether you have
plans to adopt.
Item rephrased
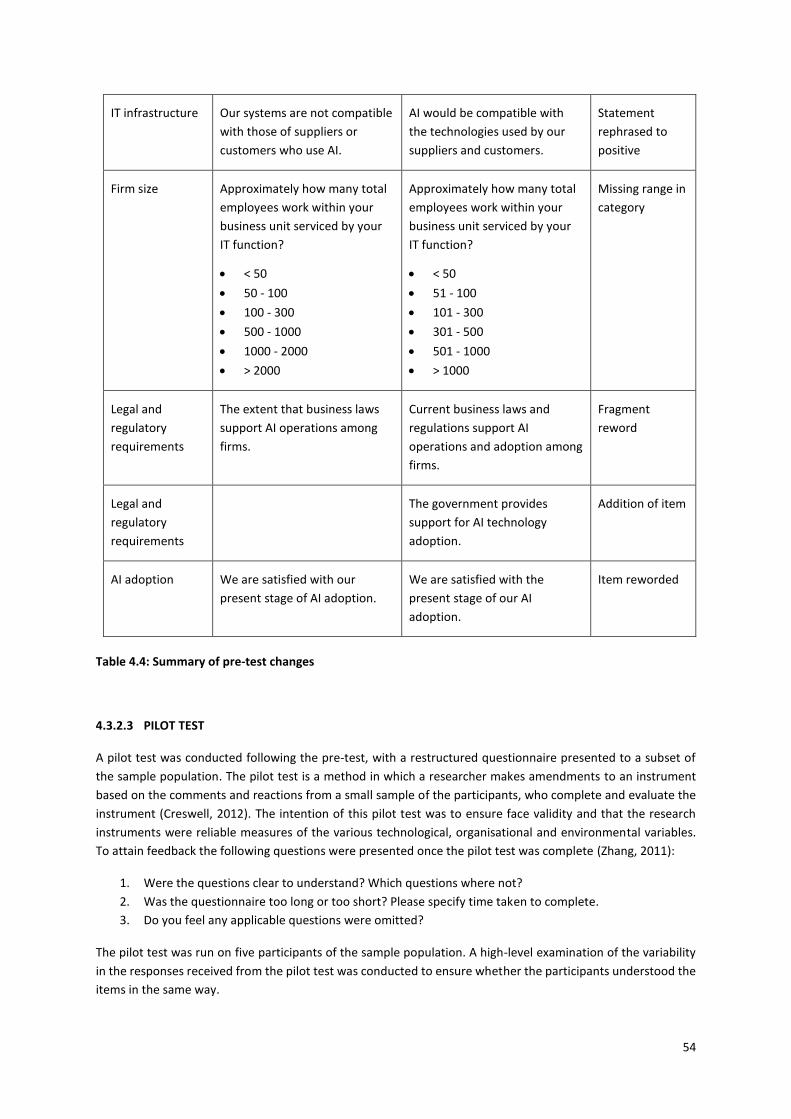
54
IT infrastructure Our systems are not compatible
with those of suppliers or
customers who use AI.
AI would be compatible with
the technologies used by our
suppliers and customers.
Statement
rephrased to
positive
Firm size Approximately how many total
employees work within your
business unit serviced by your
IT function?
• < 50
• 50 - 100
• 100 - 300
• 500 - 1000
• 1000 - 2000
• > 2000
Approximately how many total
employees work within your
business unit serviced by your
IT function?
• < 50
• 51 - 100
• 101 - 300
• 301 - 500
• 501 - 1000
• > 1000
Missing range in
category
Legal and
regulatory
requirements
The extent that business laws
support AI operations among
firms.
Current business laws and
regulations support AI
operations and adoption among
firms.
Fragment
reword
Legal and
regulatory
requirements
The government provides
support for AI technology
adoption.
Addition of item
AI adoption We are satisfied with our
present stage of AI adoption.
We are satisfied with the
present stage of our AI
adoption.
Item reworded
Table 4.4: Summary of pre-test changes
4.3.2.3 PILOT TEST
A pilot test was conducted following the pre-test, with a restructured questionnaire presented to a subset of
the sample population. The pilot test is a method in which a researcher makes amendments to an instrument
based on the comments and reactions from a small sample of the participants, who complete and evaluate the
instrument (Creswell, 2012). The intention of this pilot test was to ensure face validity and that the research
instruments were reliable measures of the various technological, organisational and environmental variables.
To attain feedback the following questions were presented once the pilot test was complete (Zhang, 2011):
1. Were the questions clear to understand? Which questions where not?
2. Was the questionnaire too long or too short? Please specify time taken to complete.
3. Do you feel any applicable questions were omitted?
The pilot test was run on five participants of the sample population. A high-level examination of the variability
in the responses received from the pilot test was conducted to ensure whether the participants understood the
items in the same way.

55
Feedback received from the respondents are summarised in Table 4.5. Additional banking institutions were
added as well as definitions for each AI technology in the basket. This ensured each respondent was aligning to
the definitions of each AI technology used in this study. It was noted that the respondents mentioned the length
of the survey was ideal, that additional questions were not necessary, and that the average time of the
completing the survey was 15 minutes. The final questionnaire is contained in Appendix B.

56
Item Item before pre-test Item post pre-test Change made
Description
of bank
• Asset Management
• Business Banking
• Central Bank
• Credit Union
• Investment Banking
• Islamic Bank
• Mutual Bank
• Private Banking
• Retail Banking
• Trading and
Securities
• Other
• Asset Management
• Business Banking
• Central Bank
• Commercial Banking
• Credit Union
• Investment Banking
• Insurance
• Islamic Bank
• Mutual Bank
• Private Banking
• Retail Banking
• Trading and Securities
• Other
Addition of
banking
structures
Adoption of
AI
technologies
• Machine learning
• Robotic process
automation
• Expert systems
• Virtual systems |
chatbots
• Natural language
processing
• Pattern recognition
• Machine learning – uses statistical
techniques to give computer
systems the ability to "learn" with
data, without being explicitly
programmed
• Robotic process automation – refers
to software that can be easily
programmed to do basic tasks
across applications just as human
workers do
• Expert systems – computer
programs that simulate the
judgement and behaviour of a
human or an organisation that has
expert knowledge and experience in
a particular field
• Virtual systems | chatbots – a
computer program designed to
simulate conversation with human
users
• Natural language processing –
branch of AI that helps computers
understand, interpret and
manipulate human language
• Pattern recognition – branch of
machine learning that focuses on
the recognition of data patterns and
regularities in data
Definitions were
added to describe
the basket of AI
technologies as
used in the study
Table 4.5: Summary of pilot test changes
57
4.3.2.4 ADMINISTRATION OF THE INSTRUMENT
On the conclusion of the pilot test, the finalised questionnaire was distributed to the sampling frame. IT decision-
makers were contacted from a University of Witwatersrand email address encouraging their participation in the
study. A cover letter (refer to Appendix C) with a personalised email was sent to the respondent to partake in
the survey. The online survey was accessible to participants via a link to an online survey tool. The IT decision-
makers are considered to be connected and technologically savvy. Thus, the online survey was considered best
due to its ease of use, speed of delivery and response, and ease of data cleaning and analysis (Van Selm,
Jankowski and Tsaliki, 2002). The online survey also has the added benefit of ensuring that the respondents are
anonymous. A potential shortfall of the online survey is that a link is embedded into an email which can be
rejected by the potential participants’ organisation for security reasons.
A total of 307 emails were initially sent over a two-week period.
The online survey was opened for 12 weeks. Frequency counts were observed after four weeks and follow-up
emails were sent to participants inviting them to participate in the survey. Post-notification or follow-up
contacting via emails and phone calls had a positive effect on response rates, and Sheehan and Hoy (1997) found
that a follow-up reminder increased response rate by 25%.
A record of the participants was maintained to avert contacting participants who acknowledged completing the
survey.
4.3.3 ANALYSIS
4.3.3.1 RELIABILITY AND VALIDITY
The data received from the online survey was examined to determine the presence of errors or missing data, or
errors when respondents provided scores outside the range (Creswell, 2012). Once the data was collected, it
was analysed using SPSS (statistical software package). The measurement scales were tested for validity.
Construct validity is an examination of how well the specified measurement scale is measuring the theoretical
construct that it is intended to measure (Bhattacherjee, 2012). While the literature was used as a basis for
construct operationalisation (content validity) and a pilot test to confirm face validity, construct validity was
furthermore gauged through tests of convergent and discriminant validity. Convergent validity refers to how
close a measure correlates to the construct that it is supposed to measure, while discriminant validity represents
the level to which a measure discriminates from other constructs that are not purported to measure (Bryman
and Bell, 2015). The convergent and discriminant validity of scales were tested by a statistical method called
factor analysis to determine if the items measured the constructs applicably (Creswell, 2012). More specifically,
principal component analysis was selected as the method for factor analysis. It is a data reduction technique
which decreases an extensive collection of measures to a lesser and more manageable number of composite
variables and was utilised to reinforce convergent and discriminant validity. Convergent validity is established
when measurement items for each factor loads highly on its related construct, and discriminant validity is
established when items have low cross-loadings on other constructs they are not intended to measure.
Reliability of the measurement scales was also examined. Internal consistency reliability measures the
consistency between different items of the same constructs (Bhattacherjee, 2012). Considering that a multiple-
item construct measure was directed at participants, the extent to which the participants similarly rank those
items is a reflection of internal consistency (ibid.). According to Creswell (2012), Cronbach’s alpha can be used
58
to estimate internal consistency reliability whereby a coefficient of 0.93 is a high coefficient, and 0.72 is
satisfactory.
4.3.3.2 DESCRIPTIVE ANALYSIS AND HYPOTHESIS TESTING
RQ 2 was answered based on the data collected from respondents by asking the IT decision-makers from the
respective business units to indicate, from a predefined basket of AI technologies (RQ1), the AI technologies
they have implemented within their business unit. This information was used to determine the current state of
adoption of the AI technologies in the business units. Additionally, the participants were requested to specify
the first year of adoption for each AI technology. The state of diffusion of each AI technology was established by
plotting diffusion curves. Furthermore, qualitative questions were posed to the respondents to provide adoption
examples for each AI technology.
RQ3 was answered by testing the hypotheses outlined in the previous chapter. This involved multiple regression
analysis that was utilised to determine the extent to which two or more independent variables are related to or
predict one dependent variable (Creswell, 2012). Since hypothesis tests are created on a sample, the possibility
of errors may arise. When the null hypothesis is rejected when it is true, it is referred to as a Type I error, and
when the null hypothesis fails to be rejected when it is false, it is referred to as Type II error. The significance
level (α) is the likelihood of producing a Type I error, and the desired relationship between the p-value and (α)
is represented as p≤0.05 (Bhattacherjee, 2012). A p-value approach was employed to establish statistical
significance, and the null hypothesis was rejected if the p-value<0.05. The use of an F-test determined if a
significant relationship exists between the dependent variable and all the independent variables. An F-test is
any statistical analysis where the test statistic has an F-distribution under the null hypothesis (Creswell, 2012).
The research hypothesis is supported if there is a statistically significant relationship between the independent
variable and the dependent variable. More specifically, the dependent variable of adoption is measured using
the following four items: how much the firm is investing resources into AI adoption; plans in place guiding AI
adoption; satisfaction with the present stage of AI adoption; and the successful implementation of AI
technologies. The independent variables are the three technological factors, three organisational factors, and
three environmental factors hypothesised to influence adoption.
4.4 ETHICAL CONSIDERATIONS
Research conducted at the University of Witwatersrand requires a strict adherence to the conditions set by the
ethics committee, which includes informed consent, anonymity and the confidentiality of participants. This is
done to ensure a high level of professionalism and to protect the interests of the participants. This study was
approved unconditionally by the School of Economics and Business Sciences with protocol number: CINFO/1174.
The ethics clearance form is contained in Appendix D.
In this study, strict adherence to the five ethical principles was applied: voluntary participation and
harmlessness; informed consent; anonymity and confidentiality; disclosure; and analysis and reporting.
The cover letter advised potential participants of the objectives of the research. The cover letter is contained in
Appendix C. Participants were informed that their participation in the research was entirely voluntary and that
they would not experience any loss or penalties if they decided not to participate. The participants were also

59
informed that, at any given point in the study, they had the right to withdraw the data that they provided without
any consequences.
The cover letter also advised potential participants that the data they provide will be anonymised and that their
responses cannot be traced back to their business unit and the individual. No banking information of their clients
was requested, and hence customer data confidentiality was not at risk of being exposed. The data acquired was
kept securely and confidentially and was not divulged to third party parties and other business units surveyed.
The individual responses were only accessed by the researcher and supervisor. Finally, the reporting of data
would be aggregated and not be reported on the individual responses.
4.5 LIMITATIONS AND THREATS TO INTERNAL AND EXTERNAL VALIDITY
As with most empirical studies, the research conducted in this study is subjected to some conditions.
Firstly, the cross-sectional nature of this study limits the ability to infer the direction of causality of the
relationships among the variables and does not cater for understanding how this relationship will change over
time. To resolve this limitation, future longitudinal research should be carried out. Within this study, causal
inferences can only be made with reference to theoretical arguments.
Secondly, the focus of this study is on adoption decision and not on AI implementation. Further research can be
considered to examine the implementation factors of AI within banking firms.
Thirdly, external validity refers to the subject of whether the outcomes of a particular study are generalisable
outside of that particular research context. (Bhattacherjee, 2012). The non-probability sampling approach is a
threat to external validity and results may not necessarily be generalisable beyond the banking units that
participate. Moreover, because this study is explored in the solitary context of innovation in the banking
industry, generalisability of the findings across industries and geographies may be limited.
Fourthly, while the questionnaires were aimed at decision-makers of the business unit, there is no assurance
that the online applications were completed by the decision-makers. Finally, the data is to be self-reported and
is thus subject to respondent biases, such as a social desirability bias.
4.6 CHAPTER SUMMARY
The research methods utilised in this study is described in the previous sections. A two-phased approach of
answering the research questions were described. This chapter focused on the survey method that was utilised
and the research instruments used to operationalise the constructs and highlighted the sources from which the
constructs and variables were selected. The techniques used to ensure validity and reliability (pre-and pilot
testing) were described. The strict adherence of the ethical principles was discussed and highlighted the
limitations. The next section provides a detailed examination and description of this study's outcomes
60
CHAPTER 5: RESEARCH FINDINGS
This chapter presents this study’s research findings. It commences with data screening which includes dealing
with missing data, reverse scoring and outlier analyses. Subsequently, the response profile is presented.
Thereafter, RQ2 is addressed by presenting a descriptive analysis of the current state of AI technology adoption.
Next, RQ3 is addressed through testing of the hypothesised research model.
5.1 DATA SCREENING
A total number of 307 potential respondents were identified and contacted to participate in the survey. Fifteen
emails were returned with error messages as the individual could not be found at the email domain. A total of
292 (95%) emails did not receive a delivery email or domain error message were thus deemed successfully
delivered to the participant. A total of 62 responses were received after 12 weeks of data collection which
represents a 21.2% response rate. The response rate is similar to those of other TOE studies such as the 22.5%
response rate by Teo et al., (2008), 22.3% by Lin and Lin (2008) and 22.22% by Low et al., (2011).
5.1.1 MISSING DATA
Responses that contain missing can distort the data analysis process. The 62 responses were screened to identify
missing data. Four survey responses were incomplete and subsequently deleted from the dataset. Of the
remaining 58 responses, three responses had more than 10% of missing items relevant to answering RQ3 (in
total, the questionnaire comprised 40 questions) (see Figure 9 below) and were subsequently removed from the
dataset. Of the remaining 55 responses, an additional 10 responses had only one missing item each, and one
response had two missing items. Table 5.1 below presents the number of missing items per survey question.

61
Variable Total no. of missing responses
Adopt_1 1
Adopt_2 1
CT1 1
CT2 1
CT3 1
MP1 1
MP2 1
MP3 1
RR1 1
RR2 1
RR3 2
Total 12
Table 5.1: Missing values
An examination of the missing data did not reveal any observable patterns to the missing data and the data was
therefore considered missing at random. A mean replacement strategy was used to impute the missing
responses.
5.1.2 REVERSE SCORING
There are instances where it is necessary to transform data within a dataset to ensure that they can be
meaningfully interpreted. Reverse scoring is a method of transforming data where scores on items whose
wording conveys the opposite meaning of their underlying construct must be reversed before they are compared
to and combined with other items. In this study, however, there were no items that required reverse scoring.
5.1.3 OUTLIER ANALYSIS
The remaining data was then examined to identify any outliers, which are defined as observations with unusually
high or unusually low values. This may suggest that the respondent is not from the same population as the other
respondents. Outliers can be detected by calculating the standardised scores, where a standardised score
greater than +- 3 denotes observations that are three or more standard deviations away from the mean. In a
normal distribution, approximately 99.7% of all observations must fall within three standard deviations of the
mean. An examination of the standardised scores did not reveal any extreme responses and no outliers were
thus suspected. Therefore, all 55 responses were retained and utilised for meaningful statistical analysis on RQ3.
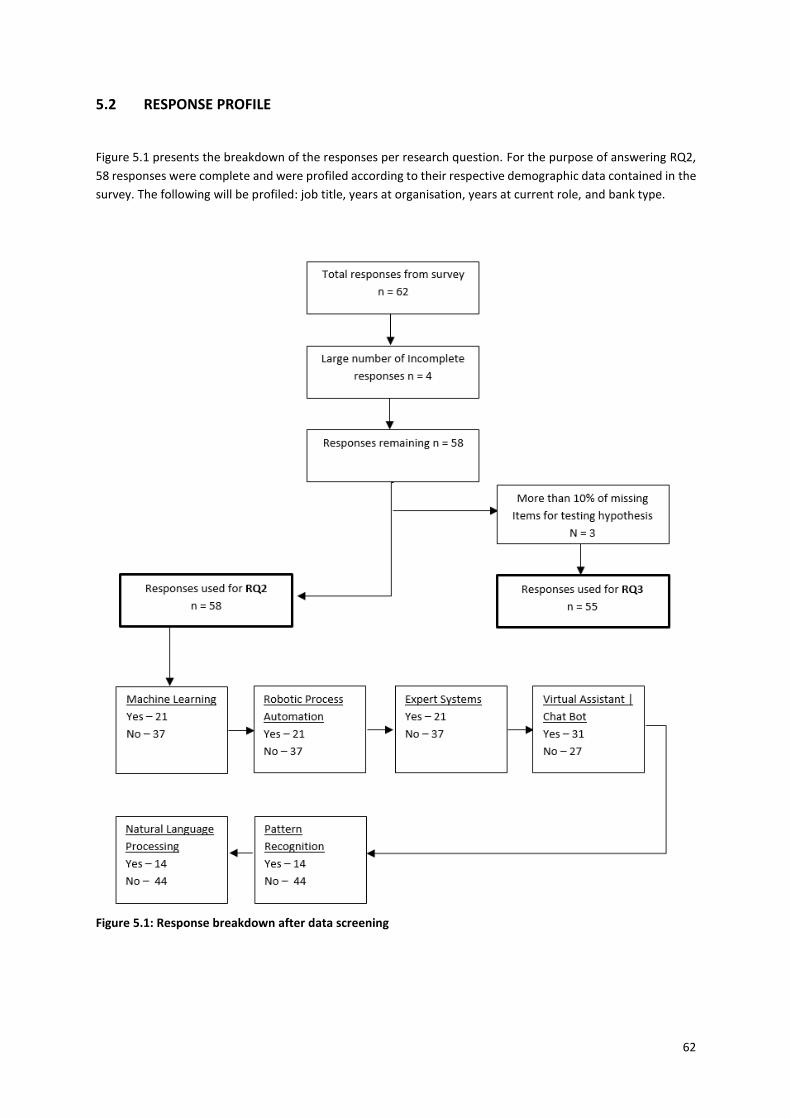
62
5.2 RESPONSE PROFILE
Figure 5.1 presents the breakdown of the responses per research question. For the purpose of answering RQ2,
58 responses were complete and were profiled according to their respective demographic data contained in the
survey. The following will be profiled: job title, years at organisation, years at current role, and bank type.
Figure 5.1: Response breakdown after data screening
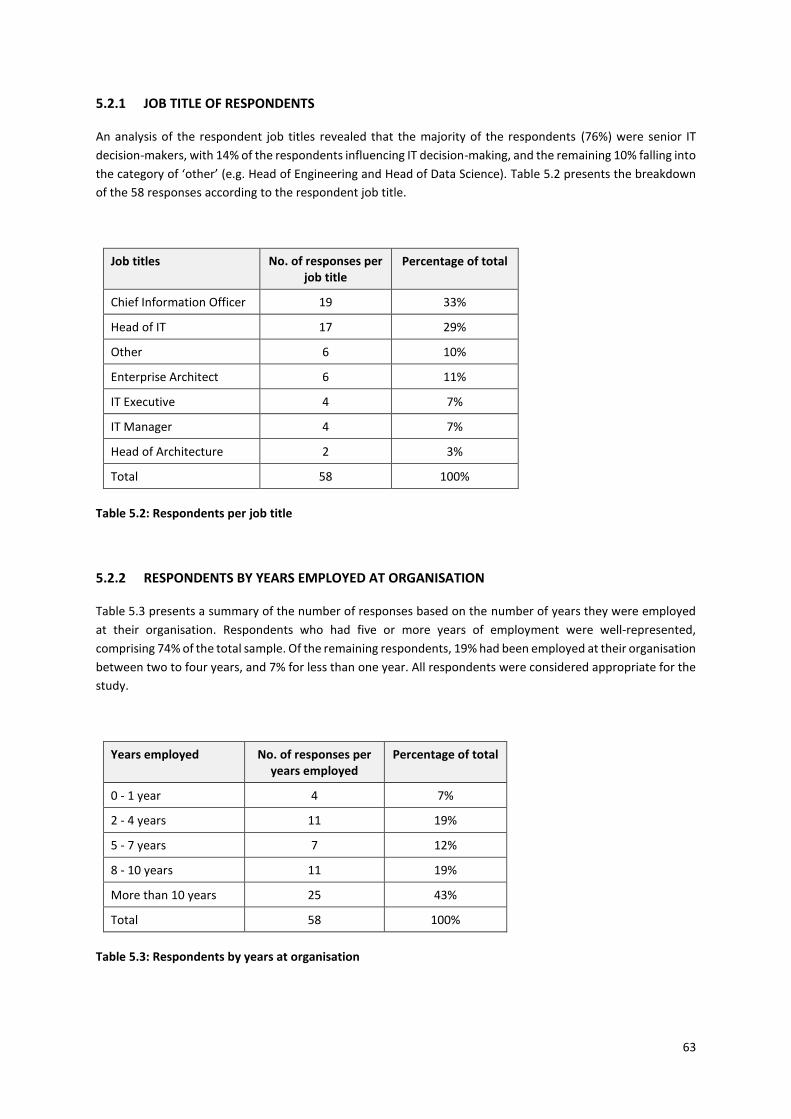
63
5.2.1 JOB TITLE OF RESPONDENTS
An analysis of the respondent job titles revealed that the majority of the respondents (76%) were senior IT
decision-makers, with 14% of the respondents influencing IT decision-making, and the remaining 10% falling into
the category of ‘other’ (e.g. Head of Engineering and Head of Data Science). Table 5.2 presents the breakdown
of the 58 responses according to the respondent job title.
Job titles No. of responses per job title
Percentage of total
Chief Information Officer 19 33%
Head of IT 17 29%
Other 6 10%
Enterprise Architect 6 11%
IT Executive 4 7%
IT Manager 4 7%
Head of Architecture 2 3%
Total 58 100%
Table 5.2: Respondents per job title
5.2.2 RESPONDENTS BY YEARS EMPLOYED AT ORGANISATION
Table 5.3 presents a summary of the number of responses based on the number of years they were employed
at their organisation. Respondents who had five or more years of employment were well-represented,
comprising 74% of the total sample. Of the remaining respondents, 19% had been employed at their organisation
between two to four years, and 7% for less than one year. All respondents were considered appropriate for the
study.
Years employed No. of responses per years employed
Percentage of total
0 - 1 year 4 7%
2 - 4 years 11 19%
5 - 7 years 7 12%
8 - 10 years 11 19%
More than 10 years 25 43%
Total 58 100%
Table 5.3: Respondents by years at organisation
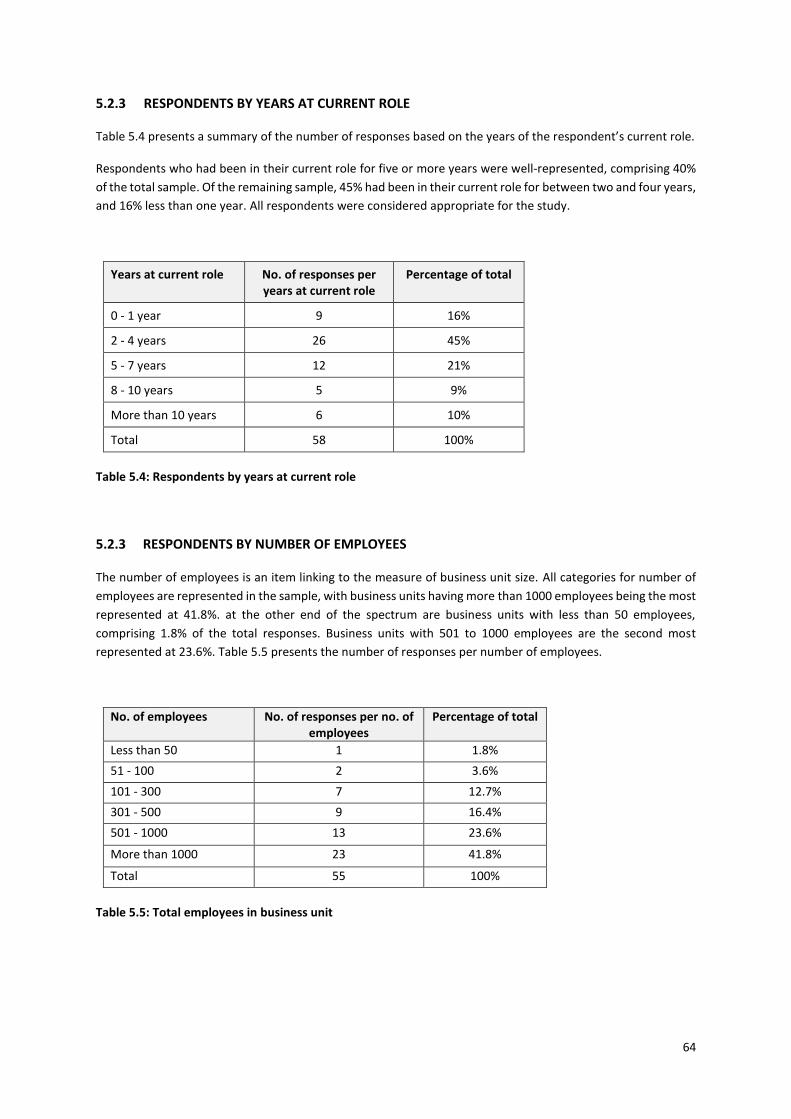
64
5.2.3 RESPONDENTS BY YEARS AT CURRENT ROLE
Table 5.4 presents a summary of the number of responses based on the years of the respondent’s current role.
Respondents who had been in their current role for five or more years were well-represented, comprising 40%
of the total sample. Of the remaining sample, 45% had been in their current role for between two and four years,
and 16% less than one year. All respondents were considered appropriate for the study.
Years at current role No. of responses per years at current role
Percentage of total
0 - 1 year 9 16%
2 - 4 years 26 45%
5 - 7 years 12 21%
8 - 10 years 5 9%
More than 10 years 6 10%
Total 58 100%
Table 5.4: Respondents by years at current role
5.2.3 RESPONDENTS BY NUMBER OF EMPLOYEES
The number of employees is an item linking to the measure of business unit size. All categories for number of
employees are represented in the sample, with business units having more than 1000 employees being the most
represented at 41.8%. at the other end of the spectrum are business units with less than 50 employees,
comprising 1.8% of the total responses. Business units with 501 to 1000 employees are the second most
represented at 23.6%. Table 5.5 presents the number of responses per number of employees.
No. of employees No. of responses per no. of employees
Percentage of total
Less than 50 1 1.8%
51 - 100 2 3.6%
101 - 300 7 12.7%
301 - 500 9 16.4%
501 - 1000 13 23.6%
More than 1000 23 41.8%
Total 55 100%
Table 5.5: Total employees in business unit

65
5.2.4 RESPONDENTS BY NUMBER OF IT STAFF
The final item relating to firm size is the number of IT employees in the business unit. Business units with 21 to
50 IT employees are most represented at 27.3% followed closely by business with 51 to 100 IT employees with
25.5%. At the other end of the spectrum, business units with less than 20 IT employees are the least represented
with 5.5% of total responses. Table 5.6 presents the number of responses according to the number of IT
employees within the business unit.
No. of employees No. of responses per no. of IT employees
Percentage of total
Less than 20 3 5.5%
21 - 50 15 27.3%
51 - 100 14 25.5%
101 - 200 10 18.2%
201 - 300 4 7.3%
More than 300 9 16.4%
Total 55 100%
Table 5.6: IT employees in business unit
5.2.5 RESPONDENTS BY BANK CATEGORY
Respondents were asked to indicate their banking category (Table 5.7). There was representation across most
banking categories, with strong representation in the retail and business banking sectors (53% of the total
sample).
The 58 responses represent a range of banking organisations from retail through to business and commercial
banking. The majority of respondents had titles such as Chief Information Officer and Head of IT, and most had
more than two years’ experience in their current role. In the next section, these 58 responses are used to address
the study’s second research question.

66
Description of bank No. of responses per bank
Percentage of total
Retail Banking 21 36%
Business Banking 10 17%
Other3 6 10%
Commercial Bank 5 9%
Asset Management 4 7%
Investment Banking 4 7%
Insurance 3 5%
Private Banking 3 5%
Central Bank 1 2%
Mutual Bank 1 2%
Credit Union 0 0%
Islamic Bank 0 0%
Trading and Securities 0 0%
Total 58 100%
Table 5.7: Respondents by bank category
5.2.6 SUMMARY OF DEMOGRAPHICS
In the respondent’s demographic characteristics, it is apparent that the sample for this study is a well-balanced
representation of South African banking business units. This conclusion is made based on the percentages of the
characteristics of respondents by years at organisation, respondents by years at current role, total employees in
business unit, IT employees in business unit and respondents by bank category.
The sample consists to a large extent of business units greater than 1000 employees and more than 10 years at
the firm. The sample also offers varied representation across numerous banking categories. The majority of the
respondents (76%) represent senior IT decision-makers within their respective business units which falls within
the stated objective of targeting these individuals given their understanding of their business units current and
future IT strategies.
3 ‘Other’ comprised rewards business units (e.g. Ebucks, Greenbacks etc.) and business units that comprised of end-to-end banking (e.g. supporting retail, business, insurance etc.).

67
5.3 RESEARCH QUESTION 2: STATE OF AI TECHNOLOGY ADOPTION WITHIN SOUTH
AFRICAN BANKING FIRMS
RQ1 aimed to identify a basket of AI technologies. Through the literature review and interviews, a basket of AI
technologies was identified (refer Section 4.2). RQ2 aims to describe the current state of adoption of this basket
of AI technologies within banking firms.
Firstly, respondents (n=58) were asked to indicate if they had adopted any of the AI technologies from the basket
of AI technologies (RQ2). Table 5.8 and Figure 5.2 present the percentage of each AI technology’s adoption
status. RPA was well-adopted among the responding banking firms at 69%, while virtual assistants (53%) and
pattern recognition (45%) followed closely behind. Machine learning (36%) and expert systems (36%) had a low
adoption status, and NLP had the lowest adoption status among the responding banking firms at 24%.
Adopted Machine learning
Robotic process
automation
Expert systems
Virtual assistants
Natural language
processing
Pattern recognition
Yes 36% 69% 36% 53% 24% 45%
No 64% 31% 64% 47% 76% 55%
Table 5.8: State of AI technology adoption (n=58)
Figure 5.2: Adoption status of AI technologies (n=58)
36%
69%
36%
53%
24%
45%
64%
31%
64%
47%
76%
55%
0%
10%
20%
30%
40%
50%
60%
70%
80%
90%
100%
Machine Learning Robotic ProcessAutomation
Expert Systems Virtual Assitants Natural LanguageProcessing
PatternRecognition
ADOPTED AI TECHNOLOGY
Yes No
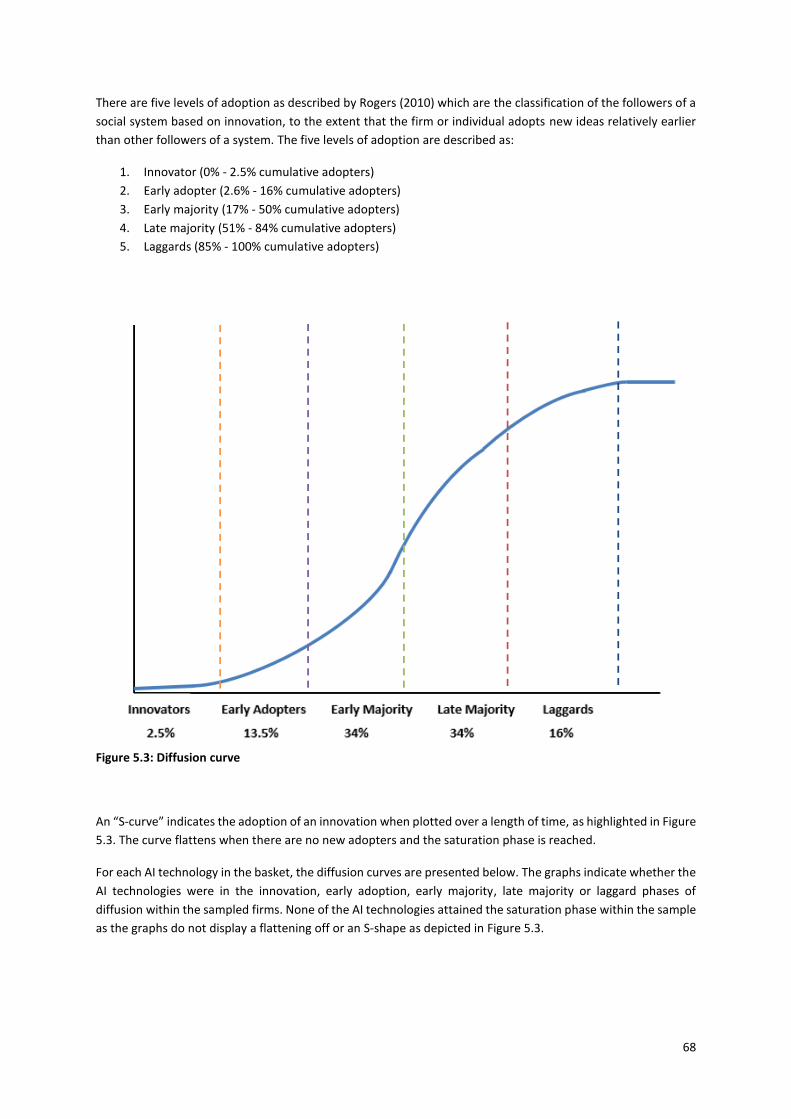
68
There are five levels of adoption as described by Rogers (2010) which are the classification of the followers of a
social system based on innovation, to the extent that the firm or individual adopts new ideas relatively earlier
than other followers of a system. The five levels of adoption are described as:
1. Innovator (0% - 2.5% cumulative adopters)
2. Early adopter (2.6% - 16% cumulative adopters)
3. Early majority (17% - 50% cumulative adopters)
4. Late majority (51% - 84% cumulative adopters)
5. Laggards (85% - 100% cumulative adopters)
Figure 5.3: Diffusion curve
An “S-curve” indicates the adoption of an innovation when plotted over a length of time, as highlighted in Figure
5.3. The curve flattens when there are no new adopters and the saturation phase is reached.
For each AI technology in the basket, the diffusion curves are presented below. The graphs indicate whether the
AI technologies were in the innovation, early adoption, early majority, late majority or laggard phases of
diffusion within the sampled firms. None of the AI technologies attained the saturation phase within the sample
as the graphs do not display a flattening off or an S-shape as depicted in Figure 5.3.
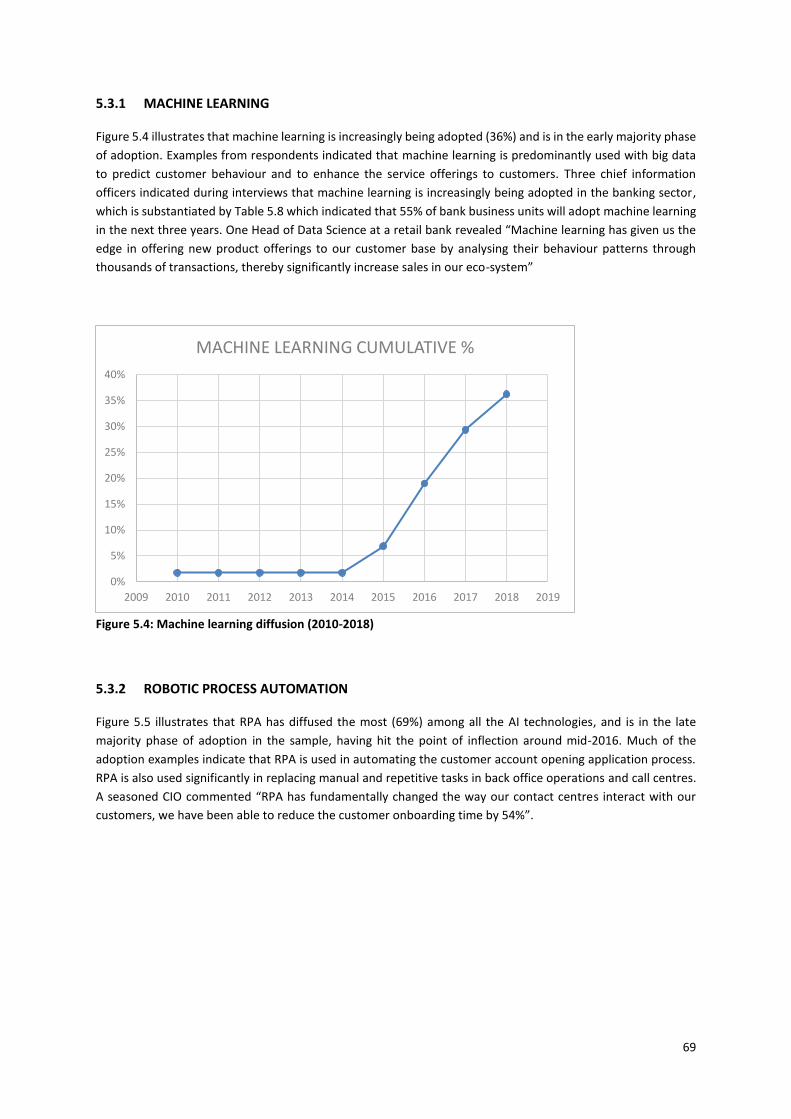
69
5.3.1 MACHINE LEARNING
Figure 5.4 illustrates that machine learning is increasingly being adopted (36%) and is in the early majority phase
of adoption. Examples from respondents indicated that machine learning is predominantly used with big data
to predict customer behaviour and to enhance the service offerings to customers. Three chief information
officers indicated during interviews that machine learning is increasingly being adopted in the banking sector,
which is substantiated by Table 5.8 which indicated that 55% of bank business units will adopt machine learning
in the next three years. One Head of Data Science at a retail bank revealed “Machine learning has given us the
edge in offering new product offerings to our customer base by analysing their behaviour patterns through
thousands of transactions, thereby significantly increase sales in our eco-system”
Figure 5.4: Machine learning diffusion (2010-2018)
5.3.2 ROBOTIC PROCESS AUTOMATION
Figure 5.5 illustrates that RPA has diffused the most (69%) among all the AI technologies, and is in the late
majority phase of adoption in the sample, having hit the point of inflection around mid-2016. Much of the
adoption examples indicate that RPA is used in automating the customer account opening application process.
RPA is also used significantly in replacing manual and repetitive tasks in back office operations and call centres.
A seasoned CIO commented “RPA has fundamentally changed the way our contact centres interact with our
customers, we have been able to reduce the customer onboarding time by 54%”.
0%
5%
10%
15%
20%
25%
30%
35%
40%
2009 2010 2011 2012 2013 2014 2015 2016 2017 2018 2019
MACHINE LEARNING CUMULATIVE %

70
Figure 5.5: Robotic process automation diffusion (2006-2018)
5.3.3 EXPERT SYSTEMS
Figure 5.6 illustrates that expert systems are increasingly being adopted (34%) and are in the early majority
phase of adoption in the sample. Expert systems are applied in banking firms to evaluate credit scoring models,
for production offerings to customers, to assist financial experts in decision-making, and for providing financial
advice to customers. Expert systems are to be significantly adopted by banking business units (47%) in the next
three years. One head of IT engineering at an investment bank commented “Expert systems have taken over the
majority of our modelling systems, which has resulted in significant insights into improved investment
decisions”.
Figure 5.6: Expert systems diffusion (2008-2018)
0%
10%
20%
30%
40%
50%
60%
70%
80%
2006 2008 2010 2012 2014 2016 2018 2020
ROBOTIC PROCESS AUTOMATION CUMULATIVE %
0%
5%
10%
15%
20%
25%
30%
35%
40%
2006 2008 2010 2012 2014 2016 2018 2020
EXPERT SYSTEMS CUMULATIVE %

71
5.3.4 VIRTUAL ASSISTANT | CHATBOTS
Figure 5.7 illustrates that virtual assistants and chatbots are increasingly being adopted (50%) and are towards
the end stage of early majority in the sample, nearing a point of inflection. Two experts from the interview panel
indicated that virtual assistants have become vital in expedited customer query resolutions. Virtual assistants
are to be significantly adopted by banking business units (38%) in the next three years. Applications of virtual
assistants include online chatbot assistance, online real-time resolution of customer queries and frequently
asked questions, virtual advisor for financial decisions, and utilisation in contact centres. One Enterprise
Architect commented “With chatbots in our HR system, employees are assisted in real time as opposed to
waiting hours for a HR consultant to hep”
Figure 5.7: Virtual assistant diffusion (2010-2018)
5.3.5 NATURAL LANGUAGE PROCESSING
Figure 5.8 illustrates that NLP is increasingly being adopted (24%) and is in the early majority phase of adoption
in the sample. NLP, however, is the least diffused AI technology in South African banking firms. The expert panel
indicated during interviews that NLP is the least understood from the AI technologies, and that the adoption
rate will be slower in comparison to the other AI technologies. There is an expectation of a 45% adoption in the
next three years. NLP is currently used for credit scoring and sentiment analysis by banking business units. A CIO
commented “Without NLP we would not be able to understand the changing needs of our customers and
improve their banking experience with us”.
0%
10%
20%
30%
40%
50%
60%
2009 2010 2011 2012 2013 2014 2015 2016 2017 2018 2019
VIRTUAL ASSISTANT CUMULATIVE %
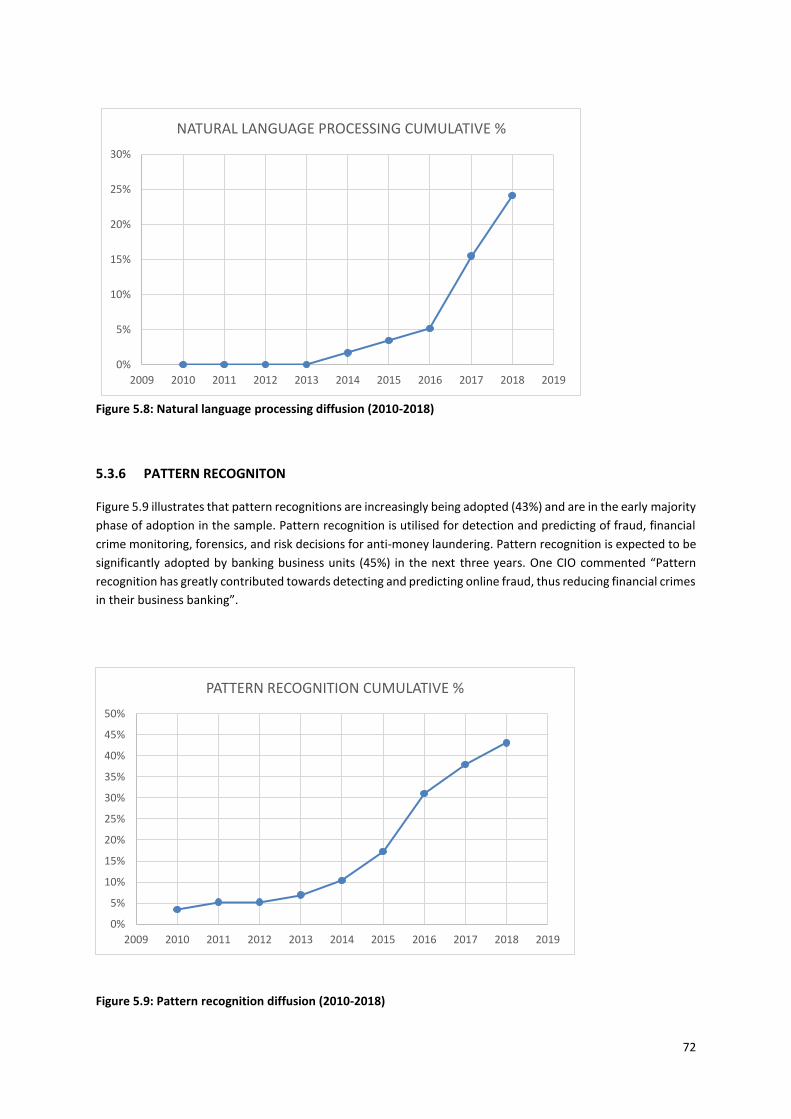
72
Figure 5.8: Natural language processing diffusion (2010-2018)
5.3.6 PATTERN RECOGNITON
Figure 5.9 illustrates that pattern recognitions are increasingly being adopted (43%) and are in the early majority
phase of adoption in the sample. Pattern recognition is utilised for detection and predicting of fraud, financial
crime monitoring, forensics, and risk decisions for anti-money laundering. Pattern recognition is expected to be
significantly adopted by banking business units (45%) in the next three years. One CIO commented “Pattern
recognition has greatly contributed towards detecting and predicting online fraud, thus reducing financial crimes
in their business banking”.
Figure 5.9: Pattern recognition diffusion (2010-2018)
0%
5%
10%
15%
20%
25%
30%
2009 2010 2011 2012 2013 2014 2015 2016 2017 2018 2019
NATURAL LANGUAGE PROCESSING CUMULATIVE %
0%
5%
10%
15%
20%
25%
30%
35%
40%
45%
50%
2009 2010 2011 2012 2013 2014 2015 2016 2017 2018 2019
PATTERN RECOGNITION CUMULATIVE %

73
5.4 PLANS TO ADOPT AI TECHNOLOGIES
Table 5.9 below illustrates the banking firms’ intentions to adopt the AI technologies. Machine learning (64%),
RPA (31%), expert systems (66%), virtual assistants (50%), NLP (76%) and pattern recognition (57%) are not
currently adopted by banking business units in the sample. The plans to adopt each AI technology was
highlighted above in the diffusion of AI technology. Machine learning (9%), RPA (12%), expert systems (19%),
virtual assistants (12%), NLP (26%) and pattern recognition (12%) are not in the plans of business banking units
to adopt.
Not adopted
Next six months
The next year
Next three years
No plans to adopt
Machine learning 64% 7% 17% 31% 9%
Robotic process automation 31% 0% 5% 14% 12%
Expert systems 66% 5% 5% 36% 19%
Virtual assistants | chatbots 50% 7% 17% 14% 12%
Natural language processing 71% 3% 14% 28% 26%
Pattern recognition 57% 5% 12% 28% 12%
Table 5.9: Banking firm plans to adopt AI technologies
Analysis of the current state of AI adoption reveals that RPA is the most diffused with 69% of banking units
reporting adoption. NLP is the least adopted AI technology with only 29% diffusion, but with promise as 45%
report plans to adopt within the next three years. Although machine learning is at an early stage of adoption, it
has high promise for further diffusion as more than 55% of banking units surveyed will adopt machine learning
in the next three years. Although there are many advantages to the adoption of technology NLP in banking, it is
unlikely to approach full diffusion, with nearly 26% of firms reporting no plans to adopt NLP.
5.5 RESEARCH QUESTION 3: FACTORS THAT INFLUENCE THE ADOPTION OF AI
TECHNOLOGIES
Prior to testing the research model of the factors that influence AI technology adoption (RQ3), it was essential
to first establish the validity and reliability of the measures. This is presented in the next section.
5.5.1 VALIDITY AND RELIABILITY
Principal component analysis is a technique that establishes whether the study’s variables exhibit uni-
dimensionality by determining whether each variable’s measurement items load highly onto a single
component. Principal component analysis can be used to establish that all items measuring a construct load

74
highly onto the same component, providing evidence of convergent validity. Principal component analysis can
demonstrate discriminant validity by showing that items have low cross loadings on components they are not
intended to measure.
A Kaiser-Meyer-Olkin measure of Sampling Adequacy (KMO) and a Bartlett Test of Sphericity were assessed to
confirm if the sample size was acceptable to warrant principal component analysis.
5.5.1.1 ADOPTION OF AI TECHNOLOGY
The KMO measure was 0.564 and the Bartlett Test of Sphericity was significant (p<0.001) which rendered factor
analysis acceptable for this analysis given the sample size of this study.
Table 5.10 presents the principal component analysis of adoption and it can be observed that all the adoption
items load highly onto component 1; therefore, all the items were retained since uni-dimensionality and
convergent validity are demonstrated. The total variance explained was 64.43% which is above 60% thus
demonstrating convergent validity.
COMPONENT
1
Adopt_1 0.823
Adopt_2 0.845
Adopt_3 0.743
Adopt_4 0.787
Table 5.10: Principal component analysis of adoption of AI technology (dependent variable)
5.5.1.2 TECHNOLOGICAL FACTORS
The KMO measure was 0.768 and the Bartlett Test of Sphericity was significant (p<0,001) which rendered factor
analysis acceptable for this study. The initial run of the principal component analysis revealed that PB4, PB5
(customer related benefits) and IF1 (infrastructure support) should be dropped. These were excluded and the
final stable solution for the technology factors was presented in Table 5.10 above. The total variance explained
was 81.95% which is well above 60%, thus demonstrating convergent validity. Table 5.11 illustrates the stable
factor solution representing three technological factors as hypothesised; namely, perceived benefits, IT
infrastructure and AI technology skills.

75
COMPONENT
AI technology skills Perceived benefits IT infrastructure
PB1 0.810
PB2 0.926
PB3 0.847
IF2 0.828
IF3 0.911
AS1 0.748
AS2 0.923
AS3 0.903
Table 5.11: Principal component analysis of technological factors (loadings less than 0.4 suppressed)
5.5.1.3 ORGANISATIONAL FACTORS
The KMO measure was 0.698 and the Bartlett Test of Sphericity was significant (p<0,001) which rendered factor
analysis acceptable for this study. The total variance explained was 75.20% which is well above 60%, thus
demonstrating convergent validity. Table 5.12 illustrates the stable factor solution representing three
organisational factors as hypothesised; namely, top management support, cost and firm size.
COMPONENT
Top management support Cost Firm size
TM1 0.891
TM2 0.887
TM3 0.924
TM4 0.907
FS1
0.686
FS2
0.867
CT1_1
0.843
CT2_1
0.833
CT3_1
0.789
Table 5.12: Principal component analysis of organisational factors (loadings less than 0.4 suppressed)
5.5.1.4 ENVIRONMENTAL FACTORS
The KMO measure was 0.699 and the Bartlett Test of Sphericity was significant (p<0,001) which rendered factor
analysis acceptable for this study. The initial run of the principal component analysis revealed that CP3 and
RR3_1 should be dropped and was excluded in the result presented in Table 5.13. The total variance explained
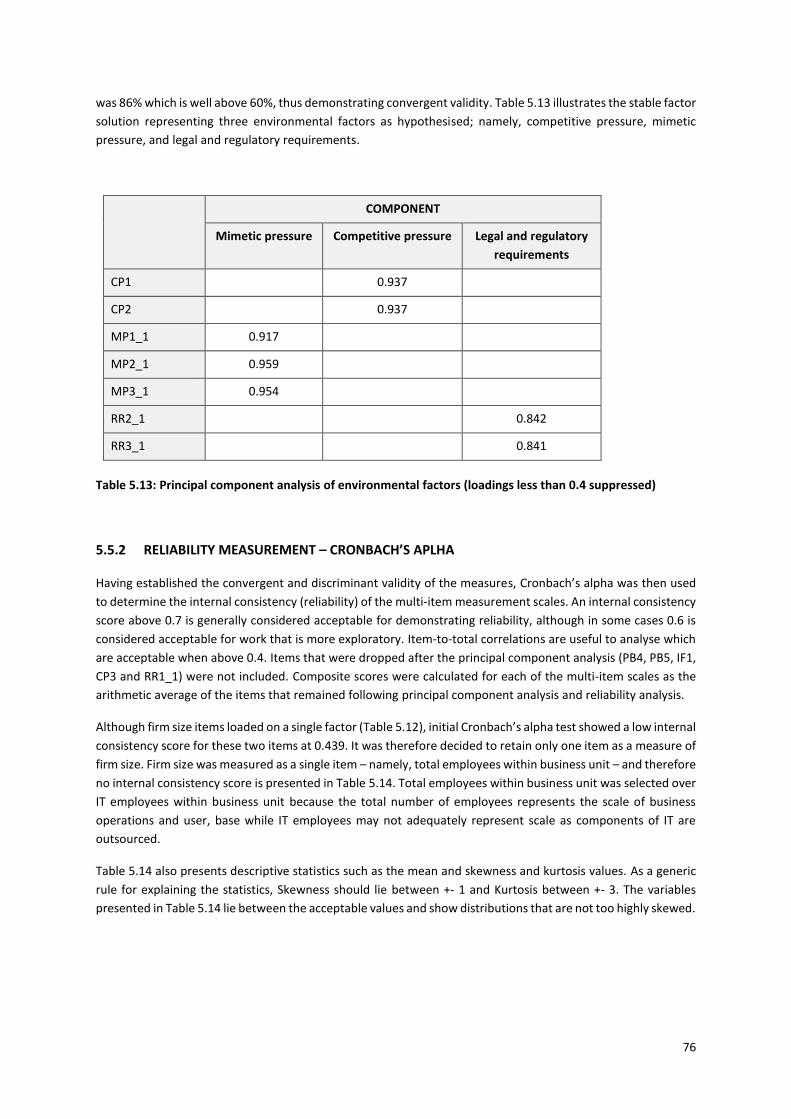
76
was 86% which is well above 60%, thus demonstrating convergent validity. Table 5.13 illustrates the stable factor
solution representing three environmental factors as hypothesised; namely, competitive pressure, mimetic
pressure, and legal and regulatory requirements.
COMPONENT
Mimetic pressure Competitive pressure Legal and regulatory
requirements
CP1
0.937
CP2
0.937
MP1_1 0.917
MP2_1 0.959
MP3_1 0.954
RR2_1
0.842
RR3_1
0.841
Table 5.13: Principal component analysis of environmental factors (loadings less than 0.4 suppressed)
5.5.2 RELIABILITY MEASUREMENT – CRONBACH’S APLHA
Having established the convergent and discriminant validity of the measures, Cronbach’s alpha was then used
to determine the internal consistency (reliability) of the multi-item measurement scales. An internal consistency
score above 0.7 is generally considered acceptable for demonstrating reliability, although in some cases 0.6 is
considered acceptable for work that is more exploratory. Item-to-total correlations are useful to analyse which
are acceptable when above 0.4. Items that were dropped after the principal component analysis (PB4, PB5, IF1,
CP3 and RR1_1) were not included. Composite scores were calculated for each of the multi-item scales as the
arithmetic average of the items that remained following principal component analysis and reliability analysis.
Although firm size items loaded on a single factor (Table 5.12), initial Cronbach’s alpha test showed a low internal
consistency score for these two items at 0.439. It was therefore decided to retain only one item as a measure of
firm size. Firm size was measured as a single item – namely, total employees within business unit – and therefore
no internal consistency score is presented in Table 5.14. Total employees within business unit was selected over
IT employees within business unit because the total number of employees represents the scale of business
operations and user, base while IT employees may not adequately represent scale as components of IT are
outsourced.
Table 5.14 also presents descriptive statistics such as the mean and skewness and kurtosis values. As a generic
rule for explaining the statistics, Skewness should lie between +- 1 and Kurtosis between +- 3. The variables
presented in Table 5.14 lie between the acceptable values and show distributions that are not too highly skewed.

77
Variables Variance
extracted
%
Cronbach's
alpha
No. of
items
Mean Std Dev Skewness Kurtosis
AI technology
adoption
64.04% 0.810 4 4.633 1.225 -0.668 1.258
Perceived
benefits
79.22% 0.861 3 6.194 0.755 -0.685 -0.071
IT
infrastructure
83.37% 0.800 2 4.600 1.249 -0.370 0.283
AI technology
skills
80.49% 0.876 3 3.733 1.491 0.331 -0.469
Top
management
support
81.67% 0.924 4 5.469 0.995 -2.074 7.078
Cost 69.35% 0.777 3 5.562 0.843 -1.105 1.611
Firm size N/A N/A 1 4.82 1.307 -0.943 0.122
Competitive
pressure
90.31% 0.891 2 5.600 1.172 -1.673 4.313
Mimetic
pressure
91.18% 0.951 3 4.883 1.133 -0.149 -0.521
Legal and
regulatory
requirements
73.07% 0.631 2 3.801 1.068 0.320 1.184
Table 5.14: Reliability by means of Cronbach’s alpha
5.5.3 CORRELATION ANALYSIS
Composite scores were calculated for AI technology adoption, perceived benefits, IT infrastructure, AI
technology skills, top management support, cost, competitive pressure, mimetic pressure, and legal and
regulatory requirements. The scores were calculated as the arithmetic average of the items that remained,
following principal component analysis and reliability analysis. The Pearson correlation was used as the study
contained ratio and interval measures. The strength of the linear relationship is denoted by the same correlation
coefficient (r). The r value can be positive or negative which demonstrates the direction of the linear relationship.
The spearman non-parametric correlations are also reported in the right-hand column of Table 5.15 below.

78
Pearson Correlation
with AI technology
adoption
Spearman Correlation
with AI technology
adoption
Perceived benefits 0.446** 0.395**
IT infrastructure 0.417** 0.414**
AI technology skills 0.756*** 0.729**
Top management support 0.549*** 0.440**
Cost 0.175 0.239
Firm size (no. employees) 0.242# 0.281*
Competitive pressure 0.355** 0.244
Mimetic pressure 0.210 0.160
Legal and regulatory requirements 0.228 0.99
Table 5.15: Correlation matrix *** p<0.001 ** p<0.01 * p<0.05 # p<0.10 (n=55)
Hypothesis 1
The relationship between perceived benefits (M=6.194; SD=0.755) and adoption of AI technology (M=4.633;
SD=1.225) was investigated. The correlation between the variables was found to be statistically significant
(r=0.446, p<0.01). This finding provides support for hypothesis 1 that perceived benefits and adoption of AI
technology are positively and significantly related. Thus, the greater the perceived benefits of AI adoption by
banking firms, the more likely will be the adoption of AI. The spearman rank-order correlation reported in Table
5.15 similarly confirms that perceived benefits is significantly related to AI technology adoption (rho=0.395,
p<0.01).
Hypothesis 2
The relationship between IT infrastructure (M=4.600; SD=1.249) and adoption of AI technology was investigated.
The correlation between the variables was found to be statistically significant (r=0.417, p<0.001). This finding
provides support for hypothesis 2 that IT infrastructure and adoption of AI technology are positively and
significantly related. Thus, the greater the availability of highly developed IT infrastructure, the more likely will
be the adoption of AI. The spearman rank-order correlation reported in Table 5.15 similarly confirms that IT
infrastructure is significantly related to AI technology adoption (rho=0.414, p<0.01).
Hypothesis 3
The relationship between AI technology skills (M=3.733; SD=1.491) and adoption of AI technology was
investigated. The correlation between the variables was found to be statistically significant (r=0.756, p<0.001).
This finding provides support for hypothesis 3 that AI technology skills and adoption of AI technology are
positively and significantly related. Thus, the greater the levels of AI technology skills of banking firms, the more
likely will be the adoption of AI. The spearman rank-order correlation reported in Table 5.15 similarly confirms
that AI technology skills is significantly related to AI technology adoption (rho=0.729, p<0.001).
Hypothesis 4
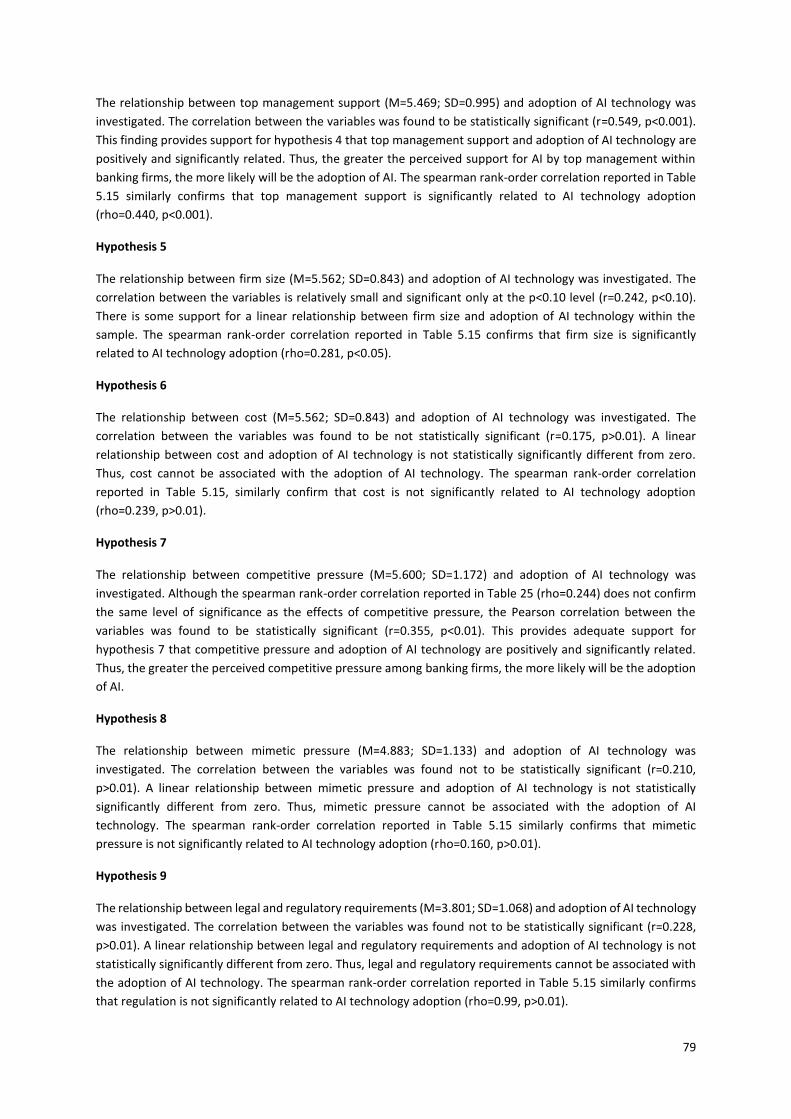
79
The relationship between top management support (M=5.469; SD=0.995) and adoption of AI technology was
investigated. The correlation between the variables was found to be statistically significant (r=0.549, p<0.001).
This finding provides support for hypothesis 4 that top management support and adoption of AI technology are
positively and significantly related. Thus, the greater the perceived support for AI by top management within
banking firms, the more likely will be the adoption of AI. The spearman rank-order correlation reported in Table
5.15 similarly confirms that top management support is significantly related to AI technology adoption
(rho=0.440, p<0.001).
Hypothesis 5
The relationship between firm size (M=5.562; SD=0.843) and adoption of AI technology was investigated. The
correlation between the variables is relatively small and significant only at the p<0.10 level (r=0.242, p<0.10).
There is some support for a linear relationship between firm size and adoption of AI technology within the
sample. The spearman rank-order correlation reported in Table 5.15 confirms that firm size is significantly
related to AI technology adoption (rho=0.281, p<0.05).
Hypothesis 6
The relationship between cost (M=5.562; SD=0.843) and adoption of AI technology was investigated. The
correlation between the variables was found to be not statistically significant (r=0.175, p>0.01). A linear
relationship between cost and adoption of AI technology is not statistically significantly different from zero.
Thus, cost cannot be associated with the adoption of AI technology. The spearman rank-order correlation
reported in Table 5.15, similarly confirm that cost is not significantly related to AI technology adoption
(rho=0.239, p>0.01).
Hypothesis 7
The relationship between competitive pressure (M=5.600; SD=1.172) and adoption of AI technology was
investigated. Although the spearman rank-order correlation reported in Table 25 (rho=0.244) does not confirm
the same level of significance as the effects of competitive pressure, the Pearson correlation between the
variables was found to be statistically significant (r=0.355, p<0.01). This provides adequate support for
hypothesis 7 that competitive pressure and adoption of AI technology are positively and significantly related.
Thus, the greater the perceived competitive pressure among banking firms, the more likely will be the adoption
of AI.
Hypothesis 8
The relationship between mimetic pressure (M=4.883; SD=1.133) and adoption of AI technology was
investigated. The correlation between the variables was found not to be statistically significant (r=0.210,
p>0.01). A linear relationship between mimetic pressure and adoption of AI technology is not statistically
significantly different from zero. Thus, mimetic pressure cannot be associated with the adoption of AI
technology. The spearman rank-order correlation reported in Table 5.15 similarly confirms that mimetic
pressure is not significantly related to AI technology adoption (rho=0.160, p>0.01).
Hypothesis 9
The relationship between legal and regulatory requirements (M=3.801; SD=1.068) and adoption of AI technology
was investigated. The correlation between the variables was found not to be statistically significant (r=0.228,
p>0.01). A linear relationship between legal and regulatory requirements and adoption of AI technology is not
statistically significantly different from zero. Thus, legal and regulatory requirements cannot be associated with
the adoption of AI technology. The spearman rank-order correlation reported in Table 5.15 similarly confirms
that regulation is not significantly related to AI technology adoption (rho=0.99, p>0.01).
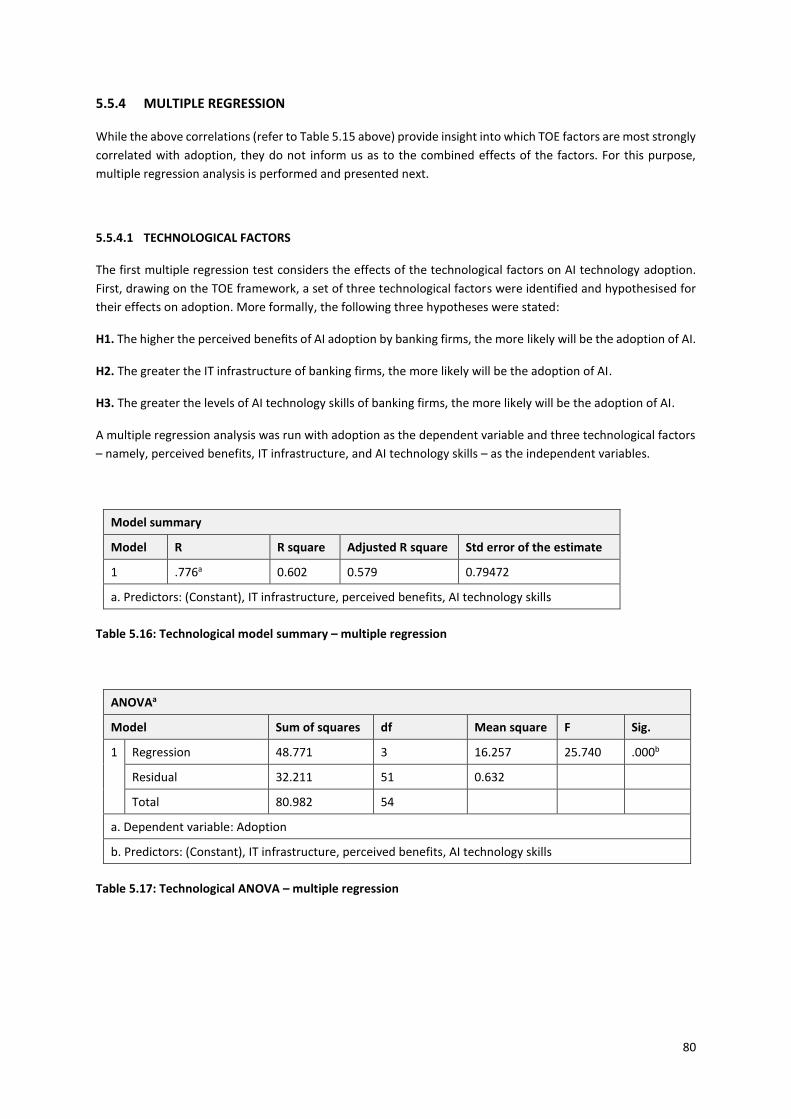
80
5.5.4 MULTIPLE REGRESSION
While the above correlations (refer to Table 5.15 above) provide insight into which TOE factors are most strongly
correlated with adoption, they do not inform us as to the combined effects of the factors. For this purpose,
multiple regression analysis is performed and presented next.
5.5.4.1 TECHNOLOGICAL FACTORS
The first multiple regression test considers the effects of the technological factors on AI technology adoption.
First, drawing on the TOE framework, a set of three technological factors were identified and hypothesised for
their effects on adoption. More formally, the following three hypotheses were stated:
H1. The higher the perceived benefits of AI adoption by banking firms, the more likely will be the adoption of AI.
H2. The greater the IT infrastructure of banking firms, the more likely will be the adoption of AI.
H3. The greater the levels of AI technology skills of banking firms, the more likely will be the adoption of AI.
A multiple regression analysis was run with adoption as the dependent variable and three technological factors
– namely, perceived benefits, IT infrastructure, and AI technology skills – as the independent variables.
Model summary
Model R R square Adjusted R square Std error of the estimate
1 .776a 0.602 0.579 0.79472
a. Predictors: (Constant), IT infrastructure, perceived benefits, AI technology skills
Table 5.16: Technological model summary – multiple regression
ANOVAa
Model Sum of squares df Mean square F Sig.
1 Regression 48.771 3 16.257 25.740 .000b
Residual 32.211 51 0.632
Total 80.982 54
a. Dependent variable: Adoption
b. Predictors: (Constant), IT infrastructure, perceived benefits, AI technology skills
Table 5.17: Technological ANOVA – multiple regression

81
Coefficientsa
Model Unstandardised coefficients Standardised coefficients
t Sig.
B Std error Beta
1 (Constant) 0.672 0.906 0.742 0.462
Perceived benefits 0.254 0.160 0.157 1.590 0.118
AI technology skills 0.542 0.084 0.660 6.470 0.000
IT infrastructure 0.079 0.098 0.081 0.805 0.424
a. Dependent variable: Adoption
Table 5.18: Technological coefficients – multiple regression
The R2 is 60.20% suggesting that the model explains roughly 60% of the variance in the AI technology adoption.
This is significant at the p<0.001 level. The independent variable that has the largest significant effect on AI
technology adoption is AI technology skills, which has a standardised beta coefficient of 0.660 that is significant
at the p<0.001 level.
This provides strong additional support for hypothesis 3. Although perceived benefits and IT infrastructure were
earlier found to correlate with adoption (refer to Section 5.5.3 above), the multiple regression results suggest
their effects are not as important to adoption. AI technology skills rather than benefits or existing infrastructure
are the most important.
5.5.4.2 ORGANISATIONAL FACTORS
The next multiple regression test considers the effects of the organisational factors on AI technology adoption.
Drawing on the TOE framework, a set of three organisational factors were identified and hypothesised for their
effects on adoption. More formally, the following three hypotheses were stated:
H4. The greater the perceived support for AI by top management within banking firms, the more likely will be
the adoption of AI.
H5. The larger the size of the banking firm, the more likely will be the adoption of AI.
H6. The greater the financial costs invested, the more likely will be the adoption of AI.
A multiple regression analysis was run with adoption as the dependent variable, and the three organisational
factors – namely, top management support, cost, and firm size – as the independent variables.

82
Model summary
Model R R square Adjusted R square Std error of the estimate
1 .600a 0.360 0.323 1.00788
a. Predictors: (Constant), cost, top management support, firm size
Table 5.19: Organisational model summary – multiple regression
ANOVAa
Model Sum of squares df Mean square F Sig.
1 Regression 29.175 3 9.725 9.574 .000b
Residual 51.807 51 1.016
Total 80.982 54
a. Dependent variable: Adoption
b. Predictors: (Constant), cost, top management support, firm size
Table 5.20: Organisational ANOVA – multiple regression
Coefficientsa
Model Unstandardised coefficients
Standardised coefficients
t Sig.
B Std error Beta
1 (Constant) -0.533 1.172 -0.455 0.651
Firm size 0.200 0.109 0.213 1.827 0.074
Top management support 0.664 0.138 0.540 4.801 0.000
Cost 0.103 0.170 0.071 0.607 0.547
a. Dependent variable: Adoption
Table 5.21: Organisational coefficients – multiple regression
The R2 is 36% suggesting that the model explains 36% of the variance in the AI technology adoption. This is
significant at the p<0.001 level.
The independent variable that has the largest significant effect on AI technology adoption is top management
support, which has a standardised beta coefficient of 0.540 which is significant at the p<0.001 level. Firm size
also seems to influence adoption; it has a standardised beta coefficient of 0.213 and is significant at the p<0.1
level.
As a result, hypothesis 4 has strong additional support and hypothesis 5 has moderate support. Cost was earlier
found not to correlate with adoption (refer to Section 5.5.3 above). The multiple regression result also suggests
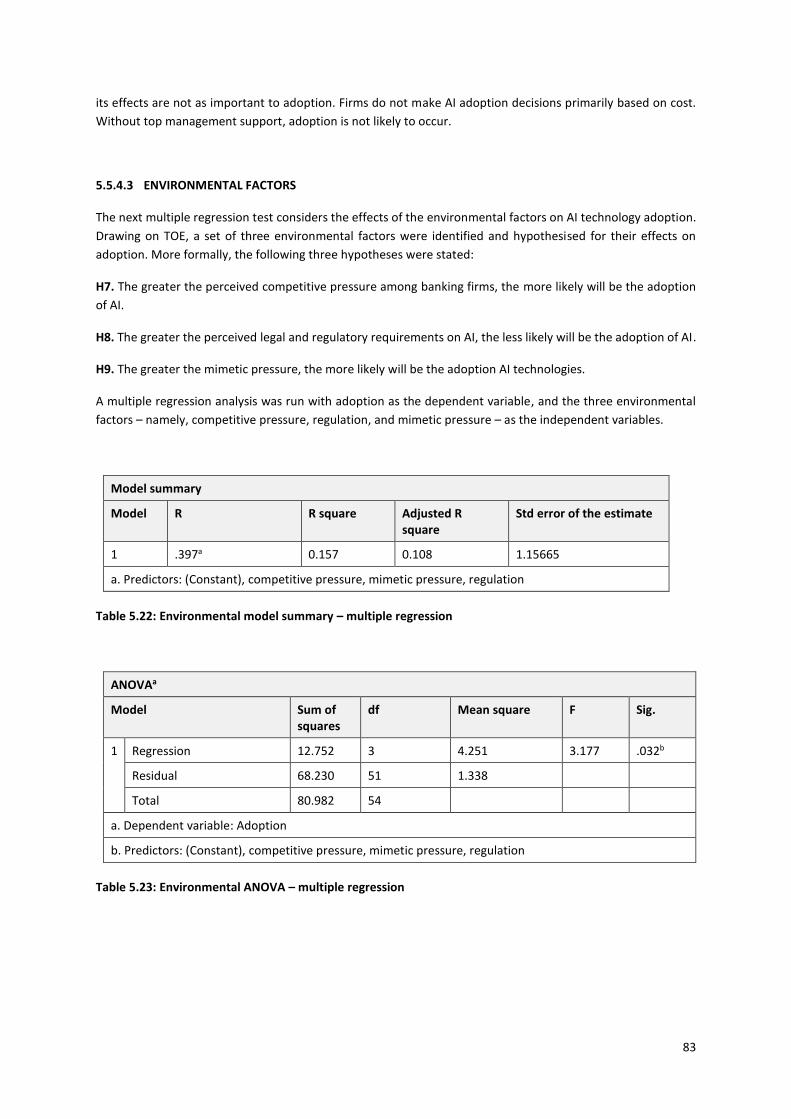
83
its effects are not as important to adoption. Firms do not make AI adoption decisions primarily based on cost.
Without top management support, adoption is not likely to occur.
5.5.4.3 ENVIRONMENTAL FACTORS
The next multiple regression test considers the effects of the environmental factors on AI technology adoption.
Drawing on TOE, a set of three environmental factors were identified and hypothesised for their effects on
adoption. More formally, the following three hypotheses were stated:
H7. The greater the perceived competitive pressure among banking firms, the more likely will be the adoption
of AI.
H8. The greater the perceived legal and regulatory requirements on AI, the less likely will be the adoption of AI.
H9. The greater the mimetic pressure, the more likely will be the adoption AI technologies.
A multiple regression analysis was run with adoption as the dependent variable, and the three environmental
factors – namely, competitive pressure, regulation, and mimetic pressure – as the independent variables.
Model summary
Model R R square Adjusted R square
Std error of the estimate
1 .397a 0.157 0.108 1.15665
a. Predictors: (Constant), competitive pressure, mimetic pressure, regulation
Table 5.22: Environmental model summary – multiple regression
ANOVAa
Model Sum of squares
df Mean square F Sig.
1 Regression 12.752 3 4.251 3.177 .032b
Residual 68.230 51 1.338
Total 80.982 54
a. Dependent variable: Adoption
b. Predictors: (Constant), competitive pressure, mimetic pressure, regulation
Table 5.23: Environmental ANOVA – multiple regression
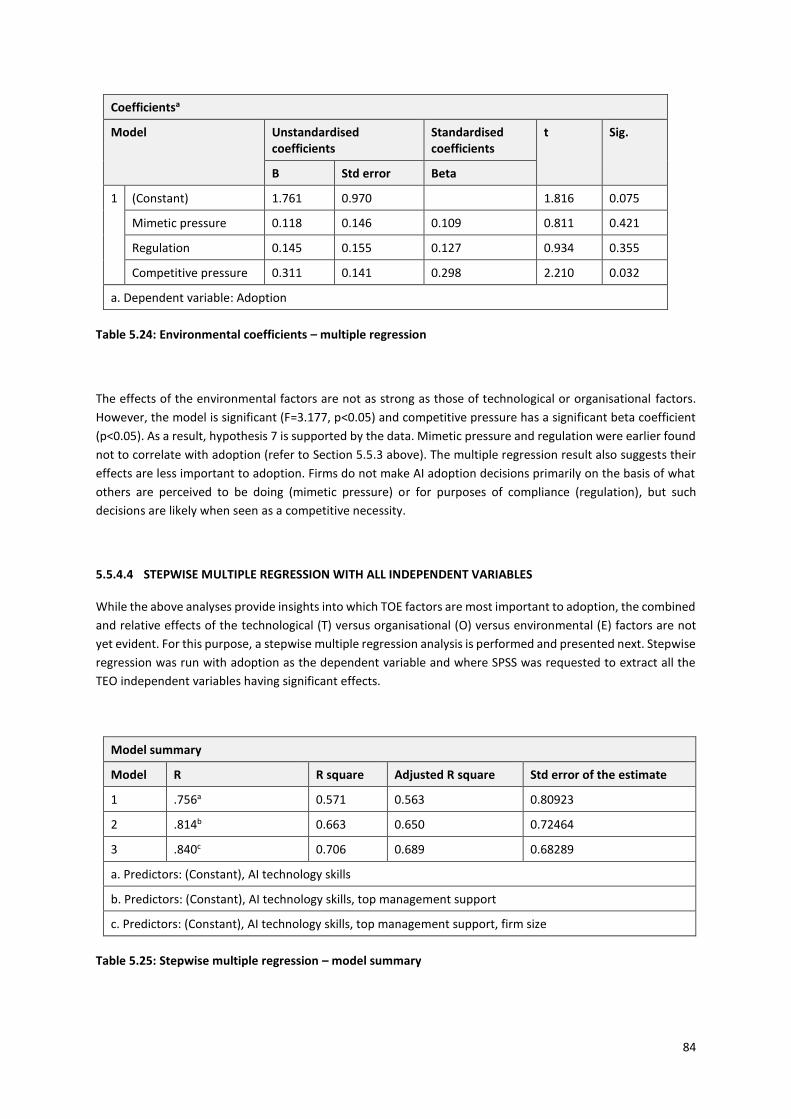
84
Coefficientsa
Model Unstandardised coefficients
Standardised coefficients
t Sig.
B Std error Beta
1 (Constant) 1.761 0.970 1.816 0.075
Mimetic pressure 0.118 0.146 0.109 0.811 0.421
Regulation 0.145 0.155 0.127 0.934 0.355
Competitive pressure 0.311 0.141 0.298 2.210 0.032
a. Dependent variable: Adoption
Table 5.24: Environmental coefficients – multiple regression
The effects of the environmental factors are not as strong as those of technological or organisational factors.
However, the model is significant (F=3.177, p<0.05) and competitive pressure has a significant beta coefficient
(p<0.05). As a result, hypothesis 7 is supported by the data. Mimetic pressure and regulation were earlier found
not to correlate with adoption (refer to Section 5.5.3 above). The multiple regression result also suggests their
effects are less important to adoption. Firms do not make AI adoption decisions primarily on the basis of what
others are perceived to be doing (mimetic pressure) or for purposes of compliance (regulation), but such
decisions are likely when seen as a competitive necessity.
5.5.4.4 STEPWISE MULTIPLE REGRESSION WITH ALL INDEPENDENT VARIABLES
While the above analyses provide insights into which TOE factors are most important to adoption, the combined
and relative effects of the technological (T) versus organisational (O) versus environmental (E) factors are not
yet evident. For this purpose, a stepwise multiple regression analysis is performed and presented next. Stepwise
regression was run with adoption as the dependent variable and where SPSS was requested to extract all the
TEO independent variables having significant effects.
Model summary
Model R R square Adjusted R square Std error of the estimate
1 .756a 0.571 0.563 0.80923
2 .814b 0.663 0.650 0.72464
3 .840c 0.706 0.689 0.68289
a. Predictors: (Constant), AI technology skills
b. Predictors: (Constant), AI technology skills, top management support
c. Predictors: (Constant), AI technology skills, top management support, firm size
Table 5.25: Stepwise multiple regression – model summary

85
ANOVAa
Model Sum of squares df Mean square F Sig.
1 Regression 46.275 1 46.275 70.664 .000b
Residual 34.707 53 0.655
Total 80.982 54
2 Regression 53.676 2 26.838 51.109 .000c
Residual 27.306 52 0.525
Total 80.982 54
3 Regression 57.199 3 19.066 40.885 .000d
Residual 23.783 51 0.466
Total 80.982 54
a. Dependent variable: Adoption
b. Predictors: (Constant), AI technology skills
c. Predictors: (Constant), AI technology skills, top management support
d. Predictors: (Constant), AI technology skills, top management support, firm size
Table 5.26: Stepwise multiple regression – ANOVA
Coefficientsa
Model Unstandardised coefficients Standardised coefficients t Sig.
B Std. Error Beta
1 (Constant) 2.316 0.296 7.810 0.000
AI technology skills
0.621 0.074 0.756 8.406 0.000
2 (Constant) 0.491 0.554 0.887 0.379
AI technology skills
0.527 0.071 0.642 7.467 0.000
Top management support
0.397 0.106 0.323 3.754 0.000
3 (Constant) -0.421 0.619 -0.681 0.499
AI technology skills
0.520 0.067 0.633 7.804 0.000
Top management support
0.397 0.100 0.323 3.980 0.000
Firm size 0.196 0.071 0.209 2.748 0.008
a. Dependent variable: Adoption
Table 5.27: Stepwise multiple regression – coefficients

86
The results confirm the relative importance of the technological factor AI technology skills, and organisational
factors top management support and firm size, over environmental factors, with approximately 70% of the
variance in AI adoption explained by these three factors.
5.5.5 ADDITIONAL ADOPTION MEASURE
An additional measure of adoption was used to test the model. Each business unit indicated whether they had
adopted each AI technology. A count was performed on the number of AI technologies each business unit
adopted and is presented in Table 5.28 below.
Number of technologies adopted Count
None adopted 6
Any one adopted 13
Any two adopted 7
Any three adopted 15
Any four adopted 8
Any five adopted 5
All six adopted 4
Total 58
Table 5.28: Count of additional adoption measure
A new column was added to the dataset, giving the respondent a score between zero and six depending on how
many technologies were adopted. Both Pearson and Spearman correlations were run on the new adoption
measure. Table 5.29 below presents the correlations.
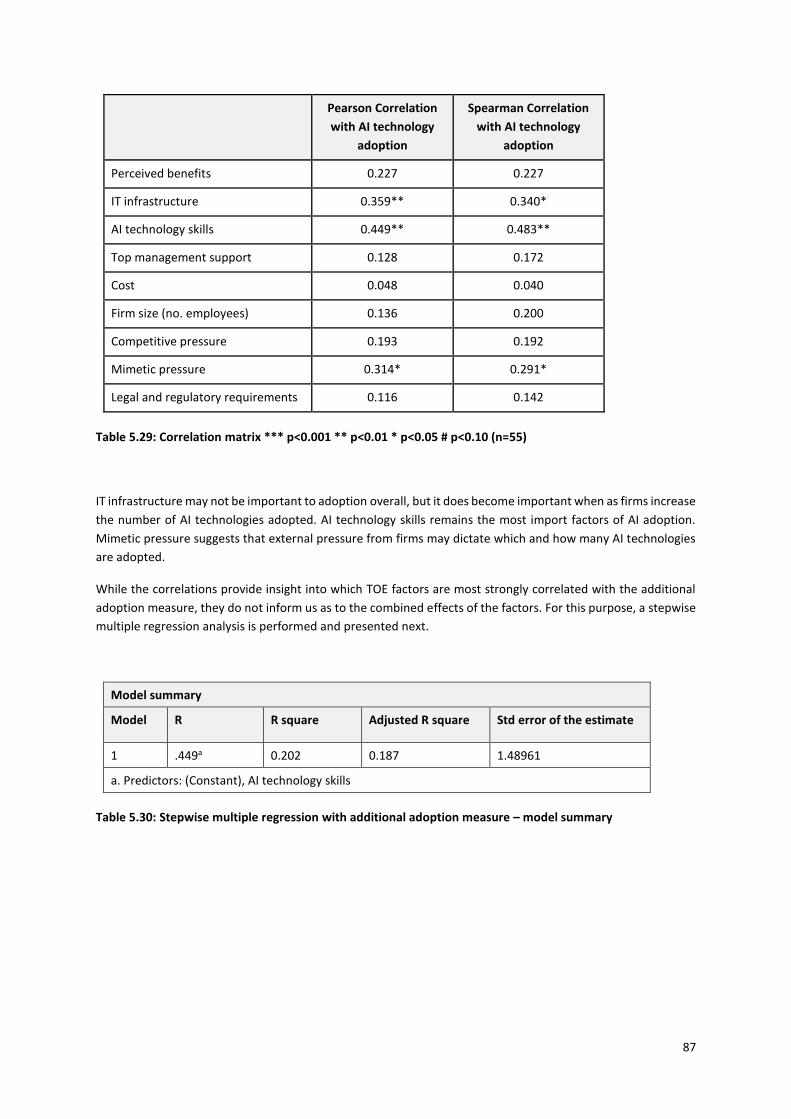
87
Pearson Correlation
with AI technology
adoption
Spearman Correlation
with AI technology
adoption
Perceived benefits 0.227 0.227
IT infrastructure 0.359** 0.340*
AI technology skills 0.449** 0.483**
Top management support 0.128 0.172
Cost 0.048 0.040
Firm size (no. employees) 0.136 0.200
Competitive pressure 0.193 0.192
Mimetic pressure 0.314* 0.291*
Legal and regulatory requirements 0.116 0.142
Table 5.29: Correlation matrix *** p<0.001 ** p<0.01 * p<0.05 # p<0.10 (n=55)
IT infrastructure may not be important to adoption overall, but it does become important when as firms increase
the number of AI technologies adopted. AI technology skills remains the most import factors of AI adoption.
Mimetic pressure suggests that external pressure from firms may dictate which and how many AI technologies
are adopted.
While the correlations provide insight into which TOE factors are most strongly correlated with the additional
adoption measure, they do not inform us as to the combined effects of the factors. For this purpose, a stepwise
multiple regression analysis is performed and presented next.
Model summary
Model R R square Adjusted R square Std error of the estimate
1 .449a 0.202 0.187 1.48961
a. Predictors: (Constant), AI technology skills
Table 5.30: Stepwise multiple regression with additional adoption measure – model summary
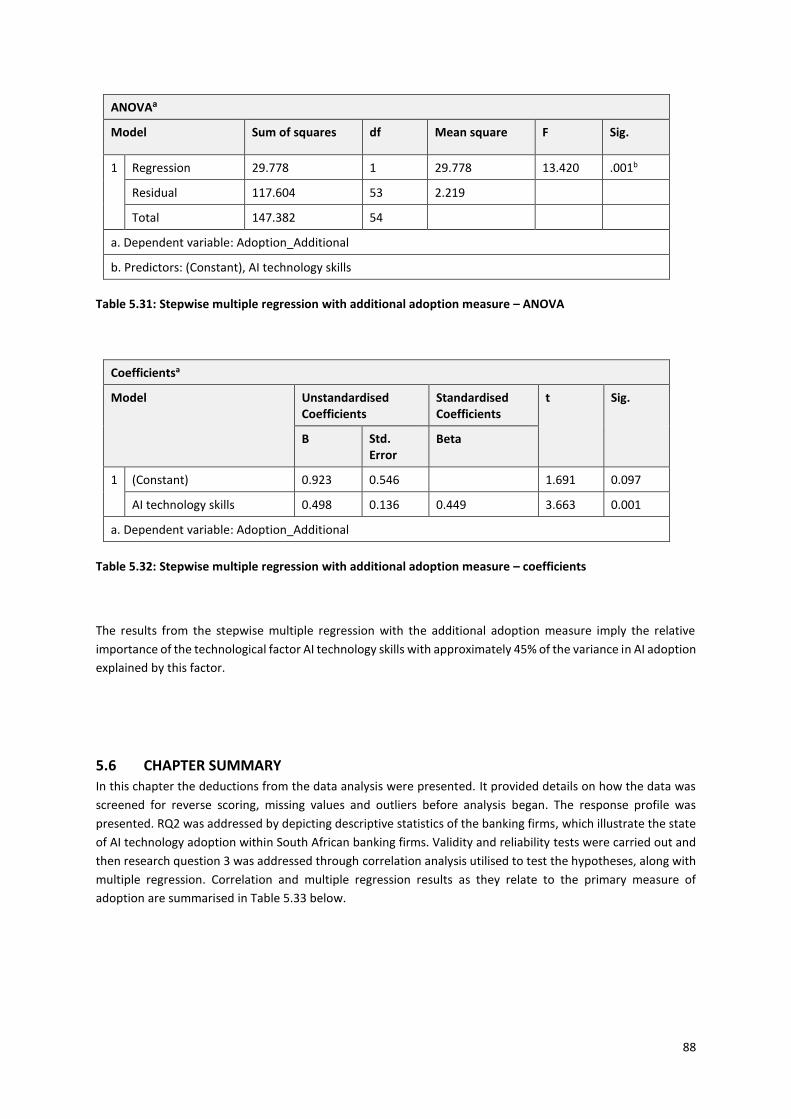
88
ANOVAa
Model Sum of squares df Mean square F Sig.
1 Regression 29.778 1 29.778 13.420 .001b
Residual 117.604 53 2.219
Total 147.382 54
a. Dependent variable: Adoption_Additional
b. Predictors: (Constant), AI technology skills
Table 5.31: Stepwise multiple regression with additional adoption measure – ANOVA
Coefficientsa
Model Unstandardised Coefficients
Standardised Coefficients
t Sig.
B Std. Error
Beta
1 (Constant) 0.923 0.546 1.691 0.097
AI technology skills 0.498 0.136 0.449 3.663 0.001
a. Dependent variable: Adoption_Additional
Table 5.32: Stepwise multiple regression with additional adoption measure – coefficients
The results from the stepwise multiple regression with the additional adoption measure imply the relative
importance of the technological factor AI technology skills with approximately 45% of the variance in AI adoption
explained by this factor.
5.6 CHAPTER SUMMARY In this chapter the deductions from the data analysis were presented. It provided details on how the data was
screened for reverse scoring, missing values and outliers before analysis began. The response profile was
presented. RQ2 was addressed by depicting descriptive statistics of the banking firms, which illustrate the state
of AI technology adoption within South African banking firms. Validity and reliability tests were carried out and
then research question 3 was addressed through correlation analysis utilised to test the hypotheses, along with
multiple regression. Correlation and multiple regression results as they relate to the primary measure of
adoption are summarised in Table 5.33 below.

89
Hypothesis Result from
correlation
Result from separate
multiple regression
Result from stepwise
regression
H1: Perceived benefits Supported
H2: IT infrastructure Supported
H3: AI technology skills Supported Supported Supported
H4: Top management Supported Supported Supported
H5: Firm size Supported Supported Supported
H6: Cost
H7: Competitive pressure Supported Supported
H8: Regulation
H9: Mimetic pressure
Table 5.33: Correlation and multiple regression summary
The next chapter discusses the findings in relation to the results from the existing literature.
90
CHAPTER 6: DISCUSSION OF RESULTS
The outcomes from each research question are presented in the subsequent sections. The first section defines
a basket of AI technologies for banking firms. Thereafter, the state of adoption of each AI technology is reported.
Lastly, the effects of the TOE factors on the adoption of AI technologies are discussed.
6.1 BASKET OF AI TECHNOLOGIES
RQ1 from the study is: What constitutes the basket of AI technologies perceived as relevant for banking firms?
This research question was addressed by conducting a literature review and utilising online research articles,
which identified a preliminary basket of AI technologies for banking. The preliminary basket of AI technologies
was presented to an expert panel to verify their relevance in the banking sector. Future research may wish to
consider a different basket of AI technologies relevant to firms outside of banking. The basket of AI technologies
perceived as relevant for banking firms is as follows:
a) Machine learning
Machine learning uses statistical techniques to give computer systems the ability to "learn" with data,
without being explicitly programmed (Gartner, 2017). By utilising big data, it has the potential to make
predictions on business activities and assist in decision-making. Examples of its application in the
banking sector include enabling traders at investment banks to track stock prices in real-time and
delivering personalised financial advice to clients based on behavioural patterns (Deloitte, 2015).
b) Robotic automation process
RPA refers to technology that can be easily programmed to do basic tasks across applications just as
human workers do (ibid.). It has the potential to replicate human interaction across multiple platforms
by interacting at the interface layer of a system (Dirican, 2015). Examples of its application in banking
include significantly improving the quality of complex manual processes which enhance customers’
experience, and pre-emptively observing and preventing trading malpractice in trading firms (Deloitte,
2015).
c) Natural language processing
NLP is branch of AI that helps computers “understand, interpret and manipulate human language”
(Collobert and Weston, 2008). Its benefits banking firms by cost saving on systems development and
enhancing decision-making. Examples of its application in the banking sector include the use of
semantic rules which are effective in extracting customer information on customer forms for processing
(Deloitte, 2015).
91
d) Expert systems
Expert systems are a branch of AI where applications simulate the decision making and performance of
a human or an organisation that has expert understanding and expertise in a particular field (Smith and
Eckroth, 2017). They have the potential to analyse, diagnose, interpret results, predict results and
formulate alternative options to problems (Accenture, 2017). Examples of expert systems application
in the banking sector operating continuously to recognise and eliminate fraud in online branch banking.
Fraudulent or suspicious behaviour is identified, and the client is immediately alerted (Deloitte, 2015).
e) Virtual assistants
Virtual assistants and chatbots are applications designed to simulate communications between the
application and human users. (Yan et al., 2016). They have the potential to enhance customer service
by providing consistent, online, real-time feedback 24 hours a day (Deloitte, 2015). Examples of its
application in the banking sector include providing a platform which can communicate with users to
provide account information and helping customers to reset their passwords and provide financial
assistance during account opening (ibid.).
f) Pattern recognition
Pattern recognition is a branch of AI that converges on the identification of data patterns and
consistencies in data (Vanneschi et al., 2018). It has the potential to identify complex irregularities in
data that a human cannot identify, thus providing data integrity and reducing financial crime. Examples
of its application in the banking sector include detection and predicating of fraud, financial crime
monitoring, forensics, and risk decisions for anti-money laundering (Vanneschi et al., 2018; Deloitte,
2015).
Having established the basket of AI technologies described above, the second research question aimed to reveal
their state of adoption. The following section presents the current state of adoption for each AI technology
within banking firms.
6.2 STATE OF ADOPTION
The study’s second research question (RQ2) is: What is the current state of adoption of AI technologies by
banking firms in South Africa? This research question was addressed by asking respondents from banking firms
to indicate which technologies from the basket of AI technologies (RQ1) they have implemented within their
business unit. The data gathered indicated which AI technologies had been adopted and which had not.
Additionally, the respondents were asked to indicate which year the AI technology was adopted, and to provide
adoption examples of how the technology was utilised in their organisation.
The study revealed that the average banking unit uses an average of three AI technologies. Given the banking
units plans to adopt AI technologies (see Table 5.9 above) in the next three years, we can expect the usage of
these technologies to increase.
92
The state of diffusion of each AI technology was shown by drawing diffusion curves. The diffusion S-curve by
Rogers (2010) was used to compare each diffusion curve of the AI technology. Each AI technology was classified
as either innovation, early adoption, early majority, late majority or laggard phases of adoption. It was
discovered that machine learning, expert systems, virtual assistants, NLP and pattern recognition were in the
early majority phase adoption, while RPA was in the late majority phase of adoption.
Additionally, the study found that NLP was the least diffused technology in the AI basket. Collobert and Weston
(2008) refer to NLP taking prominence in 2001; however, the earliest adoption of NLP in banking firms in the
sample was in 2014, with the majority in 2018. This implies that NLP has been available in the market for a while
but did not diffuse swiftly. This could indicate that banking firms did not perceive NLP as adding value and
underrated its benefits in the banking sector. Alternatively, the banking units could be facing barriers that
prohibit the adoption of NLP, and these barriers need to be identified and solutions crafted to improve future
adoption.
The rank-order of AI technologies in terms of current state of adoption is summarised as follows:
1. Robotic process automation (69%)
2. Virtual assistants (53%)
3. Patter recognition (45%)
4. Expert systems (36%)
5. Machine learning (36%)
6. Natural language processing (24%)
The aims of the third research question were to identify enablers and inhibitors to the adoption of AI
technologies. Drawing on the TOE framework, a model was developed where nine hypotheses were proposed.
The model aimed to establish whether the variables – perceived benefits, IT infrastructure, AI technology skills,
top management support, cost, competitive pressure, mimetic pressure, and legal and regulatory requirements
– influenced a banking firm’s adoption of AI technologies.
6.3 EFFECTS OF TECHNOLOGICAL FACTORS ON AI TECHNOLOGY ADOPTION
6.3.1 PERCEIVED BENEFITS
This study hypothesised that the greater the perceived benefits of AI adoption by banking firms, the more likely
will be the adoption of AI. Perceived benefits included the following (Oliveira and Martins, 2010):
• The reduction of the firms operating costs
• Enhancing the efficiency of the firms' operations
• Promoting higher standards of customer service
• Improving customer relationships, and
• Expanding the customer market
This hypothesis was supported based on a positive correlation and is consistent with the conclusions from
previous studies (Awa, Ukoha and Emecheta, 2016; Beatty, Shim and Jones, 2001; Iacovou, Benbasat and Dexter,
1995; Oliveira and Martins, 2010), which discovered perceived benefits to be a predictor of technology adoption.
This study revealed that the best-rated benefits included: reduced operating costs, improved operational
efficiency, and improved customer service. The positive relationship between AI technology adoption and
93
perceived benefits suggests that AI technology is considered by banking firms as an instrument for reducing
operating costs, and for enhancing customer and operational efficiency service, which is something that can
enable the organisation to gain major strategic benefits in the long term. These benefits also imply that benefits
achieved from using AI technologies are not only limited to the banking firms but also to the customers.
6.3.2 IT INFRASTRUCTURE
This study hypothesised that the greater the availability of highly developed IT infrastructure, the more likely
will be the adoption of AI. IT infrastructure included the following (Lin and Lin, 2008; Wang, Wang and Yang,
2010):
• Current IT infrastructure supporting AI-related technology
• AI technology is compatible with current IT infrastructure, and
• AI development is compatible with the firm's present experiences with comparable technology
This hypothesis was not supported and is contrary with the conclusions from previous studies (Aboelmaged,
2014; Lin and Lin, 2008; Tornatzky and Fleischer, 1990; Wang, Wang and Yang, 2010), which found IT
Infrastructure to be a predictor of technology adoption. Unlike the other technological innovations found in the
above-mentioned research, which have a specific application, the scope of AI technologies is wide, affecting
every element of IT infrastructure. As well as not being significant, the relationship between AI technology
adoption and IT infrastructure was found to be very weak, which suggests that AI is being adopted regardless of
whether it is compatible with existing infrastructure. In other words, having a developed infrastructure capable
of supporting AI is no guarantee that AI is being pursued.
6.3.3 AI TECHNOLOGY SKILLS
This study hypothesised that the greater the levels of AI technology skills of banking firms, the more likely will
be the adoption of AI. AI technology skills include the following (Wang, Wang and Yang, 2010):
• Dedication by the firm to ensure staff are accustomed to and trained with AI Technology
• High level of AI-related knowledge, and
• Hiring of highly specialised personnel for AI technologies.
This hypothesis was strongly supported by correlation and regression analysis where it was found in stepwise
analysis to be the most important factor for adoption. This conclusion is consistent with the inferences from
preceding studies (Lee and Kim, 2007; Manyika et al., 2017; Molla and Licker, 2005; Pudjianto and Hangjung,
2009; Wang, Wang and Yang, 2010), which found skills to be a predictor of technology adoption. These previous
studies also found that firms will delay adoption of new technology if they do not have the necessary skills (Chau
and Tam, 1997). The implementation of AI introduces an additional category of technology and, therefore,
requires specialised development to be able to use the new systems. Such adoption is an activity that is achieved
with a high level of expertise which hiring highly skilled individuals will be necessary. A study by Lee and Kim
(2007) discovered that training reduces user resistance and increases adoption of new technology. Therefore, if
firms want to be better positioned to adopt AI, they should ensure that employees are familiar with and trained
in AI; increase the general awareness of AI knowledge in the firm; and ensure a cohort of highly AI specialised
personnel are on board. The absence of these mechanisms will reduce the probability of adoption.

94
6.4 EFFECTS OF ORGANISATIONAL FACTORS ON AI TECHNOLOGY ADOPTION
6.4.1 TOP MANAGEMENT SUPPORT
This study hypothesised that the greater the perceived support for AI by top management within banking firms,
the more likely will be the adoption of AI. Top management support includes the following (Lee and Kim, 2007):
• Investing funds in AI technologies
• Senior managers are comfortable in considering the risks associated with adopting AI technologies
• Consider the adoption of AI to gain competitive edge, and
• Consider adopting AI as strategically important.
This hypothesis was strongly supported in the analysis where it was found to be the next most important variable
in the stepwise analysis, after skills. The outcome derived that top management support is essential in
technology adoption corresponds to the findings from preceding research (Kolbjørnsrud, Amico and Thomas,
2017; Lee and Kim, 2007; Wang, Wang and Yang, 2010). Top management support displays a significant positive
relationship with AI technology adoption. This suggests that top management support for banking firm
technology innovations is essential in determining its adoption, since they have the mandate to drive initiatives
and fulfil the acceptance of AI technologies. This transformation in the banking firm requires an encouraging
decision from senior managers. Top management has authority to influence employees’ behaviour within the
banking firm. Via long-term strategic vision, top management can inspire employees to learn and adopt AI
technologies. Lastly, with effective support by top management, the appropriate resources can be allocated to
AI adoption through high prioritisation (Lee and Kim, 2007).
6.4.2 FIRM SIZE
This study hypothesised that the larger the size of the banking firm, the more likely will be the adoption of AI.
Previous studies (Borgman et al., 2013; Lin, Lee and Lin, 2016; Teo et al., 2003; Wang, Wang and Yang, 2010)
discovered that firm size influenced the adoption of technology. The supposition was that larger organisations
have additional resources to experiment with and pilot innovations and can mitigate the risks and cost of
implementing new innovations (Borgman et al., 2013).
From the correlation test performed, this hypothesis received some support. The multiple regression and
stepwise regression indicated that when combined with other factors, firm size still displays a significant positive
relationship with AI technology adoption. Banking firms in South Africa are predominantly large organisations
with higher average annual revenue and may encounter more financial slack which gives them the ability to
allocate a larger budget to technology innovations. Banking firms also have larger workforces with more IT
employees; thus, they may have more expertise and person power to complement their adoption of AI. Another
deduction is that large firms such as that of a South African bank may have a greater need to stay abreast of
technological trends and innovations than their smaller competitors. It is unlikely that large banking
organisations can ignore AI applications like RPA and virtual assistants to support operations such as automating
manual processes (e.g. account openings and interacting with customers instantly without having to visit a
branch or call a contact centre).

95
6.4.3 COST
This study hypothesised that the greater the perceived cost of adopting AI technologies, the less likely will be
the adoption. Components of cost include (Lin, Lee and Lin, 2016; Teo et al., 2003):
• AI technologies have high setup costs
• AI technologies have running costs, and
• AI technologies have training costs.
Previous studies (Lin, Lee and Lin, 2016; Teo et al., 2009; Zhu et al., 2004) found that cost influences the adoption
of technology. Surprisingly, the relationship between costs and adoption is not supported in this study of AI
adoption. One possible reason is that although AI technologies are costly, they require much lower costs
compared to traditional technologies like ERP and customer relationship management systems. Firms may adopt
AI on the basis of benefits regardless of cost, or regardless of cost but in response to competitive pressure, which
is discussed next.
6.5 EFFECTS OF ENVIRONMENTAL FACTORS ON AI TECHNOLOGY ADOPTION
6.5.1 COMPETITIVE PRESSURE
Competitive pressure refers to the level of pressure from competing firms, which an outside entity influences a
firm to adopt new innovations to remain competitive and avoid downfall (Rebelo, Ruivo and Oliveira, 2013). This
study hypothesised that the greater the perceived competitive pressure among banking firms, the more likely
will be the adoption of AI. Previous studies (Chao, Yang and Jen, 2007; Kuan and Chau, 2001; Wang, Wang and
Yang, 2010) found that competitive pressure influences adoption. The supposition was that competitive
pressure is an important factor in banking firms to adopt new technology innovations to avoid competitive
decline (Zhu, Kraemer and Xu, 2003). Competitive pressure comprised the following (Chao, Yang and Jen, 2007;
Kuan and Chau, 2001; Wang, Wang and Yang, 2010):
• Firm will experience competitive pressure to adopt AI
• Firm will experience a competitive disadvantage by not adopting AI, and
• Competitors are adopting AI technologies.
The relationship between competitive pressure and adoption was significant and thus the hypothesis is
supported. Multiple regression confirmed its importance relative to those of the other environmental factors.
This indicates that when a banking firm embarks on utilising AI technologies, other competing banking firms feel
the pressure to immediately adopt the same technologies. However, the results from the stepwise regression
revealed that this environmental factor was still not as important to adoption as the technological or
organisational factors.
6.5.2 REGULATORY REQUIREMENTS
This study hypothesised that the greater the perceived legal and regulatory requirements on AI, the less likely
will be the adoption of AI. Previous studies (Borgman et al., 2013; Furst, Lang and Nolle, 1998; Zhu et al., 2006)
found that regulatory requirements influence adoption. The supposition was that regulatory requirements can
96
make a banking firm reluctant to adopt AI. Regulatory requirements comprised the following (Borgman et al.,
2013; Furst, Lang and Nolle, 1998):
• Regulation and policies will inhibit the adoption of AI
• Current business laws and regulations support AI operations and adoption among firms, and
• The government provides support for AI technology adoption.
This hypothesis was not supported and is contrary to the conclusions from the previous studies mentioned
above. The relationship between regulation and adoption was not significant or positive. This could indicate that
there are no governmental regulations or requirements regarding the use of AI technologies, or that government
regulations currently have no leverage and minimal influence on South African banking firm’s technology
adoption decisions.
6.5.3 MIMETIC PRESSURE
Mimetic pressure is defined as the tendency for firms to represent themselves after or to mimic other firms (Teo
et al., 2003). This study hypothesised that the greater the mimetic pressure, the more likely will be the adoption
of AI technologies. Previous studies (Cohen, Mou and Trope, 2014; Teo et al., 2003) found that mimetic pressure
influences adoption. The supposition was that mimetic pressure when technologies are not entirely understood,
or when returns on investment are uncertain, results in organisations developing their responses to these
innovative technologies based on organisations that they recognise to be successful (Cohen, Mou and Trope,
2014). Mimetic pressure comprised the following (Teo et al., 2003):
• Key rivals have benefited from adopting AI technologies
• Key rivals within equivalent industries are favourably perceived when adopting AI technologies, and
• Key rivals are positively regarded by their suppliers and customers when adopting AI technologies
This hypothesis was not supported in this study. The relationship between mimetic pressure and adoption was
not significant. This could indicate that banking firms are not influenced by the legitimising potential of AI
adoption as suggested by institutional theory, but perhaps rather from a more practical competitive necessity,
and based on internal firm capabilities (skills) supported by top management and the availability of resources.
There was some suggestion in the additional analysis that mimetic pressure may influence the number of
technologies adopted, but this needs to be explored further in future research.
6.6 CHAPTER SUMMARY
This chapter began by presenting the basket of AI technologies as perceived by banking firms (RQ1). Next, the
state of adoption of AI technologies by South African banking firms was presented (RQ2). The TOE factors that
influence the adoption of AI technologies were presented (RQ3). Two technological factors (perceived benefits
and IT infrastructure), one organisational factor (cost), and two environmental factors (regulation and mimetic
pressure) did not significantly increase the explanatory capability of a model that predicts AI adoption. AI
technology skills (technological factor), top management support and firm size (organisational factors), and
competitive pressure (an environmental factor) significantly predicated the adoption of AI technologies when
combined with all other variables in the TOE model for this study.
The next chapter presents the conclusion and discusses the implications and limitations of the findings in this
study.

97
CHAPTER 7: CONCLUSION
A description of the research findings is presented here by addressing all the research questions and ensuring
that the research objectives were met. These research findings are presented for both academia and practice.
The chapter is then concluded by discussing the shortcomings and proposed research for future studies.
7.1 SUMMARY OF FINDINGS
The first aim of this study was to identify a basket of AI technologies. This was achieved by drawing on existing
literature, an online review of research websites, and interviews with an expert panel. This exercise identified
the following six technologies that constitute a basket of AI technologies used by South African banking firms:
machine learning, RPA, expert systems, virtual assistants, NLP and pattern recognition.
The second aim of this study was to determine the current state of adoption of AI technologies as identified by
RQ1. This was achieved by an online survey that was carried out to determine the current state of adoption of
the AI technologies by South African banking firms. The survey was administered to a sample of 307 participants
representing various banking business units across South African banks, of which 62 responses were received.
The results revealed that RPA was the most diffused technology, while NLP was the least diffused technology.
The results also revealed a significant intention to adopt AI technologies in the next three years.
The third aim of this study was to identify the factors influencing the adoption of AI technologies. The research
model was tested using the data from the online survey. This was achieved by taking the variables hypothesised
in the research model and operationalising them to develop the questionnaire. Principal component analysis
was run to assess convergent and discriminant validity, while the internal consistency reliability was measured
using Cronbach’s alpha. Based on correlation followed by regression analysis, the study revealed that AI
technology skills, top management support, firm size and competitive pressure were positively related to the
adoption of AI technologies, while perceived benefits, IT infrastructure, cost, regulation and mimetic pressure
were not well supported as determinants of adoption in the sample.
7.2 IMPLICATIONS FOR ACADEMIA
Through the systematic literature review performed for this study, it was discovered that quantitative empirical
studies on AI adoption at firm-level are very limited. There is still much to be learnt about AI technologies since
this is a relatively understudied area, with an inadequate amount of research focusing on AI technologies and
the adoption of AI technologies at the firm level. In comparison to a study conducted by Oliveira and Martins
(2011), it was further discovered that the TOE framework has not been utilised significantly to understand AI
adoption. Furthermore, it was discovered that limited studies were undertaken regarding adoption in the South
African banking context, and importantly no studies using the TOE framework to explain adoption of AI
technologies by South African banking firms. This study uses the TOE framework as a theoretical lens to evaluate
the adoption of AI by South African banking firms. The technological factors and organisational factors emerged
as the most import factors in the adoption of AI technologies, as AI technology skills, top management support
and firm size influenced the adoption of AI within South African banking firms.

98
7.3 IMPLICATIONS FOR PRACTICE
The research provides several practical approaches for AI vendors and for banking firms considering the
adoption AI technologies. The findings from this study can be utilised as a benchmark which allows banking firms
and other financial institutions to evaluate and compare their AI adoption status to other firms. It advises
banking firms on where they stand compared to the average South African bank in terms of being innovators or
lagging behind. South African banks should use the basket of AI technologies to evaluate whether they are
among the early or late adopters of AI technology.
This study provides direction for firms seeking to understand the factors influencing decisions to adopt AI
technologies. For example, it was found that AI technology skills, top management support, firm size and
competitive pressure influenced the adoption of AI within South African banking firms.
Since top management support was found to have a positive relationship with AI adoption, AI vendors should
focus their attention on top management rather than on IT employees. By highlighting the benefits of AI for the
firm, top management can bring impetus and are in an ideal position to influence adoption by ensuring buy-in
and that resources are available for successful implementation. Top managers must understand the important
role they play in affecting the adoption of innovative technology.
Furthermore, this study informs banking firms that AI technology skills significantly improves the likelihood of
successful AI adoption. Developing AI applications is complex and requires sophisticated skills that continually
evolve as the technology advances. It is thus imperative for banking firms to continuously train and upskill their
IT employees.
Surprisingly, cost was not found to be important to banking firms when adopting AI technologies. This could
indicate that when banking firms believe AI technologies are crucial to their ability to service customers and
remain competitive, they do not predominately focus on cost. It was also surprising as it was thought banking
firms might attempt to legitimise themselves through the pressure to imitate other firms’ adoption practices via
a mimetic pressure. However, the results show that such pressure was not among the important adoption
drivers but could influence the number of AI technologies and specific types adopted. Overall, however, results
suggest that adoption is a more rational process focused on an evaluation of internal skills and capabilities and
responding to competition. Attention should therefore turn to skills development and top management support.
7.4 LIMITATIONS
It should be noted that there are some limitations to this study.
Firstly, this study had a limited number of responses (62). A larger number of responses could have influenced
the relative effects of the TEO factors on the adoption of AI technologies.
Secondly, a cross-sectional and relational research design was adopted by this study; therefore, causal
relationships could not be inferred. In the cross-sectional survey, data on both independent and dependent
variables is collected at the same time and therefore there is no temporal precedence in the data. This limits the
99
ability to draw causal inferences (Bhattacherjee, 2012). Causal inferences are therefore made only with respect
to TOE theory.
Thirdly, the focus of this study was on adopting six pre-defined technologies; therefore, results from this study
may not be generalisable to other AI technologies. As such, the factors that influence adoption of AI may not be
generalisable adopting each individual technology within the basket. A firm may have a low tendency to adopt
the entire basket of AI technologies, but a high tendency to adopt one technology within the basket.
Fourth, the surveys were self-completed by the respondents and therefore subject to respondent bias. The
questions may have been misinterpreted or be subject to acquiescence bias (whereby respondents portray their
firm in a better light regarding their state of AI adoption).
Fifthly, this study was conducted on South African banking firms and thus the findings cannot be generalised to
other geographies and other types of firms. Therefore, an opportunity exists for further research to apply to
firms outside of banking and across other countries.
Finally, the TOE framework could not describe all factors that influence the adoption of AI, thus improvements
can be made to the model by adding and testing other factors.
7.5 FUTURE RESEARCH
This study focused on the TOE framework. Further studies on adoption of AI in banking could be studied through
a different theoretical lens. The TOE framework does not provide a definitive model depicting the factors that
influence a firm’s adoption decisions, and therefore improvements to the model can be made. Additional
variables can be substituted to improve the accuracy of predicting the adoption of AI technologies, and this
study’s model can be utilised as a foundation to build upon. The interviews that were carried out in the study
alluded at uses, benefits and drivers of AI technology and these can be extended into additional qualitative
studies.
Furthermore, the study should be researched in different sectors such as manufacturing, health or government.
Another interesting study to be done in the future is to perform a case study on one bank’s experience with AI
adoption. Further research can incorporate a longitudinal design to improve understanding of how AI
technologies endure adoption and diffuse over time. Lastly, further research can be considered in unpacking AI
skills in more detail, investigating how the educational sector can develop IT professionals with the requisite
skills to promote AI use and success.
100
7.6 CONCLUSION
This study has contributed to the literature by identifying a basket of AI technologies and assessing their state
of adoption within South African banking firms. Diffusion curves for each AI technology were examined and thus
South African banking firms can assess and make informed decisions regarding their adoption of AI technologies.
By utilising the TOE framework, this study further contributed to the general AI technology literature by tackling
a research gap that revealed that the framework was not used to study AI adoption in the South African or
banking contexts. By using quantitative empirical approaches, it was revealed that technological factors (AI
technology skills), organisational factors (top management support and firm size), and one environmental factor
(competitive pressure) were positively linked to the adoption of AI technology.
As a result of this study, we now know which factors support AI adoption. Prior to this study it was unknown if
skills were more important than IT infrastructure, or whether benefits were more important than costs of
adoption, or whether regulation posed a greater concern than competitive pressure. No past studies clarified
these outcomes regarding AI adoption in banking firms. This study has shed light on the phenomenon. We are
better positioned to advise firms on which factors to focus on. Specifically, firms wanting to adopt AI should
focus first on skills rather than infrastructure, develop a strong business case focused on competitive benefits,
and craft a strategy for obtaining top management support.
101
BIBLIOGRAPHY
Aboelmaged, M.G., 2014. Predicting e-readiness at firm-level: An analysis of technological, organizational and
environmental (TOE) effects on e-maintenance readiness in manufacturing firms. International Journal
of Information Management, 34(05), pp.639-651.
Accenture, 2017. Banking technology vision 2017. [online] Available at: <https://www.accenture.com/za-
en/insight-banking-technology-vision-2017> [Accessed 10 May 2017].
Ajzen, I., 1985. From intentions to actions: A theory of planned behavior. In: J. Kuhl and J. Beckmann, eds. Action
control. Heidelberg: Springer. pp. 11-39.
Alhawiti, K.M., 2015. Advances in artificial intelligence using speech recognition. International Journal of
Computer, Electrical, Automation, Control and Information Engineering, 9(6), pp.1351-1354.
Alkhater, N., Wills, G. and Walters, R., 2014. Factors influencing an organisation's intention to adopt cloud
computing in Saudi Arabia. Cloud Computing Technology and Science (CloudCom), 2014 IEEE 6th
International Conference. Singapore, December 2014. pp.1040-1044.
Al-Tarawneh, H., 2017. Artificial intelligence part 1. [online] Available at:
<https://slideplayer.com/slide/9788755/> [Accessed November 2017].
Awa, H.O., Ukoha, O. and Emecheta, B.C., 2016. Using TOE theoretical framework to study the adoption of ERP
solution. Cogent Business and Management, 3(1).
Baker, J., 2012. The technology–organization–environment framework. In: Y. Dwivedi, M. Wade and S.
Schneberger, eds. Information systems theory. New York: Springer. pp.231-245.
Beatty, R.C., Shim, J.P. and Jones, M.C., 2001. Factors influencing corporate web site adoption: A time-based
assessment. Information and Management, pp.337-354.
Bellman, R., 1978. An introduction to artificial intelligence: Can computers think? Thomson Course Technology,
4(4).
Berger, A.N. and Bouwman, C.H., 2013. How does capital affect bank performance during financial crises?
Journal of Financial Economics, 109(1), pp.146-176.
Bhattacherjee, A., 2012. Social science research: Principles, methods, and practices. Textbooks Collection 3.
[online] Available at: <http://scholarcommons.usf.edu/oa_textbooks>
Borgman, H.P., Bahli, B., Heier, H. and Schewski, F., 2013. Cloudrise: Exploring cloud computing adoption and
governance with the TOE framework. 46th Hawaii International Conference On System Sciences IEEE.
Maui, January 2013.
Bryman, A. and Bell, E., 2015. Business research methods. Oxford: Oxford University Press.
Brynjolfsson, E. and McAfee, A., 2012. Race against the machine: How the digital revolution is accelerating
innovation, driving productivity, and irreversibly transforming employment and the economy. The
Lancet Diabetes and Endocrinology, 1(1), p.8.
102
Businesslive, 2018. Rand Merchant Bank introduces robots into the bank. [online] Available at:
<https://www.businesslive.co.za/bd/companies/financial-services/2018-03-06-rand-merchant-bank-
introduces-robots-into-the-bank/> [Accessed 01 September 2019].
Businesstech, 2016. Absa to use chatbots to talk to customers. [online] Available at:
<https://businesstech.co.za/news/banking/121771/absa-to-use-chatbots-to-talk-to-customers>
[Accessed 01 September 2019].
Businesstech, 2016. Selfie banking in South Africa not far away. [online] Available at:
<https://businesstech.co.za/news/banking/136911/selfie-banking-in-south-africa-not-far-away/>
[Accessed 01 September 2019].
Chandrashekar, A., Kumar, A. and Saxena, A., 2017. Top 10 Trends in banking – 2017. [online] Available at:
<https://www.capgemini.com/wp-
content/uploads/2017/07/banking_trends_2017_web_version.pdf> [Accessed October 2017].
Chao, C.C., Yang, J.M. and Jen, W.Y., 2007. Determining technology trends and forecasts of RFID by a historical
review and bibliometric analysis from 1991 to 2005. Technovation, 27, pp.268-279.
Charniak, E. and McDermott, D., 1985. Introduction to AI. Reading: Addison.
Chau, P.Y.K. and Tam, K.Y., 1997. Factors affecting the adoption of open systems: An exploratory study. MIS
Quarterly, 21, pp.1-24.
CIO, 2018. Robotic process automation is on the rise. [online] Available at:
<https://www.cio.com/article/3330037/business-process-automation/robotic-process-automation-is-
on-the-rise.html> [Accessed 20 November 2018].
Cohen, J.F., Mou, J. and Trope, J., 2014. Adoption of cloud computing by South African firms: The role of
institutional forces, absorptive capacity, and top management. In: Proceedings of the Southern African
Institute for Computer Scientist and Information Technologists Annual Conference 2014 on SAICSIT.
Centurion, September 2014. p.30.
Collins, P.D., Hage, J. and Hull, F.M., 1988. Organizational and technological predictors of change in automaticity.
Academy of Management Journal, 31(3), pp.512–543.
Collis, J. and Hussey, R., 2013. Business research: A practical guide for undergraduate and postgraduate students.
Macmillan International Higher Education. Hampshire.
Collobert, R. and Weston, J., 2008. A unified architecture for natural language processing: Deep neural networks
with multitask learning. In: Proceedings of the 25th International Conference on Machine Learning.
ACM. Helsinki, July 2008. pp.160-167.
Computerworld, 2014. Standard Bank uses IBM Watson to speed handling of customer queries. [online]
Available at: <https://www.computerworld.com/article/3425915/standard-bank-uses-ibm-watson-to-
speed-handling-of-customer-queries.html> [Accessed 01 September 2019].
Creswell, J.W., 2012. Educational research: Planning, conducting, and evaluating quantitative and qualitative
research. Upper Saddle River: Prentice Hall.
Davis, F.D., 1986. A technology acceptance model for empirically testing new end-user information systems:
Theory and results. Sloan School of Management, Massachusetts Institute of Technology.

103
Deloitte, 2015. Banking on the future: I vision 2020 I CII-Deloitte. [online] Available at:
<https://www2.deloitte.com/content/dam/Deloitte/in/Documents/financial-services/in-fs-deloitte-
banking-colloquium-thoughtpaper-cii.pdf> [Accessed 21 March 2017].
DiMaggio, P.J. and Powell, W.W., 1983. The iron cage revisited: Institutional isomorphism and collective
rationality in organizational fields. American Sociological Review, 48(2), pp.147-160.
Dirican, C., 2015. The impacts of robotics, artificial intelligence on business and economics. Procedia-Social and
Behavioral Sciences, 195, pp.564-573.
Forbes, 2017. Top 10 hot artificial intelligence (ai) technologies. [online] Available at:
<https://www.forbes.com/sites/gilpress/2017/01/23/top-10-hot-artificial-intelligence-ai-
technologies/#2d0013d31928> [Accessed June 2018].
Furst, K., Lang, W.W. and Nolle, D.E., 1998. Technological innovation in banking and payments: Industry trends
and implications for banks. Quarterly Journal, Office of the Comptroller of the Currency, 17(3), p.23.
Gartner, 2017. Gartner’s cool vendors in ai for banking and investment services. [online] Available at:
<http://blogs.gartner.com/moutusi-sau/2017/05/11/gartners-cool-vendors-in-ai-for-banking-and-
investment-services/> [Accessed 20 July 2017].
Gibbs, J.L. and Kraemer, K.L., 2004. A cross‐country investigation of the determinants of scope of e‐commerce
use: An institutional approach. Electronic Markets, 14(2), pp.124-137.
Hager, G.D., Bryant, R., Horvitz, E., Mataric, M. and Honavar, V., 2017. Advances in artificial intelligence require
progress across all of computer science. Computing Community Consortium, 17(07), pp.43-52.
Haton, J.P., 2006. A brief introduction to artificial intelligence. IFAC Proceedings Volumes, pp.8-16.
Haugeland, J., 1985. Artificial intelligence: The very idea. Cambridge: MIT Press.
Hirschheim, R., 1985. Information systems epistemology: An historical perspective. Research Methods in
Information Systems, 1(1), pp.13-35.
Iacovou, C.L., Benbasat, I. and Dexter, A.S., 1995. Electronic data interchange and small organizations: Adoption
and impact of technology. MIS Quarterly, 19(1), pp.465-485.
Infosys, 2017. Five ways in which AI is changing banking as we know it. [online] Available at:
<https://www.infosys.com/insights/ai-automation/Pages/five-ways-in-which-ai.aspx> [Accessed 1
August 2017].
Kok, J.N., Boers, E.J., Kosters, W.A., Van der Putten, P. and Poel, M., 2009. Artificial intelligence: Definition,
trends, techniques, and cases. Artificial Intelligence, 1(1), p.45.
Kolbjørnsrud, V., Amico, R. and Thomas, R.J., 2017. The promise of artificial intelligence. [online] Available at:
<https://www.accenture.com/t20170411T174758Z__w__/us-en/_acnmedia/PDF-35/Accenture-
Promise-Artificial-Intelligence.pdfla=en> [Accessed March 2018].
Kuan, K.K. and Chau, P.Y., 2001. A perception-based model for EDI adoption in small businesses using a
technology–organization–environment framework. Information and Management, 38, pp.507-521.
Kurzweil, R., Richter, R., Kurzweil, R. and Schneider, M.L., 1990. The age of intelligent machines. Cambridge, MA:
MIT press.

104
Lacity, M.C. and Willcocks, L.P., 2017. A new approach to automating services. MIT Sloan Management Review,
1(1), p.5.
Lee, O.K., Wang, M., Lim, K.H. and Peng, Z., 2009. Knowledge management systems diffusion in Chinese
enterprises: A multistage approach using the Technology-Organization-Environment Framework.
Journal of Global Information Management, pp.70-84.
Lee, S. and Kim, K.J., 2007. Factors affecting the implementation success of Internet-based information systems.
Computers in Human Behavior, 23, pp.1853-1880.
Liang, H., Saraf, N., Hu, Q. and Xue, Y., 2007. Assimilation of enterprise systems: The effect of institutional
pressures and the mediating role of top management. MIS Quarterly, 31(1), pp.59-87.
Lin, D., Lee, C.K.M. and Lin, K., 2016. Research on effect factors evaluation of internet of things (IOT) adoption
in Chinese agricultural supply chain. In: Industrial Engineering and Engineering Management (IEEM),
2016 IEEE International Conference. Bali, December 2016. pp.612-615.
Lin, H.F. and Lin, S.M., 2008. Determinants of e-business diffusion: A test of the technology diffusion perspective.
Technovation, 28(3), pp.135-145.
Liu, M., 2008. Determinants of E-commerce development: An empirical study by firms in Shaanxi, China. 4th
International Conference on Wireless Communications, Networking and Mobile Computing. Dalian,
October 2018.
Low, C., Chen, Y. and Wu, M., 2011. Understanding the determinants of cloud computing adoption. Industrial
Management and Data Systems, 111(7), pp.1006–1023.
Luger, G.F. and Stubblefield, W.A., 1993. Artificial intelligence: Its roots and scope. Artificial Intelligence:
Structures And Strategies, 6(1), pp.1-34.
Mackenzie, A., 2015. The fintech revolution. London Business School Review, 26, pp.50-53.
Makridakis, S., 2017. The forthcoming artificial intelligence (AI) revolution: Its impact on society and firms.
Neapolis University Institutional Repository, 90, pp.46-60.
Mansfield, E., Rapoport, J., Romeo, A., Villani, E., Wagner, S. and Husic, F., 1977. The production and application
of new industrial technology. New York: W.W. Norton & Company Inc.
Manyika, J., Chui, M., Miremadi, M., Bughin, J., George, K., Willmott, P. and Dewhurst, M., 2017. A future that
works: Automation, employment, and productivity. New York: McKinsey Global Institute.
Marous, J., 2016. The biometric future of banking. [online] Available at: The financial brand,
<https://thefinancialbrand.com/61449/biometric-banking-password-trends/> [Accessed November
2016].
Matta, V., Koonce, D. and Jeyaraj, A., 2012. Initiation, experimentation, implementation of innovations: The case
for radio frequency identification systems. International Journal of Information Management, pp.164–
174.
Metz, C., 2016. Google, Facebook and Microsoft are remaking themselves around AI. [online] Available at:
Wired.com, <https://www.wired.com/2016/11/google-facebook-microsoft-remaking-around-ai/>
[Accessed March 2017].

105
Molla, A. and Licker, P.S., 2005. eCommerce adoption in developing countries: A model and instrument.
Information and Management, pp.877-899.
Mudzana, T. and Kotze, E., 2015. Some determinants of business intelligence adoption using the technology-
organisation-environment framework: A developing country perspective. Journal for New Generation
Sciences, pp.107-119.
Murphy, P.R., Daley, J. and Dalenberg, D.R., 1991. Exploring the effects of postcard pre‐notification on industrial
firms' response to mail surveys. Journal of the Market Research Society, pp.335–345.
Okoli, C. and Schabram, K., 2010. A guide to conducting a systematic literature review of information systems
research. Sprouts: Working Papers on Information Systems, 10(26), pp.10-26.
Oliveira, T. and Martins, M.F., 2009. Determinants of information technology adoption in Portugal. In:
Proceedings of the International Conference on e-Business. Las Vegas, July 2009. pp.264-270.
Oliveira, T. and Martins, M.F., 2010. Firms patterns of e-business adoption: Evidence for the European Union-
27. The Electronic Journal Information Systems Evaluation, 13(1), pp.47-56.
Oliveira, T. and Martins, M.F., 2011. Literature review of information technology adoption models at firm level.
The Electronic Journal Information Systems Evaluation, 14, pp.110-121.
Orlikowski, W.J. and Baroudi, J.J., 1991. Studying information technology in organizations: Research approaches
and assumptions. Information Systems Research, 2, pp.1-28.
Pan, M.J. and Jang, W.Y., 2008. Determinants of the adoption of enterprise resource planning within the
technology-organization-environment framework: Taiwan's communications industry. Journal of
Computer Information Systems, 48, pp.94-102.
Patil, P.S. and Dharwadkar, N.V., 2017. Analysis of banking data using machine learning. In: I-SMAC (IoT in Social,
Mobile, Analytics and Cloud)(I-SMAC), 2017 International Conference. Coimbatore, February 2017.
pp.876-881.
Pudjianto, B.W. and Hangjung, Z., 2009. Factors affecting e-government assimilation in developing countries.
4th Communication Policy Research, South Conference. Negombo, February 2010.
PWC, 2017. Sizing the prize. What’s the real value of AI for your business and how can you capitalise? [online]
Available at: <https://www.pwc.com/gx/en/issues/analytics/assets/pwc-ai-analysis-sizing-the-prize-
report.pdf> [Accessed 13 November 2017].
Rebelo, J., Ruivo, P. and Oliveira, T., 2013. ERP use in the manufacturing sector: The case of Iberian SMEs. In:
Information Systems and Technologies (CISTI), 2013 8th Iberian Conference. Lisbon, June 2013. pp.1-6.
Rees, J., Briggs, R. and Hicks, D., 1984. New technology in the American machinery industry: Trends and
implications, a study prepared for the use of the joint economic committee, congress of the united
states. Washington, DC: Government Printing Office.
Rich, E. and Knight, K., 1991. Artificial intelligence. New Delhi: Tata McGraw-Hill.
Rogers, E.M., 1995. Diffusion of innovations: Modifications of a model for telecommunications. In: M.W.
Stoetzer and A. Mahler A. eds. Die diffusion von innovationen in der telekommunikation. Schriftenreihe
des Wissenschaftlichen Instituts für Kommunikationsdienste. Berlin: Springer. pp25-38.

106
Rogers, E.M., 2004. A prospective and retrospective look at the diffusion model. Journal of Health
Communication, 9(1), pp.13-19.
Rogers, E.M., 2010. Diffusion of innovations. Berlin: Simon and Schuster.
Russell, S. and Norvig, P. eds., 1995. Artificial intelligence: A modern approach. Englewood Cliffs: Prentice-Hall.
Schalkoff, R.J., 1990. Artificial intelligence engine. New York: McGraw-Hill.
Sheehan, K.B. and McMillan, S.J., 1999. Response variation in e‐mail surveys: An exploration. Journal of
Advertising Research, pp.45–54.
Sheehan, K.B. and Hoy, M.G., 1997. E-mail surveys: Response patterns, process and potential. In: Proceedings of
the Conference-American Academy of Advertising. St Louis, December 1997. pp.231-231.
Smith, R.G. and Eckroth, J., 2017. Building AI applications: Yesterday, today, and tomorrow. AI Magazine, 38(1),
pp.6-22.
Soares-Aguiar, A. and Palma-dos-Reis, A., 2008. Why do firms adopt e-procurement systems? Using logistic
regression to empirically test a conceptual model. IEEE Transactions on Engineering Management, 55,
pp.120-133.
Taylor, S. and Lynn, P., 1998. The effect of a preliminary notification letter on response to a postal survey of
young people. Journal of the Market Research Society, pp.165–178.
Techemergence, 2018. AI in banking – An analysis of America’s 7 top banks. [online] Available at:
<https://emerj.com/ai-sector-overviews/ai-in-banking-analysis/> [Accessed November 2018].
Techfinancials, 2015. Absa brings voice biometrics for phone banking. [online] Available at:
<https://techfinancials.co.za/2015/12/18/absa-brings-voice-biometrics-for-phone-banking/>
[Accessed 01 September 2019].
Teo, H.H., Wei, K.K. and Benbasat, I., 2003. Predicting intention to adopt interorganizational linkages: An
institutional perspective. MIS Quarterly, 27(1), pp.19-49.
Teo, T.S., Lin, S. and Lai, K.H., 2009. Adopters and non-adopters of e-procurement in Singapore: An empirical
study. Omega, 37(5), pp.972-987.
Teo, T.S.H., Ranganathan, C. and Dhaliwal, J., 2006. Key dimensions of inhibitors for the deployment of web
based business-to-business electronic commerce. IEEE Transactions on Engineering Management, 53,
pp.395-411.
The Financial Brand, 2017. The use of AI in banking is set to explode. [online] Available at:
<https://thefinancialbrand.com/63322/artificial-intelligence-ai-banking-big-data-analytics> [Accessed
17 July 2017].
Tornatzky, L. and Fleischer, M., 1990. The process of technology innovation. Lexington, MA: Lexington Books.
Tushman, M. and Nadler, D., 1986. Organizing for innovation. California Management Review, 28(1), pp.74–94.
Van Bommel, E. and Blanchard, M., 2017. Tomorrow’s AI-enabled banking. [online] Available at:
<https://www.ipsoft.com/wp-
content/themes/ipsoft_v2/images/v2/pdf/IPsoft_Tomorrow_AI_enabled_banking.pdf> [Accessed
November 2017].
107
Van Selm, M., Jankowski, N.W. and Tsaliki, L., 2002. Political parties online: Digital democracy as reflected in
three Dutch political party web sites. Communications, pp.189-209.
Vanneschi, L., Horn, D.M., Castelli, M. and Popovič, A., 2018. An artificial intelligence system for predicting
customer default in e-commerce. Expert Systems with Applications, 104(1), pp.1-21.
Venkatesh, V., Morris, M.G., Davis, G.B. and Davis, F.D., 2003. User acceptance of information technology:
Toward a unified view. MIS Quarterly, 27, pp.425-478.
Wang, Y.M., Wang, Y.S. and Yang, Y.F., 2010. Understanding the determinants of RFID adoption in the
manufacturing industry. Technological Forecasting and Social Change, 77, pp.803-815.
Winston, P. H., 1992. Artificial intelligence (3rd edn). New York: Addison-Wesley Longman.
Yan, M., Castro, P., Cheng, P. and Ishakian, V., 2016. Building a chatbot with server less computing. In:
Proceedings of the 1st International Workshop on Mashups of Things and APIs. Trento, December 2016.
p.5.
Zhang, C., 2011. An empirical assessment of the software design pattern concept. Doctoral thesis, Durham
University. [online] Available at: <http://etheses.dur.ac.uk/859/>
Zhu, K. and Kraemer, K., 2005. Post-adoption variations in usage and value of e-business by organizations: Cross-
country evidence from the retail industry. Information Systems Research, 16(1), pp.61-84.
Zhu, K. and Kraemer, K.L., 2002. E-commerce metrics for net-enhanced organizations: Assessing the value of e-
commerce to firm performance in the manufacturing sector. Information Systems Research, 13(3),
pp.275-295.
Zhu, K., Dong, S.T., Xu, S.X. and Kraemer, K.L., 2006. Innovation diffusion in global contexts: Determinants of
post-adoption digital transformation of European companies. European Journal of Information Systems,
15(6), pp.601-616.
Zhu, K., Kraemer, K.L. and Dedrick, J., 2004. Information technology payoff in e-business environments: An
international perspective on value creation of e-business in the financial services industry. Journal of
Management Information Systems, 21(1), pp.17-54.
Zhu, K., Kraemer, K.L. and Xu, S., 2003. Electronic business adoption by European firms: A cross-country
assessment of the facilitators and inhibitors. European Journal of Information Systems, 12(4), pp.251-
268.

108
APPENDIX A: SUMMARY OF INTERVIEW QUESTIONS
The section below summarises the interviews conducted with the expert panel to validate a basket of AI
technology as perceived by South African banking firms.
Question 1. What do you think about the potential uses for AI technologies in banking?
• Fraud detection through Machine learning
• Risk mitigation achieved through pattern recognition
• Automation of repetitive tasks like account opening via RPA
• Enhanced customer service through chat bots and virtual assistants
• Better investment decisions by NLP and Expert systems
• Reduced data errors via RPA
Question 2. What do you think about the potential benefits of AI technologies in banking?
• Lower cases of fraud and financial crimes
• Enhanced customer service
• Reduction in operating costs
• Fewer errors without human intervention, increases quality of output
• Better decision making by augmenting AI
• Cost savings to the customer and bank
• Greater amount of production as machine can service customers 24/7
Question 3. In my preliminary review of the literature, I identified 6 AI technologies with applications in
banking. Could you please review this list? (refer to table 4.1 for the list)
Q3a. Do you agree that these are AI technologies with relevance to banking?
Four out of the five participants highlighted that although Image recognition and Speech recognition were
prominent AI technologies, their implementations were not considered top priority in South African banks.
One participant believed that they could be used in call centres, however their firm had no plans on adopting
image and speech recognition.
Q3b. Are there any AI technologies in use or under consideration within your bank that I have not listed?
All five participants stated that pattern recognition when combined with machine learning was essential to
banking firms and currently being used by their business units.
109
4
Image recognition and speech recognition were subsequently dropped from the basket and replaced with
pattern recognition. Pattern recognition was discovered to be the third most adopted AI technology by South
African banking firms.
4 The technologies presented in question 4 match the three highest adopted AI technologies (table 5.8)
Question 4. Which technologies from the list do you believe are the three most relevant to banking, and
why?
• Robotic process automation
• Virtual assistants and chatbots
• Pattern recognition4
Question 5. What factors are driving your bank / unit to adopt AI technologies?
• Cost savings
• To remain competitive and offer similar products and service of rival banks
• Reducing online fraud and financial crime
• Expectations of customers to offer a better digital experience
• Internal business requirements and changes
•

110
APPENDIX B: ONLINE QUESTIONNAIRE

111

112

113

114

115
116
APPENDIX C: SURVEY COVER LETTER
Date: 18 June 2018
Good Day
My name is Clayton Mariemuthu. I am completing my Master of Commerce degree in Information Systems at
the University of the Witwatersrand, Johannesburg. I am conducting research on the adoption of Artificial
Intelligence by South African banking firms: A technology, organisation and environment (TOE) framework
perspective.
As a key IT decision maker, you are invited to take part in this survey. The purpose of this study is to describe
the current state of adoption of AI technologies across the South African banking sector and to understand the
factors influencing their adoption.
Your response is important and there are no right or wrong answers. This survey is both confidential and
anonymous. Anonymity and confidentiality are guaranteed by not needing to enter your name on the
questionnaire. Your participation is completely voluntary and involves no risk, penalty, or loss of benefits
whether or not you participate. You may withdraw from the survey at any stage. Submission of the questionnaire
will be taken as your consent to participate and that you have appropriate permission from your firm.
The first part of the survey captures some demographic data. Please tick whichever boxes are applicable. The
second part of the survey comprises of 35 statements. Please indicate the extent to which you agree with each
statement, by ticking in the appropriate box. The entire survey should take between 10 to 15 minutes to
complete. The survey was approved by the SEBS Ethics Committee (Non-Medical), Protocol Number:
CINFO/1174
Thank you for considering participating. Should you have any questions, or should you wish to obtain a copy of
the results of the survey, please contact me.
My contact details: 1734168@students. wits.ac.za – Cell number: 076 158 4486
My supervisor’s name and email are: Professor Jason Cohen – [email protected]
Kind regards
Clayton Mariemuthu
MCom Student
School of Economic and Business Sciences
University of the Witwatersrand, Johannesburg

117
APPENDIX D: ETHICS CLEARENCE CERTIFICATE
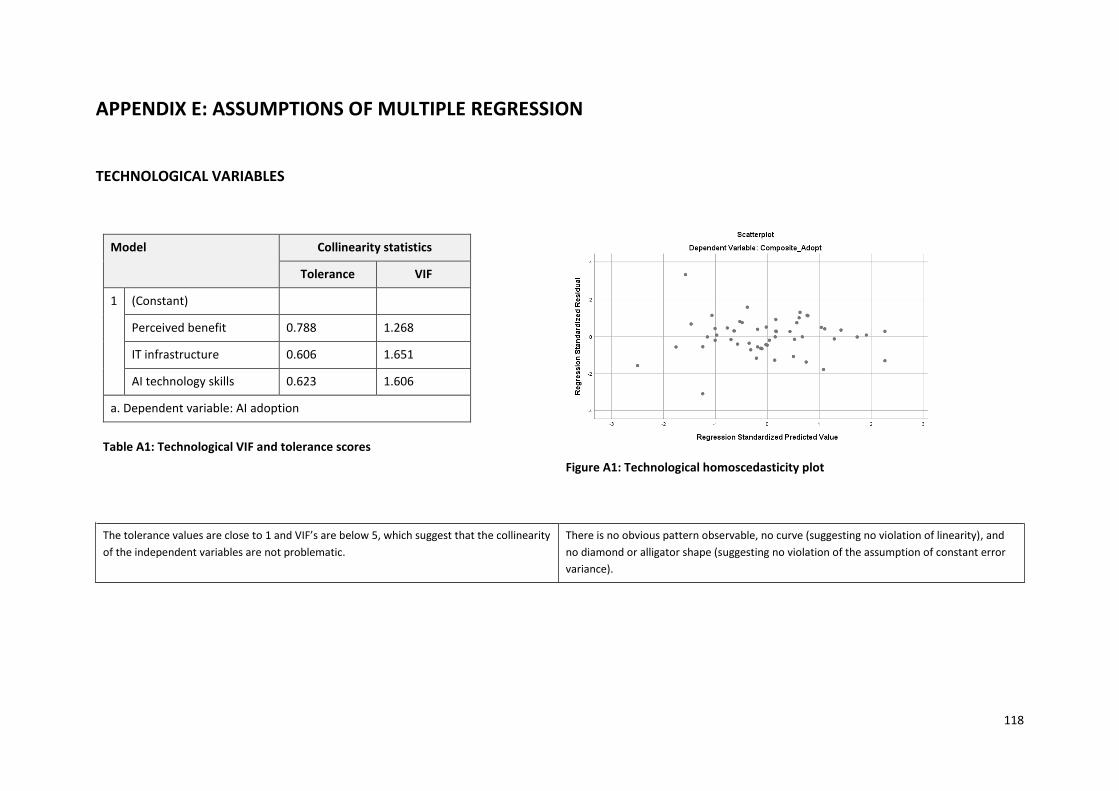
118
APPENDIX E: ASSUMPTIONS OF MULTIPLE REGRESSION
TECHNOLOGICAL VARIABLES
Model Collinearity statistics
Tolerance VIF
1 (Constant)
Perceived benefit 0.788 1.268
IT infrastructure 0.606 1.651
AI technology skills 0.623 1.606
a. Dependent variable: AI adoption
Table A1: Technological VIF and tolerance scores
Figure A1: Technological homoscedasticity plot
The tolerance values are close to 1 and VIF’s are below 5, which suggest that the collinearity
of the independent variables are not problematic.
There is no obvious pattern observable, no curve (suggesting no violation of linearity), and
no diamond or alligator shape (suggesting no violation of the assumption of constant error
variance).

119
Figure A2: Technological residual p-p plot
Figure A3: Technological residual histogram
This plot suggests that residuals are approximately normally distributed. The histogram confirms that this plot’s residual is approximately normally distributed.
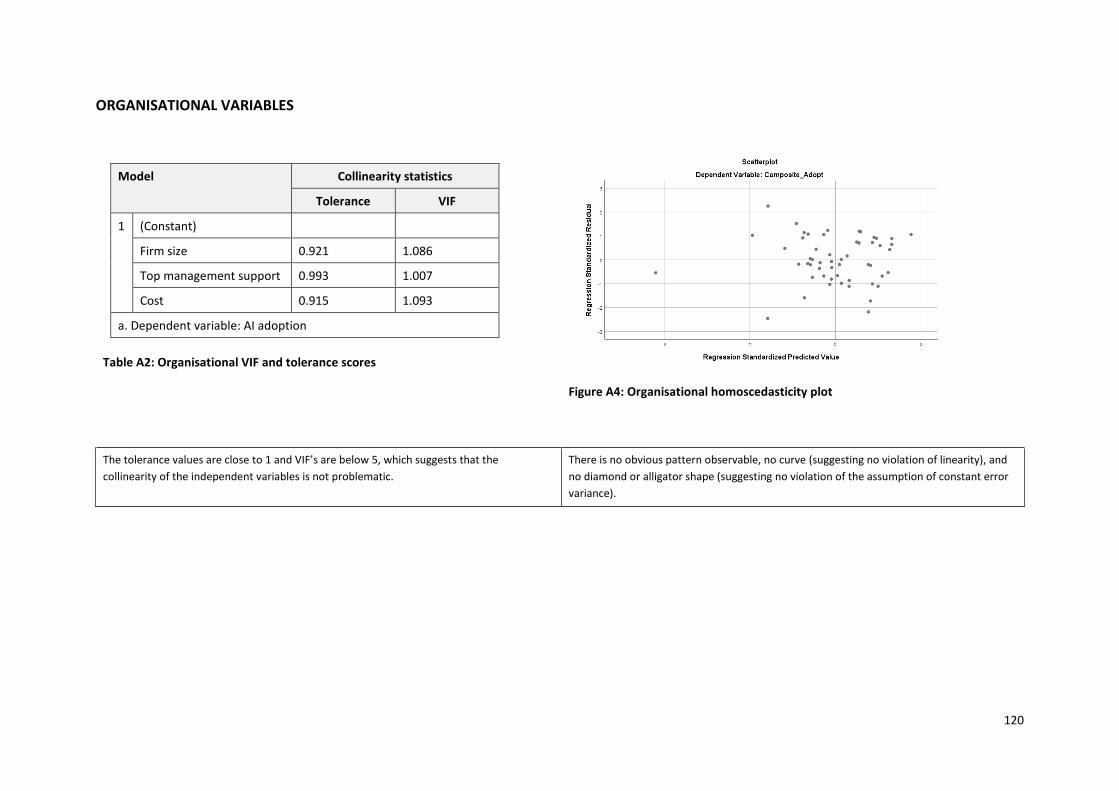
120
ORGANISATIONAL VARIABLES
Model Collinearity statistics
Tolerance VIF
1 (Constant)
Firm size 0.921 1.086
Top management support 0.993 1.007
Cost 0.915 1.093
a. Dependent variable: AI adoption
Table A2: Organisational VIF and tolerance scores
Figure A4: Organisational homoscedasticity plot
The tolerance values are close to 1 and VIF’s are below 5, which suggests that the
collinearity of the independent variables is not problematic.
There is no obvious pattern observable, no curve (suggesting no violation of linearity), and
no diamond or alligator shape (suggesting no violation of the assumption of constant error
variance).

121
Figure A5: Organisational residual p-p plot
Figure A6: Organisational residual histogram
This plot suggests that residuals are approximately normally distributed. The histogram confirms that this plot’s residual is approximately normally distributed.
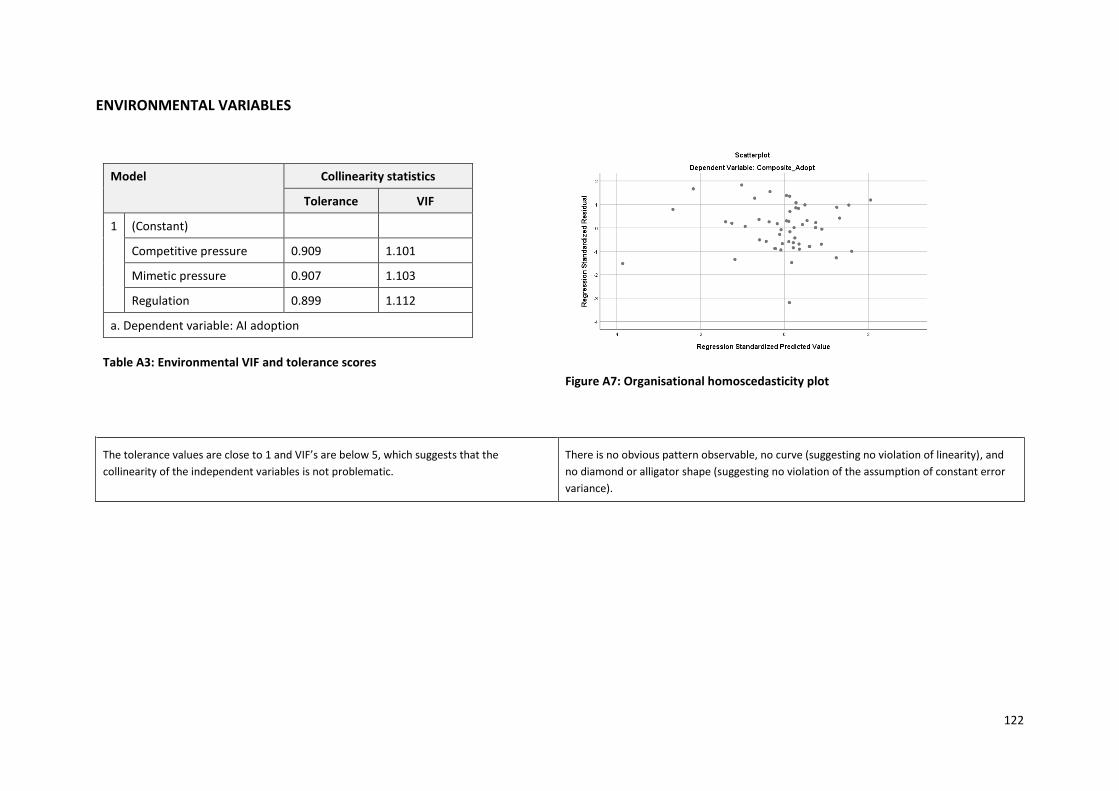
122
ENVIRONMENTAL VARIABLES
Model Collinearity statistics
Tolerance VIF
1 (Constant)
Competitive pressure 0.909 1.101
Mimetic pressure 0.907 1.103
Regulation 0.899 1.112
a. Dependent variable: AI adoption
Table A3: Environmental VIF and tolerance scores
Figure A7: Organisational homoscedasticity plot
The tolerance values are close to 1 and VIF’s are below 5, which suggests that the
collinearity of the independent variables is not problematic.
There is no obvious pattern observable, no curve (suggesting no violation of linearity), and
no diamond or alligator shape (suggesting no violation of the assumption of constant error
variance).
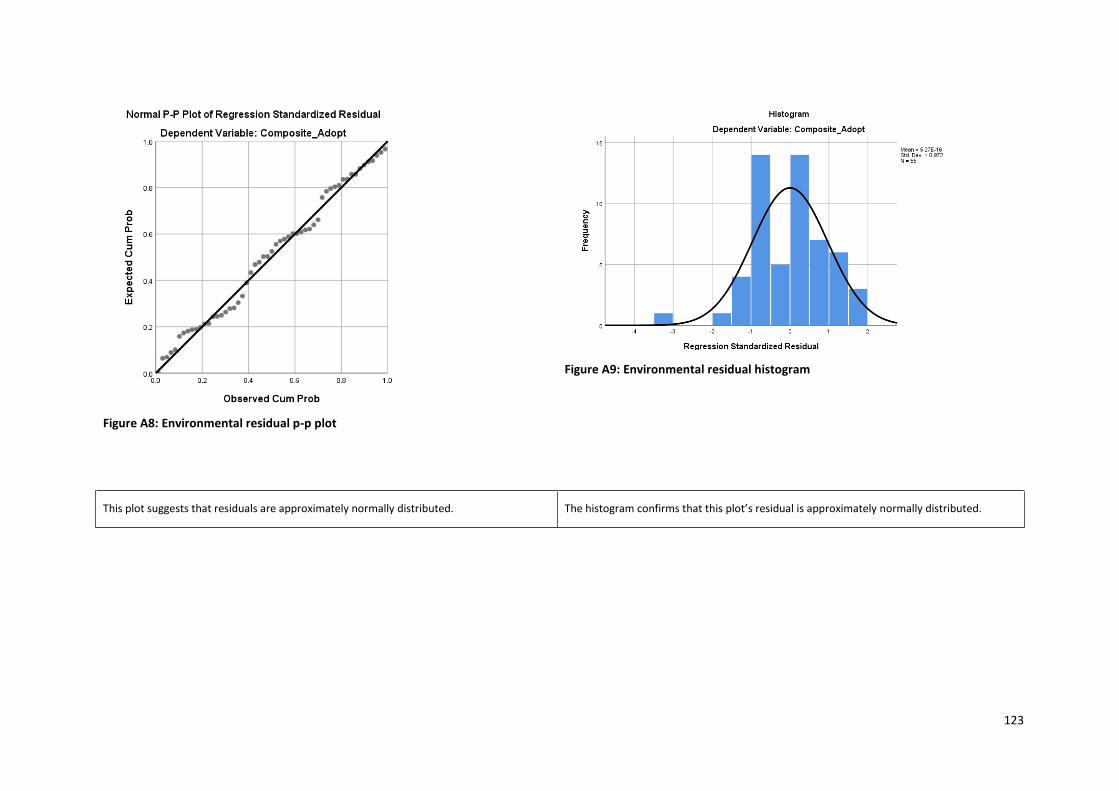
123
Figure A8: Environmental residual p-p plot
Figure A9: Environmental residual histogram
This plot suggests that residuals are approximately normally distributed. The histogram confirms that this plot’s residual is approximately normally distributed.
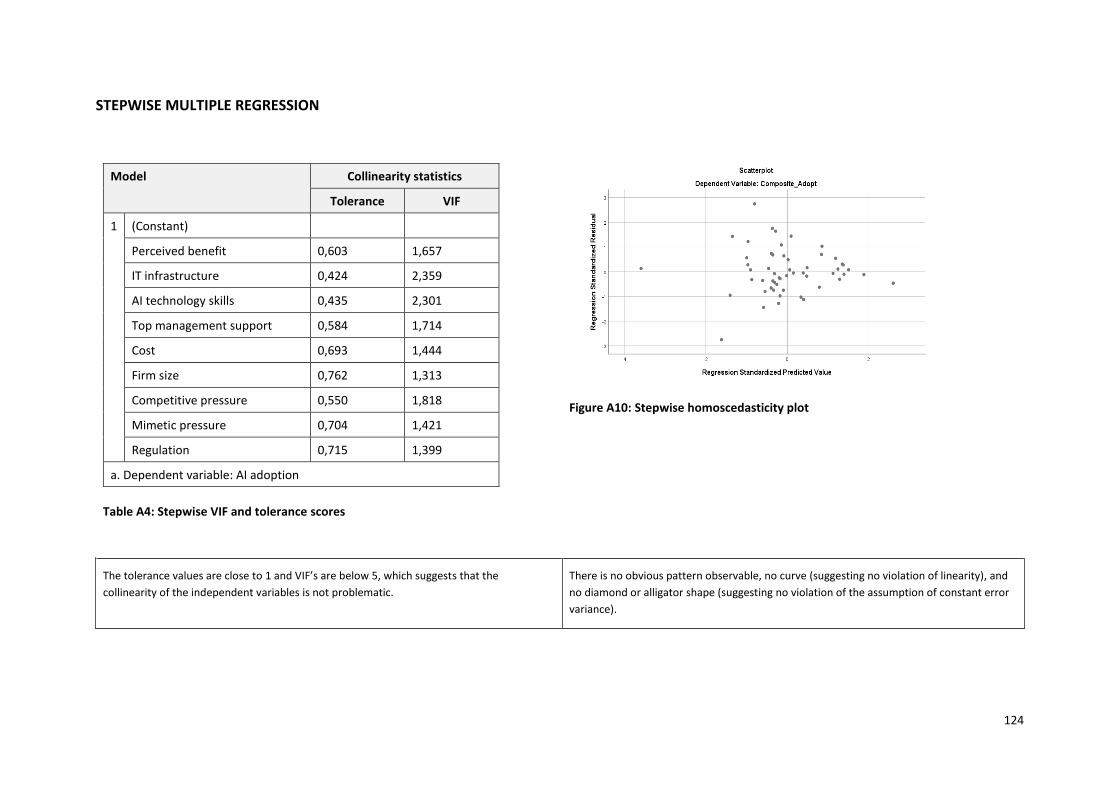
124
STEPWISE MULTIPLE REGRESSION
Model Collinearity statistics
Tolerance VIF
1 (Constant)
Perceived benefit 0,603 1,657
IT infrastructure 0,424 2,359
AI technology skills 0,435 2,301
Top management support 0,584 1,714
Cost 0,693 1,444
Firm size 0,762 1,313
Competitive pressure 0,550 1,818
Mimetic pressure 0,704 1,421
Regulation 0,715 1,399
a. Dependent variable: AI adoption
Table A4: Stepwise VIF and tolerance scores
Figure A10: Stepwise homoscedasticity plot
The tolerance values are close to 1 and VIF’s are below 5, which suggests that the
collinearity of the independent variables is not problematic.
There is no obvious pattern observable, no curve (suggesting no violation of linearity), and
no diamond or alligator shape (suggesting no violation of the assumption of constant error
variance).

125
Figure A11: Stepwise residual p-p plot Figure A12: Stepwise residual histogram
This plot suggests that residuals are approximately normally distributed. The histogram confirms that this plot’s residual is approximately normally distributed.
Related Documents