823 THE ACCOUNTING REVIEW Vol. 83, No. 3 2008 pp. 823–853 The Use of DuPont Analysis by Market Participants Mark T. Soliman University of Washington ABSTRACT: DuPont analysis, a common form of financial statement analysis, decom- poses return on net operating assets into two multiplicative components: profit margin and asset turnover. These two accounting ratios measure different constructs and, accordingly, have different properties. Prior research has found that a change in asset turnover is positively related to future changes in earnings. This paper comprehensively explores the DuPont components and contributes to the literature along three dimen- sions. First, the paper contributes to the financial statement analysis literature and finds that the information in this accounting signal is in fact incremental to accounting signals studied in prior research in predicting future earnings. Second, it contributes to the literature on the stock market’s use of accounting information by examining immediate and future equity return responses to these components by investors. Finally, it adds to the literature on analysts’ processing of accounting information by again testing immediate and delayed response of analysts through contemporaneous forecast revi- sions as well as future forecast errors. Consistent across both groups of market par- ticipants, the results show that the information is useful as evidenced by associations between the DuPont components and stock returns as well as analyst forecast revi- sions. However, I find predictable future forecast errors and future abnormal returns indicating that the information processing does not appear to be complete. Taken to- gether, the analysis indicates that the DuPont components represent an incremental and viable form of information about the operating characteristics of a firm. Keywords: financial statement analysis; DuPont analysis; market returns; analyst forecasts. JEL Classification: M4. This paper is based in part on my dissertation at the Ross School of Business at the University of Michigan. I thank the members of my committee: Christopher Achen, Allan Afuah, Patricia Dechow, Russell Lundholm (Chair), and Richard Sloan. I also thank Mary Barth, Bob Bowen, Mark Bradshaw, Dan Dhaliwal (the editor), Ilia Dichev, Jeffrey Doyle, Nader Hafzalla, Michelle Hanlon, Ron Kasznik, Maureen McNichols, Sarah McVay, Venky Nagar, Madhav Rajan, Scott Richardson, Terry Shevlin, Teri Yohn, two anonymous referees, and the doctoral students at the University of Michigan for their helpful discussions and comments. This paper also has benefited greatly from the comments of workshop participants at University of California, Berkeley, University of Chicago, Columbia University, Duke University, Massachusetts Institute of Technology, Northwestern University, University of Penn- sylvania, University of Southern California, and Stanford University. I gratefully acknowledge the financial support of the Ross School of Business at the University of Michigan, the William A. Paton Accounting Fund, and the Graduate School of Business at Stanford University. Excellent research assistance by Julie Suh was greatly appre- ciated. This paper is dedicated to the loving memory of my dear friend Nader Hafzalla. Editor’s note: This paper was accepted by Dan Dhaliwal. Submitted February 2006 Accepted September 2007

Welcome message from author
This document is posted to help you gain knowledge. Please leave a comment to let me know what you think about it! Share it to your friends and learn new things together.
Transcript

823
THE ACCOUNTING REVIEWVol. 83, No. 32008pp. 823–853
The Use of DuPont Analysisby Market Participants
Mark T. SolimanUniversity of Washington
ABSTRACT: DuPont analysis, a common form of financial statement analysis, decom-poses return on net operating assets into two multiplicative components: profit marginand asset turnover. These two accounting ratios measure different constructs and,accordingly, have different properties. Prior research has found that a change in assetturnover is positively related to future changes in earnings. This paper comprehensivelyexplores the DuPont components and contributes to the literature along three dimen-sions. First, the paper contributes to the financial statement analysis literature and findsthat the information in this accounting signal is in fact incremental to accounting signalsstudied in prior research in predicting future earnings. Second, it contributes to theliterature on the stock market’s use of accounting information by examining immediateand future equity return responses to these components by investors. Finally, it addsto the literature on analysts’ processing of accounting information by again testingimmediate and delayed response of analysts through contemporaneous forecast revi-sions as well as future forecast errors. Consistent across both groups of market par-ticipants, the results show that the information is useful as evidenced by associationsbetween the DuPont components and stock returns as well as analyst forecast revi-sions. However, I find predictable future forecast errors and future abnormal returnsindicating that the information processing does not appear to be complete. Taken to-gether, the analysis indicates that the DuPont components represent an incrementaland viable form of information about the operating characteristics of a firm.
Keywords: financial statement analysis; DuPont analysis; market returns; analystforecasts.
JEL Classification: M4.
This paper is based in part on my dissertation at the Ross School of Business at the University of Michigan. Ithank the members of my committee: Christopher Achen, Allan Afuah, Patricia Dechow, Russell Lundholm (Chair),and Richard Sloan. I also thank Mary Barth, Bob Bowen, Mark Bradshaw, Dan Dhaliwal (the editor), Ilia Dichev,Jeffrey Doyle, Nader Hafzalla, Michelle Hanlon, Ron Kasznik, Maureen McNichols, Sarah McVay, Venky Nagar,Madhav Rajan, Scott Richardson, Terry Shevlin, Teri Yohn, two anonymous referees, and the doctoral studentsat the University of Michigan for their helpful discussions and comments. This paper also has benefited greatlyfrom the comments of workshop participants at University of California, Berkeley, University of Chicago, ColumbiaUniversity, Duke University, Massachusetts Institute of Technology, Northwestern University, University of Penn-sylvania, University of Southern California, and Stanford University. I gratefully acknowledge the financial supportof the Ross School of Business at the University of Michigan, the William A. Paton Accounting Fund, and theGraduate School of Business at Stanford University. Excellent research assistance by Julie Suh was greatly appre-ciated. This paper is dedicated to the loving memory of my dear friend Nader Hafzalla.
Editor’s note: This paper was accepted by Dan Dhaliwal.Submitted February 2006Accepted September 2007

824 Soliman
The Accounting Review, May 2008
Data Availability: The data used in this study are publicly available from the sourcesindicated in the text.
I. INTRODUCTION
In this paper I examine whether the information contained in DuPont analysis is asso-ciated with stock market returns and analyst forecasts. Prior studies document that thecomponents from DuPont analysis, which decomposes return on net operating assets
into profit margin and asset turnover, have explanatory power with respect to changes infuture profitability. This paper adds to the literature by comprehensively examining investorand analyst reactions to the DuPont components along three dimensions. First, it replicatesthe previously documented forecasting ability and examines whether it is robust and incre-mental to the existence of other predictors already considered in the literature. Second, itexplores the use of these components by stock market investors by looking at both contem-poraneous and future returns. In contemporaneous long-window association and short-window information tests, the results indicate a positive association between the DuPontcomponents and equity returns. But small future abnormal returns to a trading strategyindicate a possibly incomplete processing of information. Finally, it examines both currentforecast revisions and future forecast errors by sell-side analysts. Although they appear torevise their forecasts of future earnings consistent with the information in these DuPontcomponents, the revision seems to be incomplete as evidenced by predictable future forecasterrors. Consistent across both groups of market participants, the contemporaneous resultsshow that the information is useful but the future tests indicate that the information proc-essing does not appear to be complete.
Work by Nissim and Penman (2001) provides an approach to equity valuation usingthe residual income framework that gives a simple direct mapping of financial ratios toequity valuation. In particular they use DuPont analysis, which decomposes a firm’s returnon net operating assets (RNOA) into profit margin (PM) and asset turnover (ATO) whereRNOA � PM � ATO.1 PM and ATO are accounting signals that measure different constructsabout a firm’s operations. PM is often derived from pricing power, such as product inno-vation, product positioning, brand name recognition, first mover advantage, and marketniches.2 ATO measures asset utilization and efficiency, which generally comes from theefficient use of property, plant, and equipment; efficient inventory processes; and otherforms of working capital management.3
There are reasons to expect competitive forces to affect these two sources of profita-bility differently. Large profit margins often draw new entrants into the marketplace orquick imitation of new ideas from existing rivals. The resulting competition causes highprofit margins to revert to normal levels, suggesting more transitory benefits. Unlike profitmargin, however, competition may be less threatening to an efficient deployment of assets.It is more difficult to imitate another firm’s efficient production processes because suchimitation often involves large and costly overhauls of current factories and operations.
1 Specifically, RNOA � Operating Income/Average Net Operating Assets, PM � Operating Income/Sales, andATO � Sales /Average Net Operating Assets. Hereafter, PM and ATO are referred to as the ‘‘DuPont Compo-nents.’’ Another common form is to decompose ROE � (Profit Margin � Asset Turnover � Leverage) or [NI /Sales � Sales /Assets � Assets /Equity]. As discussed in the ‘‘Valuation Theory and RNOA’’ section, I use RNOAin my analyses in order to focus on operations and thus abstract from the firm’s financing decision.
2 For example, Abercrombie and Fitch earns high margins by selling used-looking clothing that is consideredtrendy and is demanded by teenagers. Their strong brand is difficult to imitate and allows them to charge apremium.
3 A good example of high abnormal ATO is Dell. Their business model is based on maintaining extremely lowinventory and high turnover. Historically, their ATO has exceeded the industry median by about 1.2 turns.

The Use of DuPont Analysis by Market Participants 825
The Accounting Review, May 2008
Theoretical work supports these conjectures. Romer (1986) contends that knowledge iseasily diffused and transferred throughout an economy, making returns based on knowledge-based assets transitory and diminishing.4 In this setting, to the degree that the source ofprofit margin is derived from ideas that can be imitated by others, it is more likely to bemore transitory. Moreover, Romer (1986) concludes that returns derived from capitalare more persistent because of the larger frictions to the movement of capital through aneconomy.5
Work by Fairfield and Yohn (2001); Nissim and Penman 2001 and Penman and Zhang(2003) is consistent with the intuition above and shows that assert turnover is more persis-tent than profit margin and that changes in ATO are predictive of future changes in RNOAafter controlling for RNOA.6 In this paper, I begin with a replication to investigate whetherthis finding is robust to the inclusion of variables in existing research on fundamentalanalysis. I find that despite the correlation that exists between these variables, the changein ATO is still significant in explaining future changes in RNOA after controlling for thenine fundamental signals from Abarbanell and Bushee (1997; hereafter, AB) and the vari-ables in the extended accrual decomposition of Richardson et al. (2005; hereafter, RSST).
The focus of this study, however, explores the use of the information in these com-ponents by those who have a vested interest in the prediction of future earnings. Numerousstudies have explored how market participants, either stock investors or analysts, incorporatethe information in earnings into their decisions. Along similar veins, this paper extends theliterature on equity holders and analysts by exploring the immediate and delayed reactionsto these accounting signals. These two complementary approaches guide the analysesthroughout the paper: First, contemporaneous tests examine whether the information inthese components is associated with current actions by market participants; and second,future tests examine whether market participants fully use the information.
To test whether stock market returns are associated with the DuPont components, Iconduct both long-window association and short-window information tests.7 The long-window association tests show that the DuPont components are incremental to earnings andearnings changes in explaining contemporaneous returns, and that adding them to the re-gression doubles the traditionally low adjusted R2s that come with these tests (Lev 1989;Kothari 2001).8 The short-window return tests show that changes in the DuPont componentsare informative to the marketplace and incremental to the earnings surprise. The two results
4 Of course, there are many ways a firm can protect abnormally high profit margins from competition, such asestablished marketing channels, brand name recognition, customer loyalty, unique supply sources, favorablecontracts with customers or suppliers, and legal frictions such as patents and copyrights. All these factors workto promote the persistence of profit margin.
5 Additionally, there are simple accounting reasons to expect ATO to be different in nature than PM. ATO iscalculated as sales (a flow variable) divided by net operating assets (a stock variable); both of these line itemshave relatively low variance (Nissim and Penman 2001). However, PM is calculated by dividing operating incomeby sales (two flow variables), and operating income simply has higher volatility than net operating assets orsales. This also could lead to differing persistence. Thus, the very construction of these ratios and the accountingbehind them also leads to expecting different time-series properties, i.e., that PM will be less persistent andmore volatile than ATO. Accordingly, any shift in ATO is more likely to be the result of an economic occurrencerather than changes due to simple variation in the accounting numbers.
6 For example, compare Toyota to Ford. Toyota has far more efficient and technologically advanced factories. Tocompete along this dimension, Ford would have to restructure and rebuild billions of dollars’ worth of factoriesand manufacturing plants. Of course, counter examples exist to this notion. For example, Lowe’s Hardwareentered into Home Depot’s market and successfully competed with their massive scale and efficiency.
7 See Kothari (2001) for a summary of this large literature on the relation between returns and earnings.8 A supplemental finding is that adding RNOA along with earnings in these regressions increases the adjusted R2
significantly. This lends support to claims that RNOA is a more appropriate measure when examining howaccounting profitability maps into equity returns in these types of long-window regressions.

826 Soliman
The Accounting Review, May 2008
suggest that the DuPont components not only reflect information in the marketplace (long-window return tests), but also that changes in ATO appear to provide information to stockmarket participants within a small window around the earnings announcement (short-window). Finally, a future return tests produce an annual abnormal return of about 5 percentfrom using the information in the change in ATO. Thus, although the future predictiveability of earnings is reflected in short-window announcement returns, the market does notappear to completely use the information in this variable.
This paper also contributes to the literature on sell-side analysts’ use of accountinginformation. If the DuPont components map into equity value, then analysts should usethis information when creating forecasts and revising their priors about the future profita-bility of the firm. Consistent with the immediate and delayed analysis of returns above, twomeasures of analyst forecasts are examined. First, I use analyst forecast revisions measuredas the change in the forecast of next year’s earnings immediately before and after theearnings announcement. Consistent with the earnings prediction tests, I find that analysts’immediate reaction is to revise their forecasts based on changes in ATO after controllingfor the earnings surprise. Second, I look at future forecast errors of year t�1 earnings andexamine whether analysts fully understand the implications of the DuPont components inyear t for future profitability. I find that the DuPont components have predictive power forfuture forecast errors, suggesting that analysts do not completely utilize the information inthese components when issuing their forecasts. Taken together, the evidence suggests thatalthough analysts appear to use the information in revising their forecasts of the followingyear’s earnings, the updating is incomplete and analysts leave some information ‘‘on thetable.’’ This result is entirely consistent with future abnormal returns above. Thus, bothequity investors and analysts appear to use some of the information available, but not allof it.
The remainder of the paper is organized as follows. The next section develops thepredictions and research design. Section III describes the empirical analysis, Section IVpresents the results, and Section V concludes.
II. PREDICTIONS AND RESEARCH DESIGNSince the landmark studies of Ball and Brown (1968) and Beaver (1968), accounting
researchers have worked to understand how and why earnings and security returns areassociated. Beaver (1998) argues that one theoretical link between earnings and share pricesis that current earnings provide information to predict future earnings. Consistent with thistheme, researchers have looked for current financial statement information that aids inpredicting future earnings, arguing that this should be the primary goal of fundamentalanalysis (Penman 1992; Lee 1999). To this end, several approaches have emerged in theliterature. Lipe (1986) and Kormendi and Lipe (1987) decompose earnings into six com-ponents and find that more transitory components have a smaller relation with stock returns.Along the same lines, Fairfield et al. (1996) use the order of line items on the incomestatement to decompose earnings to improve predictions of ROE and find that line itemsfarther down the income statement are less persistent. Ou and Penman (1989) combine alarge group of financial ratios into one summary measure and estimate its association withfuture stock returns. Holthausen and Larcker (1992) extend this analysis and use the vari-ables to directly predict future returns.
Lev and Thiagarajan (1993) take a different approach and identify a group of financialratios used in practice by ‘‘experts’’ and examine their correspondence with contempora-neous long-window stock returns. AB (1997, 1998) extend this analysis by using the samevariables and find that some of the ratios (1) predict future earnings changes, (2) are used

The Use of DuPont Analysis by Market Participants 827
The Accounting Review, May 2008
by analysts, and (3) can predict future returns. Sloan (1996) decomposes earnings intoaccruals and cash flows and finds that firms with higher operating accruals tend to havelower future earnings and returns. RSST (2005) expand the definition of accruals to mapout the entire balance sheet and find that investing accruals are more effective than operatingaccruals in predicting future earnings and returns. Although the approaches mentionedabove were successful in predicting future earnings, they lack a unifying framework guidingthe analysis despite the fact that most of these studies were ultimately examining equityreturns.9
Valuation Theory and RNOAThe theory of finance describes stock price as a function of expected future dividends
leading to the familiar dividend-discount model that sets firm value to the present valueof the firms expected future dividends. An algebraically equivalent model, commonly re-ferred to as the residual income model, stems from the assumption of clean-surplus ac-counting and expresses firm value in terms of accounting numbers.10 The stock price canbe rewritten in terms of ROE and reported book value plus an infinite sum of discountedresidual income:
� E [(ROE � r )B ]t t�i e t�i�1P � B � �t t i(1 � r )i�1 e
where:
Pt � current stock price;Bt � book value at time t;
Et(.) � expectation based on information available at time t;ROEt�1 � the return on book equity for period t�1;Et(Dt�i) � expected future dividends for periods t�i conditional on information available
at time t; andre � cost of equity capital.
Work by Ohlson (1995) and Feltham and Ohlson (1995) highlights the theoreticalimportance of ROE in the implementation of valuation models in general, and in the residualincome model in particular. Standard DuPont analysis decomposes ROE into the threemultiplicative ratios of Profit Margin, Asset Turnover, and Leverage as follows:
ROE � [NI /Sales � Sales /Assets � Assets /BVEquity].
As the equation above shows, ROE can be affected by the firm’s choice of capitalstructure, yet changes in the firm’s capital structure may not be value relevant.11 Nissim and
9 Barth et al. (1999) use an Ohlson (1999) framework to justify and determine the accruals and cash flow valuationcoefficients and place their analysis within a broader valuation context.
10 The model is sometimes referred to as the Edwards-Bell-Ohlson (EBO) valuation equation. Clean surplus ac-counting requires that all gains and losses affecting book value be included in earnings such that changes inbook value are equal to earnings minus net dividends (bt � bt�1 � NIt � Dt).
11 Modigliani and Miller (1958) assert that it is the value of the operations that matters and not the financing ofthose assets. Penman (2001, 433–434) shows that despite the fact that ROE can be mechanically increasedthrough leverage (assuming positive spread), the increase in the discount rate results in no change in equityvalue.

828 Soliman
The Accounting Review, May 2008
Penman (2001) algebraically rearrange ROE to abstract away from financial leverage andarrive at RNOA as follows:12
ROE � RNOA � [FLEV � SPREAD].
RNOA captures the firm’s operating profitability without the effects of financial leverageand is becoming commonly used in the valuation literature (e.g., Fairfield and Yohn 2001;Nissim and Penman 2001; Penman and Zhang 2003; Fairfield et al. 2003a; Richardson etal. 2006). Using this residual-income valuation framework, they algebraically derive howequity prices should map into RNOA and decompose it into the DuPont components. Afterremoving leverage and any associated returns (e.g., interest income/expense), RNOA canbe multiplicatively decomposed into PM and ATO as follows: RNOA � PM � ATO wherePM � Operating Income/Sales and ATO � Sales/Net Operating Assets.
Nissim and Penman (2001) find that these two components of RNOA (PM and ATO)have different time-series properties. PM measures the firm’s ability to control the costsincurred to generate sales and gives insight into the sensitivity of operating income toproduct price and cost structure. �PM measures the growth rate in operating income relativeto the growth rate in sales. ATO captures the firm’s efficiency in using operating assets togenerate sales and is often interpreted as a measure of asset utilization by managers. �ATOreflects change in the productivity of the firm’s assets and ultimately measures growth insales relative to growth in operating assets. Ultimately this measure evaluates sales growthwhile controlling for growth in net operating assets used to generate those sales. As dis-cussed in the introduction, each component measures a different aspect of a firm’s opera-tions. Thus, simply using the aggregated level of RNOA may result in the loss of somepredictive information. Two research questions immediately follow: (1) Do these two com-ponents have incremental explanatory power with respect to future earnings? (2) If so, thendo market participants, such as equity analysts and stock market investors, use this infor-mation when valuing stocks? The focus of this paper is centered on the second question.
Predictions of Future RNOA Using DuPont ComponentsThe goal of these first tests is to ensure that the explanatory power documented by
Fairfield and Yohn (2001) and Penman and Zhang (2003) is truly incremental and robustto other earnings predictors from the literature before moving on to the larger question ofwhether this predictive power is used by market participants. To do this, I first control forthe fundamental signals proposed by Lev and Thiagarajan (1993). These signals were laterused by AB (1997) and shown to predict future earnings (as well as future returns [AB1998]).13 This first step is important because one of the AB variables is gross margin, whichis highly correlated to PM. In addition, their measures of inventory, accounts receivable,and capital expenditures are all parts of ATO. Thus, it is quite conceivable that earlier workon DuPont analysis was simply rediscovering the same underlying constructs using slightlydifferent measures. Second, I examine whether the information in the DuPont componentsis subsumed by accruals. In particular, I use the three components of total accruals in RSST(2005): working capital, noncurrent operating and financing, labeled �WC, �NCO, and
12 FLEV is financial leverage and SPREAD is the difference between return of the firm’s operations and borrowingcosts.
13 They include measures of inventory, accounts receivable, capital expenditures, gross margins, selling and ad-ministrative expenses, effective tax rates, earnings quality, audit quality, and labor force. See Table 3 for exactdefinitions.

The Use of DuPont Analysis by Market Participants 829
The Accounting Review, May 2008
�FIN. They find that �NCO accruals have more explanatory power of future earnings andreturns than do operating accruals. This expanded definition of accruals subsumes the op-erating accruals definition used by Sloan (1996) and provides a more complete picture ofthe degree of accruals in the firm by examining the entire balance sheet.
Fairfield and Yohn (2001) were the first to address the question of future predictivepower and find that �ATO is positively associated with future changes in RNOA, but thatlevels of PM and ATO have no predictive value. This result is intuitive because the levelsof PM and ATO are more informative toward a firm’s operating structure or industry mem-bership (Ge and Soliman 2007). Further, increases in ATO indicate that the firm’s abilityto generate sales from a given investment has increased and that this is an indicator offuture efficiency of generating sales from assets. Thus, this type of increase in profitabilitytends to persist. In this section, I replicate Fairfield and Yohn’s (2001) findings by applyingtheir models to my sample. I first estimate the following regression on the level of theDuPont components:14
�RNOA � � � � RNOA � � PM � � ATO � � �RNOA � � �NOA � � .t�1 0 1 t 2 t 3 t 4 t 5 t t�1
(1)
Next, I employ a changes specification similar to the one used by Fairfield and Yohn(2001) and examine the explanatory power of �PM and �ATO with one notable exception.In their analysis, they do not control for changes in RNOA (�RNOAt). Thus, it is difficultto surmise from their analysis whether the explanatory power comes from �PM and �ATOor whether the omitted variable, �RNOA, is providing the information. Accordingly, I es-timate the following changes regression and include �RNOA to determine whether changesin the components are incremental as follows:
�RNOA � � � � RNOA � � �PM � � �ATO � � �RNOAt�1 0 1 t 2 t 3 t 4 t
� � �NOA � � . (2)5 t t�1
Because pooled regressions are subject to cross-sectional correlation in the residuals, Iestimate all the regressions in the paper separately for each year in the sample and thenconstruct Fama-MacBeth t-statistics using the resulting set’s time-series of annual coeffi-cient estimates (Fama and MacBeth 1973). I also adjust for serial correlation in the annualcoefficient estimates due to overlapping periods (Bernard 1987) by using the Newey andWest (1987) adjustment (see Verbeek [2000] for a detailed explanation).
Thus, the first part of the analysis is primarily a replication of earlier work, but makesa small contribution in that it replicates the prior findings in a different sample and ensuresthat the result is robust to other control variables from the literature using slightly updatedtests.15
14 This is the same specification as model 2 of Table 2 in Fairfield and Yohn (2001). As they point out, there isno hypothesized reason to include the level of PM or ATO since they only capture a firm’s operating strategy.Nonetheless, they are included in my analysis to ensure comparability with prior studies. Note that both Equa-tions (1) and (2) are also estimated using the AB and RSST controls.
15 That is, Fama-MacBeth regressions coupled with Newey-West adjustment for serial correlation as opposed topooled regressions.

830 Soliman
The Accounting Review, May 2008
Use of Information by Market ParticipantsStock Return Tests
In this section, I test whether stock market participants use the information containedin the components of DuPont analysis, particularly �ATO. If the results from the profita-bility tests above are robust, then the natural question is whether stock market participantsseem to impound the information in their decision making. The question addressed here iswhether the information in the components of DuPont analysis is associated with equityreturns. Stated differently, does this form of earnings decomposition (1) capture informationthat is relevant to market participants about the firm and its future prospects incrementalto current earnings or (2) provide information to capital market participants that is asso-ciated with revised beliefs? To test these two questions, I employ long- and short-windowreturn tests, respectively.
Long-Window Return TestsIn the spirit of Ball and Brown (1968), I examine whether there is a statistical asso-
ciation between information in the components of DuPont and market equity returns. Thiswould suggest that the information in the components is correlated with information usedby investors (Francis and Schipper [1999] label this as ‘‘Interpretation 4’’ of value rele-vance), and therefore captures information that affects equity valuation. Finding statisticalsignificance is consistent with the joint hypothesis that the information in the DuPont com-ponents reflects underlying events that affect future profitability and that such events alsoare reflected in the market prices of securities. Unlike short-window tests that suffer froma lack of power and only capture information that surprises the market, long-window,contemporaneous, 12-month annual return tests will help ascertain whether the DuPontcomponents contain information that is useful to the market.16
There is still much debate on the proper specification of the returns-earnings regression(see Kothari 2001). Kothari (1992) suggests that using an earnings-level specification re-duces the bias in the coefficients because prices lead earnings. However, Easton and Harris(1991) argue that �EARN is also a relevant variable. Many papers simply include both (e.g.,Amir and Lev 1996; Francis and Schipper 1999).17 In addition, Ohlson (1995) claims thatROE (and through some algebra RNOA) is an important input into valuation models. Ifthese arguments are true, then one would expect RNOA to have better correspondence withstock prices than earnings. Accordingly, I also add RNOA and �RNOA and estimate thefollowing regression equation in pieces to see whether (1) RNOA is incremental to earningsand (2) the DuPont components are incrementally useful to earnings and RNOA:
R � � � � EARN � � �EARN � � RNOA � � �RNOA � � PMt 0 1 t 2 t 3 t 4 t 5 t
� � ATO � � �PM � � �ATO � ε (3)6 t 7 t 8 t t
16 Other researchers have used 15-month windows (e.g., Francis and Schipper 1999) in order to capture the earningsannouncement period. However, because I also conduct short-window return tests around the earnings an-nouncement (described below), the 15-month window overlaps with this analysis. As a robustness check, I usea 15-month window and find similar results.
17 As a robustness check, I estimated these regressions with one or the other of either EARN or �EARN alongwith the DuPont components and found similar results on my variables of interest. Brown et al. (1999) pointout that using returns on the LHS can help avoid econometric issues and mitigates any intertemporal constantcorrelated omitted variables.

The Use of DuPont Analysis by Market Participants 831
The Accounting Review, May 2008
where:
Rt � stock returns are measured using compounded buy-hold market-adjustedreturns (raw return minus the corresponding value-weighted return), inclusiveof dividends and other distributions computed over the 12 months beginningin the first month of the firm’s fiscal year and ending at the end of the fiscalyear t;
EARNt � EPSt /Pt�1; earnings before extraordinary items per share in year t, deflated bythe market value of equity per share at the end of fiscal year t�1;
�EARNt � �EPSt /Pt�1; earnings before extraordinary items per share in year t minus itsannual earnings per share in year t�1, deflated by the market value of equityper share at the end of fiscal year t�1.
DuPont components and RNOA are as defined earlier.18
Equation (3) examines the contemporaneous relation between returns and earnings andwhether the components of DuPont analysis are incrementally informative to stock marketparticipants. However, as Beaver et al. (1980) point out, prices lead earnings because thereis a richer information set impounded in stock prices vis-a-vis earnings. Thus, an alternativeapproach is to include future earnings as an independent variable (Warfield and Wild 1992;Fama 1990). Similar in spirit to Kothari and Sloan (1992) and Collins et al. (1994), I addfuture levels of RNOA and DuPont components to model (3) as follows:19
R � � � � EARN � � �EARN � � RNOA � � �RNOA � � PM � � ATOt 0 1 t 2 t 3 t 4 t 5 t 6 t
� � �PM � � �ATO � � RNOA � � PM � � ATO � ε .7 t 8 t 9 t�1 10 t�1 11 t�1 t (4)
This specification examines whether current market returns reflect future levels of profitmargin and asset turnover in addition to future and current levels and changes of RNOA,PM, and ATO.
Short-Window Return TestsPrevious research has not studied the market reaction to the DuPont components and
whether they are incremental to the earnings surprise.20 Thus, holding both the expectationand the level of earnings constant, the question is whether the source of earnings is usefulto market participants at the time of the earnings announcement, i.e., is the information inthese DuPont variables timely?21 Consistent with prior research, I examine the unexpectedreturn reaction to the earnings surprise. I use changes throughout the analysis because ofthe short-window nature of the test. Changes in the DuPont components are added to see
18 The DuPont components are not scaled by stock price because they are ratios. As a robustness check all DuPontvariables are scaled by beginning period stock price; inferences are unchanged.
19 For both Equations (3) and (4), I estimate the regressions with the three Fama-French factors to control for risk.Results are qualitatively similar.
20 To fully calculate PM and ATO, market participants would need some balance sheet information and sales, inaddition to operating income, at the time of the annual earnings announcement. Most firms disclose sales at thetime of the earnings announcement; and Chen et al. (2002) find that about 52 percent of quarterly earningsannouncements contain balance sheet information. In addition, they find the highest proportion of balance sheetdisclosure occurs in the 4th quarter, corresponding to the annual earnings announcements I examine.
21 Of course, an alternative explanation could be that the market is reacting to different information provided bythe company at the time of the earnings announcement and that this information is correlated with the DuPontcomponents (Beaver et al. 1970).

832 Soliman
The Accounting Review, May 2008
whether they are incrementally significant to the earnings surprise and change in RNOA asfollows:22
UR � � � � SUR � � �PM � � �ATO � � �RNOA � ε (5)t 0 1 t 2 t 3 t 4 t t
where:
URt � stock returns are measured using compounded buy-hold market-adjusted returns (raw return minus the corresponding value-weighted return), inclusive of dividends and other distributionscomputed over the five-day window surrounding the earningsannouncement beginning two days before and ending two daysafter the annual earnings announcement for fiscal year t; and
SURt (AnnualEarnings Surprise) � annual I/B/E/S earnings � the most recent median forecast of
annual earnings for year t deflated by the market value of equityper share at the end of fiscal year t�1.
Future Return TestsThe final return test is based on the growing evidence that market participants do not
fully understand the time-series properties of earnings. This stream of research shows thatinvestors sometimes do not understand the future implications of current earnings mappinginto future earnings (e.g., Bernard and Thomas 1989; Sloan 1996; Doyle et al. 2003) andthat a trading strategy exploiting this information can earn abnormal returns. To implementthis trading strategy, I explore whether investors understand the future implications of�RNOA as a function of the DuPont components using the following regression:
R � � � � �RNOA � � �PM � � �ATO � � RSST Controlst�1 0 1 t 2 t 3 t 4
� � RNOA � � PM � � ATO � � Fama-French Risk Factors � ε5 t 6 t 7 t 8 t�1 (6)
where:
Rt�1 � future stock returns are measured using compounded buy-hold market-adjustedreturns (raw return minus the corresponding value-weighted return), inclusive ofdividends and other distributions beginning four months after the end of the fiscalyear t and continuing for one year.23
22 Because short-window return tests capture the updating of priors and represent new information, I only usechanges in the DuPont components for this set of tests. Implicitly, this assumes that the market’s expectationsof profit margin and asset turnover are simply the prior years’ expectations: a random walk model. The samereasoning holds for the testing of analyst forecast revisions below. There is the possibility that �ATO is not agood measure of the surprise component of ATO. In untabulated tests, I only use innovations in the fourth quarterof ATO as a robustness check and find similar results.
23 Beginning the return window four months after year-end is standard in the literature (e.g., Sloan 1996), sincefirms generally file Form 10-Ks within four months after the end of the fiscal year (see Alford et al. 1994). Forfirms that delist during the future return period, I calculate the remaining return by taking CRSP’s delistingreturn and then reinvesting the proceeds in the value-weighted market portfolio. For firms that delist due to poorperformance (delisting codes 500 and 520–584), I use a �35 percent delisting return for NYSE/AMEX firmsand a �55 percent delisting return for NASDAQ firms, as recommended in Shumway (1997) and Shumway andWarther (1999). This mitigates concerns with potential survivorship biases.

The Use of DuPont Analysis by Market Participants 833
The Accounting Review, May 2008
If market participants fully appreciate the predictive power of the DuPont variables,then the coefficient is expected to be zero. As control variables, I include the Fama-Frenchrisk factors of book-to-market ratio (BM), size (MVE), and � (Beta) in my tests as riskfactors (Fama and French 1993). In addition, I include the three accrual variables fromRSST (described earlier), which also have been shown to be strong predictors of futureabnormal returns. In these tests, I use rank regressions where the continuous value of theindependent variable amount is replaced with its annual decile rank. These are more con-servative statistical tests; the variables are scale-free and the only assumption about theregression’s functional form is that the relations are monotonic (Iman and Conover 1979).To create decile ranks, all the continuous variables are sorted annually into ten equal-sizedgroups numbered 0 to 9 each year and then divided by 9. This allows for easy interpretationof the absolute value of the coefficient estimate on a variable as the hedge value movingfrom the top to the bottom decile created to optimize on the information in the variable,after controlling for the other variables in the regression (Bernard and Thomas 1989).
Analyst Forecast TestsBecause a primary task of equity analysts is to predict future earnings, it is expected
that their forecasts contain all relevant information. A variety of research provides evidenceconsistent with differing degrees of analyst sophistication. Several studies find that analystsdo not fully impound relevant accounting information into their earnings forecasts (e.g.,Stober 1992). A number of studies show that analyst forecasts are inefficient in the sensethat they do not fully incorporate past information available at the time of their forecasts.Lys and Sohn (1990), Klein (1990), and Abarbanell (1991) all suggest that analysts under-react to past information reflected in prices. Others have explored whether market anomaliescan be traced to how information intermediaries such as equity analysts process accountinginformation. Abarbanell and Bernard (1992) find that although analyst forecasts under-reactto earnings, the biases are not large enough to explain the post-earnings announcement driftcompletely. Bradshaw et al. (2001) explore whether equity analysts understand the lowerpersistence of accruals and find that they, like equity investors, do not fully understandaccruals. Finally, AB explore whether the forecasts of equity analysts fully incorporate theinformation in the fundamental variables used by Lev and Thiagarajan (1993) and find thatthey do not.
Notwithstanding the studies above, another series of research studies indicates that therelation can go the other way, namely that equity investors can inefficiently utilize infor-mation contained in analysts’ earnings forecasts. Mendenhall (1991), Walther (1997) andElgers et al. (2001, 2003) document that investors underweigh information contained inanalysts’ forecasts. Thus, exploring tests of stock returns and analysts’ forecasts are notperfect substitutes since neither one has been shown to subsume the other. Accordingly,whether analysts will comprehend the DuPont components in the same way equity investorsdo is still an open question and not immediately obvious from the results of the stock returntests.
To this end, I use two approaches to examine whether analysts fully impound theDuPont component information into their forecasts. First, I examine whether the DuPontcomponents are associated with analyst forecast revisions of future earnings of period t�1in the month immediately before and after the earnings announcement of year t. Thisapproach examines whether the information is associated with analysts revising their priorforecasts (e.g., Barth and Hutton 2004). Significant coefficients on the DuPont componentsindicate that the information in these ratios is useful to analysts in revising their priorsabout the future prospects of the firm or is at least correlated with other information that

834 Soliman
The Accounting Review, May 2008
is. Positive coefficients indicate that the analysts are revising their forecasts upward. Onceagain, because of the nature of the dependent variable, I use changes in this specificationto see if they are incremental to the surprise and changes in RNOA as follows:
Anal REV � � � � SUR � � �PM � � �ATO � � �RNOA � ε (7)t 0 1 t 2 t 3 t 4 t t
where:
Anal REVt � analyst revision of one-year-ahead earnings forecast measured as therevision to the consensus analyst forecast of year t�1 earnings made justafter year t earnings are announced. Specifically, it is the first medianI/B/E/S consensus one-year-ahead forecast of year t�1 earnings, minusthe last median consensus of year t�1 earnings made directly before theannouncement of year t earnings, all scaled by share price at the end offiscal year t�1.
The second test on equity analysts examines whether analysts completely understandthe predictive power that the DuPont components have for future profitability. In contrastto Equation (7), the following tests explore whether analysts fully use the information inthe DuPont components by testing whether future forecast errors for period t�1 arepredictable. This type of research design has been used by others such as Bradshaw,Richardson, and Sloan (2001). In this specification, because future forecast errors can beseen as a level or a change, I include both the levels and changes of the DuPont componentsas follows:
FE � � � � �RNOA � � PM � � ATO � � �PM � � �ATO � ε (8)t�1 1 2 t 3 t 4 t 5 t 6 t t�1
where:
FEt�1 � forecast error is the realized earnings for year t�1 less the median forecastearnings from the month prior to the announcement of t�1 earnings, scaled bythe stock price at the end of the month of the earnings announcement for year t.
The analyst tests above (Equations (7) and (8)) are complementary and provide twoapproaches to analysts’ use of information. The first tests whether analysts use the infor-mation in revising expectations and thus provides a lower bound of relevance. The futureforecast error tests examine whether analysts fully capture all the information in the com-ponents and thus place a higher threshold of sophistication on analysts. This latter testmirrors the future abnormal return tests presented earlier. Consistently, if analysts fullyimpound the information in the DuPont components when creating forecasts, then the ex-pected coefficient is zero.
III. EMPIRICAL ANALYSISSample
The empirical tests employ publicly available data from three sources: I /B/E/S, CRSP,and Compustat. I /B/E/S provides analyst forecast data. I restrict the sample to the 1984–2002 period because of weak coverage by I/B/E/S in earlier years. Financial statementdata are obtained from the Compustat annual database, and stock return data are obtained

The Use of DuPont Analysis by Market Participants 835
The Accounting Review, May 2008
from the CRSP daily stock returns files. All firm-year observations with SIC codes 6000–6999 (financial companies) are excluded because the DuPont decomposition is not mean-ingful for these firms. This is consistent with previous studies on DuPont analysis (Nissimand Penman 2001; Fairfield and Yohn 2001) and thereby facilitates comparison amongstudies. Firm-year observations that are (1) not tracked by I/B/E/S, (2) have insufficientdata on Compustat to compute the financial statement variables used in the tests, or (3) donot have contemporaneous and future return data on CRSP are eliminated. Requiring thesample to have I/B/E/S data biases the sample toward larger firms with analyst following.24
In addition, all observations that do not have all the necessary information to perform mytests are removed as well as firm-year observations with negative NOA and operating in-come.25 These criteria yield a final sample size of 38,716 firm-year observations with non-missing analyst forecasts, financial statement, and returns data. Thus, all tests are performedon the same sample.26
Variable MeasurementDuPont Decomposition
RNOA is operating income before interest (Compustat item #178) divided by averagenet operating assets (NOA), where NOA is Operating Assetst � Operating Liabilitiest. Op-erating assets is total assets (Compustat item #6) less cash and short-term investments(Compustat item #1 and item #32). Operating liabilities is total assets (Compustat item #6),less the long- and short-term portions of debt (Compustat items #9 and #34), less bookvalue of total common and preferred equity (Compustat items #60 and #130), less minor-ity interest (Compustat item #38). Growth in Net Operating Assets (�NOA) � (NOAt
� NOAt�1) /NOAt�1. RNOA is decomposed into the multiplicative components of PM(Operating Income (Compustat item #178)/Total Sales (Compustat item #12)) and ATO(Sales/Average NOA). �PMt � (PMt � PMt�1), and ATO is measured similarly.27 Futurechanges in RNOA is �RNOAt � RNOAt�1 � RNOAt. All financial variables are winsorizedat 1 percent and 99 percent to dampen the effect of outliers on the analysis.
Control Variable DefinitionsFollowing AB (1997), I calculate nine fundamental signals (see Table 3 for exact def-
initions) and consistent with RSST (2005), components of total accruals are defined asTACC � �WC � �NCO � �FIN.
Finally, the control variables used to proxy for risk in the future return tests are cal-culated as follows:
24 For example, in 2001 there were 2,707 firm-year observations with sufficient Compustat data to perform thetests of future �RNOA and the control variables. After requiring both I /B /E /S and CRSP, however, there areonly 1,711 firm-year observations in the final sample for year 2001. It should be noted that those observationsstill comprise about 92 percent of the market capitalization of all Compustat firms in that year and thereforeconstitute a representative sample.
25 Removing firms with negative operating income results in a loss of about 8,500 firm-year observations from mysample (about 18 percent), which is slightly less than the percentage Hayn (1995) reports because operatingincome is further up the income statement and does not include special items. This choice was made to (1)facilitate comparison with other studies (Fairfield and Yohn 2001), (2) remove firm-year observations whereearnings do not map clearly into equity valuation (Burgstahler and Dichev 1997; Collins et al. 1999), and (3)allow for a clear ranking of performance. As an empirical matter, all the analysis was performed on the entiresample including loss firms with extremely similar results.
26 As mentioned before, using delisting returns helps mitigate concerns of survivorship bias caused by requiringone-year-ahead future returns.
27 As a robustness check, I also measure �PM and �ATO in identical fashion as FY2001 (e.g., �PMt � (PMt
� PMt�1)*ATOt�1). Inferences are not changed.

836 Soliman
The Accounting Review, May 2008
BM � book value of equity (Compustat item #60)/Market Value ofEquity (shares � price � item #25 � item #199);
MVE (Size of the Firm) � Log(Market Value of Equity); andBETA (�) � � for firm i for fiscal year t is estimated by a market model
regression. The regression is run using weekly returns for aperiod of two years ending at the end of the fiscal year fromwhich I obtain the data to compute each of the financialratios.
IV. RESULTSTable 1 presents descriptive statistics for the variables in the analysis. Most of the
values are consistent with prior literature. RNOA and PM are slightly higher than the valuesreported in Nissim and Penman (2001) because (1) loss firms are excluded in this analy-sis and (2) I/B/E/S coverage is required in the sample, and analysts generally follow largerand more profitable firms (McNichols and O’Brien 1997). In addition, the distributions ofboth PM and ATO show that the means are larger than the medians, indicating positiveskewness. Although not reflected in the 75th percentile, large outlier values of these ratiosare present in the data. Table 2 presents Pearson and Spearman rank correlations betweenthe variables of interest. Looking at the Spearman correlations, there is a strong negativecorrelation between PM and ATO at �0.364, consistent with Nissim and Penman (2001).
Future �RNOAThe prediction of future changes in RNOA (�RNOAt�1) is presented in Table 3. Panel
A presents the results examining the levels of PM and ATO. Model 1 shows the DuPontcomponents with changes in NOA and RNOA as control variables.28 Consistent with priorliterature, neither PM nor ATO predicts future changes in RNOA. In models 2, 3, and 4, Icontrol for earnings predictors from prior literature. First, I examine the nine fundamentalsignals used by AB (1997) in model 2. Although the coefficients are not reported, most ofthe AB signals are consistent in sign and magnitude with AB (1997) with the exceptionof AB GM, which is significant and positive in my analysis and negative in theirs.29
In model 3, I control for the expanded definition of accruals from RSST (2005), and finallymodel 4 controls for all the variables simultaneously. In general, the RSST variables arestill significant and consistent with prior work (i.e., �FIN is no longer significant). Inter-estingly, in the final specification when the AB variables are included along with the RSSTvariables, ATO is positive and significant although it is not significant in any of the otherspecifications or in prior literature (Fairfield and Yohn 2001; Soliman 2004). In unreportedrobustness checks, the significance appears to occur when adding the CAPEX variable,indicating that prior studies may have been misspecified without controlling for increasesin capital expenditures above the industry average.
Finally, Panel B of Table 3 presents the changes specification used in prior studies.Consistent with prior literature (Fairfield and Yohn 2001; Penman and Zhang 2003), model1 shows that only �ATO is positive and significant in predicting future changes in RNOA.30
In models 2, 3, and 4, I show that this significance survives the inclusion of all the earnings
28 This is done primarily to mimic model 2 in Fairfield and Yohn (2001). Fairfield et al. (2003b) argue that �NOAis a proxy for growth find and that it subsumes the operating accrual anomaly proposed by Sloan (1996).
29 Many design differences can explain this inconsistency between this paper and Abarbanell and Bushee (1997):(1) a different sample period, (2) use of �RNOA in this analysis versus �EPS, or (3) the inclusion of PM in theregression which is highly correlated with Gross Margin (AB GM).
30 With the notable exception that prior studies did not include (RNOA as a control variable.

The Use of DuPont Analysis by Market Participants 837
The Accounting Review, May 2008
TABLE 1Descriptive Statistics
Mean Std. Dev. 25% Median 75%
NOAt 1,122 2,997 44.4 160.1 691.2RNOAt 0.279 0.354 0.113 0.181 0.300PMt 0.115 0.082 0.056 0.096 0.153ATOt 2.85 2.81 1.34 2.11 3.29�RNOAt 0.000 0.431 �0.048 �0.002 0.038�PMt 0.000 0.058 �0.017 0.000 0.016�ATOt �0.009 0.150 �0.154 �0.022 0.140Anal REVt �0.011 0.024 �0.003 0.000 0.001SURt �0.005 0.022 �0.004 0.000 0.002Rt 0.066 0.608 �0.278 �0.033 0.244EARNt 0.128 0.794 0.037 0.076 0.137�EARNt 0.009 0.213 �0.000 0.000 0.002
The sample size is 38,716 firm-year observations from 1984–2002. Variables are winsorized at the 1 percent and99 percent levels.Variable definitions:
NOA (Net Operating Assets) � Operating Assets minus Operating Liabilities; Operating Assets is calculatedas total assets (item #6) less cash and short-term investments (item #1) and(item #32); Operating Liabilities is calculated as total assets less total debt(items #9 and #34), less book value of total common and preferred equity(items #60 and #130), less minority interest (item #38);
PMt (Profit Margin) � Operating Incomet (item #178) /Total Salest (item #12);ATOt (Asset Turnover) � Salest /Average NOAt ((NOAt � NOAt�1) /2);
RNOAt (Return on Net OperatingAssets) � PMt � ATOt;
�RNOAt � change in RNOA from year t–1 through t (RNOAt – RNOAt�1);�PMt � change in Profit Margin (PMt – PMt�1);
�ATOt � change Asset Turnover (ATOt � ATOt�1);Anal REVt (Analyst Revision) � one-year-ahead earnings forecasts measured as the revision to the consensus
analyst forecast of year t�1 earnings made just after year t earnings areannounced; specifically, it is the first median I /B /E /S consensus one-year-ahead forecast of year t�1 earnings minus the last median consensus ofyear t�1 earnings made directly before the announcement of year tearnings, all scaled by share price at the end of fiscal year t�1;
SURt (Annual Earnings Surprise) � annual I /B /E /S earnings minus the most recent median forecast of annualearnings for year t deflated by the market value of equity per share at theend of fiscal year t�1;
Rt � stock returns are measured using compounded buy-hold market-adjustedreturns (raw return minus the corresponding value-weighted return),inclusive of dividends and other distributions computed over the 12 monthsbeginning in the first month of the firm’s fiscal year and ending at the endof the fiscal year t;
EARNt � EPSt /Pt�1; the firm’s earnings before extraordinary items per share in year tdeflated by the market value of equity per share at the end of fiscal yeart�1; and
�EARNt � �EPSt /Pt�1; the firm’s earnings before extraordinary items per share in yeart minus its annual earnings per share in year t–1 deflated by the marketvalue of equity per share at the end of fiscal year t–1.
predictors that exist in the current literature, particularly those of AB and RSST. Thus,despite the obvious collinearity that may exist between the DuPont components and thecontrol variables, the predicative power of the �ATO remains statistically significant. This

838Solim
an
The
Accounting
Review
,M
ay2008
TABLE 2Correlation Matrix: Pearson (above Diagonal) and Spearman (below Diagonal) (p-values shown in parentheses below correlations)
�RNOAt�1 �RNOAt PMt ATOt RNOAt Anal Revt SURt �PMt �ATOt Rt
�RNOAt�1 —�0.194(0.0001)
�0.137(0.0001)
�0.411(0.0001)
�0.543(0.0001)
0.071(0.0001)
0.121(0.0001)
�0.081(0.0001)
�0.002(0.676)
0.002(0.757)
�RNOAt0.0419
(0.0001)— 0.111
(0.0001)0.209
(0.0001)0.319
(0.0001)0.033
(0.0001)0.025
(0.0001)0.350
(0.0001)0.292
(0.0001)0.155
(0.0001)
PMt�0.151(0.0001)
0.196(0.0001)
— �0.194(0.0001)
0.373(0.0001)
0.028(0.0001)
0.106(0.0001)
0.333(0.0001)
0.011(0.052)
0.125(0.0001)
ATOt�0.157(0.0001)
0.122(0.0001)
�0.364(0.0001)
— 0.655(0.0001)
0.012(0.025)
0.033(0.0001)
0.026(0.0001)
0.148(0.0001)
0.108(0.0001)
RNOAt�0.273(0.0001)
0.298(0.0001)
0.502(0.0001)
0.536(0.0001)
— 0.016(0.002)
0.086(0.0001)
0.227(0.0001)
0.130(0.0001)
0.176(0.0001)
Anal Revt0.187
(0.0001)�0.189(0.0001)
0.0731(0.0001)
0.0627(0.0001)
0.1244(0.0001)
— 0.046(0.0001)
0.063(0.0001)
0.048(0.0001)
0.106(0.0001)
SURt0.2494
(0.0001)0.0693
(0.0001)0.0409
(0.0001)0.0416
(0.0001)0.0747
(0.0001)0.084
(0.0001)— 0.066
(0.0001)0.039
(0.0001)0.068
(0.0001)
�PMt�0.018(0.0001)
0.728(0.0001)
0.2958(0.0001)
0.055(0.0001)
0.311(0.0001)
0.179(0.0001)
0.060(0.0001)
— 0.109(0.0001)
0.235(0.0001)
�ATOt0.1065
(0.0001)0.6043
(0.0001)0.0148
(0.0001)0.124
(0.0001)0.112
(0.0001)0.117
(0.0001)0.050
(0.0001)0.179
(0.0001)— 0.203
(0.0001)Rt 0.0975
(0.0001)0.3581
(0.0001)0.177
(0.0001)0.090
(0.0001)0.247
(0.0001)0.238
(0.0001)0.090
(0.0001)0.338
(0.0001)0.215
(0.0001)—
(continued on next page)

The
Use
ofD
uPontA
nalysisby
Market
Participants839
The
Accounting
Review
,M
ay2008
TABLE 2 (continued)
The sample size is 38,716 firm-year observations from 1984–2002. Variables are winsorized at the 1 percent and 99 percent levels.Variable definitions:
NOA (Net Operating Assets) � Operating Assets minus Operating Liabilities; Operating Assets is calculated as total assets (item #6) less cash and short-term investments (item #1) and (item #32); Operating Liabilities is calculated as total assets less total debt (items #9 and#34), less book value of total common and preferred equity (items #60 and #130), less minority interest (item #38);
PMt (Profit Margin) � Operating Incomet (item #178) /Total Salest (item #12);ATOt (Asset Turnover) � Salest /Average NOAt ((NOAt � NOAt�1) /2);
RNOAt (Return on Net Operating Assets) � PMt � ATOt;�RNOAt � change in RNOA from year t�1 through t (RNOAt � RNOAt�1);
�PMt � change in Profit Margin (PMt – PMt�1);�ATOt � change Asset Turnover (ATOt � ATOt�1);
Anal REVt (Analyst Revision) � one-year-ahead earnings forecasts measured as the revision to the consensus analyst forecast of year t�1 earnings madejust after year t earnings are announced; specifically, it is the first median I /B /E /S consensus one-year-ahead forecast ofyear t�1 earnings minus the last median consensus of year t�1 earnings made directly before the announcement of year tearnings, all scaled by share price at the end of fiscal year t–1;
SURt (Annual Earnings Surprise) � annual I /B /E /S earnings minus the most recent median forecast of annual earnings for year t deflated by the market valueof equity per share at the end of fiscal year t–1; and
Rt � stock returns are measured using compounded buy-hold market-adjusted returns (raw return minus the corresponding value-weighted return), inclusive of dividends and other distributions computed over the 12 months beginning in the first monthof the firm’s fiscal year and ending at the end of the fiscal year t.

840 Soliman
The Accounting Review, May 2008
TABLE 3Time-Series Means and t-Statistics for Coefficients from Annual Cross-Sectional Regressions
of Future One-Year-Ahead Change in RNOA (�RNOAt�1) on the DuPont Components
Independent Variables Model 1 Model 2 Model 3 Model 4
Panel A: Levels of DuPont Components
�RNOA � � � � RNOA � � PM � � ATO � � �RNOA � � �NOAt�1 0 1 t 2 t 3 t 4 t 5 t
� RSST Controls � AB Controls � �t�1
Intercept 0.038(2.97)
0.066(3.71)
0.045(3.28)
0.072(4.36)
RNOAt�0.263
(�4.53)�0.265
(�5.58)�0.365
(�4.63)�0.257
(�5.25)
PMt0.220
(1.17)0.107
(1.18)0.321
(1.26)0.121
(1.16)
ATOt�0.005
(�1.37)�0.006
(�1.30)0.002
(�1.53)0.006
(2.14)
�RNOAt�0.045
(�3.31)�0.066
(�2.66)�0.061
(�3.25)�0.061
(�2.81)
�NOAt�0.055
(�5.92)
�WCt�0.359
(�7.08)�0.266
(�3.01)
�NCOt�0.212
(�10.53)�0.174
(�4.91)
�FINt�0.134
(�5.40)�0.052
(�0.92)AB Controls Not Included Included Not Included Included
Adjusted R2 16.8% 17.5% 16.8% 19.8%
Panel B: Changes in DuPont Components
�RNOA � � � � RNOA � � �PM � � �ATO � � �RNOA � � �NOAt�1 0 1 t 2 t 3 t 4 t 5 t
� RSST Controls � AB Controls � vt�1
Intercept 0.044(5.45)
0.057(4.88)
0.049(5.47)
0.065(5.80)
RNOAt�0.277
(�6.07)�0.285
(�5.75)�0.279
(�5.95)�0.277
(�5.32)
�PMt0.074
(1.78)0.155
(1.65)0.069
(1.83)0.338
(1.26)
�ATOt0.017
(4.29)0.016
(2.95)0.019
(4.44)0.011
(2.05)
�RNOAt�0.078
(�2.85)�0.090
(�3.51)�0.076
(�2.93)�0.094
(�3.31)
�NOAt�0.062
(�9.92)
(continued on next page)

The Use of DuPont Analysis by Market Participants 841
The Accounting Review, May 2008
TABLE 3 (continued)
Independent Variables Model 1 Model 2 Model 3 Model 4
�WCt�0.321
(�4.57)�0.248
(�3.31)
�NCOt�0.176
(�8.29)�0.149
(�4.93)
�FINt�0.098
(�3.42)�0.044
(�0.74)AB Controls Not Included Included Not Included IncludedAdjusted R2 16.9% 17.5% 16.8% 21.3%
The sample consists of 38,716 firm-year observations from 1984–2002. Regression results are based on 19annual regressions using the Fama-MacBeth approach of averaging coefficients and calculating the t-statistics as
follows: where is the simple average of the annual coefficients, n is the number of annualStdDev�
� �� �nregressions and StdDev� is the standard deviation of the annual coefficients.NOA (Net Operating
Assets) � Operating Assets minus Operating Liabilities; Operating Assets is calculated as totalassets (item #6) less cash and short-term investments (item #1) and (item #32);Operating Liabilities is calculated as total assets less total debt (items #9 and #34), lessbook value of total common and preferred equity (items #60 and #130), less minorityinterest (item #38).
�NOA (Growth in NetOperating Assets) � (NOAt � NOAt�1) /NOAt�1;
PMt � Operating Incomet (item #178) /Total Salest (item #12);ATOt � Salest /Average NOAt ((NOAt � NOAt�1) /2);
RNOAt � PMt � ATOt;�RNOAt�1 � RNOAt�1 � RNOAt;
�RNOAt � RNOAt � RNOAt�1;�PMt � PMt � PMt�1;
�ATOt � ATOt � ATOt�1;�WCt � WCt � WCt�1; WC is calculated as Current Operating Assets (COA) � Current
Operating Liabilities (COL), COA � current assets (Compustat Item #4) � cash andShort-Term Investments (STI) (Compustat Item #1), and COL � current liabilities(Compustat Item #5) � debt in current liabilities (Compustat Item #34);
�NCOt � change in net noncurrent operating assets is defined as NCOt � NCOt�1; NCO iscalculated as Noncurrent Operating Assets (NCOA) � Noncurrent Operating Liabilities(NCOL), NCOA � total assets (Compustat Item #6) � current assets (Compustat Item#4) – investments and advances (Compustat Item #32), and NCOL � total liabilities(Compustat Item #181) � current liabilities (Compustat Item #5) � long-term debt(Compustat Item #9); and
�FINt � change in net financial assets is defined as FINt � FINt�1 and FIN � Financial Assets(FINA) – Financial Liabilities (FINL), FINA � Short-Term Investments (STI)(Compustat Item #193) � Long-Term Investments (LTI) (Compustat Item #32), andFINL � long-term debt (Compustat Item #9) � debt in current liabilities (CompustatItem #34) � preferred stock (Compustat Item #130).
AB Controls are comprised of the following nine variablesAB INV � �Inventory (#3) � �Sales;AB AR � �Accounts Receivable (#2) � �Sales;
AB CAPEX � �Industry Capex � �Firm Capex (#30);AB GM � �Sales � �Gross Margin (#12-41);
AB ETR � Effective Tax Rate � ETRt � �EARNt where ETRt � ;31 TaxExpense(#16)tETR��� � �t��3 EBT(#170 � #65)��1 t
AB EQ � 0 for LIFO, 1 for FIFO or other;AB AQ � 0 for Unqualified, 1 for Qualified or other;
AB SandA � �Selling and Admin Expenses (#189) � �Sales; andAB LF � (Past Sales /Past Employees (#29) � Sales /Employees) / (Past Sales /Past Employees).

842 Soliman
The Accounting Review, May 2008
TABLE 4Time-Series Means and t-Statistics for Coefficients from Annual Cross-Sectional Regressions
of Contemporaneous Returns on DuPont Components
OLS Regressions for Market-Adjusted Returns
R � � � � EARN � � �EARN � � RNOA � � RNOA � � PM � � ATOt 0 1 t 2 t 3 t 4 t 5 t 6 t
� � �PM � � �ATO � ε7 t 8 t t
Intercept EARN �EARN RNOAt �RNOAt PMt ATOt �PMt �ATOt Adj. R2
Model 1 0.0443 0.224 2.795 4.82%(1.85) (1.43) (2.44) (2.65)
Model 2 �0.076 0.334 2.826 0.381 0.668 11.46%(�3.27) (1.84) (2.77) (9.96) (6.70) (6.45)
Model 3 �0.129 0.308 2.885 0.284 0.067 0.496 0.006 12.48%(�4.73) (1.70) (2.76) (6.84) (6.69) (2.99) (2.36) (7.17)
Model 4 �0.123 0.313 2.839 0.278 �0.003 0.495 0.004 0.122 0.089 14.00%(�4.78) (1.63) (2.68) (7.04) (�0.09) (3.00) (1.30) (1.93) (6.45) (6.85)
The sample consists of 38,716 firm-year observations from 1984–2002. Regression results are based on 19annual regressions using the Fama-MacBeth approach of averaging coefficients and calculating the t-statistics as
follows: where is the simple average of the annual coefficients, n is the number of annualStdDev�
� �� �nregressions and StdDev� is the standard deviation of the annual coefficients.
Rt � stock returns are measured using compounded buy-hold market-adjusted returns(raw return minus the corresponding value-weighted return), inclusive ofdividends and other distributions computed over the 12 months beginning in thefirst month of the firm’s fiscal year and ending at the end of the fiscal year t;
EARNt � EPSt /Pt�1; the firm’s earnings before extraordinary items per share in year tdeflated by the market value of equity per share at the end of fiscal year t�1;
�EARNt � �EPSt /Pt�1; the firm’s earnings per share before extraordinary items per sharein year t minus its annual earnings in year t�1 deflated by the market value ofequity per share at the end of fiscal year t�1;
NOA (Net Operating Assets) � Operating Assets – Operating Liabilities; Operating Assets is calculated as totalassets (item #6) less cash and short-term investments (item #1) and (item #32);Operating Liabilities is calculated as total assets less total debt (items #9 and#34), less book value of total common and preferred equity (items #60 and#130), less minority interest (item #38);
PMt � Operating Incomet (item #178) /Total Salest (item #12);ATOt � Salest /Average NOAt ((NOAt � NOAt�1) /2);
RNOAt � PMt � ATOt;�RNOAt � RNOAt � RNOAt�1;
�PMt � PMt � PMt�1; and�ATOt � ATOt � ATOt�1.
supports the prior literature findings and is consistent with the notion that changes in assetturnover bring new information in predicting future changes in profitability and is consistentwith the economic intuition that innovations in ATO reflect increases in the efficiency ofasset usage in generating revenues. This change in firm operational efficiency does notappear to be captured by any of the accounting signals from the prior literature includedin the analysis.
Stock Return TestsTable 4 presents the results from the long-window association tests of Equation (3).
The first regression model shows that �EARN is significant in explaining returns, whereas

The Use of DuPont Analysis by Market Participants 843
The Accounting Review, May 2008
EARN is not. Adjusted R2s are at levels consistent with prior literature—about 4 percent.31
Model 2 changes the analysis slightly to focus on different measures of profitability. Insteadof just using EARN and �EARN, RNOA and �RNOA are added to the analysis. Many inthe valuation literature are using RNOA as a better measure of economic performance (e.g.,Penman and Zhang 2003; Fairfield and Yohn 2001; Nissim and Penman 2001; Richardsonet al. 2006; Fairfield et al. 2003a). Model 2 bears out this choice. The results show thatsimply adding RNOA and �RNOA increases the adjusted R2 from 4.8 percent to 11.5 per-cent. An (untabulated) Vuong (1989) test and F-test confirms that this increase is statisticallysignificant. Thus, these variables are not only incrementally significant to EARN, but alsodramatically increase the traditionally low R2s that come with this type of analysis (Lev1989).
When PM and ATO are added to the regression in model 3, both components aresignificant and positive with t-statistics of 2.99 and 2.36, respectively. This is somewhatsurprising given that the levels of these variables did not predict future changes in profit-ability in table 3.32 Further, it is interesting that RNOA is still significant in models 3 and4, especially given that it is simply PM � ATO, both of which are already in the regressionequation. Thus, not only is PM and ATO incremental to RNOA, but RNOA appears to capturemore information than is contained in its parts as well as in EARN. Finally, when DuPontcomponent changes are added in the final specification (model 4), we again find that �ATOis significant and positive, consistent with the incremental explanatory power documentedin Panel B of Table 3, but that �RNOA is not. Apparently, much of the strong predictivepower of �RNOA in models 2 and 3 is driven by �ATO and not �PM. Table 4 highlightsseveral findings. First, �ATO is the only change component that is significantly associatedwith contemporaneous returns consistent with the earnings prediction results. Second, theexplanatory power of the return regression increases significantly with the addition of RNOAto EARN. And finally, despite the lack of earnings predictive ability, both PM and ATO aresignificant in explaining contemporaneous returns. This indicates that the DuPont compo-nents are incremental to earnings in capturing the information relevant to investors in pricingsecurities with explanatory power as high as 14 percent when examining RNOA and theDuPont components.
Table 5 presents the results of the tests of Equation (4)—whether future levels of PMand ATO in year t�1 are associated with contemporaneous returns in year t. The coefficient�11 on ATOt�1 is significant with t-statistic of 3.44. The results indicate that this futurecomponent is significant and incremental to current and future earnings. Once again, thispoints to the importance of asset turnover as a useful and informative ratio on the economicsof the firm. Also note that, consistent with Table 4, RNOA remains significant even afteradding the current and future levels of its components, PM and ATO. Not only are marketreturns associated with current changes in ATO, but market participants appear to positivelyprice future changes in ATO and the efficient deployment of capital it signifies.
Table 6 provides the results of tests of Equation (5). Recall from Section II that onlychanges in the DuPont components are included in these return tests because of the natureof the short-window tests. In model 1, the coefficient on surprise (SUR) is positive and
31 Prior literature has found that in the same regression EARN is significant, whereas �EARN is not (e.g., Amirand Lev 1986). In unreported results, when I estimate this regression equation using the entire sample (includingloss firms), I find that both components are statistically significant and positive. Once again, different samplecomposition and sample periods may explain this difference.
32 In unreported rank regressions where the scale is consistent across both variables, PM has a larger coefficientthan ATO indicating that PM has a somewhat larger relative importance than ATO in explaining contemporaneousreturns.

844Solim
an
The
Accounting
Review
,M
ay2008
TABLE 5Time-Series Means and t-Statistics for Coefficients from Annual Cross-Sectional Regressions of Contemporaneous Returns
on Future DuPont Components
OLS Regressions for Market-Adjusted Returns
R � � � � EARN � � �EARN � � RNOA � � �RNOA � � PM � � ATO � � �PM � � �ATOt 0 1 t 2 t 3 t 4 t 5 t 6 t 7 t 8 t
� � RNOA � � PM � � ATO � ε9 t�1 10 t�1 11 t�1 t
Intercept EARN �EARN RNOAt �RNAOt PMt ATOt �PMt �ATOt RNOAt�1 PMt�1 ATOt�1 Adj. R2
Mean Coef. �0.123 0.314 2.890 0.217 0.001 0.472 0.004 0.117 0.088 0.080 14.61%t-statistic (�4.68) (1.64) (2.74) (5.07) (0.02) (2.67) (1.10) (1.81) (6.55) (3.51) (7.39)Mean Coef. �0.140 0.312 2.863 0.289 �0.005 �0.086 �0.008 0.125 0.087 �0.007 0.724 0.017 16.04%t-statistic (�5.42) (1.64) (2.79) (7.58) (�0.13) (�0.32) (�0.68) (1.89) (5.88) (�0.43) (1.83) (3.44) (7.95)
The sample consists of 38,716 firm-year observations from 1984–2002. Regression results are based on 19 annual regressions using the Fama-MacBeth approach of
averaging coefficients and calculating the t-statistics as follows: where is the simple average of the annual coefficients, n is the number of annualStdDev�
� �� �nregressions and StdDev� is the standard deviation of the annual coefficients.
Rt � stock returns are measured using compounded buy-hold market-adjusted returns (raw return minus the corresponding value-weightedreturn), inclusive of dividends and other distributions computed over the 12 months beginning in the first month of the firm’s fiscal yearand ending at the end of the fiscal year t;
EARNt � EPSt /Pt�1; the firm’s earnings before extraordinary items per share in year t deflated by the market value of equity per share at the endof fiscal year t�1;
�EARNt � �EPSt /Pt�1; the firm’s earnings per share before extraordinary items per share in year t minus its annual earnings in year t–1 deflatedby the market value of equity per share at the end of fiscal year t�1;
NOA (Net Operating Assets) � Operating Assets – Operating Liabilities; Operating Assets is calculated as total assets (item #6) less cash and short-term investments(item #1) and (item #32); Operating Liabilities is calculated as total assets less total debt (items #9 and #34), less book value of totalcommon and preferred equity (items #60 and #130), less minority interest (item #38);
PMt � Operating Incomet (item #178) /Total Salest (item # 12);ATOt � Salest /Average NOAt ((NOAt � NOAt�1) /2);
RNOAt � PMt � ATOt;�RNOAt � RNOAt � RNOAt�1;
�PMt � PMt � PMt�1; and�ATOt � ATOt � ATOt�1.

The Use of DuPont Analysis by Market Participants 845
The Accounting Review, May 2008
TABLE 6Time-Series Means and t-Statistics for Coefficients from Annual Cross-Sectional Regressions
of Short-Window Unexpected Returns on the DuPont Components
UR � � � � SUR � � �PM � � �ATO � � �RNOA � εt 0 1 t 2 t 3 t 4 t t
Intercept SURt �PMt �ATOt �RNOAt Adj. R2
Model 1 0.006 0.119 0.19%(5.07) (4.32) (2.54)
Model 2 0.007 0.145 �0.001 0.003 0.21%(5.17) (4.53) (�0.72) (3.86) (1.07)
Model 3 0.006 0.144 �0.004 0.002 0.003 0.24%(5.21) (4.59) (�1.55) (2.01) (1.40) (1.08)
The sample consists of 38,716 firm-year observations from 1984–2002. Regression results are based on 19annual regressions using the Fama-MacBeth approach of averaging coefficients and calculating the t-statistics as
follows: where is the simple average of the annual coefficients, n is the number of annualStdDev�
� �� �nregressions and StdDev� is the standard deviation of the annual coefficients.
URt � stock returns are measured using compounded buy-hold market-adjustedreturns (raw return minus the corresponding value-weighted return),inclusive of dividends and other distributions computed over the five-daywindow surrounding the earnings announcement beginning two days beforeand ending two days after the annual earnings announcement for fiscal yeart;
SURt (Annual Earnings Surprise) � annual I /B /E /S earnings – the most recent median forecast of annualearnings for year t;
NOA (Net Operating Assets) � Operating Assets – Operating Liabilities; Operating Assets is calculated astotal assets (item #6) less cash and short-term investments (item #1) and(item #32); Operating Liabilities is calculated as total assets less total debt(items #9 and #34), less book value of total common and preferred equity(items #60 and #130), less minority interest (item #38);
PMt � Operating Incomet (item #178) /Total Salest (item #12);ATOt � Salest /Average NOAt ((NOAt � NOAt�1) /2);
RNOAt � PMt � ATOt;�RNOAt � RNOAt � RNOAt�1;
�PMt � PMt � PMt�1; and�ATOt � ATOt � ATOt�1.
significant, as would be expected. In the second model, only �ATO is significant andpositive, which is consistent with its implications for future earnings from Panel B of Table3. Positive changes in ATO are associated with positive abnormal returns around the earn-ings announcement, and the result holds even after controlling for the change of profitability(�RNOA) above and beyond the surprise in the final regression.
In my final return test, a trading strategy is explored that exploits the information inthese variables. Table 7 presents the results. Model 1 indicates that there is a correspondencebetween �ATO and future abnormal stock returns. The abnormal future return on such asimple signal is surprising, but is consistent with the future forecast error tests presentedbelow. Market participants do not appear to fully impound the future predictive power of�ATO for future changes in profitability found in Table 3. Additionally, the chance that�ATO is simply measuring risk is also minimized by the low increase in adjusted R2 inTable 4 when adding the DuPont components. As mentioned earlier, the coefficients aredecile-ranked in order to facilitate interpretation. The coefficient on �ATO indicates that atrading strategy optimizing the information in �ATO would result in a hedge return of
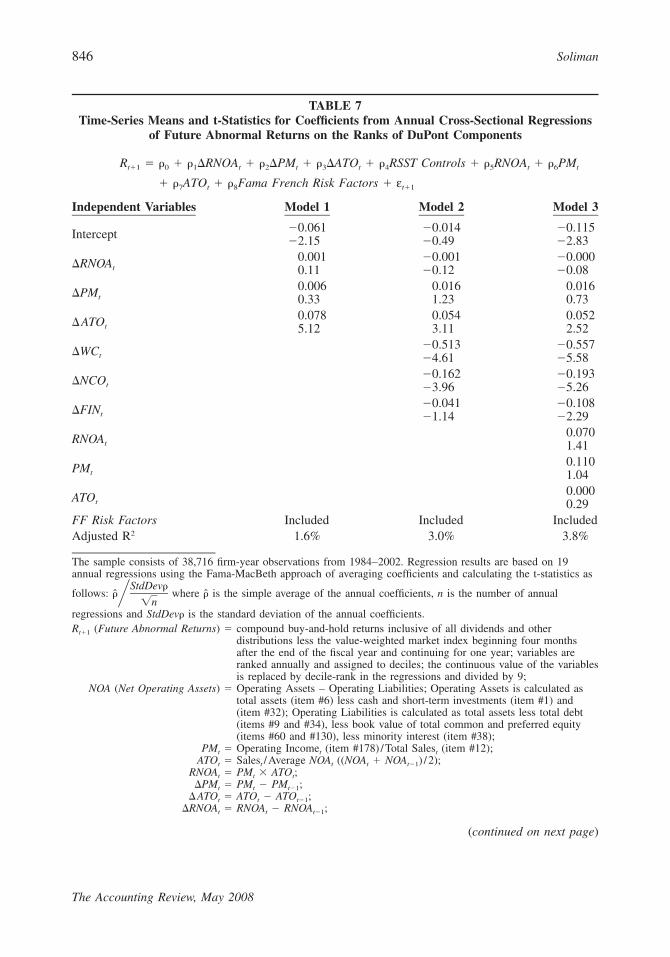
846 Soliman
The Accounting Review, May 2008
TABLE 7Time-Series Means and t-Statistics for Coefficients from Annual Cross-Sectional Regressions
of Future Abnormal Returns on the Ranks of DuPont Components
R � � � � �RNOA � � �PM � � �ATO � � RSST Controls � � RNOA � � PMt�1 0 1 t 2 t 3 t 4 5 t 6 t
� � ATO � � Fama French Risk Factors � ε7 t 8 t�1
Independent Variables Model 1 Model 2 Model 3
Intercept �0.061�2.15
�0.014�0.49
�0.115�2.83
�RNOAt0.0010.11
�0.001�0.12
�0.000�0.08
�PMt0.0060.33
0.0161.23
0.0160.73
�ATOt0.0785.12
0.0543.11
0.0522.52
�WCt�0.513�4.61
�0.557�5.58
�NCOt�0.162�3.96
�0.193�5.26
�FINt�0.041�1.14
�0.108�2.29
RNOAt0.0701.41
PMt0.1101.04
ATOt0.0000.29
FF Risk Factors Included Included IncludedAdjusted R2 1.6% 3.0% 3.8%
The sample consists of 38,716 firm-year observations from 1984–2002. Regression results are based on 19annual regressions using the Fama-MacBeth approach of averaging coefficients and calculating the t-statistics as
follows: where is the simple average of the annual coefficients, n is the number of annualStdDev�
� �� �nregressions and StdDev� is the standard deviation of the annual coefficients.Rt�1 (Future Abnormal Returns) � compound buy-and-hold returns inclusive of all dividends and other
distributions less the value-weighted market index beginning four monthsafter the end of the fiscal year and continuing for one year; variables areranked annually and assigned to deciles; the continuous value of the variablesis replaced by decile-rank in the regressions and divided by 9;
NOA (Net Operating Assets) � Operating Assets – Operating Liabilities; Operating Assets is calculated astotal assets (item #6) less cash and short-term investments (item #1) and(item #32); Operating Liabilities is calculated as total assets less total debt(items #9 and #34), less book value of total common and preferred equity(items #60 and #130), less minority interest (item #38);
PMt � Operating Incomet (item #178) /Total Salest (item #12);ATOt � Salest /Average NOAt ((NOAt � NOAt�1) /2);
RNOAt � PMt � ATOt;�PMt � PMt � PMt�1;
�ATOt � ATOt � ATOt�1;�RNOAt � RNOAt � RNOAt�1;
(continued on next page)
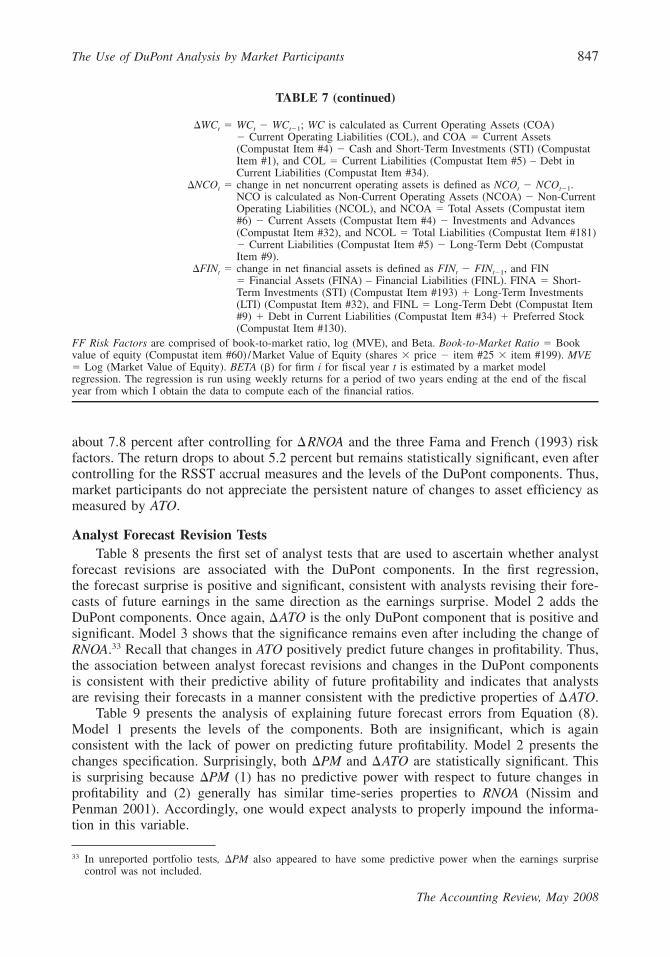
The Use of DuPont Analysis by Market Participants 847
The Accounting Review, May 2008
TABLE 7 (continued)
�WCt � WCt � WCt�1; WC is calculated as Current Operating Assets (COA)� Current Operating Liabilities (COL), and COA � Current Assets(Compustat Item #4) � Cash and Short-Term Investments (STI) (CompustatItem #1), and COL � Current Liabilities (Compustat Item #5) – Debt inCurrent Liabilities (Compustat Item #34).
�NCOt � change in net noncurrent operating assets is defined as NCOt � NCOt�1.NCO is calculated as Non-Current Operating Assets (NCOA) � Non-CurrentOperating Liabilities (NCOL), and NCOA � Total Assets (Compustat item#6) � Current Assets (Compustat Item #4) � Investments and Advances(Compustat Item #32), and NCOL � Total Liabilities (Compustat Item #181)� Current Liabilities (Compustat Item #5) � Long-Term Debt (CompustatItem #9).
�FINt � change in net financial assets is defined as FINt � FINt�1, and FIN� Financial Assets (FINA) – Financial Liabilities (FINL). FINA � Short-Term Investments (STI) (Compustat Item #193) � Long-Term Investments(LTI) (Compustat Item #32), and FINL � Long-Term Debt (Compustat Item#9) � Debt in Current Liabilities (Compustat Item #34) � Preferred Stock(Compustat Item #130).
FF Risk Factors are comprised of book-to-market ratio, log (MVE), and Beta. Book-to-Market Ratio � Bookvalue of equity (Compustat item #60) /Market Value of Equity (shares � price � item #25 � item #199). MVE� Log (Market Value of Equity). BETA (�) for firm i for fiscal year t is estimated by a market modelregression. The regression is run using weekly returns for a period of two years ending at the end of the fiscalyear from which I obtain the data to compute each of the financial ratios.
about 7.8 percent after controlling for �RNOA and the three Fama and French (1993) riskfactors. The return drops to about 5.2 percent but remains statistically significant, even aftercontrolling for the RSST accrual measures and the levels of the DuPont components. Thus,market participants do not appreciate the persistent nature of changes to asset efficiency asmeasured by ATO.
Analyst Forecast Revision TestsTable 8 presents the first set of analyst tests that are used to ascertain whether analyst
forecast revisions are associated with the DuPont components. In the first regression,the forecast surprise is positive and significant, consistent with analysts revising their fore-casts of future earnings in the same direction as the earnings surprise. Model 2 adds theDuPont components. Once again, �ATO is the only DuPont component that is positive andsignificant. Model 3 shows that the significance remains even after including the change ofRNOA.33 Recall that changes in ATO positively predict future changes in profitability. Thus,the association between analyst forecast revisions and changes in the DuPont componentsis consistent with their predictive ability of future profitability and indicates that analystsare revising their forecasts in a manner consistent with the predictive properties of �ATO.
Table 9 presents the analysis of explaining future forecast errors from Equation (8).Model 1 presents the levels of the components. Both are insignificant, which is againconsistent with the lack of power on predicting future profitability. Model 2 presents thechanges specification. Surprisingly, both �PM and �ATO are statistically significant. Thisis surprising because �PM (1) has no predictive power with respect to future changes inprofitability and (2) generally has similar time-series properties to RNOA (Nissim andPenman 2001). Accordingly, one would expect analysts to properly impound the informa-tion in this variable.
33 In unreported portfolio tests, �PM also appeared to have some predictive power when the earnings surprisecontrol was not included.

848 Soliman
The Accounting Review, May 2008
TABLE 8Time-Series Means and t-Statistics for Coefficients from Annual Cross-Sectional Regressions
of Analysts Forecast Revisions on the DuPont Components
Anal REV � � � � SUR � � �PM � � �ATO � � �RNOA � εt 0 1 t 2 t 3 t 4 t t
Intercept SURt �PMt �ATOt �RNOAt Adj. R2
Model 1 �0.002 0.062 1.09%(�5.40) (3.06) (2.66)
Model 2 �0.002 0.066 0.001 0.001 1.4%(�4.44) (3.26) (1.09) (3.63) (2.88)
Model 3 �0.002 0.066 0.001 0.001 0.000 1.32%(�4.40) (3.26) (0.94) (2.44) (0.01) (3.02)
The sample consists of 38,716 firm-year observations from 1984–2002. Regression results are based on 19annual regressions using the Fama-MacBeth approach of averaging coefficients and calculating the t-statistics as
follows: where is the simple average of the annual coefficients, n is the number of annualStdDev�
� �� �nregressions and StdDev� is the standard deviation of the annual coefficients.
Anal REVt (Analyst Revision) � one-year-ahead earnings forecasts measured as the revision to theconsensus analyst forecast of year t�1 earnings made just after yeart earnings are announced. Specifically, it is the first median I /B /E /Sconsensus one-year-ahead forecast of year t�1 earnings, minus thelast median consensus of year t�1 earnings made directly before theannouncement of year t earnings, all scaled by share price at the endof fiscal year t�1;
SURt (Annual Earnings Surprise) � annual I /B /E /S earnings – the most recent median forecast ofannual earnings for year t;
NOA (Net Operating Assets) � Operating Assets � Operating Liabilities; Operating Assets iscalculated as total assets (item #6) less cash and short-terminvestments (item #1) and (item #32); Operating liabilities iscalculated as total assets less total debt (items #9 and #34), lessbook value of total common and preferred equity (items #60 and#130), less minority interest (item #38);
�NOA (Growth in Net Operating Assets) � (NOAt � NOAt�1) /NOAt�1;PMt � Operating Incomet (item #178) /Total Salest (item #12);
ATOt � Salest /Average NOAt ((NOAt � NOAt�1) /2);RNOAt � PMt � ATOt;
�PMt � PMt � PMt�1;�ATOt � ATOt � ATOt�1; and
�RNOAt � RNOAt � RNOAt�1.
But the analysis suggests that analysts do not appear to employ all the information in�ATO when making forecasts. The positive sign of the coefficient is also important. Recallthat �ATO positively predicts future changes in profitability after controlling for the�RNOA. The positive coefficient on this variable indicates that, on average, analysts’ fore-cast errors seem to be predicted by �ATO, consistent with the positive prediction of futureprofitability and is entirely consistent with the future abnormal return tests. Specifically, itgives support to the idea that analysts do not fully appreciate the information in this variable,and that (similar to Abarbanell and Bernard [1992]) market participants may be relying onanalysts for information. Overall, the two tests seem to confirm that there is informationcontained in �ATO that is not completely understood by market participants, and both pointto the lack of appreciation of the predictive abilities of �ATO.
The Use of DuPont Analysis by Market Participants 849
The Accounting Review, May 2008
TABLE 9Time-Series Means and t-Statistics for Coefficients from Annual Cross-Sectional Regressions
of Future Forecast Errors on the DuPont Components
FE � � � � �RNOA � � PM � � ATO � � �PM � � �ATO � εt�1 1 2 t 3 t 4 t 5 t 6 t t�1
Intercept �RNOAt PMt ATOt �PMt �ATOt Adj. R2
Model 1 0.013 �0.001 �0.013 �0.000 1.74%(8.44) (�1.35) (�1.62) (�0.09) (1.46)
Model 2 0.015 0.001 0.002 0.002 2.78%(11.27) (1.09) (3.29) (2.56) (7.45)
Model 3 0.013 0.000 �0.013 �0.000 0.002 0.002 1.79%(8.57) (0.48) (�1.83) (�0.30) (3.27) (2.54) (8.32)
The sample consists of 38,716 firm-year observations from 1984–2002. Regression results are based on 19annual regressions using the Fama-MacBeth approach of averaging coefficients and calculating the t-statistics as
follows: where is the simple average of the annual coefficients, n is the number of annualStdDev�
� �� �nregressions, and StdDev� is the standard deviation of the annual coefficients.
FEt�1 (Forecast error) � realized earnings for year t�1 less the median forecast earnings from the monthsprior to the announcement of t�1 earnings, scaled by the stock price in themonth of the earnings announcement for year t;
NOA (Net Operating Assets) � Operating Assets – Operating Liabilities; Operating Assets is calculated as totalassets (item #6) less cash and short-term investments (item #1) and (item #32);Operating liabilities is calculated as total assets less total debt (items #9 and#34), less book value of total common and preferred equity (items #60 and#130), less minority interest (item #38);
PMt � Operating Incomet (item #178) /Total Salest (item #12);ATOt � Salest /Average NOAt ((NOAt � NOAt�1) /2);
RNOAt � PMt � ATOt;�PMt � PMt � PMt�1;
�ATOt � ATOt � ATOt�1; and�RNOAt � RNOAt � RNOAt�1.
V. CONCLUSIONIn this paper, the usefulness of DuPont analysis, a common form of financial statement
analysis that decomposes return on net operating assets (RNOA) into two multiplicativecomponents: profit margin and asset turnover, is comprehensively tested. This decomposi-tion breaks down earnings into two meaningful ratios that are interpretable. Consistent withprior literature and the economic intuition that an increase in asset turnover represents animprovement in asset utilization that will generate future results, I find that changes in assetturnover have positive explanatory power for future changes in RNOA incremental to currentchanges in RNOA. This paper contributes to this growing literature by confirming that theinformation contained in changes in asset turnover is incremental to other documentedpredictors of profitability such as accruals and the fundamental signals used by experts inLev and Thiagarajan (1993).
However, the primary focus of the paper is how market participants, such as equityanalysts and stock market investors, use DuPont components in assessing the prospects ofthe firm. The paper examines the stock market’s association with the information in theDuPont components variables through long- and short-window tests and finds that the mar-ket recognizes the future RNOA implications of these components. As would be expected,long-window stock returns are positively associated with changes in asset turnover. Addi-tionally, short-window returns show that the market responds favorably to changes in asset

850 Soliman
The Accounting Review, May 2008
turnover. However, future return tests confirm that this favorable response is incomplete.Analyst forecast revision tests mirror the short-window return results. I find that there ispositive revision to future earning forecasts associated with changes in asset turnover thatis incremental to the earnings surprise as well as changes in total profitability. Thus, sell-side analysts appear to properly use the information in �ATO in assessing the future pros-pects of the firm at least from a directional perspective. However, I find that although thereis an association with this ratio and revisions of future earnings forecasts, there appears tobe information in the DuPont components that goes unused by analysts as evidenced bythe predictability of future forecast errors. The consistency of the future analyst forecasterror tests with the future return tests is reassuring. In the spirit of Abarbanell and Bernard(1992), it points to the possibility that investors may be misled partially because analystsdo not impound the differential time-series properties of these two components.
Overall, the study finds that the DuPont analysis is a useful tool of financial statementanalysis. Unlike other analyses, the DuPont decomposition of RNOA has the nice featureof being derived from a theoretical and parsimonious framework of valuation and relatesto the operational aspects of the firm. In particular, the analysis points to the value offocusing on changes in asset turnover.
REFERENCESAbarbanell, J. 1991. Do analysts’ earnings forecasts incorporate information in prior stock price
changes? Journal of Accounting and Economics 14: 147–165.———, and V. Bernard. 1992. Test of analysts’ overreaction/underreaction to earnings information
as an explanation for anomalous stock price behavior. Journal of Finance 47 (July): 1181–1207.———, and B. Bushee. 1997. Fundamental analysis, future earnings, and stock prices. Journal of
Accounting Research (Spring): 1–24.———, and ———. 1998. Abnormal returns to a fundamental analysis strategy. The Accounting
Review (January): 19–45.Alford, A. W., J. Jones, and M. Zmijewski. 1994. Extensions and violations of the statutory SEC
Form 10-K filing requirements. Journal of Accounting and Economics 17: 229–256.Amir, E., and B. Lev. 1996. Value-relevance of non-financial information: The wireless communication
industry. Journal of Accounting and Economics 22: 3–30.Ball, R., and P. Brown. 1968. An empirical evaluation of accounting numbers. Journal of Accounting
Research (Autumn): 159–177.Barth, M., W. Beaver, J. Hand, and W. Landsman. 1999. Accruals, cash flows and equity values.
Review of Accounting Studies (December): 205–229.———, and R. Hutton. 2004. Analyst earnings forecast revisions and the pricing of accruals. Review
of Accounting Studies (March): 59–96.Beaver, W. 1968. The information content of annual earnings announcements. Journal of Accounting
Research (Supplement): 67–92.———, P. Kettler, and M. Scholes. 1970. The association between market-determined and accounting-
determined risk measures. The Accounting Review (October): 654–682.———, R. Lambert, and D. Morse. 1980. The information content of security prices: A second look.
Journal of Accounting and Economics 9: 139–158.———. 1998. Financial Reporting: An Accounting Revolution. 3rd edition. Upper Saddle River, NJ:
Prentice Hall.Bernard, V. 1987. Cross-sectional dependence and problems in inference in market-based accounting
research. Journal of Accounting Research (Spring): 1–48.———, and J. Thomas. 1989. Post-earnings announcement drift: Delayed price response or risk
premium? Journal of Accounting Research (Supplement): 1–36.

The Use of DuPont Analysis by Market Participants 851
The Accounting Review, May 2008
Bradshaw, M., S. Richardson, and R. Sloan. 2001. Do analysts and auditors use information in ac-cruals? Journal of Accounting Research (Summer): 45–74.
Brown, S., K. Lo, and T. Lys. 1999. Use of R2 in accounting research: Measuring change in valuerelevance over the last four decades. Journal of Accounting and Economics 28: 83–115.
Burgstahler, D., and I. Dichev. 1997. Earnings, adaptation and equity values. The Accounting Review(April): 187–215.
Chen, S., M. DeFond, and C. Park. 2002. Voluntary disclosure of balance sheet information in quar-terly earnings announcements. Journal of Accounting and Economics 33: 229–251.
Collins, D., S. P. Kothari, J. Shanken, and R. Sloan. 1994. Lack of timeliness versus noise as expla-nations for low contemporaneous return-earnings association. Journal of Accounting and Eco-nomics 18: 289–324.
———, M. Pincus, and H. Xie. 1999. Equity valuation and negative earnings: The role of book valueof equity. The Accounting Review (January): 29–61.
Doyle, J., R. Lundholm, and M. Soliman. 2003. The predictive value of expenses excluded from proforma earnings. Review of Accounting Studies 8: 145–174.
Easton, P., and T. Harris. 1991. Earnings as an explanatory variable for returns. Journal of AccountingResearch (Spring): 19–36.
Elgers, P., M. Lo, and R. Pfeiffer. 2001. Delayed security price adjustments to financial analysts’forecasts of annual earnings. The Accounting Review 76 (4): 613–632.
———, ———, and ———. 2003. Analysts vs. investors weightings of accruals in forecasting annualearnings. Journal of Accounting and Public Policy 22: 255–280.
Fairfield, P., R. Sweeney, and T. Yohn. 1996. Accounting classification and the predictive content ofearnings. The Accounting Review (July): 337–355.
———, and T. Yohn. 2001. Using asset turnover and profit margin to forecast changes in profitability.Review of Accounting Studies (December): 371–385.
———, J. Whisenant, and T. Yohn. 2003a. The differential persistence of accruals and cash flows forfuture operating income versus future profitability. The Review of Accounting Studies 8: 221–243.
———, ———, and ———. 2003b. Accrued earnings and growth: Implications for earnings per-sistence and market mispricing. The Accounting Review (January): 353–371.
Fama, E., and J. Macbeth. 1973. Risk, return and equilibrium—Empirical tests. Journal of PoliticalEconomy (May/June): 607–641.
———. 1990. Stock returns, expected returns and real activity. Journal of Finance (September): 1089–1108.
———, and K. French. 1993. Common risk factors in the returns of stocks and bonds. Journal ofFinancial Economics 33: 3–56.
Feltham, G., and J. Ohlson. 1995. Valuation and clean surplus accounting for operating and financialactivities. Contemporary Accounting Research (Spring): 689–731.
Francis, J., and K. Schipper. 1999. Have financial statements lost their relevance? Journal of Account-ing Research (Autumn): 319–352.
Ge, W., and M. Soliman. 2007. Achieving competitive advantage through product differentiation andcost efficiency: A new approach with new insights. Working paper, University of Washington.
Hayn, C. 1995. The information content of losses. Journal of Accounting and Economics 20 (2): 125–154.
Holthausen, R., and D. Larcker. 1992. The prediction of stock returns using financial statement anal-ysis. Journal of Accounting and Economics 15: 373–411.
Iman, R., and W. Conover. 1979. The use of the rank transformation in regression. Technometrics(November): 499–509.
Klein, A. 1990. A direct test of the cognitive bias theory of share price reversals. Journal of Accountingand Economics 13: 155–166.
Kormendi, R., and R. Lipe. 1987. Earnings innovations, earnings persistence, and stock returns. Jour-nal of Business 60: 323–345.

852 Soliman
The Accounting Review, May 2008
Kothari, S. P. 1992. Price-earnings regressions in the presence of prices leading earnings. Journal ofAccounting and Economics 15: 173–202.
———, and R. Sloan. 1992. Information in prices about future earnings: Implications for earningsresponse coefficients. Journal of Accounting and Economics 15: 143–171.
———. 2001. Capital markets research in accounting. Journal of Accounting and Economics 31:105–231.
Lee, C. 1999. Accounting-based valuation: Impact on business practices and research. AccountingHorizons 13: 413–425.
Lev, B. 1989. On the usefulness of earnings: Lessons and directions from two decades of empiricalresearch. Journal of Accounting Research (Supplement): 153–192.
———, and S. Thiagarajan. 1993. Fundamental information analysis. Journal of Accounting Research(Autumn): 190–215.
Lipe, R. 1986. The information contained in the components of earnings. Journal of AccountingResearch (Supplement): 37–64.
Lys, T., and S. Sohn. 1990. The association between revisions of financial analysts’ earnings forecastsand security price changes. Journal of Accounting and Economics 13: 341–363.
McNichols, M., and P. O’Brien. 1997. Self-selection and analyst coverage. Journal of AccountingResearch (Supplement): 167–199.
Mendenhall, R. 1991. Evidence on the possible underweighting of earnings-related information. Jour-nal of Accounting Research 29 (10): 170–179.
Modigliani, F., and M. Miller. 1958. The cost of capital, corporation finance and the theory of in-vestment. American Economic Review (June): 261–297.
Newey, W., and K. West. 1987. A simple, positive, semi-definite, heteroscedasticity and autocorrela-tion consistent covariance matrix. Econometrica 55: 703–708.
Nissim, D., and S. Penman. 2001. Ratio analysis and equity valuation: From research to practice.Review of Accounting Studies (March): 109–154.
Ohlson, J. 1995. Earnings, book values, and dividends in security valuation. Contemporary AccountingResearch (Spring): 661–687.
———. 1999. On transitory earnings. Review of Accounting Studies (December): 145–162.Ou, J., and S. Penman. 1989. Financial statement analysis and the prediction of stock returns. Journal
of Accounting and Economics 11: 295–329.Penman, S. 1992. Return to fundamentals. Journal of Accounting, Auditing and Finance (Autumn):
465–482.———. 2001. Financial Statement Analysis and Security Valuation. 1st edition. New York, NY:
McGraw Hill.———, and X. Zhang. 2003. Modeling sustainable earnings and P/E ratios using financial statement
information. Working paper, Columbia University.Richardson, S., R. Sloan, M. Soliman, and I. Tuna. 2005. Accrual reliability, earnings persistence and
stock prices. Journal of Accounting and Economics 39: 437–485.———, ———, ———, and ———. 2006. The implications of firm growth and accounting distor-
tions for accruals and profitability. The Accounting Review 81: 713–743.Romer, P. 1986. Increasing returns and long-run growth. Journal of Political Economy 94 (51): 1002–
1037.Shumway, T. 1997. The delisting bias in CRSP data. Journal of Finance 52: 327–340.———, and V. Warther. 1999. The delisting bias in CRSP’s Nasdaq data and its implications for the
size effect. Journal of Finance 54: 2361–2379.Sloan, R. 1996. Do stock prices fully reflect information in accruals and cash flows about future
earnings? The Accounting Review (July): 289–315.Soliman, M. 2004. Using industry-adjusted DuPont analysis to predict future profitability and returns.
Ph.D. dissertation, University of Michigan.Stober, T. 1992. Summary financial statement measures and analysts’ forecasts of earnings. Journal
of Accounting and Economics 15: 347–372.Verbeek, M. 2000. A Guide to Modern Econometrics. 1st edition. New York, NY: John Wiley & Sons.

The Use of DuPont Analysis by Market Participants 853
The Accounting Review, May 2008
Vuong, Q. 1989. Likelihood ratio tests for model selection and non-nested hypotheses. Econometrica(March): 307–333.
Walther, B. 1997. Investor sophistication and market earnings expectations. Journal of AccountingResearch 35 (2): 157–179.
Warfield, T. and J. Wild. 1992. Accounting recognition and the relevance of earnings as an explanatoryvariable for returns. Accounting Review 67 (4): 821–842.
Related Documents