ARTICLES PUBLISHED ONLINE: 2 JUNE 2013 | DOI: 10.1038/NGEO1832 The acceleration of oceanic denitrification during deglacial warming Eric D. Galbraith, Markus Kienast and the NICOPP working group members † Over much of the ocean’s surface, productivity and growth are limited by a scarcity of bioavailable nitrogen. Sedimentary δ 15 N records spanning the last deglaciation suggest marked shifts in the nitrogen cycle during this time, but the quantification of these changes has been hindered by the complexity of nitrogen isotope cycling. Here we present a database of δ 15 N in sediments throughout the world’s oceans, including 2,329 modern seafloor samples, and 76 timeseries spanning the past 30,000 years. We show that the δ 15 N values of modern seafloor sediments are consistent with values predicted by our knowledge of nitrogen cycling in the water column. Despite many local deglacial changes, the globally averaged δ 15 N values of sinking organic matter were similar during the Last Glacial Maximum and Early Holocene. Considering the global isotopic mass balance, we explain these observations with the following deglacial history of nitrogen inventory processes. During the Last Glacial Maximum, the nitrogen cycle was near steady state. During the deglaciation, denitrification in the pelagic water column accelerated. The flooding of continental shelves subsequently increased denitrification at the seafloor, and denitrification reached near steady-state conditions again in the Early Holocene. We use a recent parameterization of seafloor denitrification to estimate a 30–120% increase in benthic denitrification between 15,000 and 8,000 years ago. Based on the similarity of globally averaged δ 15 N values during the Last Glacial Maximum and Early Holocene, we infer that pelagic denitrification must have increased by a similar amount between the two steady states. N itrogen is a critical component of all living matter. But despite the ubiquity of dissolved N 2 gas in the ocean, its bioavailable forms (N bio , most of which is NO 3 - ) are scarce in the sunlit surface layer, and its limited supply exerts the primary nutritional constraint on the marine ecosystem. Within the oceans, N 2 is fixed to N bio almost entirely by micro-organisms near the ocean surface, and returned to N 2 by denitrification (including anammox) in suboxic zones of the water column and sediment, turning over the N bio inventory on a timescale of ∼3 kyr (ref. 1). The nitrogen cycle can alter the radiative properties of the atmosphere, through the generation of N 2 O (ref. 2) and by supporting the biological sequestration of CO 2 in the ocean 3,4 . Humans are transforming the nitrogen cycle by approximately doubling the pre-industrial rate of terrestrial N 2 fixation and by sup- plying N bio to the ocean surface through rivers and the atmosphere 1 . Meanwhile, anthropogenic warming is expected to increase the rate of denitrification, by expanding water column oxygen minimum zones 1,5 , and to modify the supply routes of nitrate by changing ocean circulation 6 . However, the observational record of oceanic nitrate concentrations is much shorter than the residence time of N bio and is barely able to resolve decadal fluctuations in nitrate availability 7 , preventing the identification of climatic trends. In contrast, the geological record spans vast timescales and documents large climate shifts, such as the glacial/interglacial cycles. The nitrogen stable isotope ratio (δ 15 N = (( 15 N/ 14 N sample )/ ( 15 N/ 14 N ref ) - 1) * 1,000h, where 15 N/ 14 N ref refers to atmospheric N 2 ) of sinking organic matter is preserved in marine sediments 8 , providing a window on past changes in the nitrogen cycle. Over recent decades, an understanding of nitrogen isotope systematics has developed from field and laboratory studies, and nitrogen isotope records have been generated from seafloor sediments extending back thousands (or in some cases millions) of years. The sedimentary record of the last ice age cycle is particularly well † A full list of authors and their affiliations appears at the end of the paper sampled, and has revealed signs that pelagic denitrification was less active during cold periods 3,9 . Meanwhile, the subaerial exposure of continental shelves during glacial sea-level low-stands would have eliminated the most active regions of benthic denitrification 10 , leading to a further reduction in the loss rate of N bio . Efforts to reconstruct past denitrification rates have, to date, proceeded piecemeal, focusing on small numbers of records. Here we present the first global analysis of available δ 15 N observations, starting with a synoptic picture of the present day seafloor, and proceeding to a quantitative analysis of the last deglaciation. A synoptic view of N isotopes in the modern ocean The δ 15 N of organic matter at the ocean surface depends on two factors: the global mean δ 15 N of N bio (δ 15 N mean , currently ∼5h), and the differential distribution of 14 N and 15 N within the ocean. The relative rates of N 2 fixation and denitrification are the primary controls on δ 15 N mean (ref. 11, Fig. 1), and alter the distribution of δ 15 N by imprinting their isotopic signatures where they are most intense. Meanwhile, the preferential partitioning of 14 N into sinking organic particles by the marine ecosystem conspires with ocean circulation to produce a second, more subtle class of isotopic redistribution. We refer to these as ‘inventory-altering’ and ‘internal-cycling’ fractionation processes, respectively (see Supplementary Information for more information). The sinking of particulate organic matter transfers the isotopic signature of surface ocean nitrogen to the seafloor 8,12 . Figure 2a shows our compilation of 2,329 measurements of the δ 15 N of total combustible (bulk) nitrogen at the modern seafloor. These measurements show good lateral continuity in most parts of the ocean, with strong gradients generally occurring in regions with strong oceanographic fronts 13 . Some aspects of the large-scale pat- terns correspond directly to the distribution of inventory-altering and internal-cycling processes, as expected from local studies 3,9,14 . NATURE GEOSCIENCE | ADVANCE ONLINE PUBLICATION | www.nature.com/naturegeoscience 1 © 2013 Macmillan Publishers Limited. All rights reserved.

Welcome message from author
This document is posted to help you gain knowledge. Please leave a comment to let me know what you think about it! Share it to your friends and learn new things together.
Transcript
ARTICLESPUBLISHED ONLINE: 2 JUNE 2013 | DOI: 10.1038/NGEO1832
The acceleration of oceanic denitrification duringdeglacial warmingEric D. Galbraith, Markus Kienast and the NICOPP working group members†
Over much of the ocean’s surface, productivity and growth are limited by a scarcity of bioavailable nitrogen. Sedimentary δ15Nrecords spanning the last deglaciation suggest marked shifts in the nitrogen cycle during this time, but the quantification ofthese changes has been hindered by the complexity of nitrogen isotope cycling. Here we present a database of δ15N in sedimentsthroughout the world’s oceans, including 2,329 modern seafloor samples, and 76 timeseries spanning the past 30,000 years.We show that the δ15N values of modern seafloor sediments are consistent with values predicted by our knowledge of nitrogencycling in the water column. Despite many local deglacial changes, the globally averaged δ15N values of sinking organic matterwere similar during the Last Glacial Maximum and Early Holocene. Considering the global isotopic mass balance, we explainthese observations with the following deglacial history of nitrogen inventory processes. During the Last Glacial Maximum,the nitrogen cycle was near steady state. During the deglaciation, denitrification in the pelagic water column accelerated.The flooding of continental shelves subsequently increased denitrification at the seafloor, and denitrification reached nearsteady-state conditions again in the Early Holocene. We use a recent parameterization of seafloor denitrification to estimate a30–120% increase in benthic denitrification between 15,000 and 8,000 years ago. Based on the similarity of globally averagedδ15N values during the Last Glacial Maximum and Early Holocene, we infer that pelagic denitrification must have increased bya similar amount between the two steady states.
Nitrogen is a critical component of all living matter. Butdespite the ubiquity of dissolved N2 gas in the ocean, itsbioavailable forms (Nbio, most of which is NO3
−) are scarcein the sunlit surface layer, and its limited supply exerts the primarynutritional constraint on the marine ecosystem. Within the oceans,N2 is fixed to Nbio almost entirely by micro-organisms near theocean surface, and returned to N2 by denitrification (includinganammox) in suboxic zones of the water column and sediment,turning over theNbio inventory on a timescale of∼3 kyr (ref. 1). Thenitrogen cycle can alter the radiative properties of the atmosphere,through the generation of N2O (ref. 2) and by supporting thebiological sequestration of CO2 in the ocean3,4.
Humans are transforming the nitrogen cycle by approximatelydoubling the pre-industrial rate of terrestrialN2 fixation and by sup-plyingNbio to the ocean surface through rivers and the atmosphere1.Meanwhile, anthropogenic warming is expected to increase the rateof denitrification, by expanding water column oxygen minimumzones1,5, and to modify the supply routes of nitrate by changingocean circulation6. However, the observational record of oceanicnitrate concentrations is much shorter than the residence time ofNbio and is barely able to resolve decadal fluctuations in nitrateavailability7, preventing the identification of climatic trends.
In contrast, the geological record spans vast timescales anddocuments large climate shifts, such as the glacial/interglacialcycles. The nitrogen stable isotope ratio (δ15N= ((15N/14Nsample)/(15N/14Nref)−1)∗1,000h, where 15N/14Nref refers to atmosphericN2) of sinking organic matter is preserved in marine sediments8,providing a window on past changes in the nitrogen cycle. Overrecent decades, an understanding of nitrogen isotope systematicshas developed from field and laboratory studies, and nitrogenisotope records have been generated from seafloor sedimentsextending back thousands (or in some cases millions) of years.The sedimentary record of the last ice age cycle is particularly well
†A full list of authors and their affiliations appears at the end of the paper
sampled, and has revealed signs that pelagic denitrification was lessactive during cold periods3,9. Meanwhile, the subaerial exposureof continental shelves during glacial sea-level low-stands wouldhave eliminated the most active regions of benthic denitrification10,leading to a further reduction in the loss rate of Nbio. Effortsto reconstruct past denitrification rates have, to date, proceededpiecemeal, focusing on small numbers of records. Here we presentthe first global analysis of available δ15N observations, starting witha synoptic picture of the present day seafloor, and proceeding to aquantitative analysis of the last deglaciation.
A synoptic view of N isotopes in the modern oceanThe δ15N of organic matter at the ocean surface depends ontwo factors: the global mean δ15N of Nbio (δ15Nmean, currently∼5h), and the differential distribution of 14N and 15N withinthe ocean. The relative rates of N2 fixation and denitrification arethe primary controls on δ15Nmean (ref. 11, Fig. 1), and alter thedistribution of δ15N by imprinting their isotopic signatures wherethey are most intense. Meanwhile, the preferential partitioning of14N into sinking organic particles by themarine ecosystem conspireswith ocean circulation to produce a second, more subtle class ofisotopic redistribution. We refer to these as ‘inventory-altering’and ‘internal-cycling’ fractionation processes, respectively (seeSupplementary Information for more information). The sinking ofparticulate organic matter transfers the isotopic signature of surfaceocean nitrogen to the seafloor8,12.
Figure 2a shows our compilation of 2,329 measurements of theδ15N of total combustible (bulk) nitrogen at the modern seafloor.These measurements show good lateral continuity in most parts ofthe ocean, with strong gradients generally occurring in regions withstrong oceanographic fronts13. Some aspects of the large-scale pat-terns correspond directly to the distribution of inventory-alteringand internal-cycling processes, as expected from local studies3,9,14.
NATURE GEOSCIENCE | ADVANCE ONLINE PUBLICATION | www.nature.com/naturegeoscience 1© 2013 Macmillan Publishers Limited. All rights reserved.
ARTICLES NATURE GEOSCIENCE DOI: 10.1038/NGEO1832
0 5¬5 10¬10
benthicpelagic
Pelagic < benthicδ15Nmean
δ15Nmean
N2 fixation andterrestrial input
Pelagic = benthic
Benthicdenitrification
Pelagicdenitrification
0 5¬5 10¬10
εε
pelagicε benthicε
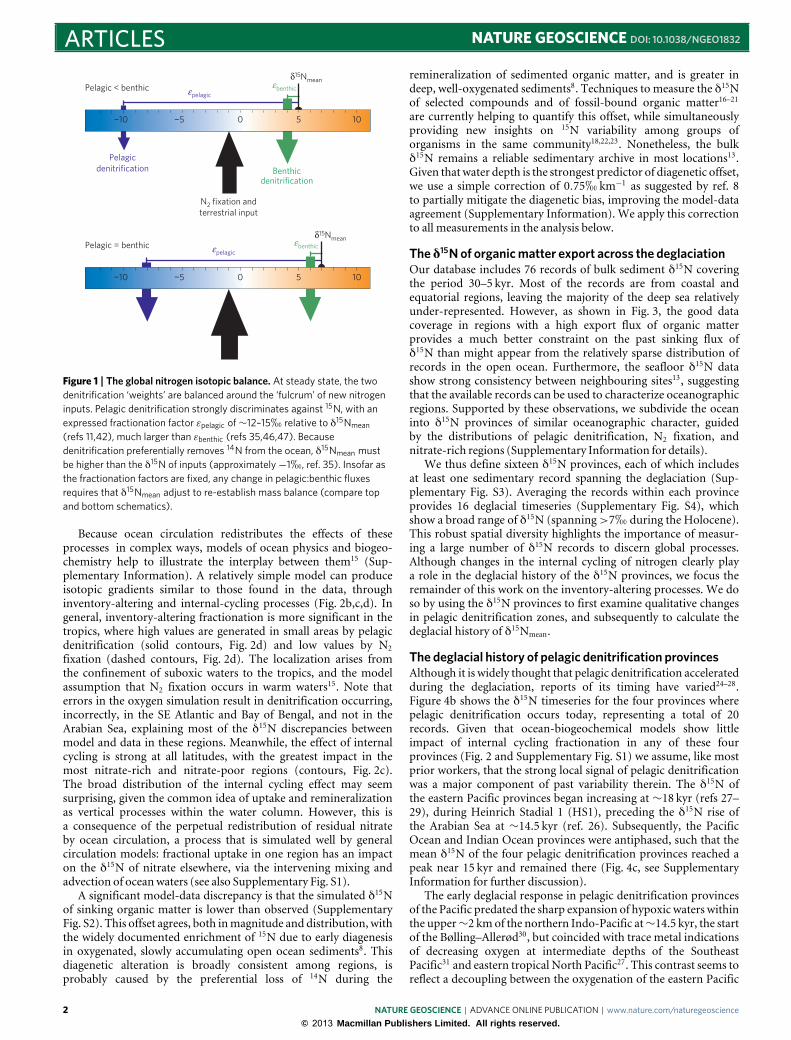
Figure 1 | The global nitrogen isotopic balance. At steady state, the twodenitrification ‘weights’ are balanced around the ‘fulcrum’ of new nitrogeninputs. Pelagic denitrification strongly discriminates against 15N, with anexpressed fractionation factor εpelagic of∼12–15h relative to δ15Nmean
(refs 11,42), much larger than εbenthic (refs 35,46,47). Becausedenitrification preferentially removes 14N from the ocean, δ15Nmean mustbe higher than the δ15N of inputs (approximately−1h, ref. 35). Insofar asthe fractionation factors are fixed, any change in pelagic:benthic fluxesrequires that δ15Nmean adjust to re-establish mass balance (compare topand bottom schematics).
Because ocean circulation redistributes the effects of theseprocesses in complex ways, models of ocean physics and biogeo-chemistry help to illustrate the interplay between them15 (Sup-plementary Information). A relatively simple model can produceisotopic gradients similar to those found in the data, throughinventory-altering and internal-cycling processes (Fig. 2b,c,d). Ingeneral, inventory-altering fractionation is more significant in thetropics, where high values are generated in small areas by pelagicdenitrification (solid contours, Fig. 2d) and low values by N2fixation (dashed contours, Fig. 2d). The localization arises fromthe confinement of suboxic waters to the tropics, and the modelassumption that N2 fixation occurs in warm waters15. Note thaterrors in the oxygen simulation result in denitrification occurring,incorrectly, in the SE Atlantic and Bay of Bengal, and not in theArabian Sea, explaining most of the δ15N discrepancies betweenmodel and data in these regions. Meanwhile, the effect of internalcycling is strong at all latitudes, with the greatest impact in themost nitrate-rich and nitrate-poor regions (contours, Fig. 2c).The broad distribution of the internal cycling effect may seemsurprising, given the common idea of uptake and remineralizationas vertical processes within the water column. However, this isa consequence of the perpetual redistribution of residual nitrateby ocean circulation, a process that is simulated well by generalcirculation models: fractional uptake in one region has an impacton the δ15N of nitrate elsewhere, via the intervening mixing andadvection of oceanwaters (see also Supplementary Fig. S1).
A significant model-data discrepancy is that the simulated δ15Nof sinking organic matter is lower than observed (SupplementaryFig. S2). This offset agrees, both inmagnitude and distribution, withthe widely documented enrichment of 15N due to early diagenesisin oxygenated, slowly accumulating open ocean sediments8. Thisdiagenetic alteration is broadly consistent among regions, isprobably caused by the preferential loss of 14N during the
remineralization of sedimented organic matter, and is greater indeep, well-oxygenated sediments8. Techniques to measure the δ15Nof selected compounds and of fossil-bound organic matter16–21are currently helping to quantify this offset, while simultaneouslyproviding new insights on 15N variability among groups oforganisms in the same community18,22,23. Nonetheless, the bulkδ15N remains a reliable sedimentary archive in most locations13.Given that water depth is the strongest predictor of diagenetic offset,we use a simple correction of 0.75h km−1 as suggested by ref. 8to partially mitigate the diagenetic bias, improving the model-dataagreement (Supplementary Information). We apply this correctionto all measurements in the analysis below.
The δ15N of organic matter export across the deglaciationOur database includes 76 records of bulk sediment δ15N coveringthe period 30–5 kyr. Most of the records are from coastal andequatorial regions, leaving the majority of the deep sea relativelyunder-represented. However, as shown in Fig. 3, the good datacoverage in regions with a high export flux of organic matterprovides a much better constraint on the past sinking flux ofδ15N than might appear from the relatively sparse distribution ofrecords in the open ocean. Furthermore, the seafloor δ15N datashow strong consistency between neighbouring sites13, suggestingthat the available records can be used to characterize oceanographicregions. Supported by these observations, we subdivide the oceaninto δ15N provinces of similar oceanographic character, guidedby the distributions of pelagic denitrification, N2 fixation, andnitrate-rich regions (Supplementary Information for details).
We thus define sixteen δ15N provinces, each of which includesat least one sedimentary record spanning the deglaciation (Sup-plementary Fig. S3). Averaging the records within each provinceprovides 16 deglacial timeseries (Supplementary Fig. S4), whichshow a broad range of δ15N (spanning>7h during the Holocene).This robust spatial diversity highlights the importance of measur-ing a large number of δ15N records to discern global processes.Although changes in the internal cycling of nitrogen clearly playa role in the deglacial history of the δ15N provinces, we focus theremainder of this work on the inventory-altering processes. We doso by using the δ15N provinces to first examine qualitative changesin pelagic denitrification zones, and subsequently to calculate thedeglacial history of δ15Nmean.
The deglacial history of pelagic denitrification provincesAlthough it is widely thought that pelagic denitrification acceleratedduring the deglaciation, reports of its timing have varied24–28.Figure 4b shows the δ15N timeseries for the four provinces wherepelagic denitrification occurs today, representing a total of 20records. Given that ocean-biogeochemical models show littleimpact of internal cycling fractionation in any of these fourprovinces (Fig. 2 and Supplementary Fig. S1) we assume, like mostprior workers, that the strong local signal of pelagic denitrificationwas a major component of past variability therein. The δ15N ofthe eastern Pacific provinces began increasing at ∼18 kyr (refs 27–29), during Heinrich Stadial 1 (HS1), preceding the δ15N rise ofthe Arabian Sea at ∼14.5 kyr (ref. 26). Subsequently, the PacificOcean and Indian Ocean provinces were antiphased, such that themean δ15N of the four pelagic denitrification provinces reached apeak near 15 kyr and remained there (Fig. 4c, see SupplementaryInformation for further discussion).
The early deglacial response in pelagic denitrification provincesof the Pacific predated the sharp expansion of hypoxic waters withinthe upper∼2 kmof the northern Indo-Pacific at∼14.5 kyr, the startof the Bølling–Allerød30, but coincided with trace metal indicationsof decreasing oxygen at intermediate depths of the SoutheastPacific31 and eastern tropical North Pacific27. This contrast seems toreflect a decoupling between the oxygenation of the eastern Pacific
2 NATURE GEOSCIENCE | ADVANCE ONLINE PUBLICATION | www.nature.com/naturegeoscience
© 2013 Macmillan Publishers Limited. All rights reserved.

NATURE GEOSCIENCE DOI: 10.1038/NGEO1832 ARTICLES
Observed seafloor δ15N Model seafloor δ15N
Model sinking δ15N, internal-cycling only Model sinking δ15N, inventory-altering only
80° S
50° E 150° E 110° W 10° W 50° E 150° E 110° W 10° W
50° E 150° E 110° W 10° W 50° E 150° E 110° W 10° W
40° S
0°
40° N
80° N
a b
c d
80° S
40° S
0°
40° N
80° N
80° S
40° S
0°
40° N
80° N
80° S
40° S
0°
40° N
80° N
1
¬2¬10123456789101112
¬2¬10123456789101112
23456789101112131415
123456789101112131415
Figure 2 | The δ15N of bulk sedimentary organic matter as observed and simulated. a, Observed seafloor δ15N. b, Simulated δ15N from anocean-biogeochemistry model, with a diagenetic correction of 0.75h km−1. c, Simulated δ15N, including only ‘internal-cycling’ fractionation (shading) andmodelled surface nitrate concentrations (contours, in µmol l−1). See Supplementary Information for an alternative simulation. d, As in c, but for only‘inventory-altering’ fractionation (shading), with integrated pelagic denitrification rates (solid contours, 30 and 800 mmol N m−2 yr−1) and N2 fixationrates (dashed contours, 30 mmol N m−2 yr−1).
0
5
10
15
20
Figure 3 | Deglacial δ15N records and export flux at 100 m. Colouredshading shows a satellite-derived estimate of export production inmmol C m−2 d−1, according to the algorithm of ref. 48, while black circlesshow the locations of sediment records that have sufficient temporalresolution to be included in the deglacial analysis.
shadow zones and the northern Pacific thermocline. We note thatalthough the Atlantic Meridional Overturning-related mechanismof ref. 32 predicts the observed increases of hypoxic volume30, atmo-spheric N2O and Arabian Sea δ15N during the Bølling–Allerød30,32,it fails to predict the increase of pelagic denitrification in the Pacificduring HS1. Thus, at least one additional mechanism must havefueled eastern Pacific suboxia at this time, such as ventilation of thesuboxic zones, local winds33, or changes in nutrient supply34.
The deglacial history of ocean mean δ15NThe δ15Nmean is strongly controlled by the balance of pelagic:benthicdenitrification11,35 (Fig. 1). This property makes δ15Nmean a very
useful quantity to track over time. The globally distributed δ15N-province records allow us to estimate the average δ15N of organicmatter sinking out of the upper ocean (δ15Nglobal_export). Wedo this by weighting the δ15N-province records by a satellite-derived estimate of export production within each province, toachieve a flux-weighted estimate (Supplementary Information).If the ocean were perfectly mixed in terms of nitrogen isotopes,δ15Nglobal_export would be equal to δ15Nmean. However, because ofthe heterogeneous distribution of nitrogen isotopes in the ocean,δ15Nglobal_export would be expected to deviate from δ15Nmean tosome degree. To explore the difference between δ15Nglobal_exportand δ15Nmean, we used a simple two-box model of the oceanto produce a Monte Carlo estimate including a broad range ofvariations in denitrification, N2 fixation, terrigenous N supply andnitrate utilization, and compared this to the results of simulationswith ocean-biogeochemistrymodels (Supplementary Information).The results suggest that δ15Nmean = δ
15Nglobal_export + 1.0± 0.6h(1 s.d.), with the positive offset due mostly to partial nitrateconsumption in the surface ocean, and the export of newlyfixed nitrogen with low δ15N. This offset is likely to vary overtime to some degree, and deserves further study in the future,but it seems unlikely to have varied beyond our 1 s.d. boundsover the deglaciation. Finally, we vary the relative export fluxaccounted for by each of the δ15N provinces by ±20%, toreflect uncertain variations in export production that may havearisen from changes in nutrient supply and iron fertilization(Supplementary Information).
Figure 4e shows the resulting deglacial history of δ15Nmean,within a window of uncertainty calculated by the Monte Carlo as-sessment. Remarkably, despite the apparent acceleration of pelagic
NATURE GEOSCIENCE | ADVANCE ONLINE PUBLICATION | www.nature.com/naturegeoscience 3© 2013 Macmillan Publishers Limited. All rights reserved.
ARTICLES NATURE GEOSCIENCE DOI: 10.1038/NGEO1832
6
8
10
5.5
6.0
1.0
0.8
0.6
0.4
6.5
7.0
1.00
1.25
1.50
1.75
51015
Age (kyr)
202530
4
5
6
7
ETSP
ETNP
Arabian Sea
Tropical1 s.d.
HS1LGM EHBA
Modern pelagic denitrification
province mean
Globaltemperature
°C
δ15Nmean
Frac
tion
of m
oder
n
s.d. δ15N
()
Benthicdenitrification
b
a
c
d
e
1
¬1
¬3
δ15N
()
%%
δ15N
()
%%
δ15N
()
%%
%%
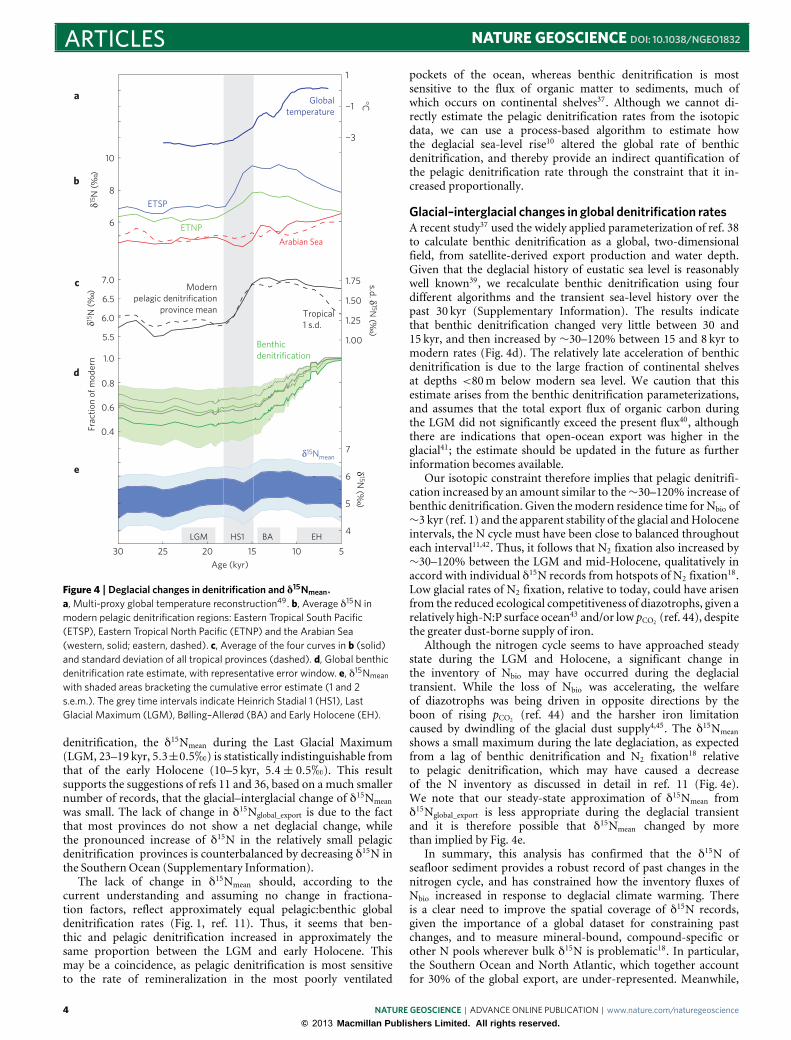
Figure 4 | Deglacial changes in denitrification and δ15Nmean.a, Multi-proxy global temperature reconstruction49. b, Average δ15N inmodern pelagic denitrification regions: Eastern Tropical South Pacific(ETSP), Eastern Tropical North Pacific (ETNP) and the Arabian Sea(western, solid; eastern, dashed). c, Average of the four curves in b (solid)and standard deviation of all tropical provinces (dashed). d, Global benthicdenitrification rate estimate, with representative error window. e, δ15Nmean
with shaded areas bracketing the cumulative error estimate (1 and 2s.e.m.). The grey time intervals indicate Heinrich Stadial 1 (HS1), LastGlacial Maximum (LGM), Bølling–Allerød (BA) and Early Holocene (EH).
denitrification, the δ15Nmean during the Last Glacial Maximum(LGM, 23–19 kyr, 5.3±0.5h) is statistically indistinguishable fromthat of the early Holocene (10–5 kyr, 5.4 ± 0.5h). This resultsupports the suggestions of refs 11 and 36, based on a much smallernumber of records, that the glacial–interglacial change of δ15Nmeanwas small. The lack of change in δ15Nglobal_export is due to the factthat most provinces do not show a net deglacial change, whilethe pronounced increase of δ15N in the relatively small pelagicdenitrification provinces is counterbalanced by decreasing δ15N inthe SouthernOcean (Supplementary Information).
The lack of change in δ15Nmean should, according to thecurrent understanding and assuming no change in fractiona-tion factors, reflect approximately equal pelagic:benthic globaldenitrification rates (Fig. 1, ref. 11). Thus, it seems that ben-thic and pelagic denitrification increased in approximately thesame proportion between the LGM and early Holocene. Thismay be a coincidence, as pelagic denitrification is most sensitiveto the rate of remineralization in the most poorly ventilated
pockets of the ocean, whereas benthic denitrification is mostsensitive to the flux of organic matter to sediments, much ofwhich occurs on continental shelves37. Although we cannot di-rectly estimate the pelagic denitrification rates from the isotopicdata, we can use a process-based algorithm to estimate howthe deglacial sea-level rise10 altered the global rate of benthicdenitrification, and thereby provide an indirect quantification ofthe pelagic denitrification rate through the constraint that it in-creased proportionally.
Glacial–interglacial changes in global denitrification ratesA recent study37 used the widely applied parameterization of ref. 38to calculate benthic denitrification as a global, two-dimensionalfield, from satellite-derived export production and water depth.Given that the deglacial history of eustatic sea level is reasonablywell known39, we recalculate benthic denitrification using fourdifferent algorithms and the transient sea-level history over thepast 30 kyr (Supplementary Information). The results indicatethat benthic denitrification changed very little between 30 and15 kyr, and then increased by ∼30–120% between 15 and 8 kyr tomodern rates (Fig. 4d). The relatively late acceleration of benthicdenitrification is due to the large fraction of continental shelvesat depths <80m below modern sea level. We caution that thisestimate arises from the benthic denitrification parameterizations,and assumes that the total export flux of organic carbon duringthe LGM did not significantly exceed the present flux40, althoughthere are indications that open-ocean export was higher in theglacial41; the estimate should be updated in the future as furtherinformation becomes available.
Our isotopic constraint therefore implies that pelagic denitrifi-cation increased by an amount similar to the∼30–120% increase ofbenthic denitrification. Given themodern residence time for Nbio of∼3 kyr (ref. 1) and the apparent stability of the glacial andHoloceneintervals, the N cycle must have been close to balanced throughouteach interval11,42. Thus, it follows that N2 fixation also increased by∼30–120% between the LGM and mid-Holocene, qualitatively inaccord with individual δ15N records from hotspots of N2 fixation18.Low glacial rates of N2 fixation, relative to today, could have arisenfrom the reduced ecological competitiveness of diazotrophs, given arelatively high-N:P surface ocean43 and/or low pCO2 (ref. 44), despitethe greater dust-borne supply of iron.
Although the nitrogen cycle seems to have approached steadystate during the LGM and Holocene, a significant change inthe inventory of Nbio may have occurred during the deglacialtransient. While the loss of Nbio was accelerating, the welfareof diazotrophs was being driven in opposite directions by theboon of rising pCO2 (ref. 44) and the harsher iron limitationcaused by dwindling of the glacial dust supply4,45. The δ15Nmeanshows a small maximum during the late deglaciation, as expectedfrom a lag of benthic denitrification and N2 fixation18 relativeto pelagic denitrification, which may have caused a decreaseof the N inventory as discussed in detail in ref. 11 (Fig. 4e).We note that our steady-state approximation of δ15Nmean fromδ15Nglobal_export is less appropriate during the deglacial transientand it is therefore possible that δ15Nmean changed by morethan implied by Fig. 4e.
In summary, this analysis has confirmed that the δ15N ofseafloor sediment provides a robust record of past changes in thenitrogen cycle, and has constrained how the inventory fluxes ofNbio increased in response to deglacial climate warming. Thereis a clear need to improve the spatial coverage of δ15N records,given the importance of a global dataset for constraining pastchanges, and to measure mineral-bound, compound-specific orother N pools wherever bulk δ15N is problematic18. In particular,the Southern Ocean and North Atlantic, which together accountfor 30% of the global export, are under-represented. Meanwhile,
4 NATURE GEOSCIENCE | ADVANCE ONLINE PUBLICATION | www.nature.com/naturegeoscience
© 2013 Macmillan Publishers Limited. All rights reserved.

NATURE GEOSCIENCE DOI: 10.1038/NGEO1832 ARTICLESstronger constraints on the isotopic effects, better process modelsof benthic denitrification, and independent measures of deep oceanδ15N and export production fluxes will reduce the quantitativeuncertainties. Finally, extending the global record of nitrogenisotopes further back in time will help to constrain the relationshipsbetween climate and the nitrogen cycle under a broader range ofenvironmental conditions.
MethodsThe NICOPP database is available at http://www.ncdc.noaa.gov/paleo/pubs/nicopp/nicopp.html.
Received 17 October 2012; accepted 25 April 2013;published online 2 June 2013
References1. Gruber, N. & Galloway, J. N. An Earth-system perspective of the global
nitrogen cycle. Nature 451, 293–296 (2008).2. Ravishankara, A. R., Daniel, J. S. & Portmann, R. W. Nitrous oxide (N2O): The
dominant ozone-depleting substance emitted in the 21st century. Science 326,123–125 (2009).
3. Ganeshram, R. S., Pedersen, T. F., Calvert, S. E. & Murray, J. W. Large changesin oceanic nutrient inventories from glacial to interglacial periods. Nature 376,755–758 (1995).
4. Falkowski, P. G. Evolution of the nitrogen cycle and its influence on thebiological sequestration of CO2 in the ocean. Nature 387, 272–275 (1997).
5. Schmittner, A., Oschlies, A., Matthews, H. D. & Galbraith, E. D.Future changes in climate, ocean circulation, ecosystems, and biogeochemicalcycling simulated for a business-as-usual CO2 emission scenario until year4000 AD. Glob. Biogeochem. Cycl. 22, GB1013 (2008).
6. Sarmiento, J. L., Hughes, T. M. C., Stouffer, R. J. & Manabe, S. Simulatedresponse of the ocean carbon cycle to anthropogenic climate warming. Nature393, 245–249 (1998).
7. Deutsch, C., Brix, H., Ito, T., Frenzel, H. & Thompson, L. Climate-forcedvariability of ocean hypoxia. Science 333, 336–339 (2011).
8. Robinson, R. S. et al. A review of nitrogen isotopic alteration in marinesediments. Paleoceanography 27, PA4203 (2012).
9. Altabet, M. A., Francois, R., Murray, D. W. & Prell, W. L. Climate-relatedvariations in denitrification in the Arabian Sea from sediment 15N/14N ratios.Nature 373, 506–509 (1995).
10. Christensen, J. J., Murray, J. W., Devol, A. H. & Codispoti, L. A. Denitrificationin continental shelf sediments hasmajor impact on the oceanic nitrogen budget.Glob. Biogeochem. Cycl. 1, 97–116 (1987).
11. Deutsch, C., Sigman, D. M., Thunell, R. C., Meckler, A. N. & Haug, G. H.Isotopic constraints on glacial/interglacial changes in the oceanic nitrogenbudget. Glob. Biogeochem. Cycl. 18, GB4012 (2004).
12. Altabet, M. A. et al. The nitrogen isotope biogeochemistry of sinkingparticles from the margin of the Eastern North Pacific. Deep-Sea Res. I 46,655–679 (1999).
13. Tesdal, J., Galbraith, E. D. & Kienast, M. Nitrogen isotopes in bulk marinesediment: linking seafloor observations with subseafloor records. Biogeosciences10, 101–118 (2013).
14. Altabet, M. A. & Francois, R. Sedimentary nitrogen isotopic ratio as arecorder for surface ocean nitrate utilization. Glob. Biogeochem. Cycl. 8,103–116 (1994).
15. Somes, C. J. et al. Simulating the global distribution of nitrogen isotopes in theocean. Glob. Biogeochem. Cycl. 24, GB4019 (2010).
16. McCarthy, M. D., Benner, R., Lee, C. & Fogel, M. L. Amino acid nitrogenisotopic fractionation patterns as indicators of heterotrophy in plankton,particulate, and dissolved organic matter. Geochim. Cosmochim. Acta 71,4727–4744 (2007).
17. Robinson, R. S. et al. Diatom-bound N-15/N-14: New support for enhancednutrient consumption in the ice age subantarctic. Paleoceanography 20,PA3003 (2005).
18. Ren, H. et al. Foraminiferal isotope evidence of reduced nitrogen fixation inthe ice age Atlantic Ocean. Science 323, 244–248 (2009).
19. Möbius, J., Gaye, B., Lahajnar, N., Bahlmann, E. & Emeis, K. C. Influence ofdiagenesis on sedimentary delta(15)N in the Arabian Sea over the last 130 kyr.Mar. Geol. 284, 127–138 (2011).
20. Sherwood, O. A., Lehmann, M. F., Schubert, C. J., Scott, D. B. & McCarthy,M. D. Nutrient regime shift in the western North Atlantic indicated bycompound-specific delta(15)N of deep-sea gorgonian corals. Proc. Natl Acad.Sci. USA 108, 1011–1015 (2011).
21. Higgins, M. B., Robinson, R. S., Carter, S. J. & Pearson, A. Evidence fromchlorin nitrogen isotopes for alternating nutrient regimes in the EasternMediterranean Sea. Earth Planet. Sci. Lett. 290, 102–107 (2010).
22. Brunelle, B. G. et al. Evidence from diatom-bound nitrogen isotopes forSubarctic Pacific stratification during the last ice age and a link to North Pacificdenitrification changes. Paleoceanography 22, PA1215 (2007).
23. Horn, M. G., Robinson, R. S., Rynearson, T. A. & Sigman, D. M. Nitrogenisotopic relationship between diatom-bound and bulk organic matter ofcultured polar diatoms. Paleoceanography 26, PA3208 (2011).
24. Pride, C. et al. Nitrogen isotopic variations in the Gulf of California since thelast deglaciation: Response to global climate change. Paleoceanography 14,397–409 (1999).
25. Emmer, E. & Thunell, R. C. Nitrogen isotope variations in SantaBarbara Basin sediments: Implications for denitrification in the easterntropical North Pacific during the last 50,000 years. Paleoceanography 15,377–387 (2000).
26. Suthhof, A., Ittekkot, V. & Gaye-Haake, B. Millennial-scale oscillation ofdenitrification intensity in the Arabian Sea during the late Quaternary and itspotential influence on atmospheric N2O and global climate. Glob. Biogeochem.Cycl. 15, 637–649 (2001).
27. Hendy, I. L. & Pedersen, T. F. Oxygen minimum zone expansion in theeastern tropical North Pacific during deglaciation. Geophys. Res. Lett. 33,L20602 (2006).
28. De Pol-Holz, R. et al. Melting of the Patagonian Ice Sheet and deglacialperturbations of the nitrogen cycle in the eastern South Pacific. Geophys. Res.Lett. 33, L04704 (2006).
29. Robinson, R., Mix, A. & Martinez, P. Southern Ocean control on the extent ofdenitrification in the southeast Pacific over the last 70 ky. Quat. Sci. Rev. 26,201–212 (2007).
30. Jaccard, S. L. & Galbraith, E. D. Large climate-driven changes of oceanicoxygen concentrations during the last deglaciataion. Nature Geosci. 5,151–156 (2012).
31. Muratli, J. M., Chase, Z., Mix, A. C. & McManus, J. Increased glacial-ageventilation of the Chilean margin by Antarctic Intermediate Water. NatureGeosci. 3, 23–26 (2010).
32. Schmittner, A. & Galbraith, E. D. Glacial greenhouse-gas fluctuationscontrolled by ocean circulation changes. Nature 456, 373–376 (2008).
33. Kienast, M. et al. Eastern Pacific cooling and Atlantic overturning circulationduring the last deglaciation. Nature 443, 846–849 (2006).
34. Martinez, P. & Robinson, R. S. Increase in water column denitrification duringthe last deglaciation: The influence of oxygen demand in the eastern equatorialPacific. Biogeosciences 7, 1–9 (2010).
35. Brandes, J. A. & Devol, A. H. A global marine-fixed nitrogen isotopic budget:Implications for Holocene nitrogen cycling. Glob. Biogeochem. Cycl. 16,1120 (2002).
36. Kienast, M. Unchanged nitrogen isotopic composition of organic matterin the South China Sea during the last climatic cycle: Global implications.Paleoceanography 15, 244–253 (2000).
37. Bianchi, D., Dunne, J. P., Sarmiento, J. L. & Galbraith, E. D. Data-basedestimates of suboxia, denitrification, and N2O production in the oceanand their sensitivities to dissolved O2. Glob. Biogeochem. Cycl. 26,GB2009 (2012).
38. Middelburg, J. J., Soetaert, K., Herman, P. M. J. & Heip, C. H. R.Denitrification in marine sediments: A model study. Glob. Biogeochem.Cycl. 10, 661–673 (1996).
39. Clark, P. U. et al. The last glacial maximum. Science 325, 710–714 (2009).40. Oka, A., Abe-Ouchi, A., Chikamoto, M. O. & Ide, T. Mechanisms
controlling export production at the LGM: Effects of changes in oceanicphysical fields and atmospheric dust deposition. Global Biochemical Cycles 25,GB2009 (2011).
41. Kohfeld, K., Le Quéré, C., Harrison, S. P. & Anderson, R. F. Role of marinebiology in glacial–interglacial CO2 cycles. Science 308, 74–78 (2005).
42. Altabet, M. A. Constraints on oceanic N balance/imbalance from sedimentary15N records. Biogeosciences 4, 75–86 (2007).
43. Tyrrell, T. The relative influences of nitrogen and phosphorus on oceanicprimary production. Nature 400, 525–531 (1999).
44. Hutchins, D. A. et al. CO2 control of Trichodesmium N2 fixation,photosynthesis, growth rates, and elemental ratios: Implications forpast, present, and future ocean biogeochemistry. Limnol. Oceanogr. 52,1293–1304 (2007).
45. Eugster, O., Gruber, N., Deutsch, C., Jaccard, S. L. & Payne,M. R. The dynamicsof the marine nitrogen cycle across the last deglaciation. Paleoceanography 28,1–14 (2013).
46. Lehmann, M. F. et al. The distribution of nitrate 15N/14N in marine sedimentsand the impact of benthic nitrogen loss on the isotopic composition of oceanicnitrate. Geochim. Cosmochim. Acta 71, 5384–5404 (2007).
47. Lehmann, M. F., Sigman, D. M. & Berelson, W. M. Coupling the 15N/14N and18 O/ 16 O of nitrate as a constraint on benthic nitrogen cycling.Mar. Chem. 88,1–20 (2004).
48. Dunne, J. P., Sarmiento, J. L. & Gnanadesikan, A. A synthesis of global particleexport from the surface ocean and cycling through the ocean interior and onthe seafloor. Glob. Biogeochem. Cycl. 21, GB4006 (2007).
NATURE GEOSCIENCE | ADVANCE ONLINE PUBLICATION | www.nature.com/naturegeoscience 5© 2013 Macmillan Publishers Limited. All rights reserved.
ARTICLES NATURE GEOSCIENCE DOI: 10.1038/NGEO1832
49. Shakun, J. D. et al. Global warming preceded by increasing carbondioxide concentrations during the last deglaciation. Nature484, 49–55 (2012).
AcknowledgementsSupport for the Nitrogen Cycle in the Oceans Past and Present (NICOPP) working groupmeetings was provided by PAGES, IMAGES and GEOTOP. E.D.G., D.B. and M.K. aresupported by the Canadian Institute for Advanced Research (CIFAR).
Author contributionsM.K., T.K. and E.D.G. initiated and led the NICOPP working group. J-E.T., E.D.G. andM.K. assembled the database.D.B.made theδ15N-province, benthic denitrification and
Eric D. Galbraith1*, Markus Kienast2, Ana Luiza Albuquerque3, Mark A. Altabet4, Fabian Batista5, Daniele Bianchi1,Stephen E. Calvert6, Sergio Contreras7, Xavier Crosta8, Ricardo De Pol-Holz9, Nathalie Dubois10, Johan Etourneau11,Roger Francois6, Ting-Chang Hsu12, Tara Ivanochko6, Samuel L. Jaccard13, Shuh-Ji Kao14, Thorsten Kiefer15,Stephanie Kienast2, Moritz F. Lehmann16, Philippe Martinez8, Matthew McCarthy5, Anna Nele Meckler13, Alan Mix17,Jürgen Möbius18, Tom F. Pedersen19, Laetitia Pichevin20, Tracy M. Quan21, Rebecca S. Robinson22, Evgeniya Ryabenko23,Andreas Schmittner17, Ralph Schneider24, Aya Schneider-Mor25, Masahito Shigemitsu26, Dan Sinclair27,Christopher Somes2, Anja S. Studer13, Jan-Erik Tesdal28, Robert Thunell29 and Jin-Yu Terence Yang30
1Department of Earth and Planetary Science, McGill University, 3450 University Street, Montreal, Quebec H3A 2A7, Canada, 2Department ofOceanography, Dalhousie University, 1355 Oxford Street, PO Box 15000, Halifax, Nova Scotia, B3H 4R2, Canada, 3Departamento de Geoquímica, Institutode Química, Universidade Federal Fluminense, Rio de Janeiro 24.020-015, Brazil, 4School for Marine Science and Technology, U MassachusettsDartmouth, 706 Rodney French Blvd, Massachusetts 02744-1221, New Bedford, USA, 5Ocean Sciences Deptartment, University of California, Santa Cruz95064, USA, 6Department of Earth Ocean and Atmospheric Sciences, University of British Columbia, 2020-2207 Main Mall, British Columbia, V6T 1Z4,Canada, 7Large Lakes Observatory, University of Minnesota Duluth, 2205 E. 5th Street, Research Laboratory Building 205, Duluth, Minnesota 55812, USA,8Université Bordeaux 1, UMR CNRS 5805 EPOC, Avenue des facultés, 33405 Talence cedex, France, 9Department of Oceanography, Center for Climateand Resilience Research (CR)2, Universidad de Concepción, Casilla 160-C, Concepcion 4070386, Chile, 10Woods Hole Oceanographic Institution, Clark120A, MS #23, Woods Hole, Massachusetts 02543, USA, 11UMR 7159 LOCEAN, Université Pierre et Marie Curie, Institut Pierre Simon Laplace, 4 PlaceJussieu, Boite 100, 75252 Paris Cedex 05, France, 12Research Center for Environmental Changes, Academia Sinica, 128 Academia Road, Sec. 2, NankangTaipei, Taiwan 115, R.O.C., 13Geological Institute, ETH Zurich, Sonneggstrasse 5, CH-8092 Zurich, Switzerland, 14Research Center for EnvironmentalChanges, Academia Sinica, Taipei 115, Taiwan, 15PAGES International Project Office, Zähringerstrasse 25, 3012 Bern, Switzerland, 16Department ofEnvironmental Sciences, University of Basel, Bernoullistrasse 30, CH-4056 Basel, Switzerland, 17College of Earth, Oceanic, & Atmospheric Sciences,Oregon State University, CEOAS Administration Building 104, Corvallis, Oregon 97331-5503, USA, 18Institute for Biogeochemistry and Marine Chemistry,Hamburg University, Bundesstrasse 55, 20146 Hamburg, Germany, 19Pacific Institute for Climate Solutions, University of Victoria, PO Box 1700 STN CSC,Victoria, British Columbia, V8W 2Y2, Canada, 20School of Geosciences, The University of Edinburgh, West Mains Road, Edinburgh EH9 3JW, Scotland, UK,21Boone Pickens School of Geology, Oklahoma State University, 105 Noble Research Center, Stillwater, Oklahoma 74074, USA, 22Graduate School ofOceanography, University of Rhode Island, Narragansett Bay Campus, Narragansett, Rhode Island 02882, USA, 23GEOMAR Helmholtz-Centre for OceanResearch Kiel, Düsternbrooker Weg 20, 24105 Kiel, Germany, 24Institut fuer Geowissenschaften, Christian-Albrechts-Universitaet zu Kiel,Ludewig-Meyn-Str. 10, 24118 Kiel, Germany, 25Department of Geological and Environmental Sciences, Stanford University, 367 Panama Street, California94305, Stanford, USA, 26Faculty of Environmental Earth Science, Hokkaido University, Sapporo 0600810, Japan, 27Institute of Marine and CoastalSciences, Rutgers University, Newark, 71 Dudley Road, New Brunswick, New Jersey 08901-8525, USA, 28School of Earth and Ocean Sciences, University ofVictoria, 3800 Finnerty Road (Ring Road), PO Box 1700 Station CSC, Victoria, British Columbia, V8W 2Y2, Canada, 29Department of Earth and OceanSciences, University of South Carolina, Columbia, South Carolina 29208, USA, 30State Key Laboratory of Marine Environmental Science, XiamenUniversity, Xiamen 361005, China. *e-mail: [email protected]
box model calculations. C.S. ran the UVic biogeochemical model simulations. E.D.G.wrote the manuscript with contributions from M.K. All coauthors participatedin discussions at the working group meetings and edited the manuscript, and/orcontributed previously unpublished data.
Additional informationSupplementary information is available in the online version of the paper. Reprints andpermissions information is available online at www.nature.com/reprints. Correspondenceand requests for materials should be addressed to E.G.
Competing financial interestsThe authors declare no competing financial interests.
6 NATURE GEOSCIENCE | ADVANCE ONLINE PUBLICATION | www.nature.com/naturegeoscience
© 2013 Macmillan Publishers Limited. All rights reserved.
Related Documents