Sustainable Communities and Public Education The 6th Houston Sustainability Indicators Report

Welcome message from author
This document is posted to help you gain knowledge. Please leave a comment to let me know what you think about it! Share it to your friends and learn new things together.
Transcript

Sustainable Communities and Public EducationT h e 6 t h H o u s t o n S u s t a i n a b i l i t y I n d i c a t o r s R e p o r t

Page 1 of 29
THE 6TH
HOUSTON SUSTAINBILITY INDICATORS REPORT
SUSTAINABLE COMMUNITIES AND PUBLIC EDUCATION
by
Lester King, PhD, AICP, LEED
October 2016
Shell Center for Sustainability Rice University
Houston, TX shellcenter.rice.edu

Page 2 of 29
THE SHELL CENTER FOR SUSTAINABILITY, RICE UNIVERSITY
6100 Main Street, Houston, TX. 77005
Any opinions, findings, conclusions, or recommendations expressed in this publication are those of the author and do not necessarily
reflect the views of the organizations or agencies that provided support for the project.
Additional copies of this report are available online at the Shell Center for Sustainability website. https://shellcenter.rice.edu.
Copyright 2016 by the Shell Center for Sustainability. All rights reserved
Page 3 of 29
Acknowledgements
About the Author:
Lester O. King, PhD, AICP, LEED Dr. King is an Urban Sustainability fellow with the Shell Center for Sustainability. He leads the Houston Sustainability Indicators program and is the lead author on this report. Dr. King is active both locally and nationally in terms of providing research intelligence to local communities and holding leadership positions on national organizations.
Project Advisors:
John B. Anderson, PhD Dr. Anderson is the Academic Director for the Shell Center for Sustainability and the Maurice Ewing Professor of Oceanography in the Department of Earth Science at Rice University.
Lyn Ragsdale, PhD Dr. Ragsdale is the former Dean of the School of Social Sciences, the Radoslav A. Tsanoff Chair in Public Affairs and Professor of Political Science at Rice University.
Lilibeth André Lilibeth Andre is the Associate Director of the Shell Center for Sustainability at Rice University since 2007. She manages the research, outreach and education activities of the center working directly with faculty, students, and other organizations and institutions.

Page 4 of 29

Page 5 of 29
Executive Summary
Location affordability has come to be primarily defined by keeping
housing costs plus transportation costs as a percentage of income
under 46% (Hulchanski, 1995; Stone, 2006; CNT, 2010; Mattingly &
Morrissey, 2014). This report evaluates a missing component of the
affordability equation, which is high school performance and its
impact on housing price and hence location decision (Machin, 2011;
Fack & Grenet, 2010; Gibbons & Machin, 2008).
In the Consumer Expenditures Survey (CES) for the Houston
metropolitan region, the average householder spent 33% of income
on housing costs, 21% on transportation costs and 1.6% of income on
education1. However, in the City of Houston, 20% of the k-12
students are enrolled in Private Schools2. Moreover, the average cost
of private school in the City of Houston is $13,1443. The problem
here, why the CES cost of education appears to be so low (1.6%)4, is
that there is a major difference between public school appreciation
for residents living within the City of Houston and those who live
outside of Houston, in the 10 county metropolitan region for which
the CES is calculated. Outside of Houston, in the more suburban
areas, there is a higher enrollment of k-12 students in public school
and hence much lower costs of education. Whereas in the City of
Houston, there may be less trust with the public education system
and hence people spend a much higher percentage of their income
on private schools.
1 (Bureau of Labor Statistics, 2013) 2 (Private School Review, 2014); (HISD 2013)
This report will add to the affordability question in Houston by
evaluating the importance of school performance on housing price.
The literature established to date suggests that most households
balance housing and transportation cost considerations in
determining where to live. Those who choose higher housing costs
will opt for lower transportation costs and vice versa (Lipman, 2006).
This dichotomy ignores proximity to quality schools and the premise
that urban public schools carry the stigma of poor performance.
Many people who choose to live in urban areas may also choose to
send their kids to private school (Holme, 2002; Dougherty, et al.,
2009).
The following research questions will be evaluated in this report:
What is the relative importance of school performance in
predicting housing value in Houston?
How can comprehensive sustainability indicators be used to
predict the variance in housing value?
We hope you find this report useful to better understand
affordability in Houston.
Sincerely,
Lester O. King, PhD
3 (Private School Review, 2014) 4 According to the CES the average education costs was $954

Page 6 of 29
The map above shows the outline of the City of Houston and boundaries of each Super Neighborhood. In the Northwest and West of the city,
the tendrils represent streets and the land immediately adjacent to the streets (commercial property), that was recently annexed into the City.

Page 7 of 29
TABLE OF CONTENTS
Acknowledgements .......................................................................................................... 3
Executive Summary .......................................................................................................... 5
HIGH SCHOOL PERFORMANCE AND HOUSING VALUE ....................................................... 9
HIGH SCHOOL PERFORMANCE ............................................................................................................................. 9
Graduation Rate............................................................................................................................................... 11
HOUSING VALUE ................................................................................................................................................... 12
Housing Value .................................................................................................................................................. 13
Geography and Performance ............................................................................................................................... 14
Sustainability Indicators........................................................................................................................................ 17
Study Results ........................................................................................................................................................ 19
What is the relative importance of school performance in predicting housing value in Houston?................ 19
CONCLUSION .................................................................................................................. 24
References ...................................................................................................................... 25

Page 8 of 29

Page 9 of 29
HIGH SCHOOL PERFORMANCE AND HOUSING VALUE
HIGH SCHOOL PERFORMANCE
The Houston Independent School District (HISD) serves 215,000
students in 287 schools5. HISD is the largest school district in
the state of Texas and the seventh (7th) largest in the nation.
The total revenue for HISD was $1.8 Billion in 20166. HISD is a
majority-minority urban school district with dual-language
instruction offered in 62 schools7. The racial/ ethnic population
of the district is 62% Hispanic, 24% African-American, 8% White
and 6% Other8. With the exception of the White student cohort
and the Hispanic student cohort, these numbers reflect the
racial/ethnic compositions in the City of Houston, which are
44% Hispanic, 23% African-American, 25% White and 8%
Other9. One reason for the difference in demographics is the
under-representation of the White cohort within HISD, which
may account for the Hispanic population constituting a larger
share of the HISD population.
5 HISD At-A-Glance (2016) 6 HISD 2015-2016 Facts and Figures 7 HISD At-A-Glace (2016)
This report does not directly address the reasons for the White
population being under-represented in HISD (relative to its
share of the overall population in Houston). Rather, we are
concerned with the impact of public school performance on
housing prices. Specifically if and how does public school
performance affect the housing prices across communities in
Houston. Since there are many factors that may influence the
housing prices across the city, we rely on the comprehensive
sustainability indicators from the Houston Sustainability
Indicators project (HSI), to make a robust attempt at
characterizing the relative impact of school performance as a
predictor of housing prices, when compared to many other
factors.
8 HISD 2015-2016 Facts and Figures 9 ACS 5Yr (2014)

Page 10 of 29
The performance of public High Schools in Houston are
routinely used to rate the desirability of neighborhoods and
communities (Hardy, Balke, & Rufca, 2015). Since students are
zoned to high schools based on place of residence within school
Feeder Boundaries10, then these boundaries can be used to
classify neighborhoods and communities, according to the
school performance in each respective zone.11 Figure 1, for
example, shows High School graduation rates, averaged by
Houston communities. Graduation rates across Houston
communities range from a high of 86% students graduating in
Museum Park to 56% students graduating in Settegast.
HISD currently has a policy of relieving overcrowding in schools
by adjusting the zoned attendance boundaries, thereby
10 HISD offers over 40 high school magnet programs. This means a student can choose to go to a school outside of their zoned school. However not all students who apply can get into their desired school due to lack of available seats. 11 For this analysis we calculated the average graduation rate for each Super Neighborhood community using the graduation rate of zoned high schools within HISD and the graduation rate for all high schools within the districts outside of HISD, that intersect with the City of Houston. For Super Neighborhoods within school districts outside of HISD, we first assigned a single graduation rate for each school district based on the average of all
redistributing students to different schools. This policy does not
properly empower existing communities in Houston, since the
attendance boundaries do not correspond with existing
community boundaries. Community leadership and
neighborhood involvement operates at the level of our
geographic communities and neighborhood boundaries, not at
the level of the feeder pattern around our children’s schools.
Therefore residents are not incentivized to invest time and
resources, since there is a ‘disconnect’ between school feeder
patterns and community boundaries.
the high schools within each respective school district. Next we calculated the graduation rate for each Super neighborhood based on the percentage of the Super Neighborhood that fell within the school feeder zone boundary or school district outside HISD. The output graduation rate was based on the percentage in which the school feeder zone area was divided. For example, if a Super Neighborhood (A) was divided by area 1/3 and 2/3 between two feeder zones (B) and (C), with 50% and 80% graduation rates respectively, the resulting graduation rate of (A) would be 1/3 x (50) + 2/3 x (80) = 69.3.

Page 11 of 29
Graduation Rate
Chart 1: Average graduation rate for High Schools by Super Neighborhood; Source: Children-At-Risk 2014 Greater Houston High School Rankings; Calculation by author; Data for Sam Houston High
School was retrieved from the 2014-2015 AEIS report produced by the Texas Education Agency (TEA).
86 8684 84 83 83 83 83 83 82 82 81 80 80 80 80 80 79 79 78 78 77 77 77 77 76 76 76 76 76 76 76 76 75 75 75 75 75 74 74 74 74 73 73 73 73 73 72 72 72 72 72 72 72 72 71 70 70 69 69 69 69 69 69 69 69 69 69 68 68 68 68 68 67 66 66 66 66 65 65 64 64 64 64
62 62 6156
0.00
10.00
20.00
30.00
40.00
50.00
60.00
70.00
80.00
90.00
100.00
Average Graduation Rate for High Schools by Super Neighborhood 2015
Page 12 of 29
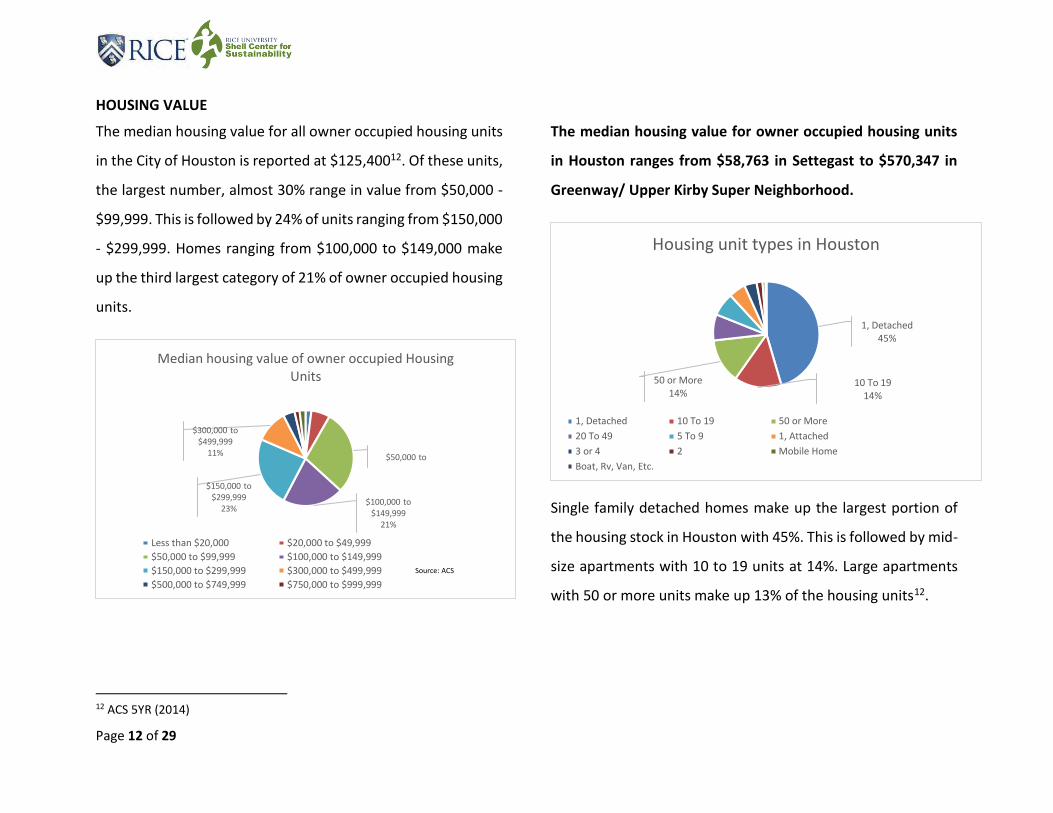
HOUSING VALUE
The median housing value for all owner occupied housing units
in the City of Houston is reported at $125,40012. Of these units,
the largest number, almost 30% range in value from $50,000 -
$99,999. This is followed by 24% of units ranging from $150,000
- $299,999. Homes ranging from $100,000 to $149,000 make
up the third largest category of 21% of owner occupied housing
units.
12 ACS 5YR (2014)
The median housing value for owner occupied housing units
in Houston ranges from $58,763 in Settegast to $570,347 in
Greenway/ Upper Kirby Super Neighborhood.
Single family detached homes make up the largest portion of
the housing stock in Houston with 45%. This is followed by mid-
size apartments with 10 to 19 units at 14%. Large apartments
with 50 or more units make up 13% of the housing units12.
$50,000 to
$100,000 to $149,999
21%
$150,000 to $299,999
23%
$300,000 to $499,999
11%
Median housing value of owner occupied Housing Units
Less than $20,000 $20,000 to $49,999
$50,000 to $99,999 $100,000 to $149,999
$150,000 to $299,999 $300,000 to $499,999
$500,000 to $749,999 $750,000 to $999,999
Source: ACS
1, Detached45%
10 To 1914%
50 or More14%
Housing unit types in Houston
1, Detached 10 To 19 50 or More
20 To 49 5 To 9 1, Attached
3 or 4 2 Mobile Home
Boat, Rv, Van, Etc.

Page 13 of 29
Housing Value
Chart 2: Median housing value by Super Neighborhood; Source: ACS 5Yr-2014
570,
347
56
9,6
40
53
7,1
40
51
7,8
03
46
6,7
08
41
0,3
33
39
7,5
66
39
0,5
98
33
4,0
50
32
6,4
43
31
0,3
05
30
8,0
58
292,
013
27
4,8
35
27
2,8
77
26
8,9
78
25
9,5
55
24
8,1
85
24
4,9
85
23
9,3
33
22
8,7
34
214
,67
920
0,5
35
197,
383
195,
44
019
2,3
50
187,
470
187,
158
187,
061
179,
448
175,
379
169,
715
168,
733
162,
857
160,
494
152,
004
142,
531
140,
420
139,
875
130,
190
123,
207
120,
741
120,
267
117,
130
116,
182
115,
674
112,
267
110,
180
107,
111
105,
710
103,
894
103,
275
102,
436
101,
293
97,3
5996
,723
96,7
0094
,307
93,5
0492
,341
90,8
3887
,535
87,2
5086
,650
86,4
0485
,958
85,8
4684
,469
84,3
8684
,100
83,3
3082
,828
81,9
3081
,436
77,2
3877
,063
73,7
8673
,717
73,1
1069
,852
69,7
4068
,829
63,6
9163
,600
63,1
0562
,524
61,9
3358
,763
0.00
100,000.00
200,000.00
300,000.00
400,000.00
500,000.00
600,000.00
Median Housing Value by Superneighborhood 2014
Page 14 of 29
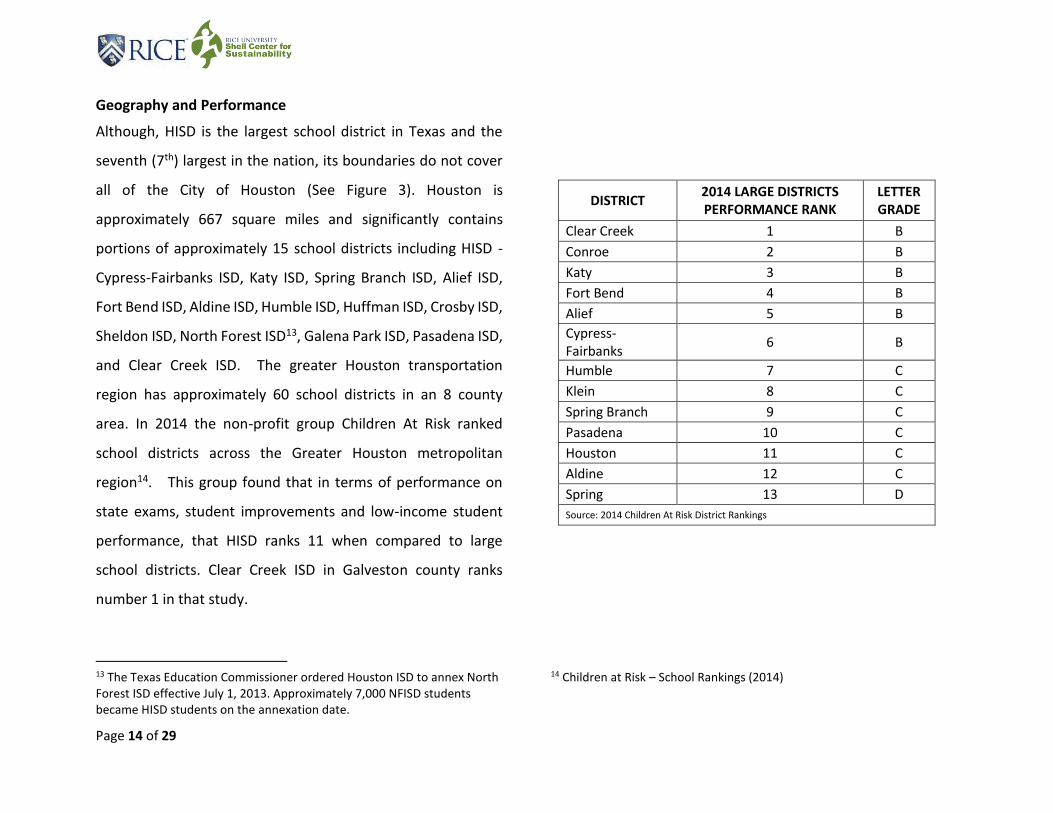
Geography and Performance
Although, HISD is the largest school district in Texas and the
seventh (7th) largest in the nation, its boundaries do not cover
all of the City of Houston (See Figure 3). Houston is
approximately 667 square miles and significantly contains
portions of approximately 15 school districts including HISD -
Cypress-Fairbanks ISD, Katy ISD, Spring Branch ISD, Alief ISD,
Fort Bend ISD, Aldine ISD, Humble ISD, Huffman ISD, Crosby ISD,
Sheldon ISD, North Forest ISD13, Galena Park ISD, Pasadena ISD,
and Clear Creek ISD. The greater Houston transportation
region has approximately 60 school districts in an 8 county
area. In 2014 the non-profit group Children At Risk ranked
school districts across the Greater Houston metropolitan
region14. This group found that in terms of performance on
state exams, student improvements and low-income student
performance, that HISD ranks 11 when compared to large
school districts. Clear Creek ISD in Galveston county ranks
number 1 in that study.
DISTRICT 2014 LARGE DISTRICTS PERFORMANCE RANK
LETTER GRADE
Clear Creek 1 B
Conroe 2 B
Katy 3 B
Fort Bend 4 B
Alief 5 B
Cypress-Fairbanks
6 B
Humble 7 C
Klein 8 C
Spring Branch 9 C
Pasadena 10 C
Houston 11 C
Aldine 12 C
Spring 13 D
Source: 2014 Children At Risk District Rankings
13 The Texas Education Commissioner ordered Houston ISD to annex North Forest ISD effective July 1, 2013. Approximately 7,000 NFISD students became HISD students on the annexation date.
14 Children at Risk – School Rankings (2014)

Page 15 of 29

Page 16 of 29

Page 17 of 29
Sustainability Indicators
The measures used in this study were taken from the 2016
update of the Houston Sustainability Indicators (HSI). This
update utilizes 2014 data, primarily because of the update
schedule of the American Community Survey’s 5-Year Block-
Group data update. All data was aggregated to the geographic
level of Super Neighborhoods in Houston.
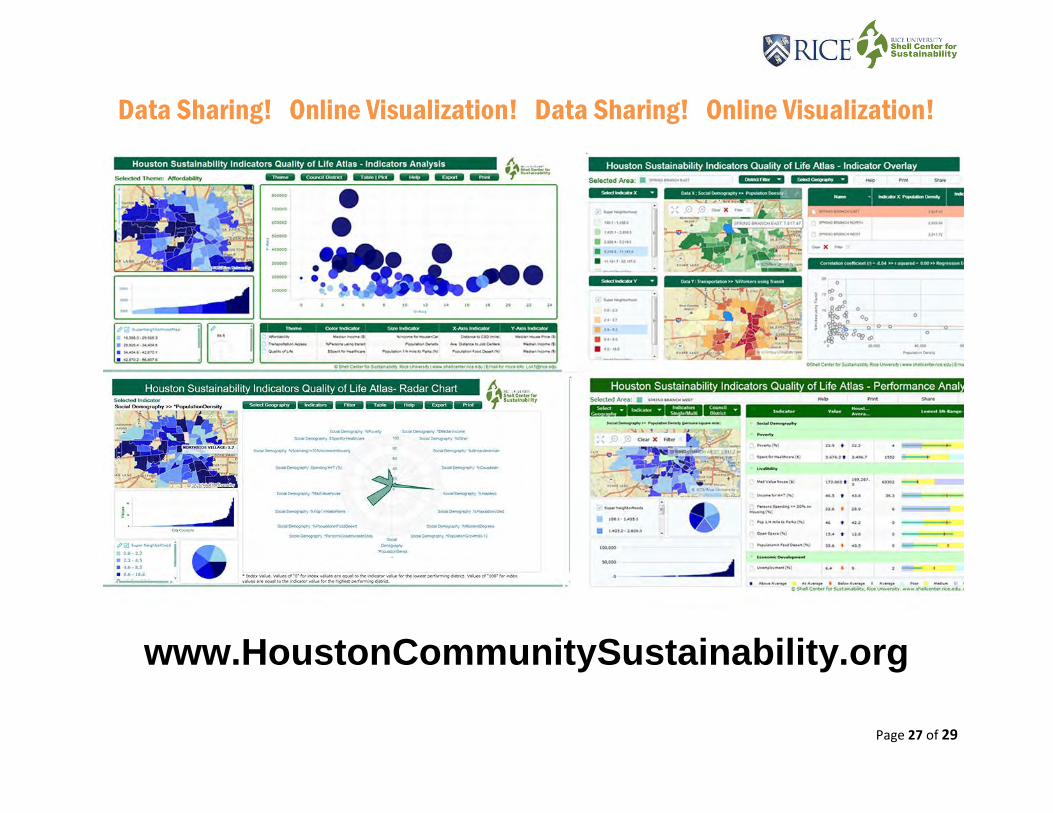
HSI consists of a procedure and methodology for a robust program to
monitor sustainable development in the Houston, Texas area. HSI
data is reported publicly through a web-based platform called the
Houston Sustainability Indicators Quality of Life Atlas. This
visualization portal is capable of monitoring key urban performance
indicators for Houston, and analyzing trends and correlations
between indicators. This tool is also capable of supporting the
development of short term and long range policy implications. The
HSI database serves as a resource for various local government
departments, elected officials, and local neighborhood organizations
for urban sustainability projects.
Following a model of integrative science for building a
comprehensive indicators dataset, the HSI data integrates a robust
collection of different datasets including: raster data from the
National Land Cover Database (NLCD) developed by the U.S.
Geological Survey; Greenhouse Gas emissions inventory from the
Vulcan Project based at Arizona State University; Continuous cover of
National Ambient Air Quality Standards (NAAQS) from the
Environmental Protection Agency; Business agglomeration analysis
and monitoring growth in primary businesses from InfoUSA; Local
and State administrative data on voting performance, waste
management, parks development, and capital improvement
projects; Decennial Census and American Community Survey socio-
economic data is also included.
The HSI Project is now in its fifth 5th year and has published 5
previous annual reports. HSI has contributed to conference
proceedings throughout the US and internationally in Ireland,
Barbados, Brazil, Canada and Portugal. The research provides hands
on learning opportunities for students in various academic units at
Rice University, including the Department of Statistics, the
Professional Science Masters Program, and the Jones School of
Business.

Page 18 of 29
Sustainability Pillar
SNBR Theme SNBR SubTheme SNBR Indicator SNBR Metrics
Social Development (13 Metrics)
Social Demography
Demographics Race/ Ethnicity
Race and ethinicity (%White)
Race and ethinicity (%Black)
Race and ethinicity (%Other)
Education
Education Attainment Population with High School Degree or less
High School Performance Zoned High School Graduation Rate
High School Demographics
High School Race and ethinicity (%White)
High School Race and ethinicity (%Other)
High School Race and ethinicity (%Black)
Poverty/ Wealth
Wealth Income Median Household Income
Poverty Level Population living below poverty
Percent below poverty
Livability
Cost of Living Affordability Housing + transportation costs as percentage of income
Quality of Life Accessibility of Public Parks %Pop within 1/4 mile to parks
Health & Nutrition Population in Food Deserts Percent of population in food desert
Economic Development
(4 Metrics)
Economic Development
Employment Employment Status Unemployment rate
Economic Performance Primary Jobs Primary jobs as a percentage of total jobs
Transportation Access Access to Transit % Population ¼ mile to transit stops
Mode Travel Choice % Population using Transit to work
Environmental Development (4 Metrics)
Land
Flooding Floodplain Expansion % Population within 100 Yr Floodplain
Sprawl City Size Distance to CBD
Density Population Density Population Density
Land Use Land Use Mix Land Use Mix index (HHI)
Table showing the Sustainability Indicators and Metrics from the HSI dataset used in this study
Page 19 of 29
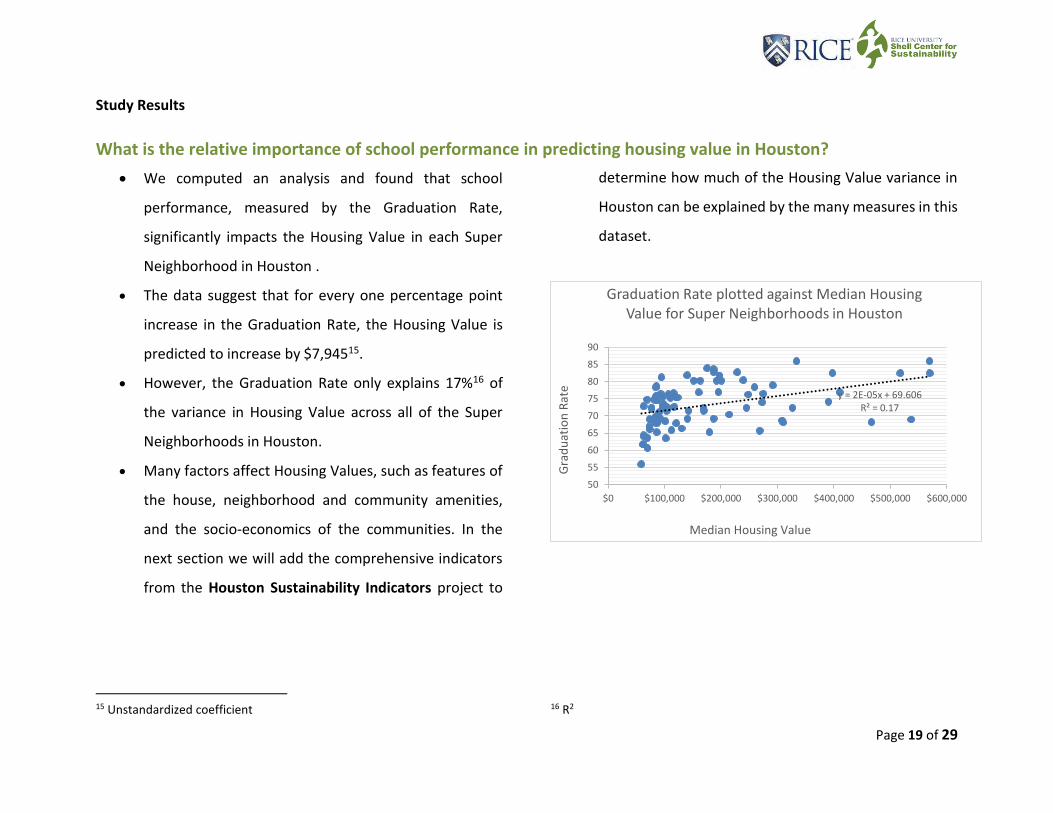
Study Results
What is the relative importance of school performance in predicting housing value in Houston?
We computed an analysis and found that school
performance, measured by the Graduation Rate,
significantly impacts the Housing Value in each Super
Neighborhood in Houston .
The data suggest that for every one percentage point
increase in the Graduation Rate, the Housing Value is
predicted to increase by $7,94515.
However, the Graduation Rate only explains 17%16 of
the variance in Housing Value across all of the Super
Neighborhoods in Houston.
Many factors affect Housing Values, such as features of
the house, neighborhood and community amenities,
and the socio-economics of the communities. In the
next section we will add the comprehensive indicators
from the Houston Sustainability Indicators project to
determine how much of the Housing Value variance in
Houston can be explained by the many measures in this
dataset.
15 Unstandardized coefficient 16 R2
y = 2E-05x + 69.606R² = 0.17
50
55
60
65
70
75
80
85
90
$0 $100,000 $200,000 $300,000 $400,000 $500,000 $600,000
Gra
du
atio
n R
ate
Median Housing Value
Graduation Rate plotted against Median Housing Value for Super Neighborhoods in Houston

Page 20 of 29
How can comprehensive sustainability indicators be used to predict the variance in housing value?
Step 1: First we computed an analysis17 to reduce the large number of indicators to a more manageable set. This was also
important because many of the variables were correlated and complementary. Our analysis was able to identify five (5) new
indexes that together can explain 73% of the variance in Housing Values. The Indexes were primarily composed of the variables
below.
Index 1: Wealth
Index 2: Ex-Urban Communities
Index 3: African American
Index 4:
Bedroom Communities
Index 5: Industrial
Communities
Median Income (.93) Distance to CBD (.91) High School Race (Black) (.90)
Pop Density (.76) Primary Jobs (.79)
White Pop (.92) Population ¼ Mile to Park (-.79)
Black Pop (.86) Food Desert (-.75) Housing + Transport Costs (-.645)
Below Poverty (-.87) Population ¼ Mile to Transit stop (-.65)
Transit Use (.63) Land Cover Mix (-39)
High School Degree or Less(-.80)
High School Race (Other) (.63)
Population in Flood Zone (.36)
White Students in Public High School (.70)
Other Race (.68)
Unemployed (-.66)
Graduation Rate (.51)
17 Principal components analysis with varimax orthogonal rotation. Used a cutoff of eigenvalues >1. KMO was 0.758

Page 21 of 29
Step2: Second we conducted another analysis to
predict the Housing Value using the values that each
Super Neighborhood scored on each of the five (5)
indices above.
We found that school performance, measured by four
(4) of the five (5) indices, significantly impacts the
Housing Value in each Super Neighborhood in
Houston18.
o Index 1: Wealthy Communities. For every one
percentage point increase in the cumulative
score of all of the indicators in Index 1, the
Housing Value is predicted to increase by
$103,81319.
o Index 2: Ex-Urban Communities. For every one
percentage point increase in the cumulative
18 We utilized an Multivariate Regression analysis. 19 Unstandardized coefficient 20 R2
score of all of the indicators in Index 2, the
Housing Value is predicted to decrease by -
$22,277.
o Index 3: African-American Communities. For
every one percentage point increase in the
cumulative score of all of the indicators in Index
3, the Housing Value is predicted to decrease by
-$19,925.
o Index 4: Bedroom Communities. For every one
percentage point increase in the cumulative
score of all of the indicators in Index 4, the
Housing Value is predicted to increase by
$23,552.
The indices explain 80%20 of the variance in Housing
Value across all of the Super Neighborhoods in Houston.

Page 22 of 29
Wealthy Communities – Graduate Rate – Housing Values
Super Neighborhoods which rank high on the Wealthy
Community Index are mainly composed of high Median
Income; high percentage of White persons; low
percentage of persons in poverty; low percentage of
persons with only a high school degree; high percentage
of white high school kids, high percentage of Asian
students; low percentage of unemployed persons and
high graduation rate.
Index 1: Wealthy Communities
Median Income (.93)
White Pop (.92)
Below Poverty (-.87)
High School Degree or Less(-.80)
White Students in Public High School (.70)
Other Race (.68) Unemployed (-.66) Graduation Rate (.51)

Page 23 of 29
Wealthy Communities – Graduate Rate – Housing Values
The table shows the top ten most Wealthy Super
Neighborhoods and the bottom ten most Distressed Super
Neighborhoods in Houston.
The importance of this study is that policy makers in the City
of Houston can use this procedure to objectively prioritize
communities in terms of targets for public services for
improvements.
The procedure utilized can be considered non-political and
systematically objective.
Super Neighborhoods in this study are not ranked by just
single indicators of performance such as Poverty or Income,
but they were ranked simultaneously by a large group of
indicators. This study can then be considered more robust
since it reflects the complexity of the urban environment and
the communities we live in.
Rank Community
1 UNIVERSITY PLACE
2 AFTON OAKS / RIVER OAKS AREA
3 GREENWAY / UPPER KIRBY AREA
4 BRAESWOOD PLACE
5 MUSEUM PARK
6 MEMORIAL
7 MEDICAL CENTER AREA
8 NEARTOWN - MONTROSE
9 GREATER UPTOWN
10 WASHINGTON AVENUE COALITION / MEMORIAL
PARK
79 GREATER FIFTH WARD
80 MAGNOLIA PARK
81 PECAN PARK
82 CLINTON PARK TRI-COMMUNITY
83 NORTHSIDE/NORTHLINE
84 GULFGATE RIVERVIEW / PINE VALLEY
85 HARRISBURG / MANCHESTER
86 GREATER GREENSPOINT
87 KASHMERE GARDENS
88 WESTWOOD

Page 24 of 29
CONCLUSION
This report supports the current Mayor of Houston’s plan to
develop Complete Communities in Houston.
1. Super Neighborhoods in Houston range in population
from approximately 2,000 to 107,000 persons, the
median population count is approximately 19,000
persons. This suggests that our Super Neighborhoods
may be the most ideal existing geographic boundaries
for communities in Houston, since 19,000 persons is the
ideal manageable size of a community from a
governance perspective.
2. Superneighborhood boundaries should be updated
along with the decennial census count. The process
needs to include citizen stakeholders to ensure that
interested persons can participate in defining their own
communities.
3. School Performance within the Houston Independent
School District’s (HISD) high school feeder patterns
matter to housing value and neighborhood
attractiveness in Houston . This research does not
evaluate the impact of high school feeder paterns
within suburban school districts outside of HISD. For
those surrounding school districts (within the city of
Houston boundary) we report the average performance
level of all high schools.
4. There is no discernable reason why high school feeder
patterns should not follow community/ Super
Neighborhood boundaries. Aligning Feeder patterns
with Super Neighborhood boundaries makes it much
easier for Houston’s communities to properly identify
with their community schools and participate in their
development.

Page 25 of 29
References
U.S. Census Bureau. (2011, December). American FactFinder.
Washington, DC. Retrieved from http://www.census.gov
Center for Neighborhood Technology. (2010). H+T Affordability
Index. Retrieved November 2012, from Center for
Neighborhood Technology: htaindex.cnt.org
Cervero, R., & Duncan, M. (2006). Which Reduces Vehicle Travel
More: Jobs-Housing Balance or Retail-Housing Mixing?
Journal of the American Planning Association, 475-490.
Ewing, R. (1999). Best Development Practices: A Primer for Smart
Growth. Washington: Smart Growth Network.
Feser, K. (2014, Januray). 2013 Home sales reflect boom. Houston
Chronicle.
Hardy, M., Balke, J., & Rufca, S. (2015). Retrieved from Houstonia:
http://www.houstoniamag.com/articles/2015/3/30/housto
ns-top-25-neighborhoods-april-2015
Harris County Flood Control District. (2004). Flood Insurance Rate
Maps. Retrieved November 2012, from
www.hcfcd.org/firms.html
HCAD. (2014). 2014 Market trends and Reappraisal. Houston, TX:
Harris County Appraisal District.
King, L. (2012). Houston Sustainability Indicators: A Comprehensive
Development Review for Citizens, Analysts and Decision
Makers. Houston: Shell Center for Sustainability, Rice
University.
Lipman, B. (2006). A heavy load: The combined housing and
transportation burdens of working families. Washington,
D.C.: Center for Housing Policy.
Sarnoff, N. (2013, August). Asking prices up over last year. Houston
Chronicle.
Schwab, J., & Topping, K. (2008). Hazard mitigation: An essential role
for planners. In P. A. Service, & J. Schwab (Ed.), Hazard
mitigation: Integrating best practices into planning (Vol. 560,
pp. 1-11). Washington, D.C.: American Planning Association.
Stone, M. E. (2006). What is Housing Affordability? The Case for the
Residual Income Approach. Housing Policy Debate, 151-184.
TEA. (2013). School and District with Site Address. Austin, TX: Texas
Education Agency.
The Economist. (2013, May 4). The Economic Performance of Cities.
The Economist.
U. S. Department of Health and Human Services. (2011). The
Affordable Care Act and Health Centers. Retrieved May 2013,
from Primary Care: The Health Center Program:
http://bphc.hrsa.gov/about/index.html
Walkscore. (2012). Walkscore Professional. Retrieved November 15,
2012, from Walkscore: http://www.walkscore.com
White, I. (2008). The absorbent city: urban form and flood risk
management. Urban Design and Planning. 161, pp. 151 - 161.
London, UK: Institution of Civil Engineers.

Page 26 of 29
HSI Report 2012
Reference: King, L. (2012). Houston Sustainability Indicators: A
Comprehensive Development Review for Citizens Analysts and
Decision Makers. Houston, TX: Shell Center for Sustainability, Rice
University
HSI Report 2013
Reference: King, L. (2013). Sustainable Development of Houston
Districts: A Sustainability Indicators Study. Houston, TX: Shell Center
for Sustainability, Rice University
HSI Report 2014
Reference: King, L. (2014). Houston Community Sustainability: The
Quality of Life Atlas. Houston, TX: Shell Center for Sustainability, Rice
University
HSI Report 2015
Reference: King, L. (2015). Opportunity Among the Districts.
Houston, TX: Shell Center for Sustainability, Rice University
Page 27 of 29
Data Sharing! Online Visualization! Data Sharing! Online Visualization!
www.HoustonCommunitySustainability.org

Page 28 of 29
THE 6TH
HOUSTON SUSTAINBILITY INDICATORS REPORT
SUSTAINABLE COMMUNITIES AND PUBLIC EDUCATION
A publication of the Shell Center for Sustainability
Rice University
School of Social Sciences
6100 Main Street, Houston, TX 77005
www.HoustonCommunitySustainability.org
https://www.facebook.com/hsi.project

Page 29 of 29

THE 6TH HOUSTON SUSTAINBILITY INDICATORS REPORT
SUSTAINABLE COMMUNITIES & PUBLIC EDUCATION
THE 6TH HOUSTON SUSTAINBILITY INDICATORS REPORT
SUSTAINABLE COMMUNITIES & PUBLIC EDUCATION
A publication of the Shell Center for SustainabilityRice University - School of Social Sciences MS-27 - 6100 Main Street, Houston, TX 77005
shellcenter.rice.edu
Related Documents