i The 3Returns Framework A method for decision making towards sustainable landscapes The 3Returns Framework A method for decision making towards sustainable landscapes GGKP Expert Group on Natural Capital

Welcome message from author
This document is posted to help you gain knowledge. Please leave a comment to let me know what you think about it! Share it to your friends and learn new things together.
Transcript
iThe 3Returns Framework A method for decision making towards sustainable landscapes
The 3Returns Framework A method for decision making towards sustainable landscapes
GGKP Expert Group on Natural Capital

The 3Returns Framework A method for decision making towards sustainable landscapes
The 3Returns Framework A method for decision making towards sustainable landscapes
July 2020
GGKP Expert Group on Natural Capital
The 3Returns Framework A method for decision making towards sustainable landscapes b
The Green Growth Knowledge Partnership (GGKP) is a global community of organizations and experts committed to collaboratively generating, managing and sharing green growth knowledge. Led by the Global Green Growth Institute (GGGI), Organisation for Economic Co-operation and Devel-
opment (OECD), United Nations Environment Programme (UNEP), United Nations Industrial Development Organization (UNIDO) and the World Bank Group, the GGKP draws together over 60 partner organizations. For more information, visit www.greengrowthknowledge.org.
This study received principal funding from the MAVA Foundation.
Copyright © United Nations Environment Programme, 2020
This publication may be reproduced in whole or in part and in any form for educational or non-profit purposes without special permission from the copyright holder, provided acknowledgement of the source is made. UNEP would appre-ciate receiving a copy of any publication that uses this publi-cation as a source. No use of this publication may be made for resale or for any other commercial purpose whatsoever without prior permission in writing from the United Nations Environment Programme.
Disclaimer
The designations employed and the presentation of the material in this publication do not imply the expression of any opinion whatsoever on the part of the GGKP partners or donors concerning the legal status of any country, territory, city or area or of its authorities, or concerning delimitation of its frontiers or boundaries. Moreover, the views expressed do not necessarily represent the decision or the stated policy of the GGKP partners or donors, nor does citing of trade names or commercial processes constitute endorsement.
Citation:
GGKP (2020). The 3Returns Framework: A Method for Decision Making Towards Sustainable Landscapes. Seoul: Global Green Growth Institute.
1The 3Returns Framework A method for decision making towards sustainable landscapes
Lead Author: Juan Jose Robalino
Co-authors: Annawati van Paddenburg, Rhiley Allbee
Valuable contributions to the 3Returns Framework were made by, and appreciated from, Andrew Lee (GGGI), Ch-aemin Lee (Korea Advanced Institute Science and Tech-nology Graduate School of Green Growth – KAIST GSGG), Yun Jin Anna Jo (KAIST GSGG), and Eunsoo Kim (KAIST GSGG). Additionally, Catherine Lovelock (The University of Queensland – UQ), Sang Phan (UQ), Ali Akber (UQ), Ammar Aziz (UQ), Aaron Russell (GGGI), and Juan Jose Robalino (GGGI) contributed to the production of the Economic Ap-praisal of Ayeyarwady Delta Mangrove Forests’, summa-rized in Chapter 4 of this report as the Myanmar Mangrove 3Returns Restoration Pilot Case.
This report was reviewed by Christopher Dickinson (GGGI), Ingvild Solvang (GGGI), Laura Garcia (GGGI), Catherine
Lovelock (UQ), Doug MacNair (Capitals Coalition – CC), Marta Santamaria (CC), and Martin Lok (CC).
Furthermore, this report was reviewed by the GGKP Natu-ral Capital Expert Group. The Natural Capital Expert Group aims to push the knowledge frontier, mainstream natural capital in global green growth activities and support stron-ger implementation of natural capital commitments in na-tional economic plans.
The production of this report was supported by the GGKP Secretariat, in particular, John J. Maughan and Sun Cho. We sincerely thank the authors, contributors, and reviewers for making this work possible.
Contributing layout designer: Nera Mariz Puyo
ACKNOWLEDGEMENTS
The 3Returns Framework A method for decision making towards sustainable landscapes 2
The 3Returns Framework presents a method for assess-ing sustainable landscape interventions. The framework aims to facilitate decision makers with the formulation and analysis of policies, financial instruments, allocation of re-sources, and the identification of practices for sustainable landscape interventions. For this, the following report is composed of five chapters. The opening chapter presents the introduction and objectives of this document. Chapter 2 builds the fundamentals for introducing the 3Returns Framework as an attractive approach for landscape as-sessment, addressing the importance of capitals for green growth and defining landscape interventions as an invest-ment in capitals. Chapter 3 goes through, step by step, the 3Returns Framework approach for landscape assessment. This is followed by Chapter 4, which presents an example of landscape assessment following the 3Returns Frame-work conducted in the Ayeyarwady Delta, Myanmar. The last chapter, Chapter 5, shares key points of the 3Returns Framework and lessons learned.
Landscape interventions in restoration and conservation, along with the development of economic sectors, must fol-low a holistic approach that takes into consideration one connected natural, social, and economic environment. For this, policy reforms and finance mobilization have been identified as necessary instruments for speeding up trans-formational growth, innovation, and efficient resource man-agement. The need for an analytical framework that consid-ers sustainable landscape interventions, while facilitating the analysis and design of policy and financial instruments, has led to the development of the 3Returns Framework.
The 3Returns Framework operationalizes already existing capital accounting frameworks (Natural Capital Protocol and Social & Human Capital Protocol) and presents green growth interventions for landscapes as investments in natural, social & human, and financial capital. Adequate green investments result in an increase in monetary and non-monetary benefits, which simultaneously lead to the preservation of resources required for current and future well-being (economic, natural, social, and human capital stocks). Considering the nature of green growth interven-tions at landscape level, the 3Returns Framework builds on the consideration of interventions as:
Investment in Natural Capital: resources allocated to increase the stocks of natural assets;
Investment in Social & Human Capital: resources allocated to increase cooperation within and among groups, individual and collective knowledge, skills, and competencies; while building/strengthening institutions for resource management, decision making, and social integration; and
Investment in Financial Capital: resources allocated to acquire or increase the assets needed in order to provide goods or services.
Green growth interventions for landscapes therefore can be interpreted as an investment in natural, social & human, and financial capital, which in turn will result in an increase in benefits. The 3Returns Framework builds on cost-benefit analyses presenting a structure that organizes the informa-tion measured, estimated, and modeled for a landscape as-sessment allowing the analysis of the impacts of different interventions. Recognizing interventions as investments in capitals leads to the reconsideration of the categorization of certain expenses. In the context of landscape interven-tions, expenses associated with sustainable production, restoration, landscape management, capacity building, etc., have historically been treated as additional operation-al expenses. However, the identification of benefits and the increase in benefits from investment in capitals requires the recategorization of certain operational expenses into capital expenses. This recategorization not only implies a new way of expressing expenditures, but also a new way of interpreting and analyzing certain financial indicators. Besides the calculation of profitable measures (i.e. net present value – NPV), the structure proposed allows the computation of efficiency measures (i.e. return on invest-ment – ROI) that, when combined with the identification of non-monetary benefits and capitals’ outputs, support decision making by identifying green growth interventions towards sustainable landscapes.
The pilot study conducted in Myanmar provided the impor-tance and usefulness of considering capitals when analyz-ing interventions towards sustainable landscapes and con-firmed the value of the ROI for supporting decision making. The calculation of the ROI proved to be valuable in order to differentiate which green intervention can be recommend-ed given that the NPV was quite similar when analyzing different green scenarios. Additionally, the calculation of the ROI for the business as usual scenario contributed to the understanding of the importance and necessity of rein-vesting in capitals in order to continue enjoying the benefits that they provide. Among the overall benefits of following the 3Returns Framework in Myanmar, the method resulted in key information needed for analyzing policy impacts and the identification of efficient ways of allocating resources in order to improve the benefits and status of stakeholders in the area of interest. Having this information available fa-cilitated discussion among multiple decision makers and their understanding of the implications of different inter-ventions with potential trade-offs that can harm the imple-mentation of them.
SUMMARY
3The 3Returns Framework A method for decision making towards sustainable landscapes
CONTENTSAcknowledgements ................................................................................................................................... 1Summary .................................................................................................................................................2 Chapter 1 ....................................................................................................................................... 7
1.1 Introduction .............................................................................................................................................71.2 Objectives ...............................................................................................................................................7
Chapter 2 .......................................................................................................................................82.1 Green Growth.......................................................................................................................................... 82.2 Capitals, Different Perspectives and Definitions ....................................................................................... 82.3 Capitals’ Benefits .................................................................................................................................. 102.4 Connecting Green Growth, Capitals, and Capitals’ Benefits ......................................................................12
Chapter 3 ..................................................................................................................................... 143.1 The 3Returns Framework, Step-by-Step .................................................................................................. 143.1.1 Identification and Scoping .................................................................................................................163.1.2 Valuation ......................................................................................................................................... 183.1.3 Return on Investment Analysis ..........................................................................................................213.1.4 Results Interpretation ...................................................................................................................... 25
Chapter 4 ..................................................................................................................................... 284.1 yanmar Mangrove 3Returns Restoration Pilot Case ................................................................................ 284.1.1 Introduction ..................................................................................................................................... 284.1.2 Identification and Scoping ................................................................................................................ 284.1.3 Valuation ..........................................................................................................................................314.1.4 Return on Investment Analysis and Conclusions ................................................................................43
Chapter 5 ..................................................................................................................................... 505.1 3Returns Framework Key Points and Lessons Learned ........................................................................... 50
References ............................................................................................................................................. 51Annex 1: Indicators and data requirements .................................................................................................. 53Annex 2: Computer-based modeling tools for valuing ES ............................................................................... 57Annex 3: Additional data and assumptions for scenario modeling ................................................................... 58
4.1. Myanmar Mangrove 3Returns Restoration Pilot Case ............................................................................. 284.1.1 Introduction ..................................................................................................................................... 284.1.2 Identification and Scoping ................................................................................................................ 284.1.3 Valuation ..........................................................................................................................................314.1.4 Return on Investment Analysis and Conclusions ................................................................................43
The 3Returns Framework A method for decision making towards sustainable landscapes 4
List of FiguresFigure 1. Green growth landscape intervention as an investment in capitals. .................................................... 12Figure 2. 3Returns Framework Stages ............................................................................................................ 15Figure 3. Identifying consequences of impacts and dependencies ................................................................... 22Figure 4. Study area in the lower Ayeyarwady Delta, Myanmar ......................................................................... 28Figure 5. Detailed map of the study area. ....................................................................................................... 30Figure 6. Mangrove forest status and land use maps in RFs and NPs ............................................................... 31Figure 7. Changes of key financial indicators of different scenarios over time. ................................................. 48Figure 8. Changes of other key indicators of different scenarios over time. ...................................................... 48
List of TablesTable 1. Reasons for utilizing the 3Returns Framework for landscape assessment. .......................................... 14Table 2. Return on Investment Analysis........................................................................................................... 21Table 3. How the 3Returns Framework operationalizes the Natural Capital Protocol. ........................................ 26Table 4. Key stakeholders identified in the study area. ..................................................................................... 29Table 5. Key stakeholders selected for the Valuation Stage. ............................................................................ 31Table 6. Mangrove status and land uses in RFs and NPs ................................................................................. 32Table 7. Population data following the scoping area for analysis ..................................................................... 33Table 8. Mangrove aquaculture ponds operations. .......................................................................................... 33Table 9. Crab catching from public mangroves within RFs and NPs .................................................................. 34Table 10. Fuelwood logging from mangroves within RF and NP in the three townships ...................................... 34Table 11. Rice production operations. ............................................................................................................ 35Table 12. Carbon sequestration ecosystem service ......................................................................................... 36Table 13. Coastal protection ecosystem service. ............................................................................................ 36Table 14. Government OPEX for control and protection of RFs and NPs. .......................................................... 37Table 15. Capitals and benefits baseline ......................................................................................................... 37Table 16. Scenarios of mangrove cover change with sea level rise ................................................................... 38Table 17. BaU impacts, impact drivers and consequences, and dependencies .................................................. 39Table 18. Scenario 1 impacts, impact drivers and consequences, and dependencies ........................................ 40Table 19. Scenarios 2-4 impacts, impact drivers and consequences, and dependencies. ................................... 42Table 20. Results of the Return on Investment Analysis ................................................................................... 44
List of BoxesBox 1. Materiality and Materiality Assessment ................................................................................................ 17Box 2. The Myanmar Mangrove 3Returns Restoration Case Example ................................................................ 17Box 3. Valuation Technique. ........................................................................................................................... 18Box 4. The Myanmar Mangrove 3Returns Restoration Case Example ................................................................ 19Box 5. The Business as Usual Scenario. ......................................................................................................... 20Box 6. CSA Practices Example ....................................................................................................................... 23Box 7. The Social Discount Rate (SDR). .......................................................................................................... 24
5The 3Returns Framework A method for decision making towards sustainable landscapes
LIST OF ACRONYMSAFOLU Agriculture, Forestry, and Other Land UseARIES Artificial Intelligence for Ecosystem ServicesBaU Business as UsualBCR Benefit to Cost RatioCAPEX Capital ExpensesCBA Cost-Benefit AnalysisCBFM Community-Based Fishery ManagementCBSFM Community-Based Sustainable Forest Management CC Capitals CoalitionCCAFS CGIAR Research Program on Climate Change, Agriculture and Food SecurityCF Community ForestryCFUG Community Forest User GroupsCIAT International Center for Tropical AgricultureCO2e Carbon Dioxide Equivalent TermsCSA Climate Smart Agriculture DFID Department for International Development (UK)DIVA Dynamic and Interactive Vulnerability AssessmentDRR Disaster Risk ReductioneCBA Extended Cost-Benefit Analysis ES Ecosystem ServicesEXACT EX-Ante Carbon Balance ToolFREDA Forest Resource Environment Development and Conservation AssociationFTE Full-Time EquivalentFUI Fuel Use Intensity GDP Gross Domestic ProductGGGI Global Green Growth Institute GHG Greenhouse GasGIS Geographic Information SystemGPS Global Positioning SystemInVEST Integrated Valuation of Ecosystem Services and TradeoffsIPBES Intergovernmental Science Policy Platform on Biodiversity and Ecosystem ServicesIWI Inclusive Wealth IndexJICA Japan International Cooperation AgencyKAIST GSGG Korea Advanced Institute of Science and Technology Graduate School of Green GrowthMIMES Multiscale Integrated Models of Ecosystem ServicesMIMU Myanmar Information Management UnitMMK Myanmar/Burmese KyatMRRP Myanmar Reforestation and Rehabilitation PlanNP National ParkNPV Net Present ValueODA Overseas Development Aid
The 3Returns Framework A method for decision making towards sustainable landscapes 6
OECD Organization for Economic Co-operation and DevelopmentOPEX Operational ExpensesPA-BAT Protected Area Benefits Assessment ToolPES Payment for Ecosystem ServicesPV Present ValueRECOFTC The Center for People and ForestsREDD+ Reduced Emissions from Deforestation and Forest DegradationRF Reserve ForestROI Return on InvestmentSDR Social Discount RateSEEA System of Integrated Environmental and Economic AccountingSES Social-Ecological SystemsSFH Small Forest HoldersSLR Sea Level RiseSoIVES Social Values for Ecosystem ServicesTESSA Toolkit for Ecosystem Service Site-Based AssessmentUQ University of QueenslandUSD US DollarVW Village WoodlotsWW WaterWorld
7The 3Returns Framework A method for decision making towards sustainable landscapes
CHAPTER 11.1 INTRODUCTIONLandscape interventions in restoration and conservation, along with the development of economic sectors, must follow a holistic approach that takes into consideration one connected natural, social, and economic environment. Many actions transcend sectoral disciplines and their con-sequences are inter-connected across ecosystems. Beyond the importance of economic resources for development, interventions must consider the strong dependency on natural, social, and human resources. Therefore, as part of sustainable landscape interventions it is a requirement to proceed with a priority goal in mind – in this case, the good stewardship of critical inputs for current and future well-being: natural capital, human capital, social capital, and economic capital.
‘Green growth’ interventions at the landscape level bring together natural, social, human, and economic capital ben-efits. Green growth interventions promote the efficient use of natural resources, the minimization of environmental im-pacts, resilience in natural disasters, and encourages inclu-sive and equitable development while building strong econ-omies. For this, policy reforms and finance mobilization have been identified as necessary instruments for speeding up efficient resource management, innovation, and growth. The need for an analytical framework that considers the im-pacts of capitals as a part of landscape interventions, while facilitating the analysis and design of policy and financial mechanisms, has led to the development of what we will from now on call: the 3Returns Framework for landscape intervention; a facilitating method for decision-making.
1.2 OBJECTIVESThe 3Returns Framework presents a new approach for the assessment of sustainable landscape interventions. This new approach provides decision makers with a structured process that allows benefits to be compared against the resources required for a green growth landscape interven-tion. The goal of this framework is to facilitate the formu-lation of policies, the design of financial instruments, the efficient allocation of resources, and the identification of best practices for sustainable landscape interventions.
This document addresses the importance of capitals for green growth and defines landscape interventions as an investment in capitals. The document demonstrates the distinction between monetary and non-monetary benefits from capital impacts, highlighting the importance of ana-lyzing monetary benefits as returns on investment in cap-itals. Chapter 2 of this document builds the fundamentals for introducing the 3Returns Framework as an attractive
approach for landscape assessment.Expanding on the fun-damentals of green interventions in landscapes, the docu-ment explains, step by step, the 3Returns Framework ap-proach for landscape assessment through Chapter 3. The objective of the framework is to assist a standardized ap-proach for the assessment of landscape interventions. For this, this chapter presents a list of recommended tools and methodologies, together with examples that demonstrate the value of following the 3Returns Framework approach during landscape assessment.
Chapter 4 presents an example of a landscape assessment following the 3Returns Framework conducted in Myanmar. The Coastal Landscape Restoration Project in the Ayeyar-wady Delta, Myanmar, conducted a 3Returns Assessment in order to define recommended policies, resource allocation, and improved practices. Its application demonstrated the benefit of the 3Returns Framework approach at the time of decision making. Finally, Chapter 5 shares key points of the 3Returns Framework and lessons learned.
The 3Returns Framework A method for decision making towards sustainable landscapes 8
CHAPTER 22.1 GREEN GROWTHUncontrolled and excessive resource exploitation, drastic land use change, and loss of natural habitats have dras-tically and negatively affected the environmental, socio-economic, and health conditions of the current global population. The 2019 Intergovernmental Science-Policy Platform on Biodiversity and Ecosystem Services (IPBES) report states: “Nature is declining globally at rates unprec-edented in human history and the rate of species extinc-tions is accelerating, with grave impacts on people around the world now likely”. Regarding human health, according to the World Health Organization, one third of deaths from strokes, lung cancer, and heart disease are due to the ef-fects of air pollution.
In response to this, the need for a transition towards a dif-ferent economic model that allows for tackling immediate and long-term environmental consequences and challeng-es has been emphasized. As a result, alternative econom-ic development models have gained traction over the last decade. These include a range of concepts such as green growth.
The Global Green Growth Institute has defined green growth as a development approach that seeks to deliver economic growth that is both environmentally sustainable and social-ly inclusive. While pursuing a low carbon economy, green growth aims at multiple objectives in economic, environ-mental, and social dimensions. It considers that issues are interrelated, and that development is culturally and contex-tually specific. Therefore, key aspects of a green growth agenda are founded in an integrated approach with long-term objectives and local solutions that take into account global issues.
Green growth strives to:
1. Increase the quantity and quality of natural capital and environmental services, as these factors af-fect productivity and their availability is critical for sustainable economic growth;
2. Increase the productivity of resources that allow for higher growth with the consumption of fewer resources;
3. Develop new green technologies, or promote the innovative application of existing green technol-ogies, as innovation is a key driver of economic growth;
4. Focus on the removal of market failures as bar-riers to achieving environmental, social, and eco-nomic goals; therefore, contributing to more effi-cient resource allocation; and
5. Pursue an inclusive and participatory ap-proach that benefits those that rely heavily on natural resources and are the most vul-nerable to the impacts of climate change.
2.2 CAPITALS, DIFFERENT PERSPECTIVES AND DEFINITIONS
Economically speaking, the concept of capital means any stock or asset from which a flow of benefits is derived (GGKP, 2020). The common interpretation of capital has been linked to the assets needed to provide goods or ser-vices, as measured in terms of monetary value. In other words, capital has been referred to only as what is known as ‘Financial Capital’. However, the identification of benefits from natural and social assets has extended the concept of capital to different areas. Yet, and due to different purposes and objectives, the identification of multiple capitals has re-sulted in numerous definitions and interpretations promot-ed by individuals and organizations that have recognized the value in identifying them.
The Four-Capital Model of Wealth Creation was first de-veloped by Ekins (1992) and includes four capital stocks: ecological (natural) capital, human capital, social and orga-nizational capital, and manufactured capital. Manufactured capital refers to material goods, such as tools or buildings that contribute to the production process and are utilized for a long period of time, typically more than a year. Human capital relates to the individual’s capacity for work, such as knowledge, skills, and health. Social and organizational capital refers to shared norms and values, networks and organizations that enable the coordination and mobiliza-tion of individuals’ contributions. Ecological capital pro-vides three types of environmental functions: the provision of resources for production, such as raw materials; the absorption of wastes that come from the production pro-cess and the disposal of consumptive materials; and most importantly, basic environmental services, which include ‘survival services’ such as climate and ecosystem stabil-ity, and ‘amenities services’ such as the beauty of natural landscapes. All of these capital stocks produce a flow of services that become valuable inputs to the productive pro-cess. Benefits of capital stocks, although difficult to assign a monetary value, can be improved through investments, which translate into an addition or improvement in capital stocks (GGKP, 2020).
9The 3Returns Framework A method for decision making towards sustainable landscapes
According to the four-capital model of wealth creation de-veloped by Ekins (1992) and further elaborated in Ekins (2000), capitals can only be identified as such from the flows of benefits to which they give rise. When monetiza-tion of benefits is possible, the value of the capital stock from which they are derived is simply the NPV of the flow of benefits over time. Benefits are not less real if they cannot be valued, although in this case the capital stock that gives rise to them will need to be described or quantified in a dif-ferent way. It is likely that through this evaluation certain benefits, especially from social, human, and natural capital stocks, will be difficult or impossible to be given a mone-tary value. This, however, does not make it impossible to identify the benefits arising from an improvement in capital stocks. According to Ekins (2000), the term ‘investment’ in capitals represents an addition to the capital stocks, even with the limitation of monetizing all of the benefits (GGKP, 2020).
The Organization for Economic Co-operation and Develop-ment (OECD)’s How’s Life? 2015: Measuring Well-being, focuses its attention on the key resources that influence the outcomes of future well-being. In other words, its mea-surement framework looks at the factors that support and shape future well-being, as well as their outcomes. Four types of resources, or capitals, are introduced, namely nat-ural, human, social, and economic capitals. Natural capital refers to both individual assets such as land, water, miner-als, etc., as well as the broader ecosystem from the natural environment, which are central to human capital through the provision of natural assets. Human capital is usually considered as an essential input to economic production, but there are also non-monetary benefits that are crucial for development, such as healthy physical and mental sta-tus, enhanced education capacity, social relationships, and the overall well-being of the individual and society (OECD, 2011). Education and skills, unemployment, and health con-ditions are indicators relevant to both current and future well-being, as they have the potential to contribute to both the growth and health of a society as well as being risk fac-tors for human capital (OECD, 2015). The OECD also focus-es on social capital, which is based on the interpretations of Scrivens and Smith (2013) – personal relationships; civic engagement; social network support; and trust and coop-erative norms – due to its consistency with the measure-ments of sustainable development recommended by the Conference of European Statisticians (UNECE, 2014). Both emphasize trust and cooperative norms, along with the role of institutions in social capital. Social capital is vital for sustaining well-being over time because trust and coopera-tive norms enable collective action which in turn promotes efficient allocation and maintenance of human, natural, and economic capital. Economic capital refers to both pro-duced capital (tangible assets and knowledge assets) and financial capital (various financial assets that may repre-sent claims on produced capital) (OECD, 2015).
The United Nation’s Inclusive Wealth Index (IWI) has cal-culations for three categories of capital – manufactured (physical, produced), human, and natural capital. Based on classical, neoclassical, and mainstream economics, along
with sustainable resources of well-being, the IWI narrowed down the score of capital assets related to current and fu-ture well-being of humans. The IWI measures the inclusive wealth – the sum of the three types of capitals – to over-come the shortcomings of gross domestic product (GDP) as a measure of social well-being. Manufactured (physi-cal, produced) capital includes all of the physical capitals produced by humans such as automobiles, buildings, and other physical infrastructures. Human capital consists of a country’s stock of knowledge and skills attained through education, along with a healthy population, which can be invested in through better education, training, and health. Natural capital, classified into renewable resources and non-renewable resources, is the stock of natural assets, ranging from abiotic to biotic components (Managi & Ku-mar, 2018). Aside from these three categories of capitals, unconventional capitals known as the enabling assets – knowledge, population, institutions, time – facilitate the functioning of the three capitals to improve social well-be-ing (Dasgupta P., 2015).
The World Bank’s Changing Wealth of Nations computes wealth in terms of produced capital, urban land, natural capital, human capital and net foreign assets, but also ac-knowledges the importance of social capital. Its focus lies primarily on natural capital and human capital, as informa-tion referring to produced capital, urban land use, and net foreign assets has already been explored and is available through various institutions. The four asset categories pro-vide the wealth estimates used in the World Bank’s Chang-ing Wealth of Nations. Produced capital and urban land include machinery, buildings, equipment, and residential and non-residential urban land, measured at market pric-es. Natural capital is comprised of energy (oil, gas, hard and soft coal) and minerals (10 categories), agricultural land (cropland and pastureland), forests (timber and some non-timber forest products), and terrestrial protected areas. Natural capital is measured as the discounted sum of the value of the rents generated over the lifetime of the asset. Human capital, estimated by gender and employment sta-tus, is measured as the discounted value of earnings over a person’s lifetime. Net foreign assets are the sum of a coun-try’s external assets and liabilities such as foreign direct investment and reserve assets. Social capital, commonly measuring “social trust” as a key indicator, is also consid-ered important due to its role in facilitating economic activ-ity and increasing well-being through cooperative behaviour among groups. An important take from the World Bank’s Changing Wealth of Nations is that it calculates compre-hensive wealth by adding the estimates of the four assets of wealth as, for the first time, explicit estimates of human capital are provided. The expected earnings of the labour force to measure human capital are a measure that is con-sistent with the concept of capital used for other assets (Lange & et al., 2018).
The literature review surrounding capitals demonstrates that even similar capitals have numerous definitions, de-pending on the approach, objective, and the intended use. Currently, there is no consensus on the definition or com-mon standards when defining capitals. However, most
The 3Returns Framework A method for decision making towards sustainable landscapes 10
of the classifications of capitals identify and define four capitals that interactively enable the environment where humans interact and gain benefits. Capitals, regardless of their intended use and considering the definitions above, can be grouped as follows: natural (ecological) capital, human capital, social (and organizational) capital, and economic (manufactured/produced) capital. These capi-tals form an essential part of the complex ecosystem that frames human well-being, making them a necessary and integral part of the consideration of sustainable, or green, assessments. Furthermore, their consideration becomes crucial when analyzing the impacts, benefits, and potential trade-offs of differing interventions.
2.3 CAPITALS’ BENEFITSSustained economic growth has been the major driver of poverty reduction and human development. However, sus-taining economic growth under the existing model has be-come a serious concern for future well-being. Growth has come at the expense of the unsustainable use of resourc-es and substantial negative impacts on the environment. The progress made in tackling global poverty and develop-ment is now threatened by the consequences of negative environmental impacts. Climate change, biodiversity loss, the unsustainable management of water resources, and the health impacts of pollution and hazardous chemicals, are among the most urgent challenges for both OECD and non-OECD countries (OECD, 2008). Population growth and demands for increases in global socioeconomic statuses have heightened the need for a rapid transition to greener and more sustainable models of growth.
In the context of natural landscapes, different initiatives have attempted to combine natural resource management, climate change, social inclusion, and economic develop-ment as a way of moving away from the traditional mod-el, based solely on economic drivers. Fortunately, some of these initiatives have been able to demonstrate positive synergies between healthy ecosystems, social inclusion, and productivity improvement. More so, interventions that consider social, human, and natural aspects, in addition to financial capital, have been reported to outweigh the bene-fits of a single economic approach.
Let us take the example of agricultural practices and ini-tiatives that aim to improve the integration of agricultural development with challenges currently faced within the sector. Agriculture is a high-risk business, especially in the developing world where farmers face unfavourable condi-tions such as degraded land and a lack of access to high quality inputs for production. Furthermore, climate change has placed a new and increased stress on the management of natural resources required for food production. As a way of achieving food security and broader development goals under a changing climate, and increasing food demands, the concept of Climate-Smart Agriculture (CSA) has been
1 International Center for Tropical Agriculture. 2 CGIAR Research Program on Climate Change, Agriculture and Food Security.3 UK’s Government’s Department for International Development.
developed as an answer to sustainably increase productiv-ity, enhance resilience, and reduce, or remove, greenhouse gases (GHGs). A collaborative effort by CIAT1, CCAFS2, the World Bank, and DFID3, has identified more than 1,700 unique combinations of production systems, regions, and technologies in the realm of potential CSA practices. How-ever, only a few of these have demonstrated synergies be-tween the pillars of productivity, adaptation, and mitigation. Based on a climate-smart assessment score, certain CSA practices and technologies proved to have combined ben-efits expressed in increased yield and income, enhanced water quality and use efficiency, improved soil health, and greater knowledge for climate risk management and diver-sification. They also showed a positive impact in gender inclusion, as well as carbon sequestration, and an improve-ment in nutrient use efficiency (Baedeker, Grosjean, & Gir-vetz, 2018). These increases in benefits, derived from the application of certain CSA practices, can be considered a result of an increase in capital stocks or assets. Howev-er, these increases in benefits not only come from access to new technological assets, but also from the increase in human and social assets (knowledge and inclusiveness), along with increased natural assets. In other words, an in-crease in economic, natural, social, and human capital.
In the fishery sector, community-based fishery management (CBFM) has been one of the most promising approaches for securing sustainable small-scale fisheries as a response to a perceived decline in marine resources. CBFM emerged in the 1980s as an alternative to government-led or private protection approaches to marine resource management. This approach is characterized by leaving the resource management authority to local communities, allowing local fishery governance, and often involving community partner-ship with governmental and non-governmental institutions. Three observed CBFM outcomes have been documented in published literature: 1) sustained resource management institutions; 2) equity in decision-making; and 3) increased marine biomass inside the management areas. Yet, em-pirical evidence suggests that outcomes from CBFM for people and ecosystems are mixed, with an inadequate un-derstanding of the factors that influence successful CBFM outcomes. As an effort to understand the drivers that in-fluence CBFM outcomes, Blythe et al. (2017) used Elinor Ostrom’s social-ecological systems (SES) framework for post-hoc diagnosis in an eight-year CBFM project in five Solomon Island villages. Results suggest that successful CBFM outcomes were facilitated by effective information sharing, harvesting rules that merge traditional and con-temporary practices, strong leadership, and resource moni-toring. The study highlights that successful outcomes were characterized by the implementation of fishing restrictions in resource management plans, the inclusion of new voices in resource management, and an increase in the catch rates within the managed areas, suggesting increases in marine biomass (Blythe & et al., 2017). In other words, benefits from improved social and human resources were not only
11The 3Returns Framework A method for decision making towards sustainable landscapes
reflected in an improved governance system, they were also reflected by an increase in marine resources supporting people’s economic activities. CBFM shows potential as an intervention of social and human capital, facilitating inclu-sive institutions by effective information sharing, harmoni-ously merging traditional and contemporary practices, and enhancing participation and leadership.
Deforestation and forest degradation caused by illegal log-ging, especially timber in tropical forests, as well as sub-sistence agriculture and urbanization, have posed serious threats to future well-being and sustainability. Putra, et al. (2018) investigated community-based sustainable forest management (CBSFM) certification systems implemented in the Kedung Keris Village, Indonesia, as a mechanism to prevent negative outcomes associated with land use change in forested areas and a way to improve the income of farmers through the sustainable management of forests. The research showed that CBSFM facilitated both ecolog-ical and socio-economic benefits to the small forest hold-ers (SFHs) in the Kedung Keris Village, as they were able to perform a more appropriate investment (capacity building, seedling procurement, land preparation, maintenance cost, etc.) for sustainable management through CBSFM. As a re-sult, timber prices increased between 10.68%-14.09% and the annual revenue exhibited a continuous rise. Meanwhile, the CBSFM system also brought other benefits, such as improved quality and quantity of water supply, erosion and flood control, and an increase in biodiversity. Furthermore, CBSFM not only improved the knowledge of SFHs in tree measurement, silviculture, timber marketing, erosion con-trol, and other forest management activities; it also created awareness regarding the sustainable management of for-ests and increased gender equality in the decision-making process. As the case shows, CBSFM has the potential to bring monetary and non-monetary benefits from improved social and human assets as well as support people’s eco-nomic activities from an increase in natural resources.
As heavy forest exploitation causes severe depletion of natural capital and degrades forest ecosystem services, balancing the provision of forest products and the manage-ment of forest ecosystem services (regulating, supporting, and cultural services) is becoming one of the major chal-lenges in forest farming communities. Zheng, et al. (2019) report results of two different scenarios in the Ecosystem Function Conservation Area of Hainan Island, where the ex-pansion of rubber plantations has caused a major loss of natural forests. One scenario looked at monoculture rubber plantations [Business as Usual (BaU)] and the other scenar-io was focused on intercropped rubber plantations (Green Intervention). By comparing both, the research found that utilizing intercropping in rubber plantations allows for greater economic income while improving ecosystem ser-vices. There was no significant difference in investment cost between monoculture rubber plantations ($149.40/ha-yr) and intercropped rubber plantations ($181.30/ha-yr); however, income from intercropped rubber plantations ($3,957/ha-yr) was more than double the income from monoculture rubber plantations ($1,696/ha-yr). Meanwhile, intercropping within plantations also contributed to de-
creases in splash soil erosion, increases of water use effi-ciency in drought seasons, improvement of water, soil and nutrient retention, improved flood mitigation, and increased biodiversity. Furthermore, adopting intercropping within plantations increased knowledge capacity (e.g. adopting additional marketable crops or other products), which al-lowed farmers to achieve a more stable income through crop diversification and risk management (Zheng, et al., 2019). Therefore, green interventions (capacity building) – in this case, intercropping within rubber plantations – not only generated extra economic income, but also improved natural capital.
For many developing nations, not only is coffee an integral part of people’s lives, it is also an invaluable commodity of outstanding export importance. For coffee production regions, the quantity and quality of the coffee produced is highly influenced by pollination services. However, increas-es in tropical deforestation and forest degradation are dis-turbing pollination services, which poses a severe threat in maintaining sustainable coffee production. According to a study done in Valle General, Costa Rica, investment in conserving forest patches surrounding coffee plantations resulted in biodiversity conservation, as well as in better quantity and quality of coffee yields (Ricketts H. Taylor, 2004). Preserved tropical forest fragments within 1km distance from the coffee plantation increased pollination services to the plantations, which resulted in 20% higher coffee yields and reduced misshapen product (peaberries) by 27%. Furthermore, they found that over USD 60,000/year of additional income could be attributed to pollination services for one single farm (480ha), which was generated by investing in nearby forest fragments (46ha and 111ha). The experiment reflected that through green interventions – conservation of two major neighboring forest patches within 1km – income increased to $747.125/ha/year. On the other hand, farms deprived of the benefits of pollination (BaU) only acquired a revenue of $618.55/ha/year. There-fore, conservation investment on forest patches, or invest-ment in what is defined as natural capital, created tangible monetary benefits.
Globally, agricultural intensification diminishes clusters of forest patches on farmlands, making them more vulnerable to infestations of pests. In coffee plantations, for example, pests such as the coffee berry borer beetle (Hypothenemus hampei), became difficult to control, leading to increased costs regarding pest management, and reducing revenue from agriculture. Karp, et al. (2013) quantified bird-mediat-ed pest management services from conserving forest ele-ments on farmland by providing habitat for borer-consuming birds in southern Costa Rica. The study showed that addi-tional annual revenue of USD 75-310/ha/year was generat-ed as a result of maintaining forest patches on farmland, which supported predation through birds within the coffee plantation. Retaining forest patches increased bird-medi-ated pest control services by twofold, which saved on av-erage 2-4% of coffee berries. Furthermore, coffee farmers benefited from 99% of the total pest-control services from forest patches blended with farmland (Karp, et al., 2013). The study presents forest conservation activities as an in-tervention that results in both, monetary and non-monetary
The 3Returns Framework A method for decision making towards sustainable landscapes 12
benefits derived from improved natural capital. Ultimately, interventions following conservation activities provide a win-win for biodiversity and farmers’ livelihoods.
The examples above present the case in which the improve-ment of resource or capital stocks has provided greater monetary and non-monetary benefits, proving that inter-ventions that consider not only economic drivers, but also natural, social, and human aspects increase the total flow of benefits. Even more, comparing the increase of benefits with the resources required for the interventions, capitals’ replenishment and improvement not only proves to have positive returns, it also provides greater and more attractive returns when comparing to BaU activities. In other words, interventions through these capitals supports Ekins (2000) statement about ‘investing’ in capitals, as they result in greater monetary and non-monetary benefits. The case studies presented in this section builds the importance of considering more than just economic resources or eco-nomic capital; they demonstrate how the improvement of natural, social, and human capital provides a greater flow of benefits, supporting their definition as capitals and the case for the investment in capitals.
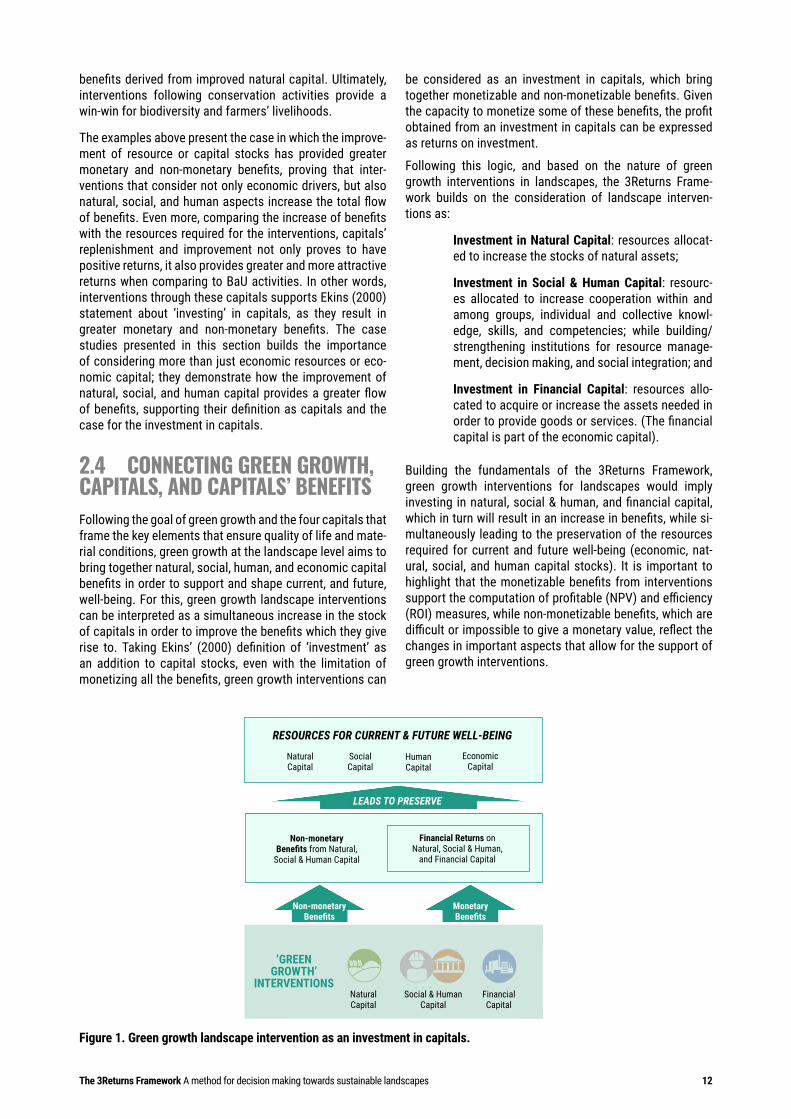
2.4 CONNECTING GREEN GROWTH, CAPITALS, AND CAPITALS’ BENEFITSFollowing the goal of green growth and the four capitals that frame the key elements that ensure quality of life and mate-rial conditions, green growth at the landscape level aims to bring together natural, social, human, and economic capital benefits in order to support and shape current, and future, well-being. For this, green growth landscape interventions can be interpreted as a simultaneous increase in the stock of capitals in order to improve the benefits which they give rise to. Taking Ekins’ (2000) definition of ‘investment’ as an addition to capital stocks, even with the limitation of monetizing all the benefits, green growth interventions can
be considered as an investment in capitals, which bring together monetizable and non-monetizable benefits. Given the capacity to monetize some of these benefits, the profit obtained from an investment in capitals can be expressed as returns on investment.
Following this logic, and based on the nature of green growth interventions in landscapes, the 3Returns Frame-work builds on the consideration of landscape interven-tions as:
Investment in Natural Capital: resources allocat-ed to increase the stocks of natural assets;
Investment in Social & Human Capital: resourc-es allocated to increase cooperation within and among groups, individual and collective knowl-edge, skills, and competencies; while building/strengthening institutions for resource manage-ment, decision making, and social integration; and
Investment in Financial Capital: resources allo-cated to acquire or increase the assets needed in order to provide goods or services. (The financial capital is part of the economic capital).
Building the fundamentals of the 3Returns Framework, green growth interventions for landscapes would imply investing in natural, social & human, and financial capital, which in turn will result in an increase in benefits, while si-multaneously leading to the preservation of the resources required for current and future well-being (economic, nat-ural, social, and human capital stocks). It is important to highlight that the monetizable benefits from interventions support the computation of profitable (NPV) and efficiency (ROI) measures, while non-monetizable benefits, which are difficult or impossible to give a monetary value, reflect the changes in important aspects that allow for the support of green growth interventions.
Figure 1. Green growth landscape intervention as an investment in capitals.
LEADS TO PRESERVE
Non-monetaryBenefits
MonetaryBenefits
NaturalCapital
Social & HumanCapital
Financial Capital
‘GREEN GROWTH’
INTERVENTIONS
RESOURCES FOR CURRENT & FUTURE WELL-BEING
NaturalCapital
SocialCapital
EconomicCapital
HumanCapital
Non-monetaryBenefits from Natural,
Social & Human Capital
Financial Returns on Natural, Social & Human,
and Financial Capital
13The 3Returns Framework A method for decision making towards sustainable landscapes
The 3Returns Framework has been designed with the goal to simultaneously serve multiple decision makers, includ-ing government entities, communities, and the private sec-tor, directly and indirectly involved and that interact in a certain natural environment. Consequently, the fundamen-tals of the 3Returns Framework emphasize the importance of considering monetary and non-monetary benefits in the process of decision making. Overall, the identification of benefits allows stakeholders to determine if the benefits from investments outweigh the resources required to in-tervene, which is fundamental information when deciding upon a course of action. It also facilitates the identification of the most efficient interventions, based on the compari-son of the resources required and the total benefits from a range of available options.
Showing financial returns and non-monetary benefits to pri-vate, public, national, and international financial institutions aims to enable the allocation of funding by demonstrating how green growth interventions can impact economic activ-ities and improve long-term returns. Pinpointing monetary and non-monetary benefits to impact investors captures the attention of economic actors interested in sustainable, long-term, and impact investment projects. The identifica-tion of both types of benefits can also facilitate the devel-opment of responsible trade agreements between the com-mercial sector and the productive and extractive sectors. Securing the production and extraction of commodities in the long run decreases the risk from the supply side and promotes formal agreements.
Analyzing monetary benefits, but also non-monetary ben-efits, should be considered when developing market and policy instruments. Their consideration facilitates design-ing financial and regulatory frameworks for resource mobi-lization and risk reduction. Following the proposed capitals’ assessment approach, the identification of valuable assets permits for designing insurance or other market-based sys-tems. Furthermore, taking into consideration non-monetary benefits, allows for the understanding of the potential trade-offs from certain market driven actions. The acknowledg-ment of monetary and non-monetary benefits is crucial for key public institutions (in charge of resource allocation and implementation of mechanisms for resource collection) when identifying efficient investment channels for securing capitals. It allows public institutions to identify the need for changing or implementing incentives to protect capitals, or to compensate for damages caused to them.
Besides the importance of accounting for monetary and non-monetary benefits for different stakeholders, the 3Re-turns Framework also presents a different approach when considering the expenditures for intended interventions. In the context of landscape interventions, expenses associ-ated with sustainable production, restoration, landscape management, capacity building, etc., have historically been treated as additional operational expenses (OPEX) rather than an integrated and detailed section of the financial analyses. Additionally, the identification and characteriza-tion of capitals, as presented in this document, leads to the reconsideration of the categorization of certain expens-
es. In other words, the identification of benefits and the increase in benefits from investment in capitals requires the recategorization of certain operational expenses into capital expenses (CAPEX). This recategorization not only implies a new way of expressing expenditures, but also a new way of interpreting and analyzing certain financial in-dicators. For instance, ROI has classically been recorded as a consideration of only the physical assets required for providing products and services in a project. The ROI in the 3Returns Framework considers the investment in natural, social & human, and physical assets required for a func-tioning and sustainable project within a landscape. This new analysis and interpretation of this financial indicator also allows for the comparison of what would happen in a landscape without intervention as well as with differing in-terventions as investments in one or more capitals. In fact, following the 3Returns will allow for more clearly defining and identifying green growth interventions for sustainable landscapes.
The 3Returns Framework A method for decision making towards sustainable landscapes 14
CHAPTER 33.1 THE 3RETURNS FRAMEWORK, STEP-BY-STEPThe 3Returns Framework aims to provide stakeholders with guidance to define the appropriate scope needed to proceed with a landscape or project assessment following the fundamentals of the 3Returns Framework. Additional-ly, it presents the mechanisms to determine whether the benefits outweigh the required resources for potential in-terventions, going through recommended indicators and an analytical approach that supports identifying efficient actions and potential trade-offs from their application. The 3Returns Framework presents a range of recommended
tools and results interpretation suggestions, considering the importance of each of them for different stakeholders.
An assessment, following the 3Returns Framework, aims to result in key information required for policy design, the de-sign of innovative financial instruments, efficient resource allocation, and a baseline for project investment. Having this information available facilitates decision making to-wards a green growth model for sustainable landscapes. The table below summarizes the reasons, considering different stakeholders’ interests, for utilizing the 3Returns Framework.
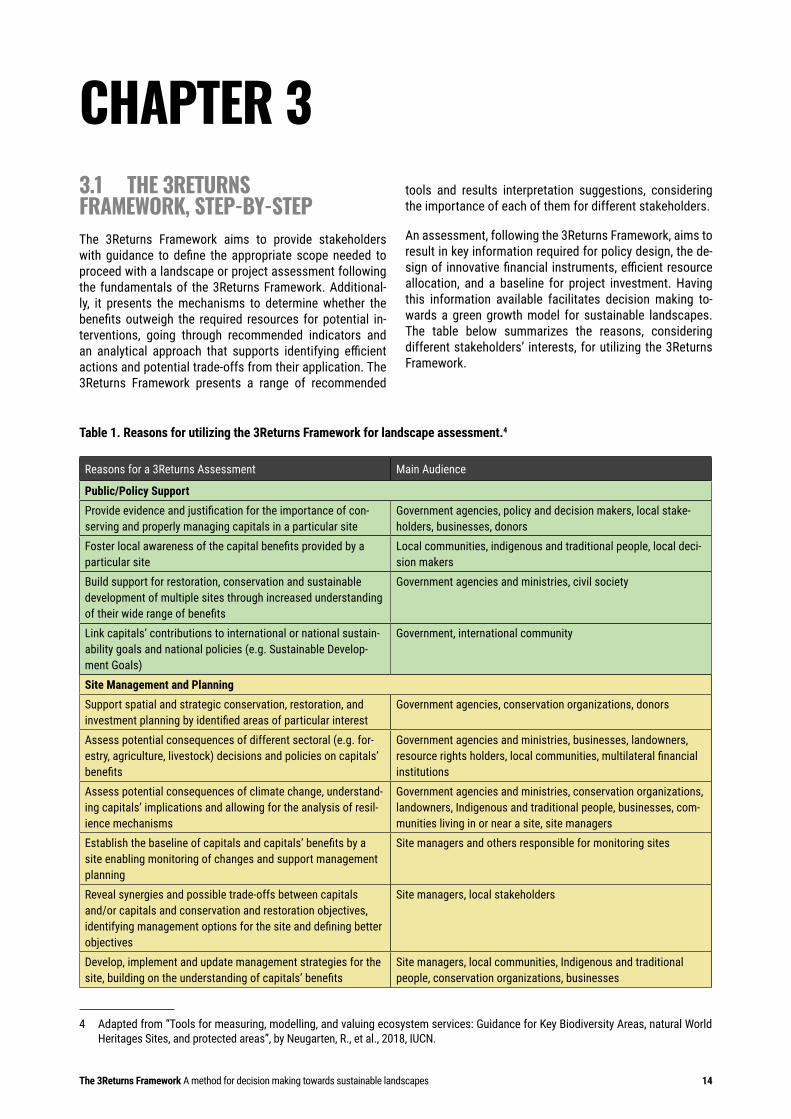
Table 1. Reasons for utilizing the 3Returns Framework for landscape assessment.4
Reasons for a 3Returns Assessment Main Audience
Public/Policy SupportProvide evidence and justification for the importance of con-serving and properly managing capitals in a particular site
Government agencies, policy and decision makers, local stake-holders, businesses, donors
Foster local awareness of the capital benefits provided by a particular site
Local communities, indigenous and traditional people, local deci-sion makers
Build support for restoration, conservation and sustainable development of multiple sites through increased understanding of their wide range of benefits
Government agencies and ministries, civil society
Link capitals’ contributions to international or national sustain-ability goals and national policies (e.g. Sustainable Develop-ment Goals)
Government, international community
Site Management and PlanningSupport spatial and strategic conservation, restoration, and investment planning by identified areas of particular interest
Government agencies, conservation organizations, donors
Assess potential consequences of different sectoral (e.g. for-estry, agriculture, livestock) decisions and policies on capitals’ benefits
Government agencies and ministries, businesses, landowners, resource rights holders, local communities, multilateral financial institutions
Assess potential consequences of climate change, understand-ing capitals’ implications and allowing for the analysis of resil-ience mechanisms
Government agencies and ministries, conservation organizations, landowners, Indigenous and traditional people, businesses, com-munities living in or near a site, site managers
Establish the baseline of capitals and capitals’ benefits by a site enabling monitoring of changes and support management planning
Site managers and others responsible for monitoring sites
Reveal synergies and possible trade-offs between capitals and/or capitals and conservation and restoration objectives, identifying management options for the site and defining better objectives
Site managers, local stakeholders
Develop, implement and update management strategies for the site, building on the understanding of capitals’ benefits
Site managers, local communities, Indigenous and traditional people, conservation organizations, businesses
4 Adapted from “Tools for measuring, modelling, and valuing ecosystem services: Guidance for Key Biodiversity Areas, natural World Heritages Sites, and protected areas”, by Neugarten, R., et al., 2018, IUCN.
15The 3Returns Framework A method for decision making towards sustainable landscapes
Funding and InvestmentAttract government and donor investment from other sectors concerned and interested with conservation, restoration, and sustainable development
Government ministries, development agencies and organizations
Assess the feasibility of economic activities’ projections Commercial banks, multilateral development banksSupport the development of new sustainable finance mecha-nisms for conservation of the sites (e.g. Payment for Ecosys-tem Services (PES) or carbon financing such as Reduced Emis-sions from Deforestation and Forest Degradation (REDD+))
Businesses, public and private investors, government agencies, conservation organizations, local communities
Assess compensation options and insurance mechanisms for conservation and restoration efforts
Government agencies, development agencies, landscape manag-ers, communities living in or near the site
Knowledge GenerationInform research on green growth provided by sites locally, na-tionally, regionally, or globally
Academics, students, conservation organizations, research orga-nizations
Inform research on capital accounting frameworks; synergies and trade-offs between capitals and sustainable development
Academics, students, conservation organizations, research orga-nizations
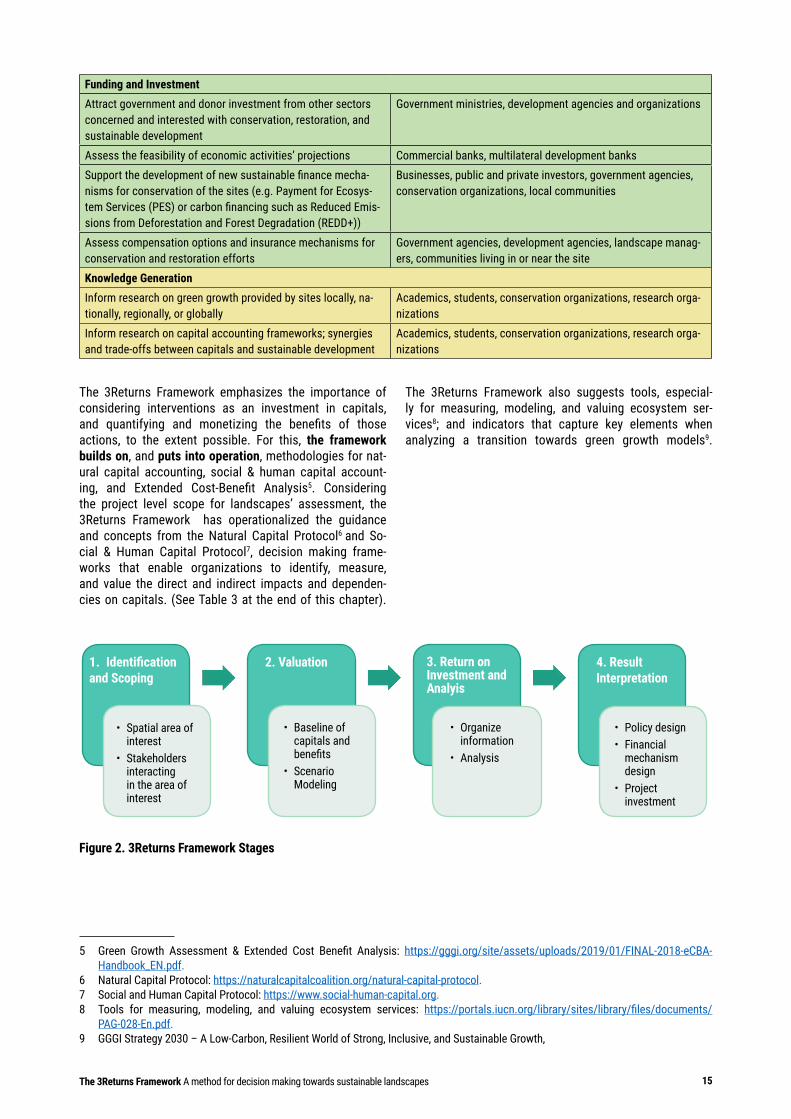
The 3Returns Framework emphasizes the importance of considering interventions as an investment in capitals, and quantifying and monetizing the benefits of those actions, to the extent possible. For this, the framework builds on, and puts into operation, methodologies for nat-ural capital accounting, social & human capital account-ing, and Extended Cost-Benefit Analysis5. Considering the project level scope for landscapes’ assessment, the 3Returns Framework has operationalized the guidance and concepts from the Natural Capital Protocol6 and So-cial & Human Capital Protocol7, decision making frame-works that enable organizations to identify, measure, and value the direct and indirect impacts and dependen-cies on capitals. (See Table 3 at the end of this chapter).
Figure 2. 3Returns Framework Stages
5 Green Growth Assessment & Extended Cost Benefit Analysis: https://gggi.org/site/assets/uploads/2019/01/FINAL-2018-eCBA-Handbook_EN.pdf.
6 Natural Capital Protocol: https://naturalcapitalcoalition.org/natural-capital-protocol.7 Social and Human Capital Protocol: https://www.social-human-capital.org.8 Tools for measuring, modeling, and valuing ecosystem services: https://portals.iucn.org/library/sites/library/files/documents/
PAG-028-En.pdf.9 GGGI Strategy 2030 – A Low-Carbon, Resilient World of Strong, Inclusive, and Sustainable Growth,
The 3Returns Framework also suggests tools, especial-ly for measuring, modeling, and valuing ecosystem ser-vices8; and indicators that capture key elements when analyzing a transition towards green growth models9.
1. Identification and Scoping
2. Valuation 3. Return on Investment and Analyis
4. Result Interpretation
• Spatial area of interest• Stakeholders interacting in the area of interest
• Baseline of capitals and benefits• Scenario Modeling
• Organize information• Analysis
• Policy design• Financial mechanism design• Project investment
The 3Returns Framework A method for decision making towards sustainable landscapes 16
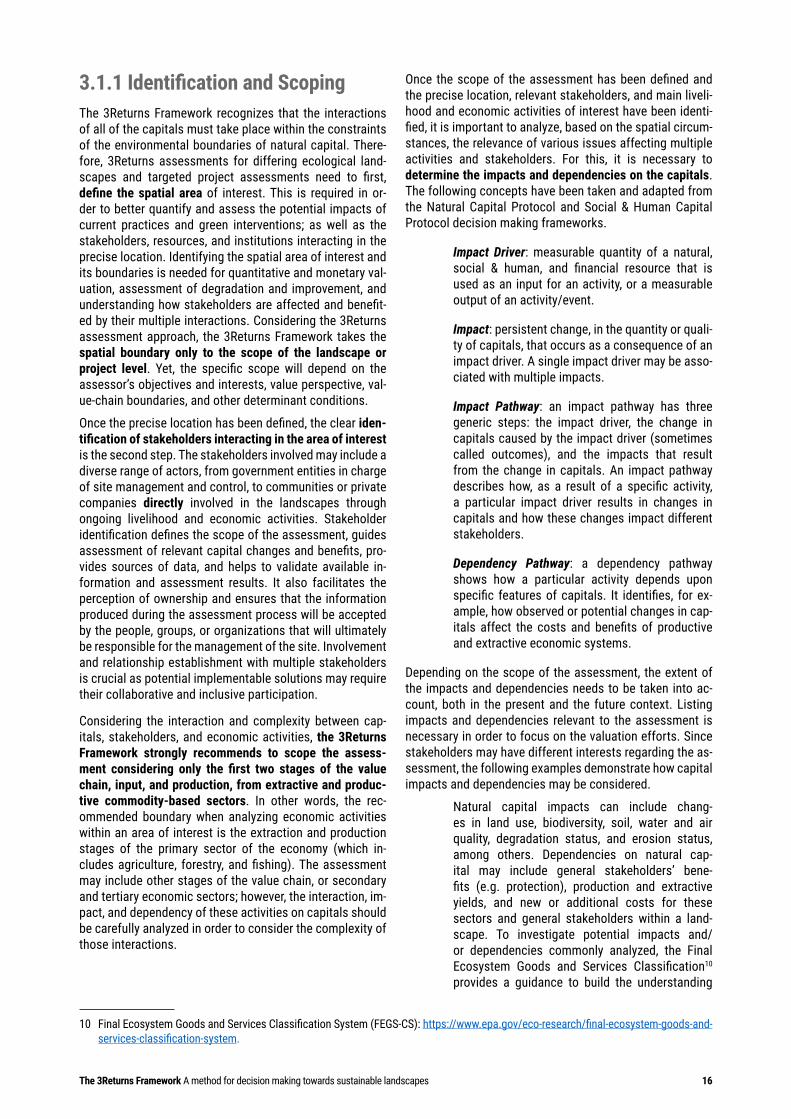
3.1.1 Identification and ScopingThe 3Returns Framework recognizes that the interactions of all of the capitals must take place within the constraints of the environmental boundaries of natural capital. There-fore, 3Returns assessments for differing ecological land-scapes and targeted project assessments need to first, define the spatial area of interest. This is required in or-der to better quantify and assess the potential impacts of current practices and green interventions; as well as the stakeholders, resources, and institutions interacting in the precise location. Identifying the spatial area of interest and its boundaries is needed for quantitative and monetary val-uation, assessment of degradation and improvement, and understanding how stakeholders are affected and benefit-ed by their multiple interactions. Considering the 3Returns assessment approach, the 3Returns Framework takes the spatial boundary only to the scope of the landscape or project level. Yet, the specific scope will depend on the assessor’s objectives and interests, value perspective, val-ue-chain boundaries, and other determinant conditions.
Once the precise location has been defined, the clear iden-tification of stakeholders interacting in the area of interest is the second step. The stakeholders involved may include a diverse range of actors, from government entities in charge of site management and control, to communities or private companies directly involved in the landscapes through ongoing livelihood and economic activities. Stakeholder identification defines the scope of the assessment, guides assessment of relevant capital changes and benefits, pro-vides sources of data, and helps to validate available in-formation and assessment results. It also facilitates the perception of ownership and ensures that the information produced during the assessment process will be accepted by the people, groups, or organizations that will ultimately be responsible for the management of the site. Involvement and relationship establishment with multiple stakeholders is crucial as potential implementable solutions may require their collaborative and inclusive participation.
Considering the interaction and complexity between cap-itals, stakeholders, and economic activities, the 3Returns Framework strongly recommends to scope the assess-ment considering only the first two stages of the value chain, input, and production, from extractive and produc-tive commodity-based sectors. In other words, the rec-ommended boundary when analyzing economic activities within an area of interest is the extraction and production stages of the primary sector of the economy (which in-cludes agriculture, forestry, and fishing). The assessment may include other stages of the value chain, or secondary and tertiary economic sectors; however, the interaction, im-pact, and dependency of these activities on capitals should be carefully analyzed in order to consider the complexity of those interactions.
10 Final Ecosystem Goods and Services Classification System (FEGS-CS): https://www.epa.gov/eco-research/final-ecosystem-goods-and-services-classification-system.
Once the scope of the assessment has been defined and the precise location, relevant stakeholders, and main liveli-hood and economic activities of interest have been identi-fied, it is important to analyze, based on the spatial circum-stances, the relevance of various issues affecting multiple activities and stakeholders. For this, it is necessary to determine the impacts and dependencies on the capitals. The following concepts have been taken and adapted from the Natural Capital Protocol and Social & Human Capital Protocol decision making frameworks.
Impact Driver: measurable quantity of a natural, social & human, and financial resource that is used as an input for an activity, or a measurable output of an activity/event.
Impact: persistent change, in the quantity or quali-ty of capitals, that occurs as a consequence of an impact driver. A single impact driver may be asso-ciated with multiple impacts.
Impact Pathway: an impact pathway has three generic steps: the impact driver, the change in capitals caused by the impact driver (sometimes called outcomes), and the impacts that result from the change in capitals. An impact pathway describes how, as a result of a specific activity, a particular impact driver results in changes in capitals and how these changes impact different stakeholders.
Dependency Pathway: a dependency pathway shows how a particular activity depends upon specific features of capitals. It identifies, for ex-ample, how observed or potential changes in cap-itals affect the costs and benefits of productive and extractive economic systems.
Depending on the scope of the assessment, the extent of the impacts and dependencies needs to be taken into ac-count, both in the present and the future context. Listing impacts and dependencies relevant to the assessment is necessary in order to focus on the valuation efforts. Since stakeholders may have different interests regarding the as-sessment, the following examples demonstrate how capital impacts and dependencies may be considered.
Natural capital impacts can include chang-es in land use, biodiversity, soil, water and air quality, degradation status, and erosion status, among others. Dependencies on natural cap-ital may include general stakeholders’ bene-fits (e.g. protection), production and extractive yields, and new or additional costs for these sectors and general stakeholders within a land-scape. To investigate potential impacts and/or dependencies commonly analyzed, the Final Ecosystem Goods and Services Classification10
provides a guidance to build the understanding
17The 3Returns Framework A method for decision making towards sustainable landscapes
of which potential impacts and dependencies are important to measure according to different stakeholders.
Social and human capital impacts can include creation or destruction of institutions, as well as changes in knowledge, capabilities, and cultural heritage. Dependencies of social and human capi-tal include the availability of a skilled, engaged, re-sponsible, healthy, and organized population, in-formation sharing, and an inclusive environment.
Financial capital impacts include the increase in assets for providing goods and services. Depen-dencies on financial capital include yields and changes in production costs and prices.
To assess impacts and dependencies following the 3Re-turns Framework, it is required to map the activities against the identified impacts and dependencies. For this, relevant activities associated with the assessment scope need to be identified. Once mapping the activities is completed, which impact driver and dependency will be measured can be de-fined following a materiality assessment.
Box 1. Materiality and Materiality AssessmentAn impact or dependency on a capital is material if consideration of its value, as part of the set of infor-mation used for decision making, has the potential to alter that decision. Consequently, a materiality assessment allows for distinguishing the relevance and significance of considering an impact driver and/or dependency. A materiality assessment can be based in the following criteria:
Operational – the extent to which capitals’ im-pacts and/or dependencies may be significant-ly affected with or without the execution of an activity.
Legal and regulatory – the extent to which a legal process or implication may be caused by capitals’ impacts and/or dependencies.
Financing – the extent to which the access of financing may be influenced by capitals’ impacts and/or dependencies.
(Adapted from Natural Capital Coalition 2016 and Social & Human Capital Coalition 2019).
Besides the materiality assessment, it is also important to choose impact drivers and dependencies that meet the as-sessment needs and stakeholders’ interests. Selecting the right ones requires careful consideration, as they may be used to track capitals’ performance over time, or for com-parison across different projects and scenarios. Their se-lection will also depend on data availability and the initial understanding of interactions within the scope of the as-sessment, which are a fundamental precursor to efficiently complete the assessment.
By the end of the identification phase, the assessor should have already defined the scope of the assessment by clear-ly identifying the spatial area of interest, the stakeholders to be considered, and a list of material impact drivers and dependencies associated with current activities and intend-ed interventions. After considering data availability and gaps, a valuation process is required to define a baseline to which changes in capitals and their benefits will be able to be modeled and analyzed, reflecting the advantages of a green intervention.
Box 2. The Myanmar Mangrove 3Returns Restoration Case in Chapter 4 presents a clear example of the criteria utilized for defining the spatial area, stakeholders, impacts, and the dependencies in capitals.The identification phase strictly depends on the landscape that is a part of the analysis; therefore, it is recommended that this phase is led by a clear and holistic understanding of the landscape situation and the main forces shaping changes in capitals.
The 3Returns Framework A method for decision making towards sustainable landscapes 18
3.1.2 ValuationThe second phase requires the definition of a baseline for capitals and benefits as a first step. Through this, the 3Re-turns assessment determines a starting point, or bench-mark, to analyze potential changes in capitals’ stocks and flows. Based on the baseline, changes in capitals attribut-ed to different activities within the landscape can be com-pared. Therefore, an explicit baseline is recommended as it will enable the drawing of meaningful conclusions. Defining the baseline requires a process of capitals’ valuation, deter-mining the importance, worth, or usefulness of them within a particular context. Therefore, understanding the social, environmental, and economic context is essential to mean-ingfully estimate the value of capitals and their benefits.
The valuation process will depend on the identification stage, specifically on the scope of the assessment, and on the impact drivers and dependencies to be assessed. Despite the variability of the valuation process, based on selecting context specific determinants, the 3Returns val-uation process requires incorporating two types of values. Social Value, which will determine relevant outcomes for society in general; assessing the vulnerability to natural and social risks caused by human activities or caused by natural forces. And Economic Value, which will determine how capitals’ impacts affect, positively or negatively, the financial performance of economic activities.
Therefore, the selection of indicators to value capitals’ stocks and flows requires the consideration of the need to reflect these two values during the valuation process. For this, each indicator may require an appropriate valuation technique in order to value capitals as “stocks”, and the benefits that are derived from them. In physical terms, “stocks” refer to the total quantity and quality of assets at a given point in time, such as the volume of standing trees in a given area. In monetary terms, capital benefits refer to the monetary inflows, or savings inferred from capital stocks, such as the revenue from economic activities based on tim-ber (Economic Value), or economic savings from flood pro-tection from standing trees (Social Value). A quantitative valuation of capital stocks will facilitate a monetary valua-tion of capitals’ benefits; however, not all quantitative capi-tal stock valuation will be able to derive a monetary valua-tion of capitals’ benefits.
11 Land Use, Irrigation and Agricultural Practices – Definitions according to FAO category system. Published in FAOSTAT by FAO, last updated November 2017 (See ANNEX 1).
12 EX-Ante Carbon Balance Tool (EX-ACT): http://www.fao.org/tc/exact/ex-act-home/en/.
Based on key elements that capture the transition towards green growth models, and available tools, especially for measuring, modeling, and valuing ecosystem services; the 3Returns Framework recommends the following indicators to be quantified and monetized in order to essentially cap-ture both, social, and economic value, while reflecting the impact of BaU activities and green interventions.
Quantitative Indicators:
Natural Capital and Economic Activity Indicators:
Land Use Area: quantify the estimated land use area in hectares based on the classification of Land Use, Irrigation and Agricultural Practices by the Food and Agriculture Organization of the United Nations11. This quantitative indicator will facilitate the monetary val-uation process for quantifying social and economic values.
GHG emissions: quantify the GHG emission esti-mates in carbon dioxide equivalent terms (CO2e). The 3Returns Framework recommends for this indicator the Ex-Ante Carbon-balance Tool12. This tool is an ap-praisal system developed by FAO which provides esti-mates of the impact of agriculture, forestry and fish-ery development projects, programmes and policies on the carbon-balance. The tool also allows compari-son between impacts of potential interventions and a business-as-usual scenario. (See Annex 1).
Box 3: The valuation techniques applied will depend on the time and resources available. There may be trade-offs between different valuation techniques in terms of their precision, time, and cost. Furthermore, all valuation methods have their advantages and disadvantag-es and, generally speaking, a sequential, pragmatic approach for estimating capitals’ stocks and benefits.
Box 4: The Myanmar Mangrove 3Returns Restoration Case in Chapter 4 includes an exam-ple of avoiding double counting.
When quantifying the economic activities related to mud crab commerce (one of the main commodities traded in the region), two main actors were identified: crab catchers and crab farmers or fatteners. Crab catchers were trading with crab fatteners (crablets and juveniles) and in markets (adult crabs), meanwhile crab fatteners were just trading in markets (adult crabs). Therefore, when quantifying the economic benefits of crab catchers, only the revenue received from markets was reported in the benefits section, as the revenue received from trading/sourcing crab farmers was already reported through the operational expenditures of the crab farmers. Consequently, benefits of both actors were expressed at the same market
Box 3. Valuation TechniqueThe valuation techniques applied will depend on the time and resources available. There may be trade-offs between different valuation techniques in terms of their precision, time, and cost. Furthermore, all valuation methods have their advantages and dis-advantages and, generally speaking, a sequential, pragmatic approach for estimating capitals’ stocks and benefits.
19The 3Returns Framework A method for decision making towards sustainable landscapes
3.1.2 ValuationThe second phase requires the definition of a baseline for capitals and benefits as a first step. Through this, the 3Re-turns assessment determines a starting point, or bench-mark, to analyze potential changes in capitals’ stocks and flows. Based on the baseline, changes in capitals attribut-ed to different activities within the landscape can be com-pared. Therefore, an explicit baseline is recommended as it will enable the drawing of meaningful conclusions. Defining the baseline requires a process of capitals’ valuation, deter-mining the importance, worth, or usefulness of them within a particular context. Therefore, understanding the social, environmental, and economic context is essential to mean-ingfully estimate the value of capitals and their benefits.
The valuation process will depend on the identification stage, specifically on the scope of the assessment, and on the impact drivers and dependencies to be assessed. Despite the variability of the valuation process, based on selecting context specific determinants, the 3Returns val-uation process requires incorporating two types of values. Social Value, which will determine relevant outcomes for society in general; assessing the vulnerability to natural and social risks caused by human activities or caused by natural forces. And Economic Value, which will determine how capitals’ impacts affect, positively or negatively, the financial performance of economic activities.
Therefore, the selection of indicators to value capitals’ stocks and flows requires the consideration of the need to reflect these two values during the valuation process. For this, each indicator may require an appropriate valuation technique in order to value capitals as “stocks”, and the benefits that are derived from them. In physical terms, “stocks” refer to the total quantity and quality of assets at a given point in time, such as the volume of standing trees in a given area. In monetary terms, capital benefits refer to the monetary inflows, or savings inferred from capital stocks, such as the revenue from economic activities based on tim-ber (Economic Value), or economic savings from flood pro-tection from standing trees (Social Value). A quantitative valuation of capital stocks will facilitate a monetary valua-tion of capitals’ benefits; however, not all quantitative capi-tal stock valuation will be able to derive a monetary valua-tion of capitals’ benefits.
11 Land Use, Irrigation and Agricultural Practices – Definitions according to FAO category system. Published in FAOSTAT by FAO, last updated November 2017 (See ANNEX 1).
12 EX-Ante Carbon Balance Tool (EX-ACT): http://www.fao.org/tc/exact/ex-act-home/en/.
Based on key elements that capture the transition towards green growth models, and available tools, especially for measuring, modeling, and valuing ecosystem services; the 3Returns Framework recommends the following indicators to be quantified and monetized in order to essentially cap-ture both, social, and economic value, while reflecting the impact of BaU activities and green interventions.
Quantitative Indicators:
Natural Capital and Economic Activity Indicators:
Land Use Area: quantify the estimated land use area in hectares based on the classification of Land Use, Irrigation and Agricultural Practices by the Food and Agriculture Organization of the United Nations11. This quantitative indicator will facilitate the monetary val-uation process for quantifying social and economic values.
GHG emissions: quantify the GHG emission esti-mates in carbon dioxide equivalent terms (CO2e). The 3Returns Framework recommends for this indicator the Ex-Ante Carbon-balance Tool12. This tool is an ap-praisal system developed by FAO which provides esti-mates of the impact of agriculture, forestry and fish-ery development projects, programmes and policies on the carbon-balance. The tool also allows compari-son between impacts of potential interventions and a business-as-usual scenario. (See Annex 1).
Box 3: The valuation techniques applied will depend on the time and resources available. There may be trade-offs between different valuation techniques in terms of their precision, time, and cost. Furthermore, all valuation methods have their advantages and disadvantag-es and, generally speaking, a sequential, pragmatic approach for estimating capitals’ stocks and benefits.
Box 4: The Myanmar Mangrove 3Returns Restoration Case in Chapter 4 includes an exam-ple of avoiding double counting.
When quantifying the economic activities related to mud crab commerce (one of the main commodities traded in the region), two main actors were identified: crab catchers and crab farmers or fatteners. Crab catchers were trading with crab fatteners (crablets and juveniles) and in markets (adult crabs), meanwhile crab fatteners were just trading in markets (adult crabs). Therefore, when quantifying the economic benefits of crab catchers, only the revenue received from markets was reported in the benefits section, as the revenue received from trading/sourcing crab farmers was already reported through the operational expenditures of the crab farmers. Consequently, benefits of both actors were expressed at the same market
Social & Human Capital Indicators:
Jobs and green jobs: quantify the estimates of jobs and green jobs in terms of number of jobs (consider only full-time jobs or full-time equivalent jobs). The number of jobs is strongly linked with the valuation of economic activities as part of the operational ex-penditures. However, not all the jobs within the eco-nomic activities identified qualify as green jobs.13 The quantification of both indicators becomes crucial as a measure for comparison between intervention and no intervention or between different interventions (See Annex 1).
Enhanced adaptation: quantify the estimated num-ber of people supported to cope with the effects of climate change. For this indicator, only direct bene-ficiaries are recommended to be considered. Direct beneficiaries are defined as households or individuals that directly receive and/or shape the outcome of a given intervention (See Annex 1).
Participation in collective decision-making organi-zations: quantify the estimated percentage of people participating in a formal organization either created based on their economic activity, social condition, or both.
Monetary Indicators:
Economic value of productive and extractive sectors: monetize the estimated annual benefits and costs from productive sectors such as agriculture, aqua-culture, livestock and forestry; and extractive sectors such as fishery. The quantification of land use area supports the monetization of economic activities if its complemented with production yields, commodity prices and costs of production.
Social and economic value of ecosystem services: monetize the estimated annual social value (e.g. haz-ard mitigation) and economic value (e.g. pesticide cost avoided) of ecosystem services. For valuing eco-system services, the document ‘Tools for measuring, modeling, and valuing ecosystem services: Guidance for Key Biodiversity Areas, natural World Heritage sites, and protected areas’ prepared by OECD, cate-gorizes two types of tools for valuing ecosystem ser-vices. The first type consists of written step-by-step tools which are guidance documents with specific measurement protocols, such as Toolkit for Ecosys-tem Service Site-based Assessment (TESSA) or the Protected Area Benefits Assessment Tool (PA-BAT). The second type are computer-based modeling tools, which are software or web-based tools that enable assessment of one or more sites. Considering the
13 To classify a job as a ‘Green Job’ requires meeting the decent job criteria. Decent working should include one or more of the following: (a) adequate monthly wage, (b) work stability and security, (c) occupational hazard level involved, (d) decent working hours, and (e) availability of social protection scheme (e.g. social security). Work that uses child labor and bounded labor do not qualify for decent work. Example sectoral areas in AFOLU that have large green employment creation potential include the following: Sustainable forestry activities (tree plantation, forest certification, national voluntary certification) sustainable production practices (organic agriculture, bee-keeping, climate smart agricultural practices) sustainable tourism (ecotourism).
nature of the proposed 3Returns assessments, the computer-based modeling tools are recommended as they can incorporate scenarios, spatial assessment, and economic valuation of ecosystem services and integrate different ecological and economic mod-els to understand and visualize ecosystem services values. For reference, Annex 2 presents the comput-er-based modeling tools included in the document prepared by the OECD.
Avoiding double counting is a key issue to consider when valuing in monetary terms. This can occur, for example, when intermediate costs or benefits, rather than only final costs or benefits, are assessed. For example, the value of some inputs may already be included in the price of a trad-ed commodity. Therefore, recording both the benefits of the inputs and the commodity traded would be an example of double counting. (See Box 4). This same principle also applies when valuing and considering ecosystem services that affect economic activities. For example, when valuing pollination services, the attributable value of pollination can be already embedded in the value of the final crops produced (yield impact). Therefore, the value of pollination services should not be added to the value of the final crops. Finally, as a measure to avoid double counting the 3Returns Framework recommends organizing the information of the valuation stage following the Return on Investment Analy-sis structure presented in the following section. Table 15 in Chapter 4 presents an example of information from the baseline valuation process organized following this struc-ture.
Box 4. The Myanmar Mangrove 3Returns Restoration Case in Chapter 4 includes an example of avoiding double counting.When quantifying the economic activities related to mud crab commerce (one of the main commod-ities traded in the region), two main actors were identified: crab catchers and crab farmers or fat-teners. Crab catchers were trading with crab fatten-ers (crablets and juveniles) and in markets (adult crabs), meanwhile crab fatteners were just trading in markets (adult crabs). Therefore, when quanti-fying the economic benefits of crab catchers, only the revenue received from markets was reported in the benefits section, as the revenue received from trading/sourcing crab farmers was already reported through the operational expenditures of the crab farmers. Consequently, benefits of both actors were expressed at the same market level considering the trade of adult crabs.
The 3Returns Framework A method for decision making towards sustainable landscapes 20
Scenario Modeling
Once the baseline has been defined and valued according to the indicators chosen, changes in capitals and benefits should be modeled to reflect different storylines describ-ing a possible future. Scenario design and analysis allows stakeholders to understand various possibilities and out-comes between continuing operations as usual and having an intervention through the implementation of different activities, technologies, or through different actors. Con-sidering the approach of the 3Returns, scenario design and analysis must incorporate the intervention and interrelated changes in capitals (natural, social & human, and financial), which allows for the analysis of changes in benefits and the identification of affected stakeholders. For this, at least two scenarios should be designed. Data and methods for assessing changes are required for designing and model-ing changes in at least two situations:
1. Business as usual, i.e., no intervention
2. Green Growth, i.e., one, or multiple, interventions
The definition and valuation of the baseline, and the identifi-cation of relevant impact drivers and dependencies, allows defining the potential changes in natural, social & human, and financial capital and their impact on the benefits to which they give rise. At this point, several considerations, explained in the paragraphs below, should be taken into ac-count when selecting and applying the methodologies to measure changes to the benefits of capitals as a result of impact drivers. It is essential to note that for a single assessment, multi-ple modeling methodologies can be applied. Therefore, it is important to identify the required or desired outputs, given that different methods may involve different geographic scopes or use different indicators and metrics. Addition-ally, depending on the methodology, extreme observations (outliers) or attributed changes in capitals and benefits may be treated in different ways. While a range of meth-
odologies can, and often must, be employed to assess im-pacts and dependencies, it is important to consider meth-odological differences and how they will affect the results. In addition to methodological considerations when measur-ing changes in the state of capitals, clear distinction needs to be drawn between the multiple actors that contribute to capital changes and the impact drivers affecting the status of the capitals. Of course, these will depend on the ma-teriality assessment done during the identification stage and the perspective of the assessor when conducting the analysis. However, at this point the consideration of actors and impact drivers should be clearly defined, allowing for the specification of the assumptions that will be consid-ered when modeling and analyzing the defined scenarios.
The 3Returns Framework strongly emphasizes the impor-tance and necessity to identify, analyze, and model chang-es in capitals associated with external factors. Scenario development must take into consideration important ex-ternal factors (impact drivers) such as climate change and extreme weather events (e.g. flooding, droughts), either naturally produced or human-induced. Changes in capitals associated with climate change and extreme weather con-ditions result in direct and indirect impacts on commercial and subsistence practices. The consideration and analysis of these changes become crucial when providing adapta-tion and technological solutions. Understanding the mag-nitude of those impacts, and which stakeholders will be affected by such changes, increases the ability to assess risks and to respond based on the current resilient oppor-tunities. Once potential external factors that may influence the state of capitals have been identified, determining the trend associated with these factors becomes an important step, especially where changes are non-linear, cumulative, or are approaching critical thresholds.
Once these considerations have been examined, the next action would be to conduct the measurement, or estima-tion, of capitals and changes in benefits associated with each impact driver and dependency through the method-ologies selected. Where relevant, the outputs may include a likelihood estimation of change. For each factor identi-fied, which could lead to significant changes in capitals, it is useful and informative to estimate the likelihood of that factor occurring. Various methods can be used to assess the likelihood of change, including a probability-based anal-ysis, a multi-criteria analysis, and expert opinion and/or multi-stakeholder assessment. The likelihood assessment will influence the results of the 3Returns assessment; how-ever, likelihood assessments are inherently uncertain and may be subjective. To account for this, a sensitivity analy-sis of the final results will support studying a range of al-ternative values, allowing the assessor to identify threshold levels of likelihood at which the assessment would lead to a different decision. This step is a useful method to justify the results of the assessment and substantiate decision making.
Box 5: The business as usual scenario
For some landscapes, it is expected to find some level of pre-existing investment in capitals, such as in production and extraction assets, restoration, or capacity building efforts. In these cases, the 3Returns Framework recommends analyzing them as BaU.
Other landscapes are expected to not have experienced any kind of investment in capitals. In these cases, the 3Returns Framework recommends analyzing these as BaU, but forewarns
Box 5. The Business as Usual ScenarioFor some landscapes, it is expected to find some level of pre-existing investment in capitals, such as in production and extraction assets, restoration, or capacity building efforts. In these cases, the 3Returns Framework recommends analyzing them as BaU.
Other landscapes are expected to not have experienced any kind of investment in capitals. In these cases, the 3Returns Framework recommends analyzing these as BaU, but forewarns that the calculation of efficiency measures (i.e. ROI) will not be possible for the BaU and will only be part of the green growth scenario analysis.
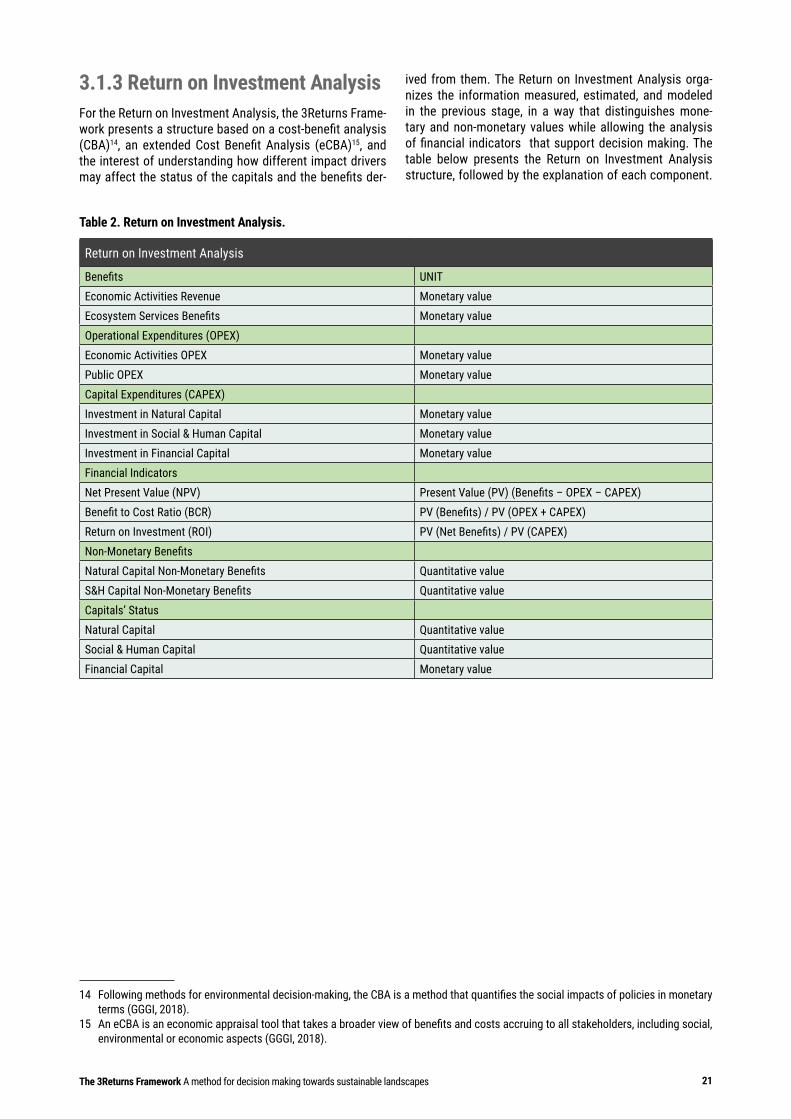
21The 3Returns Framework A method for decision making towards sustainable landscapes
Scenario Modeling
Once the baseline has been defined and valued according to the indicators chosen, changes in capitals and benefits should be modeled to reflect different storylines describ-ing a possible future. Scenario design and analysis allows stakeholders to understand various possibilities and out-comes between continuing operations as usual and having an intervention through the implementation of different activities, technologies, or through different actors. Con-sidering the approach of the 3Returns, scenario design and analysis must incorporate the intervention and interrelated changes in capitals (natural, social & human, and financial), which allows for the analysis of changes in benefits and the identification of affected stakeholders. For this, at least two scenarios should be designed. Data and methods for assessing changes are required for designing and model-ing changes in at least two situations:
1. Business as usual, i.e., no intervention
2. Green Growth, i.e., one, or multiple, interventions
The definition and valuation of the baseline, and the identifi-cation of relevant impact drivers and dependencies, allows defining the potential changes in natural, social & human, and financial capital and their impact on the benefits to which they give rise. At this point, several considerations, explained in the paragraphs below, should be taken into ac-count when selecting and applying the methodologies to measure changes to the benefits of capitals as a result of impact drivers. It is essential to note that for a single assessment, multi-ple modeling methodologies can be applied. Therefore, it is important to identify the required or desired outputs, given that different methods may involve different geographic scopes or use different indicators and metrics. Addition-ally, depending on the methodology, extreme observations (outliers) or attributed changes in capitals and benefits may be treated in different ways. While a range of meth-
Box 5: The business as usual scenario
For some landscapes, it is expected to find some level of pre-existing investment in capitals, such as in production and extraction assets, restoration, or capacity building efforts. In these cases, the 3Returns Framework recommends analyzing them as BaU.
Other landscapes are expected to not have experienced any kind of investment in capitals. In these cases, the 3Returns Framework recommends analyzing these as BaU, but forewarns
3.1.3 Return on Investment AnalysisFor the Return on Investment Analysis, the 3Returns Frame-work presents a structure based on a cost-benefit analysis (CBA)14, an extended Cost Benefit Analysis (eCBA)15, and the interest of understanding how different impact drivers may affect the status of the capitals and the benefits der-
Table 2. Return on Investment Analysis.
Return on Investment Analysis
Benefits UNITEconomic Activities Revenue Monetary valueEcosystem Services Benefits Monetary valueOperational Expenditures (OPEX)Economic Activities OPEX Monetary valuePublic OPEX Monetary valueCapital Expenditures (CAPEX)Investment in Natural Capital Monetary valueInvestment in Social & Human Capital Monetary valueInvestment in Financial Capital Monetary valueFinancial IndicatorsNet Present Value (NPV) Present Value (PV) (Benefits – OPEX – CAPEX)Benefit to Cost Ratio (BCR) PV (Benefits) / PV (OPEX + CAPEX)Return on Investment (ROI) PV (Net Benefits) / PV (CAPEX)Non-Monetary BenefitsNatural Capital Non-Monetary Benefits Quantitative valueS&H Capital Non-Monetary Benefits Quantitative valueCapitals’ StatusNatural Capital Quantitative valueSocial & Human Capital Quantitative valueFinancial Capital Monetary value
14 Following methods for environmental decision-making, the CBA is a method that quantifies the social impacts of policies in monetary terms (GGGI, 2018).
15 An eCBA is an economic appraisal tool that takes a broader view of benefits and costs accruing to all stakeholders, including social, environmental or economic aspects (GGGI, 2018).
ived from them. The Return on Investment Analysis orga-nizes the information measured, estimated, and modeled in the previous stage, in a way that distinguishes mone-tary and non-monetary values while allowing the analysis of financial indicators that support decision making. The table below presents the Return on Investment Analysis structure, followed by the explanation of each component.
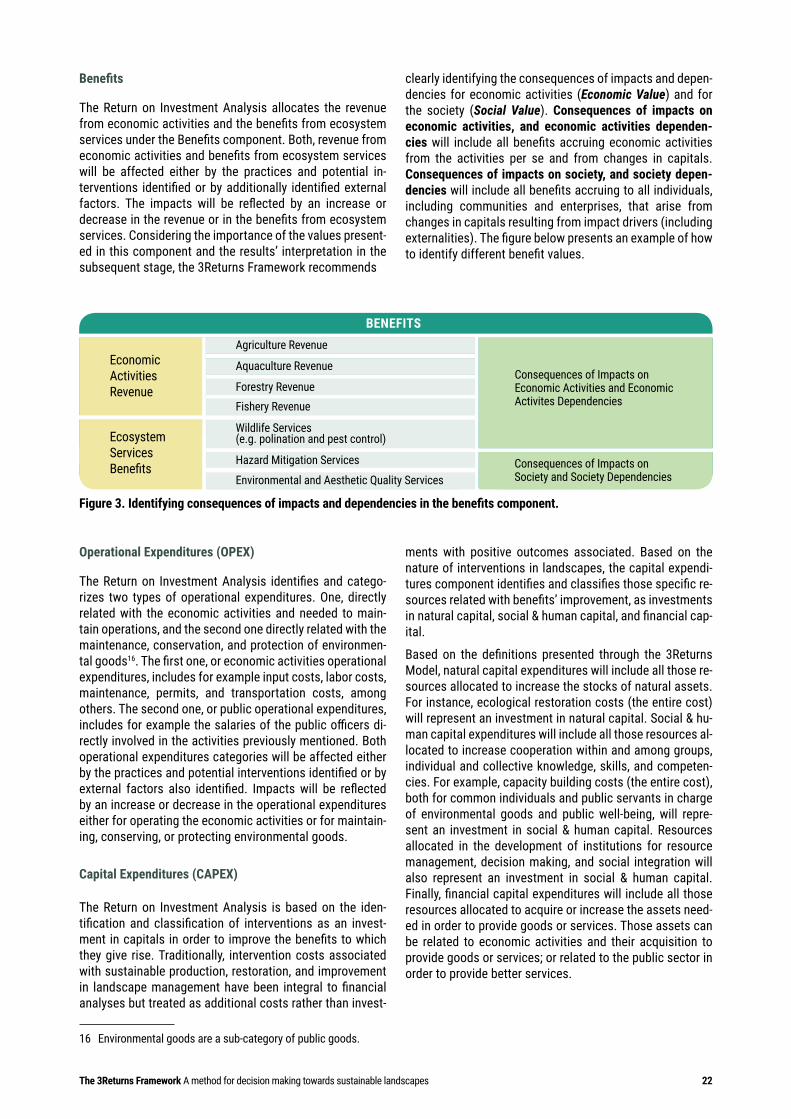
The 3Returns Framework A method for decision making towards sustainable landscapes 22
Benefits
The Return on Investment Analysis allocates the revenue from economic activities and the benefits from ecosystem services under the Benefits component. Both, revenue from economic activities and benefits from ecosystem services will be affected either by the practices and potential in-terventions identified or by additionally identified external factors. The impacts will be reflected by an increase or decrease in the revenue or in the benefits from ecosystem services. Considering the importance of the values present-ed in this component and the results’ interpretation in the subsequent stage, the 3Returns Framework recommends
clearly identifying the consequences of impacts and depen-dencies for economic activities (Economic Value) and for the society (Social Value). Consequences of impacts on economic activities, and economic activities dependen-cies will include all benefits accruing economic activities from the activities per se and from changes in capitals. Consequences of impacts on society, and society depen-dencies will include all benefits accruing to all individuals, including communities and enterprises, that arise from changes in capitals resulting from impact drivers (including externalities). The figure below presents an example of how to identify different benefit values.
Operational Expenditures (OPEX)
The Return on Investment Analysis identifies and catego-rizes two types of operational expenditures. One, directly related with the economic activities and needed to main-tain operations, and the second one directly related with the maintenance, conservation, and protection of environmen-tal goods16. The first one, or economic activities operational expenditures, includes for example input costs, labor costs, maintenance, permits, and transportation costs, among others. The second one, or public operational expenditures, includes for example the salaries of the public officers di-rectly involved in the activities previously mentioned. Both operational expenditures categories will be affected either by the practices and potential interventions identified or by external factors also identified. Impacts will be reflected by an increase or decrease in the operational expenditures either for operating the economic activities or for maintain-ing, conserving, or protecting environmental goods.
Capital Expenditures (CAPEX)
The Return on Investment Analysis is based on the iden-tification and classification of interventions as an invest-ment in capitals in order to improve the benefits to which they give rise. Traditionally, intervention costs associated with sustainable production, restoration, and improvement in landscape management have been integral to financial analyses but treated as additional costs rather than invest-
16 Environmental goods are a sub-category of public goods.
ments with positive outcomes associated. Based on the nature of interventions in landscapes, the capital expendi-tures component identifies and classifies those specific re-sources related with benefits’ improvement, as investments in natural capital, social & human capital, and financial cap-ital.
Based on the definitions presented through the 3Returns Model, natural capital expenditures will include all those re-sources allocated to increase the stocks of natural assets. For instance, ecological restoration costs (the entire cost) will represent an investment in natural capital. Social & hu-man capital expenditures will include all those resources al-located to increase cooperation within and among groups, individual and collective knowledge, skills, and competen-cies. For example, capacity building costs (the entire cost), both for common individuals and public servants in charge of environmental goods and public well-being, will repre-sent an investment in social & human capital. Resources allocated in the development of institutions for resource management, decision making, and social integration will also represent an investment in social & human capital. Finally, financial capital expenditures will include all those resources allocated to acquire or increase the assets need-ed in order to provide goods or services. Those assets can be related to economic activities and their acquisition to provide goods or services; or related to the public sector in order to provide better services.
BENEFITS
Economic Activities Revenue
Agriculture Revenue
Aquaculture Revenue
Forestry RevenueFishery Revenue
Ecosystem Services Benefits
Environmental and Aesthetic Quality Services
Wildlife Services(e.g. polination and pest control)
Hazard Mitigation Services
Consequences of Impacts on Economic Activities and Economic Activites Dependencies
Consequences of Impacts on Society and Society Dependencies
Figure 3. Identifying consequences of impacts and dependencies in the benefits component.
23The 3Returns Framework A method for decision making towards sustainable landscapes
Financial Indicators
Following the fundamentals of a cost-benefit analysis, the calculation and interpretation of the NPV and the benefit to cost ratio (BCR) follows the same logic.
The NPV is the difference between the present value (PV) of inflows and the PV of outflows over a period of time. As in capital budgeting and investment planning, the NPV in this case analyzes the profitability of current practices and of a potential intervention. A positive NPV will indicate that the projected benefits exceed the anticipated expendi-tures in present monetary terms. Therefore, a positive NPV will reflect profitability while a negative NPV will reflect net losses.
The BCR is a complementary financial indicator that sum-marizes the overall relationship between the costs and benefits of current practices and potential interventions. It provides useful information specially when analyzing dif-ferent potential interventions, being potential investments with high BCR the most preferred.
Traditionally, the ROI indicator has been a performance measure used to evaluate and compare the efficiency of an investment. However, and considering the 3Returns Framework and capitals’ investment, the ROI in this case provides valuable information when assessing interven-tions for sustainable landscapes. The ROI analyzes the resources stakeholders invest in a landscape, and the re-turns that stakeholders realize on those resources based on the net benefits they receive from the landscape and the institutions in it. Understanding the relationship between the net benefits against the resources invested in a land-scape, considering the interlinked ecological, social, and economic impact, facilitates the support for a sustainable and profitable intervention, in other words, a green growth intervention. The ROI calculation must consider Net Ben-efits (benefits minus operational expenditures) in the nu-merator as a result of interdependency and because mul-tiple impacts (either by practices, potential interventions or by external factors) will be reflected in an increase, or decrease, of the benefits and operational expenditures. As mentioned before, avoiding double counting is essential in order to reflect an accurate numerator.
For the three financial indicators calculation, when the scope of the assessment relates only to private costs or benefits to a business, a financial/commercial discount rate is used to express the future costs or benefits in PV terms. However, it is unusual that decisions affecting the capitals under consideration have purely private conse-quences. Therefore, it is appropriate to apply a discount rate that reflects the balance of preferences for consump-tion now versus preferences for consumption in the future among all different stakeholders.
Box 7: The Social Discount Rate (SDR)
The discount rate is central to any economic decision involving the use of resources in different periods of time. This is particularly relevant in the evaluation of policies and investment projects where the social consequences of incorrect or suboptimal decisions may be very significant for the long-term development. From the point of view of private investors, determining the ad-equate discount rate in a project is relatively easy (it should reflect the opportunity cost of the capital). On the other hand, the social discount rate should reflect the rate at which a group of individuals is willing to sacrifice present and future benefits and costs (measured for example in terms of wealth or consumption) (Campos & et al., 2015).
What is the optimal (social) discount rate to use in evaluating projects? The debate remains unsolved with an academic consensus still distant. However, choosing the appropriate discount rate is critical when analyzing a project. For instance, a higher discount rate favors projects with benefits that accrue earlier, whereas it tends to penalize those projects whose costs are higher at early stages and benefits mostly arise in the long run. Recommended SDR by multilateral institutions: The World Bank (10-12%), Inter-American Development Bank (12%), Asian Devel-opment Bank (10-12%), African Development Bank (10-12%), and European Bank for Recon-struction and Development (10%) (Campos & et al., 2015).
Box 6. CSA Practices ExampleTaking the implementation of CSA practices for il-lustrating capitals’ investment, the implementation of a production asset, for example solar irrigation systems, will represent an investment in financial and social & human capital. The financial capital investment will be reflected in the acquisition and implementation cost of the solar irrigation system, while the expenditures related to capacity building for system management will represent the social & human capital investment. Furthermore, the intro-duction of a complementary crop or commodity in the production stage will represent an investment in social & human capital based on the resources allocated for capacity building. The resources allo-cated for the secondary crop or commodity do not represent an investment in natural capital, as those resources are part of the input costs for operating the economic activity. Conversely, the investment in a surrounding forest with the main purpose of gain-ing ecosystem services will represent an investment in natural capital.
Net Present Value = PV (Benefits - OPEX - CAPEX)
Benefit to Cost Ratio (BCR) = PV (Benefits)PV (OPEX + CAPEX)
Return on Investment (ROI) = PV (Benefits - OPEX)PV (CAPEX)
=PV (Net Benefits)
PV (CAPEX)
The 3Returns Framework A method for decision making towards sustainable landscapes 24
Consequently, it is recommended to apply a societal or so-cial discount rate17 for expressing future costs or benefits in PV terms. A sensitivity analysis is recommended to be applied for the discount rate, testing the sensitivity of re-sults and conclusions using different discount rates.
Non-Monetary Benefits
Following the importance of capturing key elements that support a transition towards green growth models, the fol-lowing non-monetary indicators are recommended to be considered and expressed through the Return on Invest-ment Analysis. Regarding natural capital non-monetary benefits, it is recommended to quantify the cumulative GHG emissions for the scenarios regarding the time frame under analysis. Other non-monetary can be considered, for example the species diversity (depending on the scope of the assessment, e.g. tree species diversity) expressed for different scenarios and at the end of the time frame under analysis.
17 Social discount rates are almost always lower than normal financial or commercial discount rates as they attempt to reflect the well-being of future generations as well as generations alive today.
Regarding social & human non-monetary benefits, and based on the indicators suggested previously, it is recom-mended to quantify the number of total jobs and green jobs maintained for different scenarios until the end of the time frame under analysis. For the number of people supported to cope with the effects of climate change, it is recommend-ed to quantify the total number of people supported under different scenarios during the time frame under analysis. Finally, for the participation in collective decision-making organizations it is recommended to quantify the estimated percentage of people participating in a formal organization in the different scenarios and at the end of the time frame under analysis.
Capitals’ Status
The last section of the Return on Investment Analysis aims to support an overall comparable analysis based on cap-itals outputs as a result of no intervention and different potential interventions. Following the recommended indi-cators and information under analysis, the capital’s status can be expressed through the following outputs:
•• Natural Capital Status Indicator: The 3Returns Frame-work recommends quantifying the estimated land use area in hectares based on the classification of Land Use, Irrigation and Agricultural Practices by the Food and Agriculture Organization of the United Nations. The land use area should be quantified and expressed at the end of the time frame under analysis.
•• Social & Human Capital Status Indicator: It is recom-mended to express in quantitative figures the number of people involved in capacity building programs (members or staff of the government, private sector actors, and population in general), and the number of people involved in decision making and integrative organiza-tions. The social & human capital status result should be expressed as the total number of people reached during the time frame under analysis.
•• Financial Capital Status: Will be expressed as the PV (monetary terms) of the capital expended in the acquisition of assets needed to provide goods or services. The financial capital status adds up to the overall economic capital status.
Box 7. The Social Discount Rate (SDR)The discount rate is central to any economic deci-sion involving the use of resources in different peri-ods of time. This is particularly relevant in the eval-uation of policies and investment projects where the social consequences of incorrect or suboptimal decisions may be very significant for the long-term development. From the point of view of private in-vestors, determining the adequate discount rate in a project is relatively easy (it should reflect the op-portunity cost of the capital). On the other hand, the social discount rate should reflect the rate at which a group of individuals is willing to sacrifice present and future benefits and costs (measured for exam-ple in terms of wealth or consumption) (Campos & et al., 2015).
What is the optimal (social) discount rate to use in evaluating projects? The debate remains unsolved with an academic consensus still distant. However, choosing the appropriate discount rate is critical when analyzing a project. For instance, a higher dis-count rate favors projects with benefits that accrue earlier, whereas it tends to penalize those projects whose costs are higher at early stages and benefits mostly arise in the long run. Recommended SDR by multilateral institutions: The World Bank (10-12%), Inter-American Development Bank (12%), Asian Development Bank (10-12%), African Development Bank (10-12%), and European Bank for Reconstruc-tion and Development (10%) (Campos & et al., 2015).
25The 3Returns Framework A method for decision making towards sustainable landscapes
3.1.4 Results InterpretationThe information presented through the Return on Invest-ment Analysis allows policy makers and investors to an-alyze benefits, costs, and trade-offs between different investment options based on an iterative selection of inter-ventions considering investors’, governmental institutions’ and stakeholders’ interest. Information presented through the different categories allows for public and policy sup-port, site managing and planning, funding and investment, and knowledge generation purposes. When analyzing land-scapes interventions, the information obtained is of key interest to government agencies, policy and decision mak-ers, local communities, businesses, donors, conservation organizations, commercial banks, multilateral development banks, public and private investors, and research organiza-tions, among others.
Going through the Return on Investment Analysis, the first two sections, benefits and operational expenditures, reflect the importance and interrelationship between economic and livelihood activities within the landscape boundaries in which these activities are carried out. Any input or out-put from an activity has a multi-stakeholder consequence, therefore information in these two categories aims to high-light the trade-offs between economic and social value. Policy and investment decision making should consider this information aiming to maximize the value of both, while also minimizing the trade-offs between them.
Categorizing different interventions as an investment in capitals through the capital expenditure section allows for an understanding of the nature of such interventions and their relationship to benefits and operational costs. Each potential intervention will represent an investment in one or several capitals at the same time. The information in this section allows for understanding the nature of potential interventions and their relationship with changes in bene-fits and operational expenditures. Therefore, this section complements the understanding for policy and investment decision making, allowing for the appreciation of what the key factors driving economic and social value are.
The non-monetary benefits and capitals’ status comple-ments the information mentioned in the previous sections, emphasizing key trade-offs from potential interventions and no action. The acknowledgement of non-monetary ben-efits and capital’s status is of the utmost importance, spe-cifically for seeking collective well-being through important aspects that are not often reflected in monetary values.
The interpretation of the financial indicators, NPV and BCR, follows the same understanding as any other financial analysis developed in order to define the profitability of an investment. However, and considering the investment ap-proach in capitals, the interpretation of the ROI becomes relevant and crucial in understanding the efficiency of po-tential interventions, complementing the information from the NPV at the moment of policy and investment decision making.
18 For instance, when analyzing contaminated and heavily degraded landscapes.
The NPV has generally been used to decide whether to pur-sue an intervention or not, with the rule of thumb being to proceed if the NPV is greater than zero. When analyzing socio-economic systems in a landscape, it is expected, al-though not always18, that the BaU scenario reflects a posi-tive NPV. It is also expected that, depending on the nature of the actions, a potential intervention reflects a positive and greater NPV than the BaU scenario. Based on this, a range of potential interventions can be analyzed, taking as the most favourable the ones that show the greatest NPV. However, higher NPVs can be expected to be backed by greater investments (not always true), which can represent a risk, especially when considering the estimation of long-term benefits from landscapes. Additionally, even though the NPV from sustainable practices can be greater than the one from BaU practices, the fact that the NPV from BaU can be positive without investing in natural and social & human capitals hinders the motivation to move to a more sustain-able model.
The ROI indicator takes another angle of analysis when considering potential interventions and resource allocation for improving benefits. Following the 3Returns Framework and capitals’ investment approach, the ROI provides infor-mation about the efficiency of allocating resources against the net benefits received from them. It is expected to ob-serve a positive and even greater ROI from the BaU scenar-io compared to potential green growth interventions when calculating the ROI for different scenarios in the short-term. This, as current practices mostly reflect an exploitation of resources without sufficient replenishment or reinvest-ment, driven by short-term benefits and not considering the long run. On the other hand, any potential intervention that would imply an investment in capitals is expected to reflect a lower ROI in the short-term considering the nature of interventions in a landscape. However, and depending on the activities under the BaU, if degradation and unsus-tainable practices are observed, it is expected that the rela-tionship ‘net benefits over investment’ starts declining over time, reflecting a lack of capitals’ replenishment for benefit creation. Conversely, the relationship between ‘net benefits over investment’ for potential green interventions is expect-ed to increase in the long-term (at different rates depending on the interventions proposed), being the intervention with the greatest ROI the one implying the most efficient alloca-tion of resources for benefit creation.
Combining all, NPV, ROI, investment size, and non-monetary benefits, supports decision making that leads the transition towards sustainable landscapes, securing current and fu-ture well-being. From the landscape perspective, decision making based only on NPV does not strongly support a transition from a more efficient, but unsustainable econom-ic model, to a more sustainable, but less efficient model in the short-term. However, when considering the impor-tance of capitals and the need to invest in them for benefit improvement, interventions that reflect an increasing ROI, even higher than the BaU scenario in the long-term, serves as the evidence for motivating a transition towards sustain-able economic and livelihood models.
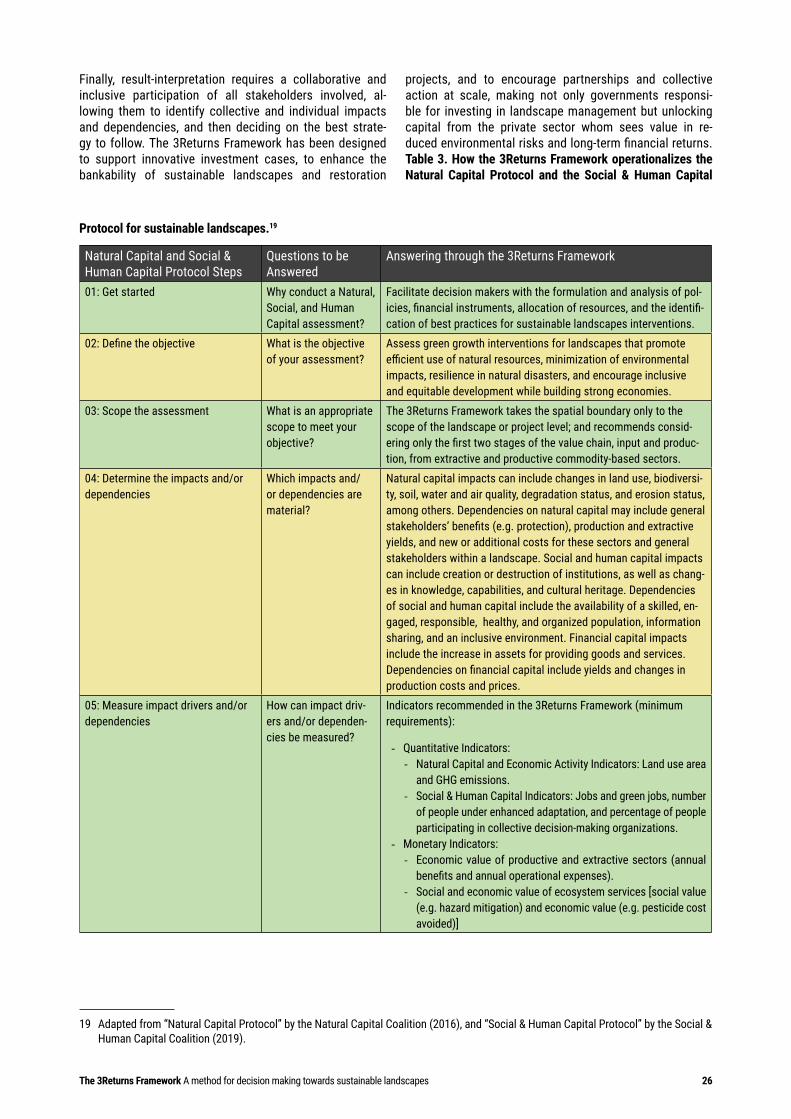
The 3Returns Framework A method for decision making towards sustainable landscapes 26
Finally, result-interpretation requires a collaborative and inclusive participation of all stakeholders involved, al-lowing them to identify collective and individual impacts and dependencies, and then deciding on the best strate-gy to follow. The 3Returns Framework has been designed to support innovative investment cases, to enhance the bankability of sustainable landscapes and restoration
projects, and to encourage partnerships and collective action at scale, making not only governments responsi-ble for investing in landscape management but unlocking capital from the private sector whom sees value in re-duced environmental risks and long-term financial returns. Table 3. How the 3Returns Framework operationalizes the Natural Capital Protocol and the Social & Human Capital
Protocol for sustainable landscapes.19
Natural Capital and Social & Human Capital Protocol Steps
Questions to be Answered
Answering through the 3Returns Framework
01: Get started Why conduct a Natural, Social, and Human Capital assessment?
Facilitate decision makers with the formulation and analysis of pol-icies, financial instruments, allocation of resources, and the identifi-cation of best practices for sustainable landscapes interventions.
02: Define the objective What is the objective of your assessment?
Assess green growth interventions for landscapes that promote efficient use of natural resources, minimization of environmental impacts, resilience in natural disasters, and encourage inclusive and equitable development while building strong economies.
03: Scope the assessment What is an appropriate scope to meet your objective?
The 3Returns Framework takes the spatial boundary only to the scope of the landscape or project level; and recommends consid-ering only the first two stages of the value chain, input and produc-tion, from extractive and productive commodity-based sectors.
04: Determine the impacts and/or dependencies
Which impacts and/or dependencies are material?
Natural capital impacts can include changes in land use, biodiversi-ty, soil, water and air quality, degradation status, and erosion status, among others. Dependencies on natural capital may include general stakeholders’ benefits (e.g. protection), production and extractive yields, and new or additional costs for these sectors and general stakeholders within a landscape. Social and human capital impacts can include creation or destruction of institutions, as well as chang-es in knowledge, capabilities, and cultural heritage. Dependencies of social and human capital include the availability of a skilled, en-gaged, responsible, healthy, and organized population, information sharing, and an inclusive environment. Financial capital impacts include the increase in assets for providing goods and services. Dependencies on financial capital include yields and changes in production costs and prices.
05: Measure impact drivers and/or dependencies
How can impact driv-ers and/or dependen-cies be measured?
Indicators recommended in the 3Returns Framework (minimum requirements):
- Quantitative Indicators:- Natural Capital and Economic Activity Indicators: Land use area
and GHG emissions.- Social & Human Capital Indicators: Jobs and green jobs, number
of people under enhanced adaptation, and percentage of people participating in collective decision-making organizations.
- Monetary Indicators:- Economic value of productive and extractive sectors (annual
benefits and annual operational expenses).- Social and economic value of ecosystem services [social value
(e.g. hazard mitigation) and economic value (e.g. pesticide cost avoided)]
19 Adapted from “Natural Capital Protocol” by the Natural Capital Coalition (2016), and “Social & Human Capital Protocol” by the Social & Human Capital Coalition (2019).
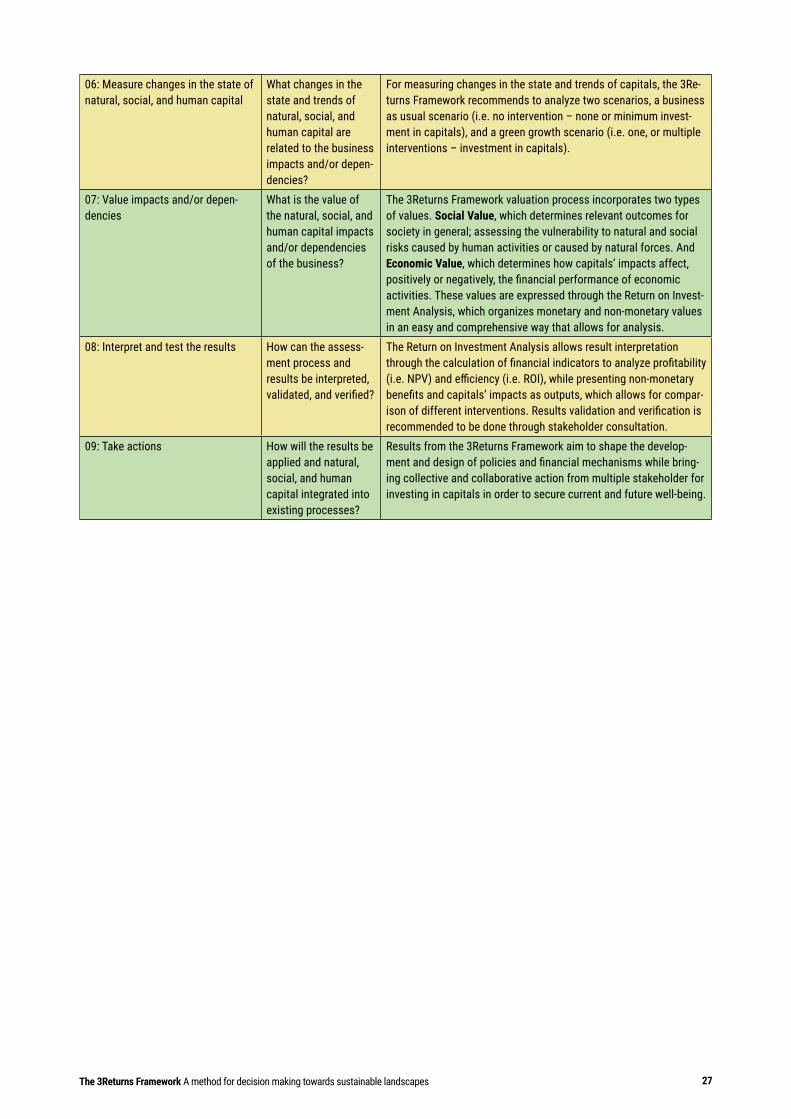
27The 3Returns Framework A method for decision making towards sustainable landscapes
06: Measure changes in the state of natural, social, and human capital
What changes in the state and trends of natural, social, and human capital are related to the business impacts and/or depen-dencies?
For measuring changes in the state and trends of capitals, the 3Re-turns Framework recommends to analyze two scenarios, a business as usual scenario (i.e. no intervention – none or minimum invest-ment in capitals), and a green growth scenario (i.e. one, or multiple interventions – investment in capitals).
07: Value impacts and/or depen-dencies
What is the value of the natural, social, and human capital impacts and/or dependencies of the business?
The 3Returns Framework valuation process incorporates two types of values. Social Value, which determines relevant outcomes for society in general; assessing the vulnerability to natural and social risks caused by human activities or caused by natural forces. And Economic Value, which determines how capitals’ impacts affect, positively or negatively, the financial performance of economic activities. These values are expressed through the Return on Invest-ment Analysis, which organizes monetary and non-monetary values in an easy and comprehensive way that allows for analysis.
08: Interpret and test the results How can the assess-ment process and results be interpreted, validated, and verified?
The Return on Investment Analysis allows result interpretation through the calculation of financial indicators to analyze profitability (i.e. NPV) and efficiency (i.e. ROI), while presenting non-monetary benefits and capitals’ impacts as outputs, which allows for compar-ison of different interventions. Results validation and verification is recommended to be done through stakeholder consultation.
09: Take actions How will the results be applied and natural, social, and human capital integrated into existing processes?
Results from the 3Returns Framework aim to shape the develop-ment and design of policies and financial mechanisms while bring-ing collective and collaborative action from multiple stakeholder for investing in capitals in order to secure current and future well-being.
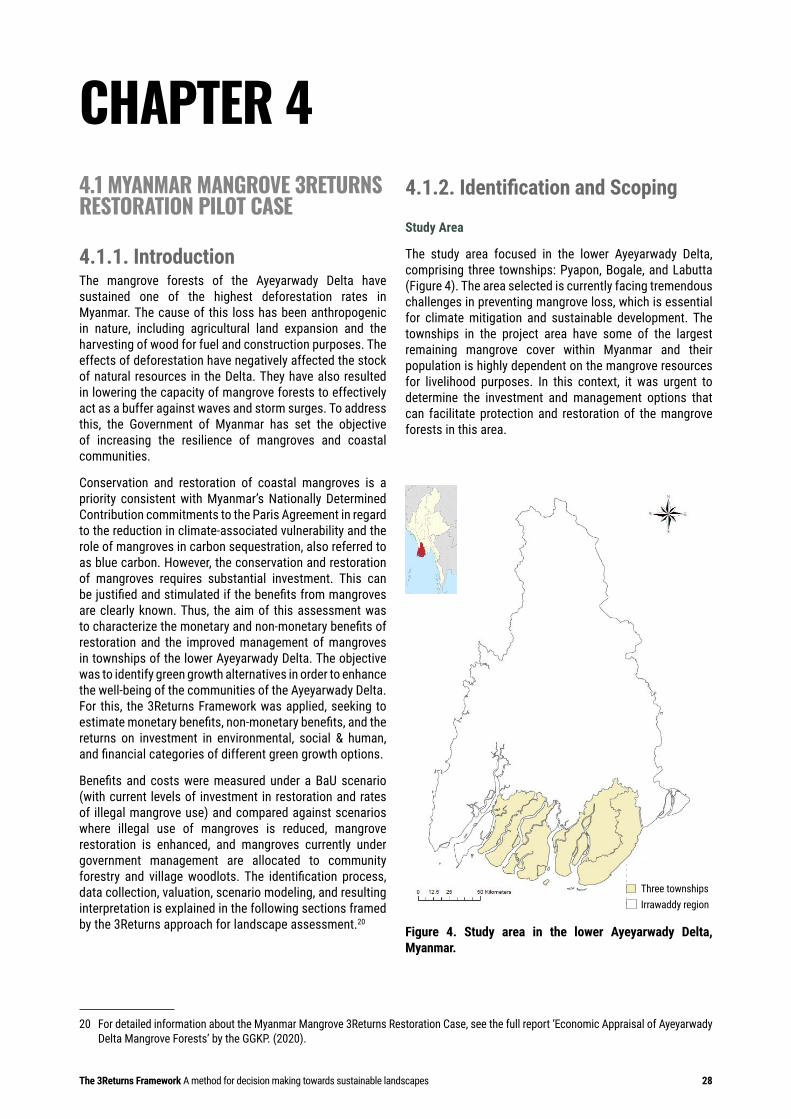
The 3Returns Framework A method for decision making towards sustainable landscapes 28
CHAPTER 4
20 For detailed information about the Myanmar Mangrove 3Returns Restoration Case, see the full report ‘Economic Appraisal of Ayeyarwady Delta Mangrove Forests’ by the GGKP. (2020).
4.1 MYANMAR MANGROVE 3RETURNS RESTORATION PILOT CASE
4.1.1. IntroductionThe mangrove forests of the Ayeyarwady Delta have sustained one of the highest deforestation rates in Myanmar. The cause of this loss has been anthropogenic in nature, including agricultural land expansion and the harvesting of wood for fuel and construction purposes. The effects of deforestation have negatively affected the stock of natural resources in the Delta. They have also resulted in lowering the capacity of mangrove forests to effectively act as a buffer against waves and storm surges. To address this, the Government of Myanmar has set the objective of increasing the resilience of mangroves and coastal communities.
Conservation and restoration of coastal mangroves is a priority consistent with Myanmar’s Nationally Determined Contribution commitments to the Paris Agreement in regard to the reduction in climate-associated vulnerability and the role of mangroves in carbon sequestration, also referred to as blue carbon. However, the conservation and restoration of mangroves requires substantial investment. This can be justified and stimulated if the benefits from mangroves are clearly known. Thus, the aim of this assessment was to characterize the monetary and non-monetary benefits of restoration and the improved management of mangroves in townships of the lower Ayeyarwady Delta. The objective was to identify green growth alternatives in order to enhance the well-being of the communities of the Ayeyarwady Delta. For this, the 3Returns Framework was applied, seeking to estimate monetary benefits, non-monetary benefits, and the returns on investment in environmental, social & human, and financial categories of different green growth options.
Benefits and costs were measured under a BaU scenario (with current levels of investment in restoration and rates of illegal mangrove use) and compared against scenarios where illegal use of mangroves is reduced, mangrove restoration is enhanced, and mangroves currently under government management are allocated to community forestry and village woodlots. The identification process, data collection, valuation, scenario modeling, and resulting interpretation is explained in the following sections framed by the 3Returns approach for landscape assessment.20
4.1.2. Identification and Scoping Study Area
The study area focused in the lower Ayeyarwady Delta, comprising three townships: Pyapon, Bogale, and Labutta (Figure 4). The area selected is currently facing tremendous challenges in preventing mangrove loss, which is essential for climate mitigation and sustainable development. The townships in the project area have some of the largest remaining mangrove cover within Myanmar and their population is highly dependent on the mangrove resources for livelihood purposes. In this context, it was urgent to determine the investment and management options that can facilitate protection and restoration of the mangrove forests in this area.
Figure 4. Study area in the lower Ayeyarwady Delta, Myanmar.
Three townshipsIrrawaddy region
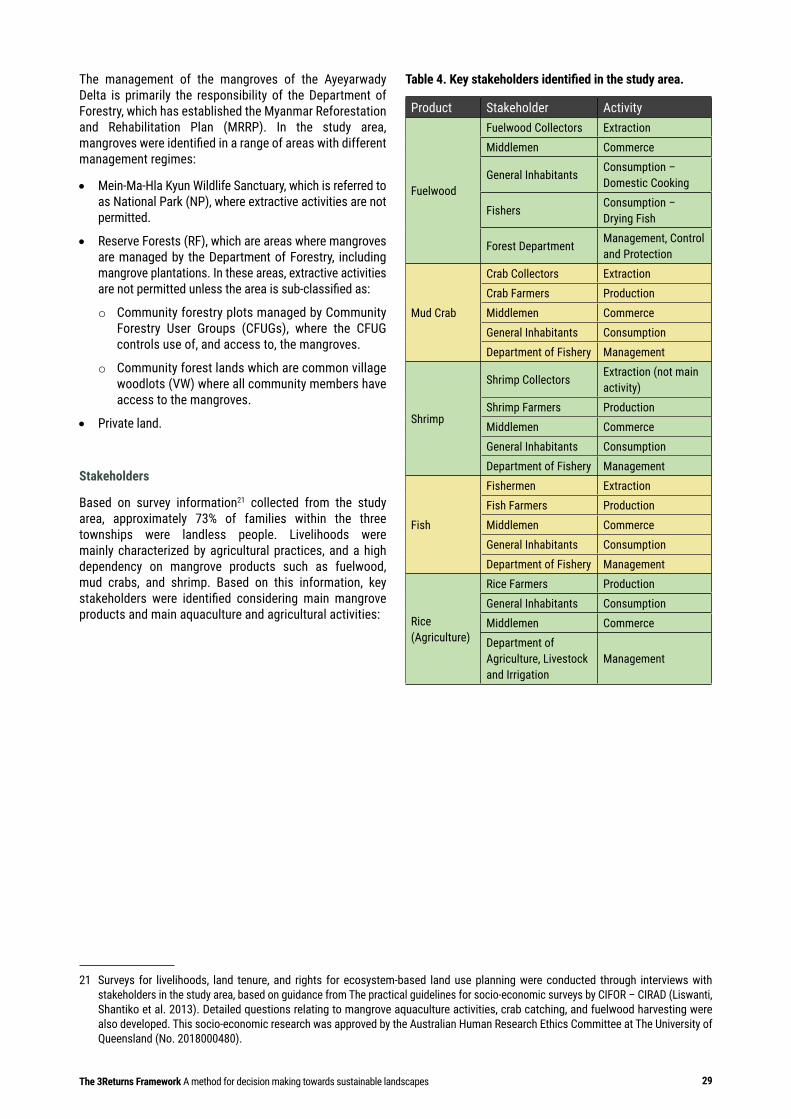
29The 3Returns Framework A method for decision making towards sustainable landscapes
The management of the mangroves of the Ayeyarwady Delta is primarily the responsibility of the Department of Forestry, which has established the Myanmar Reforestation and Rehabilitation Plan (MRRP). In the study area, mangroves were identified in a range of areas with different management regimes:
•• Mein-Ma-Hla Kyun Wildlife Sanctuary, which is referred to as National Park (NP), where extractive activities are not permitted.
•• Reserve Forests (RF), which are areas where mangroves are managed by the Department of Forestry, including mangrove plantations. In these areas, extractive activities are not permitted unless the area is sub-classified as:
o Community forestry plots managed by Community Forestry User Groups (CFUGs), where the CFUG controls use of, and access to, the mangroves.
o Community forest lands which are common village woodlots (VW) where all community members have access to the mangroves.
•• Private land.
Stakeholders
Based on survey information21 collected from the study area, approximately 73% of families within the three townships were landless people. Livelihoods were mainly characterized by agricultural practices, and a high dependency on mangrove products such as fuelwood, mud crabs, and shrimp. Based on this information, key stakeholders were identified considering main mangrove products and main aquaculture and agricultural activities:
21 Surveys for livelihoods, land tenure, and rights for ecosystem-based land use planning were conducted through interviews with stakeholders in the study area, based on guidance from The practical guidelines for socio-economic surveys by CIFOR – CIRAD (Liswanti, Shantiko et al. 2013). Detailed questions relating to mangrove aquaculture activities, crab catching, and fuelwood harvesting were also developed. This socio-economic research was approved by the Australian Human Research Ethics Committee at The University of Queensland (No. 2018000480).
Table 4. Key stakeholders identified in the study area.
Product Stakeholder Activity
Fuelwood
Fuelwood Collectors ExtractionMiddlemen Commerce
General InhabitantsConsumption – Domestic Cooking
FishersConsumption – Drying Fish
Forest Department Management, Control and Protection
Mud Crab
Crab Collectors ExtractionCrab Farmers ProductionMiddlemen CommerceGeneral Inhabitants ConsumptionDepartment of Fishery Management
Shrimp
Shrimp CollectorsExtraction (not main activity)
Shrimp Farmers ProductionMiddlemen CommerceGeneral Inhabitants ConsumptionDepartment of Fishery Management
Fish
Fishermen ExtractionFish Farmers ProductionMiddlemen CommerceGeneral Inhabitants ConsumptionDepartment of Fishery Management
Rice (Agriculture)
Rice Farmers ProductionGeneral Inhabitants ConsumptionMiddlemen CommerceDepartment of Agriculture, Livestock and Irrigation
Management
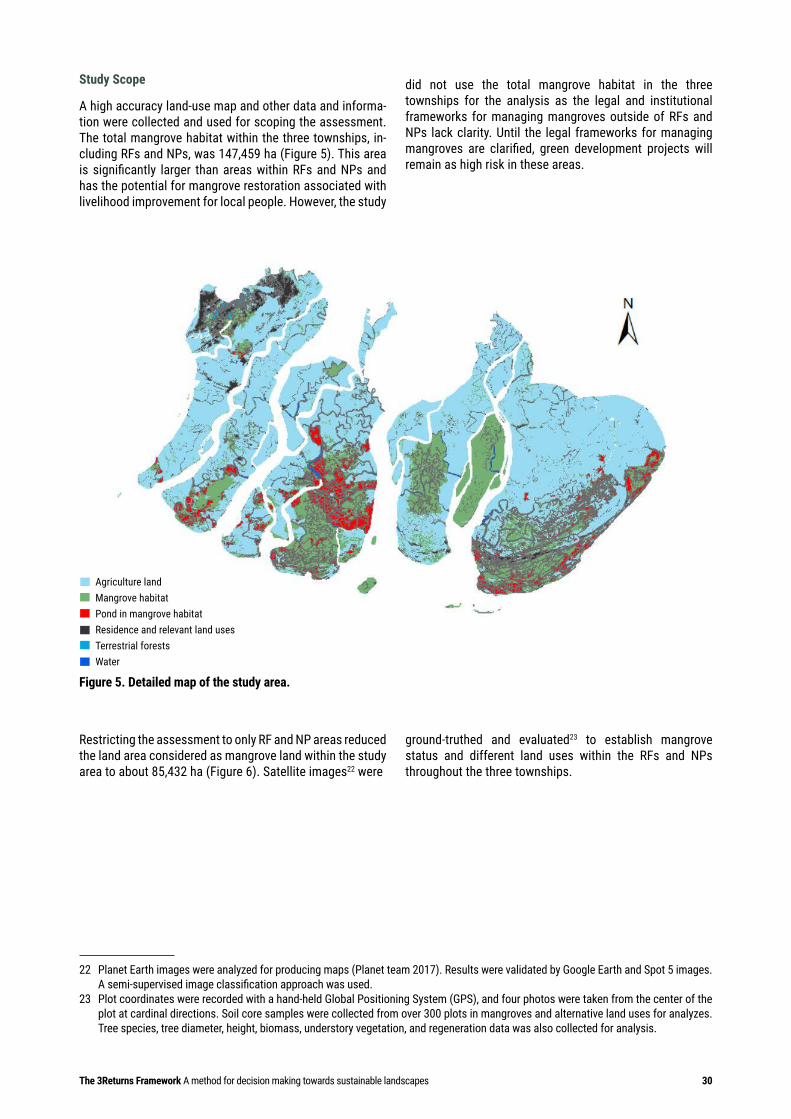
The 3Returns Framework A method for decision making towards sustainable landscapes 30
Study Scope
A high accuracy land-use map and other data and informa-tion were collected and used for scoping the assessment. The total mangrove habitat within the three townships, in-cluding RFs and NPs, was 147,459 ha (Figure 5). This area is significantly larger than areas within RFs and NPs and has the potential for mangrove restoration associated with livelihood improvement for local people. However, the study
did not use the total mangrove habitat in the three townships for the analysis as the legal and institutional frameworks for managing mangroves outside of RFs and NPs lack clarity. Until the legal frameworks for managing mangroves are clarified, green development projects will remain as high risk in these areas.
Figure 5. Detailed map of the study area.
Restricting the assessment to only RF and NP areas reduced the land area considered as mangrove land within the study area to about 85,432 ha (Figure 6). Satellite images22 were
22 Planet Earth images were analyzed for producing maps (Planet team 2017). Results were validated by Google Earth and Spot 5 images. A semi-supervised image classification approach was used.
23 Plot coordinates were recorded with a hand-held Global Positioning System (GPS), and four photos were taken from the center of the plot at cardinal directions. Soil core samples were collected from over 300 plots in mangroves and alternative land uses for analyzes. Tree species, tree diameter, height, biomass, understory vegetation, and regeneration data was also collected for analysis.
ground-truthed and evaluated23 to establish mangrove status and different land uses within the RFs and NPs throughout the three townships.
Agriculture landMangrove habitatPond in mangrove habitatResidence and relevant land usesTerrestrial forestsWater
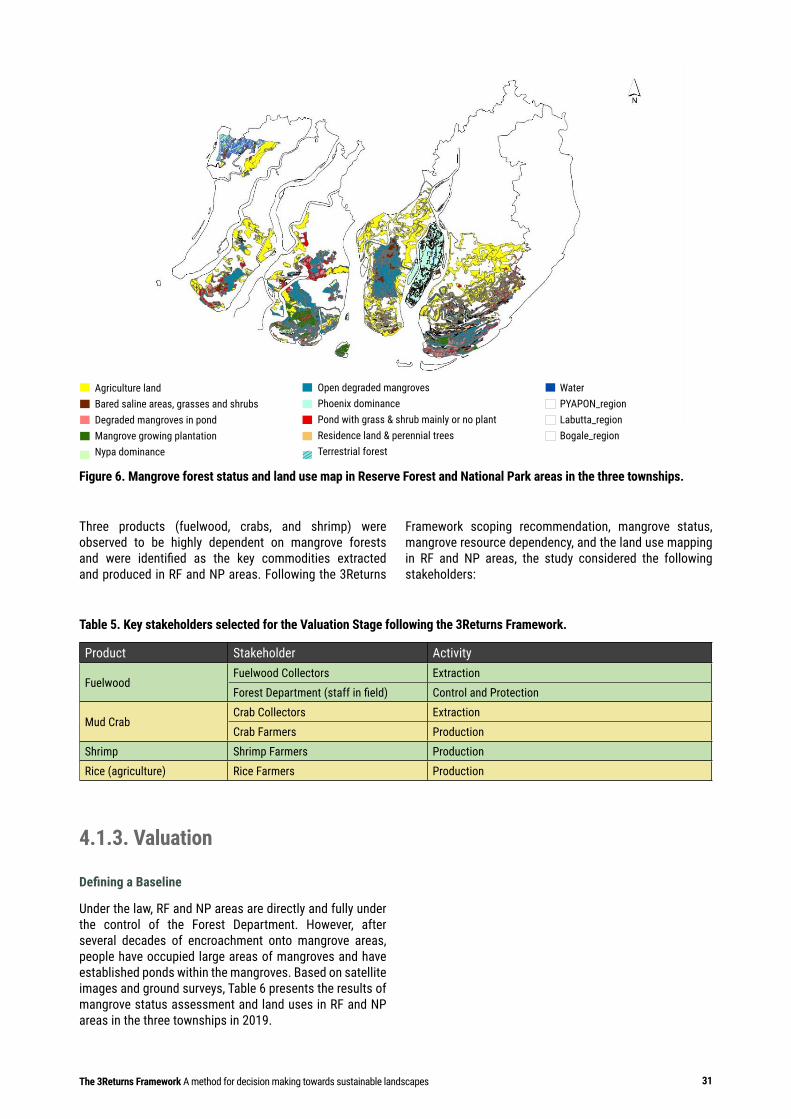
31The 3Returns Framework A method for decision making towards sustainable landscapes
Figure 6. Mangrove forest status and land use map in Reserve Forest and National Park areas in the three townships.
Three products (fuelwood, crabs, and shrimp) were observed to be highly dependent on mangrove forests and were identified as the key commodities extracted and produced in RF and NP areas. Following the 3Returns
Framework scoping recommendation, mangrove status, mangrove resource dependency, and the land use mapping in RF and NP areas, the study considered the following stakeholders:
Table 5. Key stakeholders selected for the Valuation Stage following the 3Returns Framework.
Product Stakeholder Activity
FuelwoodFuelwood Collectors ExtractionForest Department (staff in field) Control and Protection
Mud CrabCrab Collectors ExtractionCrab Farmers Production
Shrimp Shrimp Farmers ProductionRice (agriculture) Rice Farmers Production
4.1.3. Valuation Defining a Baseline
Under the law, RF and NP areas are directly and fully under the control of the Forest Department. However, after several decades of encroachment onto mangrove areas, people have occupied large areas of mangroves and have established ponds within the mangroves. Based on satellite images and ground surveys, Table 6 presents the results of mangrove status assessment and land uses in RF and NP areas in the three townships in 2019.
Open degraded mangrovesPhoenix dominancePond with grass & shrub mainly or no plantResidence land & perennial treesTerrestrial forest
WaterPYAPON_regionLabutta_regionBogale_region
Agriculture landBared saline areas, grasses and shrubsDegraded mangroves in pondMangrove growing plantationNypa dominance
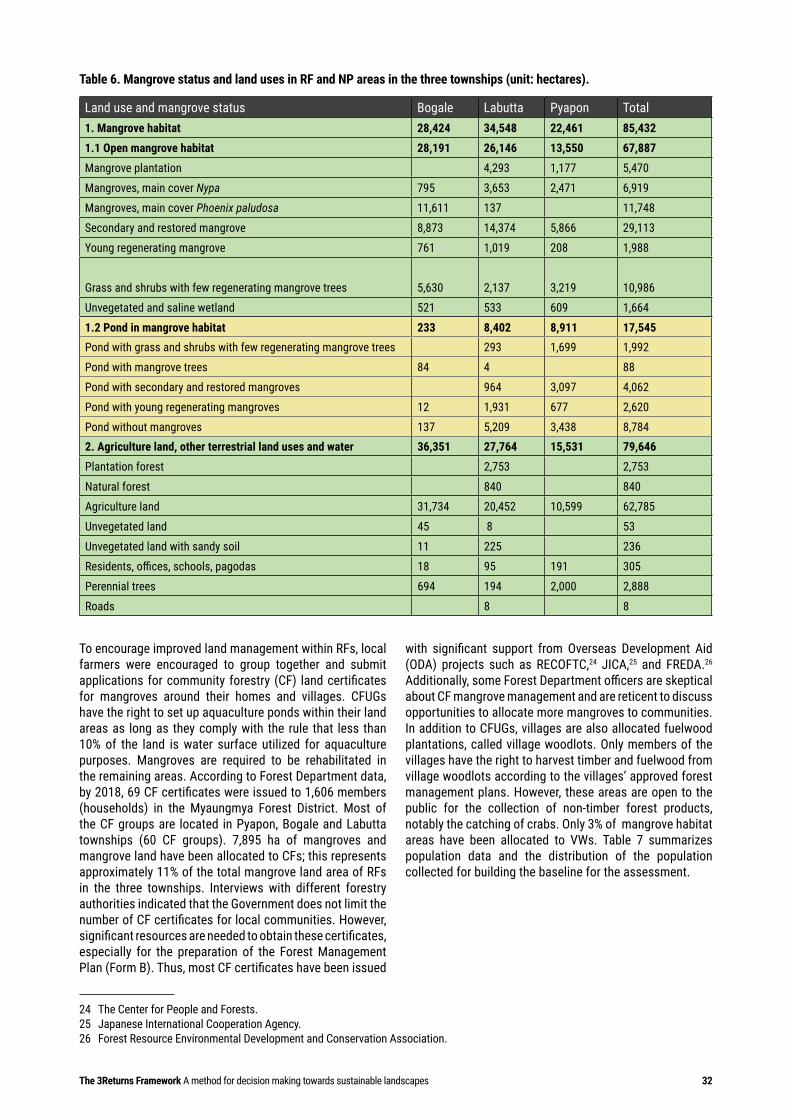
The 3Returns Framework A method for decision making towards sustainable landscapes 32
Table 6. Mangrove status and land uses in RF and NP areas in the three townships (unit: hectares).
Land use and mangrove status Bogale Labutta Pyapon Total1. Mangrove habitat 28,424 34,548 22,461 85,432
1.1 Open mangrove habitat 28,191 26,146 13,550 67,887
Mangrove plantation 4,293 1,177 5,470
Mangroves, main cover Nypa 795 3,653 2,471 6,919
Mangroves, main cover Phoenix paludosa 11,611 137 11,748
Secondary and restored mangrove 8,873 14,374 5,866 29,113
Young regenerating mangrove 761 1,019 208 1,988
Grass and shrubs with few regenerating mangrove trees 5,630 2,137 3,219 10,986
Unvegetated and saline wetland 521 533 609 1,664
1.2 Pond in mangrove habitat 233 8,402 8,911 17,545Pond with grass and shrubs with few regenerating mangrove trees 293 1,699 1,992
Pond with mangrove trees 84 4 88
Pond with secondary and restored mangroves 964 3,097 4,062
Pond with young regenerating mangroves 12 1,931 677 2,620
Pond without mangroves 137 5,209 3,438 8,7842. Agriculture land, other terrestrial land uses and water 36,351 27,764 15,531 79,646
Plantation forest 2,753 2,753
Natural forest 840 840
Agriculture land 31,734 20,452 10,599 62,785
Unvegetated land 45 8 53
Unvegetated land with sandy soil 11 225 236
Residents, offices, schools, pagodas 18 95 191 305
Perennial trees 694 194 2,000 2,888
Roads 8 8
To encourage improved land management within RFs, local farmers were encouraged to group together and submit applications for community forestry (CF) land certificates for mangroves around their homes and villages. CFUGs have the right to set up aquaculture ponds within their land areas as long as they comply with the rule that less than 10% of the land is water surface utilized for aquaculture purposes. Mangroves are required to be rehabilitated in the remaining areas. According to Forest Department data, by 2018, 69 CF certificates were issued to 1,606 members (households) in the Myaungmya Forest District. Most of the CF groups are located in Pyapon, Bogale and Labutta townships (60 CF groups). 7,895 ha of mangroves and mangrove land have been allocated to CFs; this represents approximately 11% of the total mangrove land area of RFs in the three townships. Interviews with different forestry authorities indicated that the Government does not limit the number of CF certificates for local communities. However, significant resources are needed to obtain these certificates, especially for the preparation of the Forest Management Plan (Form B). Thus, most CF certificates have been issued
24 The Center for People and Forests.25 Japanese International Cooperation Agency.26 Forest Resource Environmental Development and Conservation Association.
with significant support from Overseas Development Aid (ODA) projects such as RECOFTC,24 JICA,25 and FREDA.26 Additionally, some Forest Department officers are skeptical about CF mangrove management and are reticent to discuss opportunities to allocate more mangroves to communities. In addition to CFUGs, villages are also allocated fuelwood plantations, called village woodlots. Only members of the villages have the right to harvest timber and fuelwood from village woodlots according to the villages’ approved forest management plans. However, these areas are open to the public for the collection of non-timber forest products, notably the catching of crabs. Only 3% of mangrove habitat areas have been allocated to VWs. Table 7 summarizes population data and the distribution of the population collected for building the baseline for the assessment.
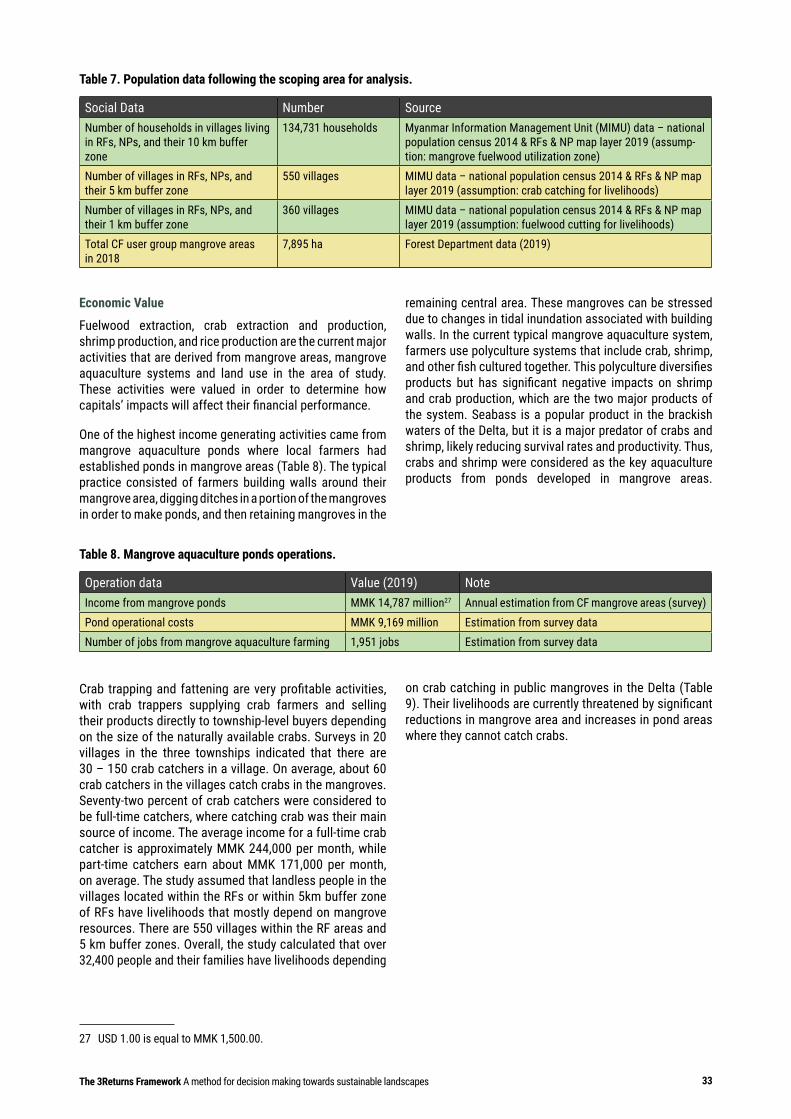
33The 3Returns Framework A method for decision making towards sustainable landscapes
Table 7. Population data following the scoping area for analysis.
Social Data Number SourceNumber of households in villages living in RFs, NPs, and their 10 km buffer zone
134,731 households Myanmar Information Management Unit (MIMU) data – national population census 2014 & RFs & NP map layer 2019 (assump-tion: mangrove fuelwood utilization zone)
Number of villages in RFs, NPs, and their 5 km buffer zone
550 villages MIMU data – national population census 2014 & RFs & NP map layer 2019 (assumption: crab catching for livelihoods)
Number of villages in RFs, NPs, and their 1 km buffer zone
360 villages MIMU data – national population census 2014 & RFs & NP map layer 2019 (assumption: fuelwood cutting for livelihoods)
Total CF user group mangrove areas in 2018
7,895 ha Forest Department data (2019)
Economic Value
Fuelwood extraction, crab extraction and production, shrimp production, and rice production are the current major activities that are derived from mangrove areas, mangrove aquaculture systems and land use in the area of study. These activities were valued in order to determine how capitals’ impacts will affect their financial performance.
One of the highest income generating activities came from mangrove aquaculture ponds where local farmers had established ponds in mangrove areas (Table 8). The typical practice consisted of farmers building walls around their mangrove area, digging ditches in a portion of the mangroves in order to make ponds, and then retaining mangroves in the
remaining central area. These mangroves can be stressed due to changes in tidal inundation associated with building walls. In the current typical mangrove aquaculture system, farmers use polyculture systems that include crab, shrimp, and other fish cultured together. This polyculture diversifies products but has significant negative impacts on shrimp and crab production, which are the two major products of the system. Seabass is a popular product in the brackish waters of the Delta, but it is a major predator of crabs and shrimp, likely reducing survival rates and productivity. Thus, crabs and shrimp were considered as the key aquaculture products from ponds developed in mangrove areas.
Table 8. Mangrove aquaculture ponds operations.
Operation data Value (2019) NoteIncome from mangrove ponds MMK 14,787 million27 Annual estimation from CF mangrove areas (survey)Pond operational costs MMK 9,169 million Estimation from survey dataNumber of jobs from mangrove aquaculture farming 1,951 jobs Estimation from survey data
Crab trapping and fattening are very profitable activities, with crab trappers supplying crab farmers and selling their products directly to township-level buyers depending on the size of the naturally available crabs. Surveys in 20 villages in the three townships indicated that there are 30 – 150 crab catchers in a village. On average, about 60 crab catchers in the villages catch crabs in the mangroves. Seventy-two percent of crab catchers were considered to be full-time catchers, where catching crab was their main source of income. The average income for a full-time crab catcher is approximately MMK 244,000 per month, while part-time catchers earn about MMK 171,000 per month, on average. The study assumed that landless people in the villages located within the RFs or within 5km buffer zone of RFs have livelihoods that mostly depend on mangrove resources. There are 550 villages within the RF areas and 5 km buffer zones. Overall, the study calculated that over 32,400 people and their families have livelihoods depending
27 USD 1.00 is equal to MMK 1,500.00.
on crab catching in public mangroves in the Delta (Table 9). Their livelihoods are currently threatened by significant reductions in mangrove area and increases in pond areas where they cannot catch crabs.
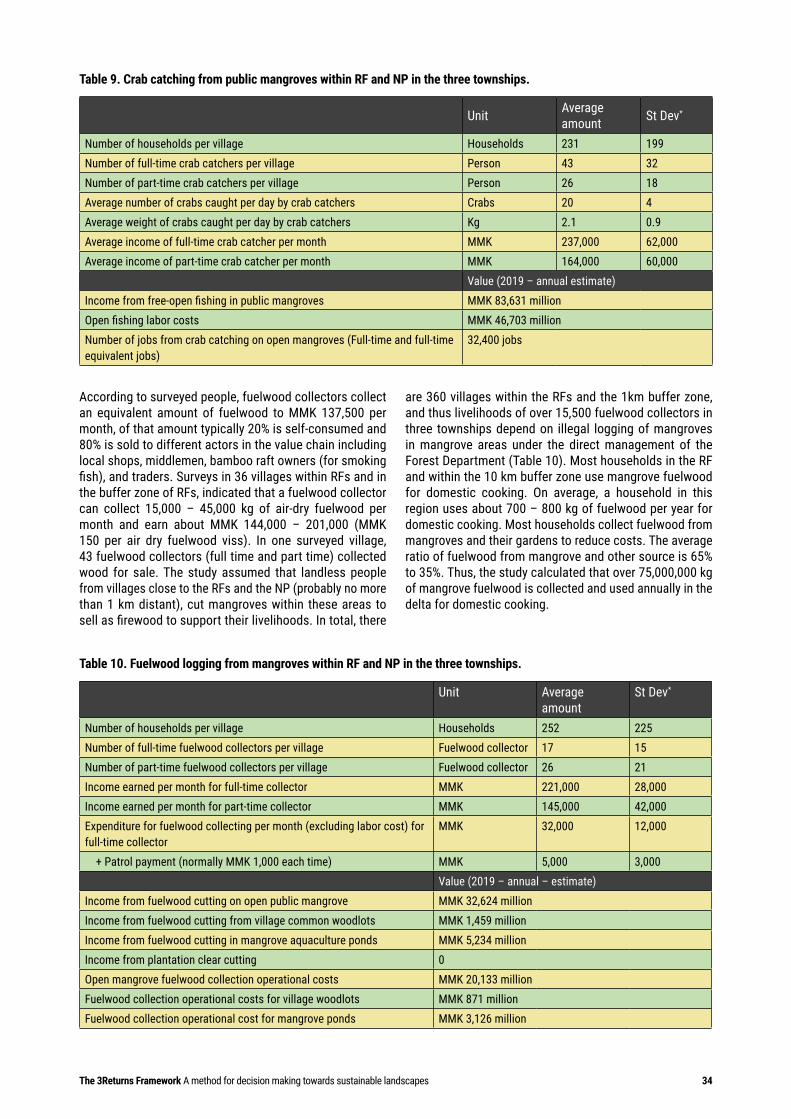
The 3Returns Framework A method for decision making towards sustainable landscapes 34
Table 9. Crab catching from public mangroves within RF and NP in the three townships.
Unit Average amount St Dev*
Number of households per village Households 231 199Number of full-time crab catchers per village Person 43 32Number of part-time crab catchers per village Person 26 18Average number of crabs caught per day by crab catchers Crabs 20 4Average weight of crabs caught per day by crab catchers Kg 2.1 0.9Average income of full-time crab catcher per month MMK 237,000 62,000Average income of part-time crab catcher per month MMK 164,000 60,000
Value (2019 – annual estimate)Income from free-open fishing in public mangroves MMK 83,631 millionOpen fishing labor costs MMK 46,703 millionNumber of jobs from crab catching on open mangroves (Full-time and full-time equivalent jobs)
32,400 jobs
According to surveyed people, fuelwood collectors collect an equivalent amount of fuelwood to MMK 137,500 per month, of that amount typically 20% is self-consumed and 80% is sold to different actors in the value chain including local shops, middlemen, bamboo raft owners (for smoking fish), and traders. Surveys in 36 villages within RFs and in the buffer zone of RFs, indicated that a fuelwood collector can collect 15,000 – 45,000 kg of air-dry fuelwood per month and earn about MMK 144,000 – 201,000 (MMK 150 per air dry fuelwood viss). In one surveyed village, 43 fuelwood collectors (full time and part time) collected wood for sale. The study assumed that landless people from villages close to the RFs and the NP (probably no more than 1 km distant), cut mangroves within these areas to sell as firewood to support their livelihoods. In total, there
are 360 villages within the RFs and the 1km buffer zone, and thus livelihoods of over 15,500 fuelwood collectors in three townships depend on illegal logging of mangroves in mangrove areas under the direct management of the Forest Department (Table 10). Most households in the RF and within the 10 km buffer zone use mangrove fuelwood for domestic cooking. On average, a household in this region uses about 700 – 800 kg of fuelwood per year for domestic cooking. Most households collect fuelwood from mangroves and their gardens to reduce costs. The average ratio of fuelwood from mangrove and other source is 65% to 35%. Thus, the study calculated that over 75,000,000 kg of mangrove fuelwood is collected and used annually in the delta for domestic cooking.
Table 10. Fuelwood logging from mangroves within RF and NP in the three townships.
Unit Average amount
St Dev*
Number of households per village Households 252 225Number of full-time fuelwood collectors per village Fuelwood collector 17 15Number of part-time fuelwood collectors per village Fuelwood collector 26 21Income earned per month for full-time collector MMK 221,000 28,000Income earned per month for part-time collector MMK 145,000 42,000Expenditure for fuelwood collecting per month (excluding labor cost) for full-time collector
MMK 32,000 12,000
+ Patrol payment (normally MMK 1,000 each time) MMK 5,000 3,000Value (2019 – annual – estimate)
Income from fuelwood cutting on open public mangrove MMK 32,624 millionIncome from fuelwood cutting from village common woodlots MMK 1,459 millionIncome from fuelwood cutting in mangrove aquaculture ponds MMK 5,234 millionIncome from plantation clear cutting 0 Open mangrove fuelwood collection operational costs MMK 20,133 millionFuelwood collection operational costs for village woodlots MMK 871 millionFuelwood collection operational cost for mangrove ponds MMK 3,126 million
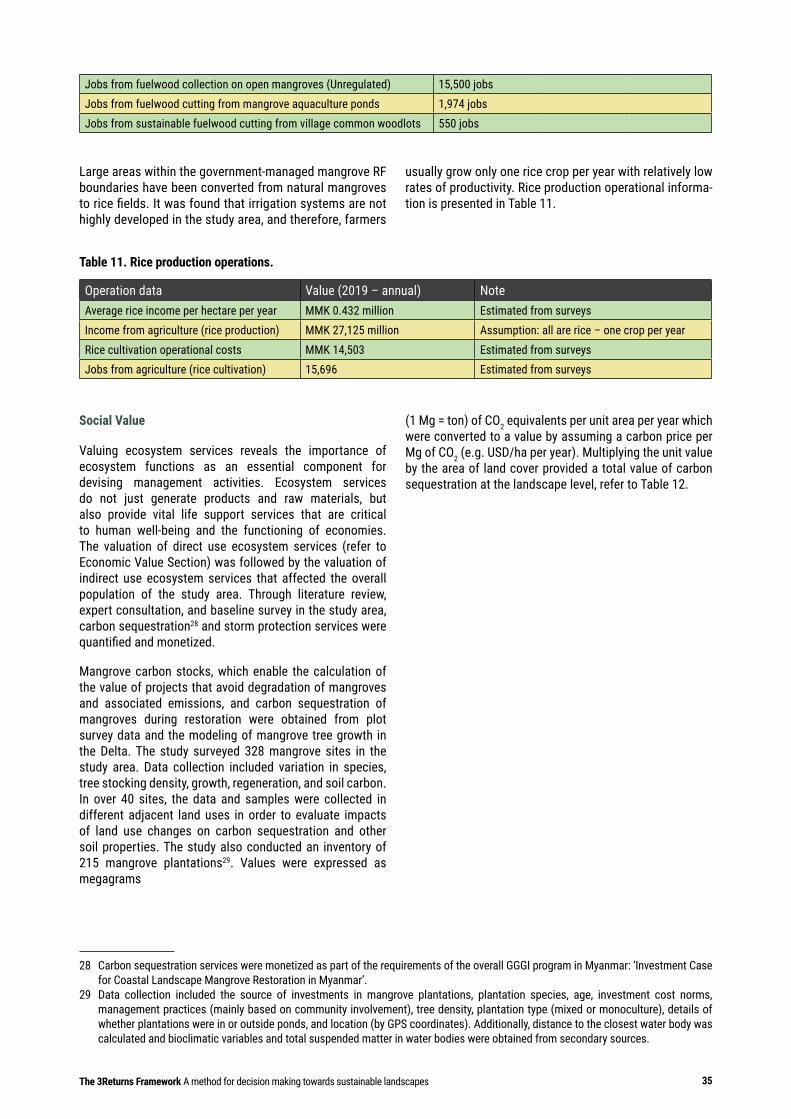
35The 3Returns Framework A method for decision making towards sustainable landscapes
Jobs from fuelwood collection on open mangroves (Unregulated) 15,500 jobsJobs from fuelwood cutting from mangrove aquaculture ponds 1,974 jobsJobs from sustainable fuelwood cutting from village common woodlots 550 jobs
Large areas within the government-managed mangrove RF boundaries have been converted from natural mangroves to rice fields. It was found that irrigation systems are not highly developed in the study area, and therefore, farmers
usually grow only one rice crop per year with relatively low rates of productivity. Rice production operational informa-tion is presented in Table 11.
Table 11. Rice production operations.
Operation data Value (2019 – annual) NoteAverage rice income per hectare per year MMK 0.432 million Estimated from surveysIncome from agriculture (rice production) MMK 27,125 million Assumption: all are rice – one crop per yearRice cultivation operational costs MMK 14,503 Estimated from surveysJobs from agriculture (rice cultivation) 15,696 Estimated from surveys
Social Value
Valuing ecosystem services reveals the importance of ecosystem functions as an essential component for devising management activities. Ecosystem services do not just generate products and raw materials, but also provide vital life support services that are critical to human well-being and the functioning of economies. The valuation of direct use ecosystem services (refer to Economic Value Section) was followed by the valuation of indirect use ecosystem services that affected the overall population of the study area. Through literature review, expert consultation, and baseline survey in the study area, carbon sequestration28 and storm protection services were quantified and monetized.
Mangrove carbon stocks, which enable the calculation of the value of projects that avoid degradation of mangroves and associated emissions, and carbon sequestration of mangroves during restoration were obtained from plot survey data and the modeling of mangrove tree growth in the Delta. The study surveyed 328 mangrove sites in the study area. Data collection included variation in species, tree stocking density, growth, regeneration, and soil carbon. In over 40 sites, the data and samples were collected in different adjacent land uses in order to evaluate impacts of land use changes on carbon sequestration and other soil properties. The study also conducted an inventory of 215 mangrove plantations29. Values were expressed as megagrams
28 Carbon sequestration services were monetized as part of the requirements of the overall GGGI program in Myanmar: ‘Investment Case for Coastal Landscape Mangrove Restoration in Myanmar’.
29 Data collection included the source of investments in mangrove plantations, plantation species, age, investment cost norms, management practices (mainly based on community involvement), tree density, plantation type (mixed or monoculture), details of whether plantations were in or outside ponds, and location (by GPS coordinates). Additionally, distance to the closest water body was calculated and bioclimatic variables and total suspended matter in water bodies were obtained from secondary sources.
(1 Mg = ton) of CO2 equivalents per unit area per year which were converted to a value by assuming a carbon price per Mg of CO2 (e.g. USD/ha per year). Multiplying the unit value by the area of land cover provided a total value of carbon sequestration at the landscape level, refer to Table 12.
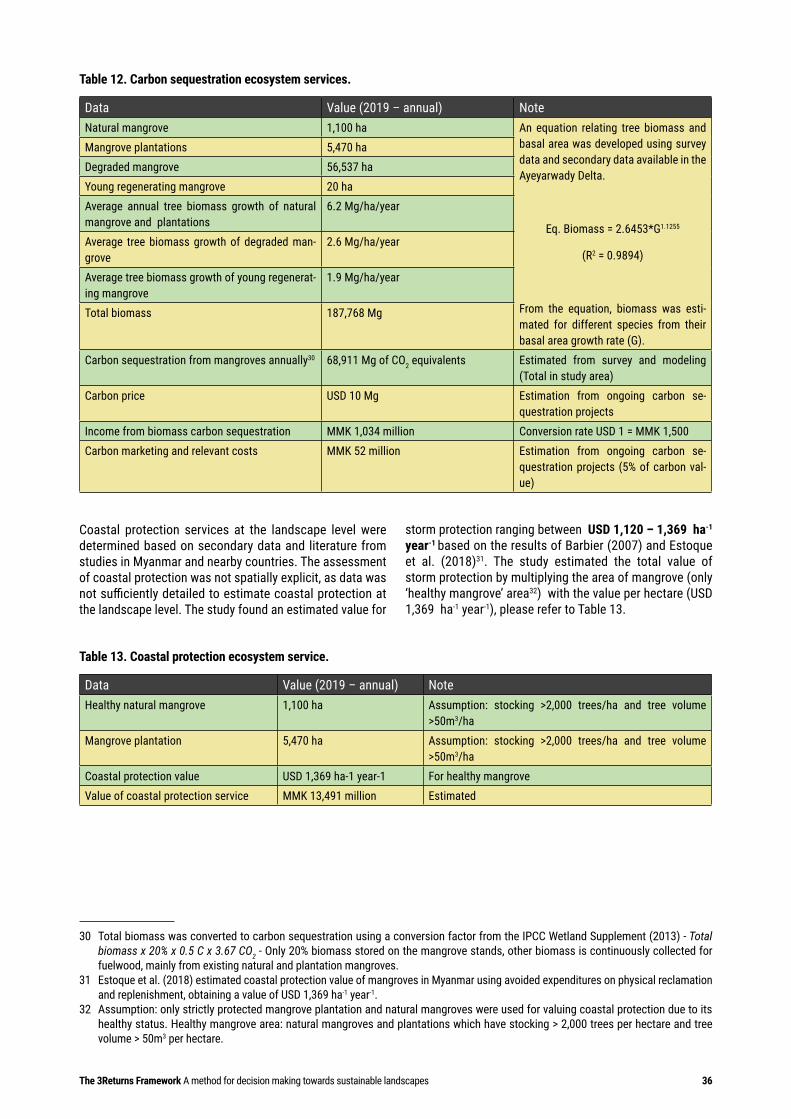
The 3Returns Framework A method for decision making towards sustainable landscapes 36
Table 12. Carbon sequestration ecosystem services.
Data Value (2019 – annual) NoteNatural mangrove 1,100 ha An equation relating tree biomass and
basal area was developed using survey data and secondary data available in the Ayeyarwady Delta.
Eq. Biomass = 2.6453*G1.1255
(R2 = 0.9894)
From the equation, biomass was esti-mated for different species from their basal area growth rate (G).
Mangrove plantations 5,470 haDegraded mangrove 56,537 haYoung regenerating mangrove 20 haAverage annual tree biomass growth of natural mangrove and plantations
6.2 Mg/ha/year
Average tree biomass growth of degraded man-grove
2.6 Mg/ha/year
Average tree biomass growth of young regenerat-ing mangrove
1.9 Mg/ha/year
Total biomass 187,768 Mg
Carbon sequestration from mangroves annually30 68,911 Mg of CO2 equivalents Estimated from survey and modeling (Total in study area)
Carbon price USD 10 Mg Estimation from ongoing carbon se-questration projects
Income from biomass carbon sequestration MMK 1,034 million Conversion rate USD 1 = MMK 1,500Carbon marketing and relevant costs MMK 52 million Estimation from ongoing carbon se-
questration projects (5% of carbon val-ue)
Coastal protection services at the landscape level were determined based on secondary data and literature from studies in Myanmar and nearby countries. The assessment of coastal protection was not spatially explicit, as data was not sufficiently detailed to estimate coastal protection at the landscape level. The study found an estimated value for
Table 13. Coastal protection ecosystem service.
Data Value (2019 – annual) NoteHealthy natural mangrove 1,100 ha Assumption: stocking >2,000 trees/ha and tree volume
>50m3/haMangrove plantation 5,470 ha Assumption: stocking >2,000 trees/ha and tree volume
>50m3/haCoastal protection value USD 1,369 ha-1 year-1 For healthy mangroveValue of coastal protection service MMK 13,491 million Estimated
30 Total biomass was converted to carbon sequestration using a conversion factor from the IPCC Wetland Supplement (2013) - Total biomass x 20% x 0.5 C x 3.67 CO2 - Only 20% biomass stored on the mangrove stands, other biomass is continuously collected for fuelwood, mainly from existing natural and plantation mangroves.
31 Estoque et al. (2018) estimated coastal protection value of mangroves in Myanmar using avoided expenditures on physical reclamation and replenishment, obtaining a value of USD 1,369 ha-1 year-1.
32 Assumption: only strictly protected mangrove plantation and natural mangroves were used for valuing coastal protection due to its healthy status. Healthy mangrove area: natural mangroves and plantations which have stocking > 2,000 trees per hectare and tree volume > 50m3 per hectare.
storm protection ranging between USD 1,120 – 1,369 ha-1 year-1 based on the results of Barbier (2007) and Estoque et al. (2018)31. The study estimated the total value of storm protection by multiplying the area of mangrove (only ‘healthy mangrove’ area32) with the value per hectare (USD 1,369 ha-1 year-1), please refer to Table 13.
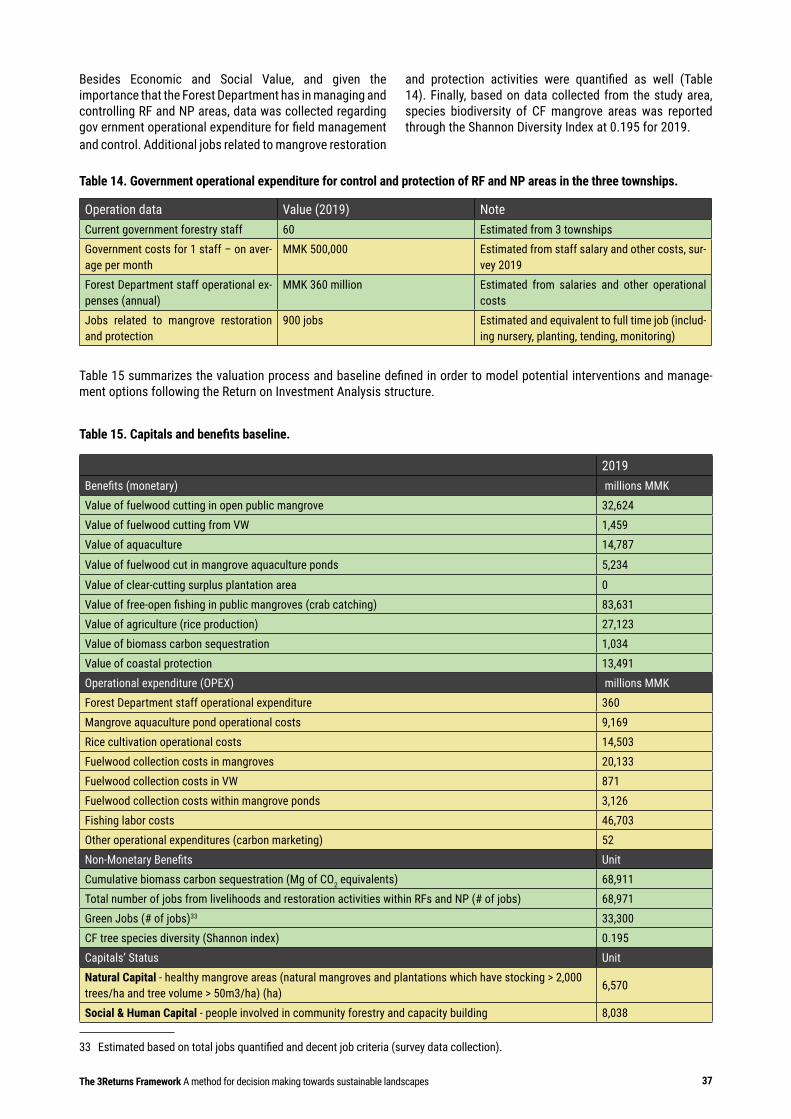
37The 3Returns Framework A method for decision making towards sustainable landscapes
Besides Economic and Social Value, and given the importance that the Forest Department has in managing and controlling RF and NP areas, data was collected regarding gov ernment operational expenditure for field management and control. Additional jobs related to mangrove restoration
and protection activities were quantified as well (Table 14). Finally, based on data collected from the study area, species biodiversity of CF mangrove areas was reported through the Shannon Diversity Index at 0.195 for 2019.
Table 14. Government operational expenditure for control and protection of RF and NP areas in the three townships.
Operation data Value (2019) NoteCurrent government forestry staff 60 Estimated from 3 townshipsGovernment costs for 1 staff – on aver-age per month
MMK 500,000 Estimated from staff salary and other costs, sur-vey 2019
Forest Department staff operational ex-penses (annual)
MMK 360 million Estimated from salaries and other operational costs
Jobs related to mangrove restoration and protection
900 jobs Estimated and equivalent to full time job (includ-ing nursery, planting, tending, monitoring)
Table 15 summarizes the valuation process and baseline defined in order to model potential interventions and manage-ment options following the Return on Investment Analysis structure.
Table 15. Capitals and benefits baseline.
2019Benefits (monetary) millions MMKValue of fuelwood cutting in open public mangrove 32,624Value of fuelwood cutting from VW 1,459Value of aquaculture 14,787
Value of fuelwood cut in mangrove aquaculture ponds 5,234
Value of clear-cutting surplus plantation area 0Value of free-open fishing in public mangroves (crab catching) 83,631Value of agriculture (rice production) 27,123Value of biomass carbon sequestration 1,034Value of coastal protection 13,491Operational expenditure (OPEX) millions MMKForest Department staff operational expenditure 360Mangrove aquaculture pond operational costs 9,169Rice cultivation operational costs 14,503Fuelwood collection costs in mangroves 20,133Fuelwood collection costs in VW 871Fuelwood collection costs within mangrove ponds 3,126Fishing labor costs 46,703Other operational expenditures (carbon marketing) 52Non-Monetary Benefits UnitCumulative biomass carbon sequestration (Mg of CO2 equivalents) 68,911Total number of jobs from livelihoods and restoration activities within RFs and NP (# of jobs) 68,971Green Jobs (# of jobs)33 33,300CF tree species diversity (Shannon index) 0.195Capitals’ Status UnitNatural Capital - healthy mangrove areas (natural mangroves and plantations which have stocking > 2,000 trees/ha and tree volume > 50m3/ha) (ha)
6,570
Social & Human Capital - people involved in community forestry and capacity building 8,038
33 Estimated based on total jobs quantified and decent job criteria (survey data collection).
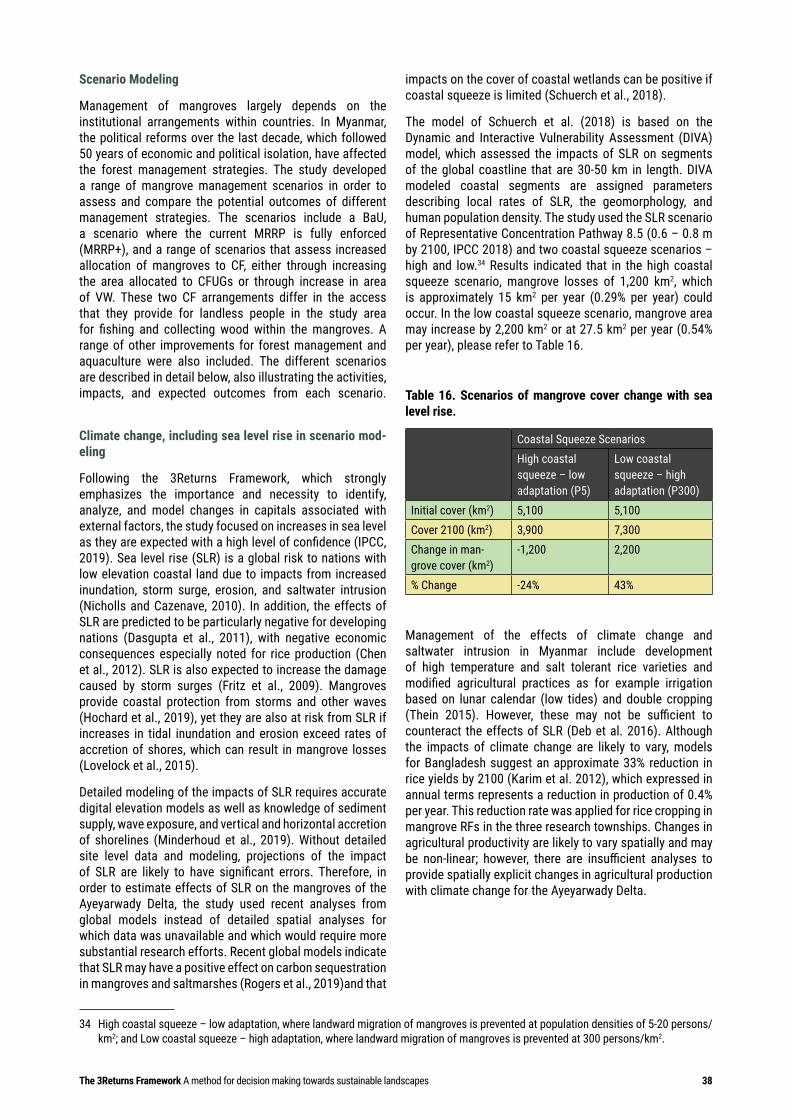
The 3Returns Framework A method for decision making towards sustainable landscapes 38
Scenario Modeling
Management of mangroves largely depends on the institutional arrangements within countries. In Myanmar, the political reforms over the last decade, which followed 50 years of economic and political isolation, have affected the forest management strategies. The study developed a range of mangrove management scenarios in order to assess and compare the potential outcomes of different management strategies. The scenarios include a BaU, a scenario where the current MRRP is fully enforced (MRRP+), and a range of scenarios that assess increased allocation of mangroves to CF, either through increasing the area allocated to CFUGs or through increase in area of VW. These two CF arrangements differ in the access that they provide for landless people in the study area for fishing and collecting wood within the mangroves. A range of other improvements for forest management and aquaculture were also included. The different scenarios are described in detail below, also illustrating the activities, impacts, and expected outcomes from each scenario.
Climate change, including sea level rise in scenario mod-eling
Following the 3Returns Framework, which strongly emphasizes the importance and necessity to identify, analyze, and model changes in capitals associated with external factors, the study focused on increases in sea level as they are expected with a high level of confidence (IPCC, 2019). Sea level rise (SLR) is a global risk to nations with low elevation coastal land due to impacts from increased inundation, storm surge, erosion, and saltwater intrusion (Nicholls and Cazenave, 2010). In addition, the effects of SLR are predicted to be particularly negative for developing nations (Dasgupta et al., 2011), with negative economic consequences especially noted for rice production (Chen et al., 2012). SLR is also expected to increase the damage caused by storm surges (Fritz et al., 2009). Mangroves provide coastal protection from storms and other waves (Hochard et al., 2019), yet they are also at risk from SLR if increases in tidal inundation and erosion exceed rates of accretion of shores, which can result in mangrove losses (Lovelock et al., 2015).
Detailed modeling of the impacts of SLR requires accurate digital elevation models as well as knowledge of sediment supply, wave exposure, and vertical and horizontal accretion of shorelines (Minderhoud et al., 2019). Without detailed site level data and modeling, projections of the impact of SLR are likely to have significant errors. Therefore, in order to estimate effects of SLR on the mangroves of the Ayeyarwady Delta, the study used recent analyses from global models instead of detailed spatial analyses for which data was unavailable and which would require more substantial research efforts. Recent global models indicate that SLR may have a positive effect on carbon sequestration in mangroves and saltmarshes (Rogers et al., 2019)and that
34 High coastal squeeze – low adaptation, where landward migration of mangroves is prevented at population densities of 5-20 persons/km2; and Low coastal squeeze – high adaptation, where landward migration of mangroves is prevented at 300 persons/km2.
impacts on the cover of coastal wetlands can be positive if coastal squeeze is limited (Schuerch et al., 2018).
The model of Schuerch et al. (2018) is based on the Dynamic and Interactive Vulnerability Assessment (DIVA) model, which assessed the impacts of SLR on segments of the global coastline that are 30-50 km in length. DIVA modeled coastal segments are assigned parameters describing local rates of SLR, the geomorphology, and human population density. The study used the SLR scenario of Representative Concentration Pathway 8.5 (0.6 – 0.8 m by 2100, IPCC 2018) and two coastal squeeze scenarios – high and low.34 Results indicated that in the high coastal squeeze scenario, mangrove losses of 1,200 km2, which is approximately 15 km2 per year (0.29% per year) could occur. In the low coastal squeeze scenario, mangrove area may increase by 2,200 km2 or at 27.5 km2 per year (0.54% per year), please refer to Table 16.
Table 16. Scenarios of mangrove cover change with sea level rise.
Coastal Squeeze ScenariosHigh coastal squeeze – low adaptation (P5)
Low coastal squeeze – high adaptation (P300)
Initial cover (km2) 5,100 5,100Cover 2100 (km2) 3,900 7,300Change in man-grove cover (km2)
-1,200 2,200
% Change -24% 43%
Management of the effects of climate change and saltwater intrusion in Myanmar include development of high temperature and salt tolerant rice varieties and modified agricultural practices as for example irrigation based on lunar calendar (low tides) and double cropping (Thein 2015). However, these may not be sufficient to counteract the effects of SLR (Deb et al. 2016). Although the impacts of climate change are likely to vary, models for Bangladesh suggest an approximate 33% reduction in rice yields by 2100 (Karim et al. 2012), which expressed in annual terms represents a reduction in production of 0.4% per year. This reduction rate was applied for rice cropping in mangrove RFs in the three research townships. Changes in agricultural productivity are likely to vary spatially and may be non-linear; however, there are insufficient analyses to provide spatially explicit changes in agricultural production with climate change for the Ayeyarwady Delta.

39The 3Returns Framework A method for decision making towards sustainable landscapes
The Business as Usual Scenario
i) All rice fields and aquaculture ponds converted from mangroves remain in the present converted condition;
ii) 11% of mangroves are allocated to communities (based on CF certificates) and are managed by the local through CFUGs for timber, non-timber forest products, and aquaculture; 3% of mangroves allocated to villages as VW by 2019;35
iii) Approved forest management plan for CFUGs allows thinning every 3 - 5 years;
35 The current annual rate of increase in areas of CFUGs and VWs were used as estimates of the annual increase in CFs over time.
iv) Law enforcement in RFs and mangrove management remain at current levels;
v) Mangrove restoration in the three townships through development of plantations by the government and other donors’ projects/programs is approximately 1,130 ha annually;
vi) Climate change impact on rice productivity results in declines of 0.4% productivity per year due to saline water intrusion. Mangrove expands landward by 0.5% per year with SLR.
Negative impact Mild positive/negative impact Positive impact expected
Tas VW by 2019;1
35 The current annual rate of increase in areas of CFUGs and VWs were used as estimates of the annual increase in CFs over time.
Table 17. Description of impact drivers, impacts, impact consequences, and dependencies in the BaU scenario on the study area.
Impact drivers Expected impact on study area
Impact consequences and dependencies
Law enforcement on mangrove manage-ment
Weak law enforcement; continuous and repeat-edly illegal logging of fuelwood and timber from mangroves; and mangrove resources are degraded
- Mangrove forest structure and dynamics are degraded. Dominance of unwanted species which limits recovery of mangroves
- Mangrove biomass carbon and timber loss. Mangrove biomass productivity significantly reduced
- Reduce habitat for wildlife, especially birds and mammals- Conflict between meeting needs of local landless people and Government’s
target to maintain and improve mangrove forests- Limited outcome for Government mangrove rehabilitation program because
of illegal logging and unregulated management activitiesCommunity Forestry and mangrove aqua-culture practices
Intensive fuelwood har-vesting for cash and more intensive farming is likely preferred
- Simple forest structure comprised of pioneer, fast growing species. Only young trees remain in the mangrove stands
- Extensive aquaculture productivity directly linked to pond surface area; thus, CF farmers tend to keep less trees and dig more ponds if possible, reducing mangrove area
- Water levels are kept high most of the time in the ponds resulting in unsuit-able hydrological regimes for mangroves
- Rapid cash return for mangrove aquaculture pond owners from fuelwood and aquaculture contributions to livelihoods
Mangrove restoration Limited mangrove res-toration given limited government budget; some unsuitable plantation es-tablishment techniques
- Mangrove restoration achieves only about 2/3 of the target set by the MRRP program
- Unsuitable plantation establishment techniques have negative ecological impacts (e.g., burning vegetation before planting)
- Low investment in capacity building within local Forest Department staff- Healthy seedlings from nursery contribute to the higher survival rate of
planted treesManagement of village common woodlot (VW)
Ineffective management due to insufficient capacity building and low invest-ment
- Micro institutional village frameworks are not sufficiently strengthened through capacity building and investment
- Illegal logging still occurs in the VW areas- People have free access to mangroves for catching crabs
Sea level rise Soil acidification and saline water intrusion
- Soil which was previously mangrove habitat has been acidified and has become toxic resulting in low or very low rice productivity
- Saline water intrusion in low elevation rice fields. Farmers have no, or little, rice harvest in about 10 % of the rice area. On average, rice yields reduced by 0.4 % per year.
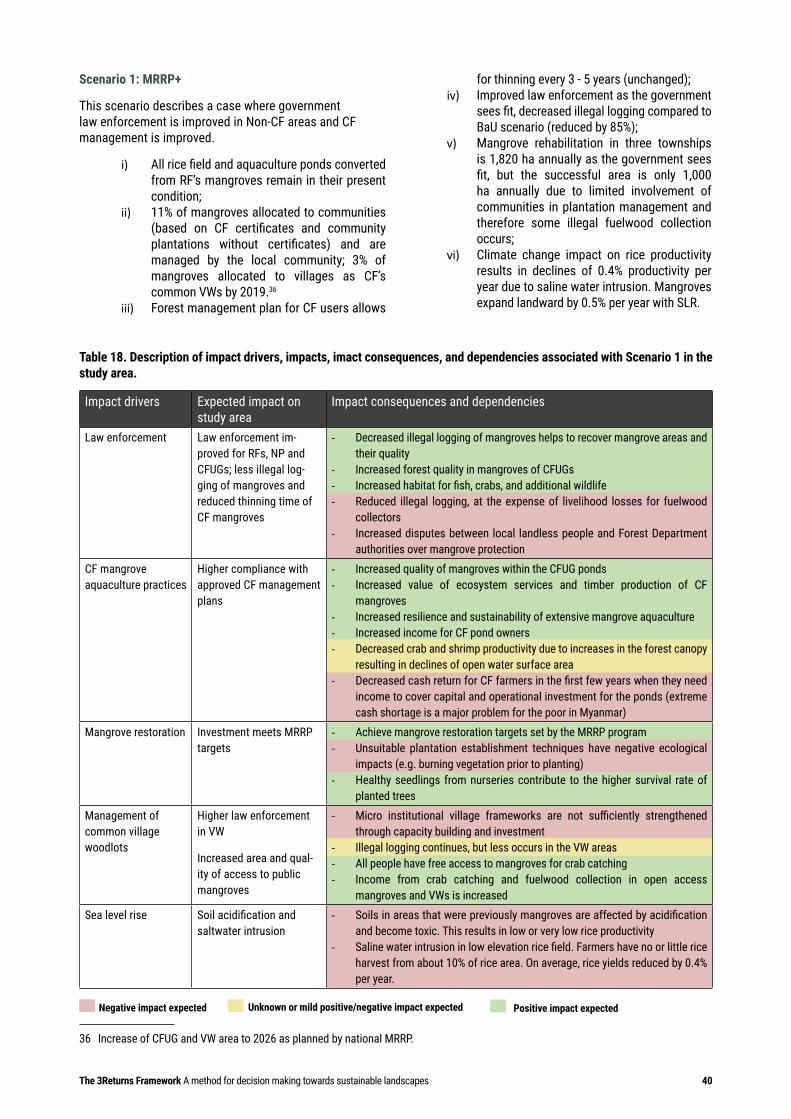
The 3Returns Framework A method for decision making towards sustainable landscapes 40
Scenario 1: MRRP+
This scenario describes a case where government law enforcement is improved in Non-CF areas and CF management is improved.
i) All rice field and aquaculture ponds converted from RF’s mangroves remain in their present condition;
ii) 11% of mangroves allocated to communities (based on CF certificates and community plantations without certificates) and are managed by the local community; 3% of mangroves allocated to villages as CF’s common VWs by 2019.36
iii) Forest management plan for CF users allows
36 Increase of CFUG and VW area to 2026 as planned by national MRRP.
for thinning every 3 - 5 years (unchanged); iv) Improved law enforcement as the government
sees fit, decreased illegal logging compared to BaU scenario (reduced by 85%);
v) Mangrove rehabilitation in three townships is 1,820 ha annually as the government sees fit, but the successful area is only 1,000 ha annually due to limited involvement of communities in plantation management and therefore some illegal fuelwood collection occurs;
vi) Climate change impact on rice productivity results in declines of 0.4% productivity per year due to saline water intrusion. Mangroves expand landward by 0.5% per year with SLR.
2019.1
36 Increase of CFUG and VW area to 2026 as planned by national MRRP.
Table 18. Description of impact drivers, impacts, imact consequences, and dependencies associated with Scenario 1 in the study area.
Impact drivers Expected impact on study area
Impact consequences and dependencies
Law enforcement Law enforcement im-proved for RFs, NP and CFUGs; less illegal log-ging of mangroves and reduced thinning time of CF mangroves
- Decreased illegal logging of mangroves helps to recover mangrove areas and their quality
- Increased forest quality in mangroves of CFUGs- Increased habitat for fish, crabs, and additional wildlife- Reduced illegal logging, at the expense of livelihood losses for fuelwood
collectors - Increased disputes between local landless people and Forest Department
authorities over mangrove protectionCF mangrove aquaculture practices
Higher compliance with approved CF management plans
- Increased quality of mangroves within the CFUG ponds- Increased value of ecosystem services and timber production of CF
mangroves- Increased resilience and sustainability of extensive mangrove aquaculture- Increased income for CF pond owners- Decreased crab and shrimp productivity due to increases in the forest canopy
resulting in declines of open water surface area- Decreased cash return for CF farmers in the first few years when they need
income to cover capital and operational investment for the ponds (extreme cash shortage is a major problem for the poor in Myanmar)
Mangrove restoration Investment meets MRRP targets
- Achieve mangrove restoration targets set by the MRRP program- Unsuitable plantation establishment techniques have negative ecological
impacts (e.g. burning vegetation prior to planting)- Healthy seedlings from nurseries contribute to the higher survival rate of
planted treesManagement of common village woodlots
Higher law enforcement in VW
Increased area and qual-ity of access to public mangroves
- Micro institutional village frameworks are not sufficiently strengthened through capacity building and investment
- Illegal logging continues, but less occurs in the VW areas- All people have free access to mangroves for crab catching - Income from crab catching and fuelwood collection in open access
mangroves and VWs is increasedSea level rise Soil acidification and
saltwater intrusion- Soils in areas that were previously mangroves are affected by acidification
and become toxic. This results in low or very low rice productivity- Saline water intrusion in low elevation rice field. Farmers have no or little rice
harvest from about 10% of rice area. On average, rice yields reduced by 0.4% per year.
Negative impact expected Unknown or mild positive/negative impact expected Positive impact expected
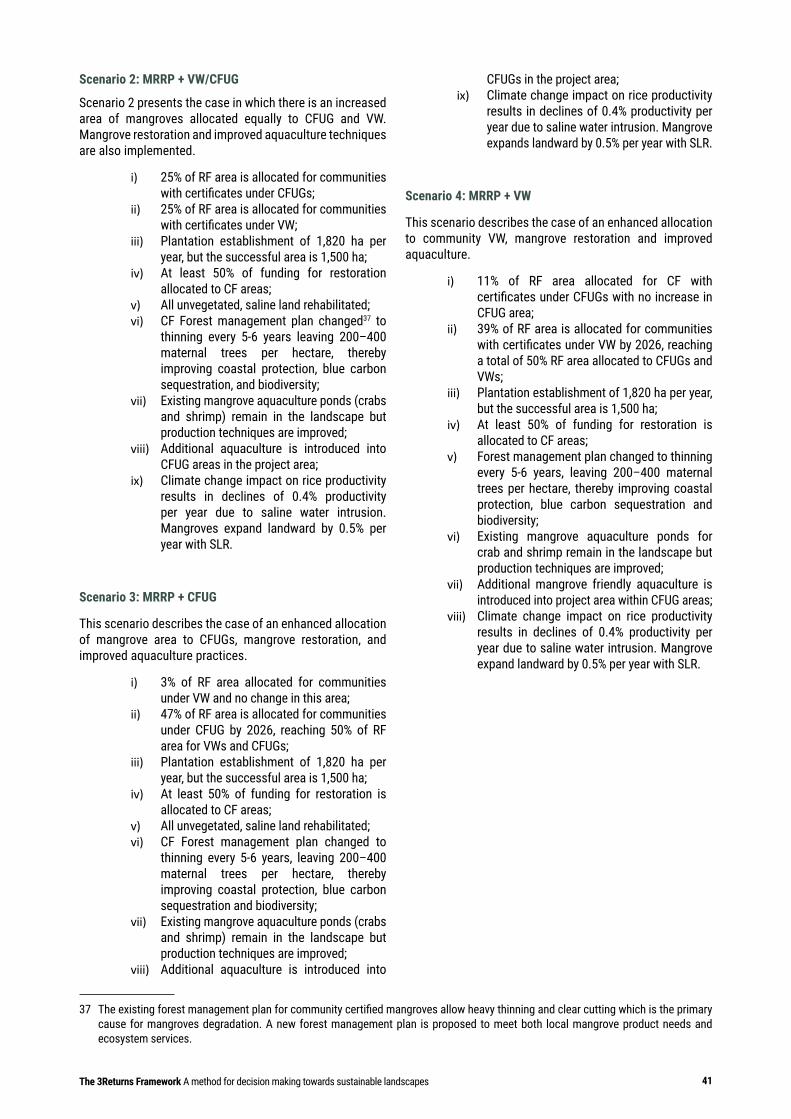
41The 3Returns Framework A method for decision making towards sustainable landscapes
Scenario 2: MRRP + VW/CFUG
Scenario 2 presents the case in which there is an increased area of mangroves allocated equally to CFUG and VW. Mangrove restoration and improved aquaculture techniques are also implemented.
i) 25% of RF area is allocated for communities with certificates under CFUGs;
ii) 25% of RF area is allocated for communities with certificates under VW;
iii) Plantation establishment of 1,820 ha per year, but the successful area is 1,500 ha;
iv) At least 50% of funding for restoration allocated to CF areas;
v) All unvegetated, saline land rehabilitated; vi) CF Forest management plan changed37 to
thinning every 5-6 years leaving 200–400 maternal trees per hectare, thereby improving coastal protection, blue carbon sequestration, and biodiversity;
vii) Existing mangrove aquaculture ponds (crabs and shrimp) remain in the landscape but production techniques are improved;
viii) Additional aquaculture is introduced into CFUG areas in the project area;
ix) Climate change impact on rice productivity results in declines of 0.4% productivity per year due to saline water intrusion. Mangroves expand landward by 0.5% per year with SLR.
Scenario 3: MRRP + CFUG
This scenario describes the case of an enhanced allocation of mangrove area to CFUGs, mangrove restoration, and improved aquaculture practices.
i) 3% of RF area allocated for communities under VW and no change in this area;
ii) 47% of RF area is allocated for communities under CFUG by 2026, reaching 50% of RF area for VWs and CFUGs;
iii) Plantation establishment of 1,820 ha per year, but the successful area is 1,500 ha;
iv) At least 50% of funding for restoration is allocated to CF areas;
v) All unvegetated, saline land rehabilitated; vi) CF Forest management plan changed to
thinning every 5-6 years, leaving 200–400 maternal trees per hectare, thereby improving coastal protection, blue carbon sequestration and biodiversity;
vii) Existing mangrove aquaculture ponds (crabs and shrimp) remain in the landscape but production techniques are improved;
viii) Additional aquaculture is introduced into
37 The existing forest management plan for community certified mangroves allow heavy thinning and clear cutting which is the primary cause for mangroves degradation. A new forest management plan is proposed to meet both local mangrove product needs and ecosystem services.
CFUGs in the project area; ix) Climate change impact on rice productivity
results in declines of 0.4% productivity per year due to saline water intrusion. Mangrove expands landward by 0.5% per year with SLR.
Scenario 4: MRRP + VW
This scenario describes the case of an enhanced allocation to community VW, mangrove restoration and improved aquaculture.
i) 11% of RF area allocated for CF with certificates under CFUGs with no increase in CFUG area;
ii) 39% of RF area is allocated for communities with certificates under VW by 2026, reaching a total of 50% RF area allocated to CFUGs and VWs;
iii) Plantation establishment of 1,820 ha per year, but the successful area is 1,500 ha;
iv) At least 50% of funding for restoration is allocated to CF areas;
v) Forest management plan changed to thinning every 5-6 years, leaving 200–400 maternal trees per hectare, thereby improving coastal protection, blue carbon sequestration and biodiversity;
vi) Existing mangrove aquaculture ponds for crab and shrimp remain in the landscape but production techniques are improved;
vii) Additional mangrove friendly aquaculture is introduced into project area within CFUG areas;
viii) Climate change impact on rice productivity results in declines of 0.4% productivity per year due to saline water intrusion. Mangrove expand landward by 0.5% per year with SLR.
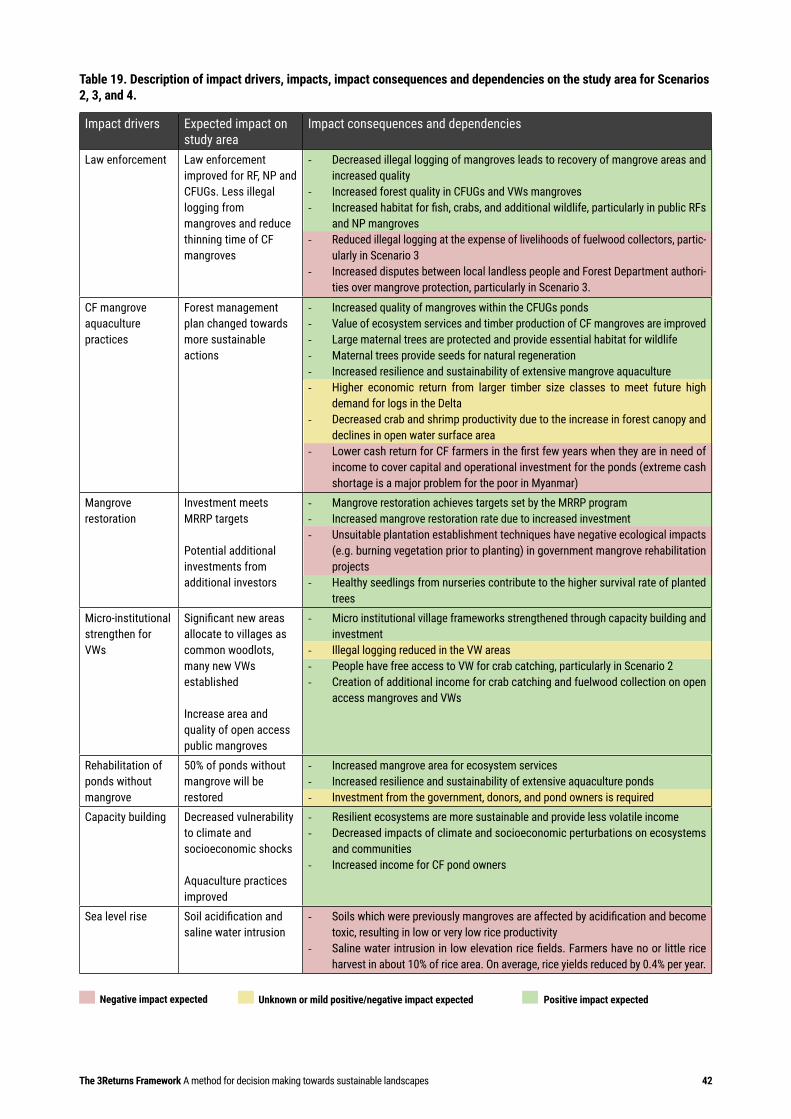
The 3Returns Framework A method for decision making towards sustainable landscapes 42
Negative impact expected Unknown or mild positive/negative impact expected Positive impact expected
Table 19. Description of impact drivers, impacts, impact consequences and dependencies on the study area for Scenarios 2, 3, and 4.
Impact drivers Expected impact on study area
Impact consequences and dependencies
Law enforcement Law enforcement improved for RF, NP and CFUGs. Less illegal logging from mangroves and reduce thinning time of CF mangroves
- Decreased illegal logging of mangroves leads to recovery of mangrove areas and increased quality
- Increased forest quality in CFUGs and VWs mangroves- Increased habitat for fish, crabs, and additional wildlife, particularly in public RFs
and NP mangroves- Reduced illegal logging at the expense of livelihoods of fuelwood collectors, partic-
ularly in Scenario 3 - Increased disputes between local landless people and Forest Department authori-
ties over mangrove protection, particularly in Scenario 3.
CF mangrove aquaculture practices
Forest management plan changed towards more sustainable actions
- Increased quality of mangroves within the CFUGs ponds- Value of ecosystem services and timber production of CF mangroves are improved- Large maternal trees are protected and provide essential habitat for wildlife- Maternal trees provide seeds for natural regeneration- Increased resilience and sustainability of extensive mangrove aquaculture- Higher economic return from larger timber size classes to meet future high
demand for logs in the Delta- Decreased crab and shrimp productivity due to the increase in forest canopy and
declines in open water surface area- Lower cash return for CF farmers in the first few years when they are in need of
income to cover capital and operational investment for the ponds (extreme cash shortage is a major problem for the poor in Myanmar)
Mangrove restoration
Investment meets MRRP targets
Potential additional investments from additional investors
- Mangrove restoration achieves targets set by the MRRP program- Increased mangrove restoration rate due to increased investment - Unsuitable plantation establishment techniques have negative ecological impacts
(e.g. burning vegetation prior to planting) in government mangrove rehabilitation projects
- Healthy seedlings from nurseries contribute to the higher survival rate of planted trees
Micro-institutional strengthen for VWs
Significant new areas allocate to villages as common woodlots, many new VWs established
Increase area and quality of open access public mangroves
- Micro institutional village frameworks strengthened through capacity building and investment
- Illegal logging reduced in the VW areas- People have free access to VW for crab catching, particularly in Scenario 2 - Creation of additional income for crab catching and fuelwood collection on open
access mangroves and VWs
Rehabilitation of ponds without mangrove
50% of ponds without mangrove will be restored
- Increased mangrove area for ecosystem services- Increased resilience and sustainability of extensive aquaculture ponds- Investment from the government, donors, and pond owners is required
Capacity building Decreased vulnerability to climate and socioeconomic shocks
Aquaculture practices improved
- Resilient ecosystems are more sustainable and provide less volatile income- Decreased impacts of climate and socioeconomic perturbations on ecosystems
and communities- Increased income for CF pond owners
Sea level rise Soil acidification and saline water intrusion
- Soils which were previously mangroves are affected by acidification and become toxic, resulting in low or very low rice productivity
- Saline water intrusion in low elevation rice fields. Farmers have no or little rice harvest in about 10% of rice area. On average, rice yields reduced by 0.4% per year.
43The 3Returns Framework A method for decision making towards sustainable landscapes
The scenarios presented above were modeled through 2026, which is the date that the current MRRP program of the Myanmar Government finishes. In order to analyze changes in capitals, benefits, and the overall impact of different interventions, the analysis was conducted over longer time periods extending through 2079 (60 years from data collection and baseline – 2019). Considering the complexity of the landscape environment, uncertainties are high with such projections. Annex 3 includes additional data and assumptions used for modeling the scenarios proposed.
4.1.4. Return on Investment Analysis and Conclusions Following the 3Returns Framework, the scenarios were modeled according to the impact drivers, impacts, and dependencies described above. Interventions such as mangrove restoration and planting, capacity building, mangrove pond establishment, and concrete gates for improving aquaculture were analyzed as an investment of capitals given their impact over the benefits and costs considered. The analysis and results of this process were presented through the Return on Investment Analysis, which allowed conducting financial analyses and comparing across scenarios. Monetized results are presented in PV terms, using a discount rate of 10%.38 Please refer to Table 20.
38 This rate was between the commercial rate, 12 – 15%, and social rate of 8% in Myanmar.
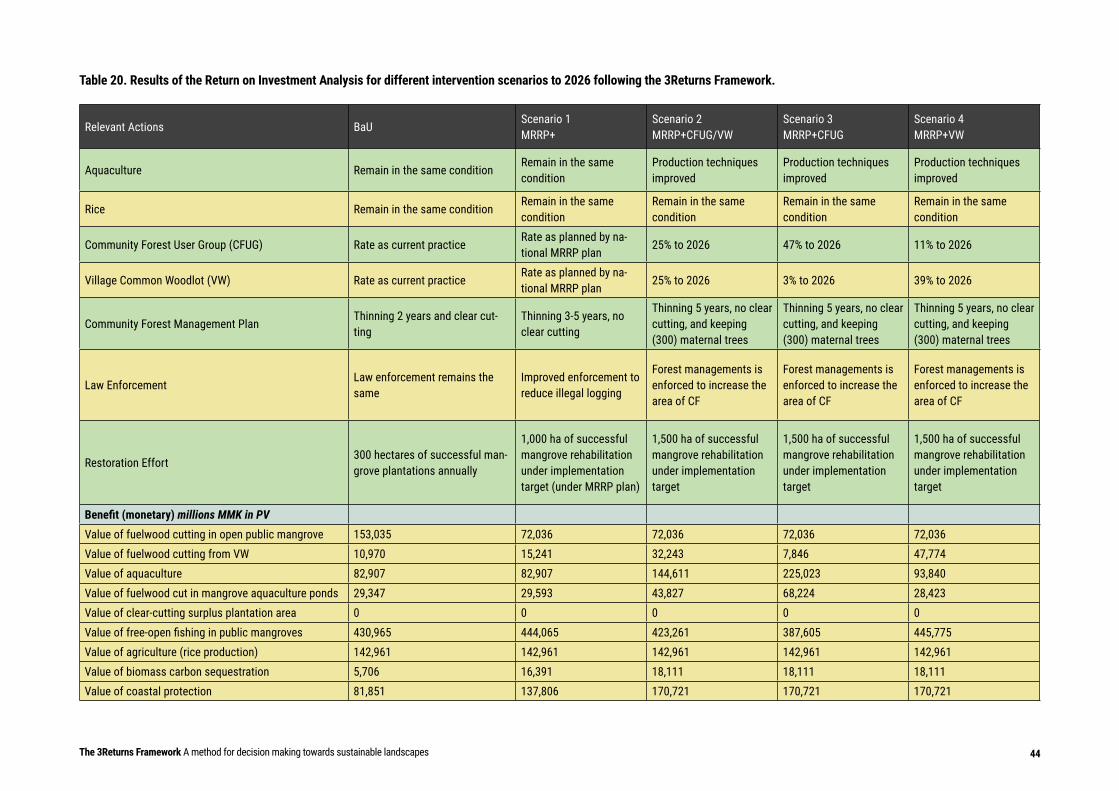
Natural Capital Platforms and Tools for Green Growth Planning 44The 3Returns Framework A method for decision making towards sustainable landscapes
Table 20. Results of the Return on Investment Analysis for different intervention scenarios to 2026 following the 3Returns Framework.
Relevant Actions BaUScenario 1 MRRP+
Scenario 2 MRRP+CFUG/VW
Scenario 3 MRRP+CFUG
Scenario 4 MRRP+VW
Aquaculture Remain in the same conditionRemain in the same condition
Production techniques improved
Production techniques improved
Production techniques improved
Rice Remain in the same conditionRemain in the same condition
Remain in the same condition
Remain in the same condition
Remain in the same condition
Community Forest User Group (CFUG) Rate as current practiceRate as planned by na-tional MRRP plan
25% to 2026 47% to 2026 11% to 2026
Village Common Woodlot (VW) Rate as current practiceRate as planned by na-tional MRRP plan
25% to 2026 3% to 2026 39% to 2026
Community Forest Management PlanThinning 2 years and clear cut-ting
Thinning 3-5 years, no clear cutting
Thinning 5 years, no clear cutting, and keeping (300) maternal trees
Thinning 5 years, no clear cutting, and keeping (300) maternal trees
Thinning 5 years, no clear cutting, and keeping (300) maternal trees
Law EnforcementLaw enforcement remains the same
Improved enforcement to reduce illegal logging
Forest managements is enforced to increase the area of CF
Forest managements is enforced to increase the area of CF
Forest managements is enforced to increase the area of CF
Restoration Effort300 hectares of successful man-grove plantations annually
1,000 ha of successful mangrove rehabilitation under implementation target (under MRRP plan)
1,500 ha of successful mangrove rehabilitation under implementation target
1,500 ha of successful mangrove rehabilitation under implementation target
1,500 ha of successful mangrove rehabilitation under implementation target
Benefit (monetary) millions MMK in PV Value of fuelwood cutting in open public mangrove 153,035 72,036 72,036 72,036 72,036Value of fuelwood cutting from VW 10,970 15,241 32,243 7,846 47,774Value of aquaculture 82,907 82,907 144,611 225,023 93,840Value of fuelwood cut in mangrove aquaculture ponds 29,347 29,593 43,827 68,224 28,423Value of clear-cutting surplus plantation area 0 0 0 0 0Value of free-open fishing in public mangroves 430,965 444,065 423,261 387,605 445,775Value of agriculture (rice production) 142,961 142,961 142,961 142,961 142,961Value of biomass carbon sequestration 5,706 16,391 18,111 18,111 18,111Value of coastal protection 81,851 137,806 170,721 170,721 170,721
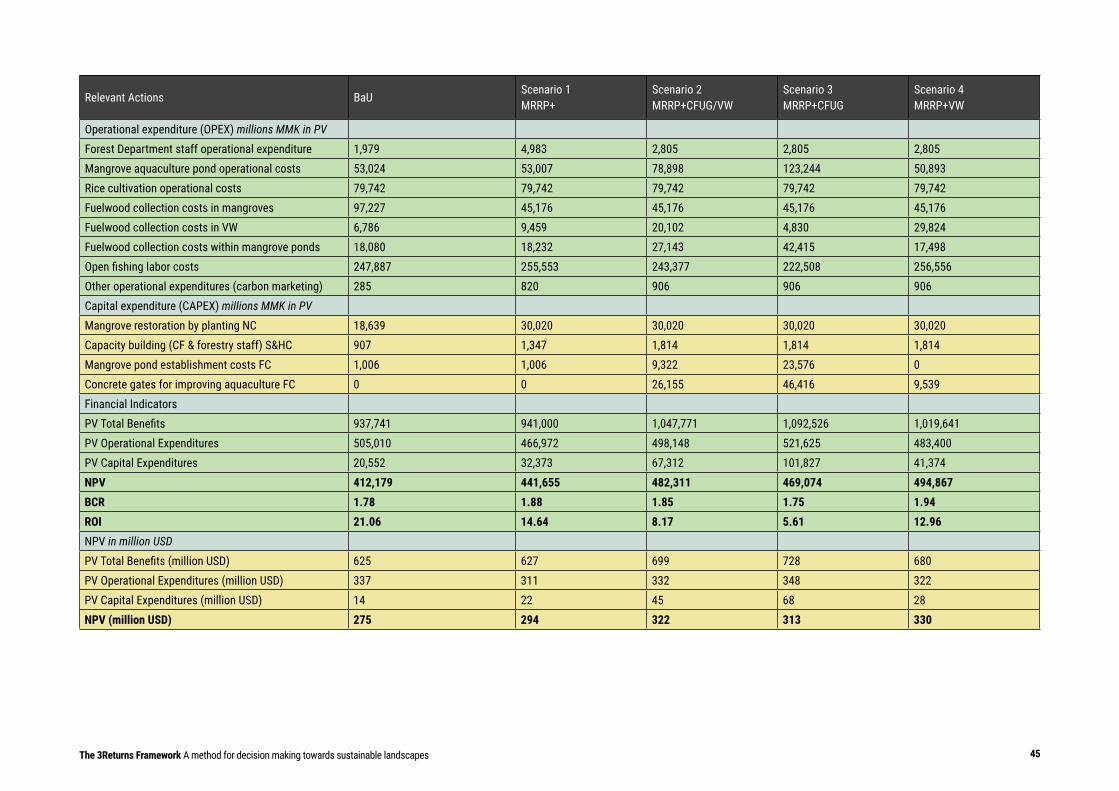
Natural Capital Platforms and Tools for Green Growth Planning 45The 3Returns Framework A method for decision making towards sustainable landscapes
Relevant Actions BaUScenario 1 MRRP+
Scenario 2 MRRP+CFUG/VW
Scenario 3 MRRP+CFUG
Scenario 4 MRRP+VW
Operational expenditure (OPEX) millions MMK in PV Forest Department staff operational expenditure 1,979 4,983 2,805 2,805 2,805Mangrove aquaculture pond operational costs 53,024 53,007 78,898 123,244 50,893Rice cultivation operational costs 79,742 79,742 79,742 79,742 79,742Fuelwood collection costs in mangroves 97,227 45,176 45,176 45,176 45,176Fuelwood collection costs in VW 6,786 9,459 20,102 4,830 29,824Fuelwood collection costs within mangrove ponds 18,080 18,232 27,143 42,415 17,498Open fishing labor costs 247,887 255,553 243,377 222,508 256,556Other operational expenditures (carbon marketing) 285 820 906 906 906Capital expenditure (CAPEX) millions MMK in PV Mangrove restoration by planting NC 18,639 30,020 30,020 30,020 30,020Capacity building (CF & forestry staff) S&HC 907 1,347 1,814 1,814 1,814Mangrove pond establishment costs FC 1,006 1,006 9,322 23,576 0Concrete gates for improving aquaculture FC 0 0 26,155 46,416 9,539Financial Indicators PV Total Benefits 937,741 941,000 1,047,771 1,092,526 1,019,641PV Operational Expenditures 505,010 466,972 498,148 521,625 483,400PV Capital Expenditures 20,552 32,373 67,312 101,827 41,374NPV 412,179 441,655 482,311 469,074 494,867BCR 1.78 1.88 1.85 1.75 1.94ROI 21.06 14.64 8.17 5.61 12.96NPV in million USD PV Total Benefits (million USD) 625 627 699 728 680PV Operational Expenditures (million USD) 337 311 332 348 322PV Capital Expenditures (million USD) 14 22 45 68 28NPV (million USD) 275 294 322 313 330
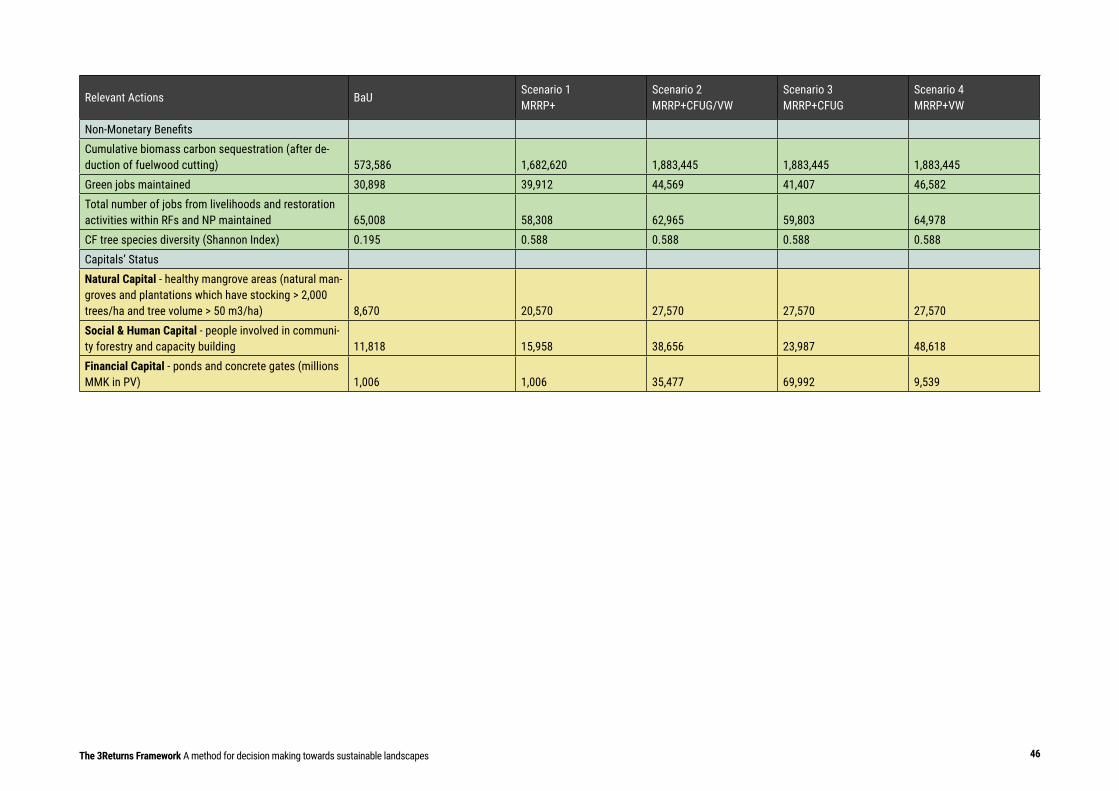
Natural Capital Platforms and Tools for Green Growth Planning 46The 3Returns Framework A method for decision making towards sustainable landscapes
Relevant Actions BaUScenario 1 MRRP+
Scenario 2 MRRP+CFUG/VW
Scenario 3 MRRP+CFUG
Scenario 4 MRRP+VW
Non-Monetary BenefitsCumulative biomass carbon sequestration (after de-duction of fuelwood cutting) 573,586 1,682,620 1,883,445 1,883,445 1,883,445Green jobs maintained 30,898 39,912 44,569 41,407 46,582Total number of jobs from livelihoods and restoration activities within RFs and NP maintained 65,008 58,308 62,965 59,803 64,978CF tree species diversity (Shannon Index) 0.195 0.588 0.588 0.588 0.588Capitals’ StatusNatural Capital - healthy mangrove areas (natural man-groves and plantations which have stocking > 2,000 trees/ha and tree volume > 50 m3/ha) 8,670 20,570 27,570 27,570 27,570Social & Human Capital - people involved in communi-ty forestry and capacity building 11,818 15,958 38,656 23,987 48,618Financial Capital - ponds and concrete gates (millions MMK in PV) 1,006 1,006 35,477 69,992 9,539
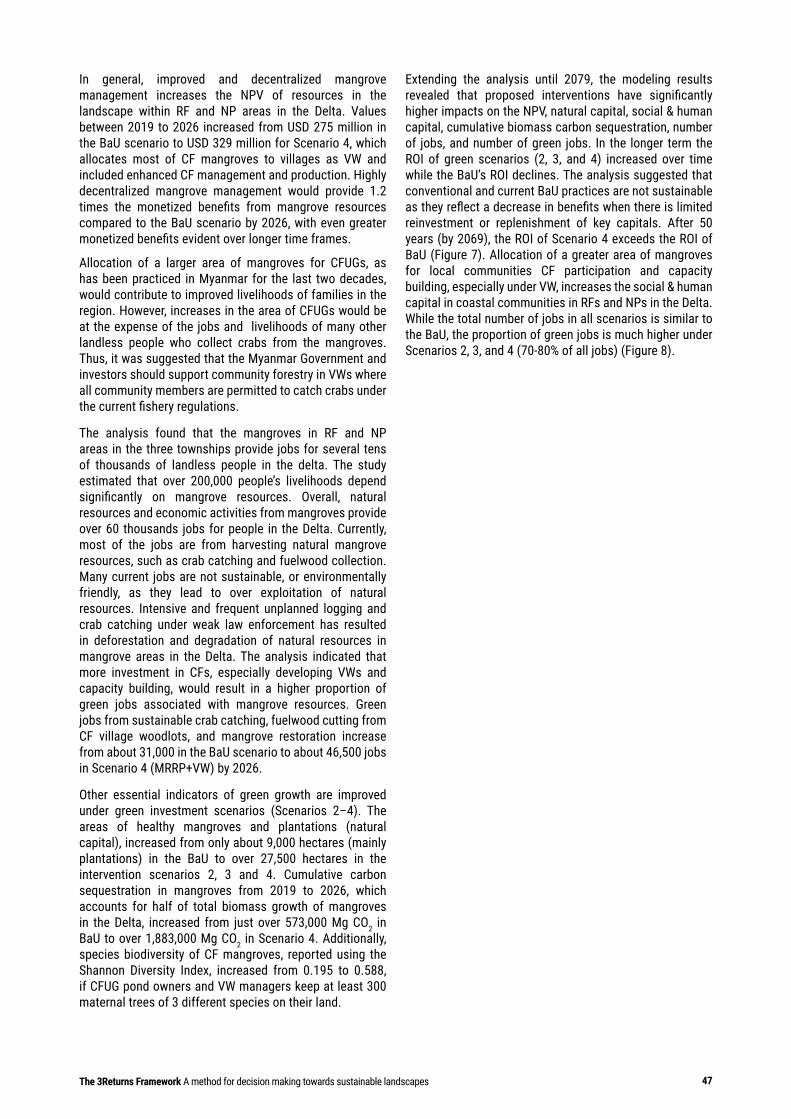
47The 3Returns Framework A method for decision making towards sustainable landscapes
In general, improved and decentralized mangrove management increases the NPV of resources in the landscape within RF and NP areas in the Delta. Values between 2019 to 2026 increased from USD 275 million in the BaU scenario to USD 329 million for Scenario 4, which allocates most of CF mangroves to villages as VW and included enhanced CF management and production. Highly decentralized mangrove management would provide 1.2 times the monetized benefits from mangrove resources compared to the BaU scenario by 2026, with even greater monetized benefits evident over longer time frames.
Allocation of a larger area of mangroves for CFUGs, as has been practiced in Myanmar for the last two decades, would contribute to improved livelihoods of families in the region. However, increases in the area of CFUGs would be at the expense of the jobs and livelihoods of many other landless people who collect crabs from the mangroves. Thus, it was suggested that the Myanmar Government and investors should support community forestry in VWs where all community members are permitted to catch crabs under the current fishery regulations.
The analysis found that the mangroves in RF and NP areas in the three townships provide jobs for several tens of thousands of landless people in the delta. The study estimated that over 200,000 people’s livelihoods depend significantly on mangrove resources. Overall, natural resources and economic activities from mangroves provide over 60 thousands jobs for people in the Delta. Currently, most of the jobs are from harvesting natural mangrove resources, such as crab catching and fuelwood collection. Many current jobs are not sustainable, or environmentally friendly, as they lead to over exploitation of natural resources. Intensive and frequent unplanned logging and crab catching under weak law enforcement has resulted in deforestation and degradation of natural resources in mangrove areas in the Delta. The analysis indicated that more investment in CFs, especially developing VWs and capacity building, would result in a higher proportion of green jobs associated with mangrove resources. Green jobs from sustainable crab catching, fuelwood cutting from CF village woodlots, and mangrove restoration increase from about 31,000 in the BaU scenario to about 46,500 jobs in Scenario 4 (MRRP+VW) by 2026.
Other essential indicators of green growth are improved under green investment scenarios (Scenarios 2–4). The areas of healthy mangroves and plantations (natural capital), increased from only about 9,000 hectares (mainly plantations) in the BaU to over 27,500 hectares in the intervention scenarios 2, 3 and 4. Cumulative carbon sequestration in mangroves from 2019 to 2026, which accounts for half of total biomass growth of mangroves in the Delta, increased from just over 573,000 Mg CO2 in BaU to over 1,883,000 Mg CO2 in Scenario 4. Additionally, species biodiversity of CF mangroves, reported using the Shannon Diversity Index, increased from 0.195 to 0.588, if CFUG pond owners and VW managers keep at least 300 maternal trees of 3 different species on their land.
Extending the analysis until 2079, the modeling results revealed that proposed interventions have significantly higher impacts on the NPV, natural capital, social & human capital, cumulative biomass carbon sequestration, number of jobs, and number of green jobs. In the longer term the ROI of green scenarios (2, 3, and 4) increased over time while the BaU’s ROI declines. The analysis suggested that conventional and current BaU practices are not sustainable as they reflect a decrease in benefits when there is limited reinvestment or replenishment of key capitals. After 50 years (by 2069), the ROI of Scenario 4 exceeds the ROI of BaU (Figure 7). Allocation of a greater area of mangroves for local communities CF participation and capacity building, especially under VW, increases the social & human capital in coastal communities in RFs and NPs in the Delta. While the total number of jobs in all scenarios is similar to the BaU, the proportion of green jobs is much higher under Scenarios 2, 3, and 4 (70-80% of all jobs) (Figure 8).
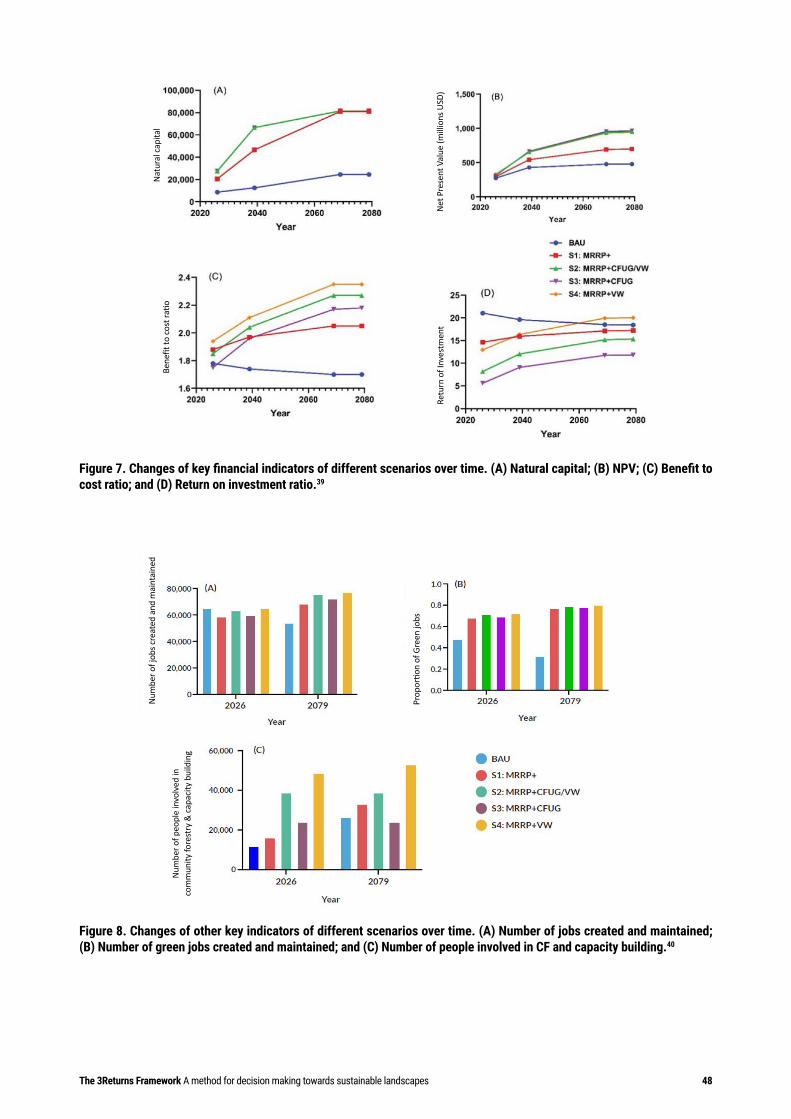
The 3Returns Framework A method for decision making towards sustainable landscapes 48
Figure 7. Changes of key financial indicators of different scenarios over time. (A) Natural capital; (B) NPV; (C) Benefit to cost ratio; and (D) Return on investment ratio.39
Figure 8. Changes of other key indicators of different scenarios over time. (A) Number of jobs created and maintained; (B) Number of green jobs created and maintained; and (C) Number of people involved in CF and capacity building.40
39 Similar changes in Natural Capital and NPV in scenarios 2, 3, and 4, given similar changes in mangrove resources. 40 Due to estimated continuous increase (according to current growth) of CFUG and VWs in BaU, by 2079 the number of people involved
in CF under BaU presents a significant increase.
Nat
ural
capi
tal
Net
Pre
sent
Val
ue (m
illio
ns U
SD)
Retu
rn o
f Inv
estm
ent
Bene
fit to
cost
ratio
Num
ber o
f job
s cre
ated
and
mai
ntai
ned
Num
ber o
f peo
ple
invo
lved
in
com
mun
ity fo
rest
ry &
capa
city
bui
ldin
g
Prop
ortio
n of
Gre
en jo
bs
49The 3Returns Framework A method for decision making towards sustainable landscapes
In conclusion, mangroves in the Delta provide vital livelihood resources and supportive services for thousands of people. Over 70% of people within RF and NP areas and buffer zones are landless people; therefore, it is crucial that mangrove management strategies and plans incorporate not only improved mangrove management, but also the prioritization of mechanisms and policies that take into consideration the impacts on these people. The analysis of different green investment scenarios indicates that decentralized mangrove management and increased investment in VWs, which still allows landless people to harvest non-timber forest products, achieves the highest NPV compared to the other scenarios by 2026. Scenario 4 also shows the greatest efficiency when analyzing benefits against investment in the long run. When considering non-monetary benefits and capitals’ outputs, decentralized mangrove management through VWs presents the best scenario compared to the other green scenarios and the least trade-offs when compared to BaU (total number of jobs maintained).
Decentralization of mangrove management through CF represents a greater investment required in all green scenarios. In the case of VWs, this greater investment comes from increasing mangrove restoration by planting (natural capital investment); capacity building for community and forestry staff for implementing CF, improving mangrove management practices, and sustainable natural resource production/exploitation (social & human capital investment); and improving aquaculture practices through the investment in concrete gates for better water and pond management (financial capital investment). The study conducted in the Delta indicated that significant CF areas have not been successfully managed given lack of capacity building and support. Even more, most CF areas reported to have received little support after CF certificates were granted to the communities. Therefore, certifying is not enough, social & human capital investment is required and crucial for managing resources in a sustainable manner.
Currently, mangrove aquaculture is a lucrative farming practice for CF pond owners that depends mostly on the status of natural capital. The analysis showed that mangrove aquaculture in the Delta has low productivity and is highly volatile due to the dependency on wild caught larvae. Additionally, advanced mangrove aquaculture techniques such as the use of concrete gates and control of pond water quality and diseases, techniques that have been developed and applied in neighboring countries (e.g. Bangladesh, Thailand, and Viet Nam), are still not implemented in Myanmar. An investment in production infrastructure (financial capital investment) and capacity building for improving sustainable aquaculture that is compatible with mangrove restoration and land-use planning to minimize climate risks (social & human capital investment), are needed for improving this significant income-generating activity. Unfortunately, people in remote rural coastal areas in the Ayeyarwady Delta have limited resources and do not count with the capital for investing in improving their economic activities. Informal loans are the only option for most of the people, even for communities
that have already received CF certificates. The analysis of this economic activity serves as the motivation for improving access to formal financial resources, thereby allowing farmers to access fairly priced and manageable loans from financial institutions.
The 3Returns Framework A method for decision making towards sustainable landscapes 50
CHAPTER 5 5.1 3RETURNS FRAMEWORK KEY POINTS AND LESSONS LEARNEDThe 3Returns Framework is not a new methodology for capitals’ accounting or for valuing ecosystem services; conversely, the 3Returns Framework builds on, and puts into operation, already existing capital accounting frameworks and tools for valuing ecosystem services. The overall motivation of this framework is to introduce a systematic approach for assessing interventions towards sustainable landscapes. For this, the 3Returns Framework presents a new approach based on the recognition of capitals, capitals’ benefits, and interventions as an investment in capitals, which allow for the computation of efficiency measures (i.e. ROI) that, when combined with profitable measures and non-monetary benefits, serve as a practical method for decision making.
The assessment conducted in Myanmar following the 3Returns approach provided the support of the 3Returns Framework as a useful method that leads decision making towards sustainable landscapes. The calculation of an efficiency measure (i.e. ROI) proved to be a valuable point in order to determine which green intervention can be recommended, considering that the NPV was quite similar when analyzing different green scenarios. Additionally, the calculation of the ROI for the BaU also contributed to the understanding of the importance and necessity of reinvesting in capitals in order to continue enjoying the benefits that they provide, something difficult to conclude from the NPV in this case. Green interventions as expressed through the 3Returns Framework (through natural, social & human, and financial capital investment) proved to be informative, especially when considering how different interventions will affect the benefits and operational costs of economic activities, and the potential trade-offs from these interventions.
Among the benefits of applying the 3Returns Framework, the method resulted in key information needed for analyzing policy impacts and the identification of efficient ways of allocating resources in order to improve the benefits and status of stakeholders in the area of interest. Having this information available facilitated discussion among decision makers and their understanding of the implications of different interventions with potential trade-offs that can harm the implementation of them. Results from the assessment also allowed decision makers to understand the potential implication of climate change, the need for improved mangrove management practices in order to increase ecosystem services, and the identification of sectors that can be developed together with mangrove restoration efforts. The experience in Myanmar showed that the results from the 3Returns assessment were not
only of interest to multiple government agencies and policy decision makers, but also from a multilateral development bank which expressed its intention to replicate the analysis in order to mobilize resources for development purposes. Additionally, the 3Returns assessment proved to be an effective example of how to combine and operationalize multiple available tools for policy impact and decision making, especially of natural capital accounting frameworks and ecosystem services valuation tools.
For scaling and replicating landscape assessments following the 3Returns Framework, the indicators recommended in this document have been selected in order to reflect and capture essential economic, social, and environmental dimensions when evaluating a potential intervention. Therefore, in order to replicate and scale landscape assessments following this framework, the indicators suggested should serve as the minimum requirement when analyzing a transition towards green growth models. By following the indicators suggested, the framework also accomplishes its goal to simultaneously serve multiple stakeholders, including government entities, communities, and the private sector. Additional indicators can be integrated as an effort to increase the understanding of impacts on capitals or for analyzing specific policy or financial mechanisms.
A multi-stakeholder process is crucial. Considering the complexity of the interactions between stakeholders, resources, and institutions within a spatial area, the 3Returns Framework strongly recommends the involvement of multiple stakeholders when assessing a landscape. Even though the assessment can be driven by a strong governmental or private angle, the analysis should consider the diverse range of actors involved in the area of interest.
The pilot study conducted in Myanmar provided the importance and usefulness of considering capitals when analyzing interventions towards sustainable landscapes and confirmed the value of the ROI for supporting decision making. The method presented through this document aims to contribute with the fundamentals for green growth landscape assessments. Furthermore, the 3Returns Framework aims to support countries, project developers, and stakeholders in meeting the Sustainable Development Goals; achieving commitments towards climate change, land degradation neutrality, and biodiversity; realizing national plans and strategies for economic growth; mobilizing resources for the execution of Nationally Determined Contributions; and other green growth targets.
51The 3Returns Framework A method for decision making towards sustainable landscapes
REFERENCESBaedeker, T., Grosjean, G., & Girvetz, E. (2018). “Bringing the Concept of Climate-Smart Agriculture to Life: Insights from CSA Country Profiles Across Africa, Asia, and Latin America”. Washington, DC. : Wolrd Bank, and the International Centre for Tropical Agriculture.
Barbier, E.B. (2007). Valuing ecosystem services as productive inputs. Econ. Policy, 177–229.
Blankespoor, B. D.M. (2017). Mangroves as a protection from storm surges in a changing climate. Ambio., 478-491.
Blythe, J., & et al. (2017). Strengthening post-hoc analysis of community-based fisheries management through the social-ecological systems framework. ELSEVIER, 50-58.
Campos, J., & et al. (2015). Time goes by: recent developments on the theory and practice of the discount rate. Inter-American Development Bank.
Chen, C., & et al. (2012). Climate change, sea level rise and rice: Global market implications. -: Clim. Change.
Dasgupta, P. (2015). Disregarded capitals: What national accounting ignores. Accounting and Business Research, 447-464.
Dasgupta, S., & et al. (2011). Exposure of developing countries to sea-level rise and storm surges. -: Clim. Change.
Deb, P., & et al. (2016). Assessment of the impacts of climate change and brackish irrigation water on rice productivity and evaluation of adaptation measures in Ca Mau province, Vietnam. Theoretical and applied climatology.
Estoque, R.C., Myint, S.W., Wang, C., Ishtiaque, A., Aung, T.T., Emerton, L., Ooba, M., Hijioka, Y., Mon, M.S., Wang, Z., & Fan, C. (2018). Assessing environmental impacts and change in Myanmar’s mangrove ecosystem service value due to deforestation (2000–2014). Glob. Chang. Biol. 24, 5391–5410.
FAO. (2019). EX-Ante Carbon balance Tool (EX-ACT). Retrieved from FAO: http://www.fao.org/tc/exact/ex-act-home/en/.
FAO. (2019). Land Use, Irrigation and Agricultural Practices. Retrieved from FAO Statistics: http://www.fao.org/economic/ess/environment/data/land-use/en/.
Fritz, H., & et al. (2009). Cyclone Nargis storm surge in Myanmar. Nat. Geosci.
GGGI. (2017). Accelerating the Transition to a New Model of Growth. Seoul: Global Green Growth Institute.
GGGI. (2018). Green Growth Assessment & Extended Cost Benefit Analysis. Jakarta: GGGI.
GGGI. (2019). GGGI Strategy 2030: A low-Carbon, Resilient World of Strong, Inclusive, and Sustainable Growth. Seoul: GGGI.
GGKP. (2020). Measuring Nature’s Contribution to Economic Development: Towards a framework of indicators for national natural capital reporting. Geneva: Green Growth Knowledge Partnership.
Hochard, J., & et al. (2019). Mangroves shelter coastal economic activity from cyclones. -: Proc. Natl. Acad. Sci.
IPCC. (2019). IPCC Special Report on the Ocean and Cryosphere in a Changing Climate. In press.
Karim, M., & et al. (2012). Climate change model predicts 33% rice yield decrease in 2100 in Bangladesh. Agronomy for Sustainable Development.
Karp, D. S., Mendenhall, C. D., Sandi, R. F., Chaumont, N., Ehrlich, P. R., Hadly, E. A., & Daily, G. C. (2013). Forest bolsters bird abundance, pest control and coffee yield. PNAS, 12579-12582.
Lange, W., & et al. (2018). The Changing Wealth of Nations 2018: Building a Sustainable Future. Washington, DC: World Bank.
Lovelock, C., & et al. (2015). The vulnerability of Indo-Pacific mangrove forests to sea-level rise. -: Nature.
Managi, S., & Kumar, P. (2018). Inclusive wealth report 2018: measuring progress towards sustainability. Routledge.
Minderhoud, P., & et al. (2019). Mekong Delta much lower than previously assumed in sea-level rise impact assessments. -: Nat. Commun.
The 3Returns Framework A method for decision making towards sustainable landscapes 52
Nahlik, D. H. (2013). Final Ecosystem Goods and Services Classification System. Corvallis: United Nations Environmental Protection Agency.
Natural Capital Coalition. (2016). Natural Capital Protocol. Retrieved from Natural Capital Coalition: https://naturalcapitalcoalition.org/natural-capital-protocol/.
Neugarten, R., & et al. (2018). Tools for measuring, modeling, and valuing ecosystem services: Guidance for Key Biodiversity Areas, natural World Heritage Sites, and protected areas. Gland, Switzerland: IUCN.
Nicholls, R., & Cazenave, A. (2010). Sea-level rise and its impact on coastal zones. -: Science.
OECD. (2008). OECD Environmental Outlook to 2030. OECD.
OECD. (2011). How’s Life? Measuring Well-Being. Paris: OECD Publishing.
OECD. (2015). How’s Life? 2015: Measuring Well-being. Paris: OECD Publishing.
Putra, A. P., Pewi, D. P., Andoh, J., & Lee, Y. (2018). Ecological and Socioeconomic Benefits of Sustainable Forest Management Certification for Small Forest Holders in Kedung Keris village, Indonesia. (pp. 11-27). Korean Journal of Forest Economics 25(2).
Ricketts, H. & Taylor, D. C. (2004). Economic value of tropical forest to coffee production. PNAS, 12579-12582.
Rogers, K., & et al. (2019). Wetland carbon storage controlled by millennial-scale variation in relative sea-level rise. -: Nature.
Schuerch, M., & et al. (2018). Future response of global coastal wetlands to sea-level rise. -: Nature.
Scrivens, K. A. (2013). Four Interpretations of Social Capital: An Agenda for Measurement. Paris: OECD Publishing.
Social & Human Capital Coalition. (2019). Social & Human Capital Protocol. Retrieved from Social & Human Capital Coalition: https://www.social-human-capital.org/
Thein, S. S. (2015). Natural Hazards Induced Salt-affected Soils for Rice Production in Myanmar. Department of Soil and Water Science Collection Yezin Agricultural University.
UNECE. (2014). Conference of European Statisticians Recommendations on Measuring Sustainable Development. New York and Geneva: United Nations.
United Nations. (2019). Nature’s Dangerous Decline ‘Unprecedented’. UN.
W.H.O. (2019). World Health Organization. Retrieved from How air pollution is destroying our health: https://www.who.int/air-pollution/news-and-events/how-airpollution-
World Bank. (2018). Decline of Global Extreme Poverty Continues but Has Slowed. Washington: The World Bank.
World Bank. (2019). Change of Wealth of Nations. Geneva: WB.
Zheng, H., Wang, L., Peng, W., Zhang, C., Li, C., Robinson, E. B., & Daily, G. C. (2019). Realizing the values of natural capital for inclusive, sustainable development: Informing China’s new ecological development strategy. (pp. 8623-8628). PNAS 116(17).
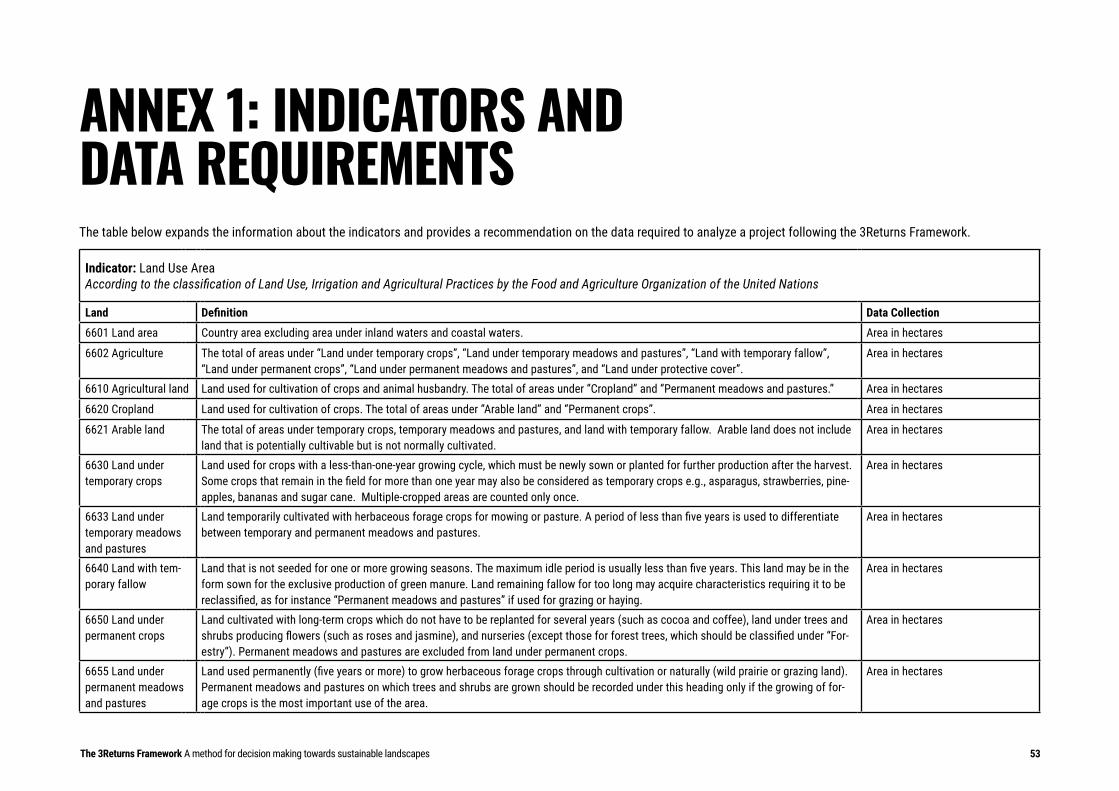
Natural Capital Platforms and Tools for Green Growth Planning 53
ANNEX 1: INDICATORS AND DATA REQUIREMENTSThe table below expands the information about the indicators and provides a recommendation on the data required to analyze a project following the 3Returns Framework.
Indicator: Land Use Area According to the classification of Land Use, Irrigation and Agricultural Practices by the Food and Agriculture Organization of the United Nations
Land Definition Data Collection
6601 Land area Country area excluding area under inland waters and coastal waters. Area in hectares
6602 Agriculture The total of areas under “Land under temporary crops”, “Land under temporary meadows and pastures”, “Land with temporary fallow”, “Land under permanent crops”, “Land under permanent meadows and pastures”, and “Land under protective cover”.
Area in hectares
6610 Agricultural land Land used for cultivation of crops and animal husbandry. The total of areas under ‘’Cropland’’ and ‘’Permanent meadows and pastures.’’ Area in hectares
6620 Cropland Land used for cultivation of crops. The total of areas under ‘’Arable land’’ and ‘’Permanent crops’’. Area in hectares
6621 Arable land The total of areas under temporary crops, temporary meadows and pastures, and land with temporary fallow. Arable land does not include land that is potentially cultivable but is not normally cultivated.
Area in hectares
6630 Land under temporary crops
Land used for crops with a less-than-one-year growing cycle, which must be newly sown or planted for further production after the harvest. Some crops that remain in the field for more than one year may also be considered as temporary crops e.g., asparagus, strawberries, pine-apples, bananas and sugar cane. Multiple-cropped areas are counted only once.
Area in hectares
6633 Land under temporary meadows and pastures
Land temporarily cultivated with herbaceous forage crops for mowing or pasture. A period of less than five years is used to differentiate between temporary and permanent meadows and pastures.
Area in hectares
6640 Land with tem-porary fallow
Land that is not seeded for one or more growing seasons. The maximum idle period is usually less than five years. This land may be in the form sown for the exclusive production of green manure. Land remaining fallow for too long may acquire characteristics requiring it to be reclassified, as for instance “Permanent meadows and pastures” if used for grazing or haying.
Area in hectares
6650 Land under permanent crops
Land cultivated with long-term crops which do not have to be replanted for several years (such as cocoa and coffee), land under trees and shrubs producing flowers (such as roses and jasmine), and nurseries (except those for forest trees, which should be classified under “For-estry”). Permanent meadows and pastures are excluded from land under permanent crops.
Area in hectares
6655 Land under permanent meadows and pastures
Land used permanently (five years or more) to grow herbaceous forage crops through cultivation or naturally (wild prairie or grazing land). Permanent meadows and pastures on which trees and shrubs are grown should be recorded under this heading only if the growing of for-age crops is the most important use of the area.
Area in hectares
The 3Returns Framework A method for decision making towards sustainable landscapes
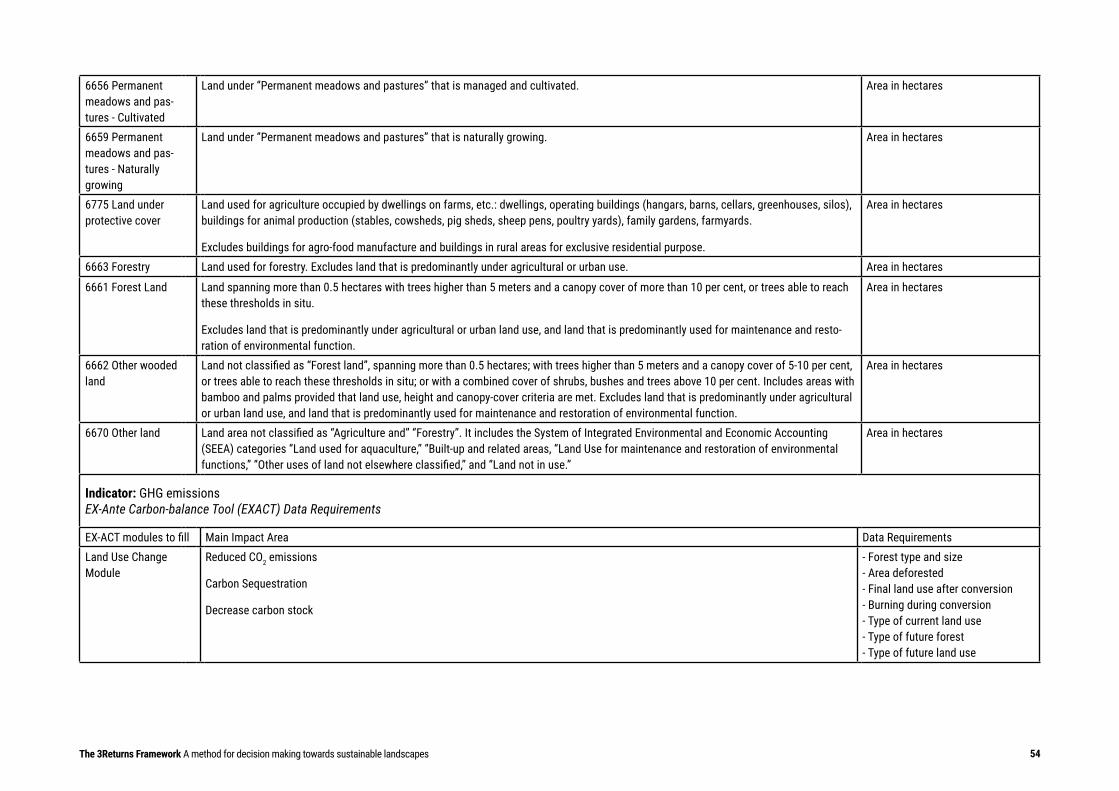
Natural Capital Platforms and Tools for Green Growth Planning 54
6656 Permanent meadows and pas-tures - Cultivated
Land under ‘’Permanent meadows and pastures’’ that is managed and cultivated. Area in hectares
6659 Permanent meadows and pas-tures - Naturally growing
Land under ‘’Permanent meadows and pastures’’ that is naturally growing. Area in hectares
6775 Land under protective cover
Land used for agriculture occupied by dwellings on farms, etc.: dwellings, operating buildings (hangars, barns, cellars, greenhouses, silos), buildings for animal production (stables, cowsheds, pig sheds, sheep pens, poultry yards), family gardens, farmyards.
Excludes buildings for agro-food manufacture and buildings in rural areas for exclusive residential purpose.
Area in hectares
6663 Forestry Land used for forestry. Excludes land that is predominantly under agricultural or urban use. Area in hectares
6661 Forest Land Land spanning more than 0.5 hectares with trees higher than 5 meters and a canopy cover of more than 10 per cent, or trees able to reach these thresholds in situ.
Excludes land that is predominantly under agricultural or urban land use, and land that is predominantly used for maintenance and resto-ration of environmental function.
Area in hectares
6662 Other wooded land
Land not classified as “Forest land”, spanning more than 0.5 hectares; with trees higher than 5 meters and a canopy cover of 5-10 per cent, or trees able to reach these thresholds in situ; or with a combined cover of shrubs, bushes and trees above 10 per cent. Includes areas with bamboo and palms provided that land use, height and canopy-cover criteria are met. Excludes land that is predominantly under agricultural or urban land use, and land that is predominantly used for maintenance and restoration of environmental function.
Area in hectares
6670 Other land Land area not classified as “Agriculture and’’ ‘’Forestry’’. It includes the System of Integrated Environmental and Economic Accounting (SEEA) categories ‘’Land used for aquaculture,’’ ‘’Built-up and related areas, ‘’Land Use for maintenance and restoration of environmental functions,” ‘’Other uses of land not elsewhere classified,’’ and ‘’Land not in use.’’
Area in hectares
Indicator: GHG emissions EX-Ante Carbon-balance Tool (EXACT) Data Requirements
EX-ACT modules to fill Main Impact Area Data RequirementsLand Use Change Module
Reduced CO2 emissions
Carbon Sequestration
Decrease carbon stock
- Forest type and size - Area deforested - Final land use after conversion - Burning during conversion - Type of current land use - Type of future forest - Type of future land use
The 3Returns Framework A method for decision making towards sustainable landscapes
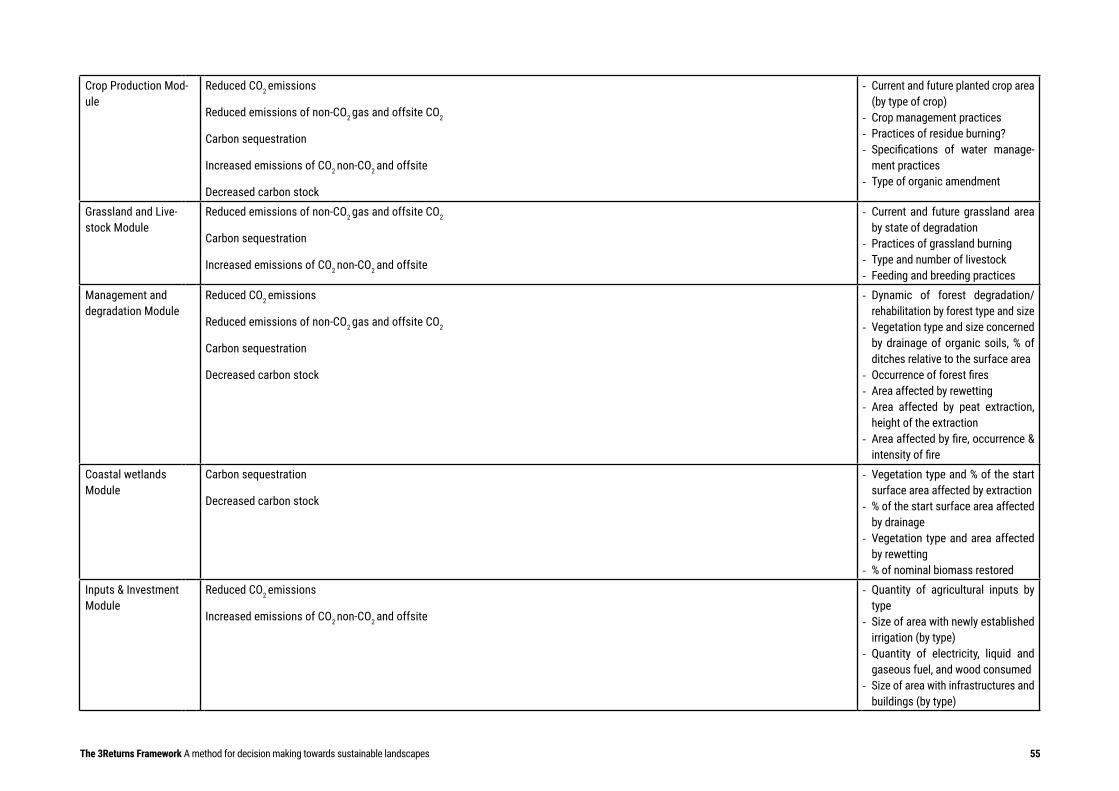
Natural Capital Platforms and Tools for Green Growth Planning 55
Crop Production Mod-ule
Reduced CO2 emissions
Reduced emissions of non-CO2 gas and offsite CO2
Carbon sequestration
Increased emissions of CO2 non-CO2 and offsite
Decreased carbon stock
- Current and future planted crop area (by type of crop)
- Crop management practices- Practices of residue burning?- Specifications of water manage-
ment practices- Type of organic amendment
Grassland and Live-stock Module
Reduced emissions of non-CO2 gas and offsite CO2
Carbon sequestration
Increased emissions of CO2 non-CO2 and offsite
- Current and future grassland area by state of degradation
- Practices of grassland burning- Type and number of livestock- Feeding and breeding practices
Management and degradation Module
Reduced CO2 emissions
Reduced emissions of non-CO2 gas and offsite CO2
Carbon sequestration
Decreased carbon stock
- Dynamic of forest degradation/rehabilitation by forest type and size
- Vegetation type and size concerned by drainage of organic soils, % of ditches relative to the surface area
- Occurrence of forest fires- Area affected by rewetting- Area affected by peat extraction,
height of the extraction- Area affected by fire, occurrence &
intensity of fireCoastal wetlands Module
Carbon sequestration
Decreased carbon stock
- Vegetation type and % of the start surface area affected by extraction
- % of the start surface area affected by drainage
- Vegetation type and area affected by rewetting
- % of nominal biomass restoredInputs & Investment Module
Reduced CO2 emissions
Increased emissions of CO2 non-CO2 and offsite
- Quantity of agricultural inputs by type
- Size of area with newly established irrigation (by type)
- Quantity of electricity, liquid and gaseous fuel, and wood consumed
- Size of area with infrastructures and buildings (by type)
The 3Returns Framework A method for decision making towards sustainable landscapes
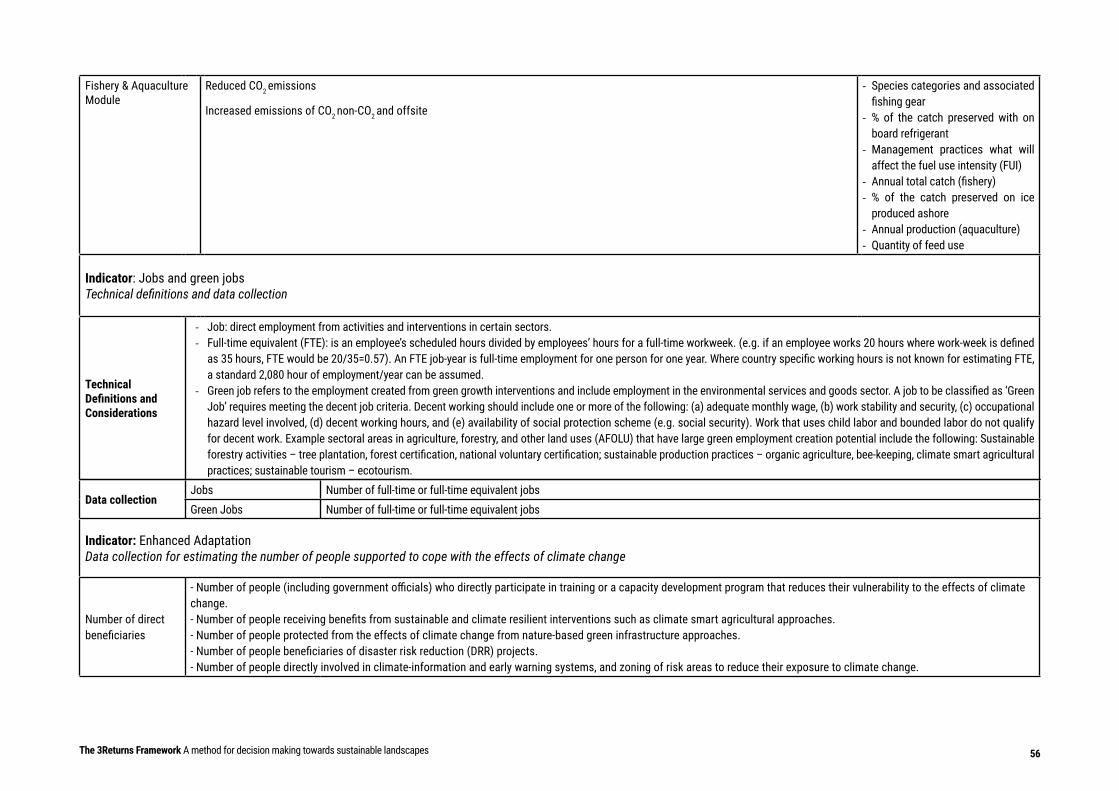
Natural Capital Platforms and Tools for Green Growth Planning 56
Data collectionJobs Number of full-time or full-time equivalent jobsGreen Jobs Number of full-time or full-time equivalent jobs
Indicator: Enhanced Adaptation Data collection for estimating the number of people supported to cope with the effects of climate change
Number of direct beneficiaries
- Number of people (including government officials) who directly participate in training or a capacity development program that reduces their vulnerability to the effects of climate change. - Number of people receiving benefits from sustainable and climate resilient interventions such as climate smart agricultural approaches. - Number of people protected from the effects of climate change from nature-based green infrastructure approaches. - Number of people beneficiaries of disaster risk reduction (DRR) projects. - Number of people directly involved in climate-information and early warning systems, and zoning of risk areas to reduce their exposure to climate change.
The 3Returns Framework A method for decision making towards sustainable landscapes
Fishery & Aquaculture Module
Reduced CO2 emissions
Increased emissions of CO2 non-CO2 and offsite
- Species categories and associated fishing gear
- % of the catch preserved with on board refrigerant
- Management practices what will affect the fuel use intensity (FUI)
- Annual total catch (fishery)- % of the catch preserved on ice
produced ashore- Annual production (aquaculture)- Quantity of feed use
Indicator: Jobs and green jobs Technical definitions and data collection
Technical Definitions and Considerations
- Job: direct employment from activities and interventions in certain sectors.- Full-time equivalent (FTE): is an employee’s scheduled hours divided by employees’ hours for a full-time workweek. (e.g. if an employee works 20 hours where work-week is defined
as 35 hours, FTE would be 20/35=0.57). An FTE job-year is full-time employment for one person for one year. Where country specific working hours is not known for estimating FTE, a standard 2,080 hour of employment/year can be assumed.
- Green job refers to the employment created from green growth interventions and include employment in the environmental services and goods sector. A job to be classified as ‘Green Job’ requires meeting the decent job criteria. Decent working should include one or more of the following: (a) adequate monthly wage, (b) work stability and security, (c) occupational hazard level involved, (d) decent working hours, and (e) availability of social protection scheme (e.g. social security). Work that uses child labor and bounded labor do not qualify for decent work. Example sectoral areas in agriculture, forestry, and other land uses (AFOLU) that have large green employment creation potential include the following: Sustainable forestry activities – tree plantation, forest certification, national voluntary certification; sustainable production practices – organic agriculture, bee-keeping, climate smart agricultural practices; sustainable tourism – ecotourism.
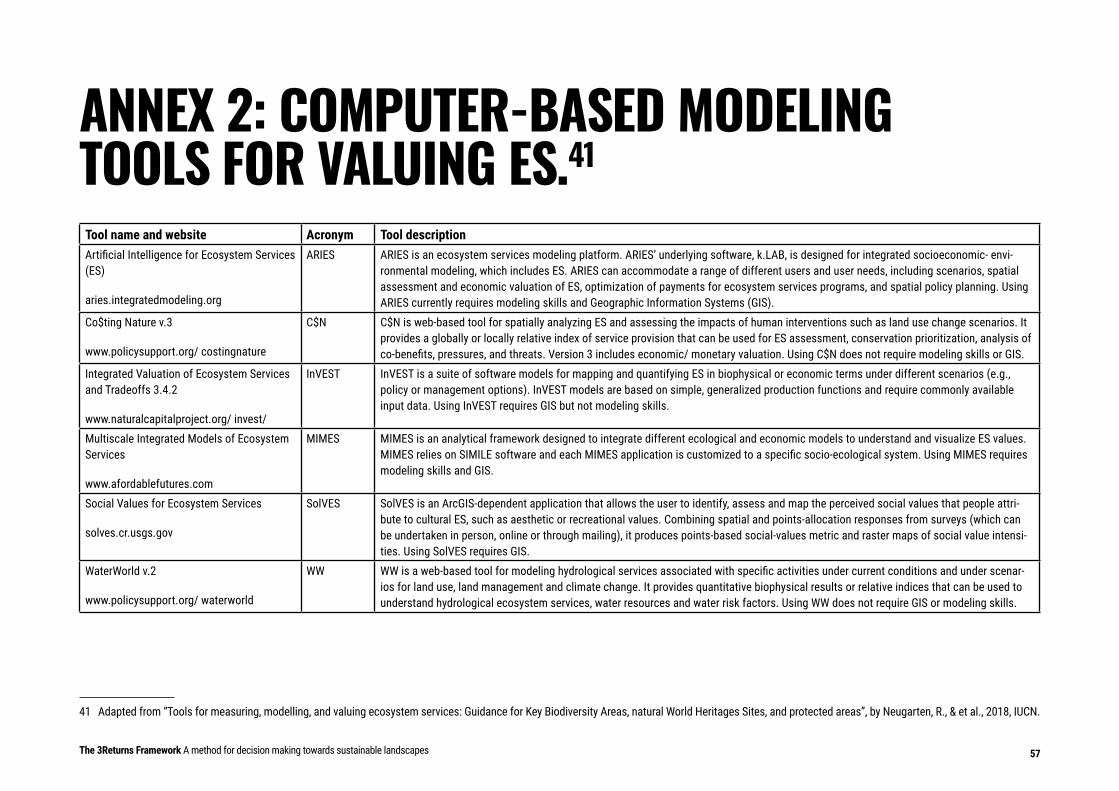
Natural Capital Platforms and Tools for Green Growth Planning 57The 3Returns Framework A method for decision making towards sustainable landscapes
ANNEX 2: COMPUTER-BASED MODELING TOOLS FOR VALUING ES.41
Tool name and website Acronym Tool descriptionArtificial Intelligence for Ecosystem Services (ES)
aries.integratedmodeling.org
ARIES ARIES is an ecosystem services modeling platform. ARIES’ underlying software, k.LAB, is designed for integrated socioeconomic- envi-ronmental modeling, which includes ES. ARIES can accommodate a range of different users and user needs, including scenarios, spatial assessment and economic valuation of ES, optimization of payments for ecosystem services programs, and spatial policy planning. Using ARIES currently requires modeling skills and Geographic Information Systems (GIS).
Co$ting Nature v.3
www.policysupport.org/ costingnature
C$N C$N is web-based tool for spatially analyzing ES and assessing the impacts of human interventions such as land use change scenarios. It provides a globally or locally relative index of service provision that can be used for ES assessment, conservation prioritization, analysis of co-benefits, pressures, and threats. Version 3 includes economic/ monetary valuation. Using C$N does not require modeling skills or GIS.
Integrated Valuation of Ecosystem Services and Tradeoffs 3.4.2
www.naturalcapitalproject.org/ invest/
InVEST InVEST is a suite of software models for mapping and quantifying ES in biophysical or economic terms under different scenarios (e.g., policy or management options). InVEST models are based on simple, generalized production functions and require commonly available input data. Using InVEST requires GIS but not modeling skills.
Multiscale Integrated Models of Ecosystem Services
www.afordablefutures.com
MIMES MIMES is an analytical framework designed to integrate different ecological and economic models to understand and visualize ES values. MIMES relies on SIMILE software and each MIMES application is customized to a specific socio-ecological system. Using MIMES requires modeling skills and GIS.
Social Values for Ecosystem Services
solves.cr.usgs.gov
SolVES SolVES is an ArcGIS-dependent application that allows the user to identify, assess and map the perceived social values that people attri-bute to cultural ES, such as aesthetic or recreational values. Combining spatial and points-allocation responses from surveys (which can be undertaken in person, online or through mailing), it produces points-based social-values metric and raster maps of social value intensi-ties. Using SolVES requires GIS.
WaterWorld v.2
www.policysupport.org/ waterworld
WW WW is a web-based tool for modeling hydrological services associated with specific activities under current conditions and under scenar-ios for land use, land management and climate change. It provides quantitative biophysical results or relative indices that can be used to understand hydrological ecosystem services, water resources and water risk factors. Using WW does not require GIS or modeling skills.
41 Adapted from “Tools for measuring, modelling, and valuing ecosystem services: Guidance for Key Biodiversity Areas, natural World Heritages Sites, and protected areas”, by Neugarten, R., & et al., 2018, IUCN.
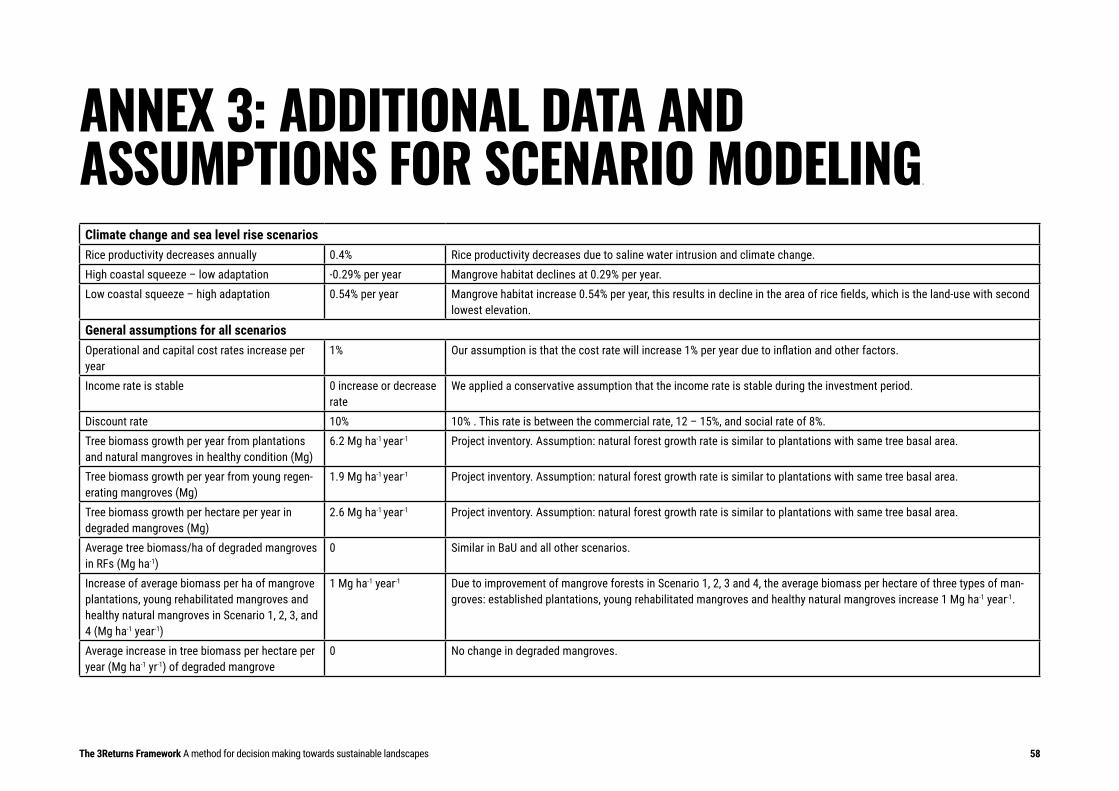
Natural Capital Platforms and Tools for Green Growth Planning 58The 3Returns Framework A method for decision making towards sustainable landscapes
ANNEX 3: ADDITIONAL DATA AND ASSUMPTIONS FOR SCENARIO MODELING.
Climate change and sea level rise scenariosRice productivity decreases annually 0.4% Rice productivity decreases due to saline water intrusion and climate change.High coastal squeeze – low adaptation -0.29% per year Mangrove habitat declines at 0.29% per year.Low coastal squeeze – high adaptation 0.54% per year Mangrove habitat increase 0.54% per year, this results in decline in the area of rice fields, which is the land-use with second
lowest elevation.
General assumptions for all scenariosOperational and capital cost rates increase per year
1% Our assumption is that the cost rate will increase 1% per year due to inflation and other factors.
Income rate is stable 0 increase or decrease rate
We applied a conservative assumption that the income rate is stable during the investment period.
Discount rate 10% 10% . This rate is between the commercial rate, 12 – 15%, and social rate of 8%.Tree biomass growth per year from plantations and natural mangroves in healthy condition (Mg)
6.2 Mg ha-1 year-1 Project inventory. Assumption: natural forest growth rate is similar to plantations with same tree basal area.
Tree biomass growth per year from young regen-erating mangroves (Mg)
1.9 Mg ha-1 year-1 Project inventory. Assumption: natural forest growth rate is similar to plantations with same tree basal area.
Tree biomass growth per hectare per year in degraded mangroves (Mg)
2.6 Mg ha-1 year-1 Project inventory. Assumption: natural forest growth rate is similar to plantations with same tree basal area.
Average tree biomass/ha of degraded mangroves in RFs (Mg ha-1)
0 Similar in BaU and all other scenarios.
Increase of average biomass per ha of mangrove plantations, young rehabilitated mangroves and healthy natural mangroves in Scenario 1, 2, 3, and 4 (Mg ha-1 year-1)
1 Mg ha-1 year-1 Due to improvement of mangrove forests in Scenario 1, 2, 3 and 4, the average biomass per hectare of three types of man-groves: established plantations, young rehabilitated mangroves and healthy natural mangroves increase 1 Mg ha-1 year-1.
Average increase in tree biomass per hectare per year (Mg ha-1 yr-1) of degraded mangrove
0 No change in degraded mangroves.
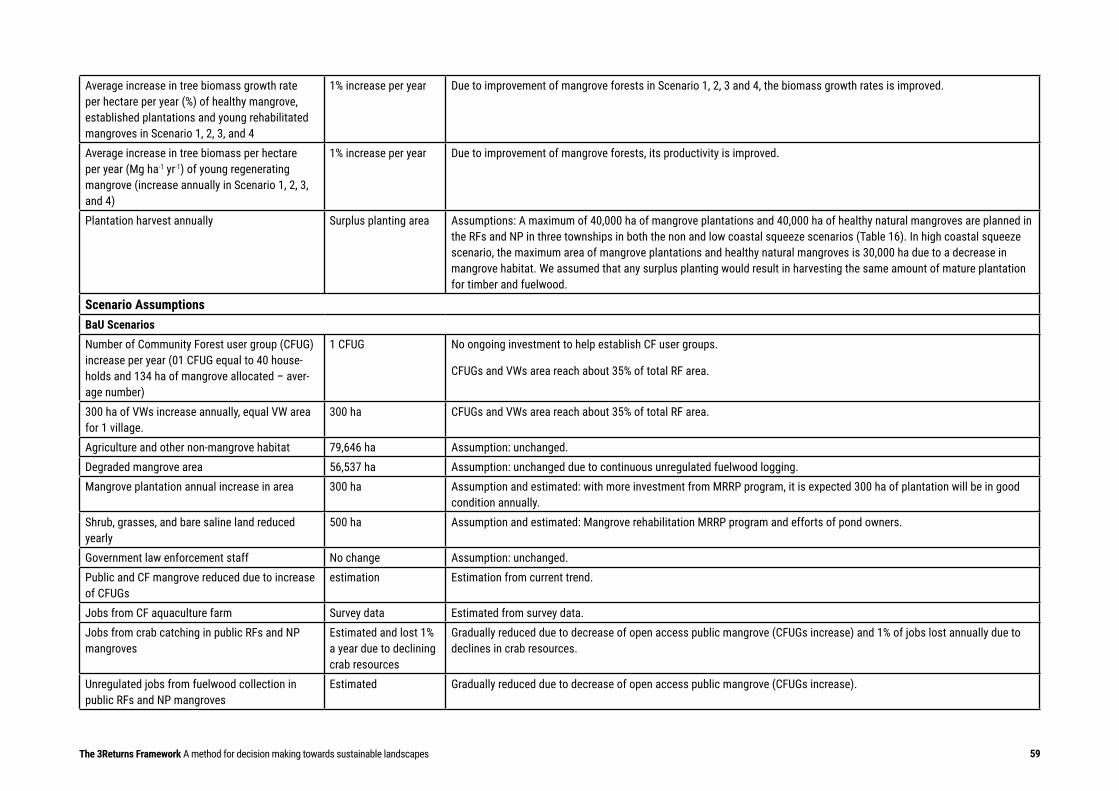
Natural Capital Platforms and Tools for Green Growth Planning 59The 3Returns Framework A method for decision making towards sustainable landscapes
Average increase in tree biomass growth rate per hectare per year (%) of healthy mangrove, established plantations and young rehabilitated mangroves in Scenario 1, 2, 3, and 4
1% increase per year Due to improvement of mangrove forests in Scenario 1, 2, 3 and 4, the biomass growth rates is improved.
Average increase in tree biomass per hectare per year (Mg ha-1 yr-1) of young regenerating mangrove (increase annually in Scenario 1, 2, 3, and 4)
1% increase per year Due to improvement of mangrove forests, its productivity is improved.
Plantation harvest annually Surplus planting area Assumptions: A maximum of 40,000 ha of mangrove plantations and 40,000 ha of healthy natural mangroves are planned in the RFs and NP in three townships in both the non and low coastal squeeze scenarios (Table 16). In high coastal squeeze scenario, the maximum area of mangrove plantations and healthy natural mangroves is 30,000 ha due to a decrease in mangrove habitat. We assumed that any surplus planting would result in harvesting the same amount of mature plantation for timber and fuelwood.
Scenario AssumptionsBaU ScenariosNumber of Community Forest user group (CFUG) increase per year (01 CFUG equal to 40 house-holds and 134 ha of mangrove allocated – aver-age number)
1 CFUG No ongoing investment to help establish CF user groups.
CFUGs and VWs area reach about 35% of total RF area.
300 ha of VWs increase annually, equal VW area for 1 village.
300 ha CFUGs and VWs area reach about 35% of total RF area.
Agriculture and other non-mangrove habitat 79,646 ha Assumption: unchanged.Degraded mangrove area 56,537 ha Assumption: unchanged due to continuous unregulated fuelwood logging.Mangrove plantation annual increase in area 300 ha Assumption and estimated: with more investment from MRRP program, it is expected 300 ha of plantation will be in good
condition annually.Shrub, grasses, and bare saline land reduced yearly
500 ha Assumption and estimated: Mangrove rehabilitation MRRP program and efforts of pond owners.
Government law enforcement staff No change Assumption: unchanged.Public and CF mangrove reduced due to increase of CFUGs
estimation Estimation from current trend.
Jobs from CF aquaculture farm Survey data Estimated from survey data.Jobs from crab catching in public RFs and NP mangroves
Estimated and lost 1% a year due to declining crab resources
Gradually reduced due to decrease of open access public mangrove (CFUGs increase) and 1% of jobs lost annually due to declines in crab resources.
Unregulated jobs from fuelwood collection in public RFs and NP mangroves
Estimated Gradually reduced due to decrease of open access public mangrove (CFUGs increase).
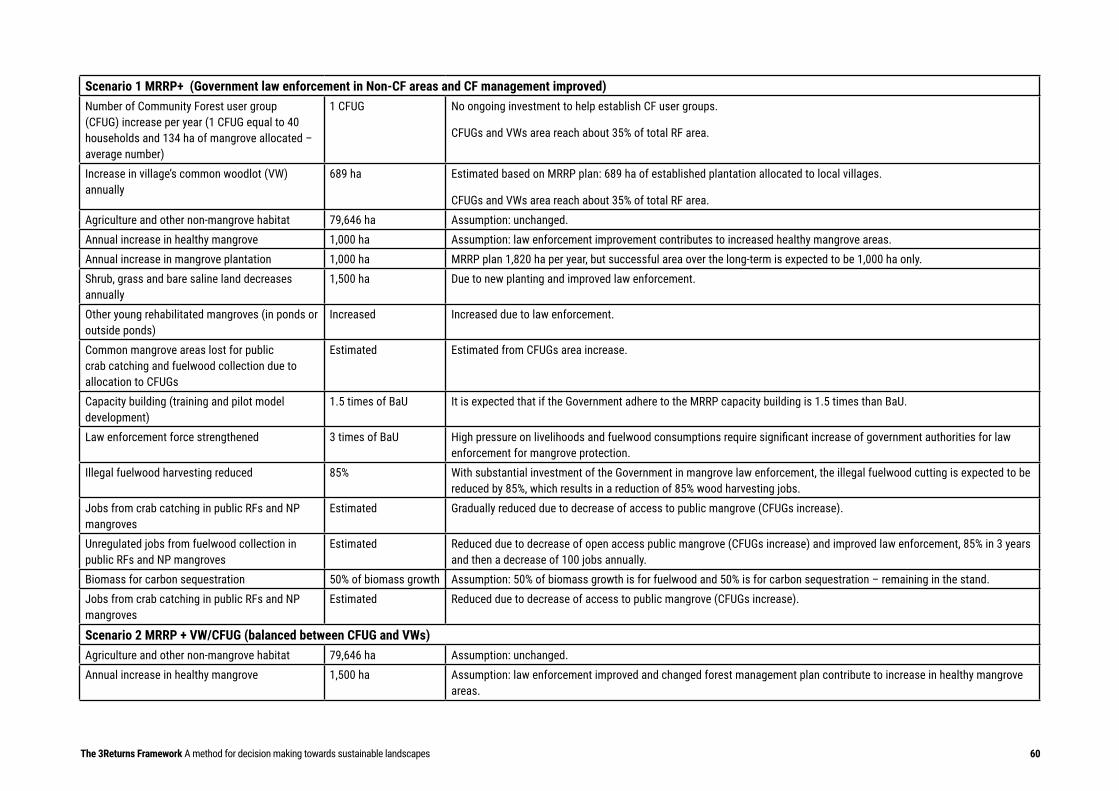
Natural Capital Platforms and Tools for Green Growth Planning 60
Scenario 1 MRRP+ (Government law enforcement in Non-CF areas and CF management improved) Number of Community Forest user group (CFUG) increase per year (1 CFUG equal to 40 households and 134 ha of mangrove allocated – average number)
1 CFUG No ongoing investment to help establish CF user groups.
CFUGs and VWs area reach about 35% of total RF area.
Increase in village’s common woodlot (VW) annually
689 ha Estimated based on MRRP plan: 689 ha of established plantation allocated to local villages.
CFUGs and VWs area reach about 35% of total RF area.Agriculture and other non-mangrove habitat 79,646 ha Assumption: unchanged.Annual increase in healthy mangrove 1,000 ha Assumption: law enforcement improvement contributes to increased healthy mangrove areas.Annual increase in mangrove plantation 1,000 ha MRRP plan 1,820 ha per year, but successful area over the long-term is expected to be 1,000 ha only.Shrub, grass and bare saline land decreases annually
1,500 ha Due to new planting and improved law enforcement.
Other young rehabilitated mangroves (in ponds or outside ponds)
Increased Increased due to law enforcement.
Common mangrove areas lost for public crab catching and fuelwood collection due to allocation to CFUGs
Estimated Estimated from CFUGs area increase.
Capacity building (training and pilot model development)
1.5 times of BaU It is expected that if the Government adhere to the MRRP capacity building is 1.5 times than BaU.
Law enforcement force strengthened 3 times of BaU High pressure on livelihoods and fuelwood consumptions require significant increase of government authorities for law enforcement for mangrove protection.
Illegal fuelwood harvesting reduced 85% With substantial investment of the Government in mangrove law enforcement, the illegal fuelwood cutting is expected to be reduced by 85%, which results in a reduction of 85% wood harvesting jobs.
Jobs from crab catching in public RFs and NP mangroves
Estimated Gradually reduced due to decrease of access to public mangrove (CFUGs increase).
Unregulated jobs from fuelwood collection in public RFs and NP mangroves
Estimated Reduced due to decrease of open access public mangrove (CFUGs increase) and improved law enforcement, 85% in 3 years and then a decrease of 100 jobs annually.
Biomass for carbon sequestration 50% of biomass growth Assumption: 50% of biomass growth is for fuelwood and 50% is for carbon sequestration – remaining in the stand.Jobs from crab catching in public RFs and NP mangroves
Estimated Reduced due to decrease of access to public mangrove (CFUGs increase).
Scenario 2 MRRP + VW/CFUG (balanced between CFUG and VWs)Agriculture and other non-mangrove habitat 79,646 ha Assumption: unchanged.Annual increase in healthy mangrove 1,500 ha Assumption: law enforcement improved and changed forest management plan contribute to increase in healthy mangrove
areas.
The 3Returns Framework A method for decision making towards sustainable landscapes
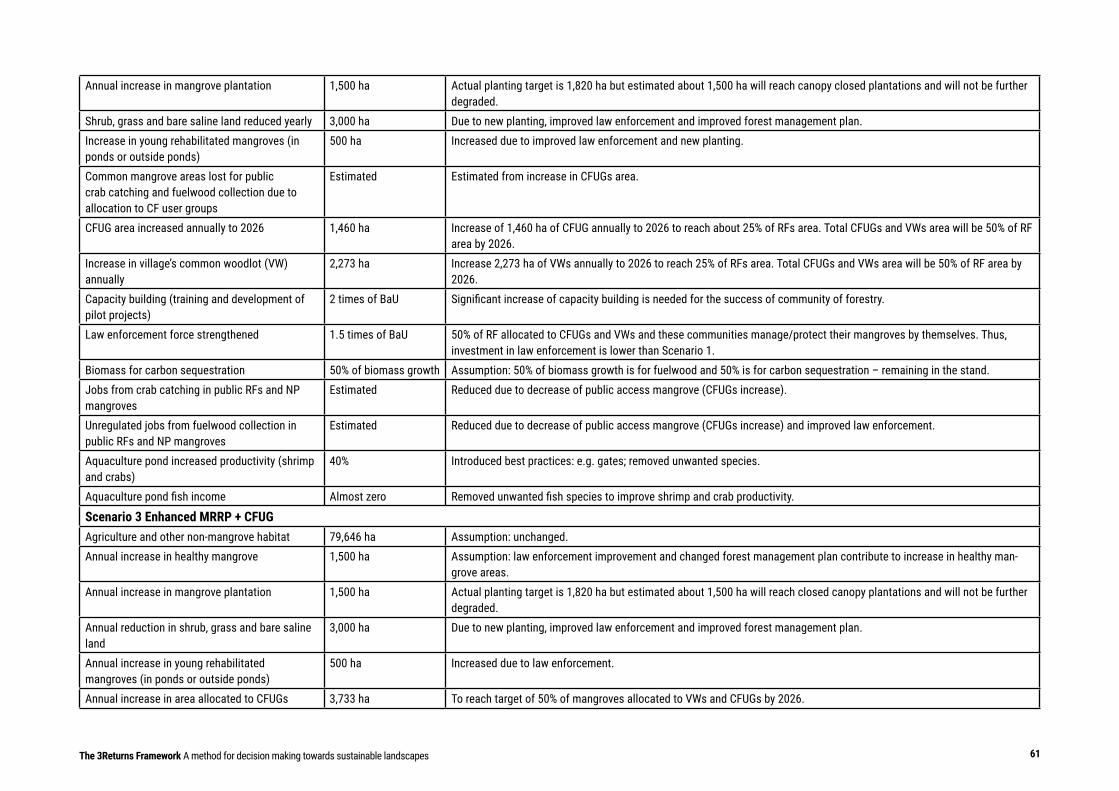
Natural Capital Platforms and Tools for Green Growth Planning 61The 3Returns Framework A method for decision making towards sustainable landscapes
Annual increase in mangrove plantation 1,500 ha Actual planting target is 1,820 ha but estimated about 1,500 ha will reach canopy closed plantations and will not be further degraded.
Shrub, grass and bare saline land reduced yearly 3,000 ha Due to new planting, improved law enforcement and improved forest management plan.Increase in young rehabilitated mangroves (in ponds or outside ponds)
500 ha Increased due to improved law enforcement and new planting.
Common mangrove areas lost for public crab catching and fuelwood collection due to allocation to CF user groups
Estimated Estimated from increase in CFUGs area.
CFUG area increased annually to 2026 1,460 ha Increase of 1,460 ha of CFUG annually to 2026 to reach about 25% of RFs area. Total CFUGs and VWs area will be 50% of RF area by 2026.
Increase in village’s common woodlot (VW) annually
2,273 ha Increase 2,273 ha of VWs annually to 2026 to reach 25% of RFs area. Total CFUGs and VWs area will be 50% of RF area by 2026.
Capacity building (training and development of pilot projects)
2 times of BaU Significant increase of capacity building is needed for the success of community of forestry.
Law enforcement force strengthened 1.5 times of BaU 50% of RF allocated to CFUGs and VWs and these communities manage/protect their mangroves by themselves. Thus, investment in law enforcement is lower than Scenario 1.
Biomass for carbon sequestration 50% of biomass growth Assumption: 50% of biomass growth is for fuelwood and 50% is for carbon sequestration – remaining in the stand.Jobs from crab catching in public RFs and NP mangroves
Estimated Reduced due to decrease of public access mangrove (CFUGs increase).
Unregulated jobs from fuelwood collection in public RFs and NP mangroves
Estimated Reduced due to decrease of public access mangrove (CFUGs increase) and improved law enforcement.
Aquaculture pond increased productivity (shrimp and crabs)
40% Introduced best practices: e.g. gates; removed unwanted species.
Aquaculture pond fish income Almost zero Removed unwanted fish species to improve shrimp and crab productivity.
Scenario 3 Enhanced MRRP + CFUGAgriculture and other non-mangrove habitat 79,646 ha Assumption: unchanged.Annual increase in healthy mangrove 1,500 ha Assumption: law enforcement improvement and changed forest management plan contribute to increase in healthy man-
grove areas.Annual increase in mangrove plantation 1,500 ha Actual planting target is 1,820 ha but estimated about 1,500 ha will reach closed canopy plantations and will not be further
degraded.Annual reduction in shrub, grass and bare saline land
3,000 ha Due to new planting, improved law enforcement and improved forest management plan.
Annual increase in young rehabilitated mangroves (in ponds or outside ponds)
500 ha Increased due to law enforcement.
Annual increase in area allocated to CFUGs 3,733 ha To reach target of 50% of mangroves allocated to VWs and CFUGs by 2026.
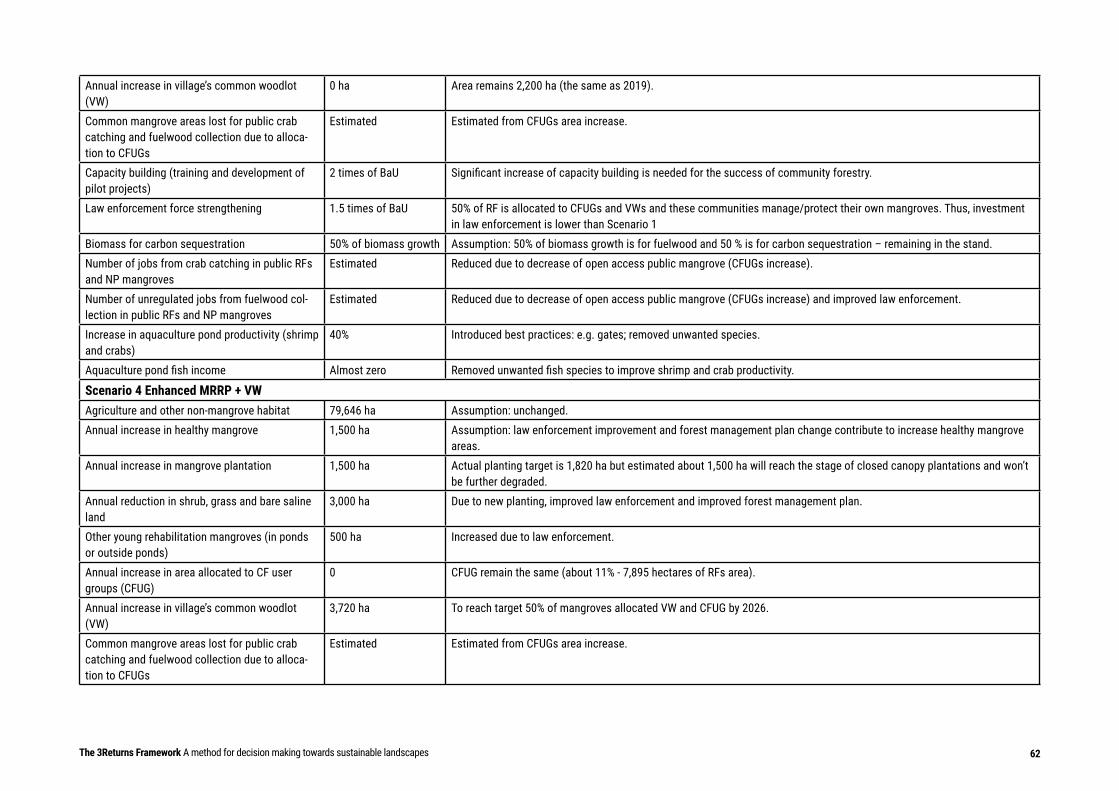
Natural Capital Platforms and Tools for Green Growth Planning 62
Annual increase in village’s common woodlot (VW)
0 ha Area remains 2,200 ha (the same as 2019).
Common mangrove areas lost for public crab catching and fuelwood collection due to alloca-tion to CFUGs
Estimated Estimated from CFUGs area increase.
Capacity building (training and development of pilot projects)
2 times of BaU Significant increase of capacity building is needed for the success of community forestry.
Law enforcement force strengthening 1.5 times of BaU 50% of RF is allocated to CFUGs and VWs and these communities manage/protect their own mangroves. Thus, investment in law enforcement is lower than Scenario 1
Biomass for carbon sequestration 50% of biomass growth Assumption: 50% of biomass growth is for fuelwood and 50 % is for carbon sequestration – remaining in the stand.Number of jobs from crab catching in public RFs and NP mangroves
Estimated Reduced due to decrease of open access public mangrove (CFUGs increase).
Number of unregulated jobs from fuelwood col-lection in public RFs and NP mangroves
Estimated Reduced due to decrease of open access public mangrove (CFUGs increase) and improved law enforcement.
Increase in aquaculture pond productivity (shrimp and crabs)
40% Introduced best practices: e.g. gates; removed unwanted species.
Aquaculture pond fish income Almost zero Removed unwanted fish species to improve shrimp and crab productivity.
Scenario 4 Enhanced MRRP + VWAgriculture and other non-mangrove habitat 79,646 ha Assumption: unchanged.Annual increase in healthy mangrove 1,500 ha Assumption: law enforcement improvement and forest management plan change contribute to increase healthy mangrove
areas.Annual increase in mangrove plantation 1,500 ha Actual planting target is 1,820 ha but estimated about 1,500 ha will reach the stage of closed canopy plantations and won’t
be further degraded.Annual reduction in shrub, grass and bare saline land
3,000 ha Due to new planting, improved law enforcement and improved forest management plan.
Other young rehabilitation mangroves (in ponds or outside ponds)
500 ha Increased due to law enforcement.
Annual increase in area allocated to CF user groups (CFUG)
0 CFUG remain the same (about 11% - 7,895 hectares of RFs area).
Annual increase in village’s common woodlot (VW)
3,720 ha To reach target 50% of mangroves allocated VW and CFUG by 2026.
Common mangrove areas lost for public crab catching and fuelwood collection due to alloca-tion to CFUGs
Estimated Estimated from CFUGs area increase.
The 3Returns Framework A method for decision making towards sustainable landscapes
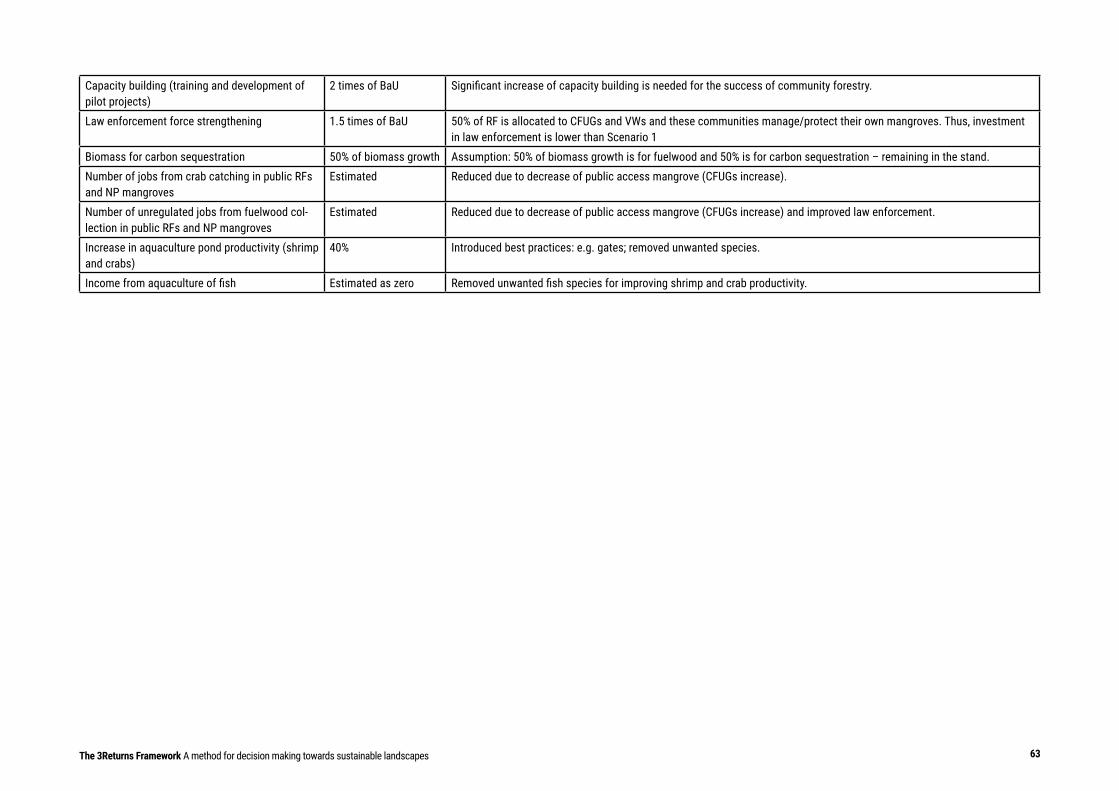
Natural Capital Platforms and Tools for Green Growth Planning 63The 3Returns Framework A method for decision making towards sustainable landscapes
Capacity building (training and development of pilot projects)
2 times of BaU Significant increase of capacity building is needed for the success of community forestry.
Law enforcement force strengthening 1.5 times of BaU 50% of RF is allocated to CFUGs and VWs and these communities manage/protect their own mangroves. Thus, investment in law enforcement is lower than Scenario 1
Biomass for carbon sequestration 50% of biomass growth Assumption: 50% of biomass growth is for fuelwood and 50% is for carbon sequestration – remaining in the stand.Number of jobs from crab catching in public RFs and NP mangroves
Estimated Reduced due to decrease of public access mangrove (CFUGs increase).
Number of unregulated jobs from fuelwood col-lection in public RFs and NP mangroves
Estimated Reduced due to decrease of public access mangrove (CFUGs increase) and improved law enforcement.
Increase in aquaculture pond productivity (shrimp and crabs)
40% Introduced best practices: e.g. gates; removed unwanted species.
Income from aquaculture of fish Estimated as zero Removed unwanted fish species for improving shrimp and crab productivity.
The 3Returns Framework A method for decision making towards sustainable landscapes 64
JOIN THE PARTNERSHIPggkp.org/Join
SHARE NEW [email protected]
SUBSCRIBE TO THE NEWSLETTERggkp.org/Subscribe
ENGAGE ON SOCIAL MEDIAggkp.org/Facebookggkp.org/LinkedIn@GGKPlatform@GGKP_Industry@GGKP_Finance
Related Documents