THE 2017 OHIO SOYBEAN PERFORMANCE TRIALS INTRODUCTION The purpose of the Ohio Soybean Performance Trials is to evaluate soybean varieties for yield and other agronomic characteristics. This evaluation gives soybean producers comparative information for selecting the best varieties for their unique production systems. FIELD PLOT DESIGN The entries for each test site were planted in a randomized complete-block design. Each entry was replicated four times and planted in plots 28 ft. long and 5 ft. wide containing four rows seeded at 15-inch row width. Seeding rate was 150,000 seeds per acre. All sites had corn as the previous crop and received no tillage prior to soybean planting. Famer cooperators sprayed preemergence herbicides (varied by location). Postemergence herbicides included: Basagran, Flex Star, First Rate, and Select Max. The C2 location was too wet for POST herbicide application and was hand-weeded. METHOD OF CONDUCTING TRIALS Entries in Trials. Performance of entries in The Ohio Soybean Perfor- mance Trials are published if seed will be available to Ohio soybean pro- ducers for the following planting season. All 2017 entries were submitted voluntarily by seed companies. Entry fee charges were paid per entry and region. Trial data were not published for the N1 (Henry County) location due to extremely variable yield from wet field conditions in the spring fol- lowed by dry weather. Test by Maturity and Type. Varieties are grouped, tested and analyzed by maturity (early and late). Conventional, Liberty Link, Roundup Ready, and Xtend varieties were tested in the same block to allow for head-to-head comparisons. Conventional herbicides were sprayed on all entries. Conven- tional, Liberty Link, Roundup Ready, and Xtend entries are statistically comparable within a maturity grouping (early or late). Use the table below to find varieties by region, maturity, and type. Wayde Looker, Matthew Hankinson, John McCormick, and Laura Lindsey Department of Horticulture and Crop Science Ohio State University Extension and OARDC MEASUREMENTS AND RECORDS Relative Maturity. Relative maturity is a rating designed to account for all of the factors that affect maturity date and includes variety, planting date, weather, latitude, and disease. Maturity is defined as the “95% brown pods” stage. A variety with a Relative Maturity rating of 3.5 will reach the 95% brown pod stage 5 days later than a variety with a rating of 3.0. Relative maturity was submitted by seed companies. Lodging Score. There was limited lodging at all trial locations except S2 (Clinton County). Lodging was rated at the S2 location at harvest using the scale: 1 = nearly all plants erect, 2 = most plants leaning slightly, 3 = most plants leaning moderately (45° angle), 4 = most plants horizontal, 5 = 80% or more of the plants down on the soil surface. Seed Size is reported as number of seeds per pound. Yield. Each soybean variety was harvested when the moisture content was between 8 and 14 percent and yields reported in bushels per acre at 13 per- cent moisture. Protein, Oil, Fiber %. Analysis was determined by near infrared transmit- tance technology. The test was performed using a Tecator Infratec whole grain analyzer calibrated with the Composition Systems Calibration devel- oped at Iowa State University and is reported at 13 percent moisture. LSD. A Least Significant Difference (LSD) for yield was computed for each maturity group. LSD's are reported in bushels per acre at 13 percent moisture. Yields of two varieties within a maturity group are significantly different 90% of the time if their yields differ by more than the LSD value shown for that maturity group. A double asterisk (**) is used to denote the variety with the highest yield within a region and maturity grouping. A sin- gle asterisk (*) is used to denote varieties with yield not statistically differ- ent than the highest yielding variety. 2017 Tables by Type, Region, Maturity Grouping Conventional, Liberty Link, Roundup Ready, and Xtend North Early (2.3-3.0) Table 3 Late (3.1-3.9) Table 4 Conventional, Liberty Link, Roundup Ready, and Xtend Central Early (2.5-3.3) Table 5 Late (3.4-3.9) Table 6 Conventional, Liberty Link, Roundup Ready, and Xtend South Early (3.2-3.6) Table 7 Late (3.7-4.3) Table 8 Table 1: The 2017 Ohio Soybean Performance Trials, Site Descriptions N2 C1 C2 S1 S2 Sandusky Co. Mercer Co. Marion Co. Preble Co. Clinton Co. Soil texture Clay Silty clay loam Clay loam Silty clay Silt loam Soil pH 6.5 6.8 6.3 6.0 6.6 Soil Test P-Mehlich (ppm) 17 89 28 92 116 Soil Test K (ppm) 118 150 168 188 203 Plant date 19-May 7-Jun 17-May 30-May 16-May Harvest date 19-Oct 21-Oct 2-Oct (early); 4-Oct (late) 17-Oct 16-Oct

Welcome message from author
This document is posted to help you gain knowledge. Please leave a comment to let me know what you think about it! Share it to your friends and learn new things together.
Transcript
THE 2017 OHIO SOYBEAN PERFORMANCE TRIALS
INTRODUCTION
The purpose of the Ohio Soybean Performance Trials is to evaluate soybean
varieties for yield and other agronomic characteristics. This evaluation gives
soybean producers comparative information for selecting the best varieties
for their unique production systems.
FIELD PLOT DESIGN
The entries for each test site were planted in a randomized complete-block
design. Each entry was replicated four times and planted in plots 28 ft. long
and 5 ft. wide containing four rows seeded at 15-inch row width. Seeding
rate was 150,000 seeds per acre. All sites had corn as the previous crop and
received no tillage prior to soybean planting. Famer cooperators sprayed
preemergence herbicides (varied by location). Postemergence herbicides
included: Basagran, Flex Star, First Rate, and Select Max. The C2 location
was too wet for POST herbicide application and was hand-weeded.
METHOD OF CONDUCTING TRIALS
Entries in Trials. Performance of entries in The Ohio Soybean Perfor-
mance Trials are published if seed will be available to Ohio soybean pro-
ducers for the following planting season. All 2017 entries were submitted
voluntarily by seed companies. Entry fee charges were paid per entry and
region. Trial data were not published for the N1 (Henry County) location
due to extremely variable yield from wet field conditions in the spring fol-
lowed by dry weather.
Test by Maturity and Type. Varieties are grouped, tested and analyzed by
maturity (early and late). Conventional, Liberty Link, Roundup Ready, and
Xtend varieties were tested in the same block to allow for head-to-head
comparisons. Conventional herbicides were sprayed on all entries. Conven-
tional, Liberty Link, Roundup Ready, and Xtend entries are statistically
comparable within a maturity grouping (early or late). Use the table below
to find varieties by region, maturity, and type.
Wayde Looker, Matthew Hankinson, John McCormick, and Laura Lindsey
Department of Horticulture and Crop Science
Ohio State University Extension and OARDC
MEASUREMENTS AND RECORDS
Relative Maturity. Relative maturity is a rating designed to account for all
of the factors that affect maturity date and includes variety, planting date,
weather, latitude, and disease. Maturity is defined as the “95% brown pods”
stage. A variety with a Relative Maturity rating of 3.5 will reach the 95%
brown pod stage 5 days later than a variety with a rating of 3.0. Relative
maturity was submitted by seed companies.
Lodging Score. There was limited lodging at all trial locations except S2
(Clinton County). Lodging was rated at the S2 location at harvest using the
scale: 1 = nearly all plants erect, 2 = most plants leaning slightly, 3 = most
plants leaning moderately (45° angle), 4 = most plants horizontal, 5 = 80%
or more of the plants down on the soil surface.
Seed Size is reported as number of seeds per pound.
Yield. Each soybean variety was harvested when the moisture content was
between 8 and 14 percent and yields reported in bushels per acre at 13 per-
cent moisture.
Protein, Oil, Fiber %. Analysis was determined by near infrared transmit-
tance technology. The test was performed using a Tecator Infratec whole
grain analyzer calibrated with the Composition Systems Calibration devel-
oped at Iowa State University and is reported at 13 percent moisture.
LSD. A Least Significant Difference (LSD) for yield was computed for
each maturity group. LSD's are reported in bushels per acre at 13 percent
moisture. Yields of two varieties within a maturity group are significantly
different 90% of the time if their yields differ by more than the LSD value
shown for that maturity group. A double asterisk (**) is used to denote the
variety with the highest yield within a region and maturity grouping. A sin-
gle asterisk (*) is used to denote varieties with yield not statistically differ-
ent than the highest yielding variety.
2017 Tables by Type, Region, Maturity Grouping
Conventional, Liberty
Link, Roundup Ready,
and Xtend
North Early (2.3-3.0) Table 3
Late (3.1-3.9) Table 4
Conventional, Liberty
Link, Roundup Ready,
and Xtend
Central Early (2.5-3.3) Table 5
Late (3.4-3.9) Table 6
Conventional, Liberty
Link, Roundup Ready,
and Xtend
South Early (3.2-3.6) Table 7
Late (3.7-4.3) Table 8
Table 1: The 2017 Ohio Soybean Performance Trials, Site Descriptions
N2 C1 C2 S1 S2
Sandusky Co. Mercer Co. Marion Co. Preble Co. Clinton Co.
Soil texture Clay Silty clay loam Clay loam Silty clay Silt loam
Soil pH 6.5 6.8 6.3 6.0 6.6
Soil Test P-Mehlich (ppm) 17 89 28 92 116
Soil Test K (ppm) 118 150 168 188 203
Plant date 19-May 7-Jun 17-May 30-May 16-May
Harvest date 19-Oct 21-Oct 2-Oct (early); 4-Oct (late) 17-Oct 16-Oct


TABLE 3: The 2017 Ohio Soybean Performance Trials, North Region - Early Varieties (RM 2.3-3.0) Entry Physical Characteristics
Brand/Variety Company Name Type Rel. Mat. Seeds/lb. % Protein % Oil % Fiber N2 '16-'17 Mean
NK S29-K3X NK Xtend 2.9 58.5**
AGI 26RY2 Advanced Genetics Inc RR2Y 2.6 58.2*
SC 9238R Seed Consultants Inc GT 2.3 57.5*
HS 25X70 Growmark Xtend 2.5 56.5*
W 5826 Wellman Seeds Xtend 2.6 55.9*
Illini 2904N Ohio Foundation Seeds Conv. 2.9 54.8*
AGI 27M05 Advanced Genetics Inc GT 2.7 54.7*
Shur Grow SG-2714R2R Shur Grow RR2Y 2.7 54.0*
G2801RX Agrigold Xtend 2.8 53.4*
CZ 2878 EXP Bayer/Credenz EXP 2.8 53.4*
Dyna-Gro S30XT96 Dyna-Gro Seed Xtend 3.0 53.3*
W 5828 Wellman Seeds Xtend 2.8 53.2*
W 295 Wellman Seeds Conv. 2.6 53.1* 56.4
Shur Grow SG-3026R2X Shur Grow Xtend 3.0 53.0* 56.0
Stewart 2827R2X Stewart Seeds Xtend 2.8 52.7*
GH2981X Golden Harvest Xtend 2.9 52.7*
Dyna-Gro S29LL18 Dyna-Gro Seed Liberty 2.9 52.5*
AG30X8 Asgrow Xtend 3.0 52.5*
Dyna-Gro S26XT88 Dyna-Gro Seed Xtend 2.6 52.0*
AG27X7 Asgrow Xtend 2.7 52.0*
Shur Grow SG-2815R2R Shur Grow RR2Y 2.8 52.0* 53.2
Key 1829L AGRA Solutions LLC Liberty 2.9 51.9*
AGI 2601RX Advanced Genetics Inc Xtend 2.6 51.4 53.9
Summit Ohio Foundation Seeds Conv. 2.6 50.4 51.2
G2900RX Agrigold Xtend 2.9 50.0
AGI 28RY3 Advanced Genetics Inc RR2Y 2.8 49.9 54.7
AGI 30M08 Advanced Genetics Inc GT 3.0 49.9 56.1
CZ 2810 LL Bayer/Credenz Liberty 2.8 49.8 55.8
Stewart 2838R2X Stewart Seeds Xtend 2.8 49.5
Shur Grow SG-2728R2X Shur Grow Xtend 2.7 48.8
Ebberts 288R2X Ebberts Field Seeds Xtend 2.8 48.8
HS 28C70 Growmark Conv. 2.8 48.8
CZ 2558 EXP Bayer/Credenz EXP 2.5 48.6
Ebberts 306R2X Ebberts Field Seeds Xtend 3.0 48.6 53.0
GL 2870NRX Great Lakes Hybrids Xtend 2.8 48.5
Rupp RS7283 Rupp Seeds RR2Y 2.8 48.4 51.4
Rupp RS26XT00 Rupp Seeds Xtend 2.6 48.2
Rupp RS28XT22 Rupp Seeds Xtend 2.8 48.0
NuTech 3252L NuTech Seed, LLC Liberty 2.5 47.9 51.0
CZ 2601 LL Bayer/Credenz Liberty 2.6 47.8
HS 30X70 Growmark Xtend 3.0 47.8
AGI 2801RX Advanced Genetics Inc Xtend 2.8 47.7
DSR-3028/R2Y Dairyland Seed RR2Y 3.0 47.7
Rupp RS24XT53 Rupp Seeds Xtend 2.4 47.5
Dyna-Gro S28XT58 Dyna-Gro Seed Xtend 2.8 47.5
Beck's 2899X2 Beck’s Hybrids Xtend 2.8 47.0
NuTech 3309L NuTech Seed, LLC Liberty 3.0 46.9
NuTech 3273L NuTech Seed, LLC Liberty 2.7 46.6
AGI 28LL01 Advanced Genetics Inc Liberty 2.8 46.6
Dyna-Gro S2908N Dyna-Gro Seed Conv. 2.9 46.6
Illini 3025 Ohio Foundation Seeds Conv. 3.0 46.5
AG30X6 Asgrow Xtend 3.0 46.1
SC 9295RR Seed Consultants Inc RR2Y 2.9 46.0 51.6
GL 3055NRX Great Lakes Hybrids Xtend 3.0 45.2
Rupp RS7242 Rupp Seeds RR2Y 2.4 44.8 48.0
DSR-2909/R2Y Dairyland Seed RR2Y 2.9 44.7 50.4
AGI 3002RX Advanced Genetics Inc Xtend 3.0 44.7
AGI 29RY3 Advanced Genetics Inc RR2Y 2.9 43.7
LG C2888RX LG Seeds Xtend 2.8 43.5
Wyandot14 Ohio Foundation Seeds Conv. 2.9 43.5
W 5829 Wellman Seeds Xtend 2.9 43.0
NOTE: North Region, Early Variety Trial Results are Continued on the Next Page.
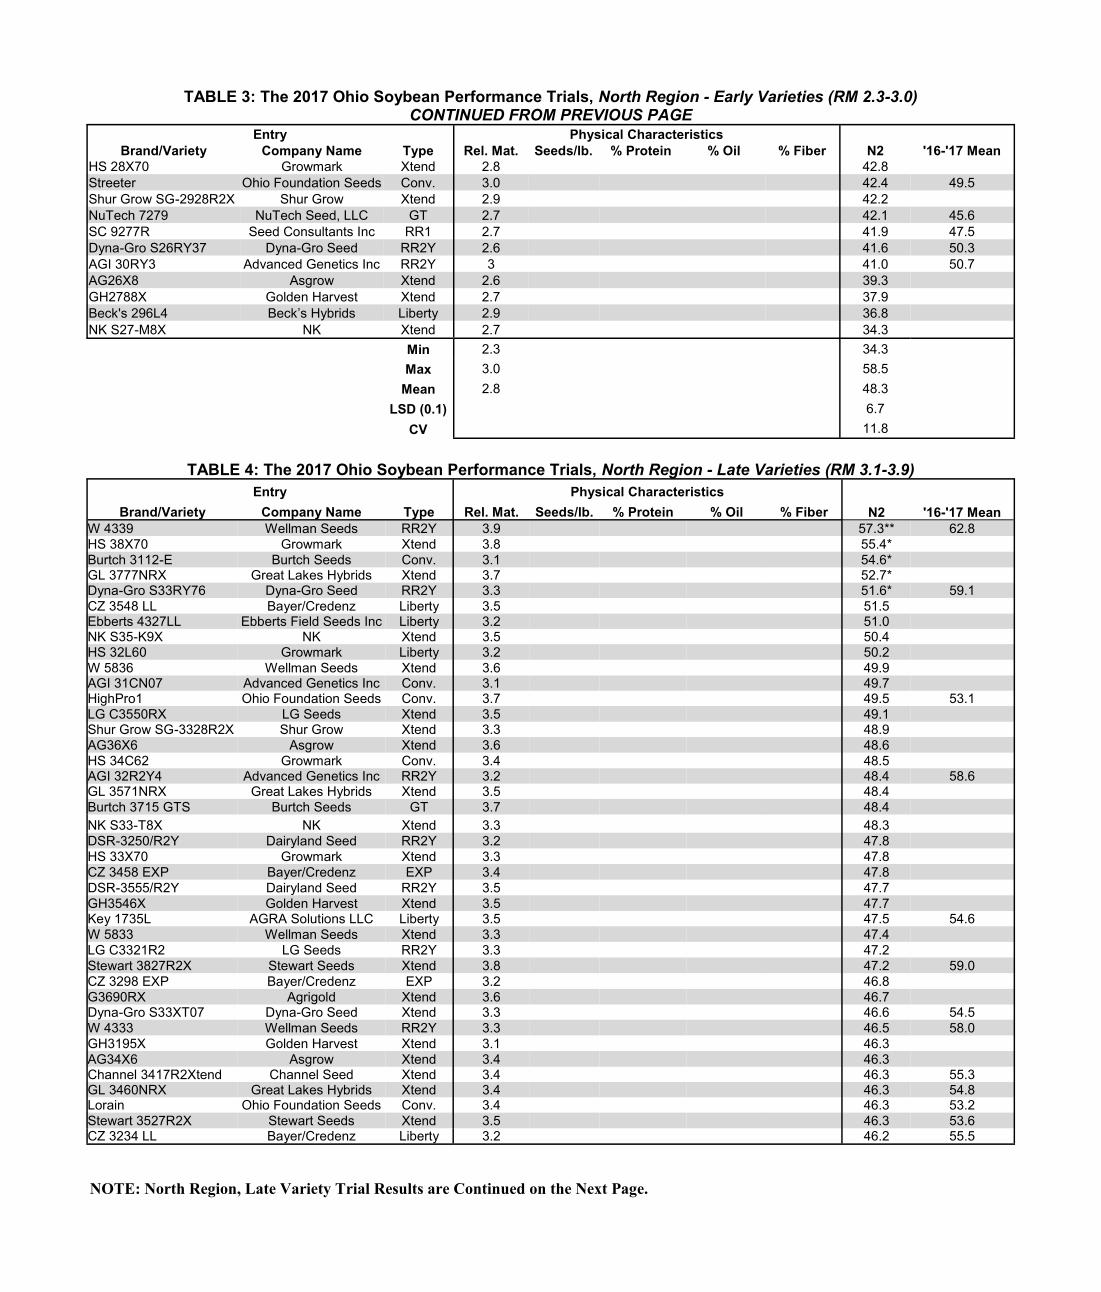
TABLE 3: The 2017 Ohio Soybean Performance Trials, North Region - Early Varieties (RM 2.3-3.0) CONTINUED FROM PREVIOUS PAGE
Entry Physical Characteristics
Brand/Variety Company Name Type Rel. Mat. Seeds/lb. % Protein % Oil % Fiber N2 '16-'17 Mean
HS 28X70 Growmark Xtend 2.8 42.8
Streeter Ohio Foundation Seeds Conv. 3.0 42.4 49.5
Shur Grow SG-2928R2X Shur Grow Xtend 2.9 42.2
NuTech 7279 NuTech Seed, LLC GT 2.7 42.1 45.6
SC 9277R Seed Consultants Inc RR1 2.7 41.9 47.5
Dyna-Gro S26RY37 Dyna-Gro Seed RR2Y 2.6 41.6 50.3
AGI 30RY3 Advanced Genetics Inc RR2Y 3 41.0 50.7
AG26X8 Asgrow Xtend 2.6 39.3
GH2788X Golden Harvest Xtend 2.7 37.9
Beck's 296L4 Beck’s Hybrids Liberty 2.9 36.8
NK S27-M8X NK Xtend 2.7 34.3
Min 2.3 34.3
Max 3.0 58.5
Mean 2.8 48.3
LSD (0.1) 6.7
CV 11.8
NOTE: North Region, Late Variety Trial Results are Continued on the Next Page.
TABLE 4: The 2017 Ohio Soybean Performance Trials, North Region - Late Varieties (RM 3.1-3.9)
Entry Physical Characteristics
Brand/Variety Company Name Type Rel. Mat. Seeds/lb. % Protein % Oil % Fiber N2 '16-'17 Mean
W 4339 Wellman Seeds RR2Y 3.9 57.3** 62.8
HS 38X70 Growmark Xtend 3.8 55.4*
Burtch 3112-E Burtch Seeds Conv. 3.1 54.6* GL 3777NRX Great Lakes Hybrids Xtend 3.7 52.7* Dyna-Gro S33RY76 Dyna-Gro Seed RR2Y 3.3 51.6* 59.1
CZ 3548 LL Bayer/Credenz Liberty 3.5 51.5 Ebberts 4327LL Ebberts Field Seeds Inc Liberty 3.2 51.0 NK S35-K9X NK Xtend 3.5 50.4 HS 32L60 Growmark Liberty 3.2 50.2
W 5836 Wellman Seeds Xtend 3.6 49.9 AGI 31CN07 Advanced Genetics Inc Conv. 3.1 49.7 HighPro1 Ohio Foundation Seeds Conv. 3.7 49.5 53.1
LG C3550RX LG Seeds Xtend 3.5 49.1 Shur Grow SG-3328R2X Shur Grow Xtend 3.3 48.9
AG36X6 Asgrow Xtend 3.6 48.6
HS 34C62 Growmark Conv. 3.4 48.5 AGI 32R2Y4 Advanced Genetics Inc RR2Y 3.2 48.4 58.6 GL 3571NRX Great Lakes Hybrids Xtend 3.5 48.4
Burtch 3715 GTS Burtch Seeds GT 3.7 48.4
NK S33-T8X NK Xtend 3.3 48.3
DSR-3250/R2Y Dairyland Seed RR2Y 3.2 47.8
HS 33X70 Growmark Xtend 3.3 47.8
CZ 3458 EXP Bayer/Credenz EXP 3.4 47.8
DSR-3555/R2Y Dairyland Seed RR2Y 3.5 47.7
GH3546X Golden Harvest Xtend 3.5 47.7 Key 1735L AGRA Solutions LLC Liberty 3.5 47.5 54.6
W 5833 Wellman Seeds Xtend 3.3 47.4
LG C3321R2 LG Seeds RR2Y 3.3 47.2
Stewart 3827R2X Stewart Seeds Xtend 3.8 47.2 59.0
CZ 3298 EXP Bayer/Credenz EXP 3.2 46.8
G3690RX Agrigold Xtend 3.6 46.7 Dyna-Gro S33XT07 Dyna-Gro Seed Xtend 3.3 46.6 54.5
W 4333 Wellman Seeds RR2Y 3.3 46.5 58.0
GH3195X Golden Harvest Xtend 3.1 46.3
AG34X6 Asgrow Xtend 3.4 46.3 Channel 3417R2Xtend Channel Seed Xtend 3.4 46.3 55.3 GL 3460NRX Great Lakes Hybrids Xtend 3.4 46.3 54.8 Lorain Ohio Foundation Seeds Conv. 3.4 46.3 53.2
Stewart 3527R2X Stewart Seeds Xtend 3.5 46.3 53.6 CZ 3234 LL Bayer/Credenz Liberty 3.2 46.2 55.5

TABLE 4: The 2017 Ohio Soybean Performance Trials, North Region - Late Varieties (RM 3.1-3.9) CONTINUED FROM PREVIOUS PAGE
Entry Physical Characteristics
Brand/Variety Company Name Type Rel. Mat. Seeds/lb. % Protein % Oil % Fiber N2 '16-'17 Mean
Shur Grow SG-3213R2R Shur Grow RR2Y 3.2 46.2 56.1
HS 38L32 Growmark Liberty 3.8 45.9
NuTech 3343L NuTech Seed, LLC Liberty 3.4 45.6
NuTech 7352X NuTech Seed, LLC Xtend 3.5 45.6
Stewart 3337R2X Stewart Seeds Xtend 3.3 45.5 53.7
G3410RX Agrigold Xtend 3.4 45.5
HS 35L42 Growmark Liberty 3.5 45.2
Channel 3617R2Xtend Channel Seed Xtend 3.6 45.2 55.5
Stewart 3628R2X Stewart Seeds Xtend 3.6 45.1 53.0
Channel 3207R2 Channel Seed RR2Y 3.2 45.0
W 4732 Wellman Seeds RR2Y 3.2 44.9 55.9
Dyna-Gro S3305N Dyna-Gro Seed Conv. 3.3 44.9 56.0
AGI 31LL01 Advanced Genetics Inc Liberty 3.1 44.8
AG32X8 Asgrow Xtend 3.2 44.8
HS 34X60 Growmark Xtend 3.4 44.8
SC 9335RR Seed Consultants Inc RR1 3.3 44.5 54.8
CZ 3118 LL Bayer/Credenz Liberty 3.1 44.3
Rupp RS33XT63 Rupp Seeds Xtend 3.3 44.3 52.6
NuTech 7365 NuTech Seed, LLC GT 3.6 44.2
AG38X8 Asgrow Xtend 3.8 44.2
AG33X8 Asgrow Xtend 3.3 44.1
Rupp RS7332 Rupp Seeds RR2Y 3.3 43.8 54.7
HS 35X70 Growmark Xtend 3.5 43.8
Burtch 3516 GTS Burtch Seeds GT 3.5 43.7
Ebberts 368R2X Ebberts Field Seeds Inc Xtend 3.6 43.6
AG38X6 Asgrow Xtend 3.8 43.4
Key 1732L AGRA Solutions LLC Liberty 3.2 43.3 53.9
Channel 3116 R2Xtend Channel Seed Xtend 3.1 43.1
Beck's 3559X2 Beck’s Hybrids Xtend 3.5 43.0
G3520RX Agrigold Xtend 3.5 42.9
CZ 3601 LL Bayer/Credenz Liberty 3.6 42.6 55.6
NuTech 7317 NuTech Seed, LLC GT 3.1 42.4
Ebberts 338R2X Ebberts Field Seeds Inc Xtend 3.3 42.3
Shur Grow SG-3116R2R Shur Grow RR2Y 3.1 42.2 50.8
Burtch 3615-E Burtch Seeds Conv. 3.6 42.1
Ebberts 4357LL Ebberts Field Seeds Inc Liberty 3.5 41.8
G3324RX Agrigold Xtend 3.3 41.5
AGI 31R2Y2 Advanced Genetics Inc RR2Y 3.1 40.8
Shur Grow SG-3111R2R Shur Grow RR2Y 3.1 40.7
LG C3489RX LG Seeds Xtend 3.4 40.6
AGI 31RY6 Advanced Genetics Inc RR2Y 3.1 40.4 49.5
AG35X7 Asgrow Xtend 3.5 40.3
Ebberts 358R2X Ebberts Field Seeds Inc Xtend 3.4 40.2
SC 9318R Seed Consultants Inc GT 3.1 40.0
AG32X6 Asgrow Xtend 3.2 39.9
Channel 3509R2 Channel Seed RR2Y 3.5 39.5 54.1
Dyna-Gro S34XT78 Dyna-Gro Seed Xtend 3.4 37.8
Min 3.1 37.8
Max 3.9 57.3
Mean 3.4 45.8
LSD (0.1) 5.7
CV 10.6

TABLE 5: The 2017 Ohio Soybean Performance Trials, Central Region - Early Varieties (RM 2.5-3.3) Entry Physical Characteristics Central Region Yield (bu/ac)
Brand/Variety Company Name Type Rel. Mat. Seeds/lb. % Protein % Oil % Fiber C1 C2 '17 Mean '16-'17 Mean
Dyna-Gro S33RY76 Dyna-Gro Seed RR2Y 3.3 57.5* 62.0** 59.8 67.9
W 5833 Wellman Seeds Xtend 3.3 60.9** 57.2 59.1
Dyna-Gro S3305N Dyna-Gro Seed Conv. 3.3 56.6* 59.8* 58.2 68.2
LG C3321R2 LG Seeds RR2Y 3.3 55.4* 60.9* 58.2
Rupp RS33XT63 Rupp Seeds Xtend 3.3 57.7* 58.5* 58.1 63.3
G3324RX Agrigold Xtend 3.3 57.1* 57.8 57.5
Shur Grow SG-3328R2X Shur Grow Xtend 3.3 55.8* 59.1* 57.5
Stewart 3337R2X Stewart Seeds Xtend 3.3 55.4* 58.5* 57.0 63.2
Ebberts 338R2X Ebberts Field Seeds Inc Xtend 3.3 56.8* 56.9 56.9
AGI 32R2Y4 Advanced Genetics Inc RR2Y 3.2 52.5 61.0* 56.8 64.3
Dyna-Gro S28XT58 Dyna-Gro Seed Xtend 2.8 56.7* 56.6 56.7
AGI 3302RX Advanced Genetics Inc Xtend 3.3 55.5* 57.9 56.7
W 295 Wellman Seeds Conv. 2.6 56.1* 57.0 56.6 64.8
AG27X7 Asgrow Xtend 2.7 54.9* 56.3 56.6
Burtch 3112-E Burtch Seeds Conv. 3.1 56.7* 56.5 56.6
CZ 2810 LL Bayer/Credenz Liberty 2.8 58.3* 54.0 56.2 64.8
HS 33X70 Growmark Xtend 3.3 53.7 58.6* 56.2
Key 1732L AGRA Solutions LLC Liberty 3.2 54.9* 57.0 56.0 63.4
CZ 3118 LL Bayer/Credenz Liberty 3.1 59.5* 52.2 55.9
AGI 30M08 Advanced Genetics Inc GT 3.0 54.2 57.5 55.9
AGI 26RY2 Advanced Genetics Inc RR2Y 2.6 56.9* 54.6 55.8 58.4
Summit Ohio Foundation Seeds Conv. 2.6 56.7* 54.8 55.8 58.1
Shur Grow SG-3111R2R Shur Grow RR2Y 3.1 54.6* 56.9 55.8
HS 28X70 Growmark Xtend 2.8 54.6* 56.7 55.7
AG32X6 Asgrow Xtend 3.2 52.7 58.2* 55.5
CZ 3234 LL Bayer/Credenz Liberty 3.2 56.6* 54.3 55.5 63.3
NK S31-Y2X NK Xtend 3.1 53.3 57.3 55.3
NuTech 7317 NuTech Seed, LLC GT 3.1 55.8* 54.5 55.2
W 4333 Wellman Seeds RR2Y 3.3 51.9 58.4* 55.2 65.2
AGI 30RY3 Advanced Genetics Inc RR2Y 3.0 55.2* 55.0 55.1 64.0
AG32X8 Asgrow Xtend 3.2 50.3 59.9* 55.1
Shur Grow SG-3213R2R Shur Grow RR2Y 3.2 48.9 61.0* 55.0 63.7
Shur Grow SG-3116R2R Shur Grow RR2Y 3.1 52.0 57.6 54.8 62.5
Channel 3207R2 Channel Seed RR2Y 3.2 54.5* 54.6 54.6
Stewart 2827R2X Stewart Seeds Xtend 2.8 50.3 58.7* 54.5
AG33X8 Asgrow Xtend 3.3 53.2 55.8 54.5
Illini 3025 Ohio Foundation Seeds Conv. 3.0 52.1 56.7 54.4
Shur Grow SG-3026R2X Shur Grow Xtend 3.0 50.2 58.6* 54.4 61.4
SC 9318R Seed Consultants Inc. GT 3.1 52.8 56.0 54.4
Ebberts 306R2X Ebberts Field Seeds Inc Xtend 3.0 50.9 57.8 54.4 62.2
HS 25X70 Growmark Xtend 2.5 55.5* 53.0 54.3
Dyna-Gro S30XT96 Dyna-Gro Seed Xtend 3.0 55.7* 52.9 54.3
Ebberts 4327LL Ebberts Field Seeds Inc Liberty 3.2 55.7* 52.8 54.3
Ebberts 288R2X Ebberts Field Seeds Inc Xtend 2.8 51.4 56.9 54.15
NK S33-T8X NK Xtend 3.3 53.3 54.9 54.1
HS 32L60 Growmark Xtend 3.2 55.2* 52.8 54.0
Key 1829L AGRA Solutions LLC Liberty 2.9 50.2 57.3 53.75
GH2981X Golden Harvest Xtend 2.9 55.1* 52.2 53.7
NuTech 3273L NuTech Seed, LLC Liberty 2.7 50.3 56.9 53.6 62.9
GH3324X Golden Harvest Xtend 3.3 53.6 53.4 53.5
G2900RX Agrigold Xtend 2.9 54.0 52.8 53.4
W 4732 Wellman Seeds RR2Y 3.2 49.9 56.9 53.4 64.9
SC 9295RR Seed Consultants Inc. RR2Y 2.9 55.4* 51.2 53.3
CZ 3298 EXP Bayer/Credenz EXP 3.2 49.0 57.2 53.1
Channel 3116 R2Xtend Channel Seed Xtend 3.1 51.2 54.9 53.1
AGI 29RY3 Advanced Genetics Inc RR2Y 2.9 50.1 55.9 53
Beck's 338L4 Beck’s Hybrids Liberty 3.3 54.9* 51.1 53.0
AGI 31R2Y2 Advanced Genetics Inc RR2Y 3.1 49.3 56.3 52.8
SC 9335RR Seed Consultants Inc. RR1 3.3 54.3 51.3 52.8 61.3
Beck's 3091X2 Beck’s Hybrids Xtend 3.0 49.8 55.5 52.7
AG30X8 Asgrow Xtend 3.0 49.5 55.5 52.5
NOTE: Central Region, Early Variety Trial Results are Continued on the Next Page.
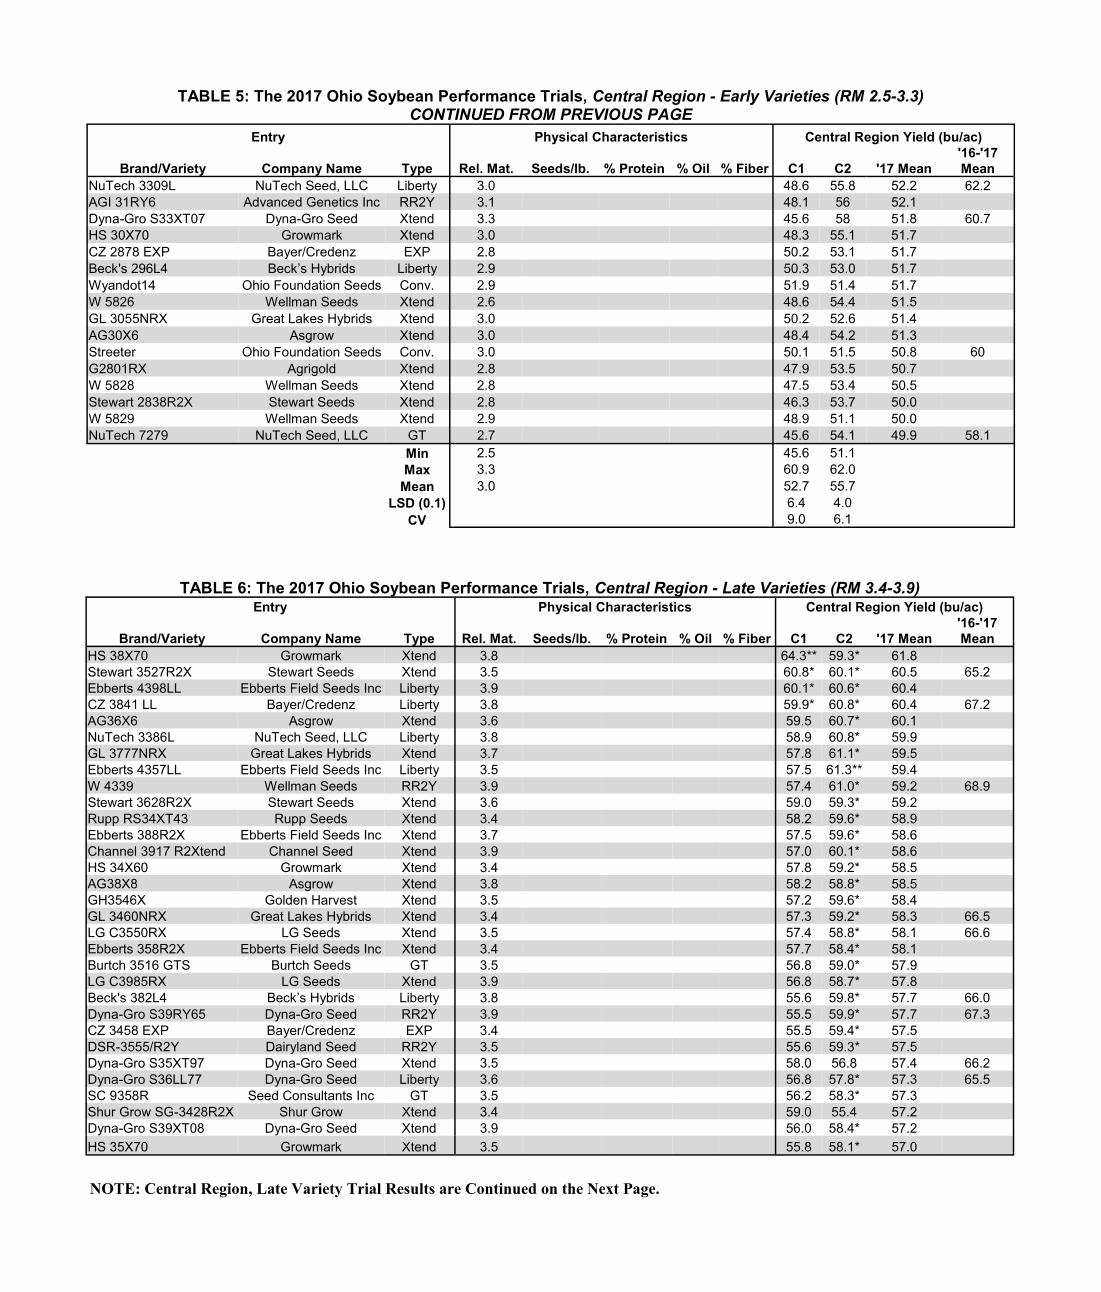
TABLE 5: The 2017 Ohio Soybean Performance Trials, Central Region - Early Varieties (RM 2.5-3.3) CONTINUED FROM PREVIOUS PAGE
Entry Physical Characteristics Central Region Yield (bu/ac)
Brand/Variety Company Name Type Rel. Mat. Seeds/lb. % Protein % Oil % Fiber C1 C2 '17 Mean
'16-'17
Mean
NuTech 3309L NuTech Seed, LLC Liberty 3.0 48.6 55.8 52.2 62.2
AGI 31RY6 Advanced Genetics Inc RR2Y 3.1 48.1 56 52.1
Dyna-Gro S33XT07 Dyna-Gro Seed Xtend 3.3 45.6 58 51.8 60.7
HS 30X70 Growmark Xtend 3.0 48.3 55.1 51.7
CZ 2878 EXP Bayer/Credenz EXP 2.8 50.2 53.1 51.7
Beck's 296L4 Beck’s Hybrids Liberty 2.9 50.3 53.0 51.7
Wyandot14 Ohio Foundation Seeds Conv. 2.9 51.9 51.4 51.7
W 5826 Wellman Seeds Xtend 2.6 48.6 54.4 51.5
GL 3055NRX Great Lakes Hybrids Xtend 3.0 50.2 52.6 51.4
AG30X6 Asgrow Xtend 3.0 48.4 54.2 51.3
Streeter Ohio Foundation Seeds Conv. 3.0 50.1 51.5 50.8 60
G2801RX Agrigold Xtend 2.8 47.9 53.5 50.7
W 5828 Wellman Seeds Xtend 2.8 47.5 53.4 50.5
Stewart 2838R2X Stewart Seeds Xtend 2.8 46.3 53.7 50.0
W 5829 Wellman Seeds Xtend 2.9 48.9 51.1 50.0
NuTech 7279 NuTech Seed, LLC GT 2.7 45.6 54.1 49.9 58.1
Min 2.5 45.6 51.1
Max 3.3 60.9 62.0
Mean 3.0 52.7 55.7
LSD (0.1) 6.4 4.0
CV 9.0 6.1
TABLE 6: The 2017 Ohio Soybean Performance Trials, Central Region - Late Varieties (RM 3.4-3.9) Entry Physical Characteristics Central Region Yield (bu/ac)
Brand/Variety Company Name Type Rel. Mat. Seeds/lb. % Protein % Oil % Fiber C1 C2 '17 Mean
'16-'17
Mean
HS 38X70 Growmark Xtend 3.8 64.3** 59.3* 61.8
Stewart 3527R2X Stewart Seeds Xtend 3.5 60.8* 60.1* 60.5 65.2
Ebberts 4398LL Ebberts Field Seeds Inc Liberty 3.9 60.1* 60.6* 60.4
CZ 3841 LL Bayer/Credenz Liberty 3.8 59.9* 60.8* 60.4 67.2
AG36X6 Asgrow Xtend 3.6 59.5 60.7* 60.1
NuTech 3386L NuTech Seed, LLC Liberty 3.8 58.9 60.8* 59.9
GL 3777NRX Great Lakes Hybrids Xtend 3.7 57.8 61.1* 59.5
Ebberts 4357LL Ebberts Field Seeds Inc Liberty 3.5 57.5 61.3** 59.4
W 4339 Wellman Seeds RR2Y 3.9 57.4 61.0* 59.2 68.9
Stewart 3628R2X Stewart Seeds Xtend 3.6 59.0 59.3* 59.2
Rupp RS34XT43 Rupp Seeds Xtend 3.4 58.2 59.6* 58.9
Ebberts 388R2X Ebberts Field Seeds Inc Xtend 3.7 57.5 59.6* 58.6
Channel 3917 R2Xtend Channel Seed Xtend 3.9 57.0 60.1* 58.6
HS 34X60 Growmark Xtend 3.4 57.8 59.2* 58.5
AG38X8 Asgrow Xtend 3.8 58.2 58.8* 58.5
GH3546X Golden Harvest Xtend 3.5 57.2 59.6* 58.4
GL 3460NRX Great Lakes Hybrids Xtend 3.4 57.3 59.2* 58.3 66.5
LG C3550RX LG Seeds Xtend 3.5 57.4 58.8* 58.1 66.6
Ebberts 358R2X Ebberts Field Seeds Inc Xtend 3.4 57.7 58.4* 58.1
Burtch 3516 GTS Burtch Seeds GT 3.5 56.8 59.0* 57.9
LG C3985RX LG Seeds Xtend 3.9 56.8 58.7* 57.8
Beck's 382L4 Beck’s Hybrids Liberty 3.8 55.6 59.8* 57.7 66.0
Dyna-Gro S39RY65 Dyna-Gro Seed RR2Y 3.9 55.5 59.9* 57.7 67.3
CZ 3458 EXP Bayer/Credenz EXP 3.4 55.5 59.4* 57.5
DSR-3555/R2Y Dairyland Seed RR2Y 3.5 55.6 59.3* 57.5
Dyna-Gro S35XT97 Dyna-Gro Seed Xtend 3.5 58.0 56.8 57.4 66.2
Dyna-Gro S36LL77 Dyna-Gro Seed Liberty 3.6 56.8 57.8* 57.3 65.5
SC 9358R Seed Consultants Inc GT 3.5 56.2 58.3* 57.3
Shur Grow SG-3428R2X Shur Grow Xtend 3.4 59.0 55.4 57.2
Dyna-Gro S39XT08 Dyna-Gro Seed Xtend 3.9 56.0 58.4* 57.2
HS 35X70 Growmark Xtend 3.5 55.8 58.1* 57.0
NOTE: Central Region, Late Variety Trial Results are Continued on the Next Page.
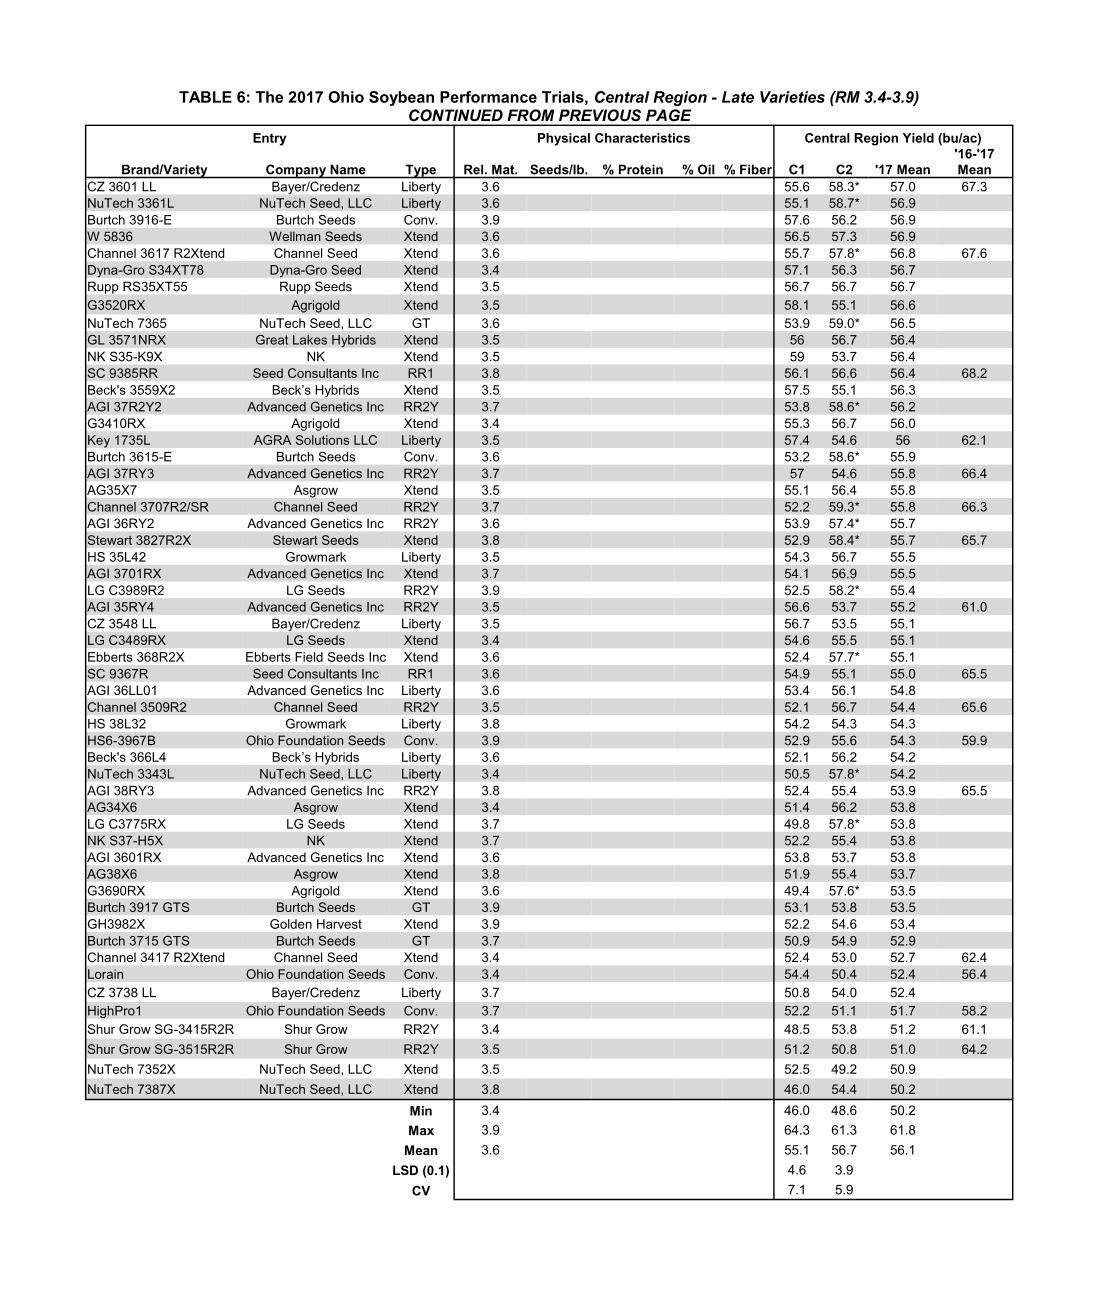
TABLE 6: The 2017 Ohio Soybean Performance Trials, Central Region - Late Varieties (RM 3.4-3.9) CONTINUED FROM PREVIOUS PAGE
Entry Physical Characteristics Central Region Yield (bu/ac)
Brand/Variety Company Name Type Rel. Mat. Seeds/lb. % Protein % Oil % Fiber C1 C2 '17 Mean
'16-'17
Mean
CZ 3601 LL Bayer/Credenz Liberty 3.6 55.6 58.3* 57.0 67.3
NuTech 3361L NuTech Seed, LLC Liberty 3.6 55.1 58.7* 56.9
Burtch 3916-E Burtch Seeds Conv. 3.9 57.6 56.2 56.9
W 5836 Wellman Seeds Xtend 3.6 56.5 57.3 56.9
Channel 3617 R2Xtend Channel Seed Xtend 3.6 55.7 57.8* 56.8 67.6
Dyna-Gro S34XT78 Dyna-Gro Seed Xtend 3.4 57.1 56.3 56.7
Rupp RS35XT55 Rupp Seeds Xtend 3.5 56.7 56.7 56.7
G3520RX Agrigold Xtend 3.5 58.1 55.1 56.6
NuTech 7365 NuTech Seed, LLC GT 3.6 53.9 59.0* 56.5
GL 3571NRX Great Lakes Hybrids Xtend 3.5 56 56.7 56.4
NK S35-K9X NK Xtend 3.5 59 53.7 56.4
SC 9385RR Seed Consultants Inc RR1 3.8 56.1 56.6 56.4 68.2
Beck's 3559X2 Beck’s Hybrids Xtend 3.5 57.5 55.1 56.3
AGI 37R2Y2 Advanced Genetics Inc RR2Y 3.7 53.8 58.6* 56.2
G3410RX Agrigold Xtend 3.4 55.3 56.7 56.0
Key 1735L AGRA Solutions LLC Liberty 3.5 57.4 54.6 56 62.1
Burtch 3615-E Burtch Seeds Conv. 3.6 53.2 58.6* 55.9
AGI 37RY3 Advanced Genetics Inc RR2Y 3.7 57 54.6 55.8 66.4
AG35X7 Asgrow Xtend 3.5 55.1 56.4 55.8
Channel 3707R2/SR Channel Seed RR2Y 3.7 52.2 59.3* 55.8 66.3
AGI 36RY2 Advanced Genetics Inc RR2Y 3.6 53.9 57.4* 55.7
Stewart 3827R2X Stewart Seeds Xtend 3.8 52.9 58.4* 55.7 65.7
HS 35L42 Growmark Liberty 3.5 54.3 56.7 55.5
AGI 3701RX Advanced Genetics Inc Xtend 3.7 54.1 56.9 55.5
LG C3989R2 LG Seeds RR2Y 3.9 52.5 58.2* 55.4
AGI 35RY4 Advanced Genetics Inc RR2Y 3.5 56.6 53.7 55.2 61.0
CZ 3548 LL Bayer/Credenz Liberty 3.5 56.7 53.5 55.1
LG C3489RX LG Seeds Xtend 3.4 54.6 55.5 55.1
Ebberts 368R2X Ebberts Field Seeds Inc Xtend 3.6 52.4 57.7* 55.1
SC 9367R Seed Consultants Inc RR1 3.6 54.9 55.1 55.0 65.5
AGI 36LL01 Advanced Genetics Inc Liberty 3.6 53.4 56.1 54.8
Channel 3509R2 Channel Seed RR2Y 3.5 52.1 56.7 54.4 65.6
HS 38L32 Growmark Liberty 3.8 54.2 54.3 54.3
HS6-3967B Ohio Foundation Seeds Conv. 3.9 52.9 55.6 54.3 59.9
Beck's 366L4 Beck’s Hybrids Liberty 3.6 52.1 56.2 54.2
NuTech 3343L NuTech Seed, LLC Liberty 3.4 50.5 57.8* 54.2
AGI 38RY3 Advanced Genetics Inc RR2Y 3.8 52.4 55.4 53.9 65.5
AG34X6 Asgrow Xtend 3.4 51.4 56.2 53.8
LG C3775RX LG Seeds Xtend 3.7 49.8 57.8* 53.8
NK S37-H5X NK Xtend 3.7 52.2 55.4 53.8
AGI 3601RX Advanced Genetics Inc Xtend 3.6 53.8 53.7 53.8
AG38X6 Asgrow Xtend 3.8 51.9 55.4 53.7
G3690RX Agrigold Xtend 3.6 49.4 57.6* 53.5
Burtch 3917 GTS Burtch Seeds GT 3.9 53.1 53.8 53.5
GH3982X Golden Harvest Xtend 3.9 52.2 54.6 53.4
Burtch 3715 GTS Burtch Seeds GT 3.7 50.9 54.9 52.9
Channel 3417 R2Xtend Channel Seed Xtend 3.4 52.4 53.0 52.7 62.4
Lorain Ohio Foundation Seeds Conv. 3.4 54.4 50.4 52.4 56.4
CZ 3738 LL Bayer/Credenz Liberty 3.7 50.8 54.0 52.4
HighPro1 Ohio Foundation Seeds Conv. 3.7 52.2 51.1 51.7 58.2
Shur Grow SG-3415R2R Shur Grow RR2Y 3.4 48.5 53.8 51.2 61.1
Shur Grow SG-3515R2R Shur Grow RR2Y 3.5 51.2 50.8 51.0 64.2
NuTech 7352X NuTech Seed, LLC Xtend 3.5 52.5 49.2 50.9
NuTech 7387X NuTech Seed, LLC Xtend 3.8 46.0 54.4 50.2
Min 3.4 46.0 48.6 50.2
Max 3.9 64.3 61.3 61.8
Mean 3.6 55.1 56.7 56.1
LSD (0.1) 4.6 3.9
CV 7.1 5.9
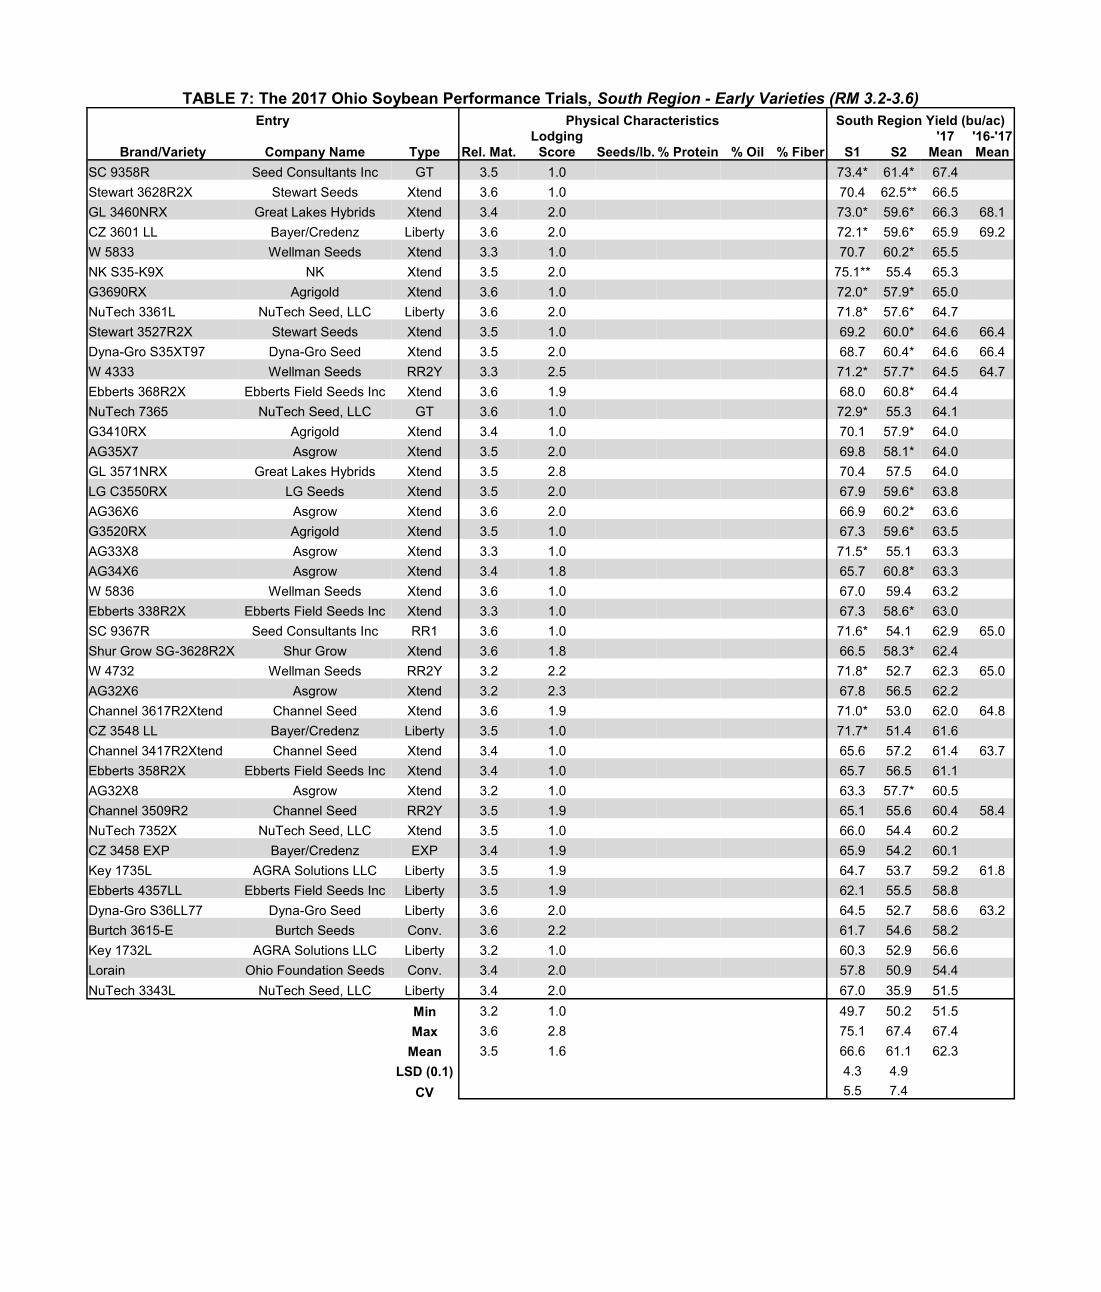
TABLE 7: The 2017 Ohio Soybean Performance Trials, South Region - Early Varieties (RM 3.2-3.6)
Entry Physical Characteristics South Region Yield (bu/ac)
Brand/Variety Company Name Type Rel. Mat.
Lodging
Score Seeds/lb. % Protein % Oil % Fiber S1 S2
'17
Mean
'16-'17
Mean
SC 9358R Seed Consultants Inc GT 3.5 1.0 73.4* 61.4* 67.4
Stewart 3628R2X Stewart Seeds Xtend 3.6 1.0 70.4 62.5** 66.5
GL 3460NRX Great Lakes Hybrids Xtend 3.4 2.0 73.0* 59.6* 66.3 68.1
CZ 3601 LL Bayer/Credenz Liberty 3.6 2.0 72.1* 59.6* 65.9 69.2
W 5833 Wellman Seeds Xtend 3.3 1.0 70.7 60.2* 65.5
NK S35-K9X NK Xtend 3.5 2.0 75.1** 55.4 65.3
G3690RX Agrigold Xtend 3.6 1.0 72.0* 57.9* 65.0
NuTech 3361L NuTech Seed, LLC Liberty 3.6 2.0 71.8* 57.6* 64.7
Stewart 3527R2X Stewart Seeds Xtend 3.5 1.0 69.2 60.0* 64.6 66.4
Dyna-Gro S35XT97 Dyna-Gro Seed Xtend 3.5 2.0 68.7 60.4* 64.6 66.4
W 4333 Wellman Seeds RR2Y 3.3 2.5 71.2* 57.7* 64.5 64.7
Ebberts 368R2X Ebberts Field Seeds Inc Xtend 3.6 1.9 68.0 60.8* 64.4
NuTech 7365 NuTech Seed, LLC GT 3.6 1.0 72.9* 55.3 64.1
G3410RX Agrigold Xtend 3.4 1.0 70.1 57.9* 64.0
AG35X7 Asgrow Xtend 3.5 2.0 69.8 58.1* 64.0
GL 3571NRX Great Lakes Hybrids Xtend 3.5 2.8 70.4 57.5 64.0
LG C3550RX LG Seeds Xtend 3.5 2.0 67.9 59.6* 63.8
AG36X6 Asgrow Xtend 3.6 2.0 66.9 60.2* 63.6
G3520RX Agrigold Xtend 3.5 1.0 67.3 59.6* 63.5
AG33X8 Asgrow Xtend 3.3 1.0 71.5* 55.1 63.3
AG34X6 Asgrow Xtend 3.4 1.8 65.7 60.8* 63.3
W 5836 Wellman Seeds Xtend 3.6 1.0 67.0 59.4 63.2
Ebberts 338R2X Ebberts Field Seeds Inc Xtend 3.3 1.0 67.3 58.6* 63.0
SC 9367R Seed Consultants Inc RR1 3.6 1.0 71.6* 54.1 62.9 65.0
Shur Grow SG-3628R2X Shur Grow Xtend 3.6 1.8 66.5 58.3* 62.4
W 4732 Wellman Seeds RR2Y 3.2 2.2 71.8* 52.7 62.3 65.0
AG32X6 Asgrow Xtend 3.2 2.3 67.8 56.5 62.2
Channel 3617R2Xtend Channel Seed Xtend 3.6 1.9 71.0* 53.0 62.0 64.8
CZ 3548 LL Bayer/Credenz Liberty 3.5 1.0 71.7* 51.4 61.6
Channel 3417R2Xtend Channel Seed Xtend 3.4 1.0 65.6 57.2 61.4 63.7
Ebberts 358R2X Ebberts Field Seeds Inc Xtend 3.4 1.0 65.7 56.5 61.1
AG32X8 Asgrow Xtend 3.2 1.0 63.3 57.7* 60.5
Channel 3509R2 Channel Seed RR2Y 3.5 1.9 65.1 55.6 60.4 58.4
NuTech 7352X NuTech Seed, LLC Xtend 3.5 1.0 66.0 54.4 60.2
CZ 3458 EXP Bayer/Credenz EXP 3.4 1.9 65.9 54.2 60.1
Key 1735L AGRA Solutions LLC Liberty 3.5 1.9 64.7 53.7 59.2 61.8
Ebberts 4357LL Ebberts Field Seeds Inc Liberty 3.5 1.9 62.1 55.5 58.8
Dyna-Gro S36LL77 Dyna-Gro Seed Liberty 3.6 2.0 64.5 52.7 58.6 63.2
Burtch 3615-E Burtch Seeds Conv. 3.6 2.2 61.7 54.6 58.2
Key 1732L AGRA Solutions LLC Liberty 3.2 1.0 60.3 52.9 56.6
Lorain Ohio Foundation Seeds Conv. 3.4 2.0 57.8 50.9 54.4
NuTech 3343L NuTech Seed, LLC Liberty 3.4 2.0 67.0 35.9 51.5
Min 3.2 1.0 49.7 50.2 51.5
Max 3.6 2.8 75.1 67.4 67.4
Mean 3.5 1.6 66.6 61.1 62.3
LSD (0.1) 4.3 4.9
CV 5.5 7.4

TABLE 8: The 2017 Ohio Soybean Performance Trials, South Region - Late Varieties (RM 3.7-4.3)
Entry Physical Characteristics South Region Yield (bu/ac)
Brand/Variety Company Name Type
Rel.
Mat.
Lodging
Score
Seeds/
lb. % Protein % Oil % Fiber S1 S2
'17
Mean
'16-'17
Mean
GL 3777NRX Great Lakes Hybrids Xtend 3.7 1.8 71.4* 68.7** 70.1
G3830RX Agrigold Xtend 3.8 1.0 68.2* 67.1* 67.7
G3980RX Agrigold Xtend 3.9 1.0 70.7* 64.3* 67.5
NuTech 3386L NuTech Seed, LLC Liberty 3.8 1.0 69.7* 64.5* 67.1 70.0
Dyna-Gro S41XS98 Dyna-Gro Seed Xtend/STS 4.1 1.0 67.7 65.7* 66.7
CZ 3841 LL Bayer/Credenz Liberty 3.8 1.9 69.5* 63.4* 66.5 67.7
CZ 4105 LL Bayer/Credenz Liberty 4.1 1.9 72.3** 59.8 66.1 67.6
Ebberts 4398LL Ebberts Field Seeds Inc Liberty 3.9 1.0 68.6* 62.5 65.6
Ebberts 388R2X Ebberts Field Seeds Inc Xtend 3.7 1.9 66.9 62.2 64.6
LG C3985RX LG Seeds Xtend 3.9 1.0 68.6* 60.3 64.5
AG38X8 Asgrow Xtend 3.8 1.0 64.1 64.4* 64.3
AG39X7 Asgrow Xtend 3.9 1.0 65.6 62.0 63.8
Stewart 4116R2X Stewart Seeds Xtend 4.1 1.0 66.5 61.1 63.8 67.7
Channel 3917R2Xtend Channel Seed Xtend 3.9 1.8 63.9 63.6* 63.8 67.1
W 4339 Wellman Seeds RR2Y 3.9 1.0 64.2 63.2* 63.7 68.4
SC 9385RR Seed Consultants Inc RR1 3.8 2.3 66.0 61.3 63.7 65.7
Channel 4116R2Xtend Channel Seed Xtend 4.1 1.0 65.3 61.8 63.6 66.6
Dyna-Gro S42RY77 Dyna-Gro Seed RR2Y 4.2 1.9 62.5 64.2* 63.4 65.7
NuTech 7406 NuTech Seed, LLC GT 4.0 1.0 65.2 60.7 63.0
Dyna-Gro S38LL54 Dyna-Gro Seed Liberty 3.8 1.9 65.7 59.5 62.6 62.1
AG40X6 Asgrow Xtend 4.0 1.9 64.7 60.5 62.6
GH3761X Golden Harvest Xtend 3.7 1.9 64.4 60.6 62.5
LG C3775RX LG Seeds Xtend 3.7 1.0 66.9 58.1 62.5
AG41X8 Asgrow Xtend 4.1 1.0 63.6 61.4 62.5
LG C3989R2 LG Seeds RR2Y 3.9 1.9 62.4 62.2 62.3 62.7
Dyna-Gro S3805N Dyna-Gro Seed Conv. 3.8 1.8 64.0 60.4 62.2 63.6
CZ 3738 LL Bayer/Credenz Liberty 3.7 1.0 67.0 57.1 62.1
Channel 4317R2Xtend Channel Seed Xtend 4.3 1.0 65.5 58.5 62.0
NuTech 7387X NuTech Seed, LLC Xtend 3.8 1.0 62.9 61.0 62.0
Stewart 3827R2X Stewart Seeds Xtend 3.8 1.0 64.7 58.9 61.8 66.6
Dyna-Gro S39XT08 Dyna-Gro Seed Xtend 3.9 1.9 62.6 60.9 61.8
AG38X6 Asgrow Xtend 3.8 1.0 65.6 57.8 61.7
Dyna-Gro S39XT68 Dyna-Gro Seed Xtend 3.9 1.0 67.9 55.3 61.6
Burtch 3916-E Burtch Seeds Conv. 3.9 1.9 64.0 58.9 61.5
NuTech 7410X NuTech Seed, LLC Xtend 4.1 1.9 62.9 59.7 61.3
Channel 3707R2/SR Channel Seed RR2Y 3.7 1.0 65.5 56.9 61.2 64.1
SC 9428R Seed Consultants Inc GT 4.2 1.0 66.4 55.9 61.2
GH3982X Golden Harvest Xtend 3.9 2.0 60.5 61.6 61.1
Shur Grow SG-3817R2R Shur Grow RR2Y 3.8 2.2 59.5 61.5 60.5
SC 9393RR Seed Consultants Inc RR1 3.9 1.0 64.2 56.5 60.4 56.7
Dyna-Gro S39RY65 Dyna-Gro Seed RR2Y 3.9 1.0 63.4 56.4 59.9 63.3
G3712RX Agrigold Xtend 3.7 1.0 63.2 55.6 59.4
NK S39-P5X NK Xtend 3.9 2.1 58.2 59.4 58.8
Burtch 3917 GTS Burtch Seeds GT 3.9 2.0 60.0 57.0 58.5
HS6-3967B Ohio Foundation Seeds Conv. 3.9 1.9 63.7 53.1 58.4 60.7
Burtch 3715 GTS Burtch Seeds GT 3.7 2.0 59.7 56.5 58.1
Clermont Ohio Foundation Seeds Conv. 3.9 3.0 54.1 59.8 57.0 57.2
HighPro1 Ohio Foundation Seeds Conv. 3.7 2.5 55.7 54.5 55.1 59.3
Min 3.7 1.0 49.0 51.4
Max 4.3 3.0 72.3 68.7
Mean 3.9 1.5 63.1 59.4
LSD (0.1) 4.2 6.2
CV 5.7 8.9
Related Documents