Page 1 THE 2014 LEARNING OPPORTUNITIES INDEX: QUESTIONS AND ANSWERS Q1. What is the Learning Opportunities Index (LOI)? A1. The LOI ranks each school based on measures of external challenges affecting student success. The school with the greatest level of external challenges is ranked number one and is described as highest on the index. It is important to acknowledge that students in all schools have some external challenges, even those schools that are ranked very low on the LOI. The LOI measures relative need and compares all schools on exactly the same set of data collected in a consistent, reliable, and objective manner. The LOI removes the subjectivity that may shape perceptions of individual school needs. There are two indices – one for elementary (including junior high schools) and one for secondary. Under various names, the Toronto District School Board (TDSB) and its legacy systems have calculated some variation of the index for over 30 years. After a year-long review and external consultation with stakeholders in 2007-08, the 2009 calculation of the index was recommended by a steering committee consisting of board staff and representatives from the Inner City Advisory Committee. This 2014 LOI uses the same methodology employed in 2009 though with updated data. Q2. Why has the LOI been developed? A2. Public education is designed to give all children an equal opportunity to succeed. The TDSB recognizes that students face varying degrees of challenge which can impact their opportunity to achieve high educational outcomes. Educational research has demonstrated that children from lower income families face more significant barriers in achieving high educational outcomes. Because of its commitment to achieving equitable academic opportunities, the TDSB wants to ensure that every student has an equitable opportunity to succeed. This means ensuring all students have access to available resources. The LOI helps to ensure that children who have access to fewer resources at home and in their neighbourhoods have

Welcome message from author
This document is posted to help you gain knowledge. Please leave a comment to let me know what you think about it! Share it to your friends and learn new things together.
Transcript
Pag
e 1
THE 2014 LEARNING OPPORTUNITIES INDEX: QUESTIONS AND ANSWERS
Q1. What is the Learning Opportunities Index (LOI)? A1. The LOI ranks each school based on measures of external challenges affecting student
success. The school with the greatest level of external challenges is ranked number one and is described as highest on the index. It is important to acknowledge that students in all schools have some external challenges, even those schools that are ranked very low on the LOI.
The LOI measures relative need and compares all schools on exactly the same set of data collected in a consistent, reliable, and objective manner. The LOI removes the subjectivity that may shape perceptions of individual school needs.
There are two indices – one for elementary (including junior high schools) and one for secondary. Under various names, the Toronto District School Board (TDSB) and its legacy systems have calculated some variation of the index for over 30 years. After a year-long review and external consultation with stakeholders in 2007-08, the 2009 calculation of the index was recommended by a steering committee consisting of board staff and representatives from the Inner City Advisory Committee. This 2014 LOI uses the same methodology employed in 2009 though with updated data.
Q2. Why has the LOI been developed? A2. Public education is designed to give all children an equal opportunity to succeed. The
TDSB recognizes that students face varying degrees of challenge which can impact their opportunity to achieve high educational outcomes. Educational research has demonstrated that children from lower income families face more significant barriers in achieving high educational outcomes.
Because of its commitment to achieving equitable academic opportunities, the TDSB wants to ensure that every student has an equitable opportunity to succeed. This means ensuring all students have access to available resources. The LOI helps to ensure that children who have access to fewer resources at home and in their neighbourhoods have
Pag
e 2
increased access to available resources in their schools. The LOI will assist with steering additional resources to the schools serving students who face greater challenges.
Q3. What are the components of the LOI? A3. The LOI is composed of variables which are combined into a single index. The variables
used are:
1. Median Income – A measurement of income levels, at which half the residents earn more and half of them earn less. This is measured at the level of the student’s neighbourhood.
2. Percentage of Families Whose Income is Below the Low Income Measure (Before Tax) – Also known as the Low Income Measure, this is the percentage of families in a student’s neighbourhood whose income is at or less than half the median income in the city.
3. Percentage of Families Receiving Social Assistance – The proportion of families in a student’s neighbourhood whose income comes from government sources.
4. Adults with Low Education – The percentage of people in a student’s neighbourhood without a high school diploma.
5. Adults with University Degrees – The percentage of people in a student’s neighbourhood with at least one university degree.
6. Lone-Parent Families – The proportion of families in a neighborhood where the parent does not live with either a spouse or common law partner. Please note the variables described above in 1, 2, 3, and 6 are based on data about families with children.
Q4. Why use these variables and not others? A4. The LOI is one of the TDSB's tools in responding to external challenges affecting
students. The variables in the LOI have been identified as external factors that impact educational achievement. They include measures of income and poverty, parents’
Pag
e 3
education, and proportion of lone-parent families. In the calculation of the LOI, the factors that most strongly track poor educational outcomes were selected.
The variables that constitute the LOI have been statistically tested against the student success indicators of TDSB students and have been shown to correlate with measures such as the Education Quality and Accountability Office (EQAO) Primary and Junior assessment results, the Ontario Secondary School Literacy Test (OSSLT), and credit achievement.
Over the past few years, a number of other variables have been considered for inclusion in the LOI, but have not been included. For some variables (e.g., crime), the ways to consistently link information to each student are not available (student-level information serves as the basis of the LOI). For other variables, such as crowding, there are no clear consensuses in the literature on whether they have any noticeable effect on student achievement. Lastly, some other proposed variables were too blunt a measure, and do not show a strong correlation to student achievement. As a result of the 2007-08 review, immigration, mobility, and housing were removed from the index because they did not show a sufficiently strong relationship to student achievement. The variables used in the LOI are to be re-evaluated as part of a review of the LOI and its uses that is now underway. It is possible that in the future, as new data becomes available, the Board will approve a change in the variables that are included in the LOI.
Q5. How does the Federal Census data connect to the students in our school? A5. We are able to obtain postal code data for each student from our School Information
Systems (SIS); however, some variables such as income are appropriately protected by privacy legislation and cannot be collected. As a result, most of the measures use a more indirect route: taking the postal code of where the student lives, and linking it with information from already-existing sources.
For income, the postal code of each student is linked to tax returns of all families with school-aged children living in that postal code. For other variables such as the proportion of lone-parent families and education, the postal code is linked to information from the Environics Analytics DemoStats 2013 database (from the immediate neighbourhood or dissemination area in which the student lives). The link to the DemoStats database
Pag
e 4
replaces similar information from the 2006 Federal Census used in the previous 2011 LOI.
Therefore, all measures in the index have a connection with the student based on the neighbourhood in which the student lives.
Q6. Why is it that schools in the same neighbourhood have different LOI rankings?
A6. The LOI is calculated from the characteristics of the students attending a school, and not
from the characteristics of the area around the school. This is important to remember because in many cases, students will not come from the immediate neighbourhood of the school. For example, the school may be located in an area of comparative affluence, but many of the students may come from lower income housing several blocks away, or may be bussed or take transit. The information about the student is gathered from the location of where the student lives.
Q7. Why are some schools lower on this LOI than the previous LOI when the students
appear to be just as needy and at-risk as before?
A7. The LOI is a measure of relative need and it provides a comparison with other schools at a specific point in time. Students in a particular school may have exactly the same level of need as in the past, but the LOI score may not remain static. A particular school’s LOI score is also influenced by changes that may have occurred in other schools. It may be that the needs of students in several other schools have increased over time to a greater degree leading to a reduction of the LOI ranking even though the actual or absolute level of need has remained exactly the same.
Q8. How is the LOI used?
A8. There is a wide range of applications for the LOI within the TDSB to help allocate staff and other available resources. During the staffing allocation process, the LOI is used as one input along with other types of information such as student headcount or full-time equivalent (FTE) status.
Pag
e 5
Q9. What has changed in the most recent (2014) Index? A9. Some schools will see their position shift with the most recent LOI. Shifts could occur
because of the normal year-over-year changes in school boundaries and/or population which would affect the scores.
There is a strong correlation between the current LOI and the LOI produced three years
ago. The correlation for the elementary school index is 0.978 and the correlation for the secondary school index is 0.977.
Q10. How does the LOI address year-over-year changes in schools? A10. The LOI is recalculated every two years.
In some instances, year-over-year changes in a specific variable could result in a significant shift in a school’s ranking. Sometimes, these changes are short-lived and are seen only in one specific year.
To counteract one-time swings that occur in a small number of schools each year, the LOI is calculated using a rolling three-year average of data for each of the variables in the index. The current index uses data from the school years 2011-12, 2012-12, and 2013-14.
Q11. What is the relationship of the LOI to student achievement? A11. There is a strong relationship between the LOI and student achievement but it is not
absolute. Some schools that are high on the LOI continue to perform well on measures of student achievement.
It should be emphasized that the LOI does not use student achievement in its calculation.
Q12. How accurate is the LOI? A12. The LOI is extremely accurate. The external review of the LOI found that it is well suited
to its purpose and that the statistical methods used in its construction are sound. As

Pag
e 6
noted above, the changes that were made in the 2009 LOI make it even more strongly correlated with external challenges to student achievement.
The accuracy of the LOI depends on two factors: the accuracy of the information entered by schools into our School Information Systems (SIS) and the data accuracy to which it is linked (i.e., tax data, and the Federal Census). For example, all components of the LOI are derived by linking data to the postal code of the student’s residence. Postal code data is complete for 99.9% of student records. However, there is no current way to check on the validity of a postal code compared to an address. If a postal code is entered incorrectly, it will incorrectly link to tax and census data.
The extent of such inaccuracies and the impact they may have on LOI rankings cannot be determined definitively. Regardless, we are confident that the LOI is an accurate representation of the differences among schools and well correlated with external challenges to student achievement.
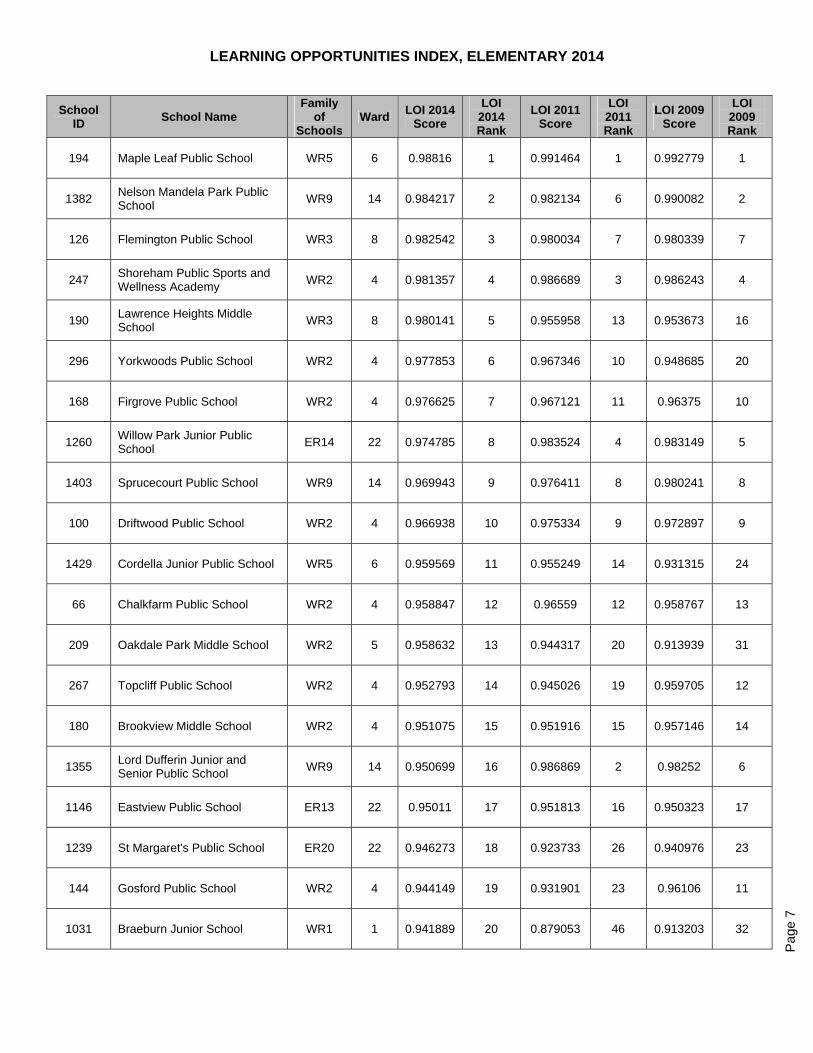
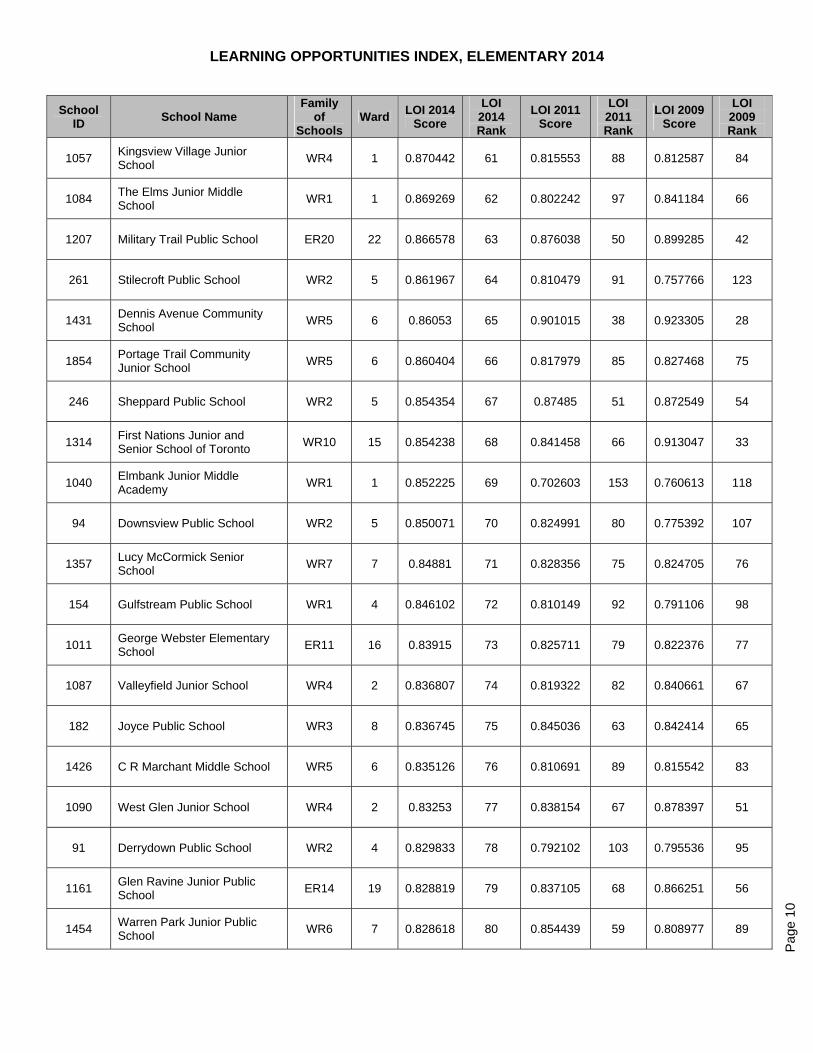
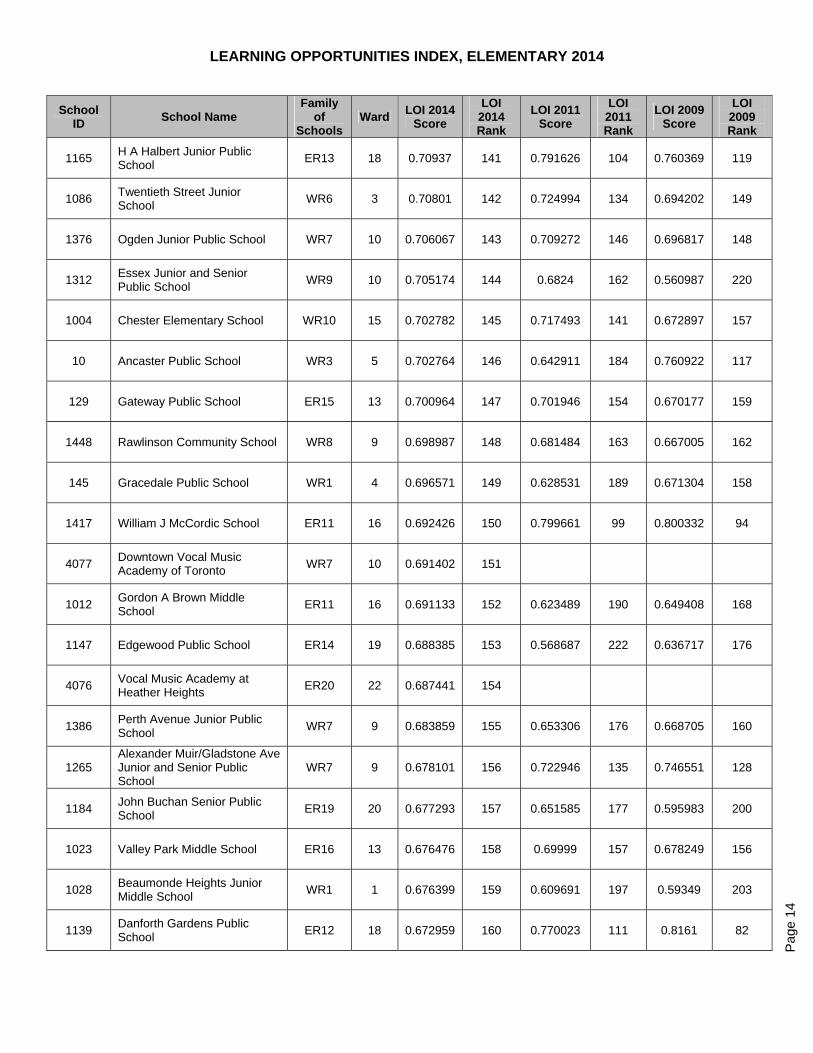
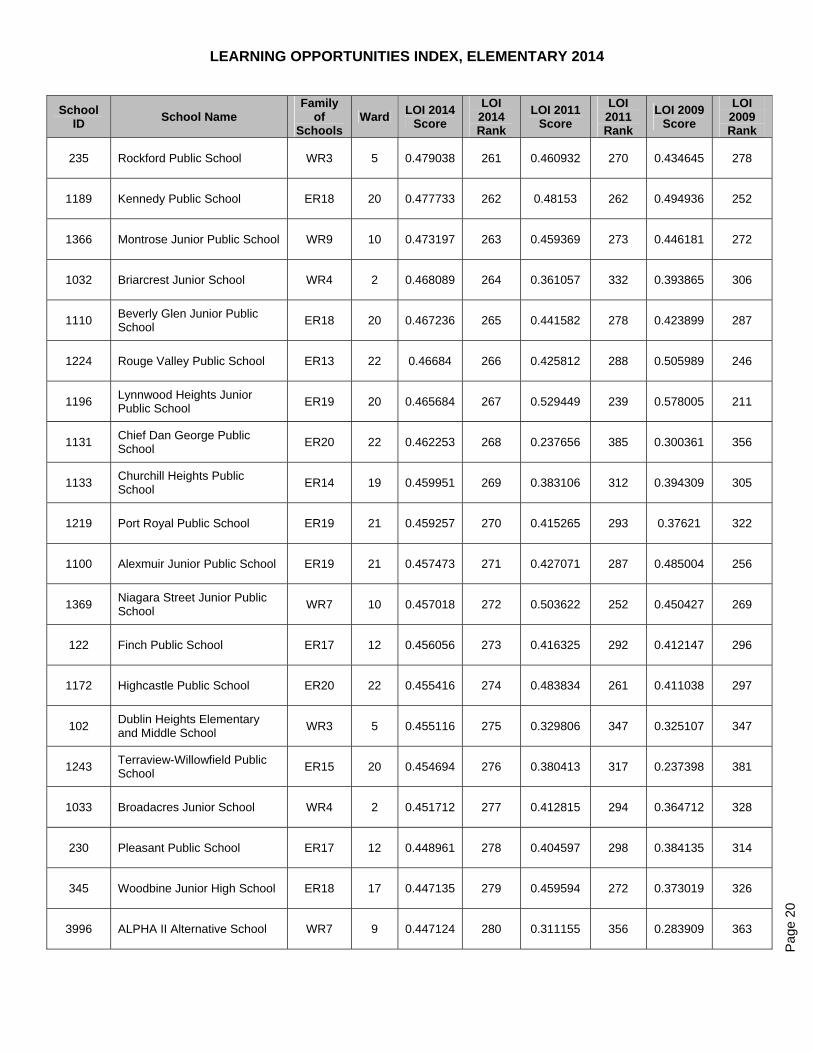
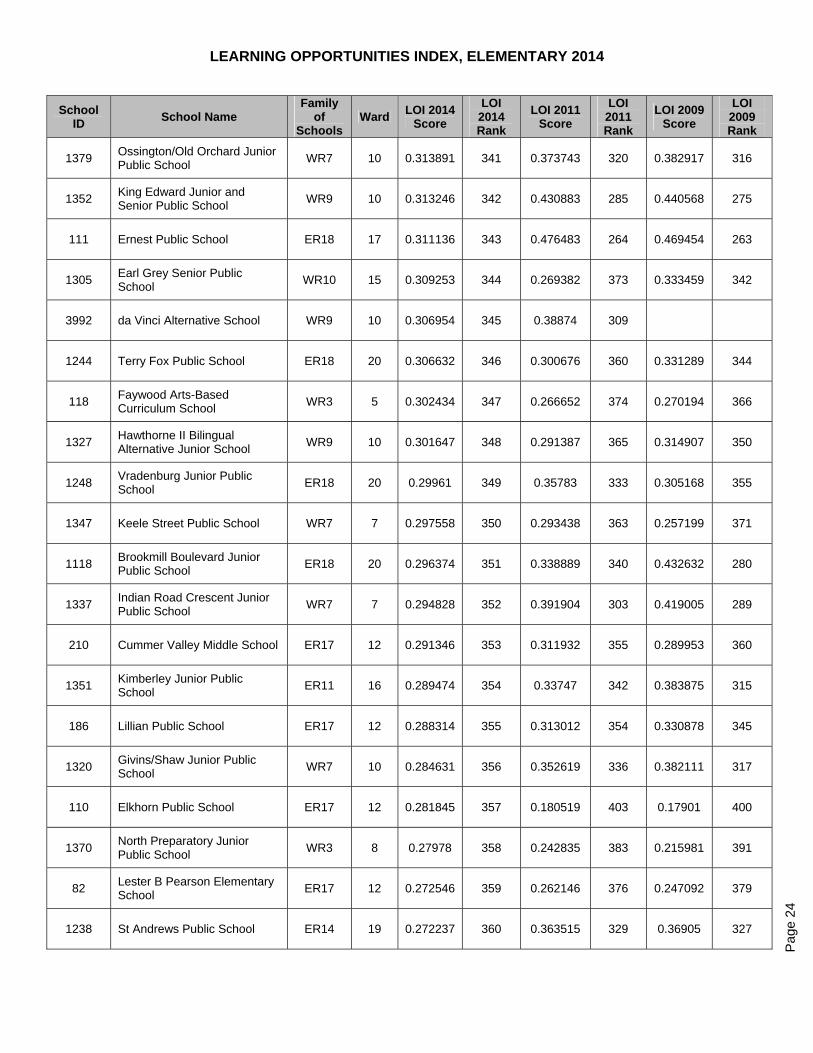
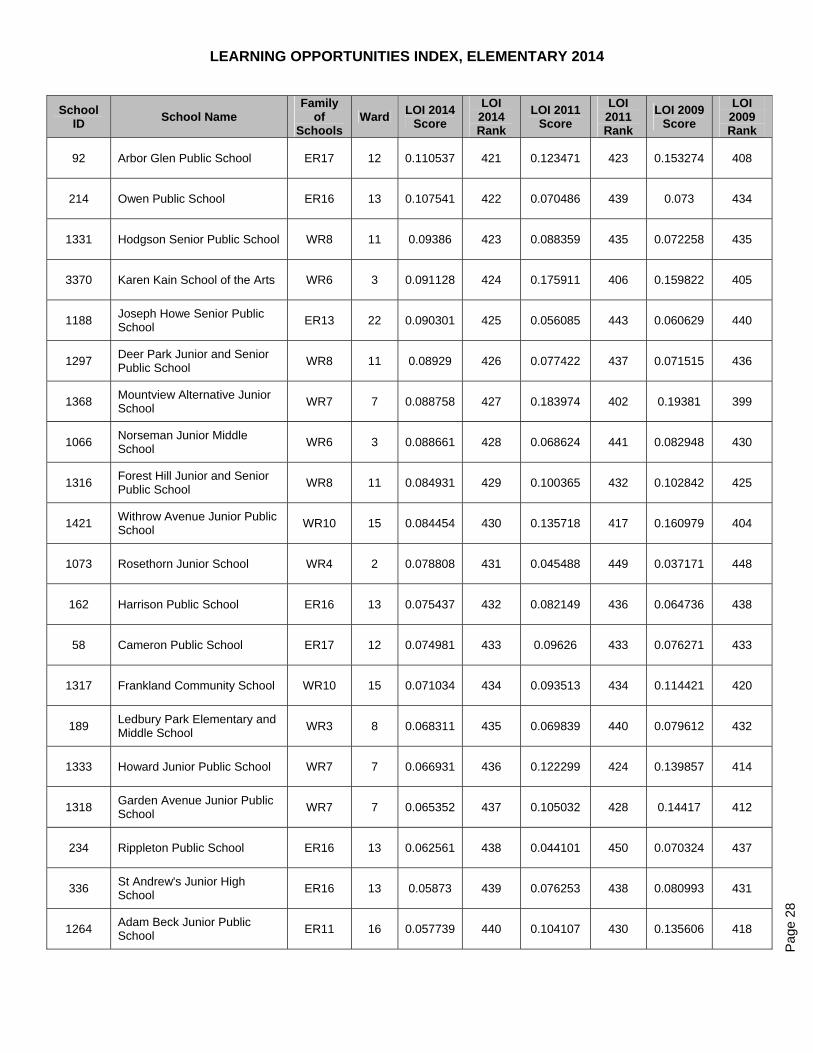
LEARNING OPPORTUNITIES INDEX, ELEMENTARY 2014
Pag
e 7
School ID
School Name Family
of Schools
Ward LOI 2014
Score
LOI 2014 Rank
LOI 2011 Score
LOI 2011 Rank
LOI 2009 Score
LOI 2009 Rank
194 Maple Leaf Public School WR5 6 0.98816 1 0.991464 1 0.992779 1
1382 Nelson Mandela Park Public School
WR9 14 0.984217 2 0.982134 6 0.990082 2
126 Flemington Public School WR3 8 0.982542 3 0.980034 7 0.980339 7
247 Shoreham Public Sports and Wellness Academy
WR2 4 0.981357 4 0.986689 3 0.986243 4
190 Lawrence Heights Middle School
WR3 8 0.980141 5 0.955958 13 0.953673 16
296 Yorkwoods Public School WR2 4 0.977853 6 0.967346 10 0.948685 20
168 Firgrove Public School WR2 4 0.976625 7 0.967121 11 0.96375 10
1260 Willow Park Junior Public School
ER14 22 0.974785 8 0.983524 4 0.983149 5
1403 Sprucecourt Public School WR9 14 0.969943 9 0.976411 8 0.980241 8
100 Driftwood Public School WR2 4 0.966938 10 0.975334 9 0.972897 9
1429 Cordella Junior Public School WR5 6 0.959569 11 0.955249 14 0.931315 24
66 Chalkfarm Public School WR2 4 0.958847 12 0.96559 12 0.958767 13
209 Oakdale Park Middle School WR2 5 0.958632 13 0.944317 20 0.913939 31
267 Topcliff Public School WR2 4 0.952793 14 0.945026 19 0.959705 12
180 Brookview Middle School WR2 4 0.951075 15 0.951916 15 0.957146 14
1355 Lord Dufferin Junior and Senior Public School
WR9 14 0.950699 16 0.986869 2 0.98252 6
1146 Eastview Public School ER13 22 0.95011 17 0.951813 16 0.950323 17
1239 St Margaret's Public School ER20 22 0.946273 18 0.923733 26 0.940976 23
144 Gosford Public School WR2 4 0.944149 19 0.931901 23 0.96106 11
1031 Braeburn Junior School WR1 1 0.941889 20 0.879053 46 0.913203 32
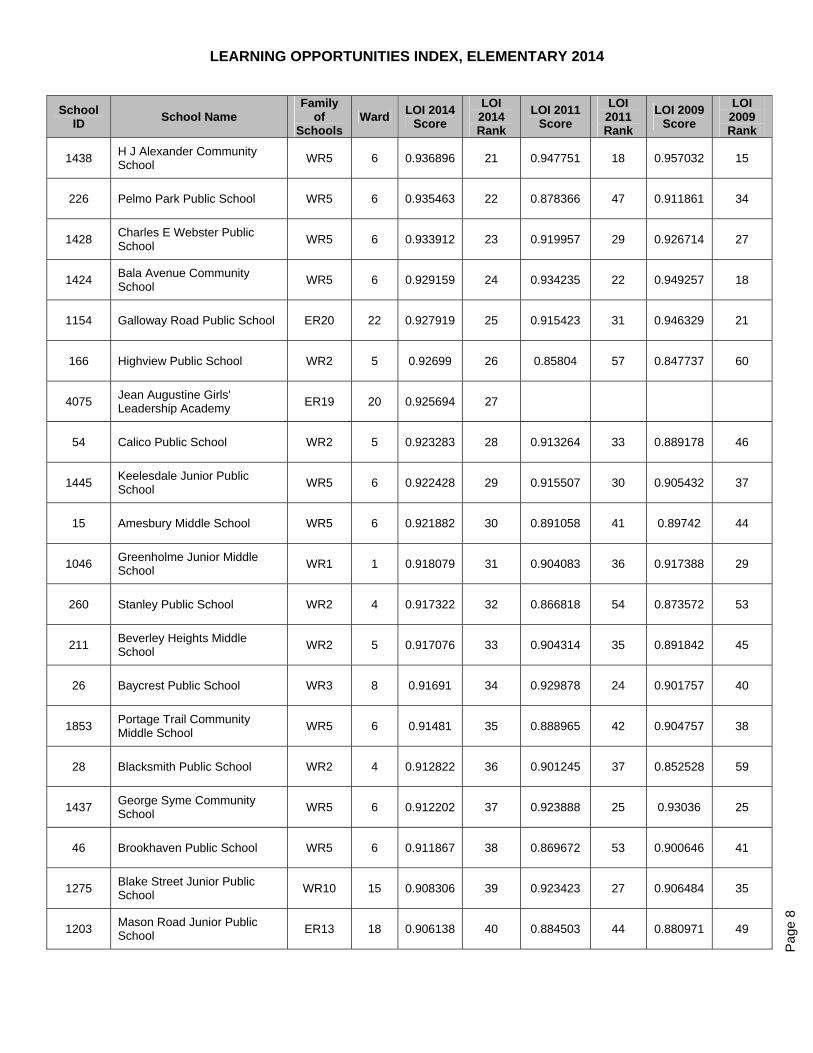
LEARNING OPPORTUNITIES INDEX, ELEMENTARY 2014
Pag
e 8
School ID
School Name Family
of Schools
Ward LOI 2014
Score
LOI 2014 Rank
LOI 2011 Score
LOI 2011 Rank
LOI 2009 Score
LOI 2009 Rank
1438 H J Alexander Community School
WR5 6 0.936896 21 0.947751 18 0.957032 15
226 Pelmo Park Public School WR5 6 0.935463 22 0.878366 47 0.911861 34
1428 Charles E Webster Public School
WR5 6 0.933912 23 0.919957 29 0.926714 27
1424 Bala Avenue Community School
WR5 6 0.929159 24 0.934235 22 0.949257 18
1154 Galloway Road Public School ER20 22 0.927919 25 0.915423 31 0.946329 21
166 Highview Public School WR2 5 0.92699 26 0.85804 57 0.847737 60
4075 Jean Augustine Girls' Leadership Academy
ER19 20 0.925694 27
54 Calico Public School WR2 5 0.923283 28 0.913264 33 0.889178 46
1445 Keelesdale Junior Public School
WR5 6 0.922428 29 0.915507 30 0.905432 37
15 Amesbury Middle School WR5 6 0.921882 30 0.891058 41 0.89742 44
1046 Greenholme Junior Middle School
WR1 1 0.918079 31 0.904083 36 0.917388 29
260 Stanley Public School WR2 4 0.917322 32 0.866818 54 0.873572 53
211 Beverley Heights Middle School
WR2 5 0.917076 33 0.904314 35 0.891842 45
26 Baycrest Public School WR3 8 0.91691 34 0.929878 24 0.901757 40
1853 Portage Trail Community Middle School
WR5 6 0.91481 35 0.888965 42 0.904757 38
28 Blacksmith Public School WR2 4 0.912822 36 0.901245 37 0.852528 59
1437 George Syme Community School
WR5 6 0.912202 37 0.923888 25 0.93036 25
46 Brookhaven Public School WR5 6 0.911867 38 0.869672 53 0.900646 41
1275 Blake Street Junior Public School
WR10 15 0.908306 39 0.923423 27 0.906484 35
1203 Mason Road Junior Public School
ER13 18 0.906138 40 0.884503 44 0.880971 49
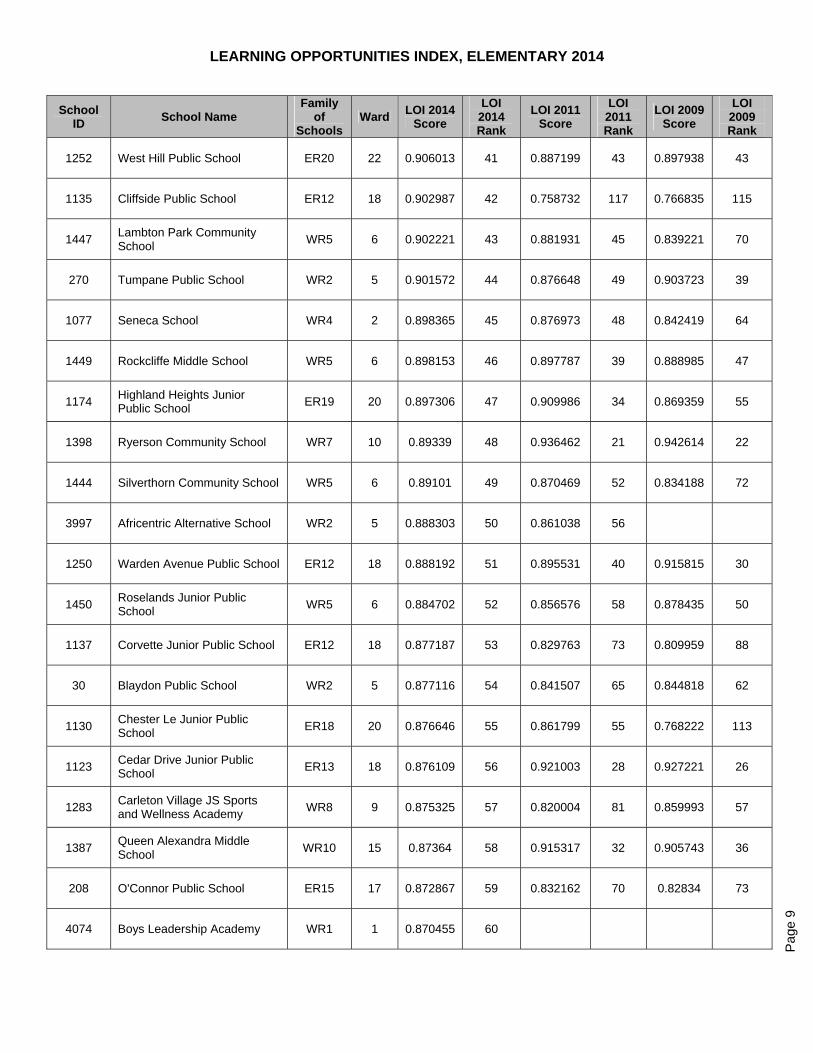
LEARNING OPPORTUNITIES INDEX, ELEMENTARY 2014
Pag
e 9
School ID
School Name Family
of Schools
Ward LOI 2014
Score
LOI 2014 Rank
LOI 2011 Score
LOI 2011 Rank
LOI 2009 Score
LOI 2009 Rank
1252 West Hill Public School ER20 22 0.906013 41 0.887199 43 0.897938 43
1135 Cliffside Public School ER12 18 0.902987 42 0.758732 117 0.766835 115
1447 Lambton Park Community School
WR5 6 0.902221 43 0.881931 45 0.839221 70
270 Tumpane Public School WR2 5 0.901572 44 0.876648 49 0.903723 39
1077 Seneca School WR4 2 0.898365 45 0.876973 48 0.842419 64
1449 Rockcliffe Middle School WR5 6 0.898153 46 0.897787 39 0.888985 47
1174 Highland Heights Junior Public School
ER19 20 0.897306 47 0.909986 34 0.869359 55
1398 Ryerson Community School WR7 10 0.89339 48 0.936462 21 0.942614 22
1444 Silverthorn Community School WR5 6 0.89101 49 0.870469 52 0.834188 72
3997 Africentric Alternative School WR2 5 0.888303 50 0.861038 56
1250 Warden Avenue Public School ER12 18 0.888192 51 0.895531 40 0.915815 30
1450 Roselands Junior Public School
WR5 6 0.884702 52 0.856576 58 0.878435 50
1137 Corvette Junior Public School ER12 18 0.877187 53 0.829763 73 0.809959 88
30 Blaydon Public School WR2 5 0.877116 54 0.841507 65 0.844818 62
1130 Chester Le Junior Public School
ER18 20 0.876646 55 0.861799 55 0.768222 113
1123 Cedar Drive Junior Public School
ER13 18 0.876109 56 0.921003 28 0.927221 26
1283 Carleton Village JS Sports and Wellness Academy
WR8 9 0.875325 57 0.820004 81 0.859993 57
1387 Queen Alexandra Middle School
WR10 15 0.87364 58 0.915317 32 0.905743 36
208 O'Connor Public School ER15 17 0.872867 59 0.832162 70 0.82834 73
4074 Boys Leadership Academy WR1 1 0.870455 60
LEARNING OPPORTUNITIES INDEX, ELEMENTARY 2014
Pag
e 10
School ID
School Name Family
of Schools
Ward LOI 2014
Score
LOI 2014 Rank
LOI 2011 Score
LOI 2011 Rank
LOI 2009 Score
LOI 2009 Rank
1057 Kingsview Village Junior School
WR4 1 0.870442 61 0.815553 88 0.812587 84
1084 The Elms Junior Middle School
WR1 1 0.869269 62 0.802242 97 0.841184 66
1207 Military Trail Public School ER20 22 0.866578 63 0.876038 50 0.899285 42
261 Stilecroft Public School WR2 5 0.861967 64 0.810479 91 0.757766 123
1431 Dennis Avenue Community School
WR5 6 0.86053 65 0.901015 38 0.923305 28
1854 Portage Trail Community Junior School
WR5 6 0.860404 66 0.817979 85 0.827468 75
246 Sheppard Public School WR2 5 0.854354 67 0.87485 51 0.872549 54
1314 First Nations Junior and Senior School of Toronto
WR10 15 0.854238 68 0.841458 66 0.913047 33
1040 Elmbank Junior Middle Academy
WR1 1 0.852225 69 0.702603 153 0.760613 118
94 Downsview Public School WR2 5 0.850071 70 0.824991 80 0.775392 107
1357 Lucy McCormick Senior School
WR7 7 0.84881 71 0.828356 75 0.824705 76
154 Gulfstream Public School WR1 4 0.846102 72 0.810149 92 0.791106 98
1011 George Webster Elementary School
ER11 16 0.83915 73 0.825711 79 0.822376 77
1087 Valleyfield Junior School WR4 2 0.836807 74 0.819322 82 0.840661 67
182 Joyce Public School WR3 8 0.836745 75 0.845036 63 0.842414 65
1426 C R Marchant Middle School WR5 6 0.835126 76 0.810691 89 0.815542 83
1090 West Glen Junior School WR4 2 0.83253 77 0.838154 67 0.878397 51
91 Derrydown Public School WR2 4 0.829833 78 0.792102 103 0.795536 95
1161 Glen Ravine Junior Public School
ER14 19 0.828819 79 0.837105 68 0.866251 56
1454 Warren Park Junior Public School
WR6 7 0.828618 80 0.854439 59 0.808977 89
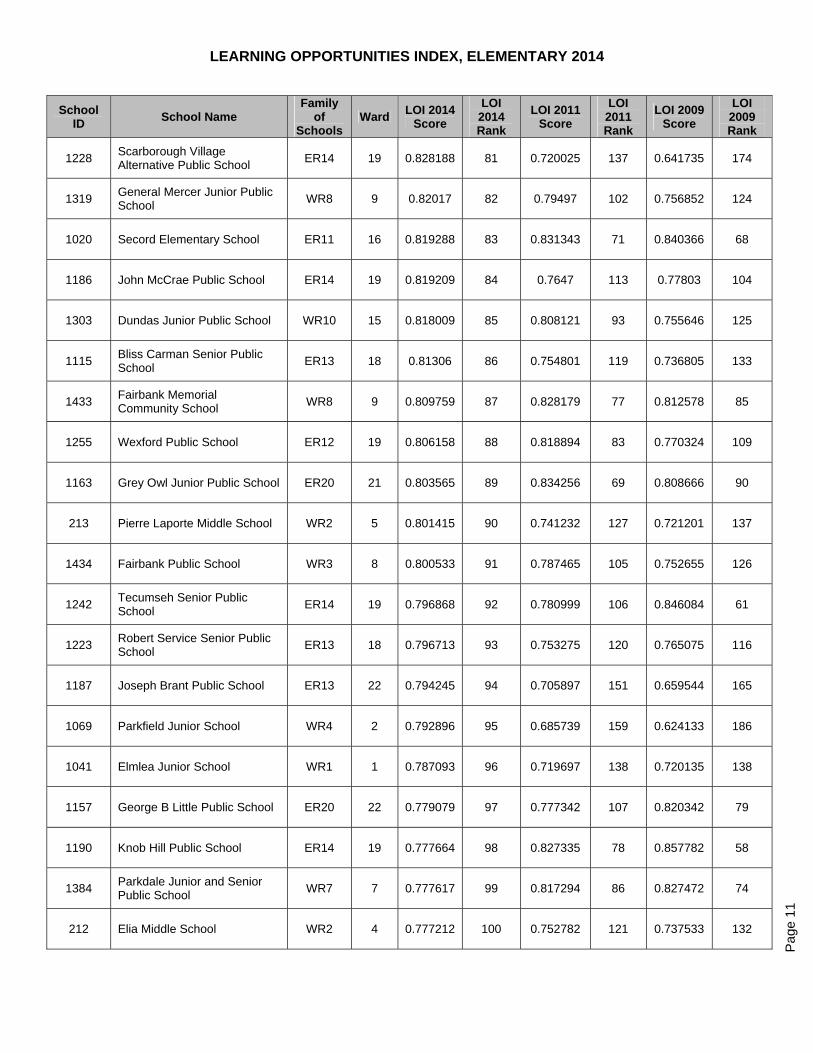
LEARNING OPPORTUNITIES INDEX, ELEMENTARY 2014
Pag
e 11
School ID
School Name Family
of Schools
Ward LOI 2014
Score
LOI 2014 Rank
LOI 2011 Score
LOI 2011 Rank
LOI 2009 Score
LOI 2009 Rank
1228 Scarborough Village Alternative Public School
ER14 19 0.828188 81 0.720025 137 0.641735 174
1319 General Mercer Junior Public School
WR8 9 0.82017 82 0.79497 102 0.756852 124
1020 Secord Elementary School ER11 16 0.819288 83 0.831343 71 0.840366 68
1186 John McCrae Public School ER14 19 0.819209 84 0.7647 113 0.77803 104
1303 Dundas Junior Public School WR10 15 0.818009 85 0.808121 93 0.755646 125
1115 Bliss Carman Senior Public School
ER13 18 0.81306 86 0.754801 119 0.736805 133
1433 Fairbank Memorial Community School
WR8 9 0.809759 87 0.828179 77 0.812578 85
1255 Wexford Public School ER12 19 0.806158 88 0.818894 83 0.770324 109
1163 Grey Owl Junior Public School ER20 21 0.803565 89 0.834256 69 0.808666 90
213 Pierre Laporte Middle School WR2 5 0.801415 90 0.741232 127 0.721201 137
1434 Fairbank Public School WR3 8 0.800533 91 0.787465 105 0.752655 126
1242 Tecumseh Senior Public School
ER14 19 0.796868 92 0.780999 106 0.846084 61
1223 Robert Service Senior Public School
ER13 18 0.796713 93 0.753275 120 0.765075 116
1187 Joseph Brant Public School ER13 22 0.794245 94 0.705897 151 0.659544 165
1069 Parkfield Junior School WR4 2 0.792896 95 0.685739 159 0.624133 186
1041 Elmlea Junior School WR1 1 0.787093 96 0.719697 138 0.720135 138
1157 George B Little Public School ER20 22 0.779079 97 0.777342 107 0.820342 79
1190 Knob Hill Public School ER14 19 0.777664 98 0.827335 78 0.857782 58
1384 Parkdale Junior and Senior Public School
WR7 7 0.777617 99 0.817294 86 0.827472 74
212 Elia Middle School WR2 4 0.777212 100 0.752782 121 0.737533 132
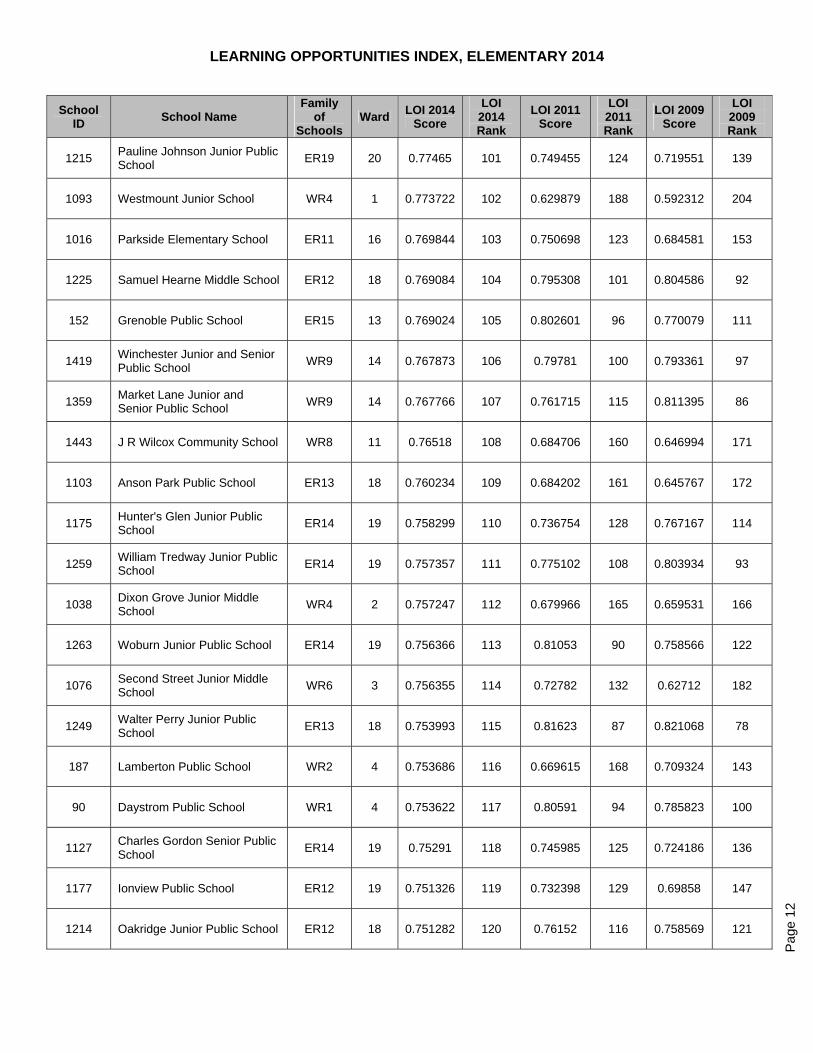
LEARNING OPPORTUNITIES INDEX, ELEMENTARY 2014
Pag
e 12
School ID
School Name Family
of Schools
Ward LOI 2014
Score
LOI 2014 Rank
LOI 2011 Score
LOI 2011 Rank
LOI 2009 Score
LOI 2009 Rank
1215 Pauline Johnson Junior Public School
ER19 20 0.77465 101 0.749455 124 0.719551 139
1093 Westmount Junior School WR4 1 0.773722 102 0.629879 188 0.592312 204
1016 Parkside Elementary School ER11 16 0.769844 103 0.750698 123 0.684581 153
1225 Samuel Hearne Middle School ER12 18 0.769084 104 0.795308 101 0.804586 92
152 Grenoble Public School ER15 13 0.769024 105 0.802601 96 0.770079 111
1419 Winchester Junior and Senior Public School
WR9 14 0.767873 106 0.79781 100 0.793361 97
1359 Market Lane Junior and Senior Public School
WR9 14 0.767766 107 0.761715 115 0.811395 86
1443 J R Wilcox Community School WR8 11 0.76518 108 0.684706 160 0.646994 171
1103 Anson Park Public School ER13 18 0.760234 109 0.684202 161 0.645767 172
1175 Hunter's Glen Junior Public School
ER14 19 0.758299 110 0.736754 128 0.767167 114
1259 William Tredway Junior Public School
ER14 19 0.757357 111 0.775102 108 0.803934 93
1038 Dixon Grove Junior Middle School
WR4 2 0.757247 112 0.679966 165 0.659531 166
1263 Woburn Junior Public School ER14 19 0.756366 113 0.81053 90 0.758566 122
1076 Second Street Junior Middle School
WR6 3 0.756355 114 0.72782 132 0.62712 182
1249 Walter Perry Junior Public School
ER13 18 0.753993 115 0.81623 87 0.821068 78
187 Lamberton Public School WR2 4 0.753686 116 0.669615 168 0.709324 143
90 Daystrom Public School WR1 4 0.753622 117 0.80591 94 0.785823 100
1127 Charles Gordon Senior Public School
ER14 19 0.75291 118 0.745985 125 0.724186 136
1177 Ionview Public School ER12 19 0.751326 119 0.732398 129 0.69858 147
1214 Oakridge Junior Public School ER12 18 0.751282 120 0.76152 116 0.758569 121
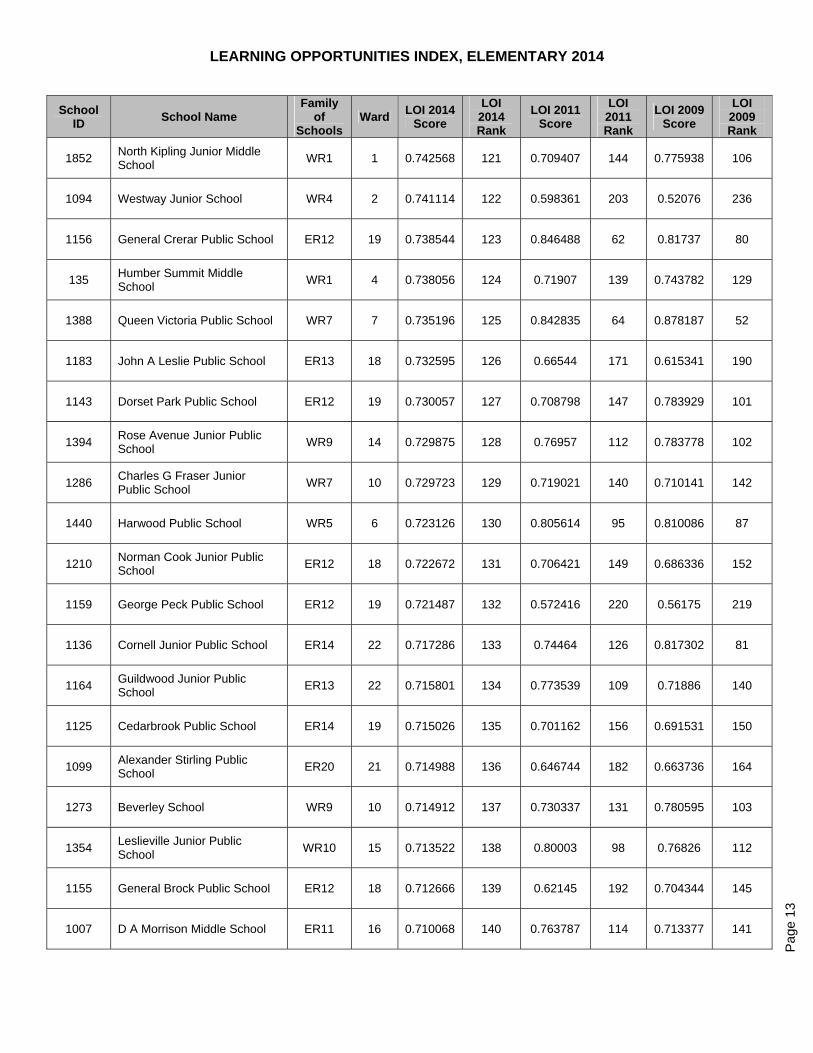
LEARNING OPPORTUNITIES INDEX, ELEMENTARY 2014
Pag
e 13
School ID
School Name Family
of Schools
Ward LOI 2014
Score
LOI 2014 Rank
LOI 2011 Score
LOI 2011 Rank
LOI 2009 Score
LOI 2009 Rank
1852 North Kipling Junior Middle School
WR1 1 0.742568 121 0.709407 144 0.775938 106
1094 Westway Junior School WR4 2 0.741114 122 0.598361 203 0.52076 236
1156 General Crerar Public School ER12 19 0.738544 123 0.846488 62 0.81737 80
135 Humber Summit Middle School
WR1 4 0.738056 124 0.71907 139 0.743782 129
1388 Queen Victoria Public School WR7 7 0.735196 125 0.842835 64 0.878187 52
1183 John A Leslie Public School ER13 18 0.732595 126 0.66544 171 0.615341 190
1143 Dorset Park Public School ER12 19 0.730057 127 0.708798 147 0.783929 101
1394 Rose Avenue Junior Public School
WR9 14 0.729875 128 0.76957 112 0.783778 102
1286 Charles G Fraser Junior Public School
WR7 10 0.729723 129 0.719021 140 0.710141 142
1440 Harwood Public School WR5 6 0.723126 130 0.805614 95 0.810086 87
1210 Norman Cook Junior Public School
ER12 18 0.722672 131 0.706421 149 0.686336 152
1159 George Peck Public School ER12 19 0.721487 132 0.572416 220 0.56175 219
1136 Cornell Junior Public School ER14 22 0.717286 133 0.74464 126 0.817302 81
1164 Guildwood Junior Public School
ER13 22 0.715801 134 0.773539 109 0.71886 140
1125 Cedarbrook Public School ER14 19 0.715026 135 0.701162 156 0.691531 150
1099 Alexander Stirling Public School
ER20 21 0.714988 136 0.646744 182 0.663736 164
1273 Beverley School WR9 10 0.714912 137 0.730337 131 0.780595 103
1354 Leslieville Junior Public School
WR10 15 0.713522 138 0.80003 98 0.76826 112
1155 General Brock Public School ER12 18 0.712666 139 0.62145 192 0.704344 145
1007 D A Morrison Middle School ER11 16 0.710068 140 0.763787 114 0.713377 141
LEARNING OPPORTUNITIES INDEX, ELEMENTARY 2014
Pag
e 14
School ID
School Name Family
of Schools
Ward LOI 2014
Score
LOI 2014 Rank
LOI 2011 Score
LOI 2011 Rank
LOI 2009 Score
LOI 2009 Rank
1165 H A Halbert Junior Public School
ER13 18 0.70937 141 0.791626 104 0.760369 119
1086 Twentieth Street Junior School
WR6 3 0.70801 142 0.724994 134 0.694202 149
1376 Ogden Junior Public School WR7 10 0.706067 143 0.709272 146 0.696817 148
1312 Essex Junior and Senior Public School
WR9 10 0.705174 144 0.6824 162 0.560987 220
1004 Chester Elementary School WR10 15 0.702782 145 0.717493 141 0.672897 157
10 Ancaster Public School WR3 5 0.702764 146 0.642911 184 0.760922 117
129 Gateway Public School ER15 13 0.700964 147 0.701946 154 0.670177 159
1448 Rawlinson Community School WR8 9 0.698987 148 0.681484 163 0.667005 162
145 Gracedale Public School WR1 4 0.696571 149 0.628531 189 0.671304 158
1417 William J McCordic School ER11 16 0.692426 150 0.799661 99 0.800332 94
4077 Downtown Vocal Music Academy of Toronto
WR7 10 0.691402 151
1012 Gordon A Brown Middle School
ER11 16 0.691133 152 0.623489 190 0.649408 168
1147 Edgewood Public School ER14 19 0.688385 153 0.568687 222 0.636717 176
4076 Vocal Music Academy at Heather Heights
ER20 22 0.687441 154
1386 Perth Avenue Junior Public School
WR7 9 0.683859 155 0.653306 176 0.668705 160
1265 Alexander Muir/Gladstone Ave Junior and Senior Public School
WR7 9 0.678101 156 0.722946 135 0.746551 128
1184 John Buchan Senior Public School
ER19 20 0.677293 157 0.651585 177 0.595983 200
1023 Valley Park Middle School ER16 13 0.676476 158 0.69999 157 0.678249 156
1028 Beaumonde Heights Junior Middle School
WR1 1 0.676399 159 0.609691 197 0.59349 203
1139 Danforth Gardens Public School
ER12 18 0.672959 160 0.770023 111 0.8161 82
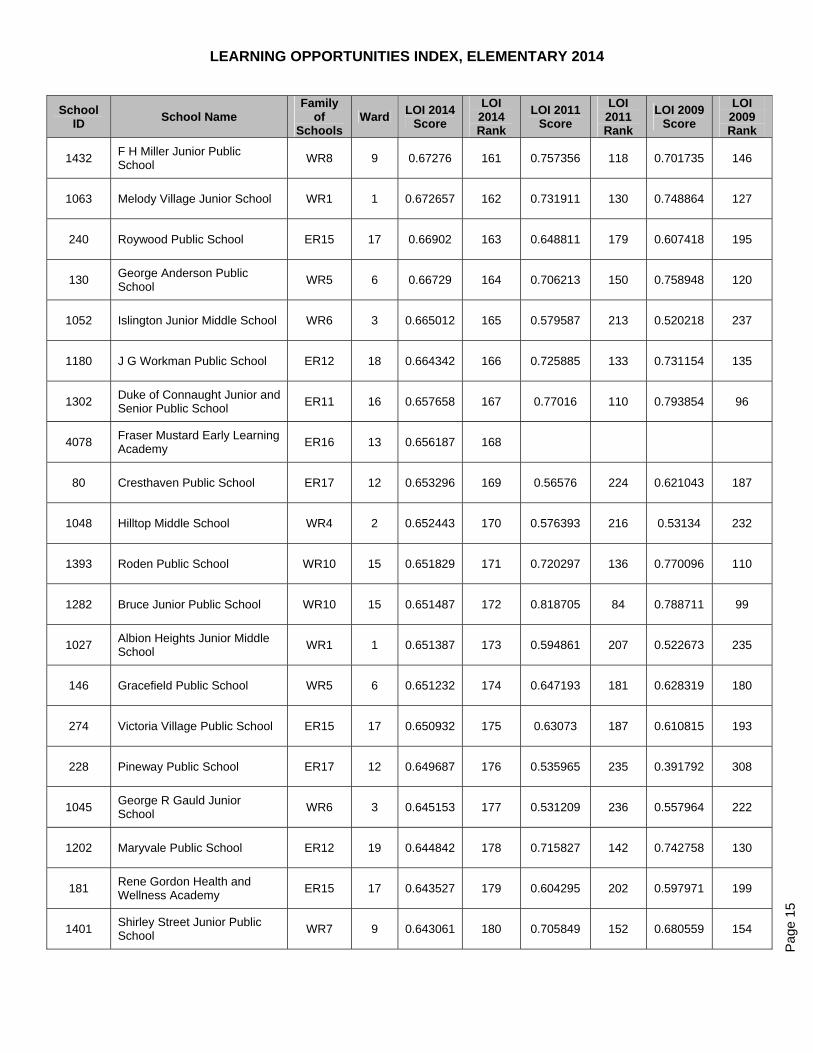
LEARNING OPPORTUNITIES INDEX, ELEMENTARY 2014
Pag
e 15
School ID
School Name Family
of Schools
Ward LOI 2014
Score
LOI 2014 Rank
LOI 2011 Score
LOI 2011 Rank
LOI 2009 Score
LOI 2009 Rank
1432 F H Miller Junior Public School
WR8 9 0.67276 161 0.757356 118 0.701735 146
1063 Melody Village Junior School WR1 1 0.672657 162 0.731911 130 0.748864 127
240 Roywood Public School ER15 17 0.66902 163 0.648811 179 0.607418 195
130 George Anderson Public School
WR5 6 0.66729 164 0.706213 150 0.758948 120
1052 Islington Junior Middle School WR6 3 0.665012 165 0.579587 213 0.520218 237
1180 J G Workman Public School ER12 18 0.664342 166 0.725885 133 0.731154 135
1302 Duke of Connaught Junior and Senior Public School
ER11 16 0.657658 167 0.77016 110 0.793854 96
4078 Fraser Mustard Early Learning Academy
ER16 13 0.656187 168
80 Cresthaven Public School ER17 12 0.653296 169 0.56576 224 0.621043 187
1048 Hilltop Middle School WR4 2 0.652443 170 0.576393 216 0.53134 232
1393 Roden Public School WR10 15 0.651829 171 0.720297 136 0.770096 110
1282 Bruce Junior Public School WR10 15 0.651487 172 0.818705 84 0.788711 99
1027 Albion Heights Junior Middle School
WR1 1 0.651387 173 0.594861 207 0.522673 235
146 Gracefield Public School WR5 6 0.651232 174 0.647193 181 0.628319 180
274 Victoria Village Public School ER15 17 0.650932 175 0.63073 187 0.610815 193
228 Pineway Public School ER17 12 0.649687 176 0.535965 235 0.391792 308
1045 George R Gauld Junior School
WR6 3 0.645153 177 0.531209 236 0.557964 222
1202 Maryvale Public School ER12 19 0.644842 178 0.715827 142 0.742758 130
181 Rene Gordon Health and Wellness Academy
ER15 17 0.643527 179 0.604295 202 0.597971 199
1401 Shirley Street Junior Public School
WR7 9 0.643061 180 0.705849 152 0.680559 154

LEARNING OPPORTUNITIES INDEX, ELEMENTARY 2014
Pag
e 16
School ID
School Name Family
of Schools
Ward LOI 2014
Score
LOI 2014 Rank
LOI 2011 Score
LOI 2011 Rank
LOI 2009 Score
LOI 2009 Rank
1153 Fleming Public School ER20 21 0.642035 181 0.551789 227 0.552169 225
1120 Buchanan Public School ER12 19 0.641204 182 0.622842 191 0.628357 179
1194 Lucy Maud Montgomery Public School
ER20 21 0.64085 183 0.596696 205 0.613889 192
1134 Clairlea Public School ER12 18 0.638166 184 0.650109 178 0.648905 169
1162 Golf Road Junior Public School
ER14 19 0.636897 185 0.574577 217 0.577878 212
1167 Heather Heights Junior Public School
ER20 22 0.636038 186 0.518741 246 0.586831 205
1406 Sunny View Junior and Senior Public School
ER16 13 0.634067 187 0.706919 148 0.771137 108
1301 Downtown Alternative School WR9 14 0.630317 188 0.63786 185 0.539371 229
120 Fenside Public School ER15 17 0.628154 189 0.598032 204 0.553301 224
1025 Westwood Middle School WR10 15 0.627822 190 0.70171 155 0.627951 181
1160 Glamorgan Junior Public School
ER15 20 0.626669 191 0.660177 174 0.686529 151
1036 Claireville Junior School WR1 1 0.626058 192 0.577467 214 0.626656 183
96 Donview Middle Health and Wellness Academy
ER15 17 0.625495 193 0.57299 219 0.575821 213
1367 Morse Street Junior Public School
WR10 15 0.623661 194 0.829538 74 0.881519 48
1026 William Burgess Elementary School
WR10 15 0.621794 195 0.660634 173 0.59492 201
1212 North Bendale Junior Public School
ER14 19 0.619938 196 0.668011 169 0.647771 170
1168 Henry Hudson Senior Public School
ER20 22 0.618623 197 0.608825 198 0.625794 184
1247 Tom Longboat Junior Public School
ER20 21 0.618456 198 0.566549 223 0.620987 188
1022 Thorncliffe Park Public School ER16 13 0.617515 199 0.671901 167 0.639056 175
1199 Manhattan Park Junior Public School
ER12 19 0.616476 200 0.513853 249 0.571097 214
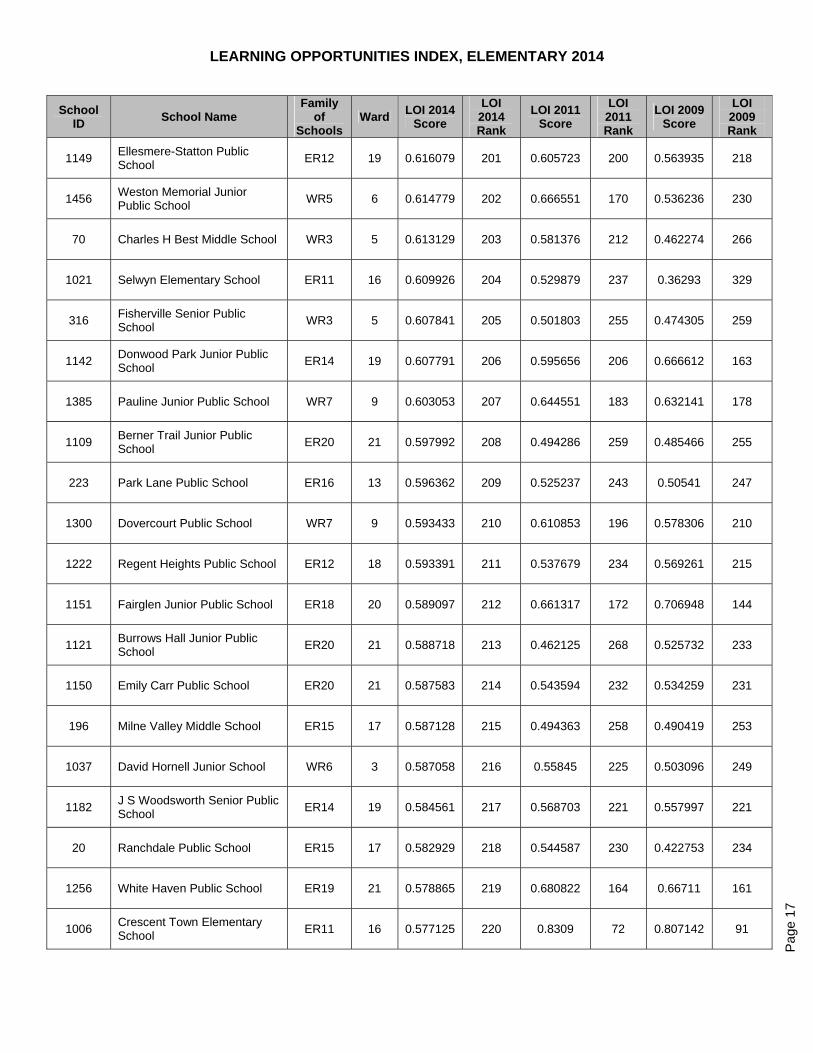
LEARNING OPPORTUNITIES INDEX, ELEMENTARY 2014
Pag
e 17
School ID
School Name Family
of Schools
Ward LOI 2014
Score
LOI 2014 Rank
LOI 2011 Score
LOI 2011 Rank
LOI 2009 Score
LOI 2009 Rank
1149 Ellesmere-Statton Public School
ER12 19 0.616079 201 0.605723 200 0.563935 218
1456 Weston Memorial Junior Public School
WR5 6 0.614779 202 0.666551 170 0.536236 230
70 Charles H Best Middle School WR3 5 0.613129 203 0.581376 212 0.462274 266
1021 Selwyn Elementary School ER11 16 0.609926 204 0.529879 237 0.36293 329
316 Fisherville Senior Public School
WR3 5 0.607841 205 0.501803 255 0.474305 259
1142 Donwood Park Junior Public School
ER14 19 0.607791 206 0.595656 206 0.666612 163
1385 Pauline Junior Public School WR7 9 0.603053 207 0.644551 183 0.632141 178
1109 Berner Trail Junior Public School
ER20 21 0.597992 208 0.494286 259 0.485466 255
223 Park Lane Public School ER16 13 0.596362 209 0.525237 243 0.50541 247
1300 Dovercourt Public School WR7 9 0.593433 210 0.610853 196 0.578306 210
1222 Regent Heights Public School ER12 18 0.593391 211 0.537679 234 0.569261 215
1151 Fairglen Junior Public School ER18 20 0.589097 212 0.661317 172 0.706948 144
1121 Burrows Hall Junior Public School
ER20 21 0.588718 213 0.462125 268 0.525732 233
1150 Emily Carr Public School ER20 21 0.587583 214 0.543594 232 0.534259 231
196 Milne Valley Middle School ER15 17 0.587128 215 0.494363 258 0.490419 253
1037 David Hornell Junior School WR6 3 0.587058 216 0.55845 225 0.503096 249
1182 J S Woodsworth Senior Public School
ER14 19 0.584561 217 0.568703 221 0.557997 221
20 Ranchdale Public School ER15 17 0.582929 218 0.544587 230 0.422753 234
1256 White Haven Public School ER19 21 0.578865 219 0.680822 164 0.66711 161
1006 Crescent Town Elementary School
ER11 16 0.577125 220 0.8309 72 0.807142 91
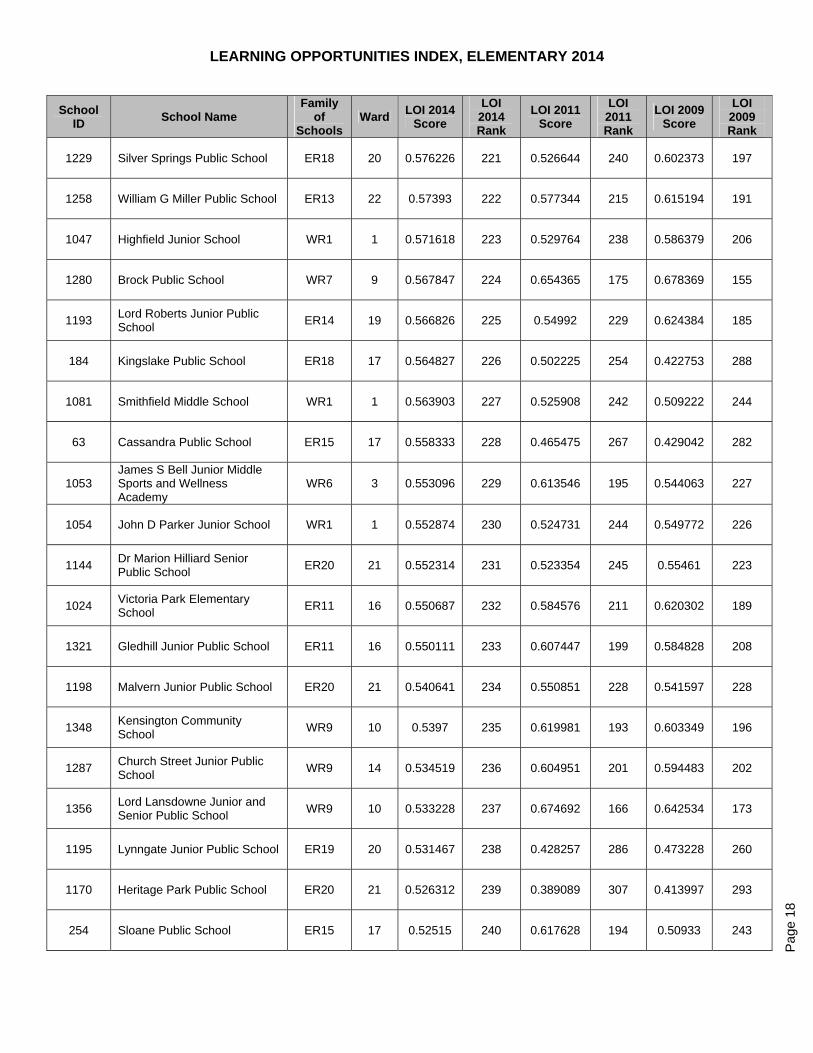
LEARNING OPPORTUNITIES INDEX, ELEMENTARY 2014
Pag
e 18
School ID
School Name Family
of Schools
Ward LOI 2014
Score
LOI 2014 Rank
LOI 2011 Score
LOI 2011 Rank
LOI 2009 Score
LOI 2009 Rank
1229 Silver Springs Public School ER18 20 0.576226 221 0.526644 240 0.602373 197
1258 William G Miller Public School ER13 22 0.57393 222 0.577344 215 0.615194 191
1047 Highfield Junior School WR1 1 0.571618 223 0.529764 238 0.586379 206
1280 Brock Public School WR7 9 0.567847 224 0.654365 175 0.678369 155
1193 Lord Roberts Junior Public School
ER14 19 0.566826 225 0.54992 229 0.624384 185
184 Kingslake Public School ER18 17 0.564827 226 0.502225 254 0.422753 288
1081 Smithfield Middle School WR1 1 0.563903 227 0.525908 242 0.509222 244
63 Cassandra Public School ER15 17 0.558333 228 0.465475 267 0.429042 282
1053 James S Bell Junior Middle Sports and Wellness Academy
WR6 3 0.553096 229 0.613546 195 0.544063 227
1054 John D Parker Junior School WR1 1 0.552874 230 0.524731 244 0.549772 226
1144 Dr Marion Hilliard Senior Public School
ER20 21 0.552314 231 0.523354 245 0.55461 223
1024 Victoria Park Elementary School
ER11 16 0.550687 232 0.584576 211 0.620302 189
1321 Gledhill Junior Public School ER11 16 0.550111 233 0.607447 199 0.584828 208
1198 Malvern Junior Public School ER20 21 0.540641 234 0.550851 228 0.541597 228
1348 Kensington Community School
WR9 10 0.5397 235 0.619981 193 0.603349 196
1287 Church Street Junior Public School
WR9 14 0.534519 236 0.604951 201 0.594483 202
1356 Lord Lansdowne Junior and Senior Public School
WR9 10 0.533228 237 0.674692 166 0.642534 173
1195 Lynngate Junior Public School ER19 20 0.531467 238 0.428257 286 0.473228 260
1170 Heritage Park Public School ER20 21 0.526312 239 0.389089 307 0.413997 293
254 Sloane Public School ER15 17 0.52515 240 0.617628 194 0.50933 243

LEARNING OPPORTUNITIES INDEX, ELEMENTARY 2014
Pag
e 19
School ID
School Name Family
of Schools
Ward LOI 2014
Score
LOI 2014 Rank
LOI 2011 Score
LOI 2011 Rank
LOI 2009 Score
LOI 2009 Rank
1176 Inglewood Heights Junior Public School
ER19 20 0.524933 241 0.51768 247 0.585948 207
95 Don Mills Middle School ER15 17 0.520477 242 0.49792 257 0.428544 283
1416 Wilkinson Junior Public School
WR10 15 0.511882 243 0.633319 186 0.610448 194
1342 Jesse Ketchum Junior and Senior Public School
WR9 14 0.510426 244 0.586976 210 0.50643 245
1381 Pape Avenue Junior Public School
WR10 15 0.509168 245 0.648552 180 0.733098 134
1173 Highland Creek Public School ER20 22 0.50619 246 0.505709 251 0.509557 242
1296 Davisville Junior Public School WR8 11 0.506155 247 0.573667 218 0.519689 238
1089 Wellesworth Junior School WR4 2 0.505715 248 0.416786 291 0.473152 261
38 Broadlands Public School ER15 17 0.503765 249 0.499949 256 0.448855 270
1030 Bloorlea Middle School WR6 3 0.503717 250 0.503081 253 0.475082 258
1111 Birch Cliff Heights Public School
ER12 18 0.502049 251 0.493376 260 0.51048 241
138 Glen Park Public School WR3 8 0.494861 252 0.589928 208 0.567195 216
1218 Poplar Road Junior Public School
ER13 22 0.492328 253 0.510518 250 0.512175 240
1185 John G Diefenbaker Public School
ER20 22 0.490121 254 0.47945 263 0.466443 265
1039 Eatonville Junior School WR4 2 0.489704 255 0.588759 209 0.503357 248
201 Muirhead Public School ER18 17 0.487813 256 0.440963 280 0.450641 268
1078 Seventh Street Junior School WR6 3 0.487519 257 0.543699 231 0.470346 262
1158 George P Mackie Junior Public School
ER13 18 0.487512 258 0.538044 233 0.602072 198
1108 Bendale Junior Public School ER14 19 0.481912 259 0.375829 319 0.376041 323
1306 Earl Haig Public School ER11 16 0.481129 260 0.526026 241 0.584157 209
LEARNING OPPORTUNITIES INDEX, ELEMENTARY 2014
Pag
e 20
School ID
School Name Family
of Schools
Ward LOI 2014
Score
LOI 2014 Rank
LOI 2011 Score
LOI 2011 Rank
LOI 2009 Score
LOI 2009 Rank
235 Rockford Public School WR3 5 0.479038 261 0.460932 270 0.434645 278
1189 Kennedy Public School ER18 20 0.477733 262 0.48153 262 0.494936 252
1366 Montrose Junior Public School WR9 10 0.473197 263 0.459369 273 0.446181 272
1032 Briarcrest Junior School WR4 2 0.468089 264 0.361057 332 0.393865 306
1110 Beverly Glen Junior Public School
ER18 20 0.467236 265 0.441582 278 0.423899 287
1224 Rouge Valley Public School ER13 22 0.46684 266 0.425812 288 0.505989 246
1196 Lynnwood Heights Junior Public School
ER19 20 0.465684 267 0.529449 239 0.578005 211
1131 Chief Dan George Public School
ER20 22 0.462253 268 0.237656 385 0.300361 356
1133 Churchill Heights Public School
ER14 19 0.459951 269 0.383106 312 0.394309 305
1219 Port Royal Public School ER19 21 0.459257 270 0.415265 293 0.37621 322
1100 Alexmuir Junior Public School ER19 21 0.457473 271 0.427071 287 0.485004 256
1369 Niagara Street Junior Public School
WR7 10 0.457018 272 0.503622 252 0.450427 269
122 Finch Public School ER17 12 0.456056 273 0.416325 292 0.412147 296
1172 Highcastle Public School ER20 22 0.455416 274 0.483834 261 0.411038 297
102 Dublin Heights Elementary and Middle School
WR3 5 0.455116 275 0.329806 347 0.325107 347
1243 Terraview-Willowfield Public School
ER15 20 0.454694 276 0.380413 317 0.237398 381
1033 Broadacres Junior School WR4 2 0.451712 277 0.412815 294 0.364712 328
230 Pleasant Public School ER17 12 0.448961 278 0.404597 298 0.384135 314
345 Woodbine Junior High School ER18 17 0.447135 279 0.459594 272 0.373019 326
3996 ALPHA II Alternative School WR7 9 0.447124 280 0.311155 356 0.283909 363
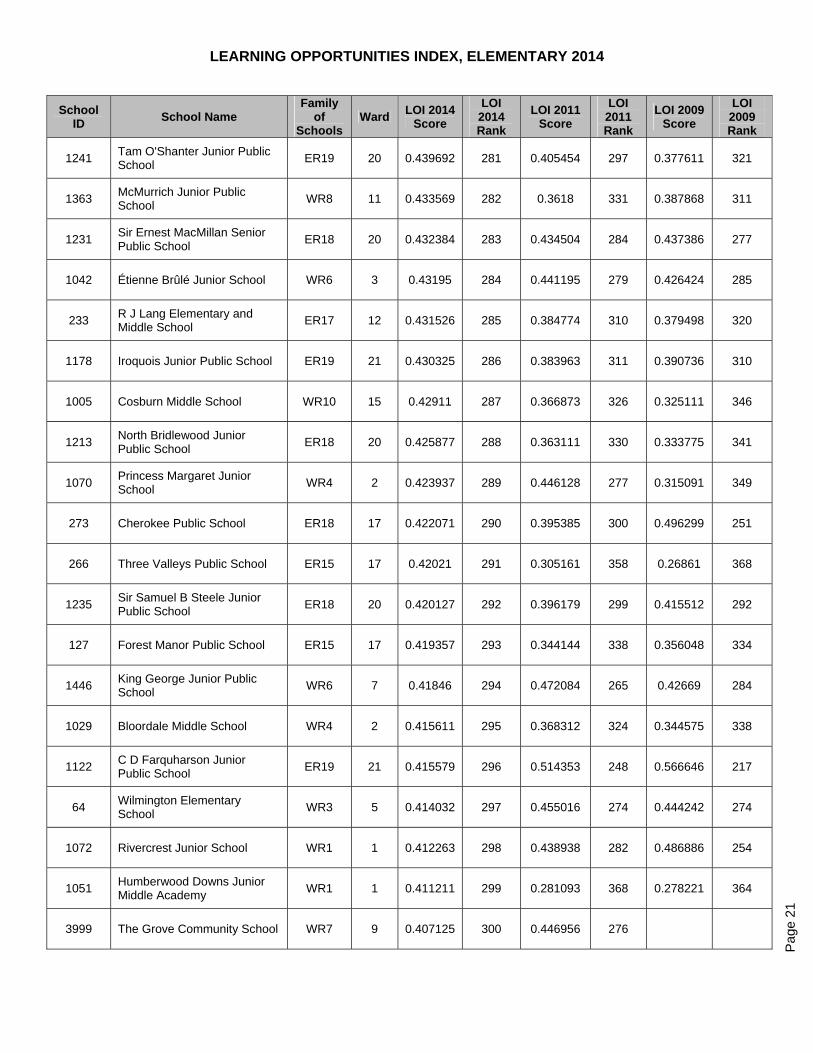
LEARNING OPPORTUNITIES INDEX, ELEMENTARY 2014
Pag
e 21
School ID
School Name Family
of Schools
Ward LOI 2014
Score
LOI 2014 Rank
LOI 2011 Score
LOI 2011 Rank
LOI 2009 Score
LOI 2009 Rank
1241 Tam O'Shanter Junior Public School
ER19 20 0.439692 281 0.405454 297 0.377611 321
1363 McMurrich Junior Public School
WR8 11 0.433569 282 0.3618 331 0.387868 311
1231 Sir Ernest MacMillan Senior Public School
ER18 20 0.432384 283 0.434504 284 0.437386 277
1042 Étienne Brûlé Junior School WR6 3 0.43195 284 0.441195 279 0.426424 285
233 R J Lang Elementary and Middle School
ER17 12 0.431526 285 0.384774 310 0.379498 320
1178 Iroquois Junior Public School ER19 21 0.430325 286 0.383963 311 0.390736 310
1005 Cosburn Middle School WR10 15 0.42911 287 0.366873 326 0.325111 346
1213 North Bridlewood Junior Public School
ER18 20 0.425877 288 0.363111 330 0.333775 341
1070 Princess Margaret Junior School
WR4 2 0.423937 289 0.446128 277 0.315091 349
273 Cherokee Public School ER18 17 0.422071 290 0.395385 300 0.496299 251
266 Three Valleys Public School ER15 17 0.42021 291 0.305161 358 0.26861 368
1235 Sir Samuel B Steele Junior Public School
ER18 20 0.420127 292 0.396179 299 0.415512 292
127 Forest Manor Public School ER15 17 0.419357 293 0.344144 338 0.356048 334
1446 King George Junior Public School
WR6 7 0.41846 294 0.472084 265 0.42669 284
1029 Bloordale Middle School WR4 2 0.415611 295 0.368312 324 0.344575 338
1122 C D Farquharson Junior Public School
ER19 21 0.415579 296 0.514353 248 0.566646 217
64 Wilmington Elementary School
WR3 5 0.414032 297 0.455016 274 0.444242 274
1072 Rivercrest Junior School WR1 1 0.412263 298 0.438938 282 0.486886 254
1051 Humberwood Downs Junior Middle Academy
WR1 1 0.411211 299 0.281093 368 0.278221 364
3999 The Grove Community School WR7 9 0.407125 300 0.446956 276
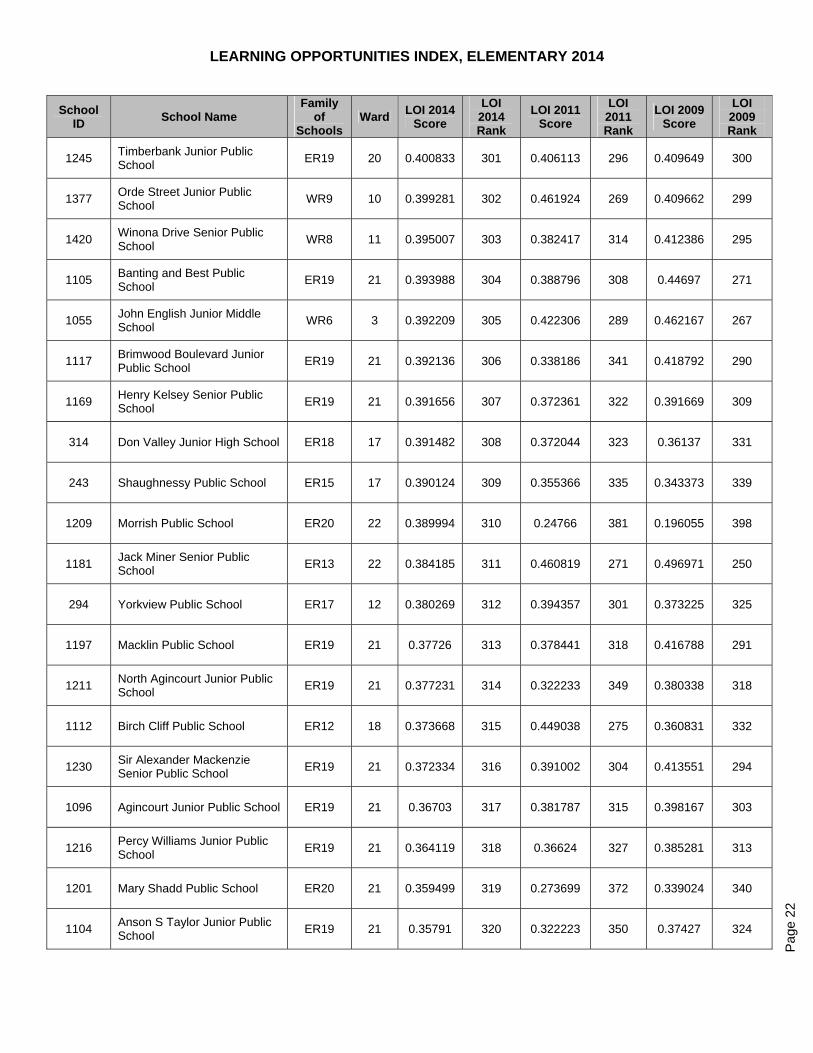
LEARNING OPPORTUNITIES INDEX, ELEMENTARY 2014
Pag
e 22
School ID
School Name Family
of Schools
Ward LOI 2014
Score
LOI 2014 Rank
LOI 2011 Score
LOI 2011 Rank
LOI 2009 Score
LOI 2009 Rank
1245 Timberbank Junior Public School
ER19 20 0.400833 301 0.406113 296 0.409649 300
1377 Orde Street Junior Public School
WR9 10 0.399281 302 0.461924 269 0.409662 299
1420 Winona Drive Senior Public School
WR8 11 0.395007 303 0.382417 314 0.412386 295
1105 Banting and Best Public School
ER19 21 0.393988 304 0.388796 308 0.44697 271
1055 John English Junior Middle School
WR6 3 0.392209 305 0.422306 289 0.462167 267
1117 Brimwood Boulevard Junior Public School
ER19 21 0.392136 306 0.338186 341 0.418792 290
1169 Henry Kelsey Senior Public School
ER19 21 0.391656 307 0.372361 322 0.391669 309
314 Don Valley Junior High School ER18 17 0.391482 308 0.372044 323 0.36137 331
243 Shaughnessy Public School ER15 17 0.390124 309 0.355366 335 0.343373 339
1209 Morrish Public School ER20 22 0.389994 310 0.24766 381 0.196055 398
1181 Jack Miner Senior Public School
ER13 22 0.384185 311 0.460819 271 0.496971 250
294 Yorkview Public School ER17 12 0.380269 312 0.394357 301 0.373225 325
1197 Macklin Public School ER19 21 0.37726 313 0.378441 318 0.416788 291
1211 North Agincourt Junior Public School
ER19 21 0.377231 314 0.322233 349 0.380338 318
1112 Birch Cliff Public School ER12 18 0.373668 315 0.449038 275 0.360831 332
1230 Sir Alexander Mackenzie Senior Public School
ER19 21 0.372334 316 0.391002 304 0.413551 294
1096 Agincourt Junior Public School ER19 21 0.36703 317 0.381787 315 0.398167 303
1216 Percy Williams Junior Public School
ER19 21 0.364119 318 0.36624 327 0.385281 313
1201 Mary Shadd Public School ER20 21 0.359499 319 0.273699 372 0.339024 340
1104 Anson S Taylor Junior Public School
ER19 21 0.35791 320 0.322223 350 0.37427 324
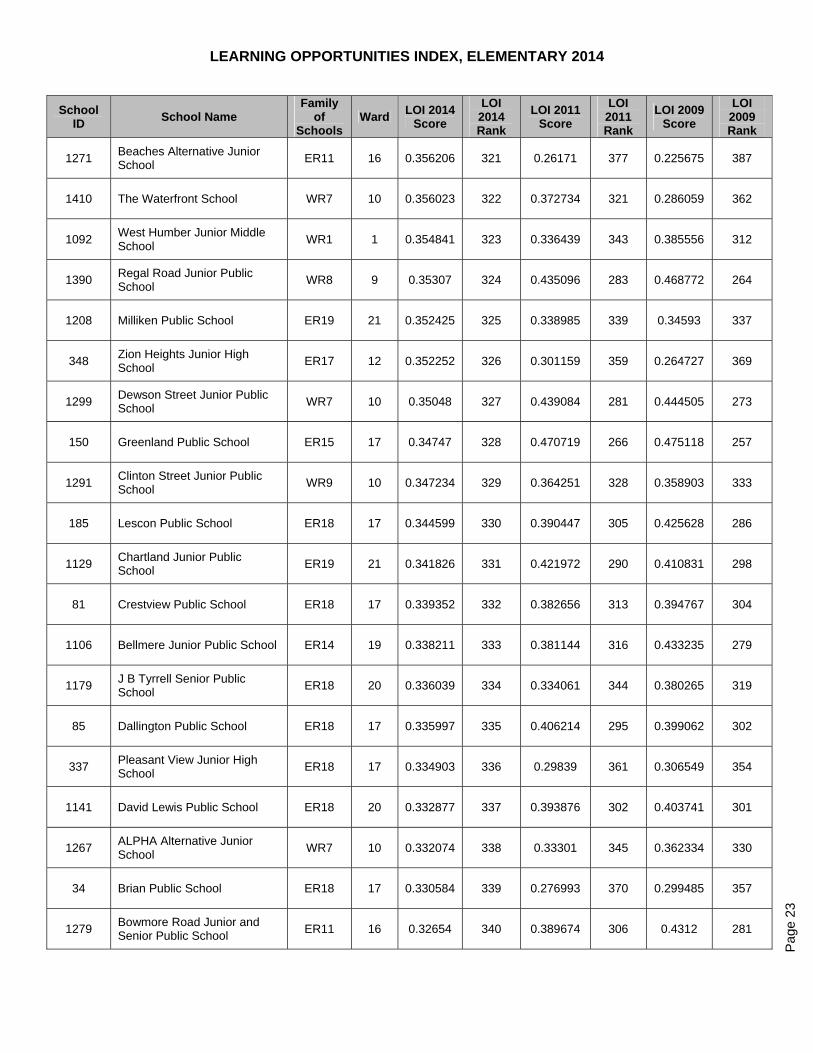
LEARNING OPPORTUNITIES INDEX, ELEMENTARY 2014
Pag
e 23
School ID
School Name Family
of Schools
Ward LOI 2014
Score
LOI 2014 Rank
LOI 2011 Score
LOI 2011 Rank
LOI 2009 Score
LOI 2009 Rank
1271 Beaches Alternative Junior School
ER11 16 0.356206 321 0.26171 377 0.225675 387
1410 The Waterfront School WR7 10 0.356023 322 0.372734 321 0.286059 362
1092 West Humber Junior Middle School
WR1 1 0.354841 323 0.336439 343 0.385556 312
1390 Regal Road Junior Public School
WR8 9 0.35307 324 0.435096 283 0.468772 264
1208 Milliken Public School ER19 21 0.352425 325 0.338985 339 0.34593 337
348 Zion Heights Junior High School
ER17 12 0.352252 326 0.301159 359 0.264727 369
1299 Dewson Street Junior Public School
WR7 10 0.35048 327 0.439084 281 0.444505 273
150 Greenland Public School ER15 17 0.34747 328 0.470719 266 0.475118 257
1291 Clinton Street Junior Public School
WR9 10 0.347234 329 0.364251 328 0.358903 333
185 Lescon Public School ER18 17 0.344599 330 0.390447 305 0.425628 286
1129 Chartland Junior Public School
ER19 21 0.341826 331 0.421972 290 0.410831 298
81 Crestview Public School ER18 17 0.339352 332 0.382656 313 0.394767 304
1106 Bellmere Junior Public School ER14 19 0.338211 333 0.381144 316 0.433235 279
1179 J B Tyrrell Senior Public School
ER18 20 0.336039 334 0.334061 344 0.380265 319
85 Dallington Public School ER18 17 0.335997 335 0.406214 295 0.399062 302
337 Pleasant View Junior High School
ER18 17 0.334903 336 0.29839 361 0.306549 354
1141 David Lewis Public School ER18 20 0.332877 337 0.393876 302 0.403741 301
1267 ALPHA Alternative Junior School
WR7 10 0.332074 338 0.33301 345 0.362334 330
34 Brian Public School ER18 17 0.330584 339 0.276993 370 0.299485 357
1279 Bowmore Road Junior and Senior Public School
ER11 16 0.32654 340 0.389674 306 0.4312 281
LEARNING OPPORTUNITIES INDEX, ELEMENTARY 2014
Pag
e 24
School ID
School Name Family
of Schools
Ward LOI 2014
Score
LOI 2014 Rank
LOI 2011 Score
LOI 2011 Rank
LOI 2009 Score
LOI 2009 Rank
1379 Ossington/Old Orchard Junior Public School
WR7 10 0.313891 341 0.373743 320 0.382917 316
1352 King Edward Junior and Senior Public School
WR9 10 0.313246 342 0.430883 285 0.440568 275
111 Ernest Public School ER18 17 0.311136 343 0.476483 264 0.469454 263
1305 Earl Grey Senior Public School
WR10 15 0.309253 344 0.269382 373 0.333459 342
3992 da Vinci Alternative School WR9 10 0.306954 345 0.38874 309
1244 Terry Fox Public School ER18 20 0.306632 346 0.300676 360 0.331289 344
118 Faywood Arts-Based Curriculum School
WR3 5 0.302434 347 0.266652 374 0.270194 366
1327 Hawthorne II Bilingual Alternative Junior School
WR9 10 0.301647 348 0.291387 365 0.314907 350
1248 Vradenburg Junior Public School
ER18 20 0.29961 349 0.35783 333 0.305168 355
1347 Keele Street Public School WR7 7 0.297558 350 0.293438 363 0.257199 371
1118 Brookmill Boulevard Junior Public School
ER18 20 0.296374 351 0.338889 340 0.432632 280
1337 Indian Road Crescent Junior Public School
WR7 7 0.294828 352 0.391904 303 0.419005 289
210 Cummer Valley Middle School ER17 12 0.291346 353 0.311932 355 0.289953 360
1351 Kimberley Junior Public School
ER11 16 0.289474 354 0.33747 342 0.383875 315
186 Lillian Public School ER17 12 0.288314 355 0.313012 354 0.330878 345
1320 Givins/Shaw Junior Public School
WR7 10 0.284631 356 0.352619 336 0.382111 317
110 Elkhorn Public School ER17 12 0.281845 357 0.180519 403 0.17901 400
1370 North Preparatory Junior Public School
WR3 8 0.27978 358 0.242835 383 0.215981 391
82 Lester B Pearson Elementary School
ER17 12 0.272546 359 0.262146 376 0.247092 379
1238 St Andrews Public School ER14 19 0.272237 360 0.363515 329 0.36905 327
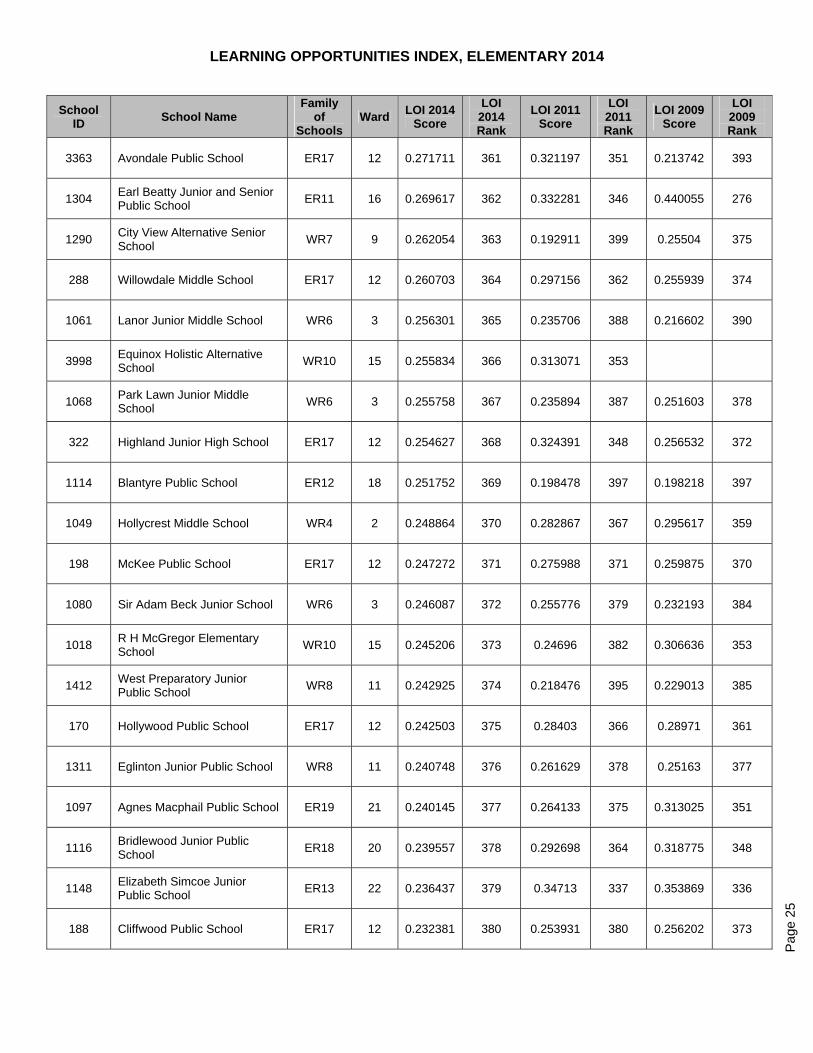
LEARNING OPPORTUNITIES INDEX, ELEMENTARY 2014
Pag
e 25
School ID
School Name Family
of Schools
Ward LOI 2014
Score
LOI 2014 Rank
LOI 2011 Score
LOI 2011 Rank
LOI 2009 Score
LOI 2009 Rank
3363 Avondale Public School ER17 12 0.271711 361 0.321197 351 0.213742 393
1304 Earl Beatty Junior and Senior Public School
ER11 16 0.269617 362 0.332281 346 0.440055 276
1290 City View Alternative Senior School
WR7 9 0.262054 363 0.192911 399 0.25504 375
288 Willowdale Middle School ER17 12 0.260703 364 0.297156 362 0.255939 374
1061 Lanor Junior Middle School WR6 3 0.256301 365 0.235706 388 0.216602 390
3998 Equinox Holistic Alternative School
WR10 15 0.255834 366 0.313071 353
1068 Park Lawn Junior Middle School
WR6 3 0.255758 367 0.235894 387 0.251603 378
322 Highland Junior High School ER17 12 0.254627 368 0.324391 348 0.256532 372
1114 Blantyre Public School ER12 18 0.251752 369 0.198478 397 0.198218 397
1049 Hollycrest Middle School WR4 2 0.248864 370 0.282867 367 0.295617 359
198 McKee Public School ER17 12 0.247272 371 0.275988 371 0.259875 370
1080 Sir Adam Beck Junior School WR6 3 0.246087 372 0.255776 379 0.232193 384
1018 R H McGregor Elementary School
WR10 15 0.245206 373 0.24696 382 0.306636 353
1412 West Preparatory Junior Public School
WR8 11 0.242925 374 0.218476 395 0.229013 385
170 Hollywood Public School ER17 12 0.242503 375 0.28403 366 0.28971 361
1311 Eglinton Junior Public School WR8 11 0.240748 376 0.261629 378 0.25163 377
1097 Agnes Macphail Public School ER19 21 0.240145 377 0.264133 375 0.313025 351
1116 Bridlewood Junior Public School
ER18 20 0.239557 378 0.292698 364 0.318775 348
1148 Elizabeth Simcoe Junior Public School
ER13 22 0.236437 379 0.34713 337 0.353869 336
188 Cliffwood Public School ER17 12 0.232381 380 0.253931 380 0.256202 373
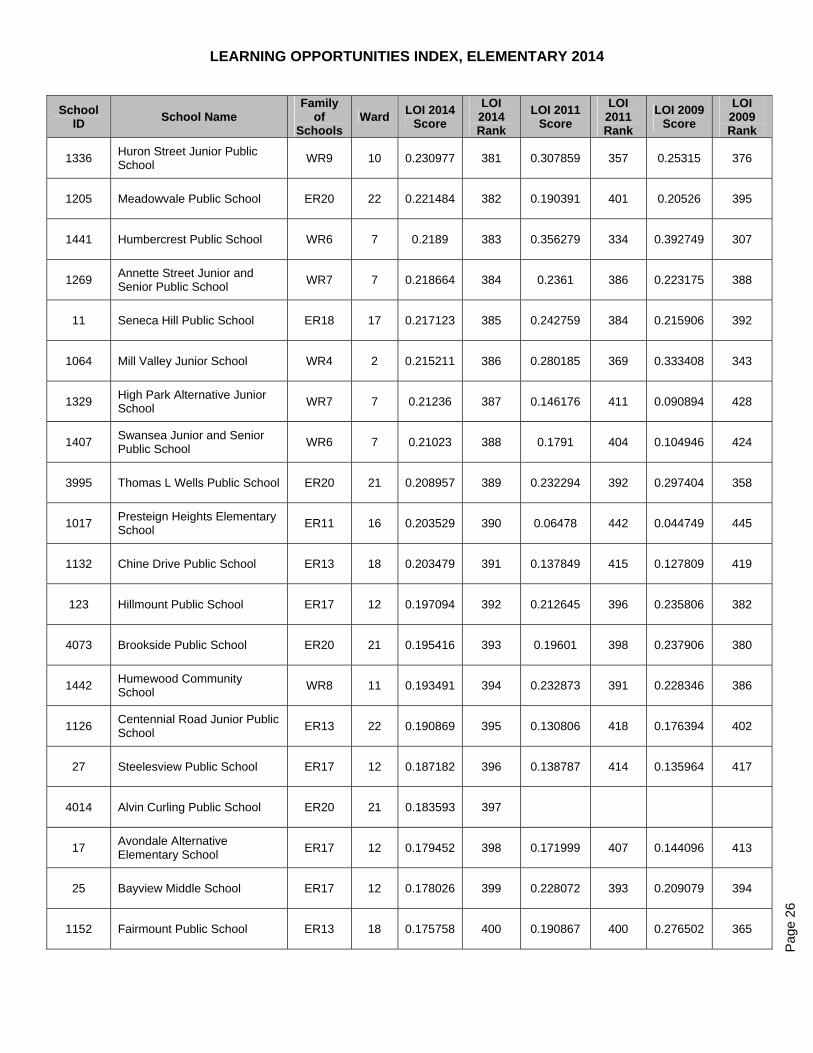
LEARNING OPPORTUNITIES INDEX, ELEMENTARY 2014
Pag
e 26
School ID
School Name Family
of Schools
Ward LOI 2014
Score
LOI 2014 Rank
LOI 2011 Score
LOI 2011 Rank
LOI 2009 Score
LOI 2009 Rank
1336 Huron Street Junior Public School
WR9 10 0.230977 381 0.307859 357 0.25315 376
1205 Meadowvale Public School ER20 22 0.221484 382 0.190391 401 0.20526 395
1441 Humbercrest Public School WR6 7 0.2189 383 0.356279 334 0.392749 307
1269 Annette Street Junior and Senior Public School
WR7 7 0.218664 384 0.2361 386 0.223175 388
11 Seneca Hill Public School ER18 17 0.217123 385 0.242759 384 0.215906 392
1064 Mill Valley Junior School WR4 2 0.215211 386 0.280185 369 0.333408 343
1329 High Park Alternative Junior School
WR7 7 0.21236 387 0.146176 411 0.090894 428
1407 Swansea Junior and Senior Public School
WR6 7 0.21023 388 0.1791 404 0.104946 424
3995 Thomas L Wells Public School ER20 21 0.208957 389 0.232294 392 0.297404 358
1017 Presteign Heights Elementary School
ER11 16 0.203529 390 0.06478 442 0.044749 445
1132 Chine Drive Public School ER13 18 0.203479 391 0.137849 415 0.127809 419
123 Hillmount Public School ER17 12 0.197094 392 0.212645 396 0.235806 382
4073 Brookside Public School ER20 21 0.195416 393 0.19601 398 0.237906 380
1442 Humewood Community School
WR8 11 0.193491 394 0.232873 391 0.228346 386
1126 Centennial Road Junior Public School
ER13 22 0.190869 395 0.130806 418 0.176394 402
27 Steelesview Public School ER17 12 0.187182 396 0.138787 414 0.135964 417
4014 Alvin Curling Public School ER20 21 0.183593 397
17 Avondale Alternative Elementary School
ER17 12 0.179452 398 0.171999 407 0.144096 413
25 Bayview Middle School ER17 12 0.178026 399 0.228072 393 0.209079 394
1152 Fairmount Public School ER13 18 0.175758 400 0.190867 400 0.276502 365
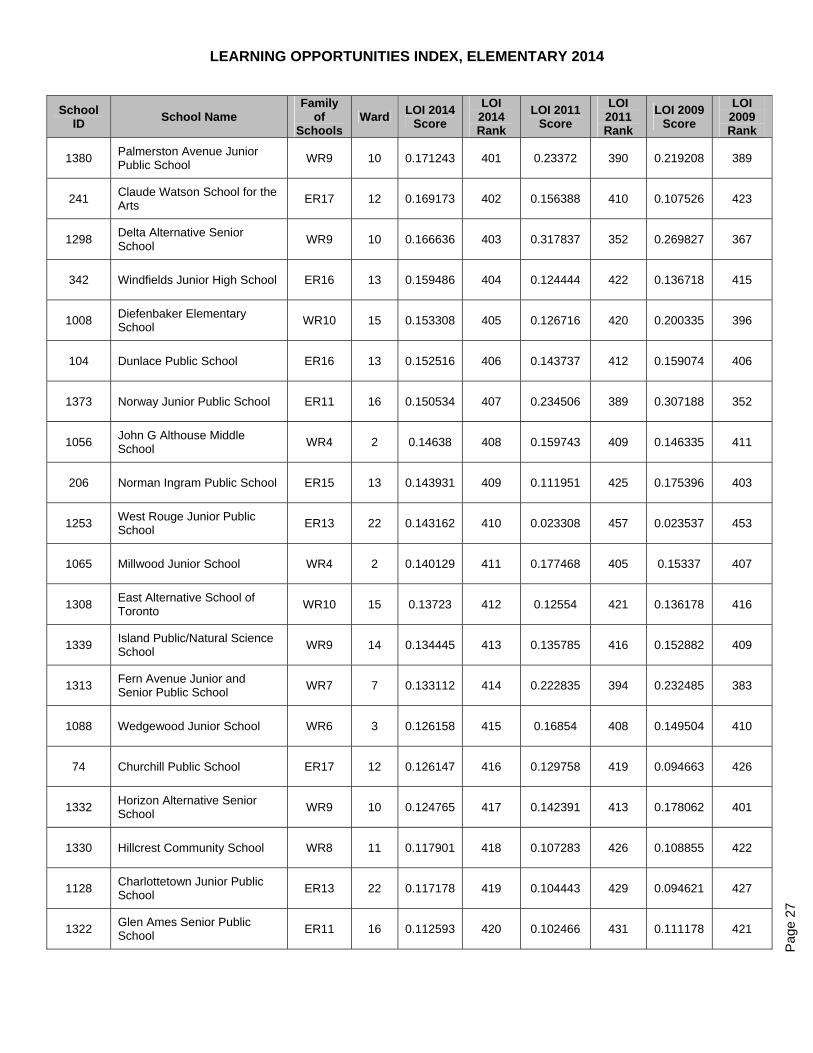
LEARNING OPPORTUNITIES INDEX, ELEMENTARY 2014
Pag
e 27
School ID
School Name Family
of Schools
Ward LOI 2014
Score
LOI 2014 Rank
LOI 2011 Score
LOI 2011 Rank
LOI 2009 Score
LOI 2009 Rank
1380 Palmerston Avenue Junior Public School
WR9 10 0.171243 401 0.23372 390 0.219208 389
241 Claude Watson School for the Arts
ER17 12 0.169173 402 0.156388 410 0.107526 423
1298 Delta Alternative Senior School
WR9 10 0.166636 403 0.317837 352 0.269827 367
342 Windfields Junior High School ER16 13 0.159486 404 0.124444 422 0.136718 415
1008 Diefenbaker Elementary School
WR10 15 0.153308 405 0.126716 420 0.200335 396
104 Dunlace Public School ER16 13 0.152516 406 0.143737 412 0.159074 406
1373 Norway Junior Public School ER11 16 0.150534 407 0.234506 389 0.307188 352
1056 John G Althouse Middle School
WR4 2 0.14638 408 0.159743 409 0.146335 411
206 Norman Ingram Public School ER15 13 0.143931 409 0.111951 425 0.175396 403
1253 West Rouge Junior Public School
ER13 22 0.143162 410 0.023308 457 0.023537 453
1065 Millwood Junior School WR4 2 0.140129 411 0.177468 405 0.15337 407
1308 East Alternative School of Toronto
WR10 15 0.13723 412 0.12554 421 0.136178 416
1339 Island Public/Natural Science School
WR9 14 0.134445 413 0.135785 416 0.152882 409
1313 Fern Avenue Junior and Senior Public School
WR7 7 0.133112 414 0.222835 394 0.232485 383
1088 Wedgewood Junior School WR6 3 0.126158 415 0.16854 408 0.149504 410
74 Churchill Public School ER17 12 0.126147 416 0.129758 419 0.094663 426
1332 Horizon Alternative Senior School
WR9 10 0.124765 417 0.142391 413 0.178062 401
1330 Hillcrest Community School WR8 11 0.117901 418 0.107283 426 0.108855 422
1128 Charlottetown Junior Public School
ER13 22 0.117178 419 0.104443 429 0.094621 427
1322 Glen Ames Senior Public School
ER11 16 0.112593 420 0.102466 431 0.111178 421
LEARNING OPPORTUNITIES INDEX, ELEMENTARY 2014
Pag
e 28
School ID
School Name Family
of Schools
Ward LOI 2014
Score
LOI 2014 Rank
LOI 2011 Score
LOI 2011 Rank
LOI 2009 Score
LOI 2009 Rank
92 Arbor Glen Public School ER17 12 0.110537 421 0.123471 423 0.153274 408
214 Owen Public School ER16 13 0.107541 422 0.070486 439 0.073 434
1331 Hodgson Senior Public School WR8 11 0.09386 423 0.088359 435 0.072258 435
3370 Karen Kain School of the Arts WR6 3 0.091128 424 0.175911 406 0.159822 405
1188 Joseph Howe Senior Public School
ER13 22 0.090301 425 0.056085 443 0.060629 440
1297 Deer Park Junior and Senior Public School
WR8 11 0.08929 426 0.077422 437 0.071515 436
1368 Mountview Alternative Junior School
WR7 7 0.088758 427 0.183974 402 0.19381 399
1066 Norseman Junior Middle School
WR6 3 0.088661 428 0.068624 441 0.082948 430
1316 Forest Hill Junior and Senior Public School
WR8 11 0.084931 429 0.100365 432 0.102842 425
1421 Withrow Avenue Junior Public School
WR10 15 0.084454 430 0.135718 417 0.160979 404
1073 Rosethorn Junior School WR4 2 0.078808 431 0.045488 449 0.037171 448
162 Harrison Public School ER16 13 0.075437 432 0.082149 436 0.064736 438
58 Cameron Public School ER17 12 0.074981 433 0.09626 433 0.076271 433
1317 Frankland Community School WR10 15 0.071034 434 0.093513 434 0.114421 420
189 Ledbury Park Elementary and Middle School
WR3 8 0.068311 435 0.069839 440 0.079612 432
1333 Howard Junior Public School WR7 7 0.066931 436 0.122299 424 0.139857 414
1318 Garden Avenue Junior Public School
WR7 7 0.065352 437 0.105032 428 0.14417 412
234 Rippleton Public School ER16 13 0.062561 438 0.044101 450 0.070324 437
336 St Andrew's Junior High School
ER16 13 0.05873 439 0.076253 438 0.080993 431
1264 Adam Beck Junior Public School
ER11 16 0.057739 440 0.104107 430 0.135606 418
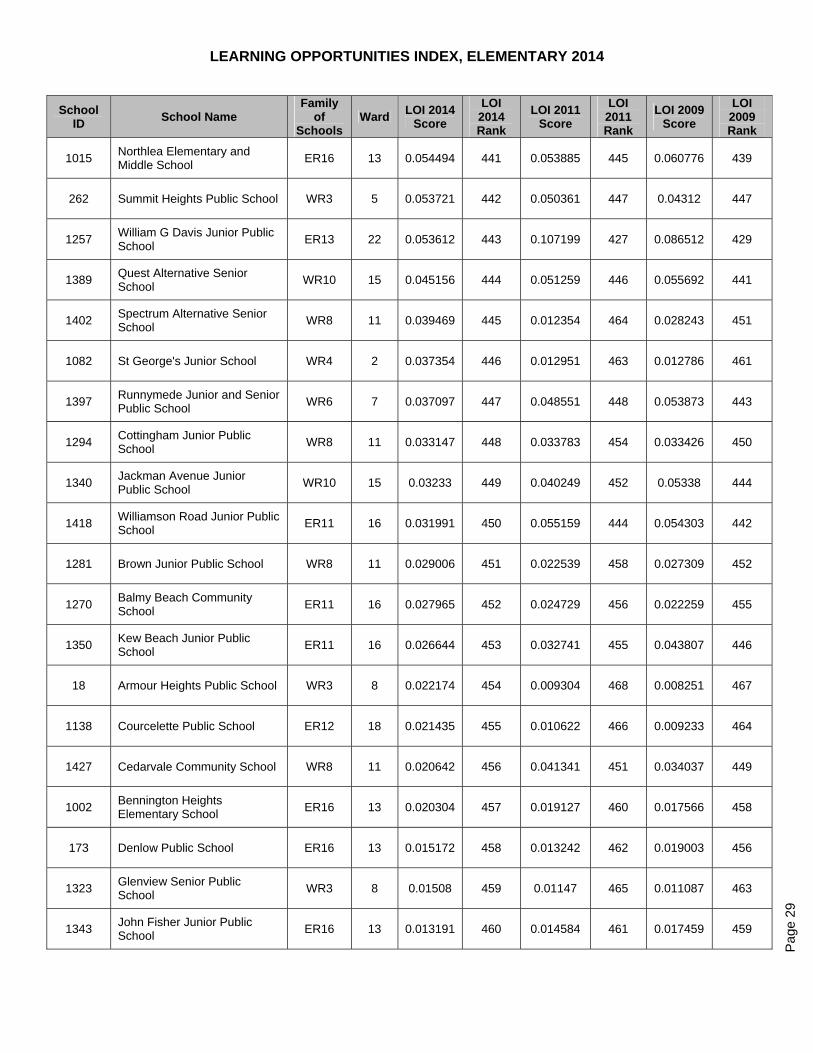
LEARNING OPPORTUNITIES INDEX, ELEMENTARY 2014
Pag
e 29
School ID
School Name Family
of Schools
Ward LOI 2014
Score
LOI 2014 Rank
LOI 2011 Score
LOI 2011 Rank
LOI 2009 Score
LOI 2009 Rank
1015 Northlea Elementary and Middle School
ER16 13 0.054494 441 0.053885 445 0.060776 439
262 Summit Heights Public School WR3 5 0.053721 442 0.050361 447 0.04312 447
1257 William G Davis Junior Public School
ER13 22 0.053612 443 0.107199 427 0.086512 429
1389 Quest Alternative Senior School
WR10 15 0.045156 444 0.051259 446 0.055692 441
1402 Spectrum Alternative Senior School
WR8 11 0.039469 445 0.012354 464 0.028243 451
1082 St George's Junior School WR4 2 0.037354 446 0.012951 463 0.012786 461
1397 Runnymede Junior and Senior Public School
WR6 7 0.037097 447 0.048551 448 0.053873 443
1294 Cottingham Junior Public School
WR8 11 0.033147 448 0.033783 454 0.033426 450
1340 Jackman Avenue Junior Public School
WR10 15 0.03233 449 0.040249 452 0.05338 444
1418 Williamson Road Junior Public School
ER11 16 0.031991 450 0.055159 444 0.054303 442
1281 Brown Junior Public School WR8 11 0.029006 451 0.022539 458 0.027309 452
1270 Balmy Beach Community School
ER11 16 0.027965 452 0.024729 456 0.022259 455
1350 Kew Beach Junior Public School
ER11 16 0.026644 453 0.032741 455 0.043807 446
18 Armour Heights Public School WR3 8 0.022174 454 0.009304 468 0.008251 467
1138 Courcelette Public School ER12 18 0.021435 455 0.010622 466 0.009233 464
1427 Cedarvale Community School WR8 11 0.020642 456 0.041341 451 0.034037 449
1002 Bennington Heights Elementary School
ER16 13 0.020304 457 0.019127 460 0.017566 458
173 Denlow Public School ER16 13 0.015172 458 0.013242 462 0.019003 456
1323 Glenview Senior Public School
WR3 8 0.01508 459 0.01147 465 0.011087 463
1343 John Fisher Junior Public School
ER16 13 0.013191 460 0.014584 461 0.017459 459

LEARNING OPPORTUNITIES INDEX, ELEMENTARY 2014
Pag
e 30
School ID
School Name Family
of Schools
Ward LOI 2014
Score
LOI 2014 Rank
LOI 2011 Score
LOI 2011 Rank
LOI 2009 Score
LOI 2009 Rank
1050 Humber Valley Village Junior Middle School
WR4 2 0.012402 461 0.009231 469 0.013842 460
1396 Rosedale Junior Public School WR9 14 0.01175 462 0.034061 453 0.023199 454
1345 John Wanless Junior Public School
WR3 8 0.011037 463 0.005408 474 0.005571 470
1003 Bessborough Drive Elementary and Middle School
ER16 13 0.009066 464 0.009384 467 0.00854 466
1019 Rolph Road Elementary School
ER16 13 0.009045 465 0.019433 459 0.018747 457
1361 Maurice Cody Junior Public School
WR8 11 0.006615 466 0.008218 470 0.01186 462
1272 Bedford Park Public School ER16 13 0.006146 467 0.005786 472 0.007079 469
1378 Oriole Park Junior Public School
WR8 11 0.005117 468 0.007935 471 0.007158 468
1083 Sunnylea Junior School WR6 3 0.00426 469 0.003475 475 0.005068 471
1266 Allenby Junior Public School WR3 8 0.003457 470 0.00556 473 0.008852 465
1344 John Ross Robertson Junior Public School
WR3 8 0.001361 471 0.001298 477 0.000982 473
1060 Lambton-Kingsway Junior Middle School
WR6 3 0.001138 472 0.001351 476 0.001786 472
1415 Whitney Junior Public School WR9 14 0.000645 473 0.000119 479 0.000093 475
1278 Blythwood Junior Public School
ER16 13 0.000637 474 0.000165 478 0.000195 474
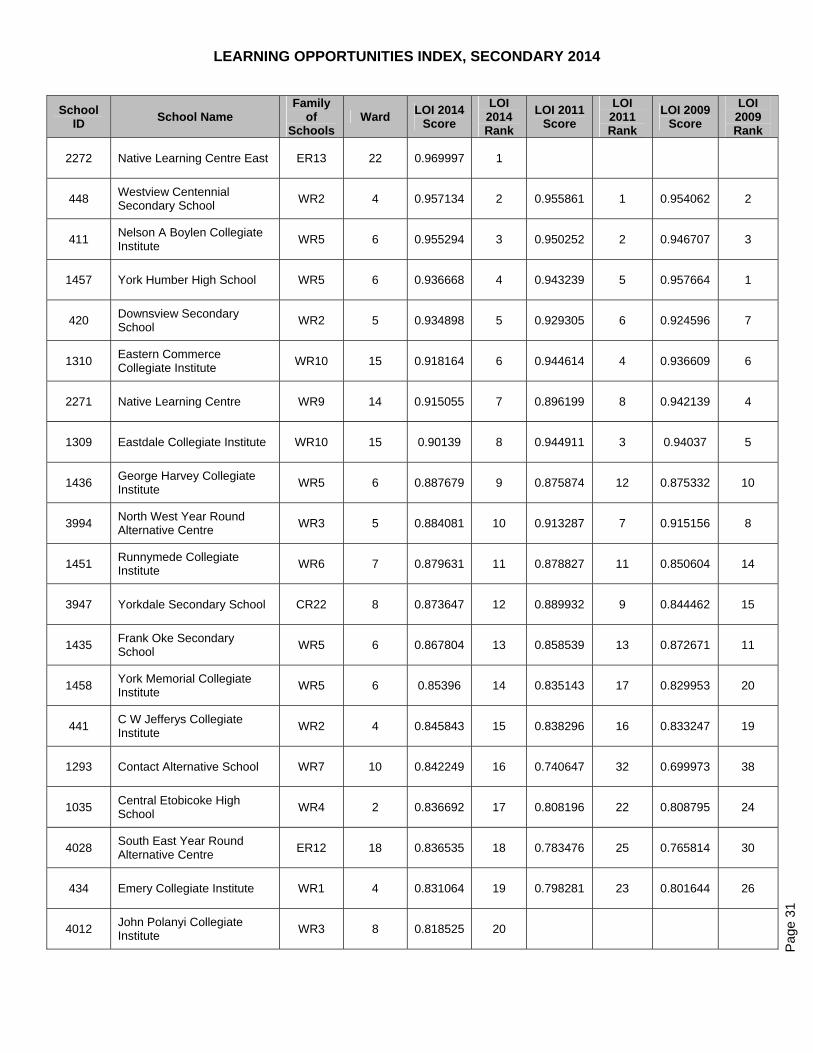
LEARNING OPPORTUNITIES INDEX, SECONDARY 2014
Pag
e 31
School ID
School Name Family
of Schools
Ward LOI 2014
Score
LOI 2014 Rank
LOI 2011 Score
LOI 2011 Rank
LOI 2009 Score
LOI 2009 Rank
2272 Native Learning Centre East ER13 22 0.969997 1
448 Westview Centennial Secondary School
WR2 4 0.957134 2 0.955861 1 0.954062 2
411 Nelson A Boylen Collegiate Institute
WR5 6 0.955294 3 0.950252 2 0.946707 3
1457 York Humber High School WR5 6 0.936668 4 0.943239 5 0.957664 1
420 Downsview Secondary School
WR2 5 0.934898 5 0.929305 6 0.924596 7
1310 Eastern Commerce Collegiate Institute
WR10 15 0.918164 6 0.944614 4 0.936609 6
2271 Native Learning Centre WR9 14 0.915055 7 0.896199 8 0.942139 4
1309 Eastdale Collegiate Institute WR10 15 0.90139 8 0.944911 3 0.94037 5
1436 George Harvey Collegiate Institute
WR5 6 0.887679 9 0.875874 12 0.875332 10
3994 North West Year Round Alternative Centre
WR3 5 0.884081 10 0.913287 7 0.915156 8
1451 Runnymede Collegiate Institute
WR6 7 0.879631 11 0.878827 11 0.850604 14
3947 Yorkdale Secondary School CR22 8 0.873647 12 0.889932 9 0.844462 15
1435 Frank Oke Secondary School
WR5 6 0.867804 13 0.858539 13 0.872671 11
1458 York Memorial Collegiate Institute
WR5 6 0.85396 14 0.835143 17 0.829953 20
441 C W Jefferys Collegiate Institute
WR2 4 0.845843 15 0.838296 16 0.833247 19
1293 Contact Alternative School WR7 10 0.842249 16 0.740647 32 0.699973 38
1035 Central Etobicoke High School
WR4 2 0.836692 17 0.808196 22 0.808795 24
4028 South East Year Round Alternative Centre
ER12 18 0.836535 18 0.783476 25 0.765814 30
434 Emery Collegiate Institute WR1 4 0.831064 19 0.798281 23 0.801644 26
4012 John Polanyi Collegiate Institute
WR3 8 0.818525 20
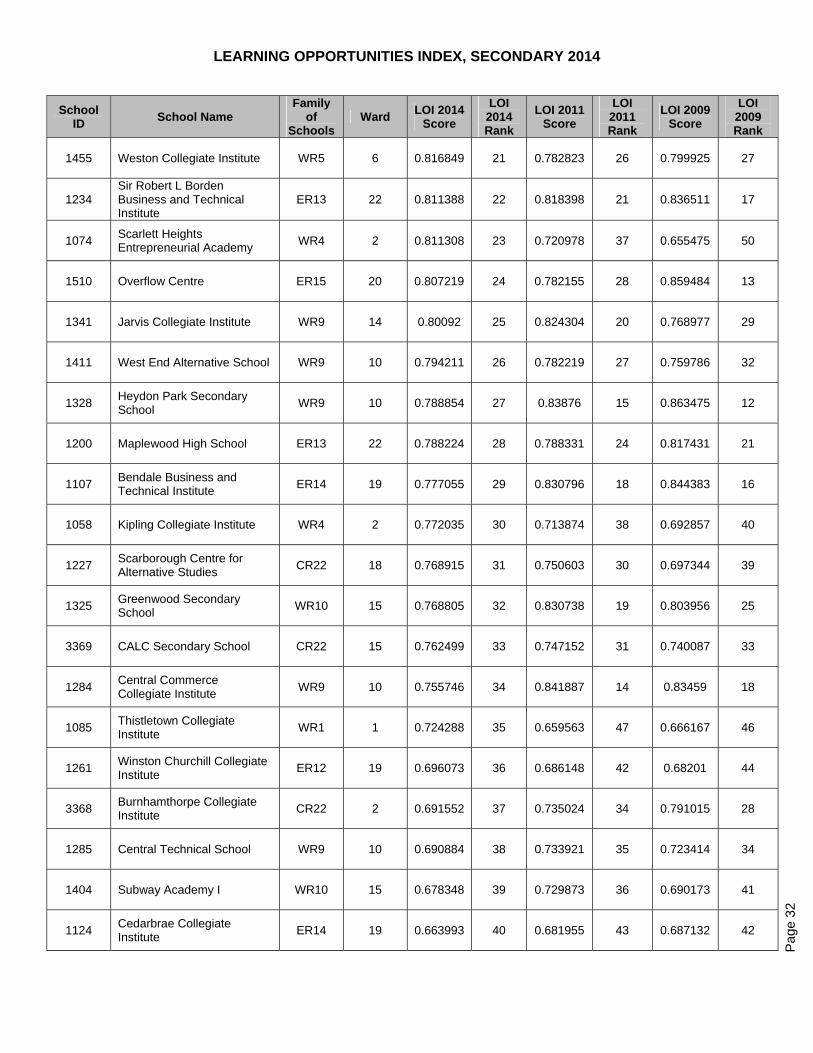
LEARNING OPPORTUNITIES INDEX, SECONDARY 2014
Pag
e 32
School ID
School Name Family
of Schools
Ward LOI 2014
Score
LOI 2014 Rank
LOI 2011 Score
LOI 2011 Rank
LOI 2009 Score
LOI 2009 Rank
1455 Weston Collegiate Institute WR5 6 0.816849 21 0.782823 26 0.799925 27
1234 Sir Robert L Borden Business and Technical Institute
ER13 22 0.811388 22 0.818398 21 0.836511 17
1074 Scarlett Heights Entrepreneurial Academy
WR4 2 0.811308 23 0.720978 37 0.655475 50
1510 Overflow Centre ER15 20 0.807219 24 0.782155 28 0.859484 13
1341 Jarvis Collegiate Institute WR9 14 0.80092 25 0.824304 20 0.768977 29
1411 West End Alternative School WR9 10 0.794211 26 0.782219 27 0.759786 32
1328 Heydon Park Secondary School
WR9 10 0.788854 27 0.83876 15 0.863475 12
1200 Maplewood High School ER13 22 0.788224 28 0.788331 24 0.817431 21
1107 Bendale Business and Technical Institute
ER14 19 0.777055 29 0.830796 18 0.844383 16
1058 Kipling Collegiate Institute WR4 2 0.772035 30 0.713874 38 0.692857 40
1227 Scarborough Centre for Alternative Studies
CR22 18 0.768915 31 0.750603 30 0.697344 39
1325 Greenwood Secondary School
WR10 15 0.768805 32 0.830738 19 0.803956 25
3369 CALC Secondary School CR22 15 0.762499 33 0.747152 31 0.740087 33
1284 Central Commerce Collegiate Institute
WR9 10 0.755746 34 0.841887 14 0.83459 18
1085 Thistletown Collegiate Institute
WR1 1 0.724288 35 0.659563 47 0.666167 46
1261 Winston Churchill Collegiate Institute
ER12 19 0.696073 36 0.686148 42 0.68201 44
3368 Burnhamthorpe Collegiate Institute
CR22 2 0.691552 37 0.735024 34 0.791015 28
1285 Central Technical School WR9 10 0.690884 38 0.733921 35 0.723414 34
1404 Subway Academy I WR10 15 0.678348 39 0.729873 36 0.690173 41
1124 Cedarbrae Collegiate Institute
ER14 19 0.663993 40 0.681955 43 0.687132 42
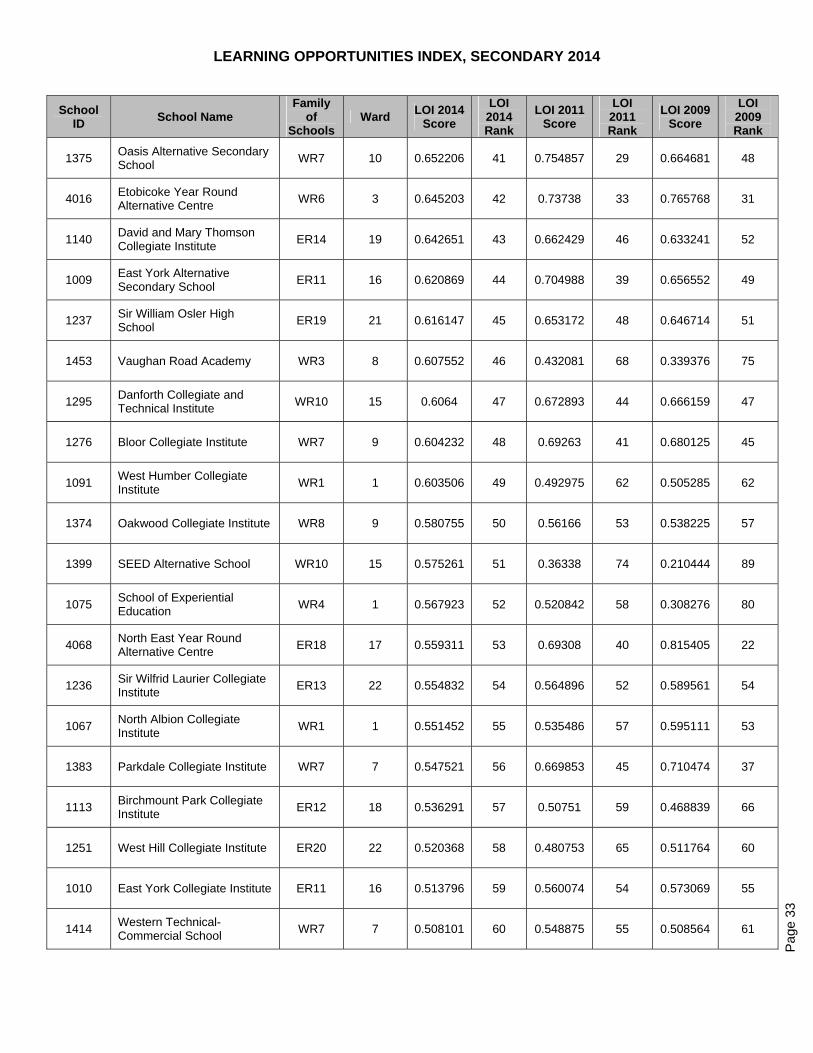
LEARNING OPPORTUNITIES INDEX, SECONDARY 2014
Pag
e 33
School ID
School Name Family
of Schools
Ward LOI 2014
Score
LOI 2014 Rank
LOI 2011 Score
LOI 2011 Rank
LOI 2009 Score
LOI 2009 Rank
1375 Oasis Alternative Secondary School
WR7 10 0.652206 41 0.754857 29 0.664681 48
4016 Etobicoke Year Round Alternative Centre
WR6 3 0.645203 42 0.73738 33 0.765768 31
1140 David and Mary Thomson Collegiate Institute
ER14 19 0.642651 43 0.662429 46 0.633241 52
1009 East York Alternative Secondary School
ER11 16 0.620869 44 0.704988 39 0.656552 49
1237 Sir William Osler High School
ER19 21 0.616147 45 0.653172 48 0.646714 51
1453 Vaughan Road Academy WR3 8 0.607552 46 0.432081 68 0.339376 75
1295 Danforth Collegiate and Technical Institute
WR10 15 0.6064 47 0.672893 44 0.666159 47
1276 Bloor Collegiate Institute WR7 9 0.604232 48 0.69263 41 0.680125 45
1091 West Humber Collegiate Institute
WR1 1 0.603506 49 0.492975 62 0.505285 62
1374 Oakwood Collegiate Institute WR8 9 0.580755 50 0.56166 53 0.538225 57
1399 SEED Alternative School WR10 15 0.575261 51 0.36338 74 0.210444 89
1075 School of Experiential Education
WR4 1 0.567923 52 0.520842 58 0.308276 80
4068 North East Year Round Alternative Centre
ER18 17 0.559311 53 0.69308 40 0.815405 22
1236 Sir Wilfrid Laurier Collegiate Institute
ER13 22 0.554832 54 0.564896 52 0.589561 54
1067 North Albion Collegiate Institute
WR1 1 0.551452 55 0.535486 57 0.595111 53
1383 Parkdale Collegiate Institute WR7 7 0.547521 56 0.669853 45 0.710474 37
1113 Birchmount Park Collegiate Institute
ER12 18 0.536291 57 0.50751 59 0.468839 66
1251 West Hill Collegiate Institute ER20 22 0.520368 58 0.480753 65 0.511764 60
1010 East York Collegiate Institute ER11 16 0.513796 59 0.560074 54 0.573069 55
1414 Western Technical-Commercial School
WR7 7 0.508101 60 0.548875 55 0.508564 61
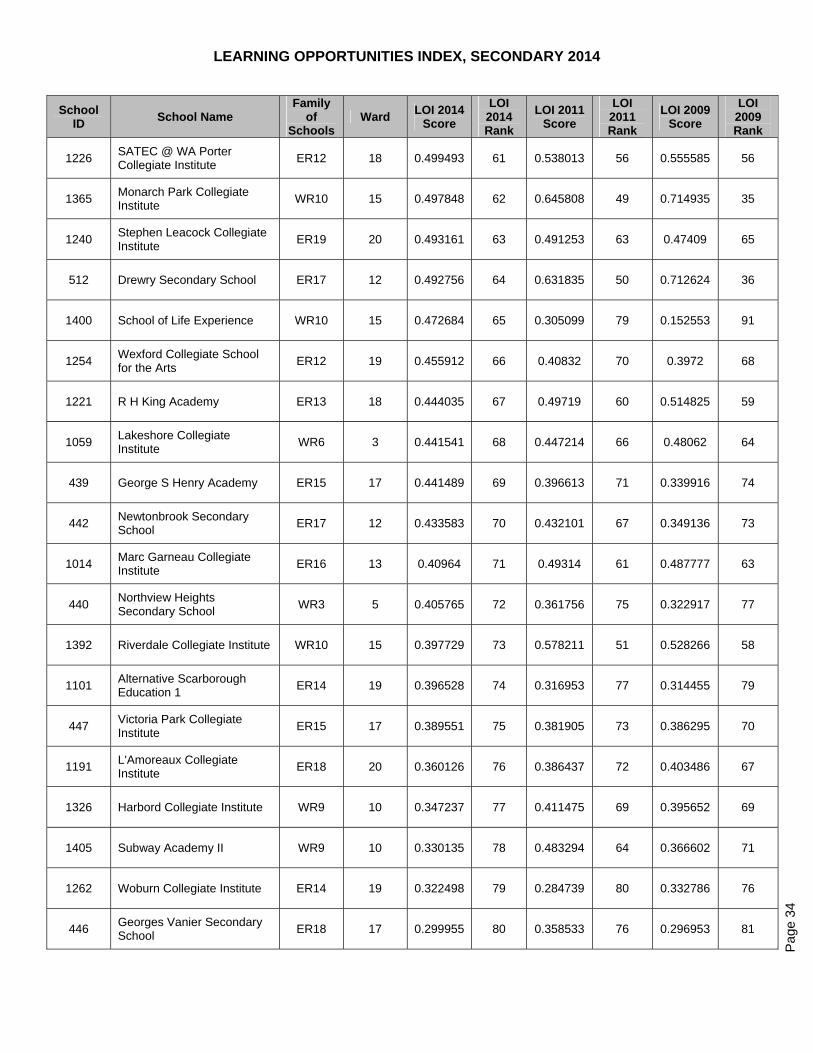
LEARNING OPPORTUNITIES INDEX, SECONDARY 2014
Pag
e 34
School ID
School Name Family
of Schools
Ward LOI 2014
Score
LOI 2014 Rank
LOI 2011 Score
LOI 2011 Rank
LOI 2009 Score
LOI 2009 Rank
1226 SATEC @ WA Porter Collegiate Institute
ER12 18 0.499493 61 0.538013 56 0.555585 56
1365 Monarch Park Collegiate Institute
WR10 15 0.497848 62 0.645808 49 0.714935 35
1240 Stephen Leacock Collegiate Institute
ER19 20 0.493161 63 0.491253 63 0.47409 65
512 Drewry Secondary School ER17 12 0.492756 64 0.631835 50 0.712624 36
1400 School of Life Experience WR10 15 0.472684 65 0.305099 79 0.152553 91
1254 Wexford Collegiate School for the Arts
ER12 19 0.455912 66 0.40832 70 0.3972 68
1221 R H King Academy ER13 18 0.444035 67 0.49719 60 0.514825 59
1059 Lakeshore Collegiate Institute
WR6 3 0.441541 68 0.447214 66 0.48062 64
439 George S Henry Academy ER15 17 0.441489 69 0.396613 71 0.339916 74
442 Newtonbrook Secondary School
ER17 12 0.433583 70 0.432101 67 0.349136 73
1014 Marc Garneau Collegiate Institute
ER16 13 0.40964 71 0.49314 61 0.487777 63
440 Northview Heights Secondary School
WR3 5 0.405765 72 0.361756 75 0.322917 77
1392 Riverdale Collegiate Institute WR10 15 0.397729 73 0.578211 51 0.528266 58
1101 Alternative Scarborough Education 1
ER14 19 0.396528 74 0.316953 77 0.314455 79
447 Victoria Park Collegiate Institute
ER15 17 0.389551 75 0.381905 73 0.386295 70
1191 L'Amoreaux Collegiate Institute
ER18 20 0.360126 76 0.386437 72 0.403486 67
1326 Harbord Collegiate Institute WR9 10 0.347237 77 0.411475 69 0.395652 69
1405 Subway Academy II WR9 10 0.330135 78 0.483294 64 0.366602 71
1262 Woburn Collegiate Institute ER14 19 0.322498 79 0.284739 80 0.332786 76
446 Georges Vanier Secondary School
ER18 17 0.299955 80 0.358533 76 0.296953 81
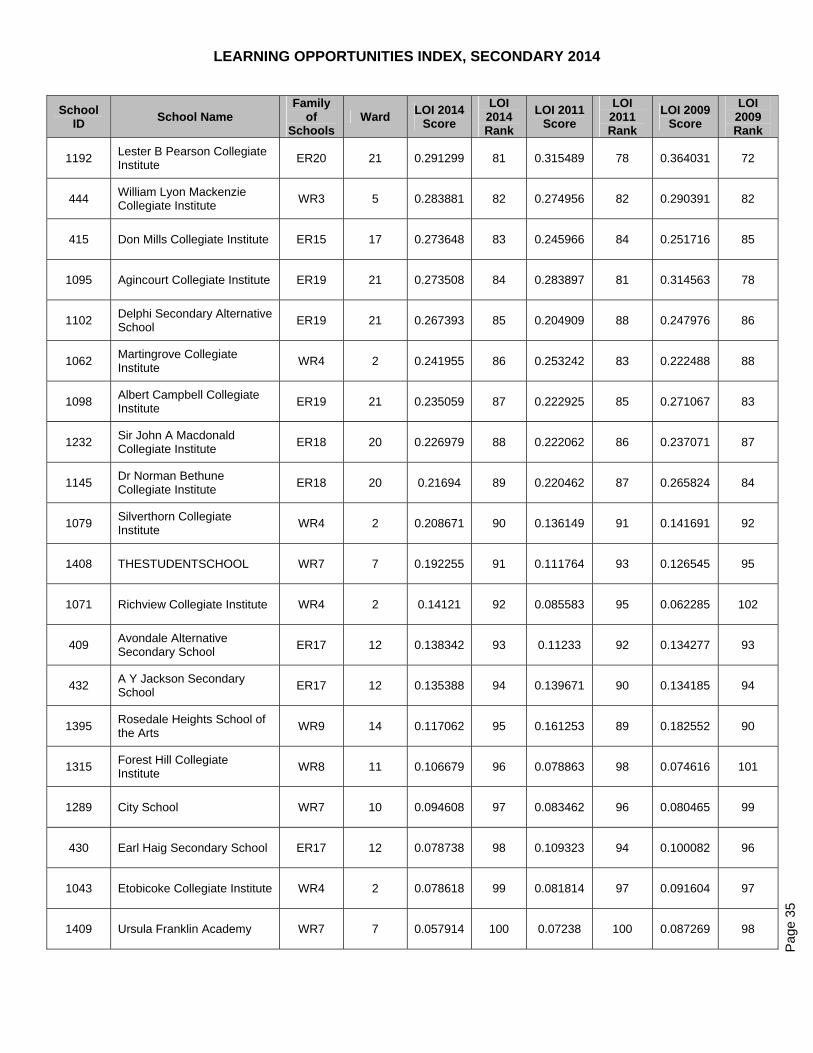
LEARNING OPPORTUNITIES INDEX, SECONDARY 2014
Pag
e 35
School ID
School Name Family
of Schools
Ward LOI 2014
Score
LOI 2014 Rank
LOI 2011 Score
LOI 2011 Rank
LOI 2009 Score
LOI 2009 Rank
1192 Lester B Pearson Collegiate Institute
ER20 21 0.291299 81 0.315489 78 0.364031 72
444 William Lyon Mackenzie Collegiate Institute
WR3 5 0.283881 82 0.274956 82 0.290391 82
415 Don Mills Collegiate Institute ER15 17 0.273648 83 0.245966 84 0.251716 85
1095 Agincourt Collegiate Institute ER19 21 0.273508 84 0.283897 81 0.314563 78
1102 Delphi Secondary Alternative School
ER19 21 0.267393 85 0.204909 88 0.247976 86
1062 Martingrove Collegiate Institute
WR4 2 0.241955 86 0.253242 83 0.222488 88
1098 Albert Campbell Collegiate Institute
ER19 21 0.235059 87 0.222925 85 0.271067 83
1232 Sir John A Macdonald Collegiate Institute
ER18 20 0.226979 88 0.222062 86 0.237071 87
1145 Dr Norman Bethune Collegiate Institute
ER18 20 0.21694 89 0.220462 87 0.265824 84
1079 Silverthorn Collegiate Institute
WR4 2 0.208671 90 0.136149 91 0.141691 92
1408 THESTUDENTSCHOOL WR7 7 0.192255 91 0.111764 93 0.126545 95
1071 Richview Collegiate Institute WR4 2 0.14121 92 0.085583 95 0.062285 102
409 Avondale Alternative Secondary School
ER17 12 0.138342 93 0.11233 92 0.134277 93
432 A Y Jackson Secondary School
ER17 12 0.135388 94 0.139671 90 0.134185 94
1395 Rosedale Heights School of the Arts
WR9 14 0.117062 95 0.161253 89 0.182552 90
1315 Forest Hill Collegiate Institute
WR8 11 0.106679 96 0.078863 98 0.074616 101
1289 City School WR7 10 0.094608 97 0.083462 96 0.080465 99
430 Earl Haig Secondary School ER17 12 0.078738 98 0.109323 94 0.100082 96
1043 Etobicoke Collegiate Institute WR4 2 0.078618 99 0.081814 97 0.091604 97
1409 Ursula Franklin Academy WR7 7 0.057914 100 0.07238 100 0.087269 98
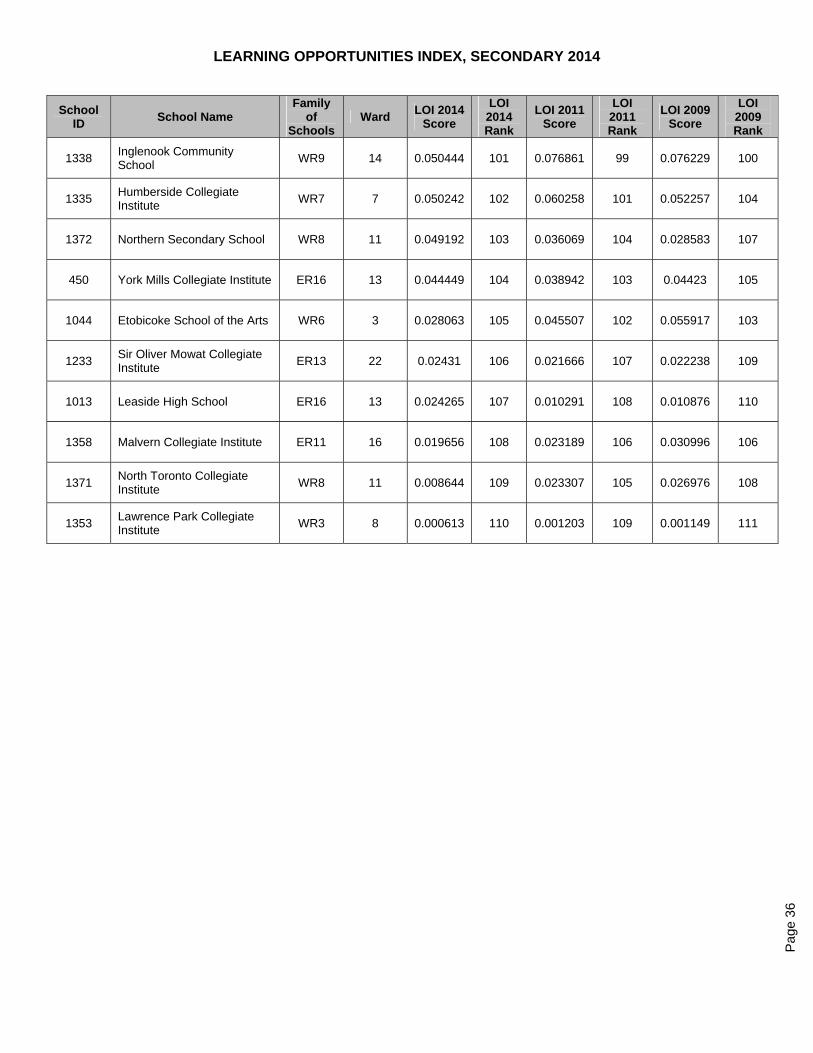
LEARNING OPPORTUNITIES INDEX, SECONDARY 2014
Pag
e 36
School ID
School Name Family
of Schools
Ward LOI 2014
Score
LOI 2014 Rank
LOI 2011 Score
LOI 2011 Rank
LOI 2009 Score
LOI 2009 Rank
1338 Inglenook Community School
WR9 14 0.050444 101 0.076861 99 0.076229 100
1335 Humberside Collegiate Institute
WR7 7 0.050242 102 0.060258 101 0.052257 104
1372 Northern Secondary School WR8 11 0.049192 103 0.036069 104 0.028583 107
450 York Mills Collegiate Institute ER16 13 0.044449 104 0.038942 103 0.04423 105
1044 Etobicoke School of the Arts WR6 3 0.028063 105 0.045507 102 0.055917 103
1233 Sir Oliver Mowat Collegiate Institute
ER13 22 0.02431 106 0.021666 107 0.022238 109
1013 Leaside High School ER16 13 0.024265 107 0.010291 108 0.010876 110
1358 Malvern Collegiate Institute ER11 16 0.019656 108 0.023189 106 0.030996 106
1371 North Toronto Collegiate Institute
WR8 11 0.008644 109 0.023307 105 0.026976 108
1353 Lawrence Park Collegiate Institute
WR3 8 0.000613 110 0.001203 109 0.001149 111
Related Documents