A data-driven review of 2014’s private tech company IPO and M&A activity

The 2014 Global Tech Exits Report
Jul 14, 2015
Welcome message from author
This document is posted to help you gain knowledge. Please leave a comment to let me know what you think about it! Share it to your friends and learn new things together.
Transcript

A data-driven review of 2014’s private tech company IPO and M&A activity
2

3
The year’s 2886 tech exits (2809 M&A and 79 IPOs) marked a significant increase in activity versus 2013 which saw 1825 exits. Private tech M&A and IPO activity was strong through 2014 as all 4 quarters of the year saw higher levels of tech exits than 2013.
73% of tech companies that were either acquired or went public in 2014 did not raise institutional capital (VC, PE, growth equity) prior to exit, up from 66% in 2013.
Behind the US, the UK and Germany stayed in the top 5. Canada which has seen investment momentum also saw tech exit activity jump enabling it to take the #3 spot. India saw strong ecommerce exit activity keeping it in the top 5.
After just 17 private tech companies exited for $1B+ valuation in 2013, that number nearly doubled to 32 in 2014. 41% of tech transactions with disclosed valuations last year were for less than $50M.
2014 saw a large increase in both VC-backed M&A activity and IPOs compared to 2013, with more than a 30% year over year increase in both types of exits.
Yahoo, J2 Global, Twitter and Microsoft rounded out the top 5. Yahoo eased up on its acqui-hire efforts but remained active. Mobile companies were a top target for tech’s most acquisitive companies.
Accel Partners took the number one spot with the most exited tech companies in 2014, overtaking SV Angel which led all VC investors for tech exits in 2013. Intel Capital is the top corporate investor in terms of number of exits.
While the absolute # of tech unicorn exits (those valued at over $1 billion+) was up, they remained rare with just over 1% of tech exits hitting the elusive billion dollar mark.

4

2014 saw 2886 tech exits (2807 M&A and 79 IPOs). This represented a huge step up versus 2013 which saw 1825 tech exits. The 58% increase in exit activity was driven by strength throughout the year as every quarter of 2014 eclipsed 2013. Q2 2014 was a breakout quarter with 731 M&A & 31 IPOs and included notable public offerings for Jingdong and Just-Eat.
5

After just 17 private tech companies exited for a $1B+ valuation in 2013, that number nearly doubled to 32 in 2014. Even with the increase, this represented just 1.1% of tech exits in 2014. The vast majority of exits are for < $200 million.
6

Surprise! 73% of tech companies that exited in 2014 did not raise institutional capital (VC, PE, growth equity) prior to exit, up from 66% in 2013.
7

Three European countries were in the top 10 based on tech exit activity in 2014. India was in the top 5 in exit activity for the second straight year. Canada bumped China from the top 5 behind increased M&A activity. China, however, had some of the largest tech exits in 2014 including IPOs for Alibaba and Jumei International, as well as UCWeb’s acquisition by Alibaba.
8
Rank Country Rank Country Rank Country Rank Country Rank Country Rank Country
1 United States 14 Denmark 29 Malaysia 41 Belarus 55 Pakistan 55 Mozambique
2 United Kingdom 14 South Africa 30 Hungary 41 Latvia 55 Bulgaria 55 Botswana
3 Canada 17 Italy 30 Turkey 41 Saudi Arabia 55 Taiwan 55 Bahamas
4 Germany 18 Finland 32 UAE 41 Luxembourg 55 Rwanda 55 Croatia
5 India 18 Japan 32 Argentina 41 Cyprus 55 Costa Rica 55 Portugal
6 China 20 Ireland 34 South Korea 41 Gibraltar 55 Ecuador 55 Kenya
7 Australia 21 Norway 34 Scotland 41 Mexico 55 Jordan
8 France 21 Brazil 34 Czech Republic 41 Greece 55 Malta
8 Israel 23 Hong Kong 34 Austria 41 Morocco 55 Lebanon
10 Sweden 24 Belgium 38 Chile 41 Ukraine 55 Ghana
10 Netherlands 25 Switzerland 38 Philippines 41 Egypt 55 Thailand
12 Spain 26 Indonesia 38 Vietnam 41 Colombia 55 Nigeria
13 Singapore 27 New Zealand 41 Slovakia 55 Iceland 55 Uganda
14 Russian 28 Poland 41 Serbia 55 Barbados 55 Slovenia
Country Rank by Number of Tech Exits in 2014

Of the top 5 countries for private tech M&A and IPO activity, India saw the highest share of Internet firms exiting as the result of significant activity in the eCommerce space. Canada and Germany saw the highest share of Mobile exits.
9

46 states and Washington DC saw either a tech M&A or IPO in 2014. California saw more transactions than the next 5 markets combined. New York was second yet again, while Massachusetts pulled narrowly ahead of Texas, claiming the third spot in the rankings. Florida comes in at 5 ahead of tech hubs Washington and Colorado.
10
Rank State Rank State Rank State Rank State Rank State
1 California 11 Virginia 21 Arizona 31 Idaho 40 Iowa
2 New York 12 Minnesota 22 Oregon 31 Oklahoma 40 Arkansas
3 Massachusetts 13 North Carolina 23 Missouri 33 Rhode Island 43 Vermont
4 Texas 14 Maryland 24 New Hampshire 33 Kentucky 43 Louisiana
5 Florida 14 Michigan 25 Tennessee 33 South Carolina 43 New Mexico
6 Washington 14 New Jersey 25 Nevada 33 Nebraska 43 Maine
7 Illinois 17 Ohio 25 Indiana 33 Mississippi 47 South Dakota
8 Georgia 18 Connecticut 25 DC 38 Montana
9 Pennsylvania 19 Utah 29 Kansas 38 Delaware
9 Colorado 20 Wisconsin 30 Alabama 40 Hawaii
U.S. State Rank by Number of Tech Exits in 2014

11
While Internet companies took nearly 50% of deals, the ascent of mobile was significant as the sector took one of every five private tech transactions in 2014. Many of tech’s most acquisitive players including Facebook, Intuit and Microsoft all made multiple mobile company acquisitions in 2014.

12

2014 saw a large increase in both VC-backed M&A activity and IPO activity compared to 2013, with more than a 30% year over year increase in both types of exits. March was a banner month for IPOs, which saw 11 companies go public including Castlight Health, 2U, and King Digital Entertainment.
13

More than 40% of exits in VC-backed tech companies occurred after a Seed or Series A investment, with the number of exits after each series getting progressively smaller. Despite publicity centered around large exits, the majority were much earlier and smaller in size.
14

54% of tech acquisitions went to companies that raised less than $10M highlighting that the majority of venture-backed exits often happen early in a company’s life. Of course, the total funding needed prior to an IPO is on the rise, and 2014 saw over 40 firms raise upward of $100M prior to exit.
15

16
After Alibaba’s landmark September IPO, Q4 was the slowest quarter of the year for VC-backed tech exits, with only 151 total exits taking place. Q1 2015 will be an important quarter to see if activity rebounds.

17
Venture capital-backed tech exits overwhelmingly went to Internet and Mobile companies. Electronics which includes chip & semi companies remain a very minor part of the VC-backed exit picture as the sector continues to lose favor with venture investors.

18
Advertising, Sales & Marketing companies saw the most exits in 2014 including Hubspot’s IPO and Oracle’s $1B acquisition of DataLogix. Business Intelligence and Internet/Mobile Video companies rounded out the top 3 sub-industries. 18 different sub-Industries saw double digit exits in 2014 highlighting the diversity of areas within tech that are seeing acquirer interest.

Both Q1 and Q2 saw more than twice the aggregate exit value for VC-backed exits than Q3 or Q4.
19

20

Accel Partners took the number one spot with the most exited tech companies in 2014, overtaking SV Angel which led all VCs in tech exits in 2013.
21
Rank Investor Rank Investor
1 Accel Partners 13 Norwest Venture Partners
2 SV Angel 13 500 Startups
3 Kleiner Perkins Caufield & Byers 13 Greycroft Partners
4 New Enterprise Associates 13 Founder Collective
4 Battery Ventures 13 Draper Fisher Jurvetson
6 Greylock Partners 18 Summit Partners
7 First Round Capital 18 Trinity Ventures
8 Redpoint Ventures 18 Foundation Capital
8 Bessemer Venture Partners 18 CRV
10 Matrix Partners 18 Andreessen Horowitz
10 Sequoia Capital 18 Benchmark Capital
10 Felicis Ventures 18 Doll Capital Management
Top VC Investors in Exited Tech Companies: 2014

Intel Capital topped the list of corporate and corporate venture capital investors for the second year in a row with the highest number of exits, followed by Google Ventures and Qualcomm Ventures.
22
Rank Investor Rank Investor
1 Intel Capital 11 Tencent
2 Google Ventures 11 Cisco Investments
3 Qualcomm Ventures 11 Time Warner Investments
4 Mitsui & Co. Global Investment 11 AOL Ventures
4 Samsung Ventures 11 Comcast Interactive Capital
6 Motorola Solutions Venture Capital 11 Symantec
7 Comcast Ventures 11 Bertelsmann Digital Media Investments
7 Blackberry Partners Fund 11 PPR
7 SingTel Innov8 11 T-Venture
7 Innovacom
Top Corporate & CVC Investors in Exited Tech Companies: 2014
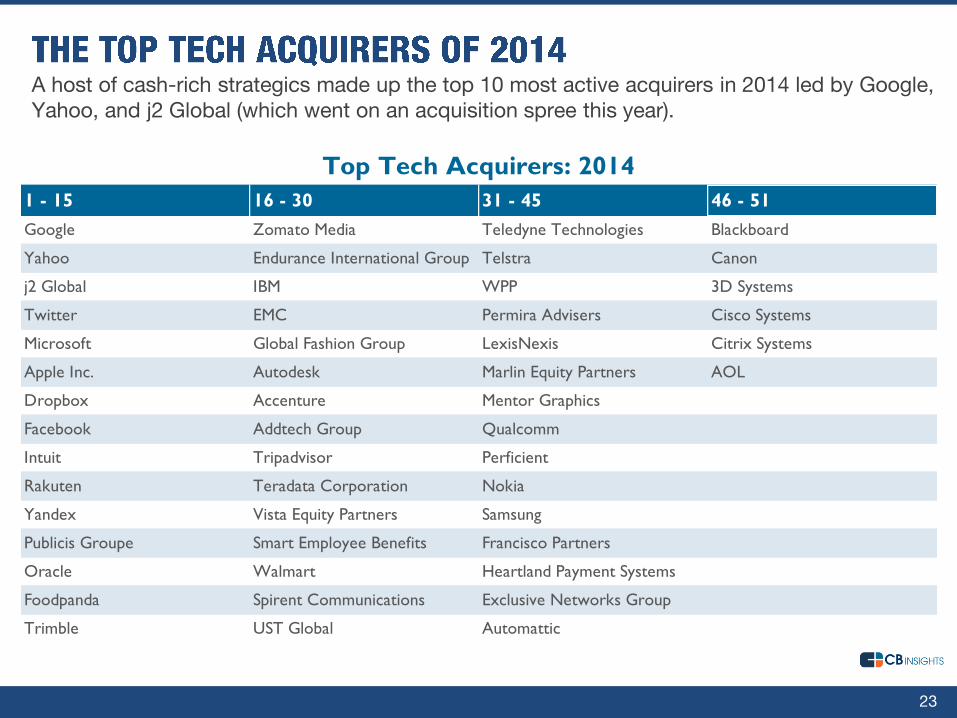
A host of cash-rich strategics made up the top 10 most active acquirers in 2014 led by Google, Yahoo, and j2 Global (which went on an acquisition spree this year).
23
1 - 15 16 - 30 31 - 45 46 - 51
Google Zomato Media Teledyne Technologies Blackboard
Yahoo Endurance International Group Telstra Canon
j2 Global IBM WPP 3D Systems
Twitter EMC Permira Advisers Cisco Systems
Microsoft Global Fashion Group LexisNexis Citrix Systems
Apple Inc. Autodesk Marlin Equity Partners AOL
Dropbox Accenture Mentor Graphics
Facebook Addtech Group Qualcomm
Intuit Tripadvisor Perficient
Rakuten Teradata Corporation Nokia
Yandex Vista Equity Partners Samsung
Publicis Groupe Smart Employee Benefits Francisco Partners
Oracle Walmart Heartland Payment Systems
Foodpanda Spirent Communications Exclusive Networks Group
Trimble UST Global Automattic
Top Tech Acquirers: 2014

Google is the top acquirer of tech companies who last raised funding at the seed or Series A stages. Yahoo slowed their acqui-hire spree in 2014, but was still the second most active early stage tech acquirer in 2014.
24
Rank Acquirer Notable Acquisitions
1 Google Songza, Lift Labs
2 Yahoo Wander, Distill
3 Twitter Cardpsring, TapCommerce
4 Dropbox Readmill, Loom
5 Apple Concept.io, Spotsetter
5 Facebook PrivateCore, Branch Media
5 Microsoft Capptain, Accompli
Top Early Stage Tech Tech Acquirers: 2014

25

Related Documents