1 Issues Driving Charitable Activities among Affluent Households November 2010 The 2010 Study of High Net Worth Philanthropy

Welcome message from author
This document is posted to help you gain knowledge. Please leave a comment to let me know what you think about it! Share it to your friends and learn new things together.
Transcript
1
Issues Driving Charitable Activities
among Affluent Households
November 2010
The 2010 Study of
High Net Worth
Philanthropy
2
Sponsored by
Researched and Written by
We especially thank Indiana University’s Center for Survey Research in
Bloomington, IN for their work in fielding the survey along with data processing
and data cleaning.
3
Bank of America Merrill Lynch Bank of America Merrill Lynch* puts the strength of the organization to work for the more than 22,000
nonprofit organizations, individuals, and families, who have a trusted relationship with us. We work on
behalf of our clients‟ best interests, with proactive and objective advice, specialized expertise and robust
investment solutions, and by delivering it through a close working relationship with a trusted advisor, we
enable clients to achieve and sustain their mission.
The Center on Philanthropy at Indiana University Every culture depends on philanthropy and nonprofit organizations to provide essential elements of a civil
society. Effective philanthropy and nonprofit management are instrumental in creating and maintaining
public confidence in the philanthropic traditions – voluntary association, voluntary giving, and voluntary
action. The Center on Philanthropy at Indiana University increases the understanding of philanthropy and
improves its practice through programs in research, teaching, public service, and public affairs. The Center
on Philanthropy at Indiana University is a part of the School of Liberal Arts at Indiana University-Purdue
University Indianapolis. The Center has academic and research programs at IUPUI and IU-Bloomington
campuses.
Center on Philanthropy Project Team Una Osili, Ph.D., Director of Research
Reema Bhakta, Research Development Specialist and Project Manager
Melissa Brown, Associate Director of Research
Deborah Hirt, Project Coordinator
Cynthia Hyatte, Project Assistant
Sindhu Raghavan, Xiaonan Kou, Jeffrey Small, Shannon Neumeyer, Research Assistants
Bank of America Editorial Review Board Christopher Dupuy, Managing Director, Head of Institutional Investments & Philanthropic Solutions
Gillian R. Howell, Managing Director, Private Philanthropy Executive
Claire M. Costello, Senior Vice President, National Foundation Executive
Ramsay Slugg, Senior Vice President, Wealth Strategies Advisor, U S Trust, Bank of America Private
Wealth Management
Donald J. Greene, National Philanthropic Strategy & Product Executive, Philanthropic Management
Bonnie Benhayon, Strategic Marketing Executive, Institutional Retirement & Philanthropy
Marketing
Linda Chin, Senior Vice President, Institutional Retirement and Philanthropy Marketing
Matthew Card, Vice President, Media Relations, Global Wealth & Investment Management
The Center on Philanthropy at Bank of America Philanthropic Management
Indiana University 100 Federal St.
550 W. North St., Suite 301 Boston, MA 02110
Indianapolis, IN 46202-3272 617-434-1388
317-274-4200 https://www.bankofamerica.com/philanthropic
www.philanthropy.iupui.edu
*Bank of America Merrill Lynch is a marketing name for the Retirement & Philanthropic Services
businesses of Bank of America Corporation (“BAC”). Banking and fiduciary activities are performed
globally by banking affiliates of BAC, including Bank of America, N.A., Member FDIC.
4
Table of Contents
INTRODUCTION .............................................................................................................................................. 5
KEY FINDINGS ................................................................................................................................................ 7
DONORS .......................................................................................................................................................... 11
Level of Charitable Giving Experience .................................................................................................. 11
Confidence in Societal Institutions ......................................................................................................... 12
Motivations behind Charitable Behavior ................................................................................................ 13
Children and the Transmission of Philanthropic Values ........................................................................ 16
Household Decision-Making .................................................................................................................. 21
High Net Worth Philanthropic Giving in 2009 ....................................................................................... 23
Response to Disaster Relief .................................................................................................................... 27
Tax Considerations ................................................................................................................................. 47
VOLUNTEERS ................................................................................................................................................ 49
Percent of Volunteers.............................................................................................................................. 49
Volunteering Hours ................................................................................................................................ 50
Volunteering by Type of Organization ................................................................................................... 52
Giving and Volunteering ........................................................................................................................ 54
NONPROFITS ................................................................................................................................................. 56
Largest Gift ............................................................................................................................................. 56
Approaches to Giving in 2009 ................................................................................................................ 58
Influences on Donor Charitable Decision-Making ................................................................................. 60
Donor Expectations of Nonprofits .......................................................................................................... 61
Why Donors Stop Giving ....................................................................................................................... 63
CHARITABLE GIVING VEHICLES AND ADVISORS ............................................................................... 67
Risk Tolerance with Personal and Philanthropic Assets ......................................................................... 67
Awareness of Philanthropic Tools to Advance Social and Charitable Goals ......................................... 68
Utilization of Giving Vehicles ................................................................................................................ 69
Trends in Charitable Advice Sought by Wealthy Donors....................................................................... 70
Given by Type of Advisor ...................................................................................................................... 71
How Advice Was Initiated ...................................................................................................................... 72
Satisfaction of Advice ............................................................................................................................. 72
CONCLUSION ................................................................................................................................................ 73
METHODOLOGY ........................................................................................................................................... 74
5
INTRODUCTION
The 2010 Study of High Net Worth Philanthropy, sponsored by Bank of America Merrill Lynch,
offers new insights into the philanthropy of wealthy donors. Conducted by the Center on
Philanthropy at Indiana University for Bank of America Merrill Lynch, this year‟s research follows
an initial landmark study published through this partnership in 2006, and another study done in
2008.
The 2006 and 2008 studies – which have become leading resources for the philanthropic sector for
understanding the philanthropic behaviors of wealthy donors – are the largest surveys of wealthy
Americans ever conducted on this topic. The new 2010 study is the result of random mailing to
20,000 households in high net worth neighborhoods across the country about their giving in 2009.
This study reflects the attitudes and behaviors of more than 800 respondents throughout the United
States with household income greater than $200,000 and/or net worth (excluding the value of their
residence) of at least $1,000,000. The average wealth of respondents was $10.7 million. Half of
those who responded had a net worth between $3 million and $20 million.
New in 2010
The latest study follows much of the same methodology as the initial 2006 and 2008 studies in order
to identify key trends and to provide deeper insights into the motivations and attitudes of wealthy
donors. For nonprofit professionals, donors, and charitable advisors, this study offers new
information about how high net worth donors: involve others in their giving and make decisions
about charitable giving within their household, encourage family traditions around charitable
giving, and approach investment risk with their personal and philanthropic assets. The 2010 report
also reveals new information about the level of confidence high net worth individuals have in
societal institutions to solve domestic or global problems, and their awareness of philanthropic tools
to advance social or charitable goals.
Similar to the 2006 and 2008 studies, the 2010 report provides insight about the motivations and
attitudes of high net worth donors, the role of values in transmitting philanthropic values to their
children/younger relatives, and a look at the kinds of volunteer services that expand their
philanthropic reach beyond dollars donated. Nonprofit organizations will be particularly interested
to read information about what high net worth donors expect from their organizations, hope to
achieve through major gifts, and list as reasons why they stop giving to particular organizations.
The 2010 report also reveals information on the role charitable or financial advisors play in high net
worth philanthropy, including the initiation of charitable advice and the utilization of charitable
giving vehicles.
The Effects of the Economy
Research at the Center on Philanthropy at Indiana University suggests a direct link between changes
in giving and changes in the overall economy. Charitable giving tends to grow in general as the
economy rises, even when the economy grows at a moderate or slow rate. But giving tends to
decline during recessions, after adjusting for inflation.
6
The 2010 Study of High Net Worth Philanthropy asks high net worth households about their
charitable giving in 2009. The economic recovery was still uncertain in 2009, with a high
unemployment rate, but a slow increase in Gross Domestic Product for the latter part of 2009. The
National Bureau of Economic Research, which monitors the economic cycle, announced in
September 2010 that the recession that began in December 2007 ended in June 2009. This recession
lasted 18 months, the longest since World War II. The Gross Domestic Product decreased 2.4
percent in 2009, in contrast to a growth of 0.4 percent in 2008.i The unemployment rate rose to 9.3
percent in 2009, representing an increase of 3.5 percentage points from 2008.ii
Giving USA, researched and written by the Center on Philanthropy on behalf of the Giving USA
Foundation, is an annual publication which examines the sources (individuals, corporations, and
foundation) and uses (religion, education, etc.) of charitable giving for the United States. Giving
USA‟s annual estimates of charitable giving in the United States are widely used by practitioners,
policy-makers, academics, and the media. In addition, each edition‟s estimate of giving for the
previous year is the first indication of generosity in that year, and, as such, generates much
publicity.
The 2007-2009 recession affected charitable giving. According to Giving USA 2010 estimation
models, total estimated giving decreased 2.4 percent from 2007 to 2008, and decreased only 3.2
percent in 2009, after adjusting for inflation.iii
High net worth households give between 65 and 70
percent of all individual giving in the United States, and between 49 and 53 percent of giving from
all sources, which includes giving from corporations, foundations, and living and deceased
individuals.iv
Further, analysis of IRS charitable tax deduction records for those who itemized their
charitable giving shows that the average amount deducted for charity by high income households
decreased 9.9 percent from 2007 to 2008 (latest year available), after adjusting for inflation.v
Giving USA 2010 shows that the two year change, since 2007, for giving to religion, education,
human services, health, and public-society benefit organizations such as United Ways or Jewish
federations declined after adjusting for inflation. Giving USA 2010 also shows that the two year
change, since 2007, for giving to international causes increased after adjusting for inflation. These
trends in giving support the findings of the 2010 Study of High Net Worth Philanthropy.
Reading the 2010 Report
The report is divided into four sections: Donors, Volunteers, Nonprofits, and Charitable Vehicles
and Advisors. The Donors section explores high net worth households as charitable givers. It
includes analysis on their confidence in groups to solve societal or global problems, motivations and
attitudes towards giving, household decision-making, along with the mechanics of what and how
high net worth households give. The Volunteers section reports on high net worth households as
volunteers and includes analysis of the number of hours volunteered by type of organization and the
relationship between giving and volunteering. In the Nonprofits section, we report on high net
worth households‟ preferences and expectations of nonprofits and why they stopped giving to
organizations. In the last section on Charitable Vehicles and Advisors, we present the various
methods by which high net worth households make philanthropic gifts along with the advice they
seek when doing so.
7
KEY FINDINGS
The 2010 Bank of America Merrill Lynch Study of High Net Worth Philanthropy tracks significant
shifts as well as consistent trends in the giving behaviors of the wealthiest donors in the United
States. The findings highlight the philanthropic legacy of high net worth households and offer
valuable information to nonprofit organizations who seek to engage, sustain, and deepen
relationships with these donors. It also helps foster peer learning among donors themselves. The
study also offers insights for people who advise the wealthy on their charitable giving strategies.
Strong Commitment to Nonprofits. High net worth households continued to support
charitable organizations at levels seen in 2005 and 2007 (98.2 percent of high net worth
households donated to charity in 2009). The same is true for giving towards religious
organizations (70.5 percent) and secular organizations (98.2 percent). This indicates that
despite the economic downturn, high net worth households remain committed to supporting
nonprofits. When compared to the general population, a higher percentage of wealthy
households gave to different charitable subsectors. Nearly 66 percent of wealthy families
still supported the same organizations or causes year after year and 94.5 percent have some
or a great deal of confidence in nonprofit organizations to solve societal or global problems.
A Change in Giving. Despite a strong commitment to nonprofits in 2009, average
charitable giving by high net worth households decreased between 2007 and 2009. Average
charitable giving dropped 34.9 percent from $83,034 in 2007 to $54,016 in 2009, after
adjusting for inflation. This drop in giving had the largest impact on health organizations.
Average giving to health decreased from $12,430 in 2007 to $4,511 in 2009, a 63.7 percent
difference. Health giving as a share of all high net worth giving dropped from 10.4 percent
to 6 percent across the two studies.
Strategic Philanthropy. Uncertainty in the economy affects many financial decisions
including those related to philanthropy. Wealthy households reported that they give when
they believe their gift will make a difference (72.4 percent), when they feel financially
secure (71.2 percent), and when they know the organization is efficient in its use of
donations (71 percent). Another major factor for high net worth households when making
charitable giving decisions was the organization‟s communications about the percentage of
funding going to programming versus administration (54.1 percent). In addition, about one-
third of households cited an organization‟s own communications about its impact (34.1
percent) as important when giving to charity.
Expect Effective and Transparent Nonprofits. In a continuing trend from the previous
study, this new study finds that wealthy donors have high expectations of charitable
organizations, ranking the following factors among those most important when determining
which to support:
o Sound business and operational practices (86.9 percent)
o Acknowledgement of contributions (including receipts) (84.9 percent)
o Spend appropriate amount on overhead (80.1 percent)
o Protection of personal information (80.1 percent)
o Full financial disclosure (61.7 percent)
8
Giving Strategies in 2009. In response to meeting community needs, nearly 64 percent of
high net worth household gave more in 2009 than in 2008 to support people‟s basic needs
and/or to fund the general operations of an organization.
Use of Charitable Vehicles. Average charitable giving to a giving vehicle such as a private
foundation, fund, or trust increased 21 percent, from $62,680 in 2007 to $75,867 in 2009.
Over one-fifth, 20.9 percent, of all high net worth households currently have an endowment
fund with a particular organization and 17.5 percent of wealthy households gave through
donor-advised funds at a community foundation, financial institution, or in another
organization. More than 46 percent of wealthy households today have a will with a specific
charitable provision and another 12 percent would consider establishing a charitable
provision in their will in the next three years.
Trends by Subsector. A few subsectors saw increases, between 4 and 21 percent, in the
average amount given by wealthy households including arts, environment/animal care,
international causes, and to giving vehicles. Other subsectors saw more significant declines
from 2007, with giving to health experiencing a 63.7 percent decline, education a 55 percent
decline, and combined purpose organizations (such as United Way, United Jewish Appeal,
or Catholic Charities) experiencing a 44 percent decline.
Role of Religion in Philanthropy. When high net worth households attended religious
services regularly they gave more, on average, to religious causes in 2009. Those who
attended religious services once a week gave $14,408 on average, and those who attended
more than once per week gave $18,673, on average, while those who did not attend religious
services gave $2,521, on average, in 2009. Nearly 39 percent of high net worth individuals
gave their time to religious organizations, volunteering on average 125 hours a year. About
39 percent of those surveyed cited “religious beliefs” among their top motivations for
giving. Forty five percent of wealthy households reported that their children or younger
relatives learned about giving through a religious institution.
The Wealthy as Volunteers. Volunteering remains a significant part of the philanthropic
efforts of wealthy individuals. More than three-quarters of high net worth individuals
volunteered in 2009 representing an increase of 3.8 percent from 2007. They volunteered an
average of 307 hours in 2009 (a median of 200 hours in 2009). The more high net worth
individuals volunteered, the more they gave. Non-volunteers gave $46,414, on average, in
2009 while those who volunteered between 101 and 200 hours donated on average $48,860
in 2009, and those who volunteered more than 200 hours donated on average $75,662 to
charity in 2009.
Largest Gift for General Operating Support. Over half of high net worth households
gave their largest gift in 2009 to fund the general operations at nonprofit organizations.
Approximately, 36 percent of high net worth households gave their largest gift to fund a
particular program, and 23.5 percent gave to support the growth of the organization.
Households were less likely to give their largest gift to support capital gifts (e.g.,
construction of a building or to purchase equipment) in 2009 (14.2 percent) than in 2007
(23.6 percent). In 2009, only 11.0 percent of households gave their largest gift to support the
9
long-term investment of an organization (e.g., endowment giving), while 37.2 percent of
households gave for that purpose in 2007.
Low Risk Tolerance with Philanthropic Assets. When it comes to investing their
philanthropic dollars, high net-worth donors are less willing to take risks than they are with
their personal investment portfolio. Over a third (35.2 percent) of high net-worth households
were willing to tolerate above-average risk in their personal portfolio, only 22.9 percent
were willing to assume that risk for their philanthropic investments. More than a quarter,
25.7 percent, said they were completely risk averse in their philanthropic investing,
compared to 10.4 percent who avoided any risk with personal investments.
Donors Consult Legal and Financial Professionals. Consistent with a trend we observed
in the 2006 and 2008 studies, the 2010 study witnessed an increase in donors‟ use of legal
and financial professionals to help them make charitable giving decisions. The 2010 data
finds accountants (67.5 percent), attorneys (40.8 percent) and financial/wealth advisors (38.8
percent) to be among the leading sources of charitable advice.
Household Decision-Makers. This study suggests that among high net worth couples who
make charitable donations, both giving partners are involved in decision-making. About 41
percent confer with their partner or spouse and then make joint decisions about charitable
giving; 26 percent confer with their spouse or partner but then usually one person ultimately
makes the charitable giving decisions for the household; 16 percent reported that giving
decisions were made by a single decision maker without conferring with anyone else; and 15
percent of couples report that each partner typically makes independent decisions about how
to allocate their giving.
Raising Philanthropic Children. The vast majority of wealthy households, 85.4 percent,
instruct their children/younger relatives about philanthropy through the parents‟ personal
efforts and family‟s network of friends/peers. Households reported that children/younger
relatives learn about giving through religious institutions (45 percent), through nonprofit
organizations (21.4 percent), and through the children‟s/young relatives‟ own personal
efforts (19.4 percent). Households involve their children/younger relatives in the charitable
organizations they choose to support (13.5 percent) and involve their children/younger
relatives in philanthropy (11 percent). More than 70 percent of wealthy families have family
traditions of involving children/younger relatives in charitable giving such as making gifts to
organizations where they belong or receive direct benefits (33.7 percent), having family
discussions about giving throughout the year (27 percent), volunteering as a family (18
percent), discussing religious traditions around giving (16 percent), and making family-level
decisions about charitable giving during the holidays (10.1 percent).
10
Why Did Wealthy Donors Stop Donating To an Organization? In 2009, high net worth
households demonstrated a strong commitment to the nonprofit organizations they
supported. For households who stopped giving to at least one organization in 2009, 35.4
percent of donors stopped supporting a charitable organization, with more than one-quarter
of those surveyed (26.6 percent) discontinuing support for at least two organizations. The
top three reasons why donors reported they stopped giving to a particular charity is because
they were too frequently solicited or asked an inappropriate amount (58.9 percent), they
decided to support other causes (34.2 percent), and because their household circumstances
changed (29.4 percent). Very few donors, however, said that they stopped giving to an
organization because they were no longer involved with organization (11.7 percent), the
program/purpose was completed (10.4 percent), or because the organization kept inaccurate
records of information (10.4 percent). This implies that wealthy donors believe that the
organizations they support demonstrate sound business practices.
Attitudes Towards Tax Policy. According to the 2010 study, a combined 67 percent of
wealthy households would somewhat or dramatically decrease their charitable contributions
if they received zero income tax deductions for their donations. Our earlier 2008 study found
a lower percentage of wealthy households (47 percent) responded in this way. Wealthy
households also reported a shift in the amount they would leave to charity in their estate plan
if the estate tax were repealed. A combined 43 percent of wealthy households would
somewhat or dramatically increase the amount they leave to charity in an estate plan if the
estate tax were repealed; compared to 36.1 percent in 2008.
11
DONORS
Most high net worth households give to charity. In the 2010 Study of High Net Worth Philanthropy
we examine high net worth households‟ level of charitable giving experience, their confidence in
groups to solve societal and global problems, their approaches to giving, and charitable decision-
making patterns within high net worth households. This report also provides information on the
giving behaviors and motivations of America‟s wealthiest donors, the transmission of philanthropic
values to children, and the mechanics of high net worth households‟ giving. We examine how their
giving changed since the study was first established in 2005, and how various demographic and
social factors influence giving.
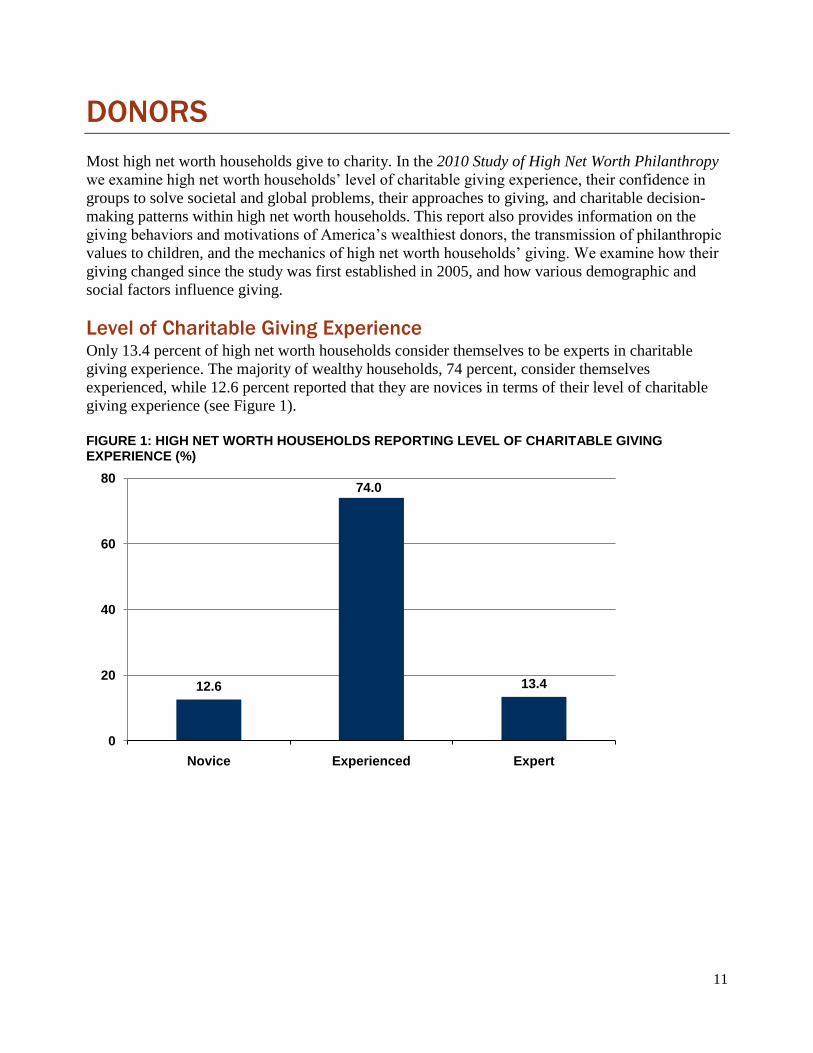
Level of Charitable Giving Experience Only 13.4 percent of high net worth households consider themselves to be experts in charitable
giving experience. The majority of wealthy households, 74 percent, consider themselves
experienced, while 12.6 percent reported that they are novices in terms of their level of charitable
giving experience (see Figure 1).
FIGURE 1: HIGH NET WORTH HOUSEHOLDS REPORTING LEVEL OF CHARITABLE GIVING EXPERIENCE (%)
12.6
74.0
13.4
0
20
40
60
80
Novice Experienced Expert
12
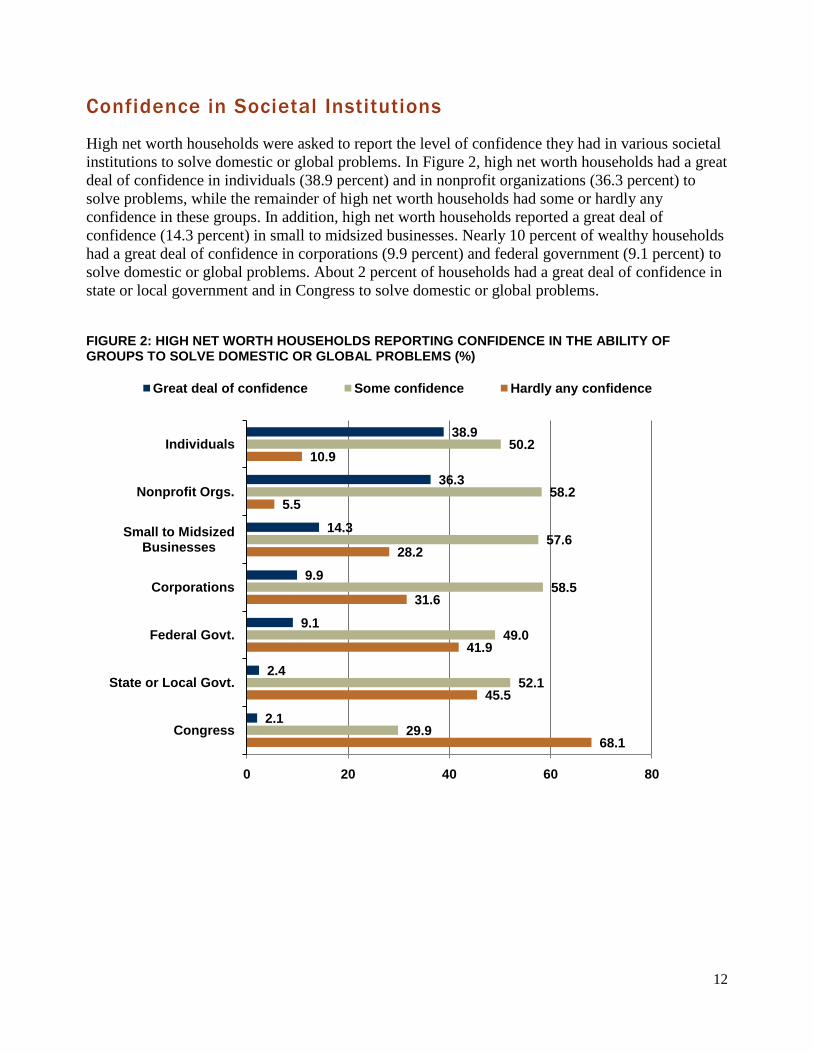
Confidence in Societal Institutions
High net worth households were asked to report the level of confidence they had in various societal
institutions to solve domestic or global problems. In Figure 2, high net worth households had a great
deal of confidence in individuals (38.9 percent) and in nonprofit organizations (36.3 percent) to
solve problems, while the remainder of high net worth households had some or hardly any
confidence in these groups. In addition, high net worth households reported a great deal of
confidence (14.3 percent) in small to midsized businesses. Nearly 10 percent of wealthy households
had a great deal of confidence in corporations (9.9 percent) and federal government (9.1 percent) to
solve domestic or global problems. About 2 percent of households had a great deal of confidence in
state or local government and in Congress to solve domestic or global problems. FIGURE 2: HIGH NET WORTH HOUSEHOLDS REPORTING CONFIDENCE IN THE ABILITY OF GROUPS TO SOLVE DOMESTIC OR GLOBAL PROBLEMS (%)
68.1
45.5
41.9
31.6
28.2
5.5
10.9
29.9
52.1
49.0
58.5
57.6
58.2
50.2
2.1
2.4
9.1
9.9
14.3
36.3
38.9
0 20 40 60 80
Congress
State or Local Govt.
Federal Govt.
Corporations
Small to Midsized Businesses
Nonprofit Orgs.
Individuals
Great deal of confidence Some confidence Hardly any confidence
13
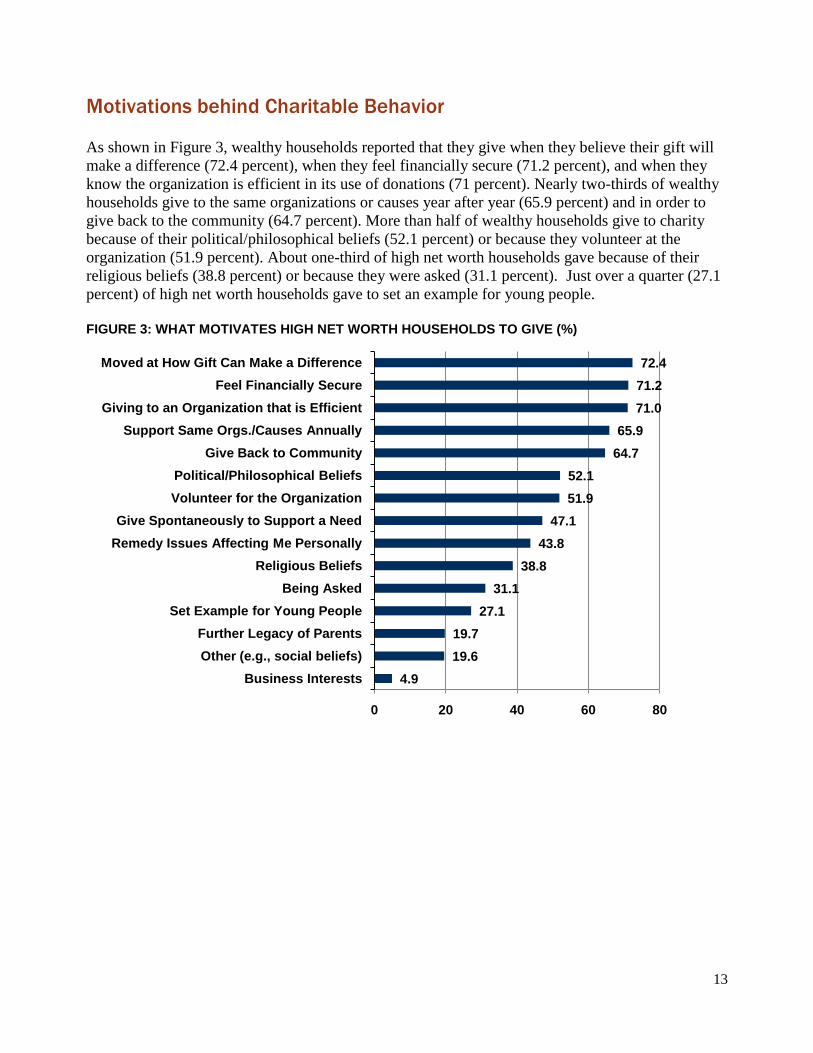
Motivations behind Charitable Behavior
As shown in Figure 3, wealthy households reported that they give when they believe their gift will
make a difference (72.4 percent), when they feel financially secure (71.2 percent), and when they
know the organization is efficient in its use of donations (71 percent). Nearly two-thirds of wealthy
households give to the same organizations or causes year after year (65.9 percent) and in order to
give back to the community (64.7 percent). More than half of wealthy households give to charity
because of their political/philosophical beliefs (52.1 percent) or because they volunteer at the
organization (51.9 percent). About one-third of high net worth households gave because of their
religious beliefs (38.8 percent) or because they were asked (31.1 percent). Just over a quarter (27.1
percent) of high net worth households gave to set an example for young people.
FIGURE 3: WHAT MOTIVATES HIGH NET WORTH HOUSEHOLDS TO GIVE (%)
4.9
19.6
19.7
27.1
31.1
38.8
43.8
47.1
51.9
52.1
64.7
65.9
71.0
71.2
72.4
0 20 40 60 80
Business Interests
Other (e.g., social beliefs)
Further Legacy of Parents
Set Example for Young People
Being Asked
Religious Beliefs
Remedy Issues Affecting Me Personally
Give Spontaneously to Support a Need
Volunteer for the Organization
Political/Philosophical Beliefs
Give Back to Community
Support Same Orgs./Causes Annually
Giving to an Organization that is Efficient
Feel Financially Secure
Moved at How Gift Can Make a Difference
14
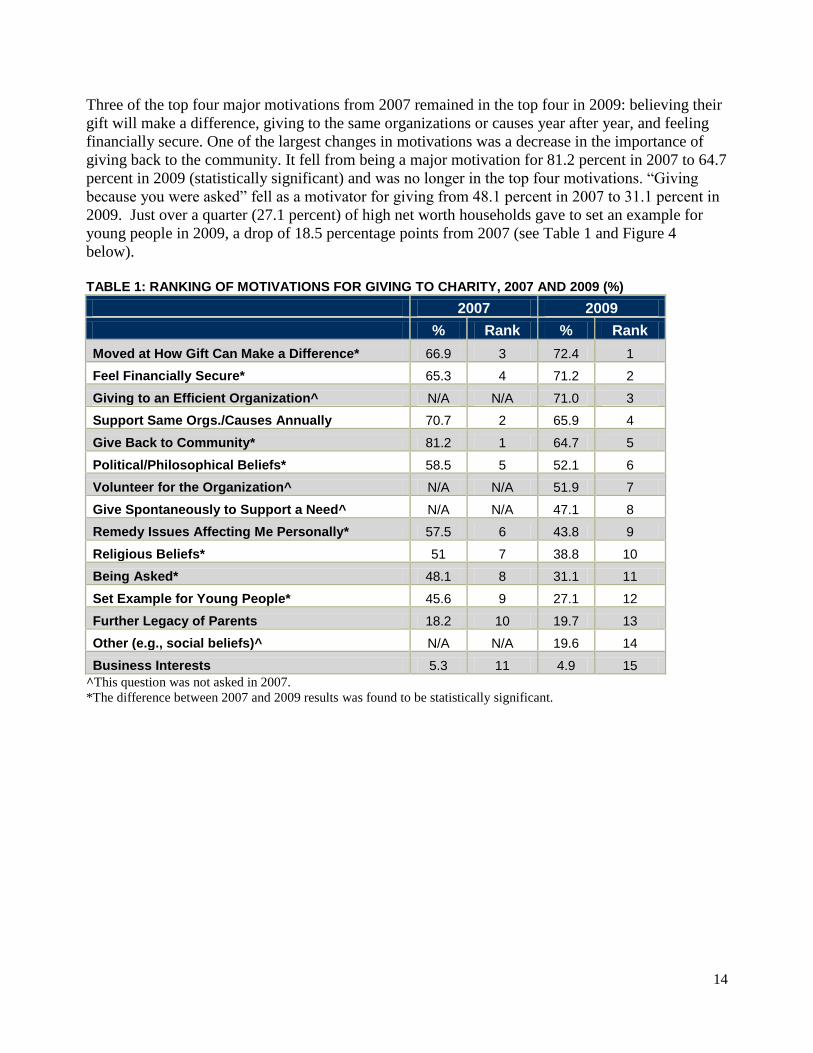
Three of the top four major motivations from 2007 remained in the top four in 2009: believing their
gift will make a difference, giving to the same organizations or causes year after year, and feeling
financially secure. One of the largest changes in motivations was a decrease in the importance of
giving back to the community. It fell from being a major motivation for 81.2 percent in 2007 to 64.7
percent in 2009 (statistically significant) and was no longer in the top four motivations. “Giving
because you were asked” fell as a motivator for giving from 48.1 percent in 2007 to 31.1 percent in
2009. Just over a quarter (27.1 percent) of high net worth households gave to set an example for
young people in 2009, a drop of 18.5 percentage points from 2007 (see Table 1 and Figure 4
below).
TABLE 1: RANKING OF MOTIVATIONS FOR GIVING TO CHARITY, 2007 AND 2009 (%)
2007 2009
% Rank % Rank
Moved at How Gift Can Make a Difference* 66.9 3 72.4 1
Feel Financially Secure* 65.3 4 71.2 2
Giving to an Efficient Organization^ N/A N/A 71.0 3
Support Same Orgs./Causes Annually 70.7 2 65.9 4
Give Back to Community* 81.2 1 64.7 5
Political/Philosophical Beliefs* 58.5 5 52.1 6
Volunteer for the Organization^ N/A N/A 51.9 7
Give Spontaneously to Support a Need^ N/A N/A 47.1 8
Remedy Issues Affecting Me Personally* 57.5 6 43.8 9
Religious Beliefs* 51 7 38.8 10
Being Asked* 48.1 8 31.1 11
Set Example for Young People* 45.6 9 27.1 12
Further Legacy of Parents 18.2 10 19.7 13
Other (e.g., social beliefs)^ N/A N/A 19.6 14
Business Interests 5.3 11 4.9 15
^This question was not asked in 2007.
*The difference between 2007 and 2009 results was found to be statistically significant.
15
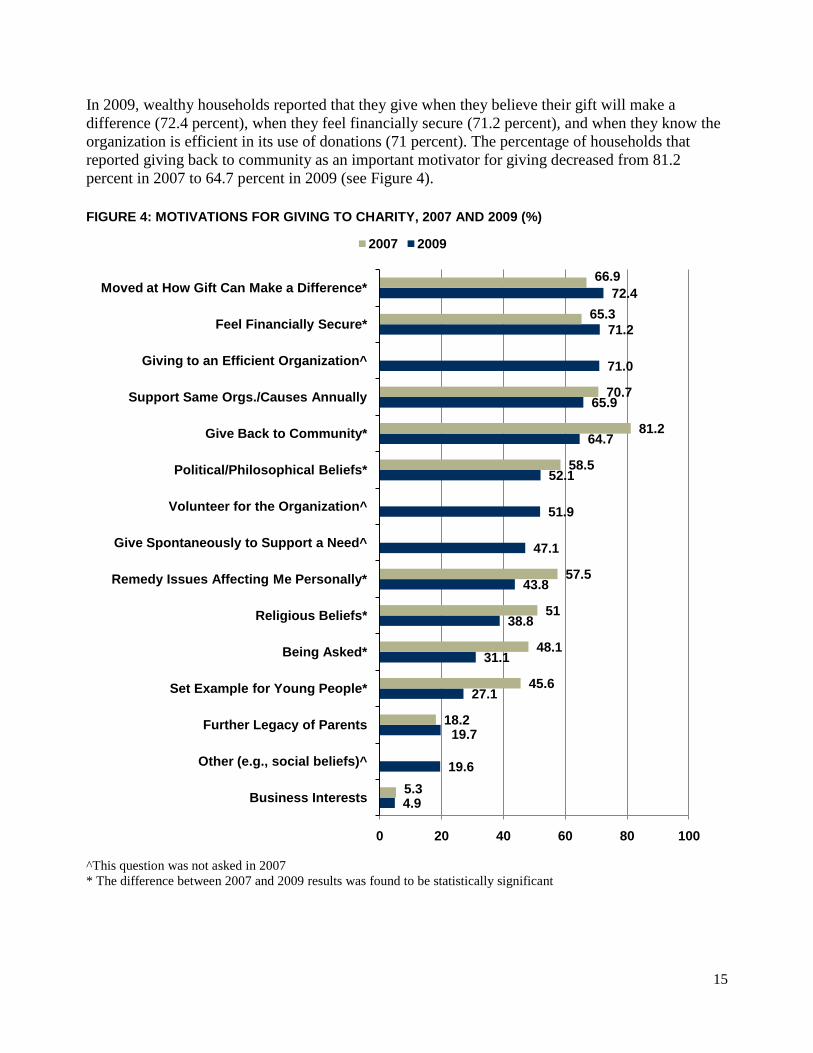
In 2009, wealthy households reported that they give when they believe their gift will make a
difference (72.4 percent), when they feel financially secure (71.2 percent), and when they know the
organization is efficient in its use of donations (71 percent). The percentage of households that
reported giving back to community as an important motivator for giving decreased from 81.2
percent in 2007 to 64.7 percent in 2009 (see Figure 4).
FIGURE 4: MOTIVATIONS FOR GIVING TO CHARITY, 2007 AND 2009 (%)
^This question was not asked in 2007
* The difference between 2007 and 2009 results was found to be statistically significant
4.9
19.6
19.7
27.1
31.1
38.8
43.8
47.1
51.9
52.1
64.7
65.9
71.0
71.2
72.4
5.3
18.2
45.6
48.1
51
57.5
58.5
81.2
70.7
65.3
66.9
0 20 40 60 80 100
Business Interests
Other (e.g., social beliefs)^
Further Legacy of Parents
Set Example for Young People*
Being Asked*
Religious Beliefs*
Remedy Issues Affecting Me Personally*
Give Spontaneously to Support a Need^
Volunteer for the Organization^
Political/Philosophical Beliefs*
Give Back to Community*
Support Same Orgs./Causes Annually
Giving to an Efficient Organization^
Feel Financially Secure*
Moved at How Gift Can Make a Difference*
2007 2009
16
Children and the Transmission of Philanthropic Values
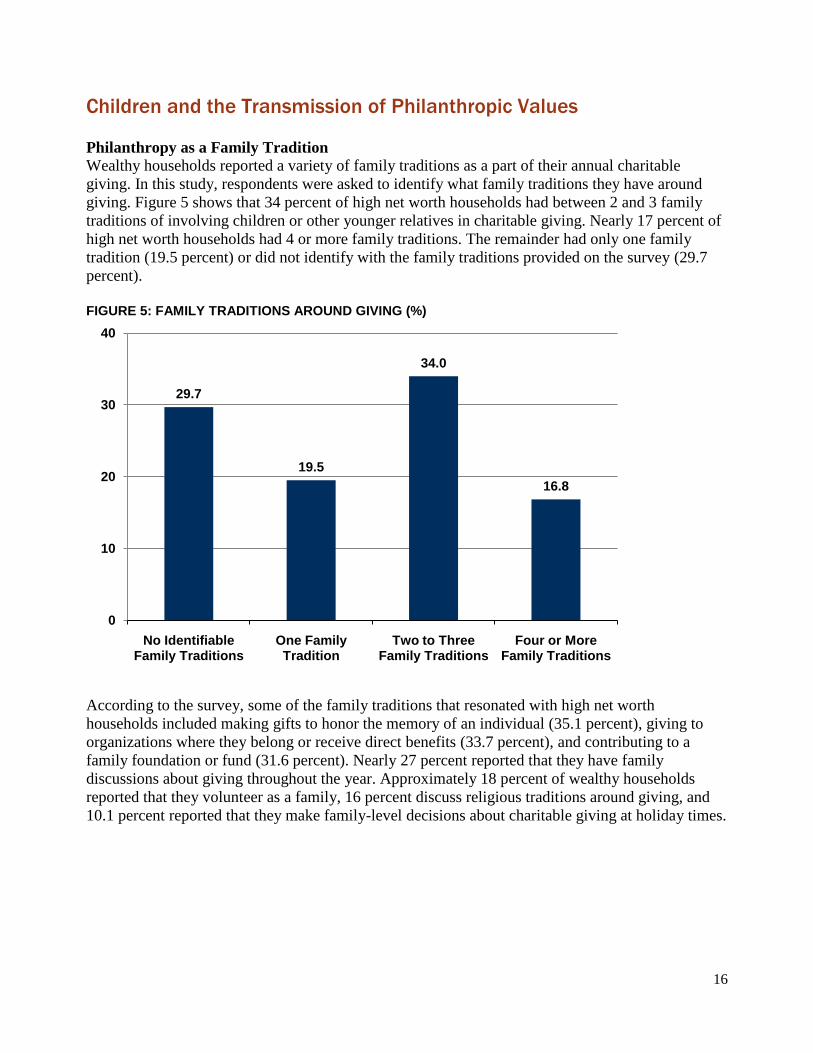
Philanthropy as a Family Tradition
Wealthy households reported a variety of family traditions as a part of their annual charitable
giving. In this study, respondents were asked to identify what family traditions they have around
giving. Figure 5 shows that 34 percent of high net worth households had between 2 and 3 family
traditions of involving children or other younger relatives in charitable giving. Nearly 17 percent of
high net worth households had 4 or more family traditions. The remainder had only one family
tradition (19.5 percent) or did not identify with the family traditions provided on the survey (29.7
percent).
FIGURE 5: FAMILY TRADITIONS AROUND GIVING (%)
According to the survey, some of the family traditions that resonated with high net worth
households included making gifts to honor the memory of an individual (35.1 percent), giving to
organizations where they belong or receive direct benefits (33.7 percent), and contributing to a
family foundation or fund (31.6 percent). Nearly 27 percent reported that they have family
discussions about giving throughout the year. Approximately 18 percent of wealthy households
reported that they volunteer as a family, 16 percent discuss religious traditions around giving, and
10.1 percent reported that they make family-level decisions about charitable giving at holiday times.
29.7
19.5
34.0
16.8
0
10
20
30
40
No Identifiable Family Traditions
One Family Tradition
Two to Three Family Traditions
Four or More Family Traditions
17
Role of Children or Other Younger Relatives in Family Philanthropy
The transmission of philanthropic values to children or other younger relatives was surveyed once
again in this year‟s study. The children of high net worth households in the study are generally
adults. The average age of the children of respondents in the study is 31.
More than 13 percent of high net worth households allowed their children or younger relatives to
participate in determining charities and issues the family gave to each year or long-term. Eleven
percent involved and educated their own children or younger relatives in their family philanthropy.
Over 6 percent allowed children or younger relatives to make decisions for their foundation or
donor-advised fund, while 5.8 percent allowed children or younger relatives to serve as directors,
managers, other decision-makers for their family foundation (see Figure 6). Approximately 72
percent of high net worth households did not involve their children or younger relatives in
charitable decisions.
FIGURE 6: TRANSMITTING PHILANTHROPIC VALUES: ROLE CHILDREN OR YOUNGER RELATIVES PLAY IN CHARITABLE GIVING, 2009 (%)
2.3
3.2
5.8
6.7
11
13.5
72.2
0 20 40 60 80
Give through Own Foundation or DAF
Create/Update Family Mission
Serve on Family Foundation
Make Grantmaking Decisions for Foundation or DAF
Involve/Educate Children or Younger Relatives in Family Philanthropy
Help in Choosing Charities Family Gives to
Children or Younger Relatives Not Involved in Charitable Decisions
18
Figure 7 reveals the role of children or younger relatives in high net worth households‟
philanthropy. Households with many family traditions (reported 2 or more family traditions) were
more likely to involve their children or younger relatives in charitable decisions (58 percent) than
those households with few family traditions (reported no identifiable or one family tradition). A
quarter of households (23.3 percent) asked their children or younger relatives to help determine
charities and issues to which the family gave, and 18 percent involved and educated their children
or younger relatives in family philanthropy.
FIGURE 7: TRANSMITTING PHILANTHROPIC VALUES: ROLE CHILDREN OR YOUNGER RELATIVES PLAY IN CHARITABLE GIVING, 2009 (%)
*The difference between few family traditions (reported no identifiable or one family tradition) and many family
traditions (reported 2 or more family traditions) was found to be statistically significant.
Note: DAF is Donor-Advised Funds.
2.8
4.5
8.3
10.8
17.7
23.3
58
2
2
3.4
3.1
4.8
4.4
88.8
0 20 40 60 80 100
Give through Own Foundation or DAF
Create/Update Family Mission
Serve on Family Foundation*
Make Grantmaking Decisions for Foundation or DAF*
Involve/Educate Children or Younger Relatives in Family Philanthropy*
Help in Choosing Charities Family Gives to*
Children or Younger Relatives Not Involved in Charitable Decisions*
Few Family Traditions Many Family Traditions
19
How Children or Other Younger Relatives Learn about Giving
Figure 8 shows how 85.4 percent of high net worth households educate their children or younger
relatives about charitable giving through their own personal efforts and family‟s network of
friends/peers. Forty-five percent reported that their children or younger relatives learn about
charitable giving through a religious organization, while 21.4 percent reported that their children or
younger relatives learned through nonprofit organization(s). Approximately 19 percent reported that
their children or younger relatives learned through their own personal efforts.
FIGURE 8: TRANSMITTING PHILANTHROPIC VALUES: HOW CHILDREN OR YOUNGER RELATIVES LEARN ABOUT GIVING (%)
0.3
1.3
3.4
19.4
21.4
45
85.4
0 20 40 60 80 100
Independent Philanthropic Advisor
Bank or Trust Co. Advisor
Independent Financial Advisor
Children's or Younger Relatives' Own Efforts
Through Nonprofit Org(s)
Through Religious Org(s)
Parent's Personal Efforts and Family's Network of Friends/Peers
20
Figure 9 explains how children or other younger relatives in high net worth households learned
about philanthropy in 2009. Households with many family traditions (reported 2 or more family
traditions) were more likely to report that their children/younger relatives learned about
philanthropy from parents and their family‟s network of friends/peers in 2009 (90.5 percent) than
those with few family traditions (reported no identifiable or one family tradition). Approximately 58
percent of high net worth households with many family traditions reported that their
children/younger relatives learned about giving through a religious institution, whereas 28 percent
learned through nonprofit organization(s).
FIGURE 9: TRANSMITTING PHILANTHROPIC VALUES: HOW CHILDREN OR YOUNGER RELATIVES LEARN ABOUT GIVING (%)
*The difference between few family traditions (reported no identifiable or one family tradition) and many family
traditions (reported 2 or more family traditions) was found to be statistically significant.
0.3
1.2
3.7
19.1
28
57.8
90.5
0.4
1.4
3.2
20.1
14.6
32.5
82.5
0 20 40 60 80 100
Independent Philanthropic Advisor
Bank or Trust Co. Advisor
Independent Financial Advisor
Children's or Younger Relatives' Own Efforts
Through Nonprofit Org(s)*
Through Religious Org(s)*
Parents' Personal Efforts and Family's Network of Friends/Peers
Few Family Traditions Many Family Traditions
21
Household Decision-Making
Research on household decision-making about philanthropy has received substantial (and growing)
attention, but the field is still in its early stages and far less is known about decision-making in high
net worth households. In this section of the report, we look at the number of decision-makers who
are involved in decisions about charitable giving, how decisions about charitable giving are made,
and then how households allocate their giving. Only respondents who are married or those living
with a partner were examined for this section.
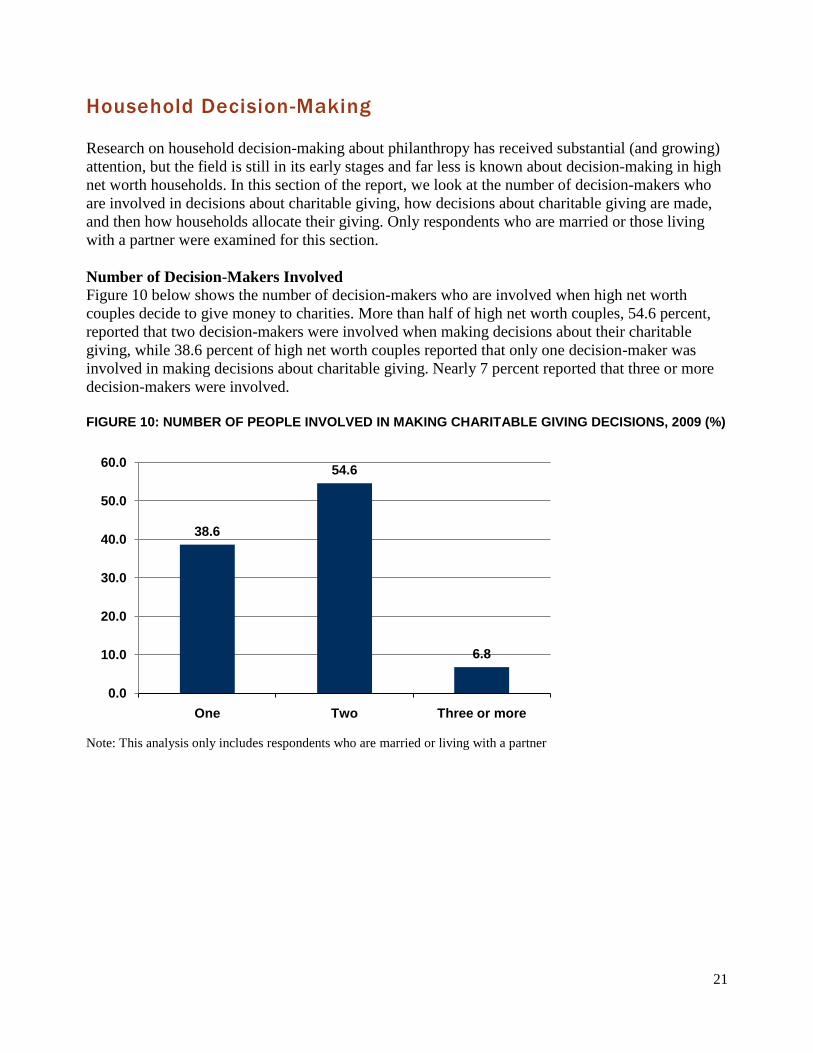
Number of Decision-Makers Involved Figure 10 below shows the number of decision-makers who are involved when high net worth
couples decide to give money to charities. More than half of high net worth couples, 54.6 percent,
reported that two decision-makers were involved when making decisions about their charitable
giving, while 38.6 percent of high net worth couples reported that only one decision-maker was
involved in making decisions about charitable giving. Nearly 7 percent reported that three or more
decision-makers were involved.
FIGURE 10: NUMBER OF PEOPLE INVOLVED IN MAKING CHARITABLE GIVING DECISIONS, 2009 (%)
Note: This analysis only includes respondents who are married or living with a partner
38.6
54.6
6.8
0.0
10.0
20.0
30.0
40.0
50.0
60.0
One Two Three or more
22
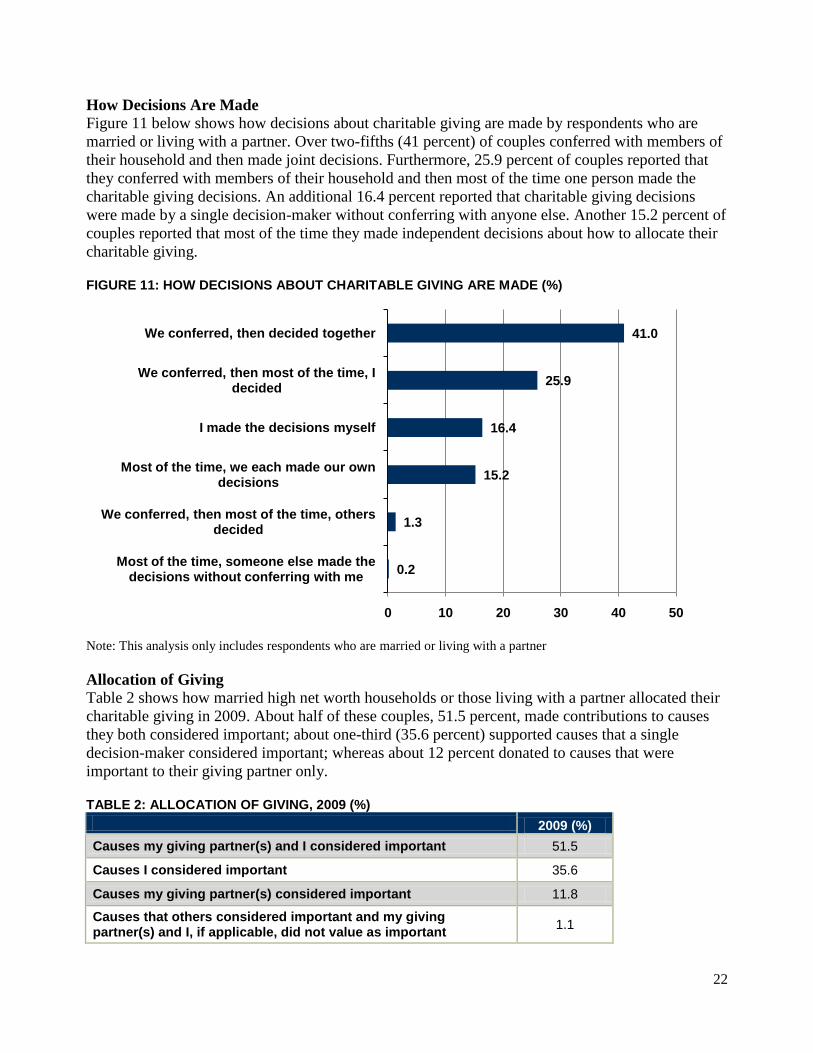
How Decisions Are Made
Figure 11 below shows how decisions about charitable giving are made by respondents who are
married or living with a partner. Over two-fifths (41 percent) of couples conferred with members of
their household and then made joint decisions. Furthermore, 25.9 percent of couples reported that
they conferred with members of their household and then most of the time one person made the
charitable giving decisions. An additional 16.4 percent reported that charitable giving decisions
were made by a single decision-maker without conferring with anyone else. Another 15.2 percent of
couples reported that most of the time they made independent decisions about how to allocate their
charitable giving. FIGURE 11: HOW DECISIONS ABOUT CHARITABLE GIVING ARE MADE (%)
Note: This analysis only includes respondents who are married or living with a partner
Allocation of Giving
Table 2 shows how married high net worth households or those living with a partner allocated their
charitable giving in 2009. About half of these couples, 51.5 percent, made contributions to causes
they both considered important; about one-third (35.6 percent) supported causes that a single
decision-maker considered important; whereas about 12 percent donated to causes that were
important to their giving partner only. TABLE 2: ALLOCATION OF GIVING, 2009 (%)
2009 (%)
Causes my giving partner(s) and I considered important 51.5
Causes I considered important 35.6
Causes my giving partner(s) considered important 11.8
Causes that others considered important and my giving partner(s) and I, if applicable, did not value as important
1.1
0.2
1.3
15.2
16.4
25.9
41.0
0 10 20 30 40 50
Most of the time, someone else made the decisions without conferring with me
We conferred, then most of the time, others decided
Most of the time, we each made our own decisions
I made the decisions myself
We conferred, then most of the time, I decided
We conferred, then decided together

23
High Net Worth Philanthropic Giving in 2009
What Was Given in 2009
High net worth households give to charity not only through their own personal assets, but also
through charitable vehicles such as private foundations, donor-advised funds, and charitable trusts.
In this study we asked about all donations made by high net worth households, which is comprised
of both direct and vehicle-based giving.
Distribution of Giving
Nearly all high net worth households made a donation to charity in 2009, 98.2 percent (see Figure
12). Similarly, nearly all high net worth households gave to secular causes, 98.2 percent in 2009. In
addition, 70.5 percent of high net worth households gave to religious organizations in 2009.
FIGURE 12: PERCENTAGE OF HIGH NET WORTH HOUSEHOLDS WHO GAVE IN 2009 (%)
98.2 98.2
70.5
0
20
40
60
80
100
Total Secular Religious
24
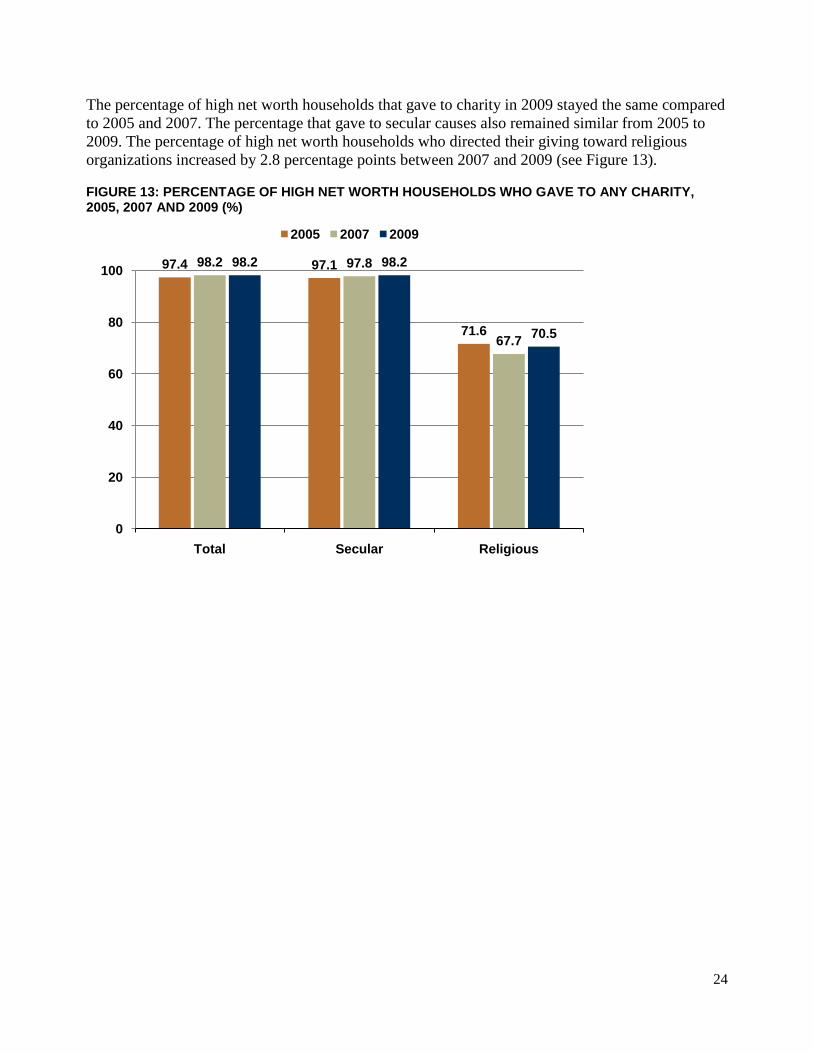
The percentage of high net worth households that gave to charity in 2009 stayed the same compared
to 2005 and 2007. The percentage that gave to secular causes also remained similar from 2005 to
2009. The percentage of high net worth households who directed their giving toward religious
organizations increased by 2.8 percentage points between 2007 and 2009 (see Figure 13). FIGURE 13: PERCENTAGE OF HIGH NET WORTH HOUSEHOLDS WHO GAVE TO ANY CHARITY, 2005, 2007 AND 2009 (%)
97.4 97.1
71.6
98.2 97.8
67.7
98.2 98.2
70.5
0
20
40
60
80
100
Total Secular Religious
2005 2007 2009
25
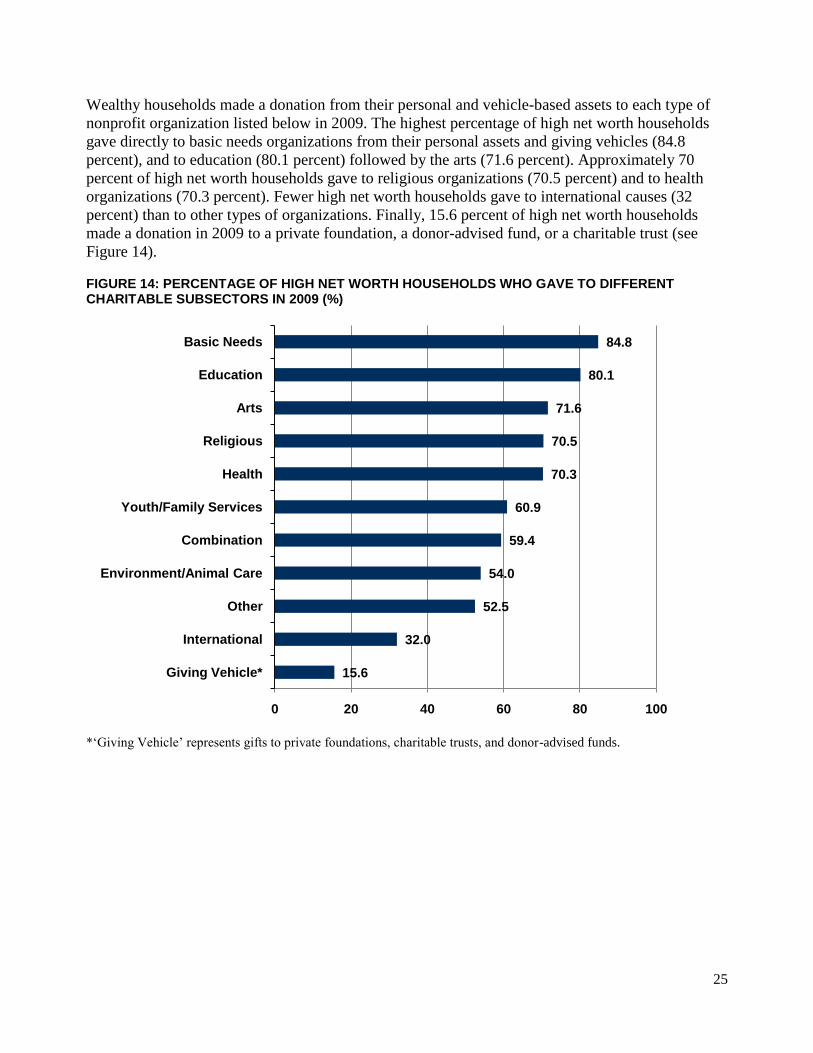
Wealthy households made a donation from their personal and vehicle-based assets to each type of
nonprofit organization listed below in 2009. The highest percentage of high net worth households
gave directly to basic needs organizations from their personal assets and giving vehicles (84.8
percent), and to education (80.1 percent) followed by the arts (71.6 percent). Approximately 70
percent of high net worth households gave to religious organizations (70.5 percent) and to health
organizations (70.3 percent). Fewer high net worth households gave to international causes (32
percent) than to other types of organizations. Finally, 15.6 percent of high net worth households
made a donation in 2009 to a private foundation, a donor-advised fund, or a charitable trust (see
Figure 14). FIGURE 14: PERCENTAGE OF HIGH NET WORTH HOUSEHOLDS WHO GAVE TO DIFFERENT CHARITABLE SUBSECTORS IN 2009 (%)
*„Giving Vehicle‟ represents gifts to private foundations, charitable trusts, and donor-advised funds.
15.6
32.0
52.5
54.0
59.4
60.9
70.3
70.5
71.6
80.1
84.8
0 20 40 60 80 100
Giving Vehicle*
International
Other
Environment/Animal Care
Combination
Youth/Family Services
Health
Religious
Arts
Education
Basic Needs
26
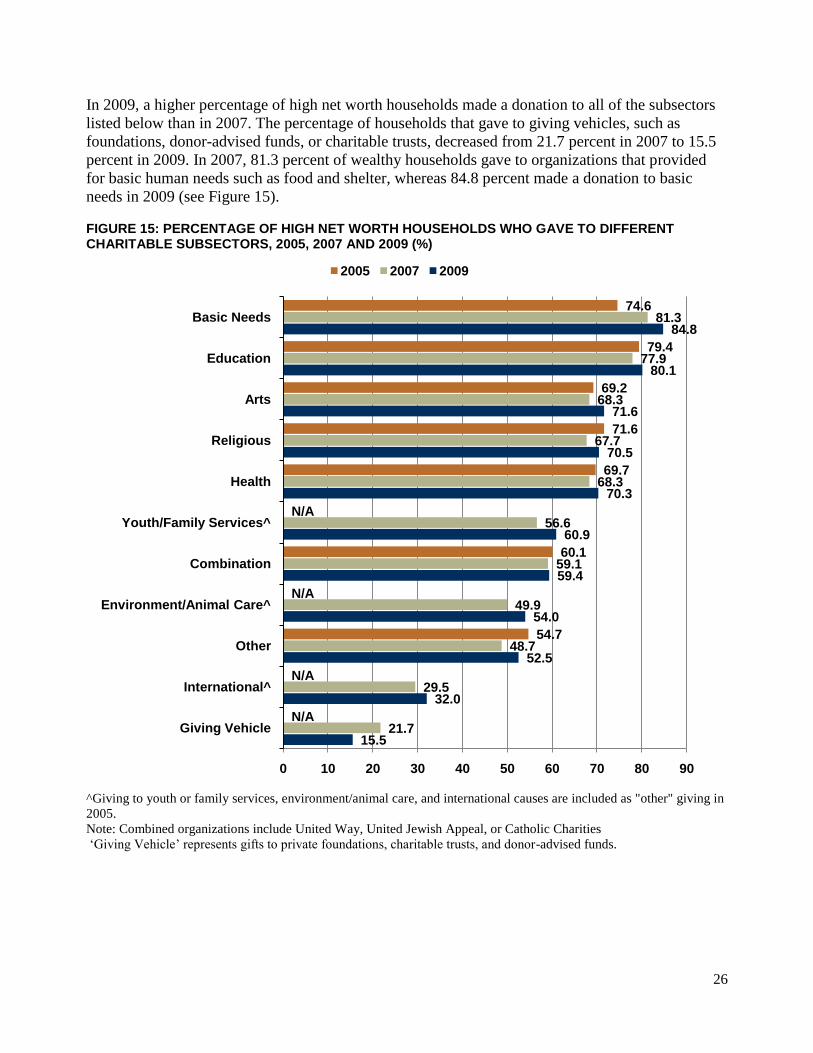
In 2009, a higher percentage of high net worth households made a donation to all of the subsectors
listed below than in 2007. The percentage of households that gave to giving vehicles, such as
foundations, donor-advised funds, or charitable trusts, decreased from 21.7 percent in 2007 to 15.5
percent in 2009. In 2007, 81.3 percent of wealthy households gave to organizations that provided
for basic human needs such as food and shelter, whereas 84.8 percent made a donation to basic
needs in 2009 (see Figure 15). FIGURE 15: PERCENTAGE OF HIGH NET WORTH HOUSEHOLDS WHO GAVE TO DIFFERENT CHARITABLE SUBSECTORS, 2005, 2007 AND 2009 (%)
^Giving to youth or family services, environment/animal care, and international causes are included as "other" giving in
2005.
Note: Combined organizations include United Way, United Jewish Appeal, or Catholic Charities „Giving Vehicle‟ represents gifts to private foundations, charitable trusts, and donor-advised funds.
15.5
32.0
52.5
54.0
59.4
60.9
70.3
70.5
71.6
80.1
84.8
21.7
29.5
48.7
49.9
59.1
56.6
68.3
67.7
68.3
77.9
81.3
N/A
N/A
54.7
N/A
60.1
N/A
69.7
71.6
69.2
79.4
74.6
0 10 20 30 40 50 60 70 80 90
Giving Vehicle
International^
Other
Environment/Animal Care^
Combination
Youth/Family Services^
Health
Religious
Arts
Education
Basic Needs
2005 2007 2009
27
Response to Disaster Relief
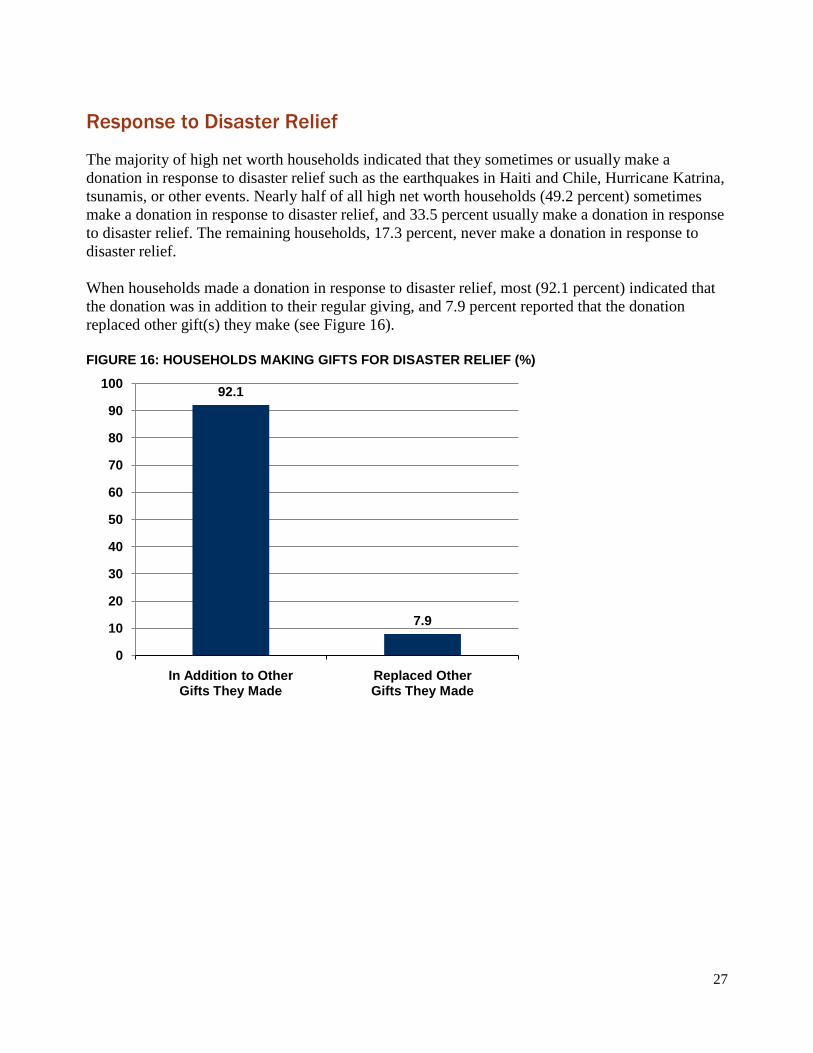
The majority of high net worth households indicated that they sometimes or usually make a
donation in response to disaster relief such as the earthquakes in Haiti and Chile, Hurricane Katrina,
tsunamis, or other events. Nearly half of all high net worth households (49.2 percent) sometimes
make a donation in response to disaster relief, and 33.5 percent usually make a donation in response
to disaster relief. The remaining households, 17.3 percent, never make a donation in response to
disaster relief.
When households made a donation in response to disaster relief, most (92.1 percent) indicated that
the donation was in addition to their regular giving, and 7.9 percent reported that the donation
replaced other gift(s) they make (see Figure 16).
FIGURE 16: HOUSEHOLDS MAKING GIFTS FOR DISASTER RELIEF (%)
92.1
7.9
0
10
20
30
40
50
60
70
80
90
100
In Addition to Other Gifts They Made
Replaced Other Gifts They Made
28
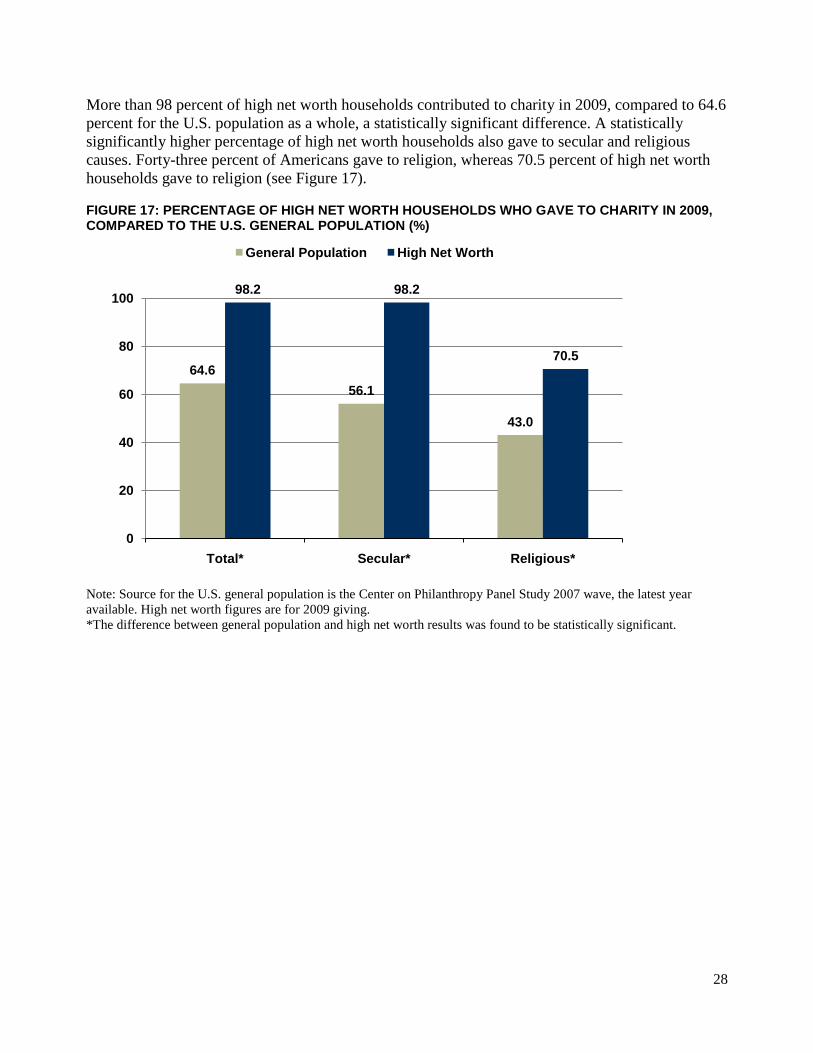
More than 98 percent of high net worth households contributed to charity in 2009, compared to 64.6
percent for the U.S. population as a whole, a statistically significant difference. A statistically
significantly higher percentage of high net worth households also gave to secular and religious
causes. Forty-three percent of Americans gave to religion, whereas 70.5 percent of high net worth
households gave to religion (see Figure 17). FIGURE 17: PERCENTAGE OF HIGH NET WORTH HOUSEHOLDS WHO GAVE TO CHARITY IN 2009, COMPARED TO THE U.S. GENERAL POPULATION (%)
Note: Source for the U.S. general population is the Center on Philanthropy Panel Study 2007 wave, the latest year
available. High net worth figures are for 2009 giving.
*The difference between general population and high net worth results was found to be statistically significant.
64.6
56.1
43.0
98.2 98.2
70.5
0
20
40
60
80
100
Total* Secular* Religious*
General Population High Net Worth
29
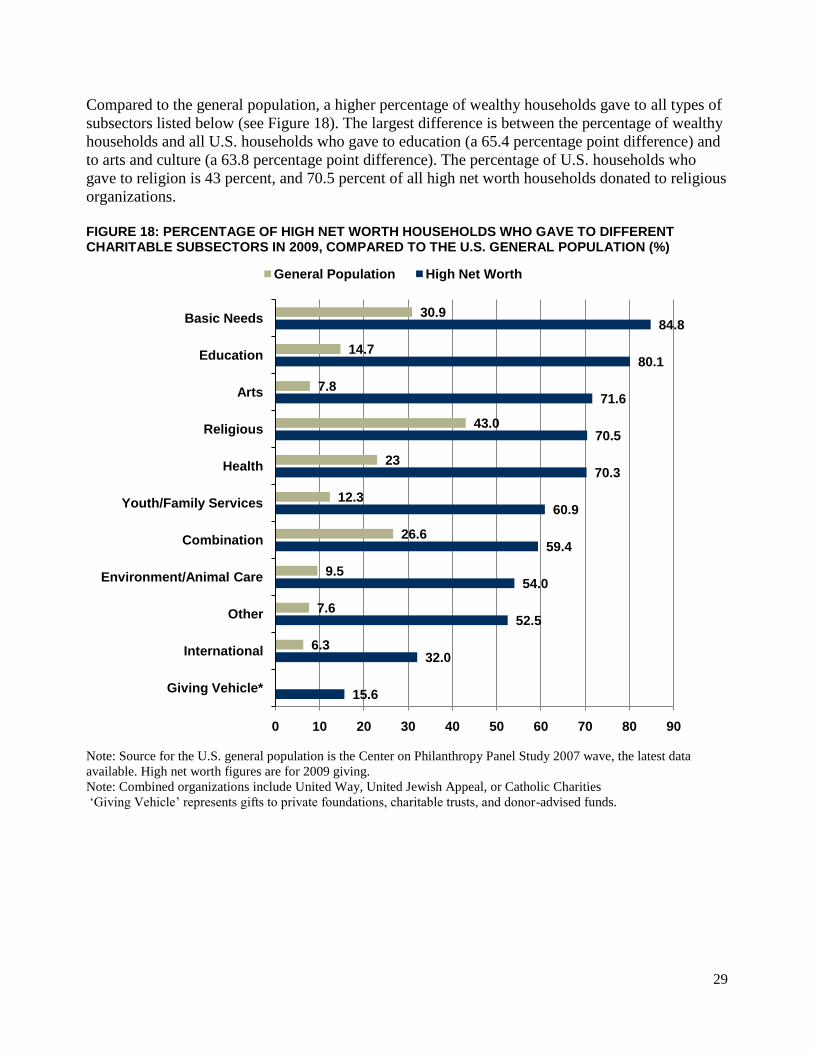
Compared to the general population, a higher percentage of wealthy households gave to all types of
subsectors listed below (see Figure 18). The largest difference is between the percentage of wealthy
households and all U.S. households who gave to education (a 65.4 percentage point difference) and
to arts and culture (a 63.8 percentage point difference). The percentage of U.S. households who
gave to religion is 43 percent, and 70.5 percent of all high net worth households donated to religious
organizations.
FIGURE 18: PERCENTAGE OF HIGH NET WORTH HOUSEHOLDS WHO GAVE TO DIFFERENT CHARITABLE SUBSECTORS IN 2009, COMPARED TO THE U.S. GENERAL POPULATION (%)
Note: Source for the U.S. general population is the Center on Philanthropy Panel Study 2007 wave, the latest data
available. High net worth figures are for 2009 giving.
Note: Combined organizations include United Way, United Jewish Appeal, or Catholic Charities „Giving Vehicle‟ represents gifts to private foundations, charitable trusts, and donor-advised funds.
15.6
32.0
52.5
54.0
59.4
60.9
70.3
70.5
71.6
80.1
84.8
6.3
7.6
9.5
26.6
12.3
23
43.0
7.8
14.7
30.9
0 10 20 30 40 50 60 70 80 90
Giving Vehicle*
International
Other
Environment/Animal Care
Combination
Youth/Family Services
Health
Religious
Arts
Education
Basic Needs
General Population High Net Worth
30
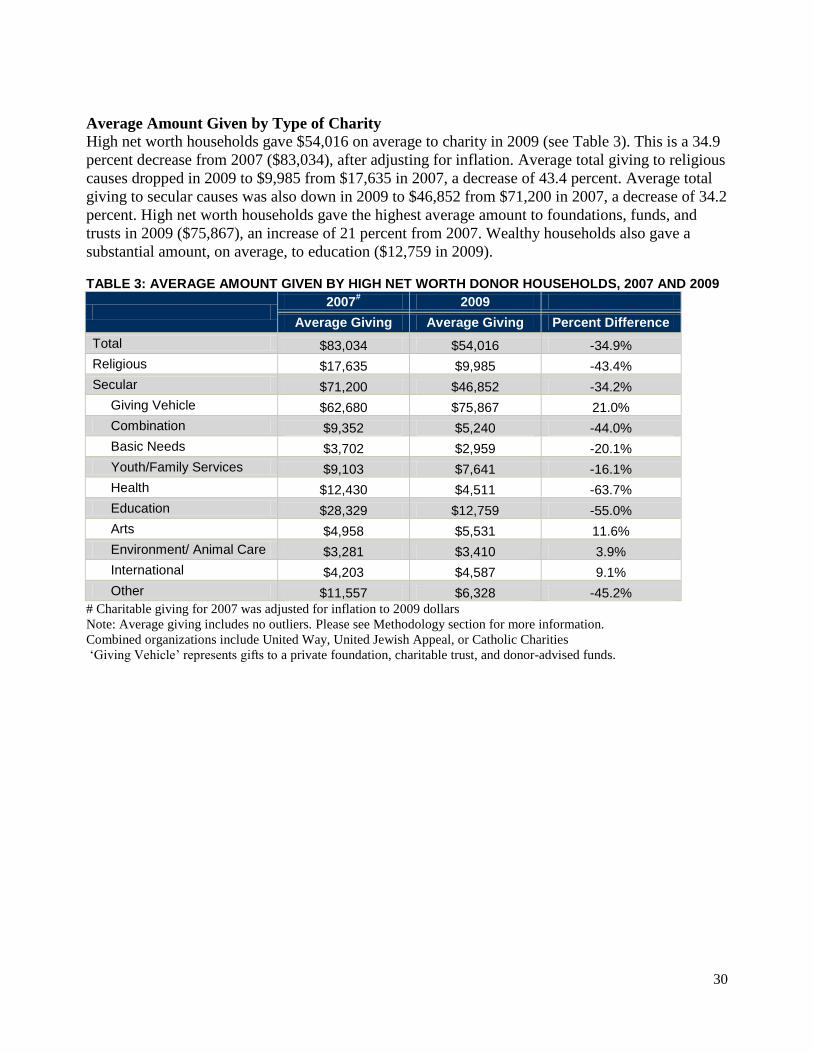
Average Amount Given by Type of Charity
High net worth households gave $54,016 on average to charity in 2009 (see Table 3). This is a 34.9
percent decrease from 2007 ($83,034), after adjusting for inflation. Average total giving to religious
causes dropped in 2009 to $9,985 from $17,635 in 2007, a decrease of 43.4 percent. Average total
giving to secular causes was also down in 2009 to $46,852 from $71,200 in 2007, a decrease of 34.2
percent. High net worth households gave the highest average amount to foundations, funds, and
trusts in 2009 ($75,867), an increase of 21 percent from 2007. Wealthy households also gave a
substantial amount, on average, to education ($12,759 in 2009).
TABLE 3: AVERAGE AMOUNT GIVEN BY HIGH NET WORTH DONOR HOUSEHOLDS, 2007 AND 2009
2007
# 2009
Average Giving Average Giving Percent Difference
Total $83,034 $54,016 -34.9%
Religious $17,635 $9,985 -43.4%
Secular $71,200 $46,852 -34.2%
Giving Vehicle $62,680 $75,867 21.0%
Combination $9,352 $5,240 -44.0%
Basic Needs $3,702 $2,959 -20.1%
Youth/Family Services $9,103 $7,641 -16.1%
Health $12,430 $4,511 -63.7%
Education $28,329 $12,759 -55.0%
Arts $4,958 $5,531 11.6%
Environment/ Animal Care $3,281 $3,410 3.9%
International $4,203 $4,587 9.1%
Other $11,557 $6,328 -45.2%
# Charitable giving for 2007 was adjusted for inflation to 2009 dollars
Note: Average giving includes no outliers. Please see Methodology section for more information.
Combined organizations include United Way, United Jewish Appeal, or Catholic Charities „Giving Vehicle‟ represents gifts to a private foundation, charitable trust, and donor-advised funds.
31
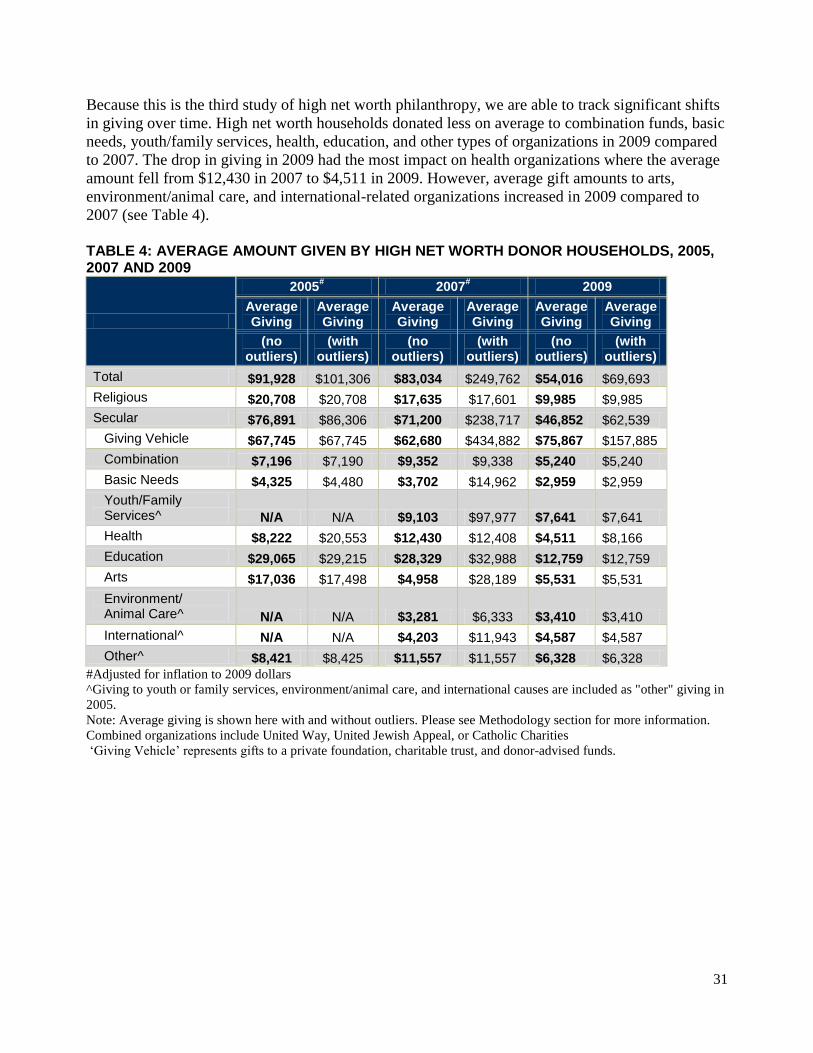
Because this is the third study of high net worth philanthropy, we are able to track significant shifts
in giving over time. High net worth households donated less on average to combination funds, basic
needs, youth/family services, health, education, and other types of organizations in 2009 compared
to 2007. The drop in giving in 2009 had the most impact on health organizations where the average
amount fell from $12,430 in 2007 to $4,511 in 2009. However, average gift amounts to arts,
environment/animal care, and international-related organizations increased in 2009 compared to
2007 (see Table 4).
TABLE 4: AVERAGE AMOUNT GIVEN BY HIGH NET WORTH DONOR HOUSEHOLDS, 2005, 2007 AND 2009
2005# 2007
# 2009
Average Giving
Average Giving
Average Giving
Average Giving
Average Giving
Average Giving
(no outliers)
(with outliers)
(no outliers)
(with outliers)
(no outliers)
(with outliers)
Total $91,928 $101,306 $83,034 $249,762 $54,016 $69,693
Religious $20,708 $20,708 $17,635 $17,601 $9,985 $9,985
Secular $76,891 $86,306 $71,200 $238,717 $46,852 $62,539
Giving Vehicle $67,745 $67,745 $62,680 $434,882 $75,867 $157,885
Combination $7,196 $7,190 $9,352 $9,338 $5,240 $5,240
Basic Needs $4,325 $4,480 $3,702 $14,962 $2,959 $2,959
Youth/Family Services^ N/A N/A $9,103 $97,977 $7,641 $7,641
Health $8,222 $20,553 $12,430 $12,408 $4,511 $8,166
Education $29,065 $29,215 $28,329 $32,988 $12,759 $12,759
Arts $17,036 $17,498 $4,958 $28,189 $5,531 $5,531
Environment/ Animal Care^ N/A N/A $3,281 $6,333 $3,410 $3,410
International^ N/A N/A $4,203 $11,943 $4,587 $4,587
Other^ $8,421 $8,425 $11,557 $11,557 $6,328 $6,328
#Adjusted for inflation to 2009 dollars
^Giving to youth or family services, environment/animal care, and international causes are included as "other" giving in
2005.
Note: Average giving is shown here with and without outliers. Please see Methodology section for more information.
Combined organizations include United Way, United Jewish Appeal, or Catholic Charities „Giving Vehicle‟ represents gifts to a private foundation, charitable trust, and donor-advised funds.
32
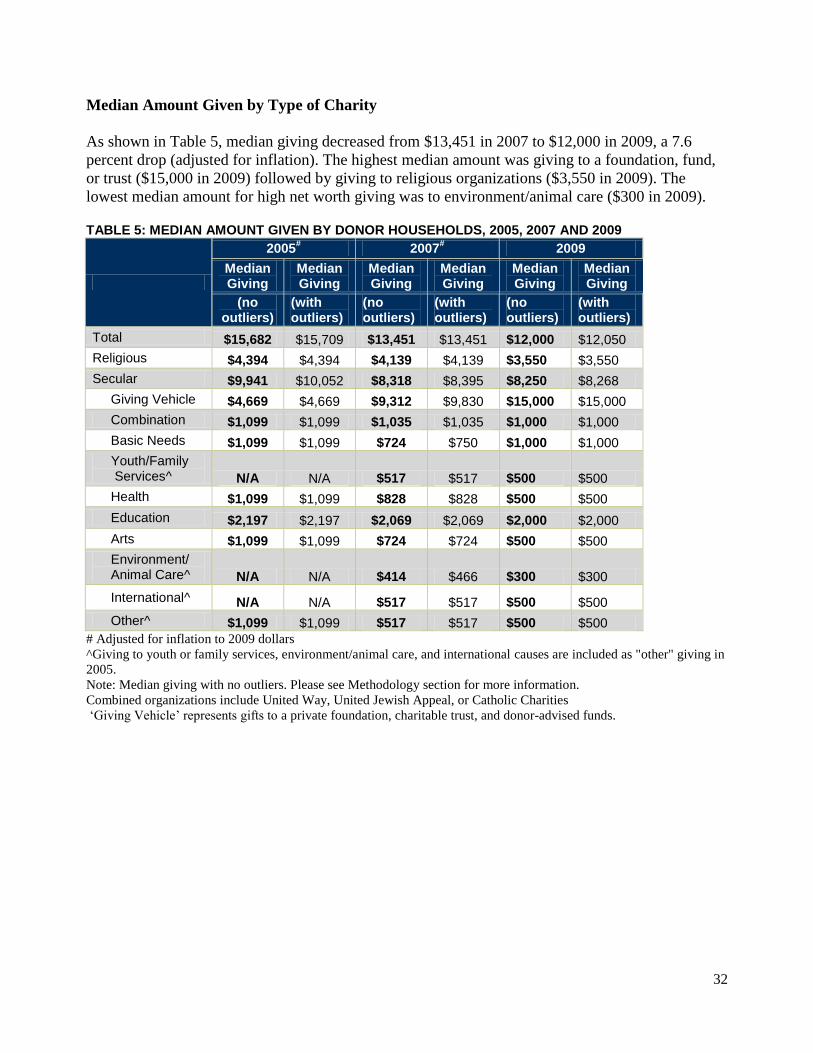
Median Amount Given by Type of Charity
As shown in Table 5, median giving decreased from $13,451 in 2007 to $12,000 in 2009, a 7.6
percent drop (adjusted for inflation). The highest median amount was giving to a foundation, fund,
or trust ($15,000 in 2009) followed by giving to religious organizations ($3,550 in 2009). The
lowest median amount for high net worth giving was to environment/animal care ($300 in 2009). TABLE 5: MEDIAN AMOUNT GIVEN BY DONOR HOUSEHOLDS, 2005, 2007 AND 2009
2005# 2007
# 2009
Median Giving
Median Giving
Median Giving
Median Giving
Median Giving
Median Giving
(no outliers)
(with outliers)
(no outliers)
(with outliers)
(no outliers)
(with outliers)
Total $15,682 $15,709 $13,451 $13,451 $12,000 $12,050
Religious $4,394 $4,394 $4,139 $4,139 $3,550 $3,550
Secular $9,941 $10,052 $8,318 $8,395 $8,250 $8,268
Giving Vehicle $4,669 $4,669 $9,312 $9,830 $15,000 $15,000
Combination $1,099 $1,099 $1,035 $1,035 $1,000 $1,000
Basic Needs $1,099 $1,099 $724 $750 $1,000 $1,000
Youth/Family Services^ N/A N/A $517 $517 $500 $500
Health $1,099 $1,099 $828 $828 $500 $500
Education $2,197 $2,197 $2,069 $2,069 $2,000 $2,000
Arts $1,099 $1,099 $724 $724 $500 $500
Environment/ Animal Care^ N/A N/A $414 $466 $300 $300
International^ N/A N/A $517 $517 $500 $500
Other^ $1,099 $1,099 $517 $517 $500 $500
# Adjusted for inflation to 2009 dollars
^Giving to youth or family services, environment/animal care, and international causes are included as "other" giving in
2005.
Note: Median giving with no outliers. Please see Methodology section for more information.
Combined organizations include United Way, United Jewish Appeal, or Catholic Charities „Giving Vehicle‟ represents gifts to a private foundation, charitable trust, and donor-advised funds.
33
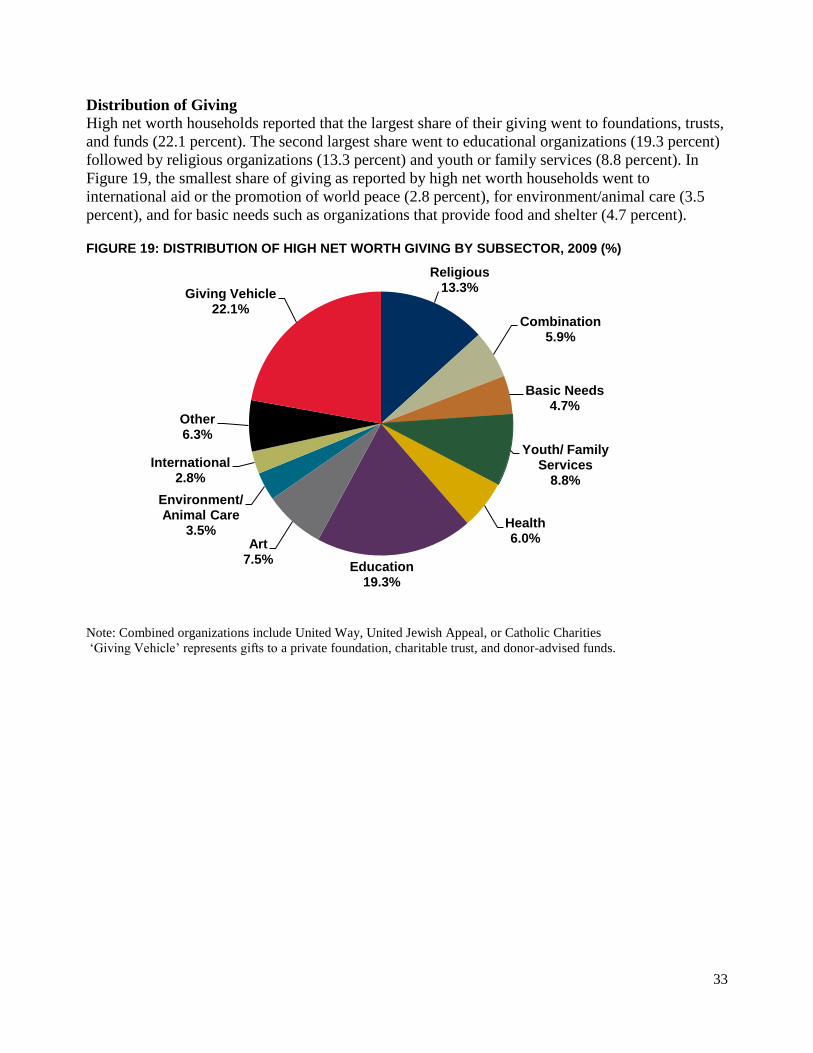
Distribution of Giving
High net worth households reported that the largest share of their giving went to foundations, trusts,
and funds (22.1 percent). The second largest share went to educational organizations (19.3 percent)
followed by religious organizations (13.3 percent) and youth or family services (8.8 percent). In
Figure 19, the smallest share of giving as reported by high net worth households went to
international aid or the promotion of world peace (2.8 percent), for environment/animal care (3.5
percent), and for basic needs such as organizations that provide food and shelter (4.7 percent). FIGURE 19: DISTRIBUTION OF HIGH NET WORTH GIVING BY SUBSECTOR, 2009 (%)
Note: Combined organizations include United Way, United Jewish Appeal, or Catholic Charities „Giving Vehicle‟ represents gifts to a private foundation, charitable trust, and donor-advised funds.
Religious13.3%
Combination5.9%
Basic Needs4.7%
Youth/ Family Services
8.8%
Health6.0%
Education19.3%
Art7.5%
Environment/ Animal Care
3.5%
International2.8%
Other6.3%
Giving Vehicle22.1%
34
The distribution of giving differs considerably between the U.S. general population and high net
worth households. Just over 63 percent of giving from all Americans goes to religion whereas only
13 percent of all high net worth giving is donated to religious organizations. Instead, the largest
share of high net worth giving goes to foundations, funds, or trusts (22.1 percent) and to education
(19.3 percent). The U.S. general population gave a larger share than high net worth households to
basic needs groups and organizations that serve a combination of purposes such as United Way,
Catholic Charities, and the United Jewish Federation (see Figure 20).
FIGURE 20: PERCENT OF TOTAL GIFT DOLLARS TO CHARITABLE SUBSECTORS, U.S. GENERAL POPULATION VS. HIGH NET WORTH DONORS, 2009 (%)
Note: Source for the U.S. general population is the Center on Philanthropy Panel Study 2007 wave, the latest year
available.
Combined organizations include United Way, United Jewish Appeal, or Catholic Charities „Giving Vehicle‟ represents gifts to a private foundation, charitable trust, and donor-advised funds.
22.1
6.3
19.3
8.8
6
2.8
4.7
3.5
5.9
7.5
13.3
N/A
2.3
4.7
1.8
3.6
1.0
10.1
1.2
10.2
1.1
63.4
0 10 20 30 40 50 60 70
Giving Vehicle
Other
Education
Youth/Family Services
Health
International
Basic Needs
Environment/Animal Care
Combination
Arts
Religious
General Population High Net Worth
35
The share of all high net worth household giving donated to a giving vehicle, basic needs, and arts
organizations increased in 2009 compared to 2007 (see Figure 21). The share of giving to religion,
combination funds (such as United Way or Catholic Charities), health, and educational
organizations decreased from 2007 to 2009. The share of contributions to basic needs organizations
by high net worth households increased only 1 percentage point from 2007 to 2009. FIGURE 21: PERCENT OF TOTAL GIFT DOLLARS TO CHARITABLE SUBSECTORS, 2005, 2007, AND 2009 (%)
Note: Combined organizations include United Way, United Jewish Appeal, or Catholic Charities „Giving Vehicle‟ represents gifts to a private foundation, charitable trust, and donor-advised funds.
16.6
4.83.6
6.4
25.8
13.2
24.7
14.6
6.8
3.7
10.4
27.1
4.2
16.5
13.3
5.94.7
6.0
19.3
7.5
22.1
0
5
10
15
20
25
30
Religious Combination Basic Needs
Health Education Arts Giving Vehicle
2005 2007 2009
36
While overall high net worth households overall give more than typical American households, in
some areas there are some similarities. For example, in both groups, there are a large number of
relatively low gift amounts with just a few donors who give at high levels. As Figure 22 shows,
even among the wealthy, charitable giving tends to be skewed toward lower levels of giving. Just
over 43 percent of all high net worth donors gave less than $10,000 in 2009 to charity. Only 2.5
percent of the wealthy donor households made donations of more than $500,000 in 2009. FIGURE 22: PERCENTAGE OF HIGH NET WORTH GIVING BY SIZE OF GIFTS, 2009 (%)
10.6
15.6
17.1
13.8
6.4
8.5 8.5 8.8
4.33.7
1.80.7
0.0
5.0
10.0
15.0
20.0
$2000 or less
$2,001 -$5,000
$5,001 -$10,000
$10,001 -$15,000
$15,001 -$20,000
$20,001 -$30,000
$30,001 -$50,000
$50,001 -$100,000
$100,001 -$200,000
$200,001-$500,000
$500,001 -$1,000,000
$1,000,001 or more
37
High Net Worth Giving by Demographics
Giving by Income
When we examine total giving within specific income categories, we observe that total giving
increases by income; this is similar to what was observed in 2005 and 2007.
At the lower end, those households earning between $200,000 and $500,000 a year gave, on
average, $29,077 in 2005, $33,541 in 2007, and $30,716 in 2009 (note: these figures have
been adjusted for inflation to be comparable to 2009 dollars).
In the middle, those households earning between $500,000 and $2 million a year gave, on
average, $94,884 in 2005, $127,930 in 2007, and $100,011 in 2009.
At the higher end, those households earning $2 million or more a year gave, on average,
$569,746 in 2005, $498,543 in 2007, and $259,692 in 2009.
¶ May not be statistically meaningful because households at this high income group contain fewer than 50 respondents
Giving as a Percentage of Income
High net worth households gave, on average, between 8 and 16.5 percent of their income to charity
in 2009.
Households that earned less than $200,000 but had assets of $1 million or more (excluding
the value of the primary residence) gave, on average, 6.5 percent of their income to charity
in 2005, 6 percent in 2007, and 16.5 percent in 2009.
Households that earned between $200,000 and $500,000 a year gave, on average, 7.6
percent of their income to charity in 2005, 9.3 percent in 2007, and 8.8 percent in 2009.
Households that earned between $500,000 and $2 million a year gave, on average, 6.9
percent of their income to charity in 2005, 9.9 percent in 2007, and 8.0 percent in 2009.
Households that earned $2 million or more a year gave, on average, 17.3 percent in 2005,
16.1 percent in 2007, and 8.7 percent in 2009. 
¶ May not be statistically meaningful because households at this high income group contain fewer than 50 respondents
38
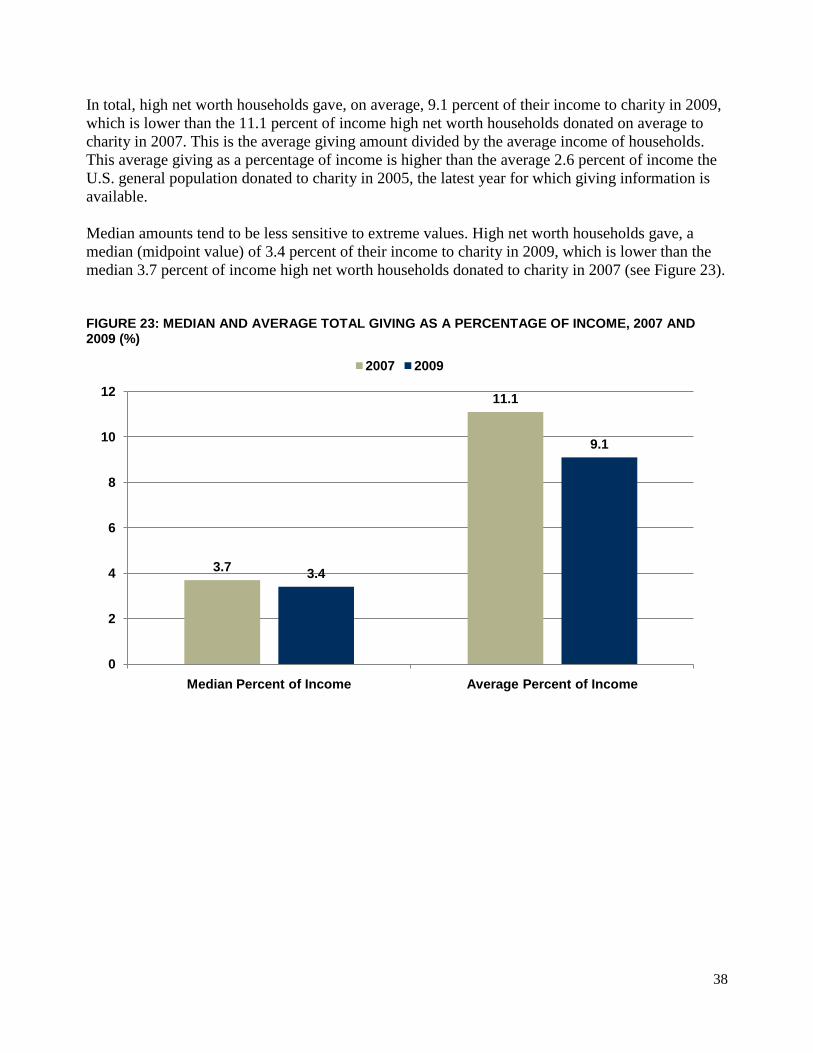
In total, high net worth households gave, on average, 9.1 percent of their income to charity in 2009,
which is lower than the 11.1 percent of income high net worth households donated on average to
charity in 2007. This is the average giving amount divided by the average income of households.
This average giving as a percentage of income is higher than the average 2.6 percent of income the
U.S. general population donated to charity in 2005, the latest year for which giving information is
available.
Median amounts tend to be less sensitive to extreme values. High net worth households gave, a
median (midpoint value) of 3.4 percent of their income to charity in 2009, which is lower than the
median 3.7 percent of income high net worth households donated to charity in 2007 (see Figure 23).
FIGURE 23: MEDIAN AND AVERAGE TOTAL GIVING AS A PERCENTAGE OF INCOME, 2007 AND 2009 (%)
3.7
11.1
3.4
9.1
0
2
4
6
8
10
12
Median Percent of Income Average Percent of Income
2007 2009
39
Giving by Wealth
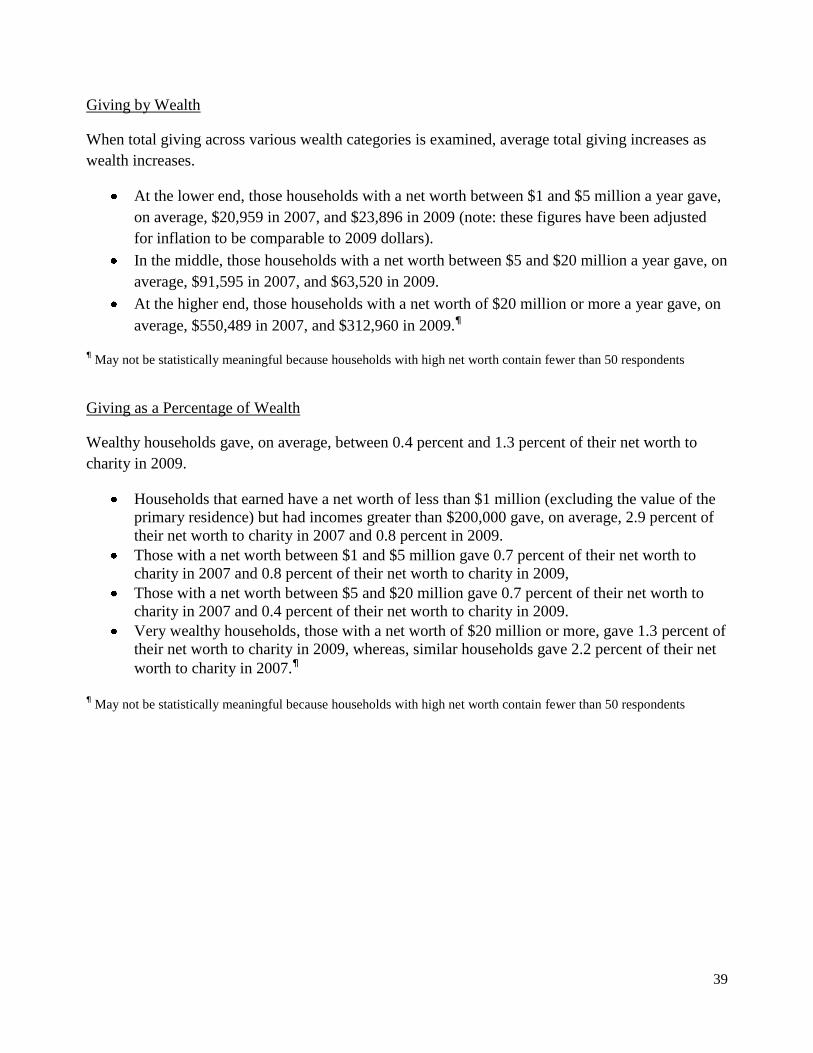
When total giving across various wealth categories is examined, average total giving increases as
wealth increases.
At the lower end, those households with a net worth between $1 and $5 million a year gave,
on average, $20,959 in 2007, and $23,896 in 2009 (note: these figures have been adjusted
for inflation to be comparable to 2009 dollars).
In the middle, those households with a net worth between $5 and $20 million a year gave, on
average, $91,595 in 2007, and $63,520 in 2009.
At the higher end, those households with a net worth of $20 million or more a year gave, on
average, $550,489 in 2007, and $312,960 in 2009.
¶ May not be statistically meaningful because households with high net worth contain fewer than 50 respondents
Giving as a Percentage of Wealth
Wealthy households gave, on average, between 0.4 percent and 1.3 percent of their net worth to
charity in 2009.
Households that earned have a net worth of less than $1 million (excluding the value of the
primary residence) but had incomes greater than $200,000 gave, on average, 2.9 percent of
their net worth to charity in 2007 and 0.8 percent in 2009.
Those with a net worth between $1 and $5 million gave 0.7 percent of their net worth to
charity in 2007 and 0.8 percent of their net worth to charity in 2009,
Those with a net worth between $5 and $20 million gave 0.7 percent of their net worth to
charity in 2007 and 0.4 percent of their net worth to charity in 2009.
Very wealthy households, those with a net worth of $20 million or more, gave 1.3 percent of
their net worth to charity in 2009, whereas, similar households gave 2.2 percent of their net
worth to charity in 2007.
¶ May not be statistically meaningful because households with high net worth contain fewer than 50 respondents
40
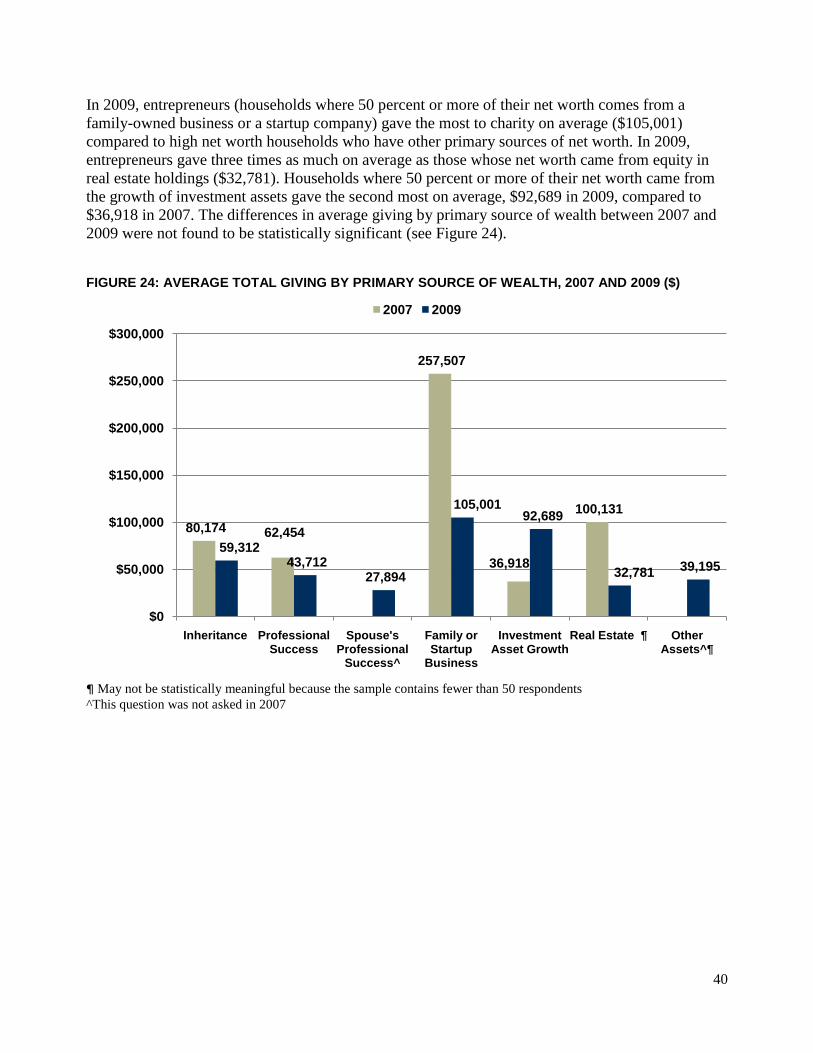
In 2009, entrepreneurs (households where 50 percent or more of their net worth comes from a
family-owned business or a startup company) gave the most to charity on average ($105,001)
compared to high net worth households who have other primary sources of net worth. In 2009,
entrepreneurs gave three times as much on average as those whose net worth came from equity in
real estate holdings ($32,781). Households where 50 percent or more of their net worth came from
the growth of investment assets gave the second most on average, $92,689 in 2009, compared to
$36,918 in 2007. The differences in average giving by primary source of wealth between 2007 and
2009 were not found to be statistically significant (see Figure 24).
FIGURE 24: AVERAGE TOTAL GIVING BY PRIMARY SOURCE OF WEALTH, 2007 AND 2009 ($)
¶ May not be statistically meaningful because the sample contains fewer than 50 respondents
^This question was not asked in 2007
80,174 62,454
257,507
36,918
100,131
59,312 43,712
27,894
105,001 92,689
32,781 39,195
$0
$50,000
$100,000
$150,000
$200,000
$250,000
$300,000
Inheritance Professional Success
Spouse's Professional
Success^
Family or Startup
Business
Investment Asset Growth
Real Estate ¶ Other Assets^
2007 2009
41
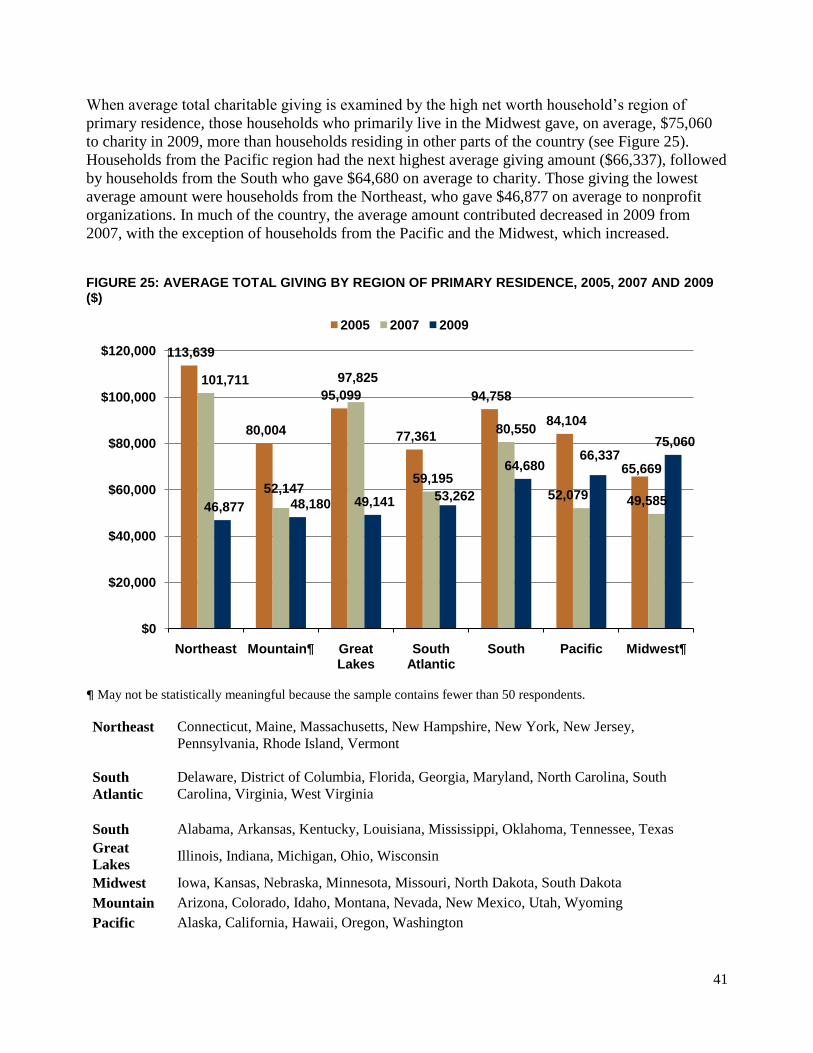
When average total charitable giving is examined by the high net worth household‟s region of
primary residence, those households who primarily live in the Midwest gave, on average, $75,060
to charity in 2009, more than households residing in other parts of the country (see Figure 25).
Households from the Pacific region had the next highest average giving amount ($66,337), followed
by households from the South who gave $64,680 on average to charity. Those giving the lowest
average amount were households from the Northeast, who gave $46,877 on average to nonprofit
organizations. In much of the country, the average amount contributed decreased in 2009 from
2007, with the exception of households from the Pacific and the Midwest, which increased.
FIGURE 25: AVERAGE TOTAL GIVING BY REGION OF PRIMARY RESIDENCE, 2005, 2007 AND 2009 ($)
¶ May not be statistically meaningful because the sample contains fewer than 50 respondents.
Northeast Connecticut, Maine, Massachusetts, New Hampshire, New York, New Jersey,
Pennsylvania, Rhode Island, Vermont
South
Atlantic
Delaware, District of Columbia, Florida, Georgia, Maryland, North Carolina, South
Carolina, Virginia, West Virginia
South Alabama, Arkansas, Kentucky, Louisiana, Mississippi, Oklahoma, Tennessee, Texas
Great
Lakes Illinois, Indiana, Michigan, Ohio, Wisconsin
Midwest Iowa, Kansas, Nebraska, Minnesota, Missouri, North Dakota, South Dakota
Mountain Arizona, Colorado, Idaho, Montana, Nevada, New Mexico, Utah, Wyoming
Pacific Alaska, California, Hawaii, Oregon, Washington
113,639
80,004
95,099
77,361
94,758
84,104
65,669
101,711
52,147
97,825
59,195
80,550
52,079 49,585 46,877 48,180 49,141 53,262
64,680 66,337
75,060
$0
$20,000
$40,000
$60,000
$80,000
$100,000
$120,000
Northeast Mountain¶ Great Lakes
South Atlantic
South Pacific Midwest
2005 2007 2009
42
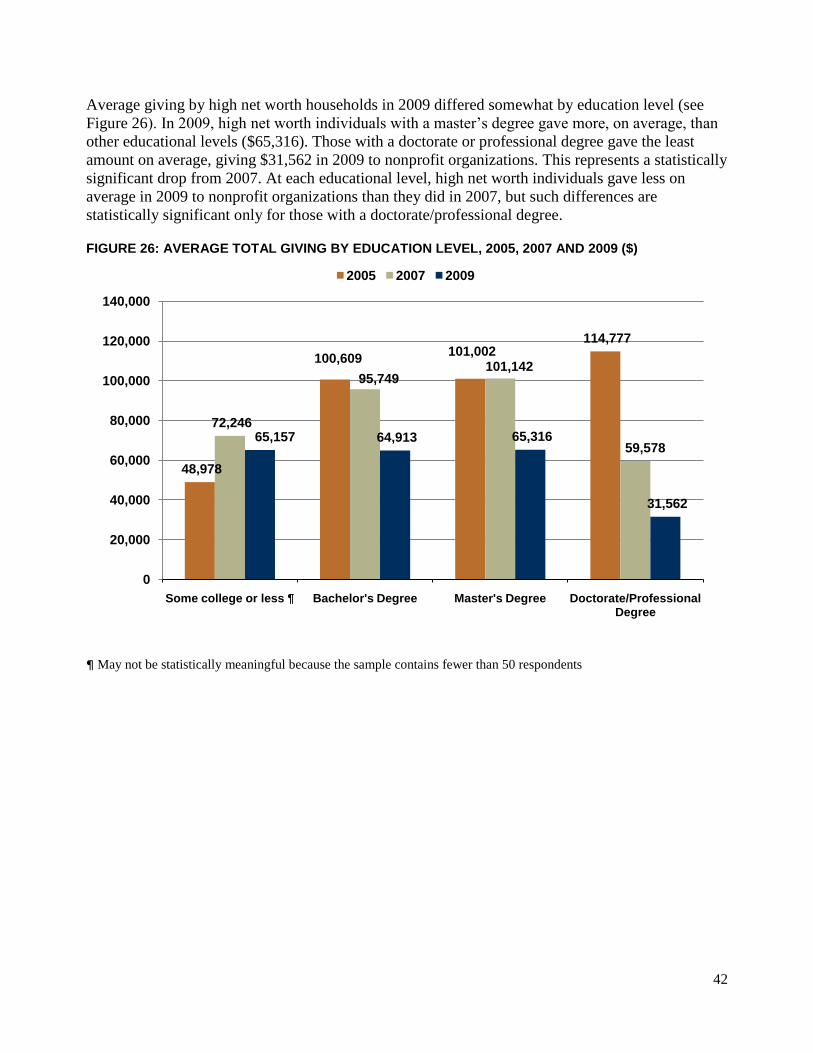
Average giving by high net worth households in 2009 differed somewhat by education level (see
Figure 26). In 2009, high net worth individuals with a master‟s degree gave more, on average, than
other educational levels ($65,316). Those with a doctorate or professional degree gave the least
amount on average, giving $31,562 in 2009 to nonprofit organizations. This represents a statistically
significant drop from 2007. At each educational level, high net worth individuals gave less on
average in 2009 to nonprofit organizations than they did in 2007, but such differences are
statistically significant only for those with a doctorate/professional degree. FIGURE 26: AVERAGE TOTAL GIVING BY EDUCATION LEVEL, 2005, 2007 AND 2009 ($)
¶ May not be statistically meaningful because the sample contains fewer than 50 respondents
48,978
100,609 101,002
114,777
72,246
95,749 101,142
59,578 65,157 64,913 65,316
31,562
0
20,000
40,000
60,000
80,000
100,000
120,000
140,000
Some college or less ¶ Bachelor's Degree Master's Degree Doctorate/Professional Degree
2005 2007 2009
43
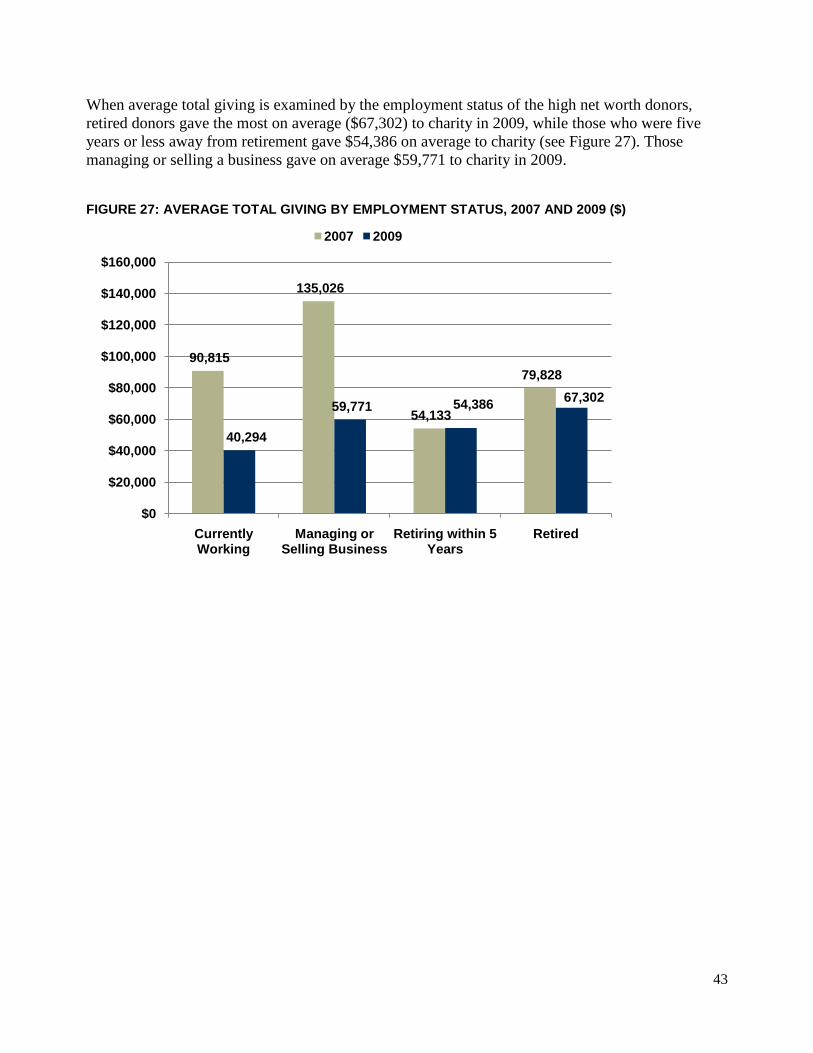
When average total giving is examined by the employment status of the high net worth donors,
retired donors gave the most on average ($67,302) to charity in 2009, while those who were five
years or less away from retirement gave $54,386 on average to charity (see Figure 27). Those
managing or selling a business gave on average $59,771 to charity in 2009.
FIGURE 27: AVERAGE TOTAL GIVING BY EMPLOYMENT STATUS, 2007 AND 2009 ($)
90,815
135,026
54,133
79,828
40,294
59,771 54,386 67,302
$0
$20,000
$40,000
$60,000
$80,000
$100,000
$120,000
$140,000
$160,000
Currently Working
Managing or Selling Business
Retiring within 5 Years
Retired
2007 2009
44
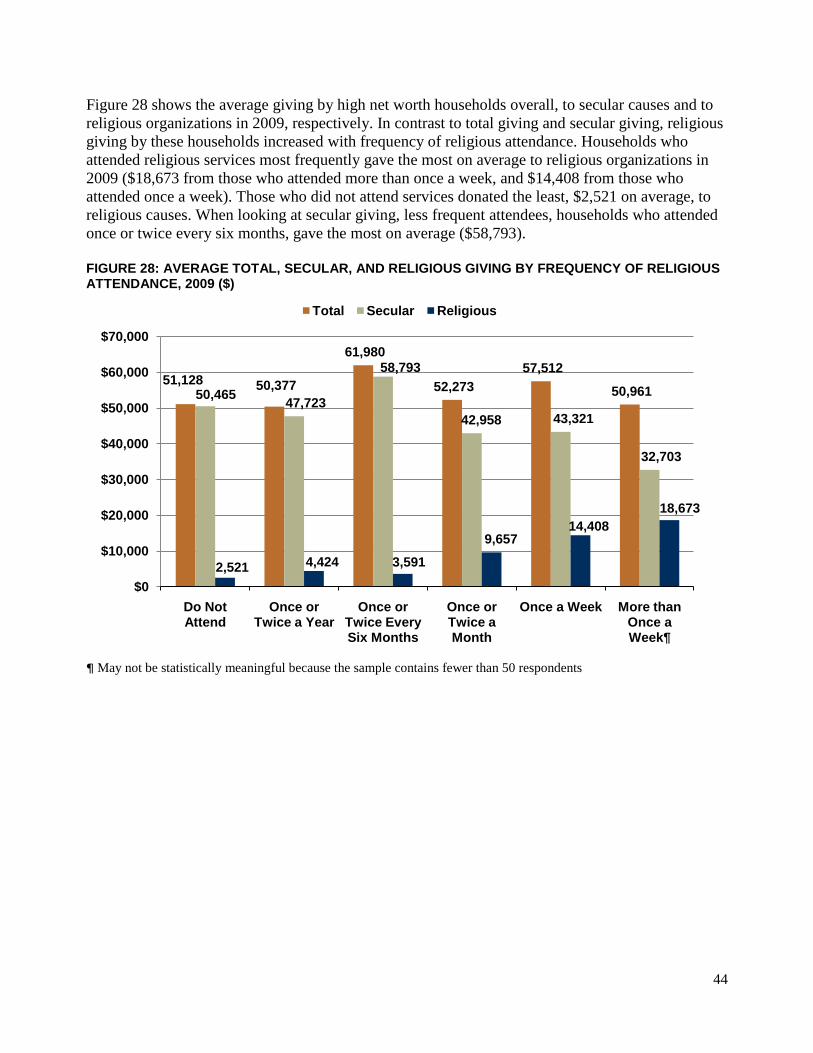
Figure 28 shows the average giving by high net worth households overall, to secular causes and to
religious organizations in 2009, respectively. In contrast to total giving and secular giving, religious
giving by these households increased with frequency of religious attendance. Households who
attended religious services most frequently gave the most on average to religious organizations in
2009 ($18,673 from those who attended more than once a week, and $14,408 from those who
attended once a week). Those who did not attend services donated the least, $2,521 on average, to
religious causes. When looking at secular giving, less frequent attendees, households who attended
once or twice every six months, gave the most on average ($58,793).
FIGURE 28: AVERAGE TOTAL, SECULAR, AND RELIGIOUS GIVING BY FREQUENCY OF RELIGIOUS ATTENDANCE, 2009 ($)
¶ May not be statistically meaningful because the sample contains fewer than 50 respondents
51,128 50,377
61,980
52,273
57,512
50,961 50,465 47,723
58,793
42,958 43,321
32,703
2,521 4,424 3,591
9,657 14,408
18,673
$0
$10,000
$20,000
$30,000
$40,000
$50,000
$60,000
$70,000
Do Not Attend
Once or Twice a Year
Once or Twice Every Six Months
Once or Twice a Month
Once a Week More than Once a Week
Total Secular Religious
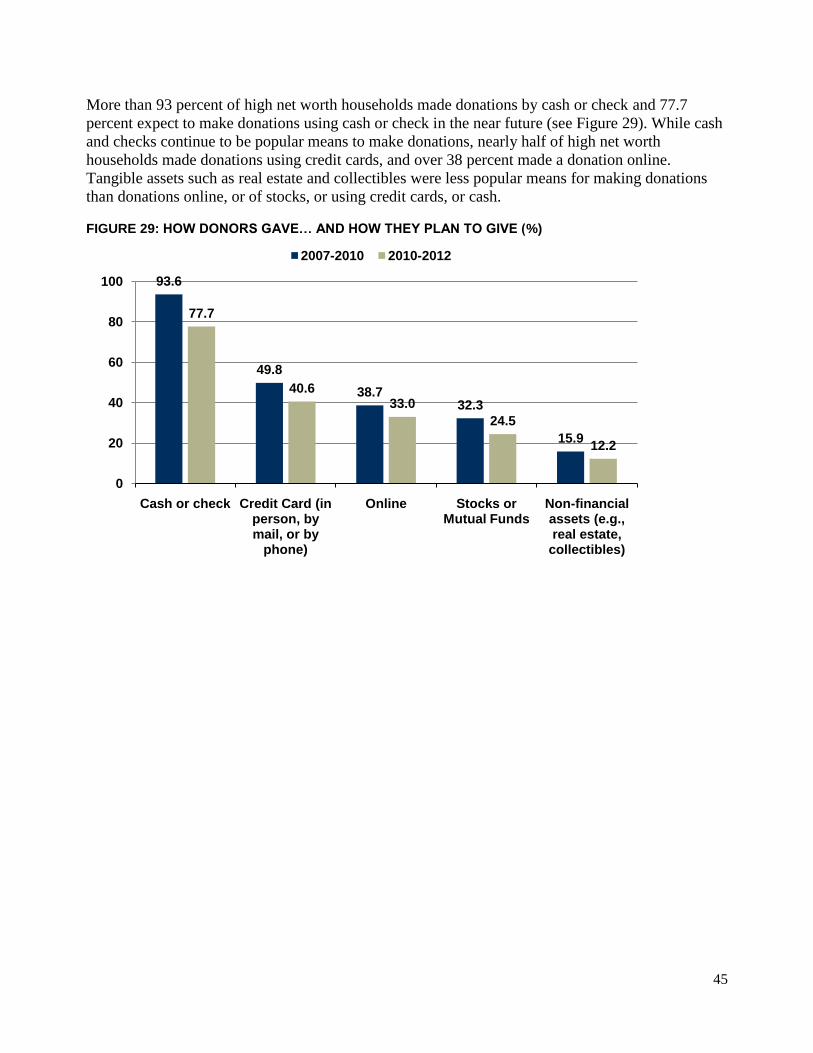
45
More than 93 percent of high net worth households made donations by cash or check and 77.7
percent expect to make donations using cash or check in the near future (see Figure 29). While cash
and checks continue to be popular means to make donations, nearly half of high net worth
households made donations using credit cards, and over 38 percent made a donation online.
Tangible assets such as real estate and collectibles were less popular means for making donations
than donations online, or of stocks, or using credit cards, or cash. FIGURE 29: HOW DONORS GAVE… AND HOW THEY PLAN TO GIVE (%)
93.6
49.8
38.732.3
15.9
77.7
40.633.0
24.5
12.2
0
20
40
60
80
100
Cash or check Credit Card (in person, by mail, or by
phone)
Online Stocks or Mutual Funds
Non-financial assets (e.g., real estate,
collectibles)
2007-2010 2010-2012
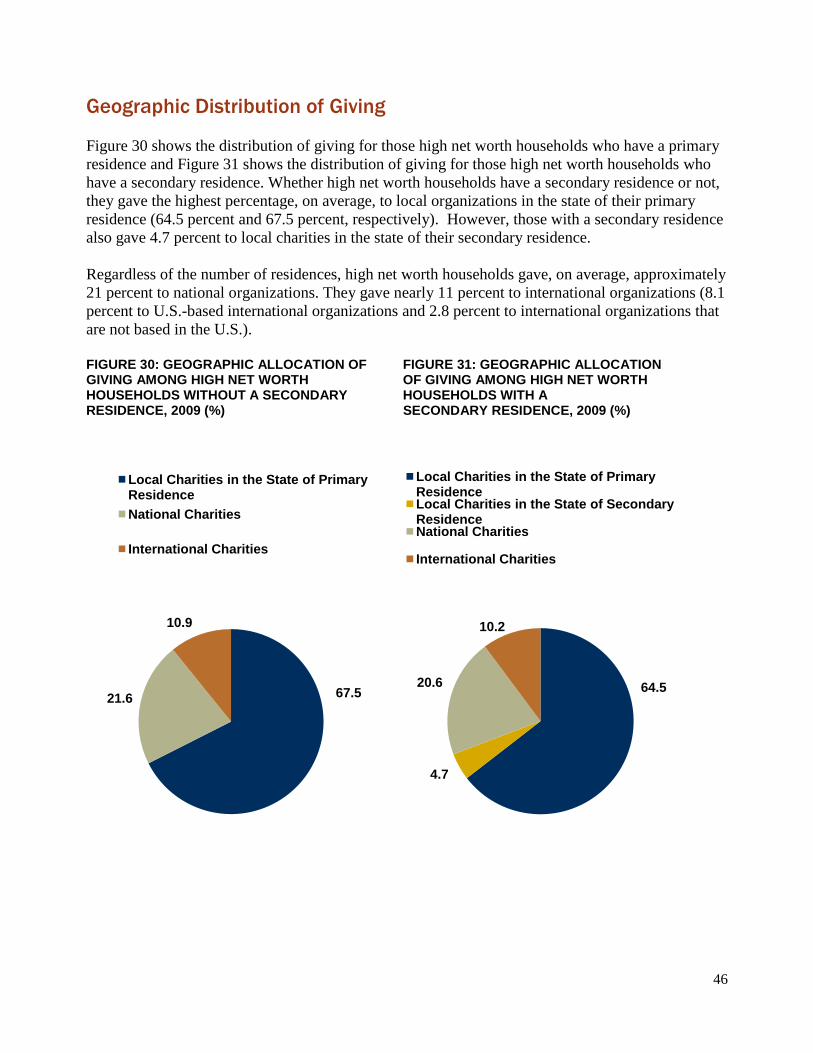
46
Geographic Distribution of Giving
Figure 30 shows the distribution of giving for those high net worth households who have a primary
residence and Figure 31 shows the distribution of giving for those high net worth households who
have a secondary residence. Whether high net worth households have a secondary residence or not,
they gave the highest percentage, on average, to local organizations in the state of their primary
residence (64.5 percent and 67.5 percent, respectively). However, those with a secondary residence
also gave 4.7 percent to local charities in the state of their secondary residence.
Regardless of the number of residences, high net worth households gave, on average, approximately
21 percent to national organizations. They gave nearly 11 percent to international organizations (8.1
percent to U.S.-based international organizations and 2.8 percent to international organizations that
are not based in the U.S.).
FIGURE 30: GEOGRAPHIC ALLOCATION OF FIGURE 31: GEOGRAPHIC ALLOCATION GIVING AMONG HIGH NET WORTH OF GIVING AMONG HIGH NET WORTH HOUSEHOLDS WITHOUT A SECONDARY HOUSEHOLDS WITH A RESIDENCE, 2009 (%) SECONDARY RESIDENCE, 2009 (%)
67.521.6
10.9
Local Charities in the State of Primary Residence
National Charities
International Charities
64.5
4.7
20.6
10.2
Local Charities in the State of Primary ResidenceLocal Charities in the State of Secondary ResidenceNational Charities
International Charities
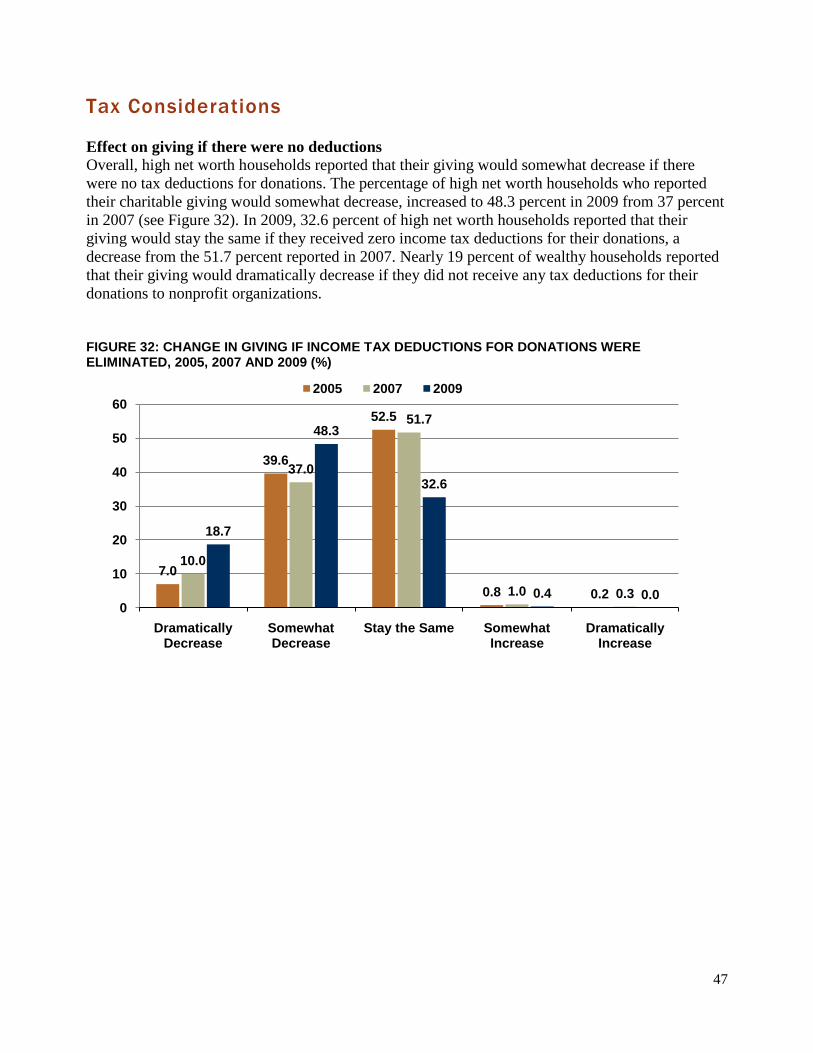
47
Tax Considerations
Effect on giving if there were no deductions
Overall, high net worth households reported that their giving would somewhat decrease if there
were no tax deductions for donations. The percentage of high net worth households who reported
their charitable giving would somewhat decrease, increased to 48.3 percent in 2009 from 37 percent
in 2007 (see Figure 32). In 2009, 32.6 percent of high net worth households reported that their
giving would stay the same if they received zero income tax deductions for their donations, a
decrease from the 51.7 percent reported in 2007. Nearly 19 percent of wealthy households reported
that their giving would dramatically decrease if they did not receive any tax deductions for their
donations to nonprofit organizations.
FIGURE 32: CHANGE IN GIVING IF INCOME TAX DEDUCTIONS FOR DONATIONS WERE ELIMINATED, 2005, 2007 AND 2009 (%)
7.0
39.6
52.5
0.8 0.2
10.0
37.0
51.7
1.0 0.3
18.7
48.3
32.6
0.4 0.00
10
20
30
40
50
60
Dramatically Decrease
Somewhat Decrease
Stay the Same Somewhat Increase
Dramatically Increase
2005 2007 2009
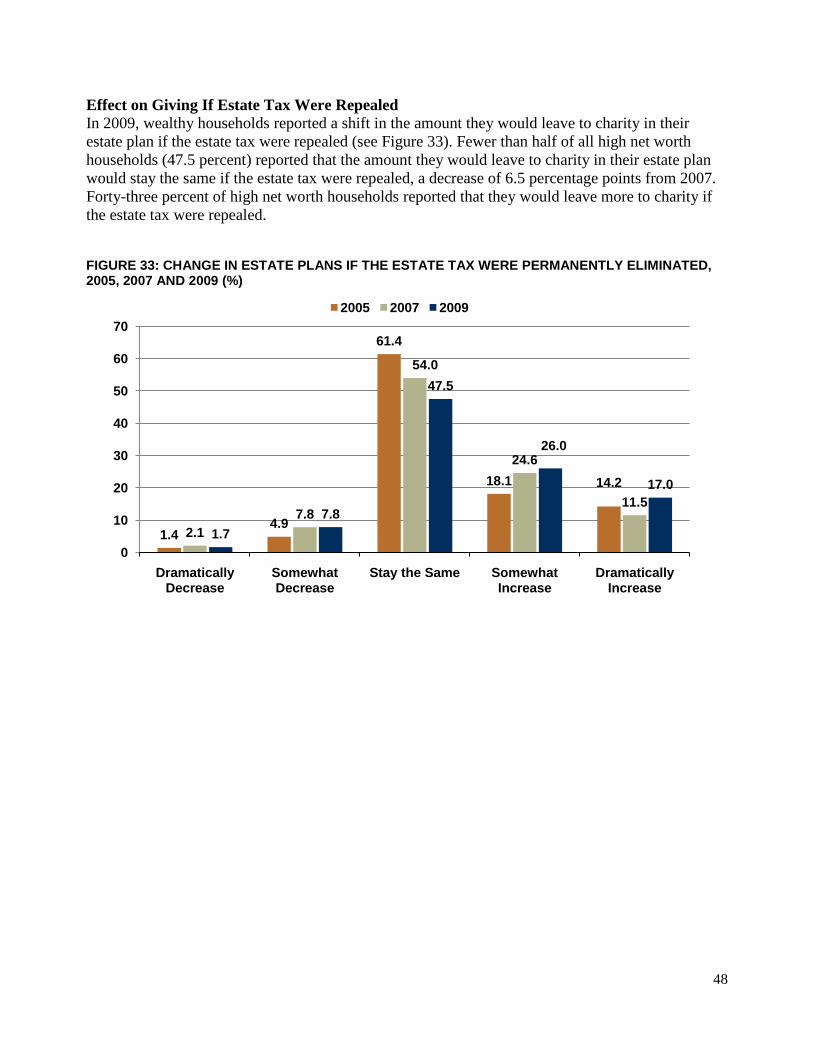
48
Effect on Giving If Estate Tax Were Repealed
In 2009, wealthy households reported a shift in the amount they would leave to charity in their
estate plan if the estate tax were repealed (see Figure 33). Fewer than half of all high net worth
households (47.5 percent) reported that the amount they would leave to charity in their estate plan
would stay the same if the estate tax were repealed, a decrease of 6.5 percentage points from 2007.
Forty-three percent of high net worth households reported that they would leave more to charity if
the estate tax were repealed. FIGURE 33: CHANGE IN ESTATE PLANS IF THE ESTATE TAX WERE PERMANENTLY ELIMINATED, 2005, 2007 AND 2009 (%)
1.44.9
61.4
18.1 14.2
2.1
7.8
54.0
24.6
11.5
1.7
7.8
47.5
26.0
17.0
0
10
20
30
40
50
60
70
Dramatically Decrease
Somewhat Decrease
Stay the Same Somewhat Increase
Dramatically Increase
2005 2007 2009
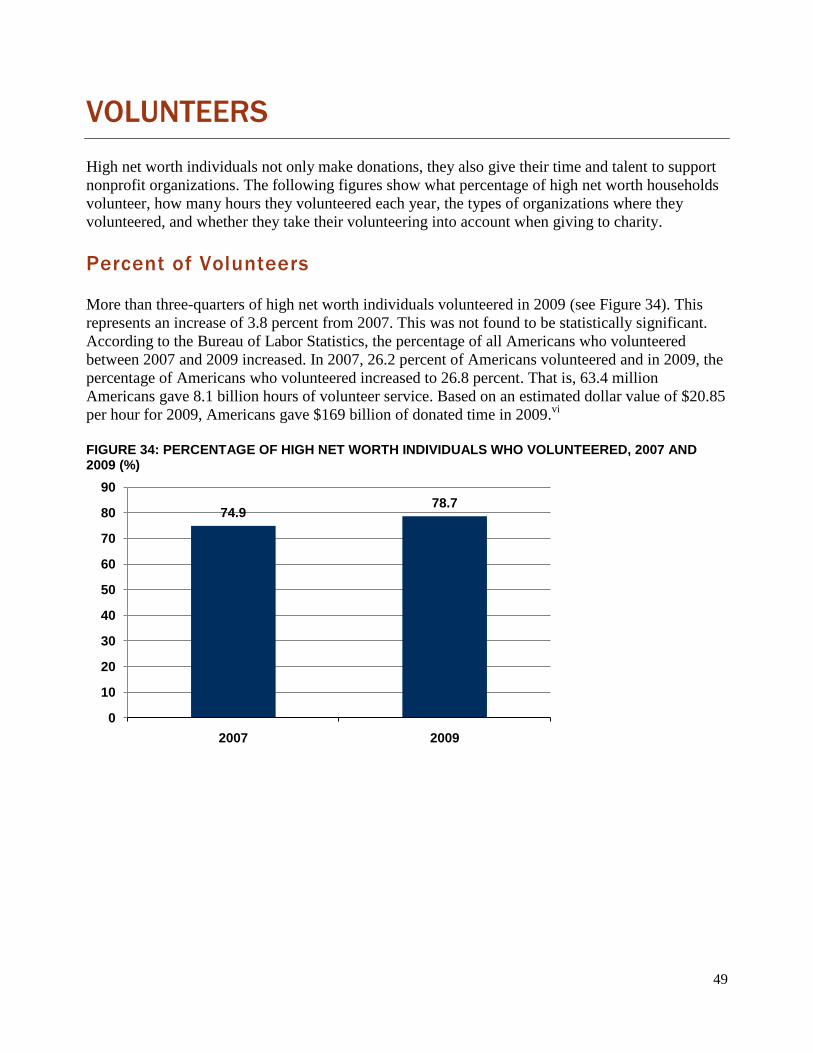
49
VOLUNTEERS
High net worth individuals not only make donations, they also give their time and talent to support
nonprofit organizations. The following figures show what percentage of high net worth households
volunteer, how many hours they volunteered each year, the types of organizations where they
volunteered, and whether they take their volunteering into account when giving to charity.
Percent of Volunteers
More than three-quarters of high net worth individuals volunteered in 2009 (see Figure 34). This
represents an increase of 3.8 percent from 2007. This was not found to be statistically significant.
According to the Bureau of Labor Statistics, the percentage of all Americans who volunteered
between 2007 and 2009 increased. In 2007, 26.2 percent of Americans volunteered and in 2009, the
percentage of Americans who volunteered increased to 26.8 percent. That is, 63.4 million
Americans gave 8.1 billion hours of volunteer service. Based on an estimated dollar value of $20.85
per hour for 2009, Americans gave $169 billion of donated time in 2009.vi
FIGURE 34: PERCENTAGE OF HIGH NET WORTH INDIVIDUALS WHO VOLUNTEERED, 2007 AND 2009 (%)
74.978.7
0
10
20
30
40
50
60
70
80
90
2007 2009
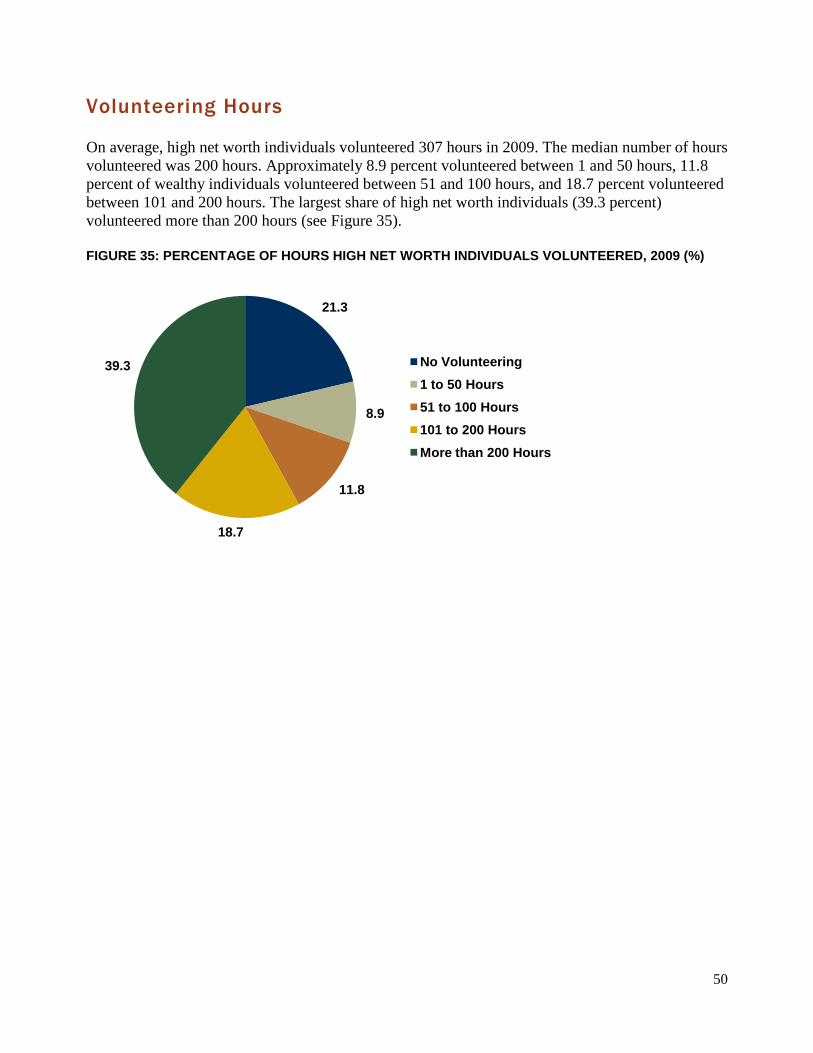
50
Volunteering Hours
On average, high net worth individuals volunteered 307 hours in 2009. The median number of hours
volunteered was 200 hours. Approximately 8.9 percent volunteered between 1 and 50 hours, 11.8
percent of wealthy individuals volunteered between 51 and 100 hours, and 18.7 percent volunteered
between 101 and 200 hours. The largest share of high net worth individuals (39.3 percent)
volunteered more than 200 hours (see Figure 35). FIGURE 35: PERCENTAGE OF HOURS HIGH NET WORTH INDIVIDUALS VOLUNTEERED, 2009 (%)
21.3
8.9
11.8
18.7
39.3 No Volunteering
1 to 50 Hours
51 to 100 Hours
101 to 200 Hours
More than 200 Hours
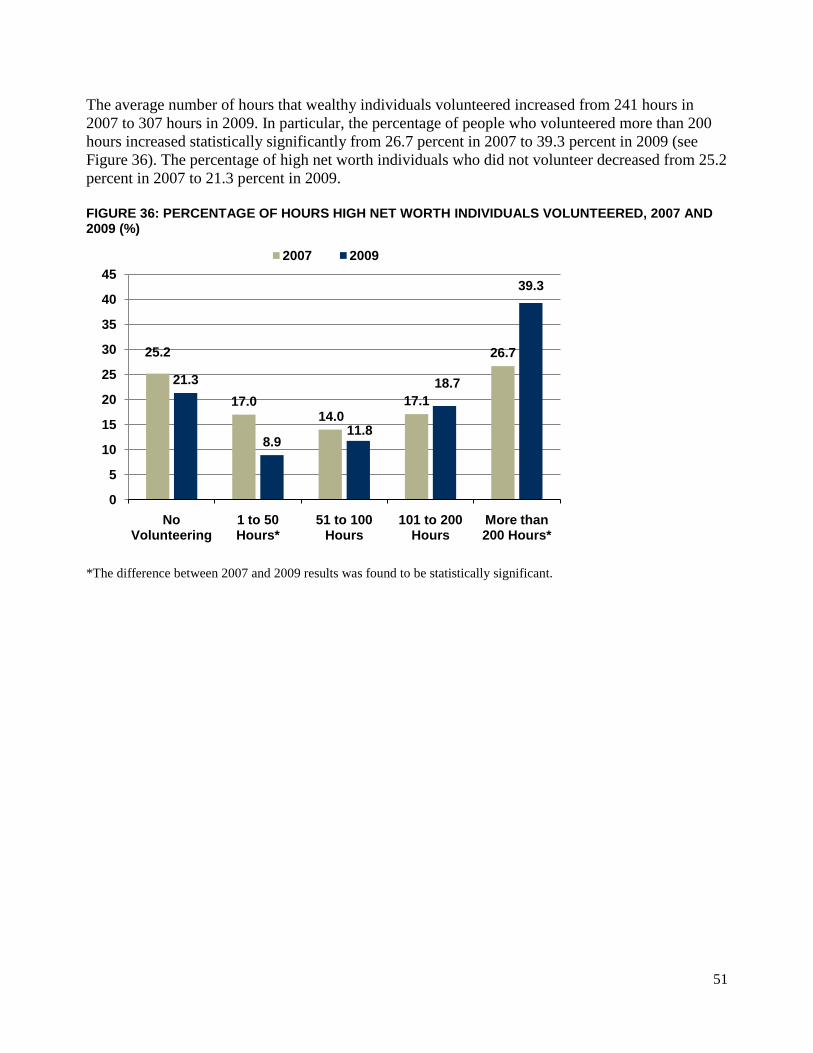
51
The average number of hours that wealthy individuals volunteered increased from 241 hours in
2007 to 307 hours in 2009. In particular, the percentage of people who volunteered more than 200
hours increased statistically significantly from 26.7 percent in 2007 to 39.3 percent in 2009 (see
Figure 36). The percentage of high net worth individuals who did not volunteer decreased from 25.2
percent in 2007 to 21.3 percent in 2009.
FIGURE 36: PERCENTAGE OF HOURS HIGH NET WORTH INDIVIDUALS VOLUNTEERED, 2007 AND 2009 (%)
*The difference between 2007 and 2009 results was found to be statistically significant.
25.2
17.014.0
17.1
26.7
21.3
8.911.8
18.7
39.3
0
5
10
15
20
25
30
35
40
45
No Volunteering
1 to 50 Hours*
51 to 100 Hours
101 to 200 Hours
More than 200 Hours*
2007 2009
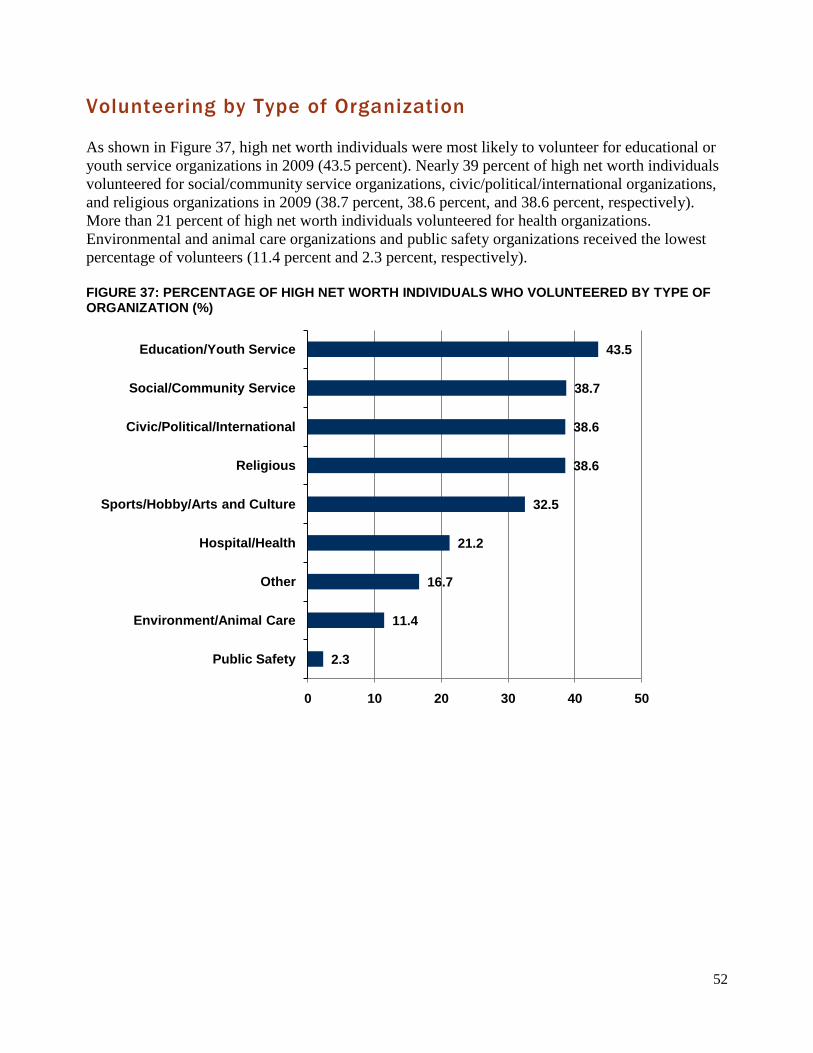
52
Volunteering by Type of Organization
As shown in Figure 37, high net worth individuals were most likely to volunteer for educational or
youth service organizations in 2009 (43.5 percent). Nearly 39 percent of high net worth individuals
volunteered for social/community service organizations, civic/political/international organizations,
and religious organizations in 2009 (38.7 percent, 38.6 percent, and 38.6 percent, respectively).
More than 21 percent of high net worth individuals volunteered for health organizations.
Environmental and animal care organizations and public safety organizations received the lowest
percentage of volunteers (11.4 percent and 2.3 percent, respectively).
FIGURE 37: PERCENTAGE OF HIGH NET WORTH INDIVIDUALS WHO VOLUNTEERED BY TYPE OF ORGANIZATION (%)
2.3
11.4
16.7
21.2
32.5
38.6
38.6
38.7
43.5
0 10 20 30 40 50
Public Safety
Environment/Animal Care
Other
Hospital/Health
Sports/Hobby/Arts and Culture
Religious
Civic/Political/International
Social/Community Service
Education/Youth Service
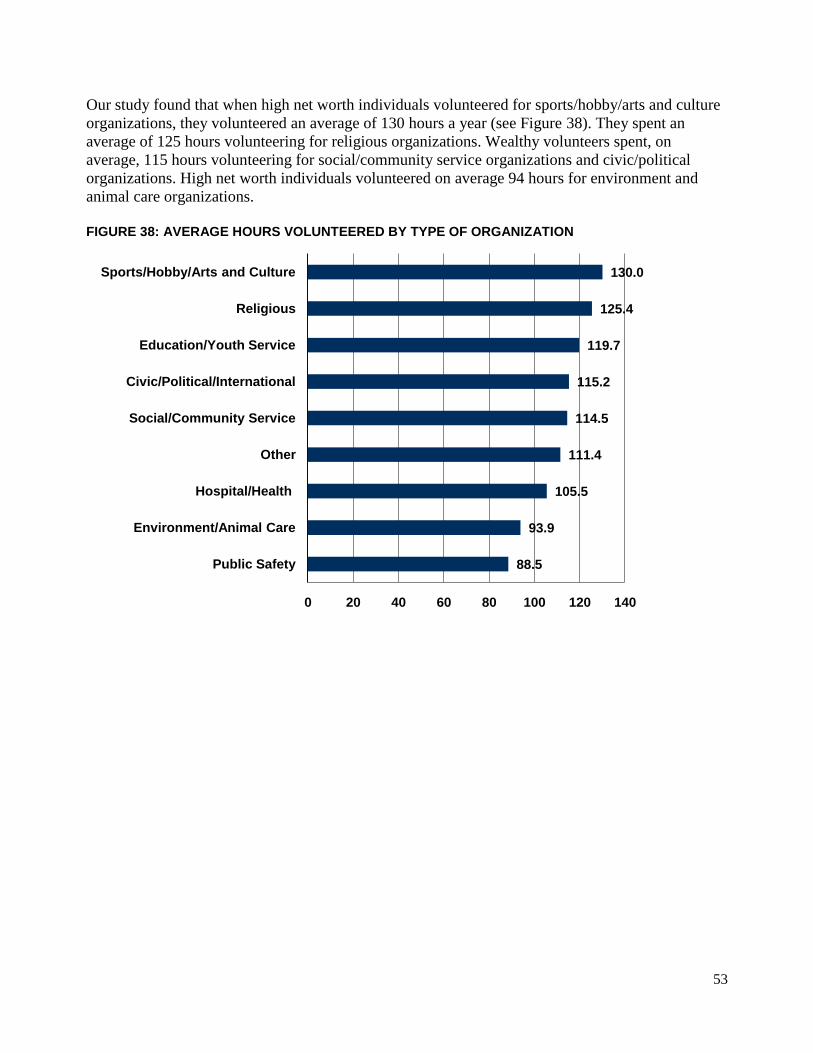
53
Our study found that when high net worth individuals volunteered for sports/hobby/arts and culture
organizations, they volunteered an average of 130 hours a year (see Figure 38). They spent an
average of 125 hours volunteering for religious organizations. Wealthy volunteers spent, on
average, 115 hours volunteering for social/community service organizations and civic/political
organizations. High net worth individuals volunteered on average 94 hours for environment and
animal care organizations.
FIGURE 38: AVERAGE HOURS VOLUNTEERED BY TYPE OF ORGANIZATION
88.5
93.9
105.5
111.4
114.5
115.2
119.7
125.4
130.0
0 20 40 60 80 100 120 140
Public Safety
Environment/Animal Care
Hospital/Health
Other
Social/Community Service
Civic/Political/International
Education/Youth Service
Religious
Sports/Hobby/Arts and Culture
54
Giving and Volunteering
Higher levels of volunteering by high net-worth households are associated with higher total giving
levels. High net worth individuals who volunteered more than 200 hours a year gave the most on
average to charity ($75,662). In 2009, high net worth individuals who volunteered more than 200
hours gave on average $75,662, whereas in 2007 these high frequency volunteers gave on average
$136,906 (see Figure 39).
On average, non-volunteers gave more than low-frequency volunteers. High net worth individuals
who did not volunteer in 2009 gave more on average ($46,414) than those who volunteered between
1 to 50 hours ($30,822) and 51 to 100 hours ($31,890). However, those who volunteered between
101 to 200 hours gave more on average ($48,860) than non-volunteers ($46,414).
FIGURE 39: AVERAGE GIVING AMOUNTS BY TOTAL HOURS VOLUNTEERED, 2005, 2007 AND 2009 ($)
49,107
43,965
103,730
73,853
128,912
36,346
46,891 49,506
128,579
136,906
46,414
30,822 31,890
48,860
75,662
$0
$20,000
$40,000
$60,000
$80,000
$100,000
$120,000
$140,000
$160,000
No volunteering
1 to 50 hours
51 to 100 hours
101 to 200 hours
More than 200 hours
2005 2007 2009
55
As Figure 40 shows, high net worth individuals who volunteered in 2009 gave more on average to
organizations where they served on the board or had another oversight role ($84,551). They also
gave more on average to organizations where they volunteered and where they believed their gift
would have the largest impact ($69,929), as well as where they volunteered the largest number of
hours ($66,525). High net worth individuals who did not take their volunteer role into account when
determining where to give donated less on average ($33,373).
FIGURE 40: AVERAGE TOTAL GIVING BY HIGH NET WORTH INDIVIDUALS WHO AGREE WITH THE FOLLOWING STATEMENTS WHEN DETERMINING WHERE TO GIVE MORE TO CHARITY ($)
33,373
57,791
62,542
66,525
69,929
84,551
$0 $20,000 $40,000 $60,000 $80,000
Volunteer Role Not Taken into Account
Serve on a Non-Board Role
Gift Has Largest Impact Regardless of Volunteer Activity
Volunteer the Most Hours
Gift Has Largest Impact and Volunteer at Org.
Serve on Board or Have Oversight Role
56
NONPROFITS
High net worth households are important donors to all types of nonprofit organizations. In this
section of the report, we discuss the intended objectives for these donors‟ largest gift, what high net
worth households prefer and expect from the nonprofits they support, and finally, what caused them
to stop giving to an organization.
Largest Gift Gifts of all sizes are important and meet nonprofit organization‟s mission and operational goals.
High net worth households make large gifts to charity every year that can transform a nonprofit‟s
ability to change lives and communities, and they often transform the donor‟s life. This section
reports on the most significant or largest gifts high net worth households made in 2009. First, we
examine the objectives of the gift and then look at the terms of the largest gift.
Objectives for the Largest Gifts Made in 2009
More than half of high net worth households, 55.5 percent, did not designate their largest gift for a
particular purpose in 2009, which means that they gave to the general operations of nonprofit
organizations (see Figure 41). Over one-third of high net worth households (36.2 percent) gave their
largest gift to fund a particular program, and 23.5 percent gave to support the growth of the
organization. Households were least likely to make their largest gifts in 2009 to startup funding or
to support the collaboration of nonprofit organizations (5.6 percent and 1.9 percent, respectively). In
2009, only 11.0 percent of households gave their largest gift to support the long-term investment of
an organization, while 37.2 percent of households gave for that purpose in 2007.
FIGURE 41: OBJECTIVES OF LARGEST GIFTS MADE, 2007 AND 2009 (%)
^This question was not asked in 2007
*The difference between 2007 and 2009 results was found to be statistically significant.
1.9
4.1
5.6
11.0
11.9
14.2
23.5
36.2
55.5
10.1
37.2
23.6
23.4
40.4
31.6
56.7
0 10 20 30 40 50 60 70
Support Collaboration of Nonprofit Orgs.^
Other (e.g., receive benefits)^
Startup Funding*
Long-term Investment in Org.*
Memorial Gift*
Capital Gift*
Support Growth of Org.*
Fund Particular Program
General Operating Support
2007 2009
57
One Year vs. Multi-Year
Nearly three-quarters of households (73.3 percent) reported that their largest gift was a one-time gift
that was paid out in one year. More than a quarter reported their gift was a multi-year gift (see
Figure 42).
FIGURE 42: LENGTH OF TERM FOR LARGEST GIFT, 2007 AND 2009 (%)
69.2
30.8
73.3
26.7
0
10
20
30
40
50
60
70
80
One-time Gift Multi-year Gift
2007 2009
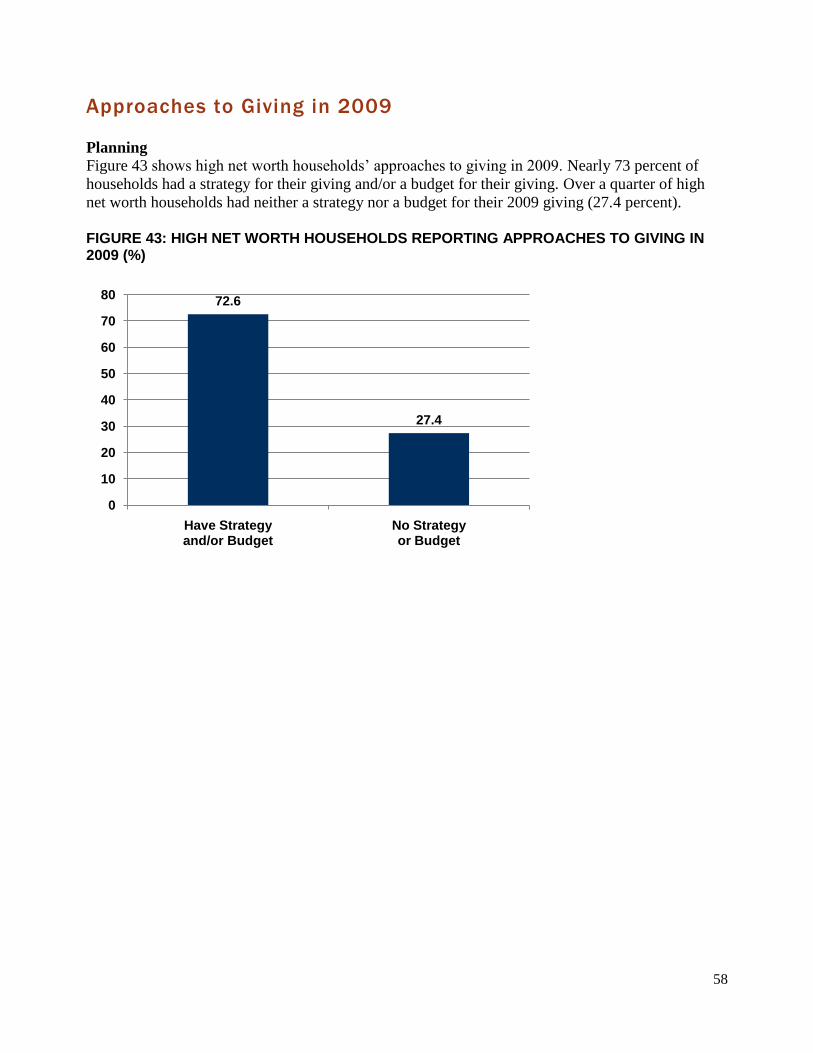
58
Approaches to Giving in 2009
Planning
Figure 43 shows high net worth households‟ approaches to giving in 2009. Nearly 73 percent of
households had a strategy for their giving and/or a budget for their giving. Over a quarter of high
net worth households had neither a strategy nor a budget for their 2009 giving (27.4 percent).
FIGURE 43: HIGH NET WORTH HOUSEHOLDS REPORTING APPROACHES TO GIVING IN 2009 (%)
72.6
27.4
0
10
20
30
40
50
60
70
80
Have Strategy and/or Budget
No Strategy or Budget
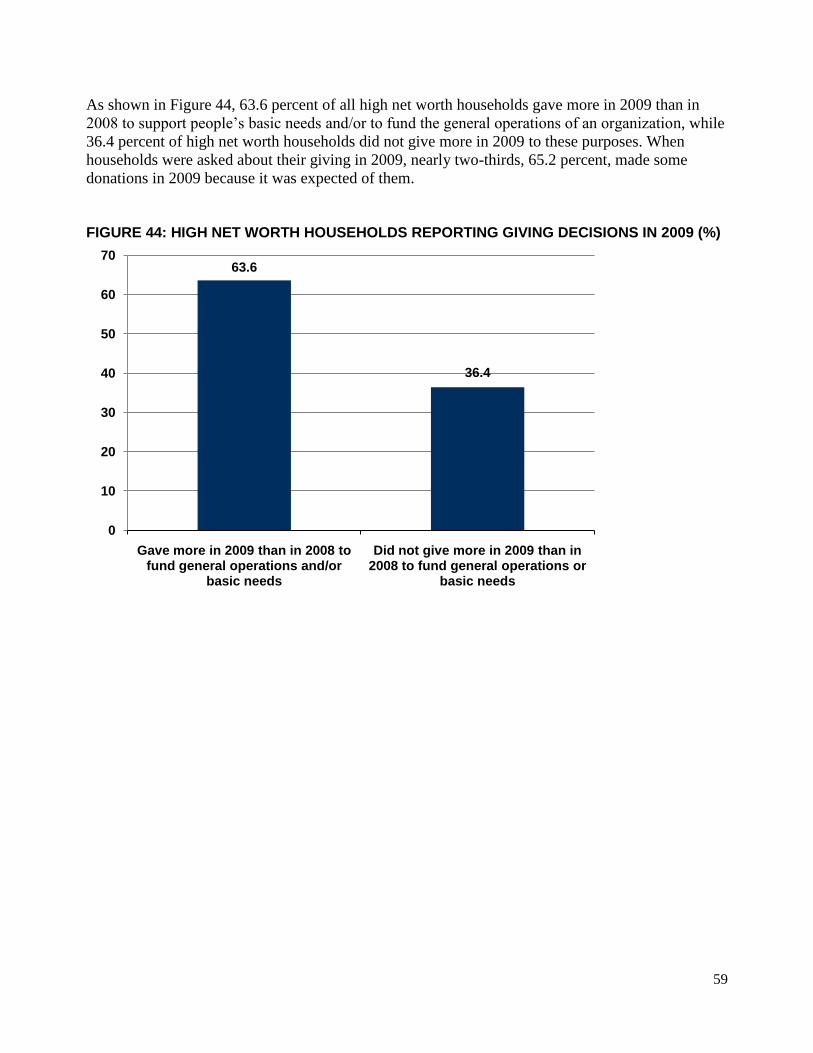
59
As shown in Figure 44, 63.6 percent of all high net worth households gave more in 2009 than in
2008 to support people‟s basic needs and/or to fund the general operations of an organization, while
36.4 percent of high net worth households did not give more in 2009 to these purposes. When
households were asked about their giving in 2009, nearly two-thirds, 65.2 percent, made some
donations in 2009 because it was expected of them.
FIGURE 44: HIGH NET WORTH HOUSEHOLDS REPORTING GIVING DECISIONS IN 2009 (%)
63.6
36.4
0
10
20
30
40
50
60
70
Gave more in 2009 than in 2008 to fund general operations and/or
basic needs
Did not give more in 2009 than in 2008 to fund general operations or
basic needs
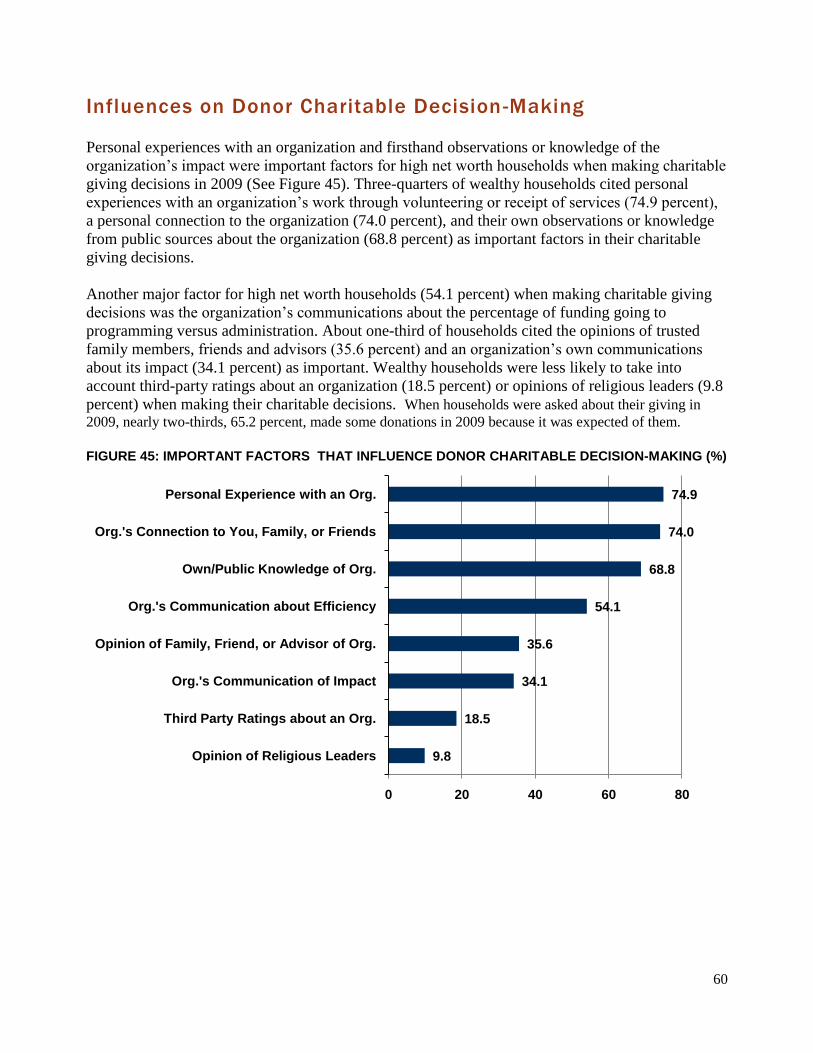
60
Influences on Donor Charitable Decision-Making
Personal experiences with an organization and firsthand observations or knowledge of the
organization‟s impact were important factors for high net worth households when making charitable
giving decisions in 2009 (See Figure 45). Three-quarters of wealthy households cited personal
experiences with an organization‟s work through volunteering or receipt of services (74.9 percent),
a personal connection to the organization (74.0 percent), and their own observations or knowledge
from public sources about the organization (68.8 percent) as important factors in their charitable
giving decisions.
Another major factor for high net worth households (54.1 percent) when making charitable giving
decisions was the organization‟s communications about the percentage of funding going to
programming versus administration. About one-third of households cited the opinions of trusted
family members, friends and advisors (35.6 percent) and an organization‟s own communications
about its impact (34.1 percent) as important. Wealthy households were less likely to take into
account third-party ratings about an organization (18.5 percent) or opinions of religious leaders (9.8
percent) when making their charitable decisions. When households were asked about their giving in
2009, nearly two-thirds, 65.2 percent, made some donations in 2009 because it was expected of them.
FIGURE 45: IMPORTANT FACTORS THAT INFLUENCE DONOR CHARITABLE DECISION-MAKING (%)
9.8
18.5
34.1
35.6
54.1
68.8
74.0
74.9
0 20 40 60 80
Opinion of Religious Leaders
Third Party Ratings about an Org.
Org.'s Communication of Impact
Opinion of Family, Friend, or Advisor of Org.
Org.'s Communication about Efficiency
Own/Public Knowledge of Org.
Org.'s Connection to You, Family, or Friends
Personal Experience with an Org.
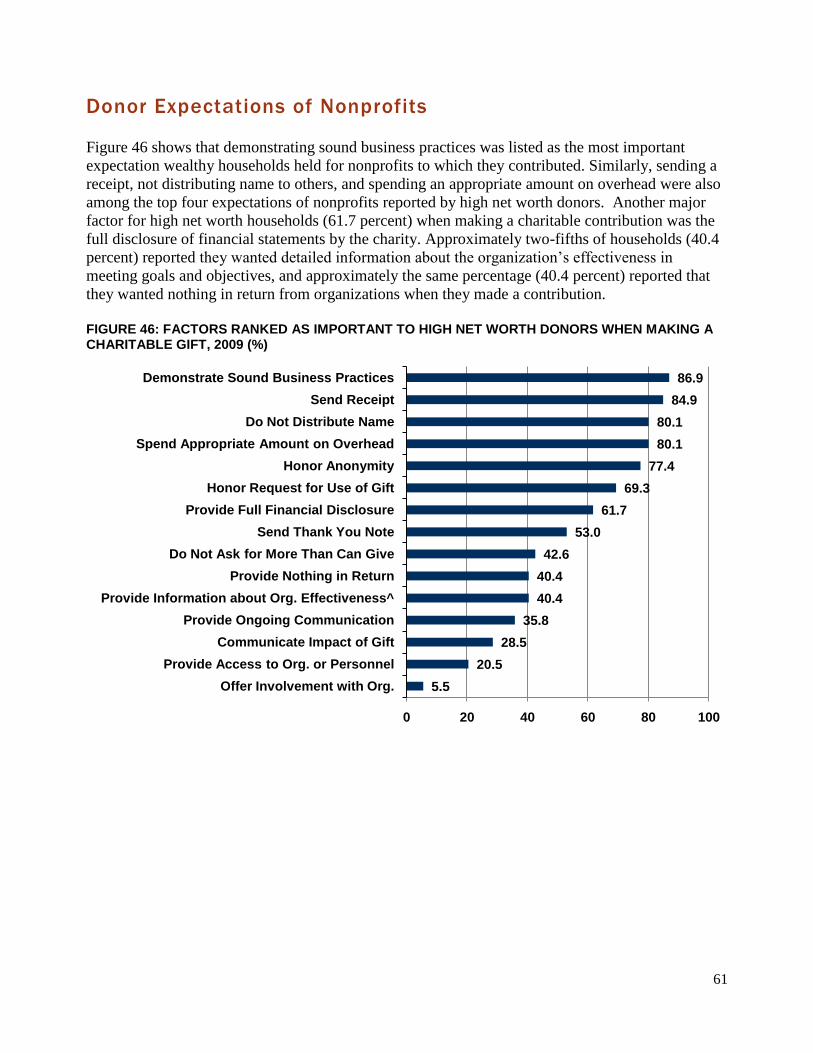
61
Donor Expectations of Nonprofits
Figure 46 shows that demonstrating sound business practices was listed as the most important
expectation wealthy households held for nonprofits to which they contributed. Similarly, sending a
receipt, not distributing name to others, and spending an appropriate amount on overhead were also
among the top four expectations of nonprofits reported by high net worth donors. Another major
factor for high net worth households (61.7 percent) when making a charitable contribution was the
full disclosure of financial statements by the charity. Approximately two-fifths of households (40.4
percent) reported they wanted detailed information about the organization‟s effectiveness in
meeting goals and objectives, and approximately the same percentage (40.4 percent) reported that
they wanted nothing in return from organizations when they made a contribution.
FIGURE 46: FACTORS RANKED AS IMPORTANT TO HIGH NET WORTH DONORS WHEN MAKING A CHARITABLE GIFT, 2009 (%)
5.5
20.5
28.5
35.8
40.4
40.4
42.6
53.0
61.7
69.3
77.4
80.1
80.1
84.9
86.9
0 20 40 60 80 100
Offer Involvement with Org.
Provide Access to Org. or Personnel
Communicate Impact of Gift
Provide Ongoing Communication
Provide Information about Org. Effectiveness^
Provide Nothing in Return
Do Not Ask for More Than Can Give
Send Thank You Note
Provide Full Financial Disclosure
Honor Request for Use of Gift
Honor Anonymity
Spend Appropriate Amount on Overhead
Do Not Distribute Name
Send Receipt
Demonstrate Sound Business Practices
62
In 2007 and 2009, high net worth households ranked demonstrating sound business and operational
practices and sending a receipt as important expectations of nonprofits when making a contribution
(see Figure 47). FIGURE 47: FACTORS RANKED AS IMPORTANT TO HIGH NET WORTH DONORS WHEN MAKING A CHARITABLE GIFT, 2007 AND 2009 (%)
^Question was not asked in 2007.
5.5
20.5
28.5
35.8
40.4
40.4
42.6
53.0
61.7
69.3
77.4
80.1
80.1
84.9
86.9
16.0
64.6
42.0
54.9
33.1
42.6
57.0
77.7
65.2
62.7
88.3
82.7
83.7
93.0
0 20 40 60 80 100
Offer Involvement with Org.
Provide Access to Org. or Personnel
Communicate Impact of Gift
Provide Ongoing Communication
Provide Information about Org. Effectiveness^
Provide Nothing in Return
Do Not Ask for More Than Can Give
Send Thank You Note
Provide Full Financial Disclosure
Honor Request for Use of Gift
Honor Anonymity
Spend Appropriate Amount on Overhead
Do Not Distribute Name
Send Receipt
Demonstrate Sound Business Practices
2007 2009
63
Why Donors Stop Giving
Each year nonprofits work to attract new donors to their organization and at the same time to retain
the donors they have. In this section of the report, we look at how many high net worth households
stopped giving to organizations in 2009, along with their reasons for doing so.
How Many Stop Giving
Among those households who stopped giving to at least one organization in 2009, about 35 percent
of high net worth households stopped supporting one organization they previously supported. Just
over 40 percent of high net worth households stopped supporting two or three organizations they
previously supported (see Figure 48). About 9 percent of high net worth households stopped giving
to four organizations and approximately 15 percent stopped giving to five or more organizations in
2009.
FIGURE 48: NUMBER OF ORGANIZATIONS HIGH NET WORTH HOUSEHOLDS STOPPED SUPPORTING IN 2009 THAT THEY PREVIOUSLY SUPPORTED, 2007 AND 2009 (%)
Note: When comparing 2007 to 2009, the results were not statistically significant across any categories.
38.0
26.0
16.7
6.3
13.0
35.4
26.6
13.9
8.9
15.2
0
10
20
30
40
50
One Two Three Four Five or more
2007 2009
64
While high net worth households discontinued their support of organizations in 2009, they still gave
on average to 6 or 7 organizations (see Figure 49). Households that stopped giving to one
organization gave on average to 6 organizations. Those households that stopped giving to five or
more organizations still supported, on average, 7 organizations in 2009. FIGURE 49: NUMBER OF ORGANIZATIONS HIGH NET WORTH HOUSEHOLDS STOPPED SUPPORTING IN 2009 THAT THEY PREVIOUSLY SUPPORTED AND AVERAGE NUMBER OF CAUSES SUPPORTED, 2007 AND 2009
6.3 6.26.6
5.96.66.3
7.0 7.1 7.2 6.9
0
2
4
6
8
10
One Two Three Four Five or moreAv
era
ge
Nu
mb
er
of
Cau
ses S
up
po
rted
Number of Organizations Stopped Giving To
2007 2009
65
Reasons for Ending Support of Nonprofits
The top reasons high net worth households stopped supporting the organization(s) they previously
supported were “too frequent solicitation/asked for an inappropriate amount,” “decided to support
other causes,” and “household circumstances changed” (58.9 percent, 34.2 percent, and 29.4
percent, respectively). Less than 12 percent of wealthy households reported that they stopped giving
because they are “no longer involved with organization,” the “program/purpose was completed,” or
because of “inaccurate recordkeeping of information” (see Figure 50).
FIGURE 50: REASON(S) WHY A HIGH NET WORTH HOUSEHOLD STOPPED SUPPORTING AN ORGANIZATION THEY PREVIOUSLY SUPPORTED (%)
10.4
10.4
11.7
29.1
29.4
34.2
58.9
0 20 40 60 80
Inaccurate Recordkeeping of Information
Program/Purpose Completed
No Longer Involved with Org.
Org. Changed Leadership or Activities
Household Circumstances Changed
Decided to Support Other Causes
Too Frequent Solicitation/Asked for Inappropriate Amount
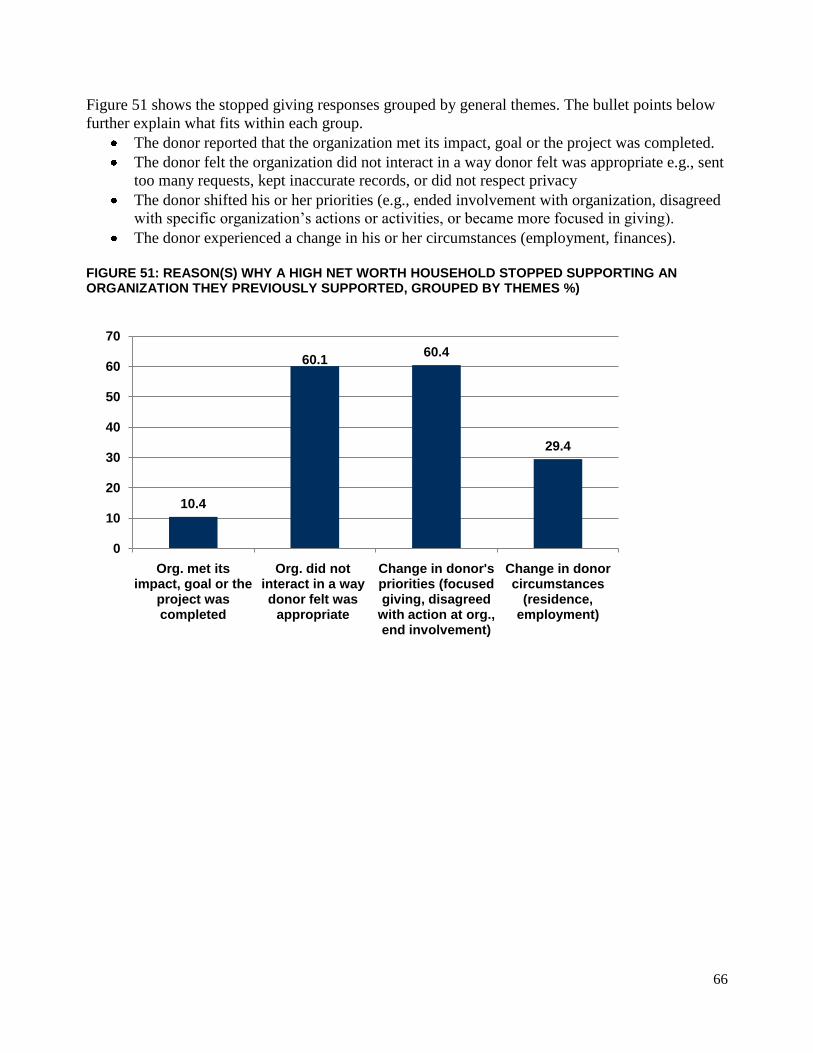
66
Figure 51 shows the stopped giving responses grouped by general themes. The bullet points below
further explain what fits within each group.
The donor reported that the organization met its impact, goal or the project was completed.
The donor felt the organization did not interact in a way donor felt was appropriate e.g., sent
too many requests, kept inaccurate records, or did not respect privacy
The donor shifted his or her priorities (e.g., ended involvement with organization, disagreed
with specific organization‟s actions or activities, or became more focused in giving).
The donor experienced a change in his or her circumstances (employment, finances).
FIGURE 51: REASON(S) WHY A HIGH NET WORTH HOUSEHOLD STOPPED SUPPORTING AN ORGANIZATION THEY PREVIOUSLY SUPPORTED, GROUPED BY THEMES %)
10.4
60.160.4
29.4
0
10
20
30
40
50
60
70
Org. met its impact, goal or the
project was completed
Org. did not interact in a way donor felt was
appropriate
Change in donor's priorities (focused giving, disagreed
with action at org., end involvement)
Change in donor circumstances
(residence, employment)
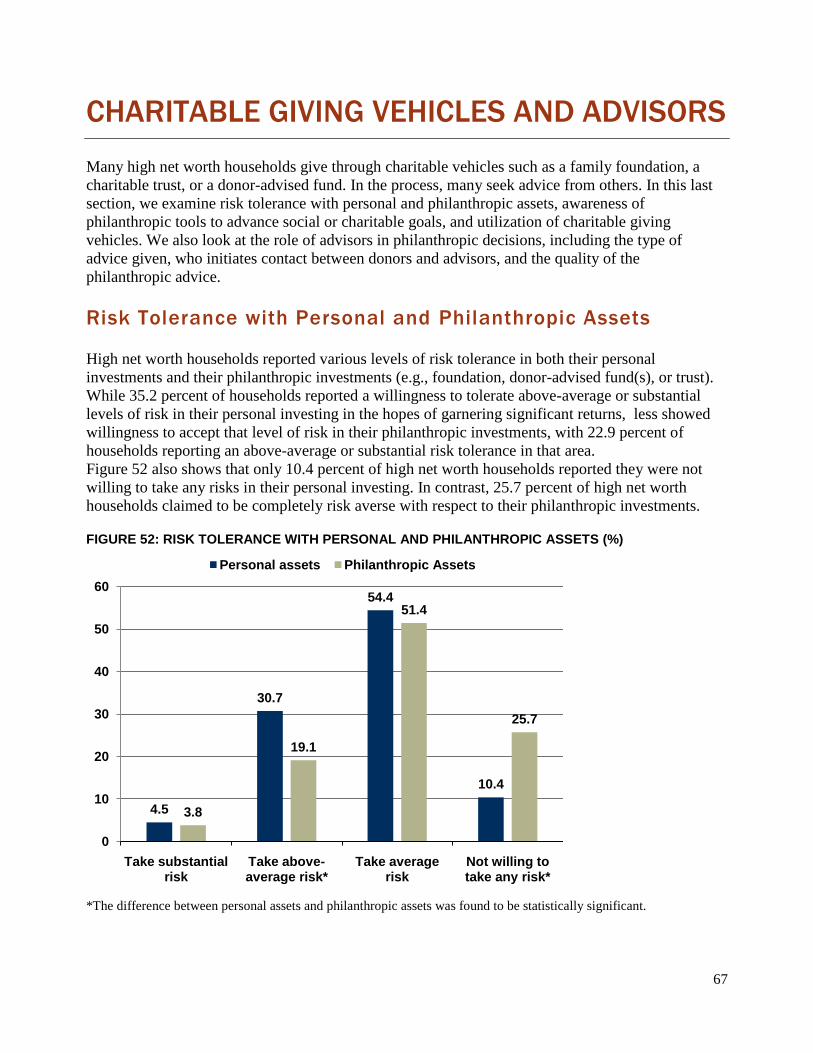
67
CHARITABLE GIVING VEHICLES AND ADVISORS
Many high net worth households give through charitable vehicles such as a family foundation, a
charitable trust, or a donor-advised fund. In the process, many seek advice from others. In this last
section, we examine risk tolerance with personal and philanthropic assets, awareness of
philanthropic tools to advance social or charitable goals, and utilization of charitable giving
vehicles. We also look at the role of advisors in philanthropic decisions, including the type of
advice given, who initiates contact between donors and advisors, and the quality of the
philanthropic advice.
Risk Tolerance with Personal and Philanthropic Assets
High net worth households reported various levels of risk tolerance in both their personal
investments and their philanthropic investments (e.g., foundation, donor-advised fund(s), or trust).
While 35.2 percent of households reported a willingness to tolerate above-average or substantial
levels of risk in their personal investing in the hopes of garnering significant returns, less showed
willingness to accept that level of risk in their philanthropic investments, with 22.9 percent of
households reporting an above-average or substantial risk tolerance in that area.
Figure 52 also shows that only 10.4 percent of high net worth households reported they were not
willing to take any risks in their personal investing. In contrast, 25.7 percent of high net worth
households claimed to be completely risk averse with respect to their philanthropic investments. FIGURE 52: RISK TOLERANCE WITH PERSONAL AND PHILANTHROPIC ASSETS (%)
*The difference between personal assets and philanthropic assets was found to be statistically significant.
4.5
30.7
54.4
10.4
3.8
19.1
51.4
25.7
0
10
20
30
40
50
60
Take substantial risk
Take above-average risk*
Take average risk
Not willing to take any risk*
Personal assets Philanthropic Assets
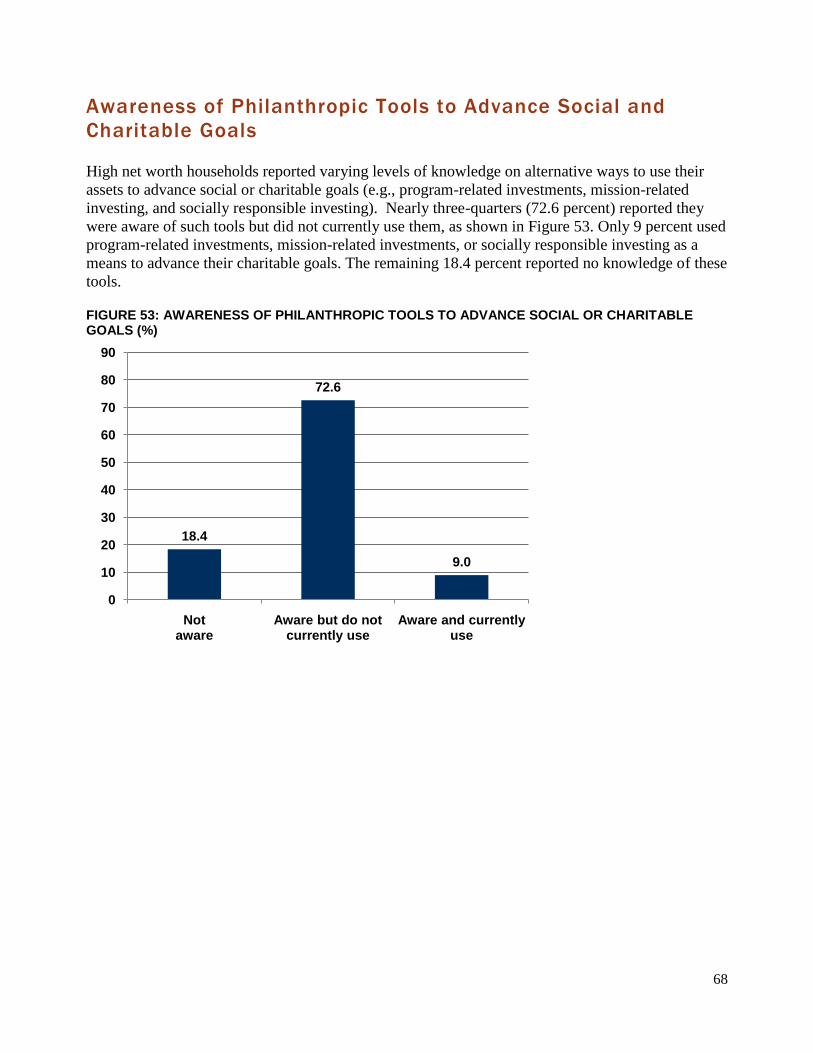
68
Awareness of Philanthropic Tools to Advance Social and
Charitable Goals
High net worth households reported varying levels of knowledge on alternative ways to use their
assets to advance social or charitable goals (e.g., program-related investments, mission-related
investing, and socially responsible investing). Nearly three-quarters (72.6 percent) reported they
were aware of such tools but did not currently use them, as shown in Figure 53. Only 9 percent used
program-related investments, mission-related investments, or socially responsible investing as a
means to advance their charitable goals. The remaining 18.4 percent reported no knowledge of these
tools. FIGURE 53: AWARENESS OF PHILANTHROPIC TOOLS TO ADVANCE SOCIAL OR CHARITABLE GOALS (%)
18.4
72.6
9.0
0
10
20
30
40
50
60
70
80
90
Not aware
Aware but do not currently use
Aware and currently use
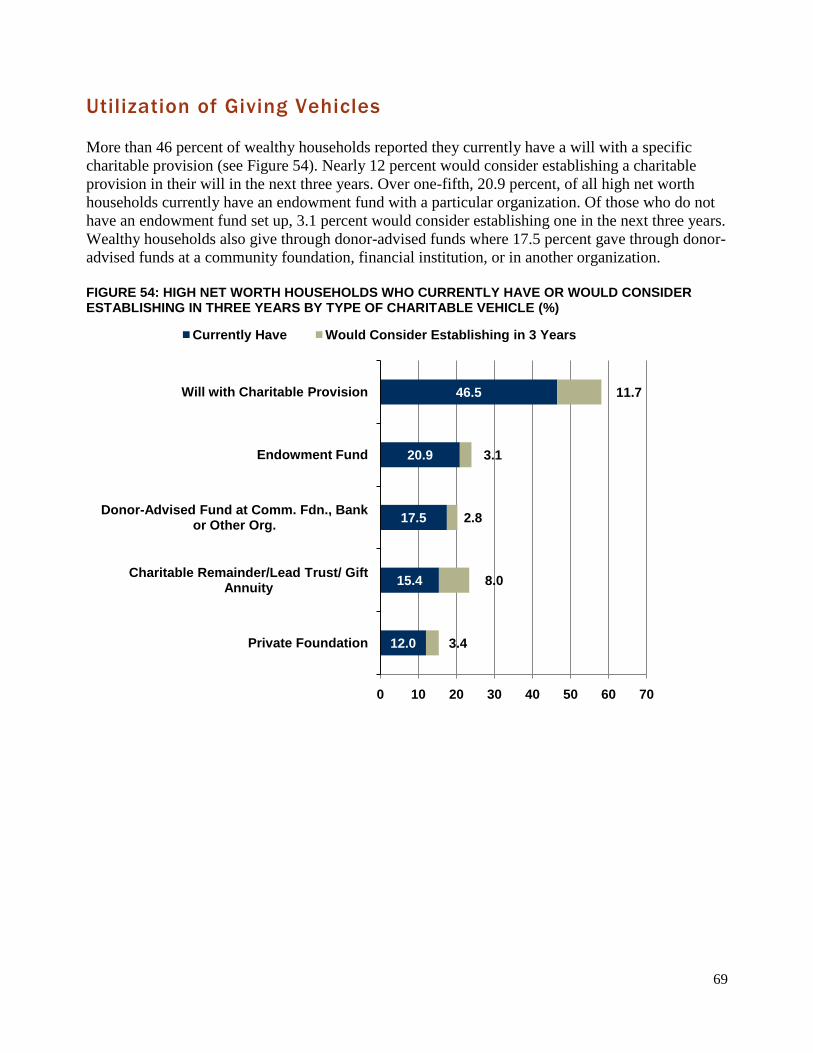
69
Utilization of Giving Vehicles
More than 46 percent of wealthy households reported they currently have a will with a specific
charitable provision (see Figure 54). Nearly 12 percent would consider establishing a charitable
provision in their will in the next three years. Over one-fifth, 20.9 percent, of all high net worth
households currently have an endowment fund with a particular organization. Of those who do not
have an endowment fund set up, 3.1 percent would consider establishing one in the next three years.
Wealthy households also give through donor-advised funds where 17.5 percent gave through donor-
advised funds at a community foundation, financial institution, or in another organization.
FIGURE 54: HIGH NET WORTH HOUSEHOLDS WHO CURRENTLY HAVE OR WOULD CONSIDER ESTABLISHING IN THREE YEARS BY TYPE OF CHARITABLE VEHICLE (%)
12.0
15.4
17.5
20.9
46.5
3.4
8.0
2.8
3.1
11.7
0 10 20 30 40 50 60 70
Private Foundation
Charitable Remainder/Lead Trust/ Gift Annuity
Donor-Advised Fund at Comm. Fdn., Bank or Other Org.
Endowment Fund
Will with Charitable Provision
Currently Have Would Consider Establishing in 3 Years
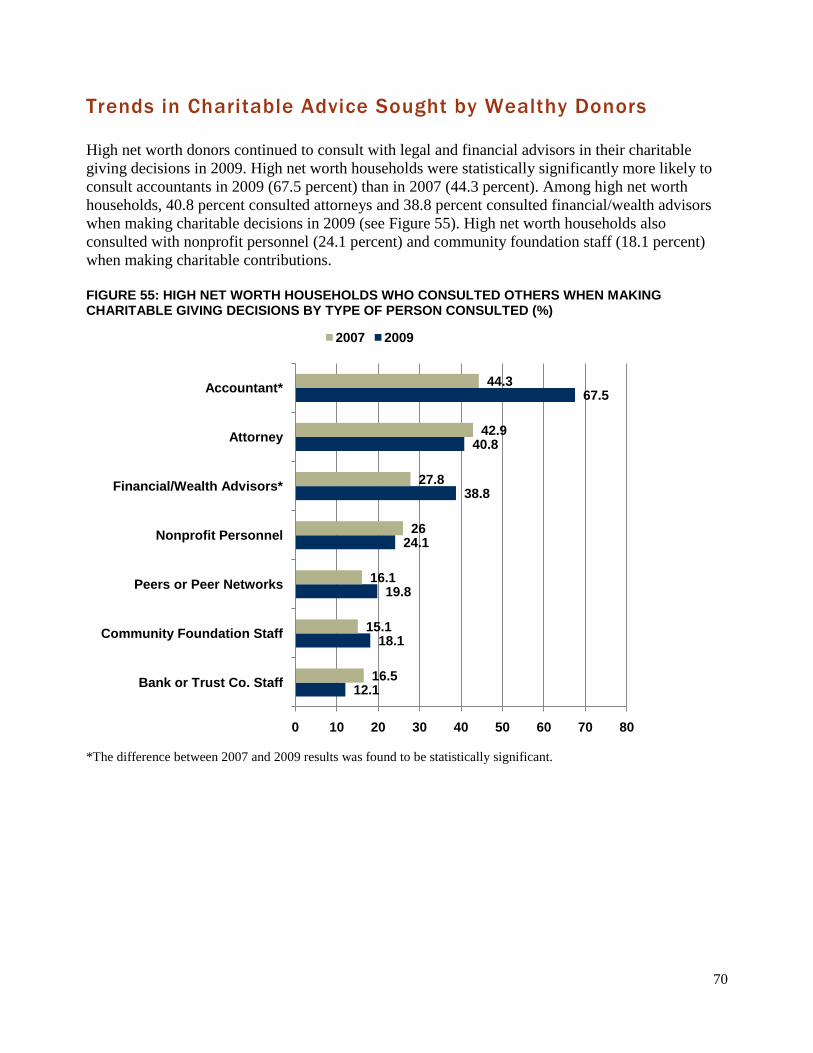
70
Trends in Charitable Advice Sought by Wealthy Donors
High net worth donors continued to consult with legal and financial advisors in their charitable
giving decisions in 2009. High net worth households were statistically significantly more likely to
consult accountants in 2009 (67.5 percent) than in 2007 (44.3 percent). Among high net worth
households, 40.8 percent consulted attorneys and 38.8 percent consulted financial/wealth advisors
when making charitable decisions in 2009 (see Figure 55). High net worth households also
consulted with nonprofit personnel (24.1 percent) and community foundation staff (18.1 percent)
when making charitable contributions.
FIGURE 55: HIGH NET WORTH HOUSEHOLDS WHO CONSULTED OTHERS WHEN MAKING CHARITABLE GIVING DECISIONS BY TYPE OF PERSON CONSULTED (%)
*The difference between 2007 and 2009 results was found to be statistically significant.
12.1
18.1
19.8
24.1
38.8
40.8
67.5
16.5
15.1
16.1
26
27.8
42.9
44.3
0 10 20 30 40 50 60 70 80
Bank or Trust Co. Staff
Community Foundation Staff
Peers or Peer Networks
Nonprofit Personnel
Financial/Wealth Advisors*
Attorney
Accountant*
2007 2009
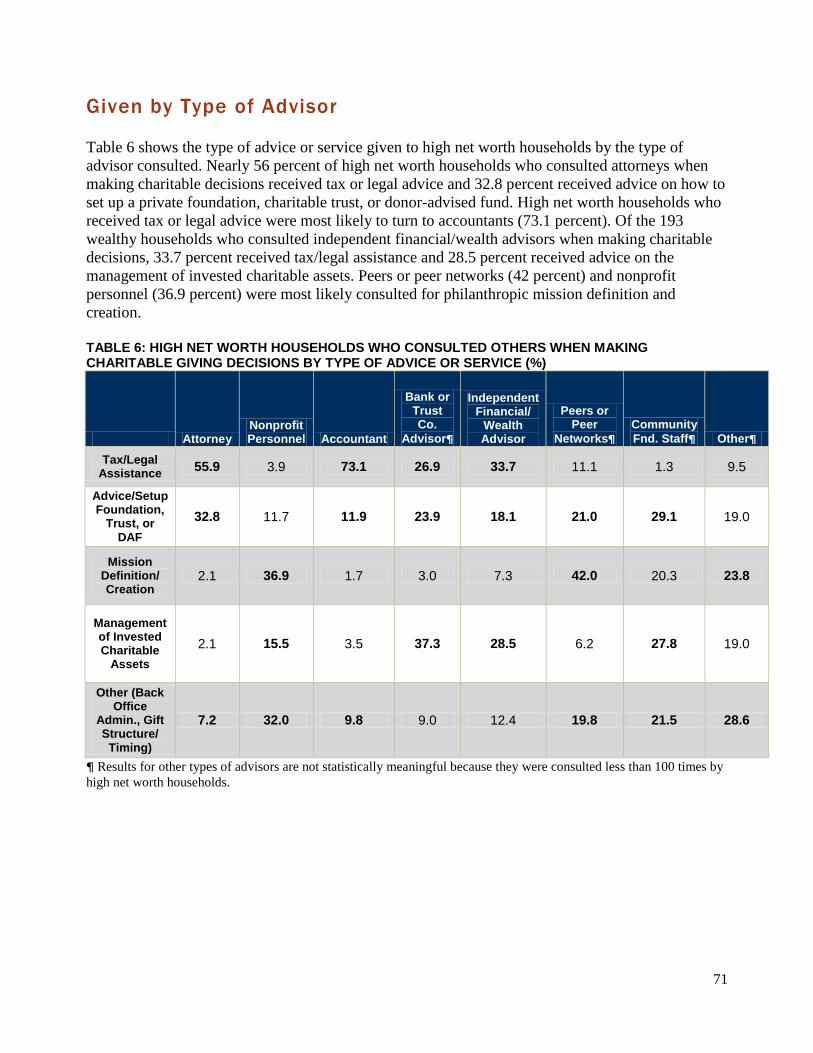
71
Given by Type of Advisor
Table 6 shows the type of advice or service given to high net worth households by the type of
advisor consulted. Nearly 56 percent of high net worth households who consulted attorneys when
making charitable decisions received tax or legal advice and 32.8 percent received advice on how to
set up a private foundation, charitable trust, or donor-advised fund. High net worth households who
received tax or legal advice were most likely to turn to accountants (73.1 percent). Of the 193
wealthy households who consulted independent financial/wealth advisors when making charitable
decisions, 33.7 percent received tax/legal assistance and 28.5 percent received advice on the
management of invested charitable assets. Peers or peer networks (42 percent) and nonprofit
personnel (36.9 percent) were most likely consulted for philanthropic mission definition and
creation.
TABLE 6: HIGH NET WORTH HOUSEHOLDS WHO CONSULTED OTHERS WHEN MAKING CHARITABLE GIVING DECISIONS BY TYPE OF ADVICE OR SERVICE (%)
Attorney Nonprofit Personnel Accountant
Bank or Trust Co.
Advisor
Independent Financial/
Wealth Advisor
Peers or Peer
Networks
Community
Fnd. Staff¶ Other
Tax/Legal Assistance
55.9 3.9 73.1 26.9 33.7 11.1 1.3 9.5
Advice/Setup Foundation,
Trust, or DAF
32.8 11.7 11.9 23.9 18.1 21.0 29.1 19.0
Mission Definition/ Creation
2.1 36.9 1.7 3.0 7.3 42.0 20.3 23.8
Management of Invested Charitable
Assets
2.1 15.5 3.5 37.3 28.5 6.2 27.8 19.0
Other (Back Office
Admin., Gift Structure/
Timing)
7.2 32.0 9.8 9.0 12.4 19.8 21.5 28.6
¶ Results for other types of advisors are not statistically meaningful because they were consulted less than 100 times by
high net worth households.
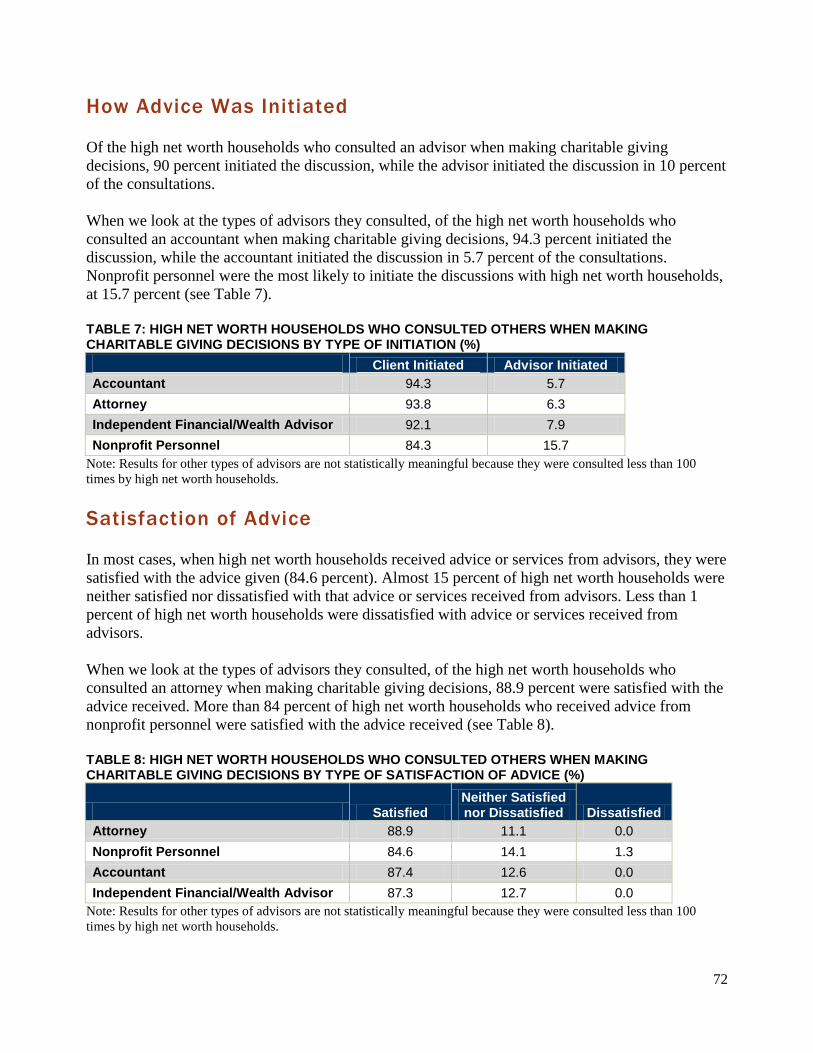
72
How Advice Was Initiated
Of the high net worth households who consulted an advisor when making charitable giving
decisions, 90 percent initiated the discussion, while the advisor initiated the discussion in 10 percent
of the consultations.
When we look at the types of advisors they consulted, of the high net worth households who
consulted an accountant when making charitable giving decisions, 94.3 percent initiated the
discussion, while the accountant initiated the discussion in 5.7 percent of the consultations.
Nonprofit personnel were the most likely to initiate the discussions with high net worth households,
at 15.7 percent (see Table 7).
TABLE 7: HIGH NET WORTH HOUSEHOLDS WHO CONSULTED OTHERS WHEN MAKING CHARITABLE GIVING DECISIONS BY TYPE OF INITIATION (%)
Client Initiated Advisor Initiated
Accountant 94.3 5.7
Attorney 93.8 6.3
Independent Financial/Wealth Advisor 92.1 7.9
Nonprofit Personnel 84.3 15.7
Note: Results for other types of advisors are not statistically meaningful because they were consulted less than 100
times by high net worth households.
Satisfaction of Advice
In most cases, when high net worth households received advice or services from advisors, they were
satisfied with the advice given (84.6 percent). Almost 15 percent of high net worth households were
neither satisfied nor dissatisfied with that advice or services received from advisors. Less than 1
percent of high net worth households were dissatisfied with advice or services received from
advisors.
When we look at the types of advisors they consulted, of the high net worth households who
consulted an attorney when making charitable giving decisions, 88.9 percent were satisfied with the
advice received. More than 84 percent of high net worth households who received advice from
nonprofit personnel were satisfied with the advice received (see Table 8).
TABLE 8: HIGH NET WORTH HOUSEHOLDS WHO CONSULTED OTHERS WHEN MAKING CHARITABLE GIVING DECISIONS BY TYPE OF SATISFACTION OF ADVICE (%)
Satisfied Neither Satisfied nor Dissatisfied Dissatisfied
Attorney 88.9 11.1 0.0
Nonprofit Personnel 84.6 14.1 1.3
Accountant 87.4 12.6 0.0
Independent Financial/Wealth Advisor 87.3 12.7 0.0
Note: Results for other types of advisors are not statistically meaningful because they were consulted less than 100
times by high net worth households.
73
CONCLUSION
Bank of America Merrill Lynch, one of the leading providers to both philanthropic individuals and
institutions, partnered with the Center on Philanthropy at Indiana University, one of the nation‟s
leading academic centers for the study and practice of philanthropy, to produce the 2010 Study of
High Net Worth Philanthropy. High net worth households play an important role in the
philanthropic landscape. They give between 65 and 70 percent of all individual giving, and between
49 and 53 percent of giving from all sources, which includes giving from corporations, foundations,
and both living and deceased individuals.vii
Not only do wealthy families give from their own personal income or assets, many also establish
charitable giving vehicles and give through private foundations, donor-advised funds and/or
charitable trusts. While the economy slowly improves, we see that wealthy families continue to give
generously of their time and money. High net worth households continued to support charitable
organizations at levels that were remarkably consistent with those seen in 2005 and 2007 and more
than three-quarters volunteered their time and talent to the organizations and causes they value.
Nearly three-quarters of high net worth households consider themselves experienced with charitable
giving and the majority has high levels of trust in nonprofit organizations to solve domestic or
global problems.
In this report, we provided analysis of the philanthropy of high net worth households by looking at
the wealthy as donors and as volunteers. We also examined the interaction between high net worth
households and nonprofit organizations and between the wealthy and their charitable advisors. As
with the 2006 and 2008 studies, the 2010 study highlights how high net worth households continue
to be drivers in American philanthropy.
74
METHODOLOGY Study Overview
The purpose of the 2010 Bank of America Merrill Lynch Study on High Net Worth Philanthropy
was to assess charitable giving and philanthropic activities of high-income and high net worth
households. The study consisted of a 12 page mailed survey randomly distributed to 20,000
households in high net worth areas of the United States (those where the average amount of
investable net assets were $3 million or more). The Indiana University Center for Survey Research
(CSR) implemented the survey. Dr. Una Osili, Director of Research at the Center on Philanthropy at
Indiana University oversaw analysis procedures.
The Questionnaire
For this report, the CSR mailed and received questionnaires between May and June 2010. Total
giving questions were modeled after the philanthropy questions from the Center on Philanthropy
Panel Study (COPPS), a module of the Panel Study on Income Dynamics conducted at the
University of Michigan. This modeling was intended to provide comparable national averages on
giving data. The 2010 Study of High Net Worth Philanthropy asks about giving in 2009.
Charitable giving information is the combination of high net worth households‟ personal assets and
giving from foundations, funds, and trusts, referred to as overall giving. In addition, giving to youth
or family services, environment/animal care, and international causes are included separately in the
2008 study but were incorporated into the category for “other” giving in the 2006 study about
giving in 2005. Questions on the motivations for giving were modeled after questions asked on
regional giving studies conducted by the Center on Philanthropy.
Final Disposition Summary
The response rate was 5.6 percent when undeliverable surveys and those households that were not
eligible, physically or mentally unable, or chose not to respond are excluded.
Disposition Count
Paper Completion 986
Web Completion 91
Bad address 437
Refused 139
Deceased 53
Physically/Mentally Unable 4
No response 18,290
Total 20,000
Final Dataset
The study‟s main purpose is to understand the philanthropic patterns of high net worth households.
Therefore, any household with an income less than $200,000 or a net worth of less than $1,000,000
(excluding the value of the primary residence) was excluded from analysis. In addition, all
respondents had to have their primary residence in the United States. After excluding those
75
households that did not qualify because of their income or wealth, the final sample was 801
responses.
Analysis
Charitable giving data tends to contain extreme values that are apt to highly influence average
giving amounts. In addition, if the sample size is relatively small, then including or excluding
specific data points that are clearly "outliers" may have a profound influence on averages.
Therefore, average giving was presented both with and without outliers. Outliers were identified by
natural breaks in the data where one observation had a particularly strong influence. In 2007, two
observations were considered outliers and as was the case in 2009, two observations were
considered outliers. Median amounts of giving are included because they tend to be less subject to
extreme values. Together, these values present a more complete picture of high net worth charitable
giving. Further, unless otherwise specified, charitable giving for 2005 and 2007 were adjusted for
inflation to 2009 dollars.
i U.S. Department of Commerce, Bureau of Economic Analysis, News release, “Gross Domestic Product: Fourth
Quarter 2009” (March, 2010). ii Data from U.S. Department of Labor, Bureau of Labor Statistics.
iii Giving USA 2010, Giving USA Foundation, researched and written by the Center on Philanthropy at Indiana
University. iv Center on Philanthropy at Indiana University analysis of charitable giving using data from the Survey of Consumer
Finances, IRS tax deduction information for households with income of $200,000 or more. Latest year available. v The Center on Philanthropy‟s analysis of 2007 and 2008 IRS tax deduction information (latest year available) for
households with income of $200,000 or more. vi Bureau of Labor Statistics, “Volunteering in the United States, 2009.” Available at
http://www.bls.gov/news.release/volun.nr0.htm August 2010. vii
Center on Philanthropy at Indiana University analysis of charitable giving using data from the Survey of Consumer
Finances, IRS tax deduction information for households with income of $200,000 or more. Latest year available.
The views and opinions expressed are those of the author, are subject to change without notice at
any time, and may differ from views expressed by Retirement & Philanthropic Services or other
divisions of Bank of America. Since economic and market conditions change frequently, there can
be no assurance that the trends described here will continue or that the forecasts will come to pass.
These materials are provided for informational purposes only.
Related Documents