The 2002 National Technology The 2002 National Technology Readiness Survey: Readiness Survey: Technology Readiness and Key Technology Readiness and Key Trends Trends Presented to: Presented to: Center for eService Partnership Forum Center for eService Partnership Forum February 28, 2003 February 28, 2003 Presented by: Presented by: Charles L. Colby Charles L. Colby President President Rockbridge Associates, Inc. Rockbridge Associates, Inc. 703-757-5213 – [email protected] 703-757-5213 – [email protected]

The 2002 National Technology Readiness Survey: Technology Readiness and Key Trends Presented to: Center for eService Partnership Forum February 28, 2003.
Mar 26, 2015
Welcome message from author
This document is posted to help you gain knowledge. Please leave a comment to let me know what you think about it! Share it to your friends and learn new things together.
Transcript

The 2002 National The 2002 National Technology Readiness Technology Readiness Survey:Survey:Technology Readiness and Key Technology Readiness and Key TrendsTrends
Presented to:Presented to:
Center for eService Partnership ForumCenter for eService Partnership Forum
February 28, 2003February 28, 2003
Presented by:Presented by:
Charles L. ColbyCharles L. Colby
PresidentPresident
Rockbridge Associates, Inc.Rockbridge Associates, Inc.
703-757-5213 – [email protected] – [email protected]

Major Points…Major Points…
E-Service resources in the household are increasing
E-Government use is growing, but there is room for improvement in quality
There really are “technology ownership gaps” in America

Our Research ProgramOur Research Program
National Technology Readiness Survey Authored by Parasuraman and Colby Replicated in 1999, 2000, 2001 and 2002 Nationally representative telephone survey Sponsored by the University of Maryland
Center for e-Service and Rockbridge Associates, Inc.

Household ResourcesHousehold Resources
How Consumers are Enabling How Consumers are Enabling themselves to use E-Servicethemselves to use E-Service

Technology
Company
Employees Customers
In the 2000s, e-Service In the 2000s, e-Service will grow, powered by the will grow, powered by the
useruser
1990s
2000s
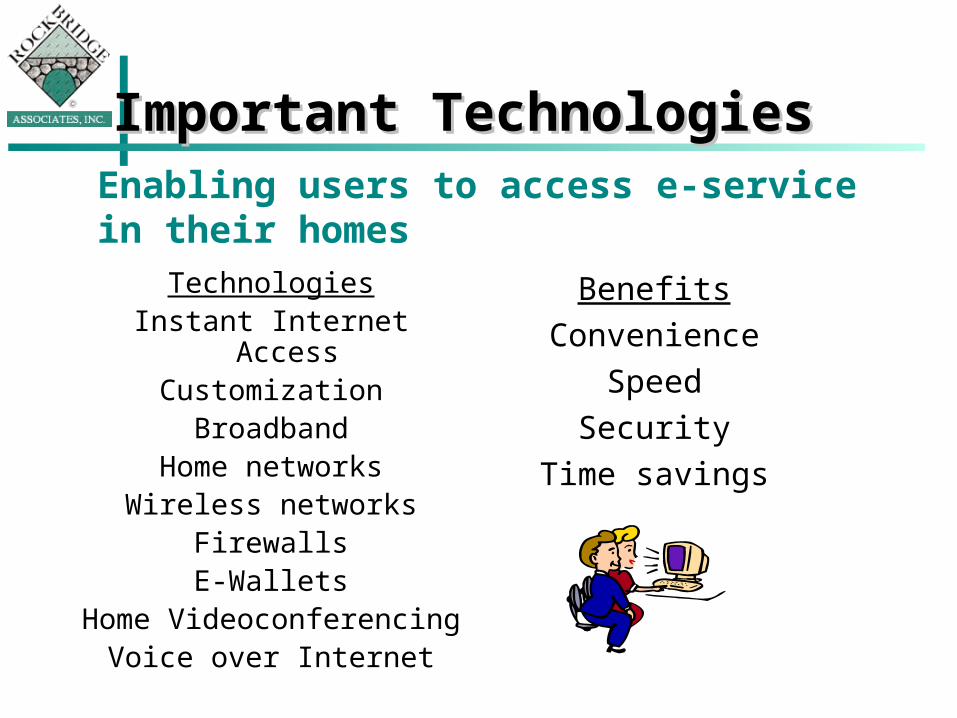
Enabling users to access e-service in their homes
TechnologiesInstant Internet Access
CustomizationBroadband
Home networksWireless networks
FirewallsE-Wallets
Home Videoconferencing
Voice over Internet
BenefitsConvenience
SpeedSecurity
Time savings
Important TechnologiesImportant Technologies

Home Sweet (Wired) Home Sweet (Wired) HomeHome
High Speed Connection19% of US
HHs
Personal/family web site (21%)
Personal/family Internet Identity (13%)
Home Network(18%)
Home Compute
r(70%)
InternetAccess(62%)

More Depth, less ReachMore Depth, less ReachThe Growth last year was in The Growth last year was in BroadbandBroadband
Computer Penetration dropped from 72% in ’01 to 70% in ‘02
Computer use at work dropped from 49% to 44% (tech collapse?)
Home Internet Penetration grew from 58% to 62%
Work Penetration dropped from 43% to 41%
High speed access grew from 21% to 31% of Internet households
Cable modems are driving the boom
20% in 2002 (from 12% in 2001)
DSL is 9% (from 8% in 2001)
58% without it think it is available in their neighborhood
Flat Growing

Growth e-Services Growth e-Services (commercial)(commercial)
1613
15 15
5 5 4 3
23 2220 19
9 96 5
0
5
10
15
20
25
Bill P
ayin
g
Checki
ng util
ity a
ccount
Payin
g cre
dit ca
rd b
ill
Man
agin
g cre
dit ca
rd
Signi
ng up
for t
elec
om
Signi
ng up
for u
tility
Applyin
g for m
ortgag
e
Signi
ng up
for i
nsura
nce
2001
2002

Flat or Declining e-Flat or Declining e-ServicesServices(2001 to 2002)(2001 to 2002)
While all of these have grown since 1999, the incidence was flat or dropped in the past year for… Online travel Purchasing (all size categories, especially <$10) Online banking Applying for credit cards Stock trading
9/11 and the economy were no doubt factors

Online VenuesOnline Venues Many take the job home, and personal
business to work 5.9 hours per week on internet at home for work
purposes* 3.7 hours per week on internet at work for
personal purposes* 38% of of the public have used the internet
at a location away from home or work, usually a friend’s home or library
M-Commerce is not yet taking off: 5% of adults accessed the internet from a portable device in 2001 and 2002
*Among those with access in both places.

E-GovernmentE-Government
Trends and SatisfactionTrends and Satisfaction

Online Activities (12 month period, based on online population)
50
16
33
1121
39
19
36
1824
0
20
40
60
Visitedlocal/state
site
Didbusiness
withlocal/state
gov't
Visitedfederalgov't
website
Didbusiness
withfederalgov't
Didbusinesswith any
gov'tonline
%
2001
2002
Business with e-Gov is Business with e-Gov is Growing (but less Growing (but less “shopping”)“shopping”)

E-Government E-Government ActivitiesActivities
Local/State Taxes (19%) Motor vehicle
(17%) Employment
(14%) General research
(11%)
Federal Taxes (41%) General
research (12%) Downloading
forms (9%)

Satisfaction with e-Satisfaction with e-GovernmentGovernmentCommercial Sites do a Little BetterCommercial Sites do a Little Better
Satisfaction with Online Activities
6474
88 87 8776
134 0
5 16
0
20
40
60
80
100
Local/StateGov't
FederalGov't
Buyingthings <$10
Buyingthings $10-
$100
Buyingthings>$100
Payingcredit card
bill
%
SatisfiedDissatisfied

Gaps: Gaps: Technology “Have Technology “Have Nots”Nots”
Size of the gap, who the Size of the gap, who the have nots are, why they lack have nots are, why they lack
technologytechnology

Framing the IssueFraming the Issue Online access is a prerequisite to
special advantages, such as… Discounts (e.g., special air fares) E-Government 24 x 7 service
Many Americans want technology at home, but lack it
Other Americans don’t want the technology (many seniors), but need access anyway

Who are the “Have Who are the “Have Nots”Nots”
Older Less educated Lower income Less white More rural and inner city

Should the Government Should the Government Step in?Step in?
It depends on which side of the divide you are on… 38% of the public believe “the
government should provide subsidies to people who cannot afford computers”
64% of those who lack computers because of affordability believe the gov’t should intervene

Why the Gap at Home?Why the Gap at Home? Reasons for not having a computer:
Affordability (43%) Lack of interest (34%) Can use computers somewhere else (22%) Lack of knowledge (20%)
Reasons for not having Internet access: Lack of interest (32%) Affordability (31%) Can use it elsewhere (20%) Lack of knowledge (12%)

Training and Training and Experience IssuesExperience Issues
Only 17% of those who lack computers at home and work have “moderate” or “a lot of experience” using them
54% of the “have nots” need at least moderate or extensive training
While 38% prefer a classroom setting, many prefer a more interpersonal style of training (visiting home, neighborhood center)

Future DirectionsFuture Directions
Where we go next with NTRSWhere we go next with NTRS

Future Research Future Research DirectionsDirections
Cultural influences on techno-readiness
A general theory of innovation (e.g., biotech, entertainment)
Organizational techno-readiness
Future InitiativesFuture Initiatives
African American/Hispanic NTRS, with Terri Albert, University of Hartford (March 2003)
Continuing studies in other countries (Austria, Sweden)
Possibility of a business executive NTRS in U.S. and Latin America (need a sponsor)
Related Documents