The 2001 Recession: How Was It Different and What Developments May Have Caused It? Kevin L. Kliesen S EPTEMBER/OCTOBER 2003 23 T he U.S. business expansion that started in March 1991 and ended exactly a decade later lasted more than a year longer than the pre- vious record-long 1961-69 expansion. On July 17, 2003, the arbiters of U.S. business cycles (the National Bureau of Economic Research [NBER]) declared that the 2001 recession ended some time in November 2001. 1 It was relatively short and, by some measures, shallow. Indeed, it bears some resemblance to the mild 1969-70 and 1990-91 recessions, which, respectively, followed the second- and third-longest expansions in U.S. history. Although the past two business cycles are consistent with the evidence that U.S. expansions have gotten progressively longer over time, and that recessions have become shorter, the mildness of the 2001 recession is per- haps surprising given the jarring economic develop- ments that preceded it. In particular, the resiliency of the U.S. economy in the face of a boom and bust in U.S. equity markets and business outlays for capital equipment, as well as the economic distur- bances caused by the fallout from the events of September 11, 2001, has been noted prominently by several policymakers and economists. This article comprises two sections. The first section will discuss these developments in the con- text of the key differences between the 2001 reces- sion and the “average” post-World War II recession. The second section will then attempt to ascertain, first, the extent to which forecasters were surprised by the recession and, second, what aspect of econ- omic developments in the latter part of the 1990s and into 2000-01 surprised them. I accomplish the latter by examining forecast errors for real gross domestic product (GDP) growth and some of its major components from a macroeconometric fore- casting model. Such an exercise may help determine whether some sector-specific shocks can be identi- fied as potential causes for the recession. COMPARING THE 2001 RECESSION WITH PREVIOUS POSTWAR RECESSIONS According to the NBER’s Business Cycle Dating Committee, which establishes and maintains the chronology of U.S. business cycles, the average reces- sion (defined as the time from the peak to the trough) lasted 11 months during the post-World War II period. 2 The shortest of these downturns has lasted 6 months (1980), while the longest have lasted 16 months (1973-75 and 1981-82). Eliminating these extremes shows that recessions tend to average about 9 months. Hence, the 2001 recession, which ended in November 2001, was somewhat shorter than average. The 2001 recession’s relatively short duration is not the only unique characteristic that distinguishes it from other post-World War II recessions. 3 Another unique feature was its mildness, as seen by the decline in output (real GDP). Current national income and product account (NIPA) data indicate that real GDP rose 0.2 percent from the first quarter of 2001 (the peak quarter designated by the NBER Commit- tee) to the fourth quarter of 2001 (the trough quarter according to the NBER). Economists have found that the severity of the recession importantly influences the magnitude of the recovery. That is, a deep reces- sion tends to be followed by a strong recovery, but a mild recession tends to be followed by a mild recovery. 4 But does the length of the expansion say anything about the duration of the recession? Perhaps. One notable characteristic of the 2001 recession 2 See <http://www.nber.org/cycles>. 3 Others who have noted the uniqueness of the 1991-2001 business cycle include Koenig, Siems, and Wynne (2002), Lansing (2003), and Nordhaus (2002). 4 See Friedman (1964) or Balke and Wynne (1996). 1 See <http://www.nber.org/cycles/july2003.html>. In an article pub- lished in April 2003, this was also the date chosen by Chauvet and Piger (2003) using a type of Markov-switching model that was originally developed by Hamilton (1989). Kevin L. Kliesen is an economist at the Federal Reserve Bank of St. Louis. The author thanks William Gavin, William Poole, and Daniel Thornton for helpful comments. Thomas Pollmann provided research assistance. © 2003, The Federal Reserve Bank of St. Louis.

Welcome message from author
This document is posted to help you gain knowledge. Please leave a comment to let me know what you think about it! Share it to your friends and learn new things together.
Transcript

The 2001 Recession: How Was It Different andWhat Developments May Have Caused It?Kevin L. Kliesen
SEPTEMBER/OCTOBER 2003 23
T he U.S. business expansion that started inMarch 1991 and ended exactly a decade laterlasted more than a year longer than the pre-
vious record-long 1961-69 expansion. On July 17,2003, the arbiters of U.S. business cycles (theNational Bureau of Economic Research [NBER])declared that the 2001 recession ended some time inNovember 2001.1 It was relatively short and, by somemeasures, shallow. Indeed, it bears some resemblanceto the mild 1969-70 and 1990-91 recessions, which,respectively, followed the second- and third-longestexpansions in U.S. history. Although the past twobusiness cycles are consistent with the evidencethat U.S. expansions have gotten progressivelylonger over time, and that recessions have becomeshorter, the mildness of the 2001 recession is per-haps surprising given the jarring economic develop-ments that preceded it. In particular, the resiliencyof the U.S. economy in the face of a boom and bustin U.S. equity markets and business outlays forcapital equipment, as well as the economic distur-bances caused by the fallout from the events ofSeptember 11, 2001, has been noted prominentlyby several policymakers and economists.
This article comprises two sections. The firstsection will discuss these developments in the con-text of the key differences between the 2001 reces-sion and the “average” post-World War II recession.The second section will then attempt to ascertain,first, the extent to which forecasters were surprisedby the recession and, second, what aspect of econ-omic developments in the latter part of the 1990sand into 2000-01 surprised them. I accomplish thelatter by examining forecast errors for real grossdomestic product (GDP) growth and some of itsmajor components from a macroeconometric fore-
casting model. Such an exercise may help determinewhether some sector-specific shocks can be identi-fied as potential causes for the recession.
COMPARING THE 2001 RECESSIONWITH PREVIOUS POSTWARRECESSIONS
According to the NBER’s Business Cycle DatingCommittee, which establishes and maintains thechronology of U.S. business cycles, the average reces-sion (defined as the time from the peak to the trough)lasted 11 months during the post-World War IIperiod.2 The shortest of these downturns has lasted6 months (1980), while the longest have lasted 16months (1973-75 and 1981-82). Eliminating theseextremes shows that recessions tend to average about9 months. Hence, the 2001 recession, which endedin November 2001, was somewhat shorter thanaverage.
The 2001 recession’s relatively short duration isnot the only unique characteristic that distinguishesit from other post-World War II recessions.3 Anotherunique feature was its mildness, as seen by thedecline in output (real GDP). Current national incomeand product account (NIPA) data indicate that realGDP rose 0.2 percent from the first quarter of 2001(the peak quarter designated by the NBER Commit-tee) to the fourth quarter of 2001 (the trough quarteraccording to the NBER). Economists have found thatthe severity of the recession importantly influencesthe magnitude of the recovery. That is, a deep reces-sion tends to be followed by a strong recovery, buta mild recession tends to be followed by a mildrecovery.4 But does the length of the expansion sayanything about the duration of the recession?Perhaps.
One notable characteristic of the 2001 recession
2 See <http://www.nber.org/cycles>.
3 Others who have noted the uniqueness of the 1991-2001 businesscycle include Koenig, Siems, and Wynne (2002), Lansing (2003), andNordhaus (2002).
4 See Friedman (1964) or Balke and Wynne (1996).
1 See <http://www.nber.org/cycles/july2003.html>. In an article pub-lished in April 2003, this was also the date chosen by Chauvet andPiger (2003) using a type of Markov-switching model that was originallydeveloped by Hamilton (1989).
Kevin L. Kliesen is an economist at the Federal Reserve Bank of St. Louis.The author thanks William Gavin, William Poole, and Daniel Thorntonfor helpful comments. Thomas Pollmann provided research assistance.
© 2003, The Federal Reserve Bank of St. Louis.
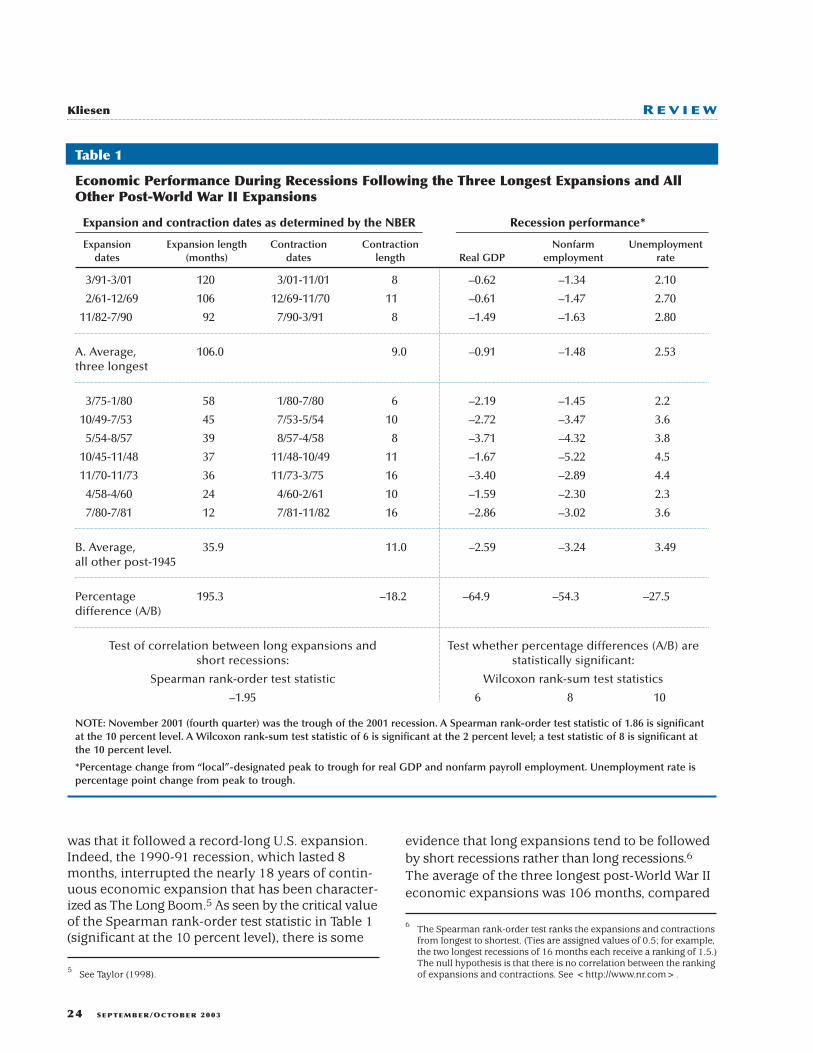
was that it followed a record-long U.S. expansion.Indeed, the 1990-91 recession, which lasted 8months, interrupted the nearly 18 years of contin-uous economic expansion that has been character-ized as The Long Boom.5 As seen by the critical valueof the Spearman rank-order test statistic in Table 1(significant at the 10 percent level), there is some
evidence that long expansions tend to be followedby short recessions rather than long recessions.6
The average of the three longest post-World War IIeconomic expansions was 106 months, compared
24 SEPTEMBER/OCTOBER 2003
Kliesen R E V I E W
Economic Performance During Recessions Following the Three Longest Expansions and AllOther Post-World War II Expansions
Expansion and contraction dates as determined by the NBER Recession performance*
Expansion Expansion length Contraction Contraction Nonfarm Unemployment dates (months) dates length Real GDP employment rate
3/91-3/01 120 3/01-11/01 8 –0.62 –1.34 2.10
2/61-12/69 106 12/69-11/70 11 –0.61 –1.47 2.70
11/82-7/90 92 7/90-3/91 8 –1.49 –1.63 2.80
A. Average, 106.0 9.0 –0.91 –1.48 2.53three longest
3/75-1/80 58 1/80-7/80 6 –2.19 –1.45 2.2
10/49-7/53 45 7/53-5/54 10 –2.72 –3.47 3.6
5/54-8/57 39 8/57-4/58 8 –3.71 –4.32 3.8
10/45-11/48 37 11/48-10/49 11 –1.67 –5.22 4.5
11/70-11/73 36 11/73-3/75 16 –3.40 –2.89 4.4
4/58-4/60 24 4/60-2/61 10 –1.59 –2.30 2.3
7/80-7/81 12 7/81-11/82 16 –2.86 –3.02 3.6
B. Average, 35.9 11.0 –2.59 –3.24 3.49all other post-1945
Percentage 195.3 –18.2 –64.9 –54.3 –27.5difference (A/B)
Test of correlation between long expansions and Test whether percentage differences (A/B) are short recessions: statistically significant:
Spearman rank-order test statistic Wilcoxon rank-sum test statistics
–1.95 6 8 10
NOTE: November 2001 (fourth quarter) was the trough of the 2001 recession. A Spearman rank-order test statistic of 1.86 is significantat the 10 percent level. A Wilcoxon rank-sum test statistic of 6 is significant at the 2 percent level; a test statistic of 8 is significant atthe 10 percent level.
*Percentage change from “local”-designated peak to trough for real GDP and nonfarm payroll employment. Unemployment rate ispercentage point change from peak to trough.
Table 1
5 See Taylor (1998).
6 The Spearman rank-order test ranks the expansions and contractionsfrom longest to shortest. (Ties are assigned values of 0.5; for example,the two longest recessions of 16 months each receive a ranking of 1.5.)The null hypothesis is that there is no correlation between the rankingof expansions and contractions. See <http://www.nr.com>.
with nearly 36 months for all other post-World War IIexpansions. The average recession following thethree longest expansions was 9 months, a little morethan 18 percent shorter than all others.
Since the NBER uses monthly measures ofeconomic activity to date peaks and troughs, theirtrough quarters do not always correspond to actualpeaks and troughs of aggregate output.7 Table 1 alsoshows that the actual peak-to-trough percentagedecline in real GDP during the recessions followingthe three longest expansions was about 1 percent,versus 2.6 percent for all other post-World War IIrecessions. Moreover, the percentage decline in non-farm employment and the percentage-point rise inthe unemployment rate following the three longestexpansions were about, respectively, 54 and 28 per-cent smaller than in the recessions that followed theother seven expansions. There is some statisticalevidence that recession performance varies with thelength of the business expansion. According to theWilcoxon rank-sum test statistic reported in Table 1,the average percentage changes in real GDP and non-farm payroll employment in recessions that followedthe three longest recessions are significantly differentfrom the average changes that followed all otherexpansions. The average change in the unemploy-ment rate, however, is not statistically different inrecessions following long or short expansions.8
The evidence presented in Table 1 suggests thatrecessions that follow long expansions tend (i) tobe of shorter duration and (ii) to have smaller-than-average declines in output and payroll employment.The finding that recessions are milder after longexpansions, which runs counter to Friedman (1964),might be that fewer imbalances accumulate overthe course of long expansions, whereas expansionsof a shorter duration end because of oil price shocksor an increase in inflation that exacerbates distor-tions to the price mechanism, thereby precipitating“tightening” actions by monetary policy policy-makers. Over the final four quarters prior to the peakof the three longest expansions reported in Table 1,the consumer price index (CPI) inflation rate aver-
aged about 4.5 percent; over the final four quartersof the remaining expansions, the inflation rate aver-aged 6.3 percent.
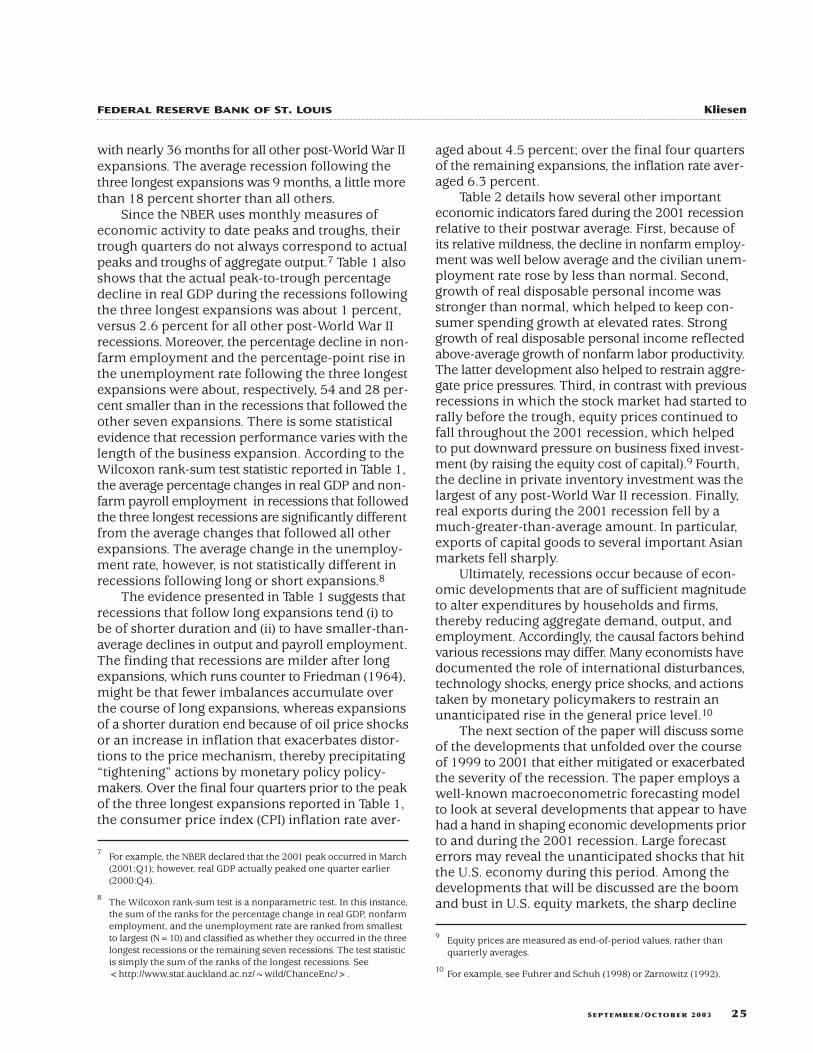
Table 2 details how several other importanteconomic indicators fared during the 2001 recessionrelative to their postwar average. First, because ofits relative mildness, the decline in nonfarm employ-ment was well below average and the civilian unem-ployment rate rose by less than normal. Second,growth of real disposable personal income wasstronger than normal, which helped to keep con-sumer spending growth at elevated rates. Stronggrowth of real disposable personal income reflectedabove-average growth of nonfarm labor productivity.The latter development also helped to restrain aggre-gate price pressures. Third, in contrast with previousrecessions in which the stock market had started torally before the trough, equity prices continued tofall throughout the 2001 recession, which helpedto put downward pressure on business fixed invest-ment (by raising the equity cost of capital).9 Fourth,the decline in private inventory investment was thelargest of any post-World War II recession. Finally,real exports during the 2001 recession fell by amuch-greater-than-average amount. In particular,exports of capital goods to several important Asianmarkets fell sharply.
Ultimately, recessions occur because of econ-omic developments that are of sufficient magnitudeto alter expenditures by households and firms,thereby reducing aggregate demand, output, andemployment. Accordingly, the causal factors behindvarious recessions may differ. Many economists havedocumented the role of international disturbances,technology shocks, energy price shocks, and actionstaken by monetary policymakers to restrain anunanticipated rise in the general price level.10
The next section of the paper will discuss someof the developments that unfolded over the courseof 1999 to 2001 that either mitigated or exacerbatedthe severity of the recession. The paper employs awell-known macroeconometric forecasting modelto look at several developments that appear to havehad a hand in shaping economic developments priorto and during the 2001 recession. Large forecasterrors may reveal the unanticipated shocks that hitthe U.S. economy during this period. Among thedevelopments that will be discussed are the boomand bust in U.S. equity markets, the sharp decline
SEPTEMBER/OCTOBER 2003 25
FEDERAL RESERVE BANK OF ST. LOUIS Kliesen
7 For example, the NBER declared that the 2001 peak occurred in March(2001:Q1); however, real GDP actually peaked one quarter earlier(2000:Q4).
8 The Wilcoxon rank-sum test is a nonparametric test. In this instance,the sum of the ranks for the percentage change in real GDP, nonfarmemployment, and the unemployment rate are ranked from smallestto largest (N=10) and classified as whether they occurred in the threelongest recessions or the remaining seven recessions. The test statisticis simply the sum of the ranks of the longest recessions. See<http://www.stat.auckland.ac.nz/~wild/ChanceEnc/>.
9 Equity prices are measured as end-of-period values, rather thanquarterly averages.
10 For example, see Fuhrer and Schuh (1998) or Zarnowitz (1992).

in business capital expenditures for computers andsoftware, the economic fallout from the events sur-rounding September 11, and the significant declinein the real value of U.S. exports.
WERE FORECASTERS SURPRISED BYTHE RECESSION?
Finding the causes of the 2001 recession, orany recession, is often extremely difficult.11 In theliterature, finding the proximate cause (or shock)that precipitated a downturn in economic activityhas taken many forms.12 This article uses a large-
scale macroeconometric forecasting model toidentify structural changes in the U.S. economy.Specifically, I examine quarterly forecasts that arepublished in the last month of each quarter in theBlue Chip Economic Indicators (BCEI).13 These areknown as the Blue Chip Econometric Detail (BCED).14
26 SEPTEMBER/OCTOBER 2003
regression (VAR) or real business cycle models, to changes in the majorcomponents of real GDP relative to trend. See Walsh (1993), Blanchard(1993), Hansen and Prescott (1993), and Hall (1993).
13 The BCED are published in March (Q1), June (Q2), September (Q3),and December (Q4).
14 Because no model is used to produce the Blue Chip Consensus forecast,the BCED uses Macroeconometric Advisers’ macroeconometric modelto produce detailed quarterly forecasts of output, prices, interest rates,profits, productivity, and other economic series. The BCED forecastsare based on the Blue Chip Consensus forecast.
Kliesen R E V I E W
Growth of Various Economic Series During Post-World War II Recessions (Percent Change)
Averages excluding the 2001 recession
Average High Low 2001 recession
Real GDP –1.96 –0.14 –3.40 0.20
PCE 0.41 3.28 –1.29 2.18
Durables –3.66 16.35 –9.45 10.15
Nondurables –0.06 2.69 –2.43 1.14
Services 2.17 3.59 –0.24 1.13
Fixed Investment –6.94 –0.76 –16.26 –6.16
Nonresidential investment –7.59 –2.99 –14.57 –8.01
Equipment & software –9.65 –3.50 –18.44 –7.32
Structures –4.26 4.09 –11.11 –9.88
Residential investment –6.31 10.63 –30.18 –0.93
Inventory investment –0.56 2.94 –3.18 –3.61
Government 1.24 5.95 –7.59 3.64
Exports –0.76 10.00 –12.45 –10.04
Imports –4.54 5.70 –13.96 –6.04
Nonfarm employment –2.20 –0.79 –4.23 –0.98
Unemployment rate 2.49 3.50 0.90 1.43
S&P 500 11.59 22.89 –14.55 –1.06
CPI inflation 3.93 14.44 –2.20 0.89
Industrial production –7.30 –3.37 –11.26 –4.19
Nonfarm productivity 0.89 3.68 –0.61 2.23
Real disposable personal income –0.24 3.22 –3.31 0.37
NOTE: Period for the 2001 recession is 2001:Q1 to 2001:Q4. Percent changes are from NBER-designated peak quarters to NBER-designated trough quarters. Change in the unemployment rate is in percentage points.
Table 2
11 See Boldin (1994).
12 These have included the identification of shocks, using vector auto
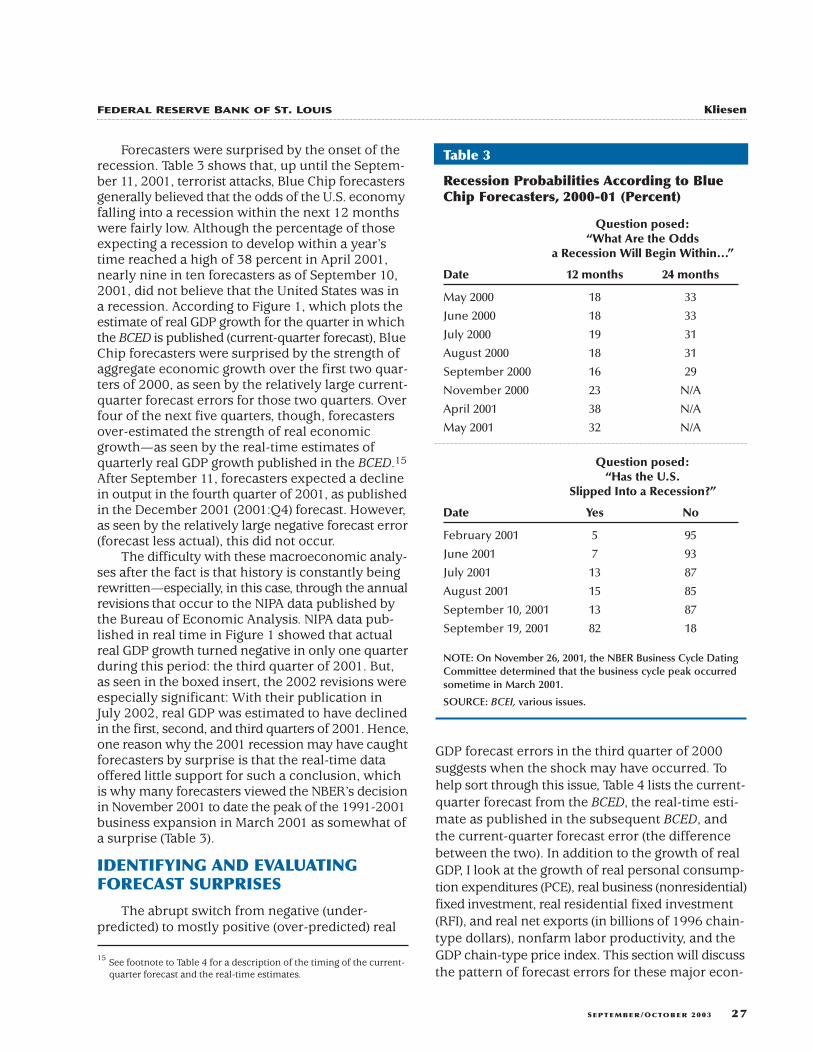
Forecasters were surprised by the onset of therecession. Table 3 shows that, up until the Septem-ber 11, 2001, terrorist attacks, Blue Chip forecastersgenerally believed that the odds of the U.S. economyfalling into a recession within the next 12 monthswere fairly low. Although the percentage of thoseexpecting a recession to develop within a year’stime reached a high of 38 percent in April 2001,nearly nine in ten forecasters as of September 10,2001, did not believe that the United States was ina recession. According to Figure 1, which plots theestimate of real GDP growth for the quarter in whichthe BCED is published (current-quarter forecast), BlueChip forecasters were surprised by the strength ofaggregate economic growth over the first two quar-ters of 2000, as seen by the relatively large current-quarter forecast errors for those two quarters. Overfour of the next five quarters, though, forecastersover-estimated the strength of real economicgrowth—as seen by the real-time estimates ofquarterly real GDP growth published in the BCED.15
After September 11, forecasters expected a declinein output in the fourth quarter of 2001, as publishedin the December 2001 (2001:Q4) forecast. However,as seen by the relatively large negative forecast error(forecast less actual), this did not occur.
The difficulty with these macroeconomic analy-ses after the fact is that history is constantly beingrewritten—especially, in this case, through the annualrevisions that occur to the NIPA data published bythe Bureau of Economic Analysis. NIPA data pub-lished in real time in Figure 1 showed that actualreal GDP growth turned negative in only one quarterduring this period: the third quarter of 2001. But,as seen in the boxed insert, the 2002 revisions wereespecially significant: With their publication inJuly 2002, real GDP was estimated to have declinedin the first, second, and third quarters of 2001. Hence,one reason why the 2001 recession may have caughtforecasters by surprise is that the real-time dataoffered little support for such a conclusion, whichis why many forecasters viewed the NBER’s decisionin November 2001 to date the peak of the 1991-2001business expansion in March 2001 as somewhat ofa surprise (Table 3).
IDENTIFYING AND EVALUATINGFORECAST SURPRISES
The abrupt switch from negative (under-predicted) to mostly positive (over-predicted) real
GDP forecast errors in the third quarter of 2000suggests when the shock may have occurred. Tohelp sort through this issue, Table 4 lists the current-quarter forecast from the BCED, the real-time esti-mate as published in the subsequent BCED, andthe current-quarter forecast error (the differencebetween the two). In addition to the growth of realGDP, I look at the growth of real personal consump-tion expenditures (PCE), real business (nonresidential)fixed investment, real residential fixed investment(RFI), and real net exports (in billions of 1996 chain-type dollars), nonfarm labor productivity, and theGDP chain-type price index. This section will discussthe pattern of forecast errors for these major econ-
SEPTEMBER/OCTOBER 2003 27
FEDERAL RESERVE BANK OF ST. LOUIS Kliesen
15 See footnote to Table 4 for a description of the timing of the current-quarter forecast and the real-time estimates.
Recession Probabilities According to BlueChip Forecasters, 2000-01 (Percent)
Question posed:“What Are the Odds
a Recession Will Begin Within...”
Date 12 months 24 months
May 2000 18 33
June 2000 18 33
July 2000 19 31
August 2000 18 31
September 2000 16 29
November 2000 23 N/A
April 2001 38 N/A
May 2001 32 N/A
Question posed:“Has the U.S.
Slipped Into a Recession?”
Date Yes No
February 2001 5 95
June 2001 7 93
July 2001 13 87
August 2001 15 85
September 10, 2001 13 87
September 19, 2001 82 18
NOTE: On November 26, 2001, the NBER Business Cycle DatingCommittee determined that the business cycle peak occurredsometime in March 2001.
SOURCE: BCEI, various issues.
Table 3

omic variables in the context of the macroeconomicdevelopments noted above. From this discussion, itis hoped that some identification of the likely shocksthat caused the 2001 recession will emerge.
Consumer Spending
As seen in Table 2, real PCE usually increasesslightly (about 0.5 percent) during the average post-war recession. This was true for the 2001 recessionas well, but the increase in real PCE was relativelylarge (2.2 percent). On average, the pattern of con-sumer expenditures by type of good and serviceduring a recession is quite different: Spending onconsumer durables typically falls about 3.75 percent,while spending on services increases by a little lessthan 2.25 percent. Real expenditures on nondurablegoods is about unchanged. Even though consumerexpenditures on durables tends to fall sharply, therelative income inelasticity of consumer demandfor services, combined with the fact that householdspending on services (current dollars) is now a littlemore than 59 percent of PCE (versus roughly 41percent in 1960), probably explains why total spend-ing does not appreciably decline.16
On average, consumer expenditures on durablegoods peak about two quarters prior to the businesscycle peak; they then bottom out about one quarterafter the trough. After showing relatively weakergrowth in 2000 and early 2001, consumer durablegoods purchases rose strongly well into the 2001recession. The 10.2 percent increase for real con-sumer durables during the 2001 recession was sur-passed only by the 1948-49 recession. Table 4 showsthat forecasters generally were surprised by thestrength of real PCE growth prior to and into therecession, which suggests that a shock to consumerspending was not a precursor to the recession.Indeed, this can be seen by the cumulative current-quarter forecast errors, which summed to a littlemore than –3 percentage points by 2001:Q1 (theNBER business cycle peak).
Part of this strength in consumer expenditureswas manifested after the terrorist attacks onSeptember 11: To counteract the expected drop in
28 SEPTEMBER/OCTOBER 2003
16 The share of consumer expenditures (current dollars) on nondurableshas declined from about 46 percent in 1960 to about 30 percent cur-rently. The other category, consumer durables, has varied much less,between 11 and around 14 percent.
Kliesen R E V I E W
Real GDP Growth: Current-Quarter Forecast and Forecast Error and Real-Time Actual Growth Estimate
–4.0
–3.0
–2.0
–1.0
0.0
1.0
2.0
3.0
4.0
5.0
6.0
7.0
2000:Q1 2000:Q2 2000:Q3 2000:Q4 2001:Q1 2001:Q2 2001:Q3 2001:Q4 2002:Q1
Percent
Current-Quarter Forecast ErrorCurrent-Quarter Forecast Real-Time Actual Growth Estimate
Figure 1
SEPTEMBER/OCTOBER 2003 29
FEDERAL RESERVE BANK OF ST. LOUIS Kliesen
Changing History: The 2001 AnnualRevision to the NIPAs
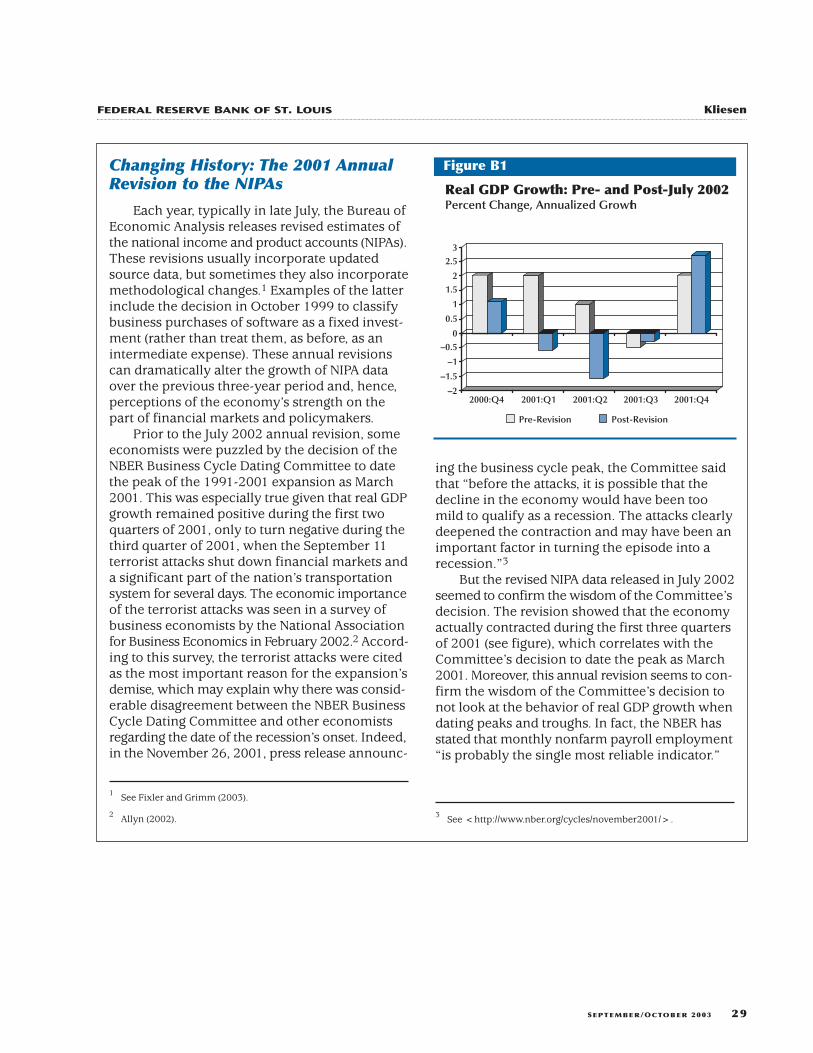
Each year, typically in late July, the Bureau ofEconomic Analysis releases revised estimates ofthe national income and product accounts (NIPAs).These revisions usually incorporate updatedsource data, but sometimes they also incorporatemethodological changes.1 Examples of the latterinclude the decision in October 1999 to classifybusiness purchases of software as a fixed invest-ment (rather than treat them, as before, as anintermediate expense). These annual revisionscan dramatically alter the growth of NIPA dataover the previous three-year period and, hence,perceptions of the economy’s strength on thepart of financial markets and policymakers.
Prior to the July 2002 annual revision, someeconomists were puzzled by the decision of theNBER Business Cycle Dating Committee to datethe peak of the 1991-2001 expansion as March2001. This was especially true given that real GDPgrowth remained positive during the first twoquarters of 2001, only to turn negative during thethird quarter of 2001, when the September 11terrorist attacks shut down financial markets anda significant part of the nation’s transportationsystem for several days. The economic importanceof the terrorist attacks was seen in a survey ofbusiness economists by the National Associationfor Business Economics in February 2002.2 Accord-ing to this survey, the terrorist attacks were citedas the most important reason for the expansion’sdemise, which may explain why there was consid-erable disagreement between the NBER BusinessCycle Dating Committee and other economistsregarding the date of the recession’s onset. Indeed,in the November 26, 2001, press release announc-
ing the business cycle peak, the Committee saidthat “before the attacks, it is possible that thedecline in the economy would have been toomild to qualify as a recession. The attacks clearlydeepened the contraction and may have been animportant factor in turning the episode into arecession.”3
But the revised NIPA data released in July 2002seemed to confirm the wisdom of the Committee’sdecision. The revision showed that the economyactually contracted during the first three quartersof 2001 (see figure), which correlates with theCommittee’s decision to date the peak as March2001. Moreover, this annual revision seems to con-firm the wisdom of the Committee’s decision tonot look at the behavior of real GDP growth whendating peaks and troughs. In fact, the NBER hasstated that monthly nonfarm payroll employment“is probably the single most reliable indicator.”
3 See <http://www.nber.org/cycles/november2001/>.
1 See Fixler and Grimm (2003).
2 Allyn (2002).
–2
–1.5
–1
–0.50
0.5
1
1.52
2.53
2000:Q4 2001:Q1 2001:Q2 2001:Q3 2001:Q4
Pre-Revision Post-Revision
Real GDP Growth: Pre- and Post-July 2002Percent Change, Annualized Growth
Figure B1
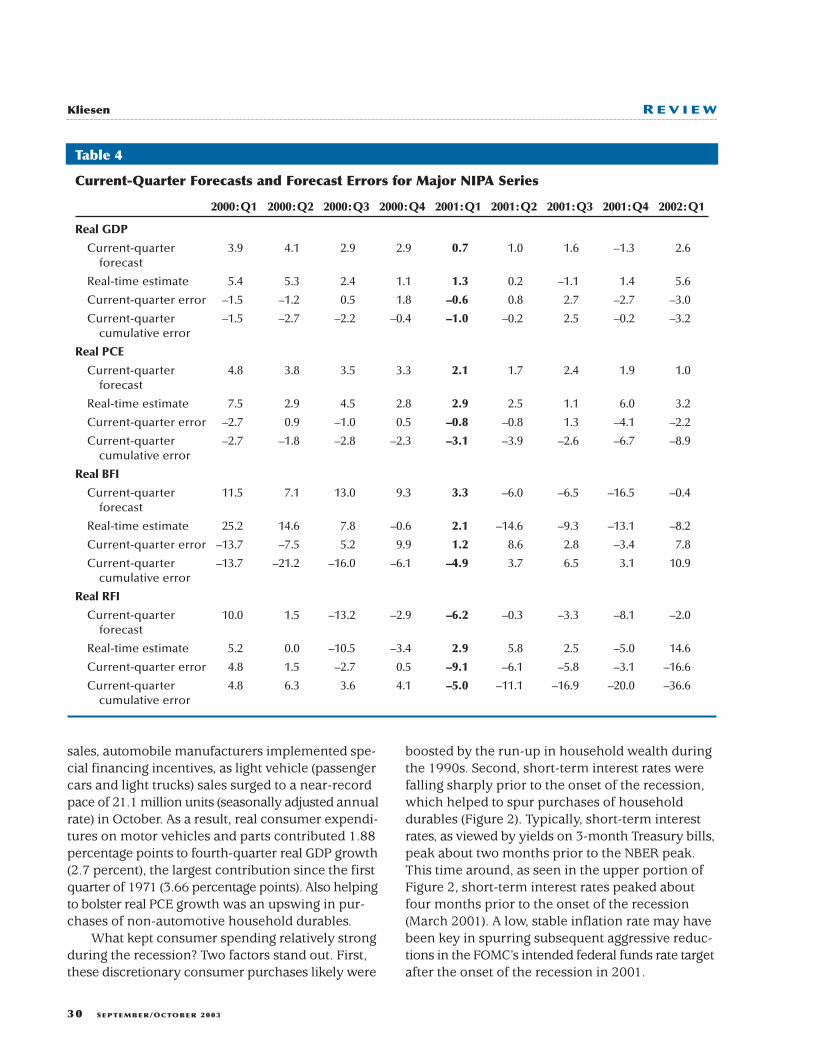
sales, automobile manufacturers implemented spe-cial financing incentives, as light vehicle (passengercars and light trucks) sales surged to a near-recordpace of 21.1 million units (seasonally adjusted annualrate) in October. As a result, real consumer expendi-tures on motor vehicles and parts contributed 1.88percentage points to fourth-quarter real GDP growth(2.7 percent), the largest contribution since the firstquarter of 1971 (3.66 percentage points). Also helpingto bolster real PCE growth was an upswing in pur-chases of non-automotive household durables.
What kept consumer spending relatively strongduring the recession? Two factors stand out. First,these discretionary consumer purchases likely were
boosted by the run-up in household wealth duringthe 1990s. Second, short-term interest rates werefalling sharply prior to the onset of the recession,which helped to spur purchases of householddurables (Figure 2). Typically, short-term interestrates, as viewed by yields on 3-month Treasury bills,peak about two months prior to the NBER peak.This time around, as seen in the upper portion ofFigure 2, short-term interest rates peaked aboutfour months prior to the onset of the recession(March 2001). A low, stable inflation rate may havebeen key in spurring subsequent aggressive reduc-tions in the FOMC’s intended federal funds rate targetafter the onset of the recession in 2001.
30 SEPTEMBER/OCTOBER 2003
Kliesen R E V I E W
Current-Quarter Forecasts and Forecast Errors for Major NIPA Series
2000:Q1 2000:Q2 2000:Q3 2000:Q4 2001:Q1 2001:Q2 2001:Q3 2001:Q4 2002:Q1
Real GDP
Current-quarter 3.9 4.1 2.9 2.9 0.7 1.0 1.6 –1.3 2.6forecast
Real-time estimate 5.4 5.3 2.4 1.1 1.3 0.2 –1.1 1.4 5.6
Current-quarter error –1.5 –1.2 0.5 1.8 –0.6 0.8 2.7 –2.7 –3.0
Current-quarter –1.5 –2.7 –2.2 –0.4 –1.0 –0.2 2.5 –0.2 –3.2cumulative error
Real PCE
Current-quarter 4.8 3.8 3.5 3.3 2.1 1.7 2.4 1.9 1.0forecast
Real-time estimate 7.5 2.9 4.5 2.8 2.9 2.5 1.1 6.0 3.2
Current-quarter error –2.7 0.9 –1.0 0.5 –0.8 –0.8 1.3 –4.1 –2.2
Current-quarter –2.7 –1.8 –2.8 –2.3 –3.1 –3.9 –2.6 –6.7 –8.9cumulative error
Real BFI
Current-quarter 11.5 7.1 13.0 9.3 3.3 –6.0 –6.5 –16.5 –0.4forecast
Real-time estimate 25.2 14.6 7.8 –0.6 2.1 –14.6 –9.3 –13.1 –8.2
Current-quarter error –13.7 –7.5 5.2 9.9 1.2 8.6 2.8 –3.4 7.8
Current-quarter –13.7 –21.2 –16.0 –6.1 –4.9 3.7 6.5 3.1 10.9cumulative error
Real RFI
Current-quarter 10.0 1.5 –13.2 –2.9 –6.2 –0.3 –3.3 –8.1 –2.0forecast
Real-time estimate 5.2 0.0 –10.5 –3.4 2.9 5.8 2.5 –5.0 14.6
Current-quarter error 4.8 1.5 –2.7 0.5 –9.1 –6.1 –5.8 –3.1 –16.6
Current-quarter 4.8 6.3 3.6 4.1 –5.0 –11.1 –16.9 –20.0 –36.6cumulative error
Table 4
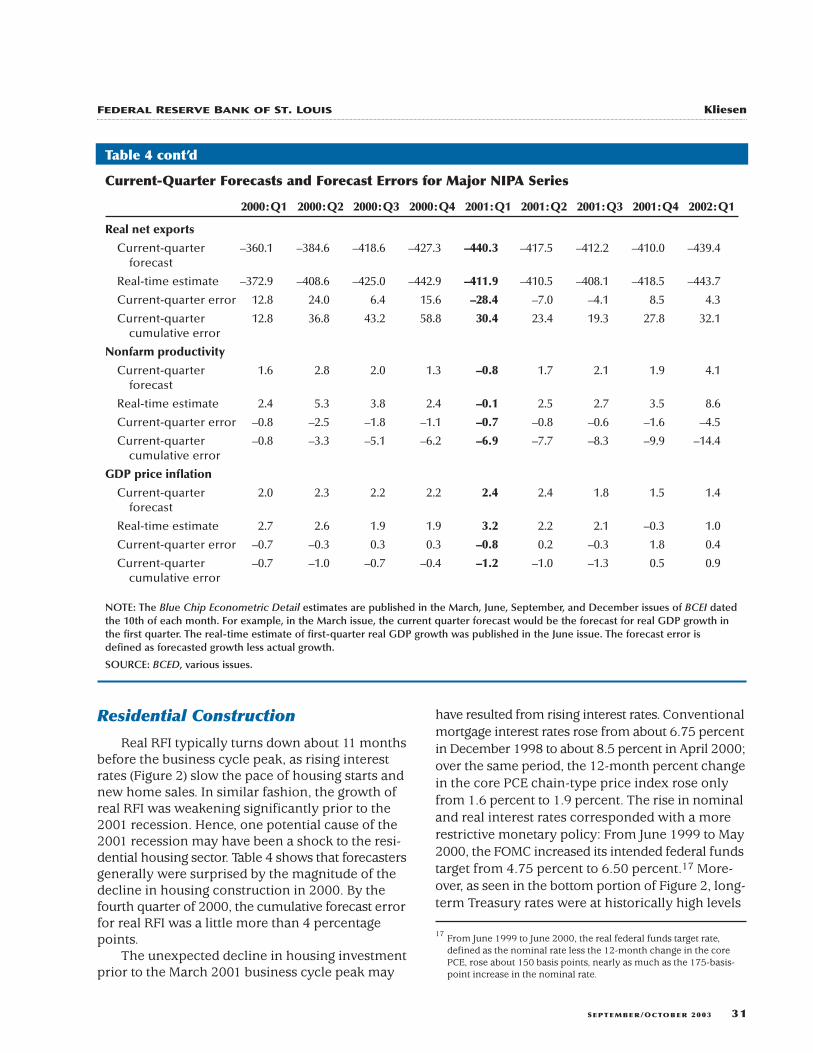
Residential Construction
Real RFI typically turns down about 11 monthsbefore the business cycle peak, as rising interestrates (Figure 2) slow the pace of housing starts andnew home sales. In similar fashion, the growth ofreal RFI was weakening significantly prior to the2001 recession. Hence, one potential cause of the2001 recession may have been a shock to the resi-dential housing sector. Table 4 shows that forecastersgenerally were surprised by the magnitude of thedecline in housing construction in 2000. By thefourth quarter of 2000, the cumulative forecast errorfor real RFI was a little more than 4 percentagepoints.
The unexpected decline in housing investmentprior to the March 2001 business cycle peak may
have resulted from rising interest rates. Conventionalmortgage interest rates rose from about 6.75 percentin December 1998 to about 8.5 percent in April 2000;over the same period, the 12-month percent changein the core PCE chain-type price index rose onlyfrom 1.6 percent to 1.9 percent. The rise in nominaland real interest rates corresponded with a morerestrictive monetary policy: From June 1999 to May2000, the FOMC increased its intended federal fundstarget from 4.75 percent to 6.50 percent.17 More-over, as seen in the bottom portion of Figure 2, long-term Treasury rates were at historically high levels
SEPTEMBER/OCTOBER 2003 31
FEDERAL RESERVE BANK OF ST. LOUIS Kliesen
Current-Quarter Forecasts and Forecast Errors for Major NIPA Series
2000:Q1 2000:Q2 2000:Q3 2000:Q4 2001:Q1 2001:Q2 2001:Q3 2001:Q4 2002:Q1
Real net exports
Current-quarter –360.1 –384.6 –418.6 –427.3 –440.3 –417.5 –412.2 –410.0 –439.4forecast
Real-time estimate –372.9 –408.6 –425.0 –442.9 –411.9 –410.5 –408.1 –418.5 –443.7
Current-quarter error 12.8 24.0 6.4 15.6 –28.4 –7.0 –4.1 8.5 4.3
Current-quarter 12.8 36.8 43.2 58.8 30.4 23.4 19.3 27.8 32.1cumulative error
Nonfarm productivity
Current-quarter 1.6 2.8 2.0 1.3 –0.8 1.7 2.1 1.9 4.1forecast
Real-time estimate 2.4 5.3 3.8 2.4 –0.1 2.5 2.7 3.5 8.6
Current-quarter error –0.8 –2.5 –1.8 –1.1 –0.7 –0.8 –0.6 –1.6 –4.5
Current-quarter –0.8 –3.3 –5.1 –6.2 –6.9 –7.7 –8.3 –9.9 –14.4cumulative error
GDP price inflation
Current-quarter 2.0 2.3 2.2 2.2 2.4 2.4 1.8 1.5 1.4forecast
Real-time estimate 2.7 2.6 1.9 1.9 3.2 2.2 2.1 –0.3 1.0
Current-quarter error –0.7 –0.3 0.3 0.3 –0.8 0.2 –0.3 1.8 0.4
Current-quarter –0.7 –1.0 –0.7 –0.4 –1.2 –1.0 –1.3 0.5 0.9cumulative error
NOTE: The Blue Chip Econometric Detail estimates are published in the March, June, September, and December issues of BCEI datedthe 10th of each month. For example, in the March issue, the current quarter forecast would be the forecast for real GDP growth inthe first quarter. The real-time estimate of first-quarter real GDP growth was published in the June issue. The forecast error isdefined as forecasted growth less actual growth.
SOURCE: BCED, various issues.
Table 4 cont’d
17 From June 1999 to June 2000, the real federal funds target rate,defined as the nominal rate less the 12-month change in the corePCE, rose about 150 basis points, nearly as much as the 175-basis-point increase in the nominal rate.

(relative to previous postwar periods) prior to the2001 business cycle peak.
Ironically, an unexpected decline in RFI mayhave helped trigger the onset of the recession; italso was an important factor tempering the severityof the 2001 recession. This can be seen in Table 4as an abrupt switch from cumulative positive fore-cast errors for RFI growth to large cumulative neg-ative forecast errors. In contrast with the typicalpattern of growth after the business cycle peak, RFI
strengthened in late 2000 and into the first twoquarters of the recession. Referring back to Figure 2helps to explain why. Yields on 10-year governmentsecurities usually top out about one month after thepeak, but this time long-term rates peaked 10 monthsbefore the March 2001 business cycle peak. Withmortgage interest rates also falling sharply, and realincome growth remaining relatively strong (seeTable 2), the housing sector benefited significantly.
32 SEPTEMBER/OCTOBER 2003
Kliesen R E V I E W
2030405060708090
100110120130140150
–12 –11 –10 –9 –8 –7 –6 –5 –4 –3 –2 –1 0 1 2 3 4 5 6 7 8 9 10 11 12Months Around Peak
High Low Historical Average (Post WWII) Current Episode
Movements of Short- and Long-Term Interest Rates During the 2001 Recession Relative to Previous Post-World War II Recessions
3-Month Treasury Bill Rate
Figure 2
10-Year Treasury Bond Rate
65
75
85
95
105
115
125
135
–12 –11 –10 –9 –8 –7 –6 –5 –4 –3 –2 –1 0 1 2 3 4 5 6 7 8 9 10 11 12
Months Around Peak
Long-term composite rate from Jan. 1947 toMarch 1953; 10-year constant maturity rate from April 1953 to present.
High Low Historical Average (Post-WWII) Current Episode
NOTE: The range of previous cycles denoted by the shaded areas excludes the 2001recession and recovery.

International Trade
Another factor that may have helped push theeconomy into a recession was an unexpected declinein real net exports. During the 2001 recession, asseen in Table 2, real exports of goods and servicesfell about 10 percent, which was substantially largerthan the average post-World War II recession declineof roughly 0.75 percent. There were two factorsworking against U.S. exports leading up to the reces-sion. The first of these was an appreciation of thetrade-weighted value of the U.S. dollar. After fallingnearly 5 percent from August 1998 to August 1999,the real value of the U.S. dollar began to rise shortlythereafter.18 By October 2000, the dollar was upnearly 13 percent from a year earlier. In addition toa price effect (an appreciation of the trade-weightedvalue of the dollar), growth of U.S. exports wastempered by a worldwide slowdown in economicactivity, as world output growth slowed from 4.7percent in 2000 to 2.3 percent in 2001.19 The declinein exports during the 2001 recession relative to1998-2000 was most pronounced in non-automotivecapital goods and consumer goods and travel andtransportation services. The largest percentage-pointdeclines in U.S. real exports were generally for thosedestined for Asia: South Korea (–58.4 percent), Taiwan(–37.3 percent), and Japan (–37.1 percent).
Table 4 shows that the Blue Chip forecastingmodel (BCED) significantly underestimated thedecline in real net exports during 2000. In realdollars, the average quarterly error was about $15billion, or about 3.5 percent of the average valueof real net exports over these four quarters.20 Thecurrent-quarter cumulative forecast error was nearly$59 billion, or a little more than 14 percent of theaverage forecasted value of real net exports overthese four quarters—although the Blue Chip modelsubsequently over-predicted the decline in real netexports during the recession.
Business Investment
Swings in business inventories typically accountfor a large percentage of the decline in output during
a recession. As with most downturns, an unintendedaccumulation of business inventories relative tosales also preceded the 2001 recession. What wasdifferent this time is that the imbalance betweeninventories and sales was outside the range of pre-vious downturns. As seen in Table 2, the peak-to-trough decline in real private inventory investmentwas 3.6 percent, which surpassed the previous largestdecline of 3.2 percent seen during the 1948-49 reces-sion. But since forecasters were generally surprisedby the strength of consumer spending during therecession, it appears that the decline in businessinventories may have been more of a reflection offaster-than-expected growth of household expen-ditures (unexpectedly drawing down inventories)rather than planned reductions in inventories thatfiltered back into production cuts at manufacturers.However, it is also clear that the response toSeptember 11 by automotive manufacturers led toa sizable decline in auto inventories in the fourthquarter of 2001.21
The largest component of business investmentis fixed investment (expenditures on capital goodsand structures). BFI is also one of the most volatileindicators of business activity, and it usually accountsfor a large percentage of the decline in output duringthe average recession. Table 2 shows that the 2001recession was fairly typical in terms of businesscapital spending. For example, real BFI fell 8 percentin the 2001 recession, only modestly more thanthe average downturn (7.6 percent). Although thedecline in real equipment and software expendi-tures (7.3 percent) was somewhat smaller thanaverage (9.7 percent), the decline in business struc-tures (9.9 percent) was significantly larger thanaverage (4.3 percent).
The pattern of BFI spending before the businesscycle peak was consistent with previous episodes inthat, on average, growth of BFI turns negative aboutone quarter prior to the peak. As seen in Table 4,this was true prior to the 2001 recession. But asFigure 3 shows, this only held true for businessexpenditures on information processing equipmentand software (hereafter high-tech equipment).Business investment in commercial structures andindustrial equipment reached its peak concurrentwith the NBER-dated business cycle peak; on theother hand, spending on transportation equipment
SEPTEMBER/OCTOBER 2003 33
21 The real change in private inventories was –$98.4 billion in the fourthquarter of 2001. Of this, $33.5 billion was attributed to the change inreal private automotive inventories.
FEDERAL RESERVE BANK OF ST. LOUIS Kliesen
18 This refers to the Federal Reserve Board’s trade-weighted major cur-rency index. The U.S. dollar is measured against currencies of the euroarea (12 countries) and 6 additional countries. The real value uses theforeign consumer price indices to deflate the spot exchange rates.
19 International Monetary Fund (2003).
20 The percentage error for real net exports is the current-quarter errordivided by the actual value for that quarter.

34 SEPTEMBER/OCTOBER 2003
Kliesen R E V I E W
0.00
0.20
0.40
0.60
0.80
1.00
1.20
1.40
1.60
Jan98
May98
Sep98
Jan99
May99
Sep99
Jan00
May00
Sep00
Jan01
May01
Sep01
Jan02
May02
Sep02
Jan03
Business Cycle Peak: March 2001(2001:Q1)
Components of Real Business Fixed InvestmentIndex, 1998:Q1 = 1.0
Figure 3
0.00
0.20
0.40
0.60
0.80
1.00
1.20
1.40
1.60
Jan98
May98
Sep98
Jan99
May99
Sep99
Jan00
May00
Sep00
Jan01
May01
Sep01
Jan02
May02
Sep02
Jan03
Information Processing Equipment Industrial Equipment Transportation Equipment
Industrial Structures Commercial Structures
Business Cycle Peak: March 2001(2001:Q1)

peaked much earlier (1999:Q3) and industrialstructures, although rebounding modestly from2000:Q2 through 2001:Q1, remained below its levelseen three years earlier. The weakness in businesscommercial structures may have been exacerbatedby overbuilding. In the third quarter of 2000, thenational commercial office vacancy rate (firstreported in 1986:Q1) fell to a record low of 7.7 per-cent, while vacancy rates for industrial structureswere little changed since the start of the businessexpansion in March 1991 (averaging around 8 per-cent). By 2003:Q1, the commercial vacancy rate hadrisen to a nine-year high of 16.4 percent and realfixed investment in commercial structures continuedto decline.22
Table 4 shows that Blue Chip forecasters signifi-cantly under-predicted the strength of real BFI overthe first half of 2000: The forecast error over thistwo-quarter period averaged 10.6 percentage points.Hence, perhaps the most significant shock that ledto the 2001 recession was the unexpected declinein real BFI. Although the pace of BFI growth wasclearly slowing, forecasters responded to these largenegative errors by raising their projected growthover the second half of 2001. The result was theopposite: relatively large positive errors. Althoughfairly sizable negative cumulative forecast errorscontinued into 2001:Q1, the persistent overestima-tion by forecasters of the strength of BFI spendingcaused these cumulative errors to become signifi-cantly positive by 2002:Q1. It thus appears thatforecasters were surprised not only by the suddendecline in BFI, but by the persistence of the decline.
One factor that may have spurred tremendousgrowth of business expenditures on commercialstructures and real information processing equip-ment and software late in the expansion was thesharp rise in equity prices, which lowered the costof capital to firms.23 Presumably, the converse holds
as well: Declines in equity prices raise the cost ofcapital and slow the growth of capital expenditures.Thus, although equity prices topped off well beforethe peak in high-tech or commercial structures,falling stock prices beginning in 2000 probablycaused firms to reassess the feasibility of manyplanned outlays and, ultimately, delay or cancelseveral projects.24 This is consistent with the growthof real BFI after the first quarter of 2000. Evidently,falling long-term rates were not a significant enoughinducement to cause firms to increase planned out-lays (see Figure 2). Hence, the timing of the declinesin real BFI and the Nasdaq stock price index suggestssome causation—if one believes the aforementionedcost-of-capital story that helped fuel the investmentboom. It is also consistent with the timing of thelarge positive fixed investment forecast errors overthe second half of 2000.
For computer equipment and software, anadditional factor might have been precautionarycapital expenditures by firms to eliminate Y2K com-puter glitches. But the largest potential Y2K-relatedinvestment contribution to real GDP growth probablyoccurred during the 1997-99 period, when expendi-tures on these goods were estimated to have con-tributed about 0.37 percentage points to real outputgrowth, whereas total high-tech expenditures contin-ued to increase strongly into the first half of 2000.25
Productivity and Prices
As seen in Table 2, nonfarm labor productivityrose 2.2 percent, more than a percentage pointfaster than during the average postwar recession.Strong labor productivity growth also helped to keepreal disposable personal income growth positiveduring the recession (0.37 percent), rather thandeclining slightly as is typically the case. Hence,helping to underpin the strength of real consumerspending during the recession was relatively stronggrowth of nonfarm labor productivity. Table 4 showsthat the relatively strong labor productivity growthwas quite a surprise to forecasters. Over this nine-quarter period, forecasters underestimated quarterlylabor productivity growth rates in each quarter. By2002:Q1 the cumulative forecast error was 14.4percentage points, an average of 1.6 percentagepoints per quarter. Recent empirical work on the
SEPTEMBER/OCTOBER 2003 35
24 The Nasdaq and S&P 500 reached a peak in the first quarter of 2000;the Wilshire 5000 peaked in the third quarter of 2000.
25 See Kliesen (2003).
FEDERAL RESERVE BANK OF ST. LOUIS Kliesen
22 The source for the national industrial vacancy rate is CB Richard Ellis;this measure of industrial vacancy rates begins in the first quarter of1981.
23 Caballero and Hammour (2002) argue that the rapid increase in stockprices in the latter part of the 1990s arose in part from the “emerginginformation technology sector” (investment boom) and the onset offiscal surpluses. They argue that the fiscal surpluses may have arisenfrom the stock market boom and also helped fuel further investmentby increasing aggregate saving. Tevlin and Whelan (2003) find thataccelerated rates of depreciation and rapid rates of declines for pricesof equipment explain much of the high-tech investment boom in the1990s. They also argue that conventional models that do not use adisaggregated approach (high-tech and non-high-tech investment)thus could not account for the boom—nor, presumably, the bust.
sources of this productivity shock suggests muchof it stemmed from the high-tech investment boomof the 1990s.26
Faster than expected productivity growth alsohelped to minimize growth of unit labor costs andaggregate inflation pressures. Although forecasterswere surprised by the persistence of strong produc-tivity growth, their inflation forecast errors weremuch smaller: From 2000:Q1 to 2002:Q1, the cumu-lative GDP inflation forecast error was 0.9 percentagepoints, or about zero when averaged over this period.By contrast, the cumulative real GDP forecast errorwas –3.2 percentage points.
CONCLUSION
When viewed across the expanse of post-World War II recessions, the 2001 recession wasboth relatively mild and of comparatively shortduration. The 2001 recession and recovery was alsounusual in several respects. First, in contrast to thetypical downturn, spending on consumer durablegoods and new residential housing continued to growthroughout the recession. The strength of theserelatively interest-sensitive sectors reflected thesteep declines in short- and long-term interest ratesthat started well before the onset of the recession—another distinguishing difference. Second, the 2001recession was also notable for the sharp decline inexports and business investment in structures andinventories. Further, the declines in business capitalspending were probably magnified by the sharpdeclines in equity prices during the recession, whichhelped to raise firms’ financial cost of capital.
Identifying a cause of the recession is difficult.Using real-time forecast errors from MacroeconomicAdvisers’ forecasting model, which incorporatesthe Blue Chip Consensus forecast, it appears thatshocks to investment by businesses and householdswere important factors. Another significant factorappears to be the unexpected declines in real netexports in 2000, which likely exacerbated the shockto the capital goods sector. Offsetting these shockswere unexpectedly large increases in labor produc-tivity growth. This productivity shock helped to keepgrowth of real disposable income at an elevated rateduring the recession.
REFERENCES
Allyn, Maureen F. “NABE Outlook Panel: America Is on theThreshold of Sustained Recovery.” National Associationfor Business Economics Outlook, February 2002.
Balke, Nathan S. and Wynne, Mark A. “Are Deep RecessionsFollowed by Strong Recoveries? Results for the G-7Countries.” Applied Economics, July 1996, 28(7), pp. 889-97.
Blanchard, Olivier J. “Consumption and the Recession of1990-1991.” American Economic Review, May 1993, 83(2),pp. 270-74 (Papers and Proceedings of the 105th AnnualMeeting of the American Economic Association).
Boldin, Michael D. “Dating Turning Points in the BusinessCycle.” The Journal of Business, January 1994, 67(1), pp.97-131.
Caballero, Ricardo J. and Hammour, Mohamad L.“Speculative Growth.” NBER Working Paper No. w9381,National Bureau of Economic Research, December 2002.
Chauvet, Marcelle and Piger, Jeremy M. “IdentifyingBusiness Cycle Turning Points in Real Time.” FederalReserve Bank of St. Louis Review, March/April 2003,85(2), pp. 47-61.
Fixler, Dennis J. and Grimm, Bruce T. “Revisions, Rationality,and Turning Points in GDP.” Presented at the 115th AnnualMeeting of the American Economic Association, “Trackingthe Turning Points in the Economy.” Washington, DC: 3-5January 2003.
Friedman, Milton. “Monetary Studies of the NationalBureau,” in The National Bureau Enters Its 45th Year,44th Annual Report of the National Bureau of EconomicResearch, 1964, pp. 7-25.
Fuhrer, Jeffrey C. and Schuh, Scott. “Beyond Shocks: WhatCauses Business Cycles? An Overview.” Presented at the42nd Annual Economic Conference of the Federal ReserveBank of Boston, 1998.
Hall, Robert E. “Macro Theory and the Recession of 1990-1991.” American Economic Review, May 1993, 83(2), pp.275-79 (Papers and Proceedings of the 105th AnnualMeeting of the American Economic Association).
Hamilton, James D. “A New Approach to the EconomicAnalysis of Nonstationary Time Series and the BusinessCycle.” Econometrica, March 1989, 57(2), pp. 357-84.
36 SEPTEMBER/OCTOBER 2003
Kliesen R E V I E W
26 See Jorgenson, Ho, and Stiroh (2002) and Oliner and Sichel (2002).

Hansen, Gary D. and Prescott, Edward C. “Did TechnologyShocks Cause the 1990-1991 Recession?” AmericanEconomic Review, May 1993, 83(2), pp. 280-86 (Papersand Proceedings of the 105th Annual Meeting of theAmerican Economic Association).
International Monetary Fund. World Economic Outlook:Growth and Institutions. Washington, DC: April 2003.
Jorgenson, Dale W.; Ho, Mun S. and Stiroh, Kevin J.“Projecting Productivity Growth: Lessons from the U.S.Growth Resurgence.” Federal Reserve Bank of AtlantaEconomic Review, Third Quarter 2002, 87(3), pp. 1-13.
Kliesen, Kevin L. “Was Y2K Behind the Business InvestmentBoom and Bust?” Federal Reserve Bank of St. Louis Review,January/February 2003, 85(1), pp. 31-42.
Koenig, Evan F.; Siems, Thomas F. and Wynne, Mark A.“New Economy, New Recession.” Federal Reserve Bankof Dallas Southwest Economy, March/April 2002, 0(2),pp. 11-16.
Lansing, Kevin J. “Growth in the Post-Bubble Economy.”Federal Reserve Bank of San Francisco Economic Letter,No. 2003-17, 20 June 2003.
Nordhaus, William D. “Puzzles About the AmericanEconomy in the Current Recession and Recovery.”Unpublished manuscript, Yale University, 15 April 2002.
Oliner, Stephen D. and Sichel, Daniel E. “InformationTechnology and Productivity: Where Are We Now andWhere Are We Going?” Federal Reserve Bank of AtlantaEconomic Review, Third Quarter 2002, 87(3), pp. 15-44.
Taylor, John B. “Monetary Policy and the Long Boom.”Federal Reserve Bank of St. Louis Review, November/December 1998, 80(6), pp. 3-11.
Tevlin, Stacey and Whelan, Karl. “Explaining the InvestmentBoom of the 1990s.” Journal of Money, Credit, and Banking,February 2003, 35(1), pp. 1-22.
Walsh, Carl E. “What Caused the 1990-1991 Recession?”Federal Reserve Bank of San Francisco Economic Review,1993, 0(1), pp. 33-48.
Zarnowitz, Victor. “Business Cycles: Theory, History,Indicators, and Forecasting,” in NBER Studies in BusinessCycles. Volume 27. Chicago: University of Chicago Press,1992, pp. 77-124
SEPTEMBER/OCTOBER 2003 37
FEDERAL RESERVE BANK OF ST. LOUIS Kliesen

38 SEPTEMBER/OCTOBER 2003
Kliesen R E V I E W
Related Documents