Journal of Seismology 4: 401–414, 2000. © 2000 Kluwer Academic Publishers. Printed in the Netherlands. 401 The 1997 Umbria-Marche (Italy) earthquake sequence: analysis of the data recorded by the local and temporary networks M. Cattaneo 1* , P. Augliera 1,2 , G. De Luca 3 , A. Gorini 4 , A. Govoni 5 , S. Marcucci 4 , A. Michelini 5 , G. Monachesi 6 , D. Spallarossa 1,2 , L. Trojani 6 & XGUMS 1 Dipartimento Scienze della Terra, Universit` a di Genova, Viale Benedetto XV, 5, 16132 Genova; 2 GNDT-CNR, Via Nizza 128, 00198 Roma; 3 Dipartimento di Fisica, Universit` a dell’Aquila, Via Vetoio, 67010 Coppito di L’Aquila; 4 Servizio Sismico Nazionale, Via Curtatone 3, 00185 Roma; 5 Osservatorio Geofisico Sperimentale, Trieste, P.O. Box 2011, 34016 Trieste; 6 Osservatorio Geofisico Sperimentale, Macerata, Viale Indipendenza 180, 62100 Macerata; XGUMS = eXperimental Group for Umbria-Marche Seismicity; * Present address: ING, Via di Vigna Murata, 605, 00143 Rome, Italy; e-mail: [email protected] Received 9 March 1999; accepted in revised form 7 February 2000 Key words: Aftershocks distribution, Apennines, earthquake location, propagation models, seismic sequences Abstract We present some preliminary results obtained from the joined analysis of the data collected by the permanent and the temporary networks operating in the area of the earthquake sequence that followed (and anticipated) the 26 September, Central Italy, main shocks. In particular, these earthquake data have allowed us to determine a well constrained wave-velocity model (both P and S) with station corrections which demonstrated to produce robust hypocentral locations. These velocity models with station corrections have been used for re-locating the whole September 1997–July 1998 subset of data of the permanent network, and the previous background seismicity, starting from May 1996. The focal mechanisms of the largest events were also obtained from an analysis of the first-motion polarities. Our results indicate that 1) the seismic activity aligns on a SE-NW trend for a total length of about 50 km of extension; 2) the focal depth of these events is restricted to the range 0–9 km; 3) most events can be related to sub-parallel SW dipping fault planes; 4) focal mechanisms of the largest shocks (M L > 4) show a coherent behaviour, with normal fault solution on SSE-NNW striking, SW dipping planes; 5) the space-time evolution of the activity displays a discontinuous mode of energy release, with different episodes of activation and an apparent clustering of aftershocks at the edges of the areas which presumably ruptured in the main shocks. Introduction Starting on September 3, 1997, 22:07 UTC, a long sequence of seismic events occurred in Central Italy, at the regional border between Umbria and Marche. Details on the first part of the sequence, as located by the national seismic network and the data of one of the dense temporary networks installed in the area, can be found in Amato et al. (1998). In this area, however, three regional networks of digital seismic stations have been operating independently for a number of years and, in the second part of the 1997 earthquake se- quence, an additional, dense, temporary network was installed in the southern part of the epicentral area. The analysis presented here exploits the potentials that a merged data set of this kind can offer, especially for what concerns the relocation of all the earthquakes throughout time-an important aspect to improve our knowledge on the seismotectonics of the area. A de- scription of the temporary network employed here is provided by Michelini et al. (this volume) together with an account on the geology of the area. It follows that in this paper we make an attempt to complement and use the data of the permanent and temporary networks jointly. First, we have used some earthquakes well located by the dense temporary net- work, and also recorded by the regional permanent

Welcome message from author
This document is posted to help you gain knowledge. Please leave a comment to let me know what you think about it! Share it to your friends and learn new things together.
Transcript
Journal of Seismology4: 401–414, 2000.© 2000Kluwer Academic Publishers. Printed in the Netherlands.
401
The 1997 Umbria-Marche (Italy) earthquake sequence: analysis of thedata recorded by the local and temporary networks
M. Cattaneo1∗, P. Augliera1,2, G. De Luca3, A. Gorini4, A. Govoni5, S. Marcucci4,A. Michelini5, G. Monachesi6, D. Spallarossa1,2, L. Trojani6 & XGUMS1Dipartimento Scienze della Terra, Universit`a di Genova, Viale Benedetto XV, 5, 16132 Genova;2GNDT-CNR,Via Nizza 128, 00198 Roma;3Dipartimento di Fisica, Universit`a dell’Aquila, Via Vetoio, 67010 Coppito diL’Aquila; 4Servizio Sismico Nazionale, Via Curtatone 3, 00185 Roma;5Osservatorio Geofisico Sperimentale,Trieste, P.O. Box 2011, 34016 Trieste;6Osservatorio Geofisico Sperimentale, Macerata, Viale Indipendenza 180,62100 Macerata; XGUMS = eXperimental Group for Umbria-Marche Seismicity;∗Present address: ING, Via diVigna Murata, 605, 00143 Rome, Italy; e-mail: [email protected]
Received 9 March 1999; accepted in revised form 7 February 2000
Key words:Aftershocks distribution, Apennines, earthquake location, propagation models, seismic sequences
Abstract
We present some preliminary results obtained from the joined analysis of the data collected by the permanent andthe temporary networks operating in the area of the earthquake sequence that followed (and anticipated) the 26September, Central Italy, main shocks. In particular, these earthquake data have allowed us to determine a wellconstrained wave-velocity model (both P and S) with station corrections which demonstrated to produce robusthypocentral locations. These velocity models with station corrections have been used for re-locating the wholeSeptember 1997–July 1998 subset of data of the permanent network, and the previous background seismicity,starting from May 1996. The focal mechanisms of the largest events were also obtained from an analysis of thefirst-motion polarities. Our results indicate that 1) the seismic activity aligns on a SE-NW trend for a total lengthof about 50 km of extension; 2) the focal depth of these events is restricted to the range 0–9 km; 3) most eventscan be related to sub-parallel SW dipping fault planes; 4) focal mechanisms of the largest shocks (ML > 4) showa coherent behaviour, with normal fault solution on SSE-NNW striking, SW dipping planes; 5) the space-timeevolution of the activity displays a discontinuous mode of energy release, with different episodes of activation andan apparent clustering of aftershocks at the edges of the areas which presumably ruptured in the main shocks.
Introduction
Starting on September 3, 1997, 22:07 UTC, a longsequence of seismic events occurred in Central Italy,at the regional border between Umbria and Marche.Details on the first part of the sequence, as located bythe national seismic network and the data of one of thedense temporary networks installed in the area, canbe found in Amato et al. (1998). In this area, however,three regional networks of digital seismic stations havebeen operating independently for a number of yearsand, in the second part of the 1997 earthquake se-quence, an additional, dense, temporary network wasinstalled in the southern part of the epicentral area. The
analysis presented here exploits the potentials that amerged data set of this kind can offer, especially forwhat concerns the relocation of all the earthquakesthroughout time-an important aspect to improve ourknowledge on the seismotectonics of the area. A de-scription of the temporary network employed here isprovided by Michelini et al. (this volume) togetherwith an account on the geology of the area.
It follows that in this paper we make an attemptto complement and use the data of the permanent andtemporary networks jointly. First, we have used someearthquakes well located by the dense temporary net-work, and also recorded by the regional permanent
402
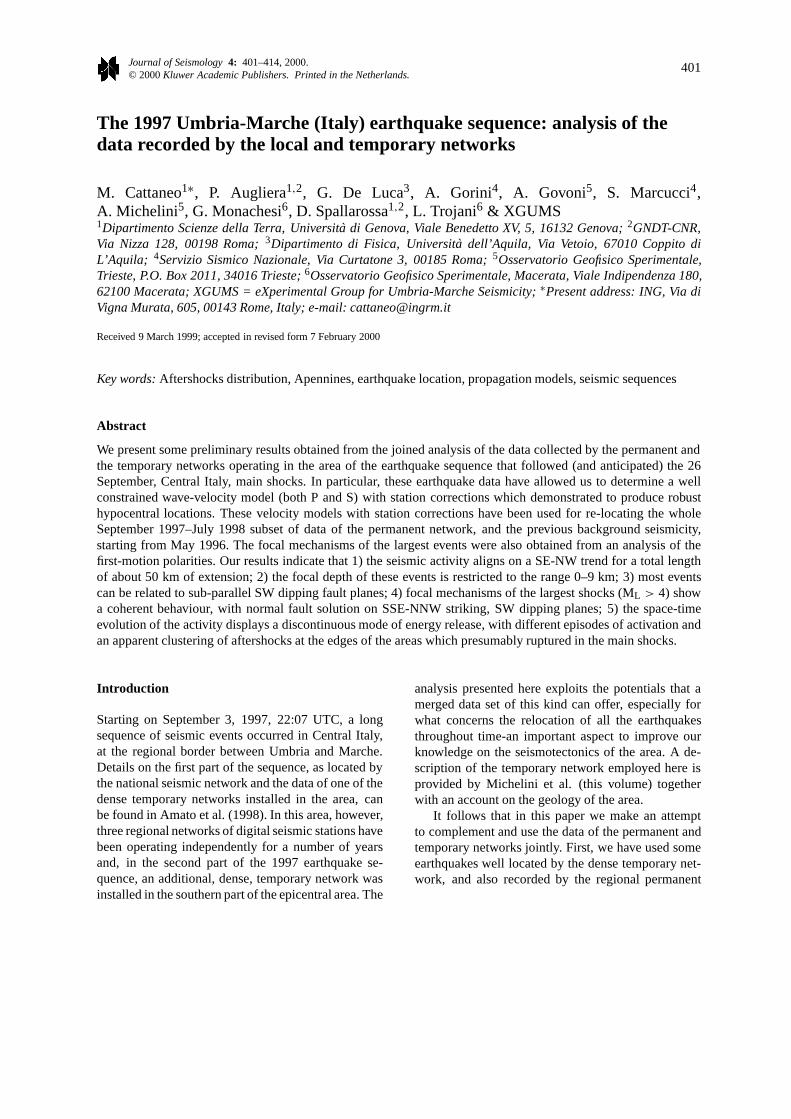
Figure 1. Network geometry and epicenters of the events used for the propagation model analysis. Squares: permanent network. Triangles:temporary network. Diamonds: strong motion stations.
networks, to construct an ‘ad hoc’ seismic propaga-tion model. This model is used in the second part ofthis study to relocate the earthquakes recorded in thoseperiods of time when only the data from the permanentnetworks are available. At last, we describe the meanfeatures of the whole sequence as obtained with thisdata set.
Data
Since the end of 1991 the Servizio Sismico Nazionale(SSN) started a program aimed at improving andhomogenising the seismic monitoring in the centralApennines, with the deployment of three componentdigital stations in Abruzzo and, since 1996, in Umbriaand Marche. At the moment the network covers themajority of the seismogenetic areas of a large region
which extends from the northern part of Umbria andMarche to the central part of Abruzzo. The networkconsists of 40 stations equipped with 20-bit digitaldata loggers (Lennartz Mars88-FD) and three com-ponent short period sensors (Mark L4C-3D) having amean station spacing of approximately 25 km. Owingto the set-up of the instrumentation, the network op-erates on the basis of autonomous event detection anddata storage at each station, and off-line data retrievalon magnetic devices. The network is managed by dif-ferent local institutions which are in charge of stationmaintenance and data collection. The local institutionsare: the ‘Osservatorio Geofisico Sperimentale’, Ma-cerata, for the Marche region; the ‘Dipartimento diFisica’ of the ‘Università dell’Aquila’ for Abruzzo andthe ‘Regione Umbria – Osservatorio Sismico A. Bina’,Perugia, for the Umbria region.
403
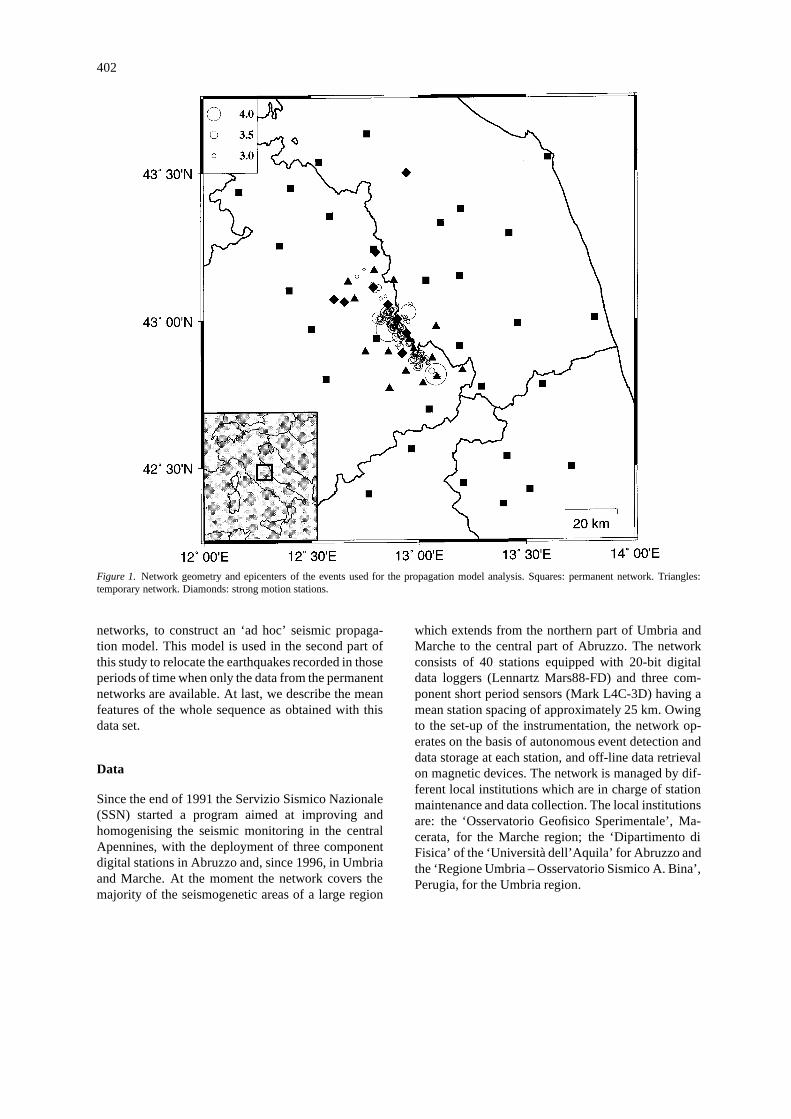
Figure 2. P wave residual times vs. distance for different networks. Symbols are relevant to the different stations.
During the 1997 Umbria-Marche earthquake se-quence, the network operated regularly but, owing tothe very high rate of seismicity and to the relativelylow memory capacity of the data loggers, some loss ofdata occurred mainly between the two mainshocks ofSeptember 26.
During the evolution of the seismic sequence, theSSN (Servizio Sismico Nazionale) and a pool of in-stitutions sponsored by the CNR-GNDT (ConsiglioNazionale delle Ricerche – Gruppo Nazionale per laDifesa dai Terremoti) installed some digital seismic
stations, in an effort to improve the coverage of thetemporary network of 26 stations deployed imme-diately after the beginning of the seismic sequenceby ING, Geosciences Azur – Nice and Università diCamerino (Amato et al., 1998). Details on the install-ation and the first results of this GNDT experimentcan be found in Michelini et al. (this volume). Alsosome accelerographic stations, GPS clock synchron-ised, were installed in the epicentral area by the SSNand provided additional data for earthquakes location.
404
In summary, the data set analysed in this paper in-cludes that of the 40 permanent stations, operating forthe whole sequence, of the 15 temporary stations forthe period Oct. 18–Nov. 3, 1997 (5 of them, however,were working since September 29), and of 12 strongmotion stations, for the period Oct. 3 1997–May 1999.A map of the network geometry is reported in Figure 1.
Among the 600+ earthquakes located by the tem-porary network in the period Oct. 18–Nov. 3 1997, 106were also well recorded by the regional networks andthis subset of data will be analysed in the next section.The epicentral location of these events, as obtainedusing the temporary stations, is reported in Figure 1,together with the network geometry.
Propagation models
The location of very shallow earthquakes obtainedfrom the data of a sparse network such as ours is proneto become unstable. This behaviour is enhanced whenthe data are provided by stations triggered locally,which does not insure the same acquisition geometryfor all the events. The deriving location uncertain-ties can be reduced by adopting well-calibrated, 3-Dheterogeneous, seismic propagation models or by us-ing well constrain 1-D models with well determinedstation residual corrections.
In our analysis, we have pursued the second altern-ative above and we have assumed that the locationsobtained solely from the dense temporary network arecorrect. Obviously, these locations are also affectedby errors-the estimated mean erh is 0.2 km, whilethe mean erz is 0.5 km-but these values should beconsidered negligible when compared to the expectederrors for locations obtained from the analysis of thedata of the regional network. Therefore, on the basisof these locations, we have determined the averagemean station corrections for the 40-station permanentnetwork. To this purpose, we have started from the 1-Dmodel determined from the data of the temporary net-work (Michelini et al., this volume), which is very wellconstrained for the shallow layers, and complementedwith DSS profiles information (Ponziani et al., 1995),to produce a suitable starting model for our analysis.In fact, the availability of well-constrained locationsand of a reliable 1-D propagation model allowed us toobtain travel time residuals that are just due to the in-adequacy of our models (besides some possible casesof mis-picking). To this regard, Figure 2 shows that itis difficult to find any significant correlation between
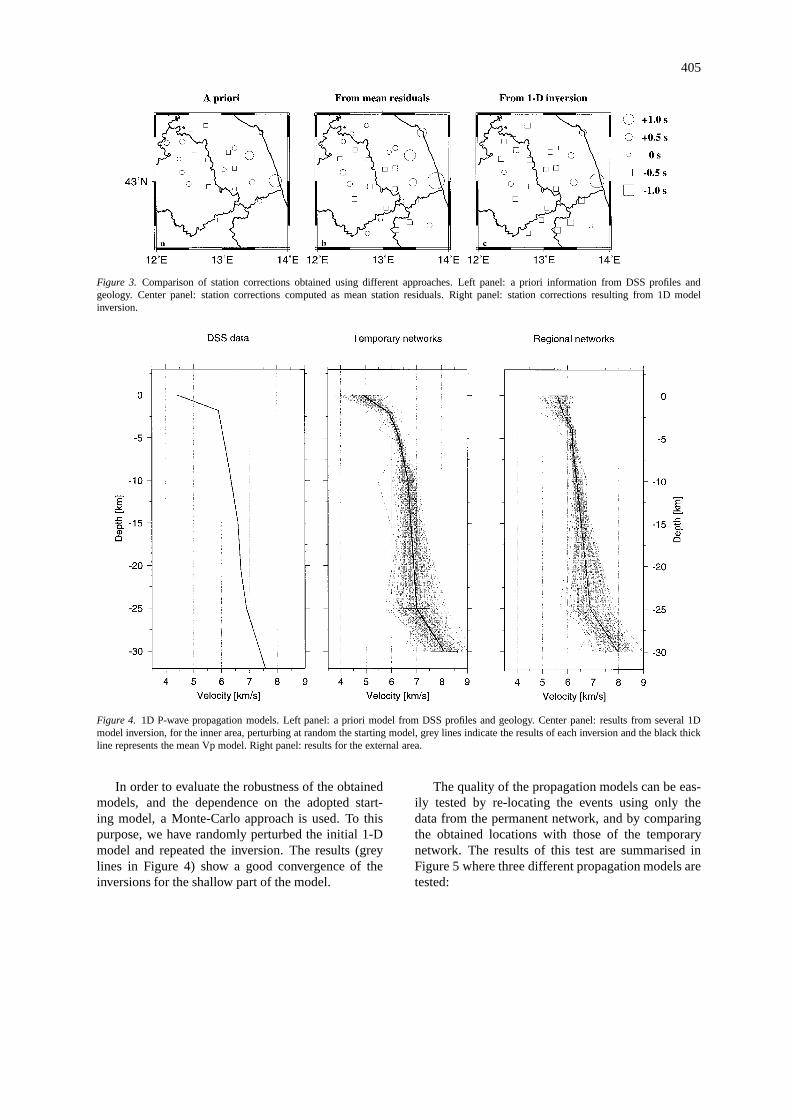
residual times and distance, but some stations dis-play an event-to-event consistent pattern of positive ornegative residual times which can be introduced as aconstant additive term in the location procedure (i.e.,the station correction). Thus, the first approach that weadopted consisted of computing the ‘static’ correctionthat could be assigned to each station on the basis ofthese residuals. A map of the obtained values is repor-ted in Figure 3(b). This correction can be interpreted asthe contribution of the upper crustal structure beneatheach station.
An independent check of these results can be ob-tained from the comparison of these delay times withthose predicted on the basis of our ‘a-priori’ know-ledge of the crustal structures of the area. Figure 3(a)reports these values determined from an analysis ofthe DSS profiles acquired in the area combined withinformation on the geological structure (Ponziani,1994). The main pattern of the residual correctiondistribution is well reproduced, confirming that resid-uals are mainly due to the uppermost part of the crustbeneath each station.
Finally, another approach consists of inverting theresiduals both for the 1-D propagation model and forthe station correction terms (Kissling et al., 1994). Wenote that in our case, we can invert only for modeland station correction while fixing the hypocentrallocations to the values determined by the temporarynetwork. The results are reported in Figure 3(c) whichshows a good correspondence between the invertedcorrection terms and those obtained with the othermethods described above. In addition to the stationcorrection terms, this inversion procedure allowed usto obtain a new 1-D model, both for Vp and for Vs.After 5 iterations, the procedure reached 89% variancereduction, with a final rms of 0.16 s. This rather highreduction can be easily explained by the high start-ing residuals in some stations (see Figure 2), stronglyreduced by the station correction term. The result-ing average Vp model is shown in Figure 4 (blackthick line in the right panel) and it is compared toan ‘a priori’ model derived from the analysis of theDSS profiles of the area (left panel) (Ponziani et al.,1995) and to the model obtained from data of the tem-porary network (black thick line in the central panel)(Michelini et al., this volume). The difference betweenthe two inverted models is not surprising, indeed themodel reported in the central panel of Figure 4 is rel-evant to a small sector of the Apennines, whereas themodel in the right panel fits the wave propagation in amuch broader region of Central Italy.
405
Figure 3. Comparison of station corrections obtained using different approaches. Left panel: a priori information from DSS profiles andgeology. Center panel: station corrections computed as mean station residuals. Right panel: station corrections resulting from 1D modelinversion.
Figure 4. 1D P-wave propagation models. Left panel: a priori model from DSS profiles and geology. Center panel: results from several 1Dmodel inversion, for the inner area, perturbing at random the starting model, grey lines indicate the results of each inversion and the black thickline represents the mean Vp model. Right panel: results for the external area.
In order to evaluate the robustness of the obtainedmodels, and the dependence on the adopted start-ing model, a Monte-Carlo approach is used. To thispurpose, we have randomly perturbed the initial 1-Dmodel and repeated the inversion. The results (greylines in Figure 4) show a good convergence of theinversions for the shallow part of the model.
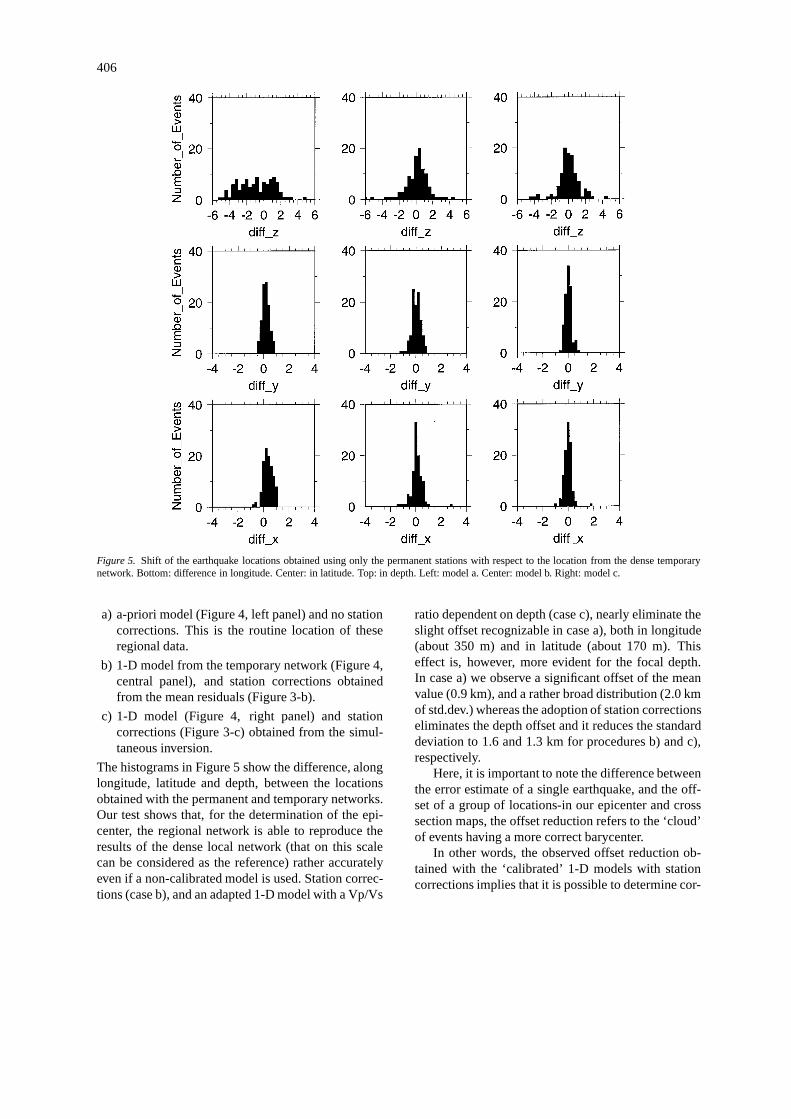
The quality of the propagation models can be eas-ily tested by re-locating the events using only thedata from the permanent network, and by comparingthe obtained locations with those of the temporarynetwork. The results of this test are summarised inFigure 5 where three different propagation models aretested:
406
Figure 5. Shift of the earthquake locations obtained using only the permanent stations with respect to the location from the dense temporarynetwork. Bottom: difference in longitude. Center: in latitude. Top: in depth. Left: model a. Center: model b. Right: model c.
a) a-priori model (Figure 4, left panel) and no stationcorrections. This is the routine location of theseregional data.
b) 1-D model from the temporary network (Figure 4,central panel), and station corrections obtainedfrom the mean residuals (Figure 3-b).
c) 1-D model (Figure 4, right panel) and stationcorrections (Figure 3-c) obtained from the simul-taneous inversion.
The histograms in Figure 5 show the difference, alonglongitude, latitude and depth, between the locationsobtained with the permanent and temporary networks.Our test shows that, for the determination of the epi-center, the regional network is able to reproduce theresults of the dense local network (that on this scalecan be considered as the reference) rather accuratelyeven if a non-calibrated model is used. Station correc-tions (case b), and an adapted 1-D model with a Vp/Vs
ratio dependent on depth (case c), nearly eliminate theslight offset recognizable in case a), both in longitude(about 350 m) and in latitude (about 170 m). Thiseffect is, however, more evident for the focal depth.In case a) we observe a significant offset of the meanvalue (0.9 km), and a rather broad distribution (2.0 kmof std.dev.) whereas the adoption of station correctionseliminates the depth offset and it reduces the standarddeviation to 1.6 and 1.3 km for procedures b) and c),respectively.
Here, it is important to note the difference betweenthe error estimate of a single earthquake, and the off-set of a group of locations-in our epicenter and crosssection maps, the offset reduction refers to the ‘cloud’of events having a more correct barycenter.
In other words, the observed offset reduction ob-tained with the ‘calibrated’ 1-D models with stationcorrections implies that it is possible to determine cor-
407
rectly the mean hypocentral distribution of a series ofevents in this area. However, for what concerns thelocation of the single event, the same is not true and,in the following analysis, we will focus on the meandistribution of the events rather to single locations.
Sequence evolution
Space-time distribution
The 1-D propagation model with station correctionsobtained from the inversion procedure has been usedto locate all the events of the sequence. The sequencestarted on September 3, 1997 (at 22:07 UTC), witha ML 4.5. Overall, our analysis includes the data forthe period May 1996 – July 31 1998 which results ina total of nearly 1300 events recorded by the digitalregional stations. The obtained catalogue can be con-sidered as complete above magnitude 2.6 although thedata set cannot be considered fully homogeneous forsome loss of data that occurred on 9/26 and that wasmentioned above. We computed local magnitudes bydeconvolving the instrument response of sensors fromour seismograms, convolving with the response of atheoretical Wood-Anderson sensor and then adoptingthe standard techniques.
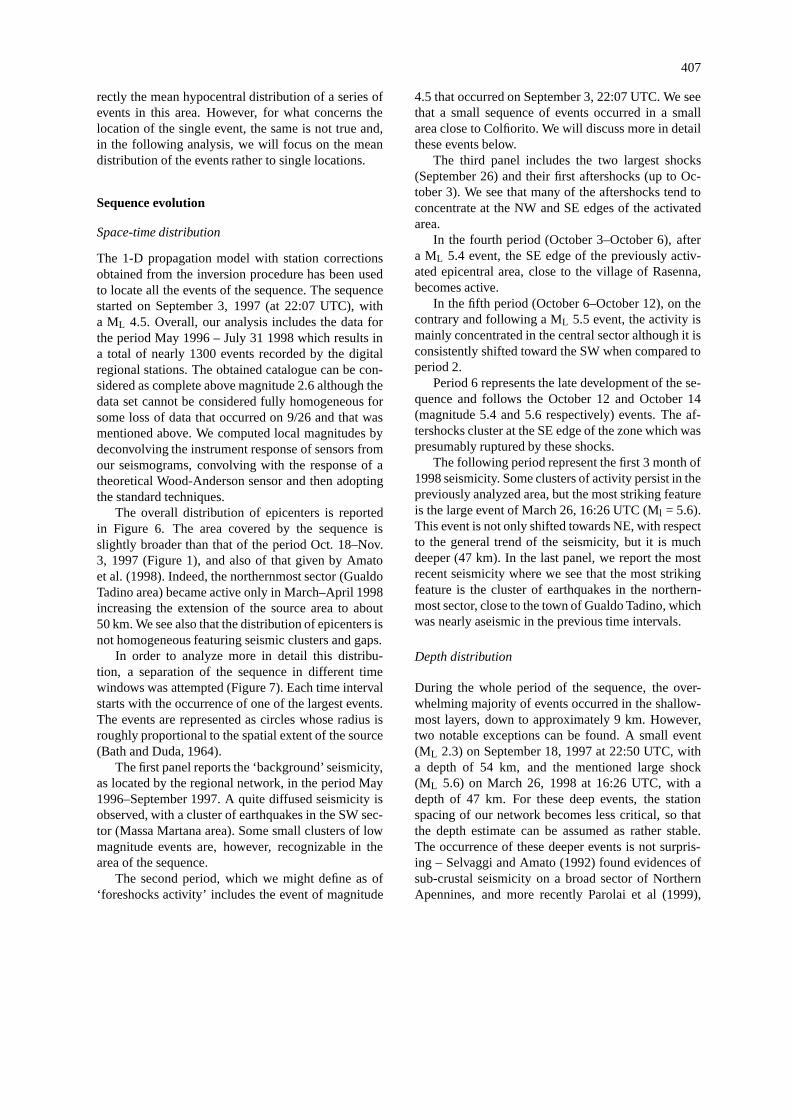
The overall distribution of epicenters is reportedin Figure 6. The area covered by the sequence isslightly broader than that of the period Oct. 18–Nov.3, 1997 (Figure 1), and also of that given by Amatoet al. (1998). Indeed, the northernmost sector (GualdoTadino area) became active only in March–April 1998increasing the extension of the source area to about50 km. We see also that the distribution of epicenters isnot homogeneous featuring seismic clusters and gaps.
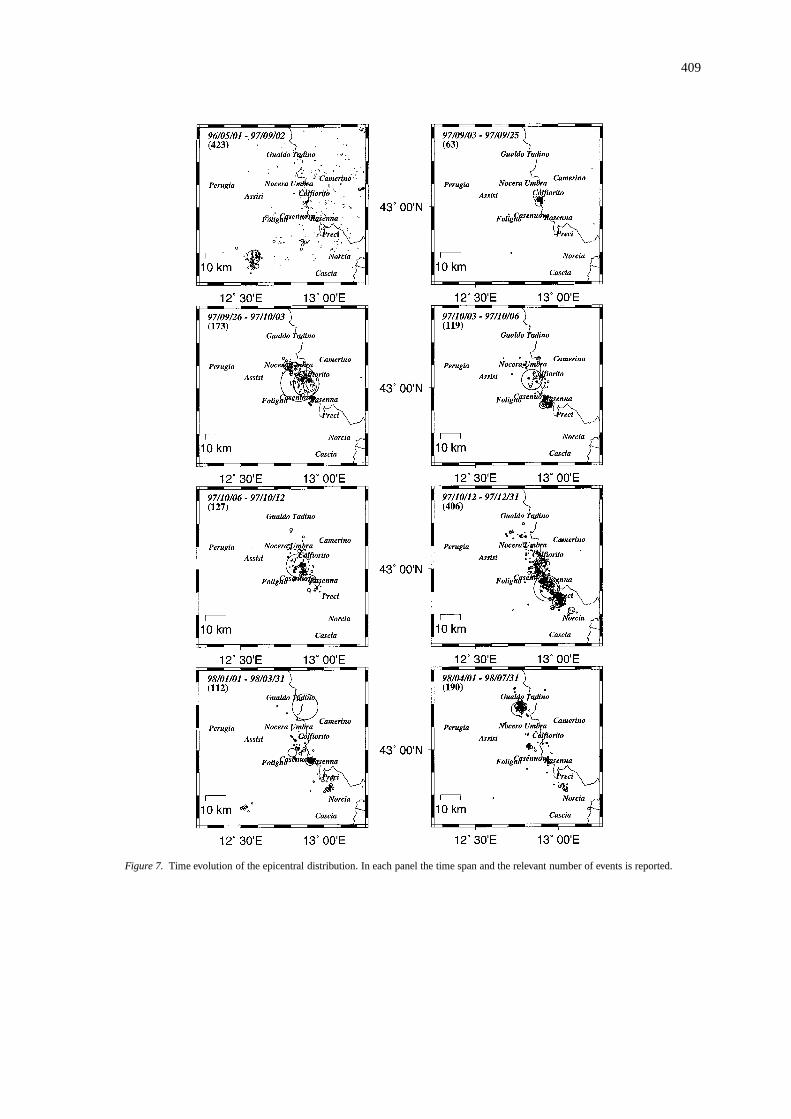
In order to analyze more in detail this distribu-tion, a separation of the sequence in different timewindows was attempted (Figure 7). Each time intervalstarts with the occurrence of one of the largest events.The events are represented as circles whose radius isroughly proportional to the spatial extent of the source(Bath and Duda, 1964).
The first panel reports the ‘background’ seismicity,as located by the regional network, in the period May1996–September 1997. A quite diffused seismicity isobserved, with a cluster of earthquakes in the SW sec-tor (Massa Martana area). Some small clusters of lowmagnitude events are, however, recognizable in thearea of the sequence.
The second period, which we might define as of‘foreshocks activity’ includes the event of magnitude
4.5 that occurred on September 3, 22:07 UTC. We seethat a small sequence of events occurred in a smallarea close to Colfiorito. We will discuss more in detailthese events below.
The third panel includes the two largest shocks(September 26) and their first aftershocks (up to Oc-tober 3). We see that many of the aftershocks tend toconcentrate at the NW and SE edges of the activatedarea.
In the fourth period (October 3–October 6), aftera ML 5.4 event, the SE edge of the previously activ-ated epicentral area, close to the village of Rasenna,becomes active.
In the fifth period (October 6–October 12), on thecontrary and following a ML 5.5 event, the activity ismainly concentrated in the central sector although it isconsistently shifted toward the SW when compared toperiod 2.
Period 6 represents the late development of the se-quence and follows the October 12 and October 14(magnitude 5.4 and 5.6 respectively) events. The af-tershocks cluster at the SE edge of the zone which waspresumably ruptured by these shocks.
The following period represent the first 3 month of1998 seismicity. Some clusters of activity persist in thepreviously analyzed area, but the most striking featureis the large event of March 26, 16:26 UTC (Ml = 5.6).This event is not only shifted towards NE, with respectto the general trend of the seismicity, but it is muchdeeper (47 km). In the last panel, we report the mostrecent seismicity where we see that the most strikingfeature is the cluster of earthquakes in the northern-most sector, close to the town of Gualdo Tadino, whichwas nearly aseismic in the previous time intervals.
Depth distribution
During the whole period of the sequence, the over-whelming majority of events occurred in the shallow-most layers, down to approximately 9 km. However,two notable exceptions can be found. A small event(ML 2.3) on September 18, 1997 at 22:50 UTC, witha depth of 54 km, and the mentioned large shock(ML 5.6) on March 26, 1998 at 16:26 UTC, with adepth of 47 km. For these deep events, the stationspacing of our network becomes less critical, so thatthe depth estimate can be assumed as rather stable.The occurrence of these deeper events is not surpris-ing – Selvaggi and Amato (1992) found evidences ofsub-crustal seismicity on a broad sector of NorthernApennines, and more recently Parolai et al (1999),
408
Figure 6. Epicenters of the relocated seismicity in the period September 1997–July 1998. 1283 events have been selected. Symbols areproportional to the spatial extent of each source.
analyzing the seismicity of this area in a larger timespan, found evidences of a deeper seismogenic layerbeneath Marche, probably related to a portion of theAdriatic slab located beneath the Apenninic Arc, andevidenced also by seismic tomography (Amato et al.,1993).
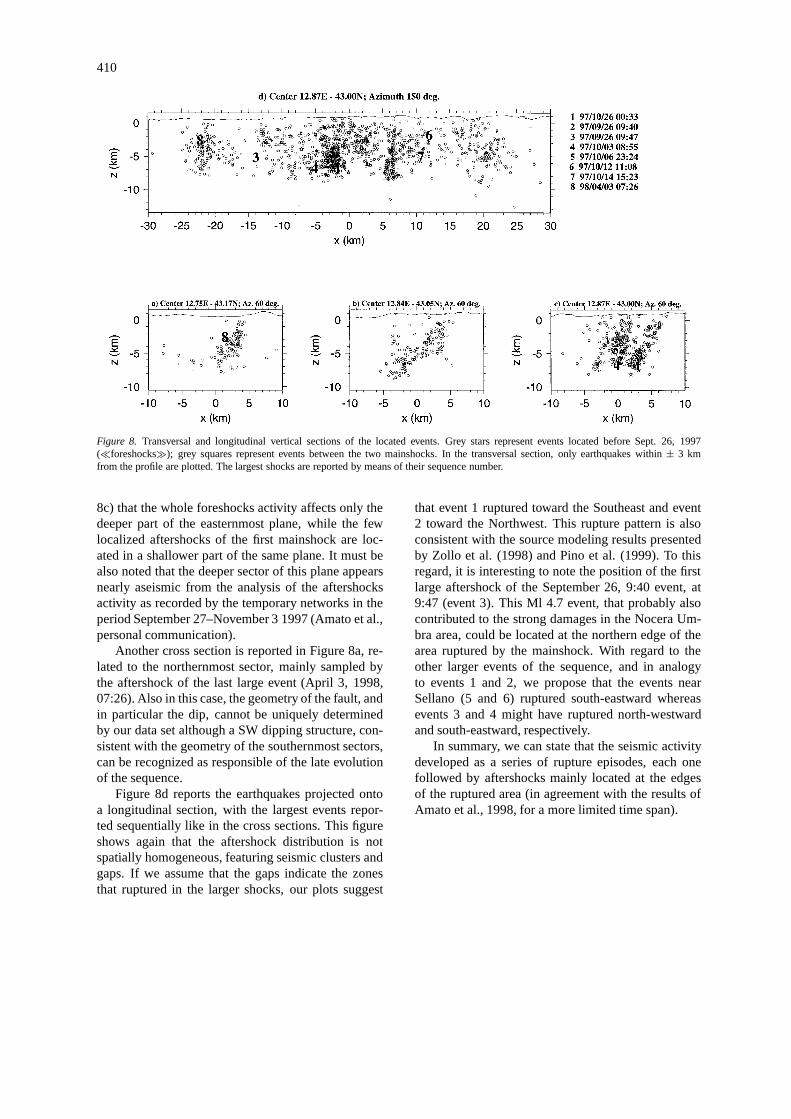
For the shallow events, we have already discussedthe difference between the error estimate of a singledepth evaluation, and the significance of the meandepth distribution of a series of events. For this reason,we have projected (Figure 8a, b, c) the hypocenterson sections perpendicular to the main trend of the epi-centers, choosing a width of selection (±3 km) largeenough to assure that a reasonable number of eventsis plotted. The three sections were drawn across thenorthern part of the sequence, mainly active in thefirst and last period of activity (the southern sector isdiscussed in detail by Michelini et al., this volume).Section 8b is comparable to Figure 4 ofAmato et al.(1998). The foci tend to concentrate on a plane, witha dip comparable to that reported byAmato et al.,and compatible with one of the planes of the focalmechanism of the mainshocks. In section 8c, whichruns across the area where the mainshocks nucleated,we see that the events tend to concentrate along (at
least) two, nearly parallel, alignments both dippingtowards SW and spaced by about 5 km. The dip ofthese planes seems slightly higher than that recognizedin section 8b: this fact could be related to the ver-tical spreading of the less-constrained locations, butthe existence of subparallel planes is consistent withthe findings of Michelini et al. (this volume) for thesouthernmost sector. In this section, we show alsosome selected events (those with ML > 5.2, and thefirst aftershock of the largest mainshock), plotted ac-cording to their temporal sequence. The location ofthese larger events, however, should be taken carefullybecause these shocks saturated the recordings of theclosest stations which made the S-wave picking verydifficult or, in most cases, impossible. Nonetheless,we note that event 1 can be related to the easternmostplane, while the others appear to be all linked to thewesternmost one, and they nucleated at the bottom ofthe aftershock area.
It is also interesting to observe the time evolu-tion of the seismic activity along these sections: theevents before September 26 (‘foreshocks’) are repor-ted as grey stars, while the aftershocks of event 1(between September 26, 00h03m and September 26,09h40m) as grey squares. It is rather evident (section
409
Figure 7. Time evolution of the epicentral distribution. In each panel the time span and the relevant number of events is reported.
410
Figure 8. Transversal and longitudinal vertical sections of the located events. Grey stars represent events located before Sept. 26, 1997(�foreshocks�); grey squares represent events between the two mainshocks. In the transversal section, only earthquakes within± 3 kmfrom the profile are plotted. The largest shocks are reported by means of their sequence number.
8c) that the whole foreshocks activity affects only thedeeper part of the easternmost plane, while the fewlocalized aftershocks of the first mainshock are loc-ated in a shallower part of the same plane. It must bealso noted that the deeper sector of this plane appearsnearly aseismic from the analysis of the aftershocksactivity as recorded by the temporary networks in theperiod September 27–November 3 1997 (Amato et al.,personal communication).
Another cross section is reported in Figure 8a, re-lated to the northernmost sector, mainly sampled bythe aftershock of the last large event (April 3, 1998,07:26). Also in this case, the geometry of the fault, andin particular the dip, cannot be uniquely determinedby our data set although a SW dipping structure, con-sistent with the geometry of the southernmost sectors,can be recognized as responsible of the late evolutionof the sequence.
Figure 8d reports the earthquakes projected ontoa longitudinal section, with the largest events repor-ted sequentially like in the cross sections. This figureshows again that the aftershock distribution is notspatially homogeneous, featuring seismic clusters andgaps. If we assume that the gaps indicate the zonesthat ruptured in the larger shocks, our plots suggest
that event 1 ruptured toward the Southeast and event2 toward the Northwest. This rupture pattern is alsoconsistent with the source modeling results presentedby Zollo et al. (1998) and Pino et al. (1999). To thisregard, it is interesting to note the position of the firstlarge aftershock of the September 26, 9:40 event, at9:47 (event 3). This Ml 4.7 event, that probably alsocontributed to the strong damages in the Nocera Um-bra area, could be located at the northern edge of thearea ruptured by the mainshock. With regard to theother larger events of the sequence, and in analogyto events 1 and 2, we propose that the events nearSellano (5 and 6) ruptured south-eastward whereasevents 3 and 4 might have ruptured north-westwardand south-eastward, respectively.
In summary, we can state that the seismic activitydeveloped as a series of rupture episodes, each onefollowed by aftershocks mainly located at the edgesof the ruptured area (in agreement with the results ofAmato et al., 1998, for a more limited time span).
411
Focal mechanisms
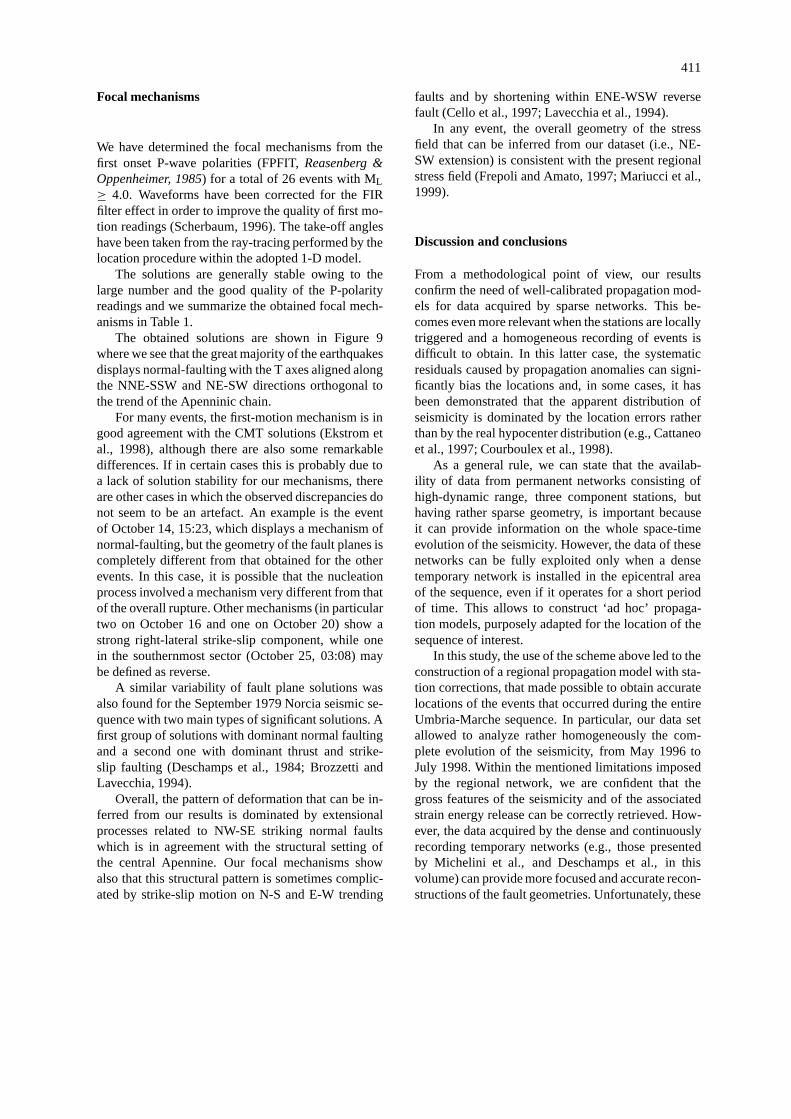
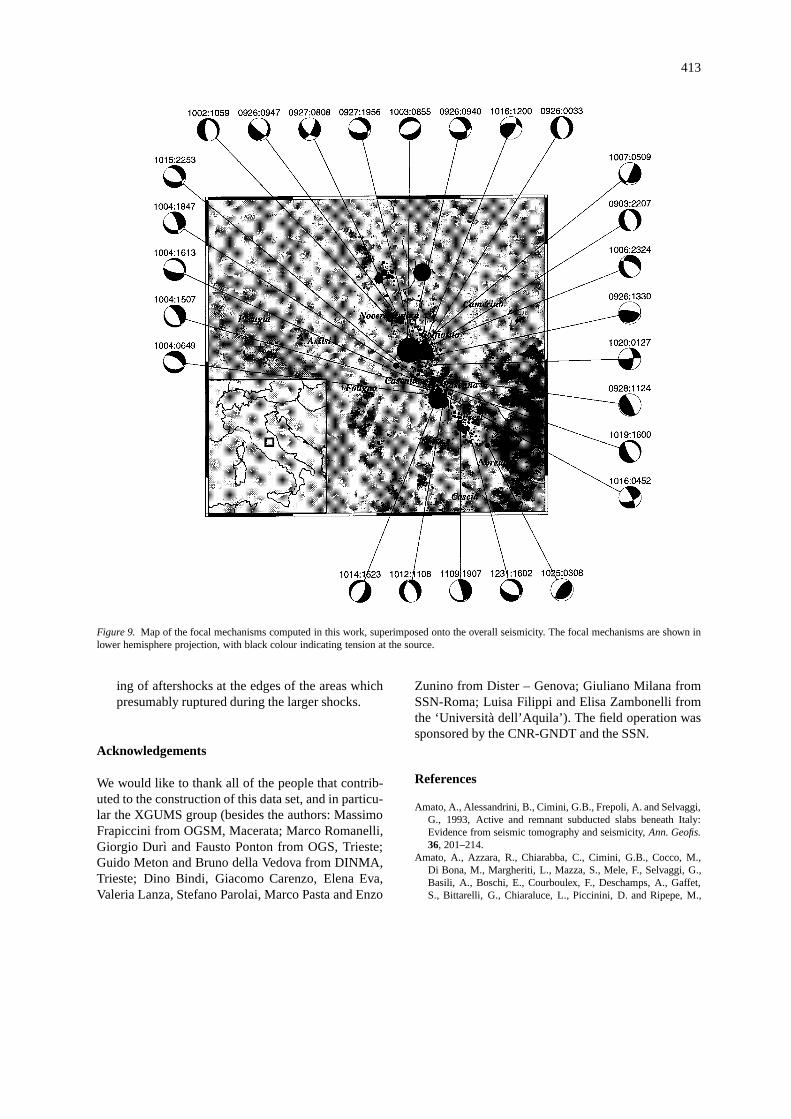
We have determined the focal mechanisms from thefirst onset P-wave polarities (FPFIT,Reasenberg &Oppenheimer, 1985) for a total of 26 events with ML≥ 4.0. Waveforms have been corrected for the FIRfilter effect in order to improve the quality of first mo-tion readings (Scherbaum, 1996). The take-off angleshave been taken from the ray-tracing performed by thelocation procedure within the adopted 1-D model.
The solutions are generally stable owing to thelarge number and the good quality of the P-polarityreadings and we summarize the obtained focal mech-anisms in Table 1.
The obtained solutions are shown in Figure 9where we see that the great majority of the earthquakesdisplays normal-faulting with the T axes aligned alongthe NNE-SSW and NE-SW directions orthogonal tothe trend of the Apenninic chain.
For many events, the first-motion mechanism is ingood agreement with the CMT solutions (Ekstrom etal., 1998), although there are also some remarkabledifferences. If in certain cases this is probably due toa lack of solution stability for our mechanisms, thereare other cases in which the observed discrepancies donot seem to be an artefact. An example is the eventof October 14, 15:23, which displays a mechanism ofnormal-faulting, but the geometry of the fault planes iscompletely different from that obtained for the otherevents. In this case, it is possible that the nucleationprocess involved a mechanism very different from thatof the overall rupture. Other mechanisms (in particulartwo on October 16 and one on October 20) show astrong right-lateral strike-slip component, while onein the southernmost sector (October 25, 03:08) maybe defined as reverse.
A similar variability of fault plane solutions wasalso found for the September 1979 Norcia seismic se-quence with two main types of significant solutions. Afirst group of solutions with dominant normal faultingand a second one with dominant thrust and strike-slip faulting (Deschamps et al., 1984; Brozzetti andLavecchia, 1994).
Overall, the pattern of deformation that can be in-ferred from our results is dominated by extensionalprocesses related to NW-SE striking normal faultswhich is in agreement with the structural setting ofthe central Apennine. Our focal mechanisms showalso that this structural pattern is sometimes complic-ated by strike-slip motion on N-S and E-W trending
faults and by shortening within ENE-WSW reversefault (Cello et al., 1997; Lavecchia et al., 1994).
In any event, the overall geometry of the stressfield that can be inferred from our dataset (i.e., NE-SW extension) is consistent with the present regionalstress field (Frepoli and Amato, 1997; Mariucci et al.,1999).
Discussion and conclusions
From a methodological point of view, our resultsconfirm the need of well-calibrated propagation mod-els for data acquired by sparse networks. This be-comes even more relevant when the stations are locallytriggered and a homogeneous recording of events isdifficult to obtain. In this latter case, the systematicresiduals caused by propagation anomalies can signi-ficantly bias the locations and, in some cases, it hasbeen demonstrated that the apparent distribution ofseismicity is dominated by the location errors ratherthan by the real hypocenter distribution (e.g., Cattaneoet al., 1997; Courboulex et al., 1998).
As a general rule, we can state that the availab-ility of data from permanent networks consisting ofhigh-dynamic range, three component stations, buthaving rather sparse geometry, is important becauseit can provide information on the whole space-timeevolution of the seismicity. However, the data of thesenetworks can be fully exploited only when a densetemporary network is installed in the epicentral areaof the sequence, even if it operates for a short periodof time. This allows to construct ‘ad hoc’ propaga-tion models, purposely adapted for the location of thesequence of interest.
In this study, the use of the scheme above led to theconstruction of a regional propagation model with sta-tion corrections, that made possible to obtain accuratelocations of the events that occurred during the entireUmbria-Marche sequence. In particular, our data setallowed to analyze rather homogeneously the com-plete evolution of the seismicity, from May 1996 toJuly 1998. Within the mentioned limitations imposedby the regional network, we are confident that thegross features of the seismicity and of the associatedstrain energy release can be correctly retrieved. How-ever, the data acquired by the dense and continuouslyrecording temporary networks (e.g., those presentedby Michelini et al., and Deschamps et al., in thisvolume) can provide more focused and accurate recon-structions of the fault geometries. Unfortunately, these
412
Table 1.
Date To Lat.N Long.E Dep. Ml Pol Ddr Dip Rake Errors
D Dip R
970903 22 7 29.70 43–00.92 12–52.77 8.7 4.5 20 260 49 –81 7 1 5
970926 033 13.33 43– 1.24 12–53.31 3.8 5.6 23 80 37 –96 0 2 4
970926 940 27.08 43– 1.41 12–50.83 6.5 5.9 14 174 61 –138 2 5 5
970926 947 38.57 43– 6.41 12–48.19 2.6 4.7 7 108 26 –24 9 5 16
970926 1330 52.92 43– 0.57 12–54.57 6.0 4.9 9 150 20 52 13 5 16
970927 8 8 8.34 43– 5.28 12–49.20 4.2 4.9 12 120 70 –32 0 3 4
970927 1956 43.82 43– 2.80 12–51.32 4.9 4.4 16 180 61 –124 3 5 2
970928 1124 32.37 42–58.14 12–52.59 3.5 3.9 16 230 10 76 20 3 10
971002 1059 56.70 43– 5.68 12–47.06 4.5 4.4 32 60 27 –116 6 2 8
971003 855 22.43 43– 2.05 12–50.52 5.7 5.4 31 158 51 –91 9 6 5
971004 649 59.93 42–55.50 12–54.79 4.0 4.5 30 184 34 –116 2 2 8
971004 15 7 21.38 42–55.84 12–55.86 2.4 4.5 31 208 23 –120 6 6 2
971004 1613 33.36 42–55.96 12–56.14 2.1 4.8 32 192 68 –104 4 0 2
971004 1847 48.30 42–55.72 12–56.44 2.1 4.6 33 72 72 –60 0 2 4
971006 2324 53.54 43– 0.91 12–50.58 7.0 5.5 30 24 58 –122 5 7 6
971007 5 9 57.69 43– 1.47 12–51.91 2.9 4.7 35 212 25 –172 2 2 12
971012 11 8 37.39 42–54.64 12–56.99 2.2 5.3 24 60 51 –112 6 4 2
971014 1523 11.03 42–54.91 12–55.77 4.9 5.6 28 114 62 –100 3 2 0
971015 2253 11.18 42–55.55 12–55.82 2.0 4.5 30 52 50 –56 2 4 4
971016 452 56.08 42–56.37 12–55.04 2.0 4.2 24 160 62 –168 4 18 8
971016 12 0 31.77 43– 2.06 12–53.43 2.0 4.6 34 116 63 40 2 6 6
971019 16 0 18.00 42–57.95 12–51.46 6.5 4.3 40 40 22 –112 3 8 3
971020 127 5.42 42–59.40 12–52.77 3.3 3.7 40 88 63 2 3 20 45
971025 3 8 7.30 42–48.99 13– 4.79 2.0 4.4 45 148 25 110 6 3 9
971109 19 7 33.88 42–51.26 12–59.99 2.0 4.9 26 196 13 –148 3 4 9
971231 16 2 15.83 42–51.14 13– 1.41 5.4 4.4 14 58 36 –58 6 6 6
Date: year, month, day.To: Origin time of earthquake.Lat N – Long E – Dep.: Seismic parameters of 26 selected earthquakes.Ml: magnitude.Pol: number of polarities.Ddr: Dip direction (downdip azimuth in degrees, clockwise from north).Dip: Dip angle in degrees down from horizontal.Rake: Rake in degrees 0 = left lateral; 90 = reverse; +- 180 = right lateral; –90 = normal.
pictures are related to a limited time span, and do notcover, in particular, the foreshocks and the first activa-tion period, or some late re-activations, like that in theGualdo Tadino area. Overall, the joined use of thesedata and those coming from the permanent networksallows for the analysis of the complete seismicity.
In particular, our analysis has shown that:– the seismic activity aligns along the SE-NW trend
of the Apennines for about 50 km from Norcia toGualdo Tadino; this area shows a strong correla-tion also with the most damaged area (Galli andGaladini, 1999);
– the focal depth of these events is limited to therange 0–9 km, with few exceptions;
– the two main shocks are related to two distinguish-able, sub-parallel structures; the foreshock activityaffected just the deepest part of the easternmostplane, where the first shock nucleated;
– most events, also in the last period of the sequence,can be related to sub-parallel SW dipping faultplanes;
– most focal mechanisms show a coherent beha-viour, with normal faulting on NW striking, SWdipping planes;
– the space-time evolution of the activity displays adiscontinuous mode of energy release, with differ-ent episodes of activation and an apparent cluster-
413
Figure 9. Map of the focal mechanisms computed in this work, superimposed onto the overall seismicity. The focal mechanisms are shown inlower hemisphere projection, with black colour indicating tension at the source.
ing of aftershocks at the edges of the areas whichpresumably ruptured during the larger shocks.
Acknowledgements
We would like to thank all of the people that contrib-uted to the construction of this data set, and in particu-lar the XGUMS group (besides the authors: MassimoFrapiccini from OGSM, Macerata; Marco Romanelli,Giorgio Durì and Fausto Ponton from OGS, Trieste;Guido Meton and Bruno della Vedova from DINMA,Trieste; Dino Bindi, Giacomo Carenzo, Elena Eva,Valeria Lanza, Stefano Parolai, Marco Pasta and Enzo
Zunino from Dister – Genova; Giuliano Milana fromSSN-Roma; Luisa Filippi and Elisa Zambonelli fromthe ‘Università dell’Aquila’). The field operation wassponsored by the CNR-GNDT and the SSN.
References
Amato, A., Alessandrini, B., Cimini, G.B., Frepoli, A. and Selvaggi,G., 1993, Active and remnant subducted slabs beneath Italy:Evidence from seismic tomography and seismicity,Ann. Geofis.36, 201–214.
Amato, A., Azzara, R., Chiarabba, C., Cimini, G.B., Cocco, M.,Di Bona, M., Margheriti, L., Mazza, S., Mele, F., Selvaggi, G.,Basili, A., Boschi, E., Courboulex, F., Deschamps, A., Gaffet,S., Bittarelli, G., Chiaraluce, L., Piccinini, D. and Ripepe, M.,
414
1998, The 1997 Umbria-Marche, Italy, earthquake sequence: afirst look at the main shocks and aftershocks,Geophys. Res. Lett.25/15, 2861–2864.
Bath, M. and Duda, S.J., 1964, Earthquake volume, plain area,seismic strain, deformation and related quantities,Ann. Geofis.17, 353–368.
Brozzetti, F. and Lavecchia, G., 1994, Seismicity and related exten-sional stress field: the case of the Norcia Seismic Zone (CentralItaly), Ann. Tectonicae8, 36–57.
Cattaneo, M., Augliera, P., Spallarossa, D. and Eva, C., 1997, Re-construction of seismogenetic structures by multiplet analysis:an example of Western Liguria, Italy,Bull. Seism. Soc. Am.87/4,8369–8379.
Cello, G., Mazzoli, S., Tondi, E. and Turco, E., 1997, Active tec-tonics in the Central Apennines and possible implications forseismic hazard analysis in peninsular Italy,Tectonophysics272,43–68.
Courboulex, F., Deschamps, A., Cattaneo, M., Costi, F., De-verchere, J., Virieux, J., Augliera, P., Lanza, V. and Spallarossa,D., 1998, Source study and tectonic implications of the 1995Ventimiglia (border of Italy and France) earthquake (Ml = 4.7),Tectonophysics290, 245–257.
Deschamps, A., Iannaccone, G. and Scarpa, R., 1984, The Umbrianearthquake (Italy) of 19 September 1979,Ann. Geophys.2, 29–36.
Deschamps, A., Courboulex, F., Gaffet, S., Lomax, A., Virieux,J., Amato, A., Azzara, R., Castello, B., Chiarabba, C., Cimini,G.B., Cocco, M., Di Bona, M., Margheriti, L., Mele, F.,Selvaggi, G., Chiaraluce, L., Piccinini, D. and Ripepe, M.,1999. Spatio-temporal distribution of seismic activity during theUmbria-Marche crisis, 1997,Journ. Seismology, this volume.
Ekstrom, G., Morelli, A., Boschi, E. and Dziewonski, A.M., 1998,Moment tensor analysis of the central Italy earthquake sequenceof September-October 1997,Geophys. Res. Lett.25/11, 1971–1974.
Frepoli, A. and Amato, A., 1997, Contemporaneous extension andcompression in the northern Apennines from earthquake fault-plane solutions,Geophys. J. Int.129, 368–388.
Galli, P. and Galadini, F., 1999, Seismotectonic framework of the1997–1998 Umbria-Marche (Central Italy) earthquakes,Seism.Res. Lett.70/4, 417–427.
Kissling, E., Ellsworth, W.L., Eberhart-Phillips, D. and Krad-olfer, U., 1994, Initial reference models in local earthquaketomography,J. Geophys. Res.99, 19635–19646.
Lavecchia, G., Brozzetti, F., Barchi, M., Menichetti, M. and Keller,J.V.A., 1994, Seismotectonic zoning in east-central Italy deducedfrom an analysis of the Neogene to present deformations andrelated stress fields,Geol. Soc. Am. Bull. 106, 1107–1120.
Mariucci, M.T., Amato, A. and Montone, P., 1999, Recent tectonicevolution and present stress in the Northern Apennines (Italy),Tectonics18/1, 108–118.
Michelini, A., Spallarossa, D., Cattaneo, M., Govoni, A. andMontanari, A., 1999, The 1997 Umbria-Marche (Italy) earth-quake sequence: tomographic images obtained from data of theGNDT-SSN temporary network,Journ. Seismology, this volume.
Parolai, S., Trojani, L., Monachesi, G., Frappiccini, M., Cattaneo,M. and Augliera, P., 1999, New considerations on the seismicitydistribution in the Marchesan area by means of an analysis ofthe location accuracy of the RSM network, Submitted toJourn.Seismology.
Pino, N.A., Mazza, S. and Boschi, E., 1999, Rupture directivity ofthe major shocks in the 1997 Umbria-Marche (Central Italy) se-quence from regional broadband waveforms,Geophys. Res. Lett.26/14, 2101–2104.
Ponziani, F., 1994, Digitalizzazione e reinterpretazione di dati disismica crostale: ipotesi su un modello geodinamico per l’ItaliaCentrale – Tirreno Settentrionale,Ph. D. Thesis, UniversitàScienze della Terra, Perugia.
Ponziani, F., De Franco, R., Minelli, G., Biella, G., Federico, C. andPialli, G., 1995, Crustal shortening and duplication of the Mohoin the Northern Apennines: a view from seismic refraction data,Tectonophysics252, 391–418.
Reasenberg, P. and Oppenheimer, D., 1985, FPFIT, FPPLOT andFPPAGE: Fortran computer programs for calculating and dis-playing earthquake fault plane solutions,U.S. Geol. Surv. OpenFile Rep., 85–739.
Scherbaum, F., 1996,Of Poles and Zeros – Fundamental of Di-gital Seismology. Vol. 15 – Modern Approaches in Geophysics –Kluwer Academic Publishers, The Netherlands.
Selvaggi, G., Amato, A., 1992, Subcrustal earthquakes in the North-ern Apennines (Italy): evidence for a still active subduction?,Geophys. Res. Lett.19, 2127–2130.
Zollo, A., Bongiovanni, G., Herrero, A., Marcucci, S. and Mil-ana, G., 1998, The 1997 Colfiorito earthquake sequence (centralItaly): insights on the mainshocks ruptures from near sourcestrong motion records,XXIII Gen. Ass. EGS, Nice, 18–24 April1998.
Related Documents