ed: CK / sa: CT, PY SET : 1,571.05 Analyst Chanpen SIRITHANARATTANAKUL +662 657 7824 [email protected] Thailand Research Team +662 657 7831 [email protected] Key Indices Current % Chng SET Index 1571.05 0.48% SET 100 Index 2223.24 0.49% SET 50 Index 985.53 0.47% Bt/US$ Exchange Rate 35.65 -0.37% Daily Volume (m shrs) 12,644 Daily Turnover (US$m) 1,946 Source: SET, DBS Vickers Market Key Data (%) EPS Gth Div Yield 2015A (16.9) 3.1 2016F 35.8 3.0 2017F 7.1 3.1 (x) PER EV/EBITDA 2015A 20.9 8.8 2016F 15.5 8.4 2017F 14.5 7.9 Source: DBS Vickers STOCKS Source: DBS Vickers, Bloomberg Finance L.P. Closing price as of 30 Dec 2016 DBS Group Research . Equity 6 Jan 2017 Thailand Market Focus Strategy Refer to important disclosures at the end of this report Bottom-up selection still key Our 12-month SET Index target is at 1650, representing 15.6x 2017F earnings Expect market EPS growth of 7% for 2017 Five themes for investment in 2017 Top 10 picks: ANAN, AOT, CK, CPALL, GL, IVL, MTLS, SCC, TISCO, and TKN. 2016 recap. The Thai market was the best performing market in the region in 2016, with the SET Index rising 19.8% vs 3.5% gain for regional peers. The strong performance was due to the strong corporate EPS growth of c. 36% boosted by energy, petrochem and transportation sector and the return of foreign investors into the market. Mid/small-cap stocks (+64.8%) strongly outperformed large-cap ones (+18.9%), thanks to their superior earnings growth outlook. Expect 7% corporate EPS growth for 2017. Looking forward to 2017, we expect market earnings to grow 7%. Our current earnings growth forecast is 15% for 2017. We believe the key difference was mainly in the banking and energy sector, due to different in provisioning and oil price assumptions. Based on our conservative 7% EPS growth, our SET Index target is now 1650, based on 15.6x earnings in 2017. Five themes for 2017 investment. We have five themes for investment in 2017. They are (i) infrastructure upcycle – The rising infrastructure spending in 2017 should be a key catalyst for construction contractors like CK, SCC, STEC (ii) superior earnings growth outlook – Those fit the themes are ANAN, FN, IVL, WORK, MTLS, TKN, BEAUTY (iii) strong tourism – Beneficiaries are AOT, ERW (iv) strong US dollar – This should benefit exporters like IVL, HANA, TU (v) CLMV exposure – GL, BEAUTY, CBG Top ten picks. Our top ten picks are Ananda Development (ANAN), Airports of Thailand (AOT), Ch. Karnchang (CK), CP All (CPALL), Group Lease (GL), Indorama Ventures (IVL), Muangthai Leasing (MTLS), Siam Cement (SCC), Tisco Group (TISCO), and Taokaenoi Marketing (TKN). Price Mkt Cap Target Price Performance (%) Bt US$m Bt 3 mth 12 mth Rating Ananda Development 4.94 458 5.60 2.1 24.6 BUY Airports of Thailand 398.00 15,826 455.00 (1.5) 17.5 BUY Ch. Karnchang 31.00 1,462 40.00 5.1 13.8 BUY CP ALL 62.50 15,627 75.00 2.5 47.0 BUY Group Lease Public Co Ltd 57.25 2,431 88.00 81.6 339.5 BUY Indorama Ventures 33.50 4,489 42.00 9.2 57.5 BUY Muangthai Leasing Pcl 24.70 1,458 32.00 42.1 28.7 BUY Siam Cement 496.00 16,567 580.00 (8.4) 9.6 BUY TISCO Financial Group 60.25 1,343 65.00 4.7 37.3 BUY Taokaenoi Food & Marketing 28.00 1,076 32.00 17.8 na BUY

Welcome message from author
This document is posted to help you gain knowledge. Please leave a comment to let me know what you think about it! Share it to your friends and learn new things together.
Transcript

ed: CK / sa: CT, PY
SET : 1,571.05
Analyst Chanpen SIRITHANARATTANAKUL +662 657 7824 [email protected] Thailand Research Team +662 657 7831 [email protected]
Key Indices
Current % Chng
SET Index 1571.05 0.48%
SET 100 Index 2223.24 0.49%
SET 50 Index 985.53 0.47%
Bt/US$ Exchange Rate 35.65 -0.37%
Daily Volume (m shrs) 12,644
Daily Turnover (US$m) 1,946
Source: SET, DBS Vickers Market Key Data
(%) EPS Gth Div Yield
2015A (16.9) 3.1
2016F 35.8 3.0
2017F 7.1 3.1
(x) PER EV/EBITDA
2015A 20.9 8.8
2016F 15.5 8.4
2017F 14.5 7.9
Source: DBS Vickers STOCKS
Source: DBS Vickers, Bloomberg Finance L.P.
Closing price as of 30 Dec 2016
DBS Group Research . Equity
6 Jan 2017
Thailand Market Focus
Strategy Refer to important disclosures at the end of this report
Bottom-up selection still key
Our 12-month SET Index target is at 1650,
representing 15.6x 2017F earnings
Expect market EPS growth of 7% for 2017
Five themes for investment in 2017
Top 10 picks: ANAN, AOT, CK, CPALL, GL, IVL, MTLS,
SCC, TISCO, and TKN.
2016 recap. The Thai market was the best performing market in
the region in 2016, with the SET Index rising 19.8% vs 3.5% gain
for regional peers. The strong performance was due to the
strong corporate EPS growth of c. 36% boosted by energy,
petrochem and transportation sector and the return of foreign
investors into the market. Mid/small-cap stocks (+64.8%) strongly
outperformed large-cap ones (+18.9%), thanks to their superior
earnings growth outlook.
Expect 7% corporate EPS growth for 2017. Looking forward
to 2017, we expect market earnings to grow 7%. Our current
earnings growth forecast is 15% for 2017. We believe the key
difference was mainly in the banking and energy sector, due to
different in provisioning and oil price assumptions. Based on our
conservative 7% EPS growth, our SET Index target is now 1650,
based on 15.6x earnings in 2017.
Five themes for 2017 investment. We have five themes for
investment in 2017. They are
(i) infrastructure upcycle – The rising infrastructure spending in
2017 should be a key catalyst for construction contractors like
CK, SCC, STEC
(ii) superior earnings growth outlook – Those fit the themes are
ANAN, FN, IVL, WORK, MTLS, TKN, BEAUTY
(iii) strong tourism – Beneficiaries are AOT, ERW
(iv) strong US dollar – This should benefit exporters like IVL,
HANA, TU
(v) CLMV exposure – GL, BEAUTY, CBG
Top ten picks. Our top ten picks are Ananda Development
(ANAN), Airports of Thailand (AOT), Ch. Karnchang (CK), CP All
(CPALL), Group Lease (GL), Indorama Ventures (IVL), Muangthai
Leasing (MTLS), Siam Cement (SCC), Tisco Group (TISCO), and
Taokaenoi Marketing (TKN).
Price Mkt Cap Target Price Performance (%)
Bt US$m Bt 3 mth 12 mth Rating
Ananda
Development 4.94 458 5.60 2.1 24.6 BUY
Airports of Thailand 398.00 15,826 455.00 (1.5) 17.5 BUY
Ch. Karnchang 31.00 1,462 40.00 5.1 13.8 BUY
CP ALL 62.50 15,627 75.00 2.5 47.0 BUY
Group Lease Public
Co Ltd 57.25 2,431 88.00 81.6 339.5 BUY
Indorama Ventures 33.50 4,489 42.00 9.2 57.5 BUY
Muangthai Leasing
Pcl 24.70 1,458 32.00 42.1 28.7 BUY
Siam Cement 496.00 16,567 580.00 (8.4) 9.6 BUY
TISCO Financial
Group 60.25 1,343 65.00 4.7 37.3 BUY
Taokaenoi Food &
Marketing 28.00 1,076 32.00 17.8 na BUY

Market Focus
Page 2
Our top picks
Our top picks strongly outperformed the market in 2016.
Our portfolio has posted an impressive 45% price return since
March 2016 when we started to track our monthly performance,
vs the market’s 12% rise during the same period.
Among our best picks in 2016 were Group Lease (GL), Ananda
Development (ANAN), The Erawan Group (ERW), Ladprao
Hospital (LPH), Taokaenoi Marketing (TKN), LH Hotel Leasehold
REIT (LHHOTEL), etc.
Cumulative price returns of our stock picks vs the market
Source: DBS Vickers
Stock picks for 2017. Looking forward into 2017, we believe
bottom-up selection remains the key. We have top ten picks for
the market based on five investment themes. These include (i)
infrastructure upcycle, (ii) superior earnings growth outlook, (iii)
strong tourism, (iv) strong US dollar, and (v) CLMV exposure.
The top ten picks are ANAN, AOT, CK, CPALL, GL, IVL, MTLS, SCC,
TISCO and TKN.
ANAN is our top pick in the residential property counter, thanks to
its strong earnings growth of 51% this year, supported by rising
contribution from its JV with Mitsui Fudosan. ANAN’s revenue
visibility is also the highest in the sector, supported by its large
backlog on hand which is equivalent to 74% of estimated transfers
in 2017.
AOT should continue to benefit from the strong tourism outlook
amid calmer politics. The company’s plan to split par from Bt10 to
Bt1, subject to shareholders’ approval on 27 January 2017, should
help improve the stock’s trading liquidity and be a near-term
catalyst for the share price.
CK should be a prime beneficiary of rising infrastructure spending
in Thailand. Group Lease (GL) remains one of our top picks in the
Thai market, thanks to its aggressive expansion into neighbouring
countries which should result in strong earnings growth outlook.
We like CPALL for its dominant position in fast growing convenient
store format with FY15-18F CAGR of 21%. The stock is also very
resilient to the slowing economy and generates strong annual cash
flow of c. Bt34bn.
GL offers a good example of a company that has been very
successful in expanding into CLMV countries. The company is one
of the largest motorcycle HP players in Thailand. GL has grown its
businesses aggressively in Cambodia, has the No.1 market share in
Laos, has recently started a finance business in Indonesia, has just
acquired 100% of a microfinance company in Myanmar and 30%
of a finance company in Sri Lanka, and aims to become the world
finance company in the foreseeable future.
We like IVL for its improving outlook of core earnings, driven by
high value-added products and its leading position in global market
for PET/Polyester and automotive-related specialty products. We
believe the market remains too pessimistic on its core EBITDA
margin and its re-rating in 2017F is likely. The strong baht against
the greenback is also positive for the company, as the company
derives most of its revenue in US dollar.
MTLS’ asset quality remains solid with low NPL and high coverage
ratio. We expect the company to report strong earnings growth of
51% this year.
We also like SCC on its solid earnings performance and financial
position, and healthy ROE and EPG on its improving earnings
outlook, driven by the automotive plastic segment. Key catalyst for
the stock is new orders from European automakers which will
launch SUV cars in 2017-18.
TISCO is our top pick in the banking sector. We like the stock for
its potential loan growth turnaround, improving asset quality, and
high ROE.
We expect TKN’s earnings to jump 52% this year, on the back of
the capacity expansion from the new plant. Note that the new
plant under BOI promotional privileges will come online in 1Q17
and double the company’s existing capacity.
80
90
100
110
120
130
140
150
160
Feb
-16
Mar
-16
Ap
r-1
6
May
-16
Jun
-16
Jul-
16
Au
g-1
6
Sep
-16
Oct
-16
No
v-1
6
De
c-1
6
Market
Our portfolio

Market Focus
Page 3
Stock picks for 2017
Mkt Price Target % PE PBV Div Yield ROE
Bloomberg Cap 30 Dec Price Upside (x) (x) (%) (x)
Code (US$m) (Bt) (Bt) 16F 17F 16F 17F 16F 17F 16F Rcmd
ANAN TB 463 4.94 5.60 13% 11.3 7.5 1.7 1.4 2.6 4.0 17.6 BUY
AOT TB 15,998 398.00 455.00 14% 29.1 25.2 4.7 4.1 1.1 1.2 17.0 BUY
CK TB 1,478 31.00 40.00 29% 24.0 26.7 2.3 2.2 1.2 1.1 10.2 BUY
CPALL TB 15,798 62.50 75.00 20% 34.6 28.0 13.0 11.4 2.0 2.5 40.2 Buy
GL TB 2,457 57.25 88.00 54% 79.6 42.5 10.8 6.5 0.5 0.6 14.0 BUY
IVL TB 4,538 33.50 42.00 25% 10.0 16.1 1.8 1.7 3.5 2.2 18.9 BUY
MTLS TB 1,473 24.70 32.00 30% 37.6 25.0 7.9 6.4 1.0 1.2 22.7 BUY
SCC TB 16,747 496.00 580.00 17% 11.2 11.6 2.5 2.2 3.6 3.5 23.9 BUY
TISCO TB 1,357 60.25 65.00 8% 9.6 8.2 1.5 1.4 4.0 4.1 17.0 BUY
TKN TB 1,087 28.00 32.00 14% 51.5 33.9 18.0 14.9 1.2 1.8 37.6 BUY
Source: Company, DBS Vickers
Market Focus
Page 4
Stock Picks
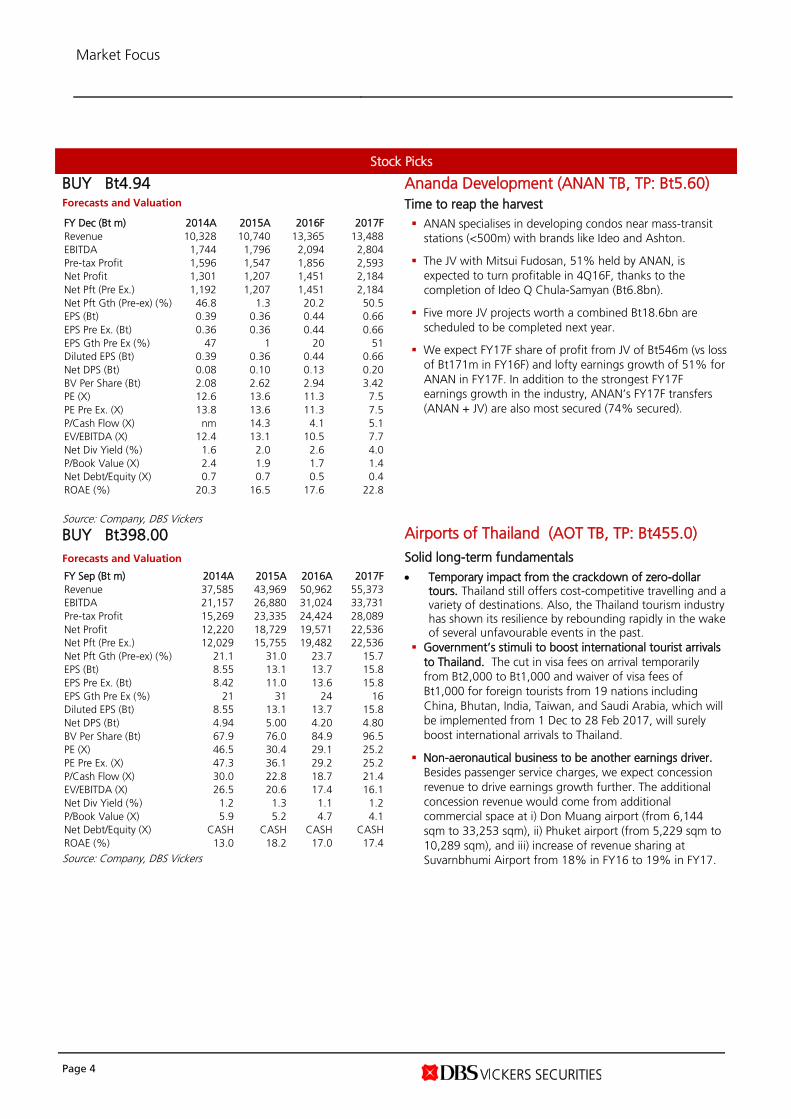
BUY Bt4.94 Forecasts and Valuation
Ananda Development (ANAN TB, TP: Bt5.60)
Time to reap the harvest
FY Dec (Bt m) 2014A 2015A 2016F 2017F
Revenue 10,328 10,740 13,365 13,488
EBITDA 1,744 1,796 2,094 2,804
Pre-tax Profit 1,596 1,547 1,856 2,593
Net Profit 1,301 1,207 1,451 2,184
Net Pft (Pre Ex.) 1,192 1,207 1,451 2,184
Net Pft Gth (Pre-ex) (%) 46.8 1.3 20.2 50.5
EPS (Bt) 0.39 0.36 0.44 0.66
EPS Pre Ex. (Bt) 0.36 0.36 0.44 0.66
EPS Gth Pre Ex (%) 47 1 20 51
Diluted EPS (Bt) 0.39 0.36 0.44 0.66
Net DPS (Bt) 0.08 0.10 0.13 0.20
BV Per Share (Bt) 2.08 2.62 2.94 3.42
PE (X) 12.6 13.6 11.3 7.5
PE Pre Ex. (X) 13.8 13.6 11.3 7.5
P/Cash Flow (X) nm 14.3 4.1 5.1
EV/EBITDA (X) 12.4 13.1 10.5 7.7
Net Div Yield (%) 1.6 2.0 2.6 4.0
P/Book Value (X) 2.4 1.9 1.7 1.4
Net Debt/Equity (X) 0.7 0.7 0.5 0.4
ROAE (%) 20.3 16.5 17.6 22.8
Source: Company, DBS Vickers
ANAN specialises in developing condos near mass-transit
stations (<500m) with brands like Ideo and Ashton.
The JV with Mitsui Fudosan, 51% held by ANAN, is
expected to turn profitable in 4Q16F, thanks to the
completion of Ideo Q Chula-Samyan (Bt6.8bn).
Five more JV projects worth a combined Bt18.6bn are
scheduled to be completed next year.
We expect FY17F share of profit from JV of Bt546m (vs loss
of Bt171m in FY16F) and lofty earnings growth of 51% for
ANAN in FY17F. In addition to the strongest FY17F
earnings growth in the industry, ANAN’s FY17F transfers
(ANAN + JV) are also most secured (74% secured).
BUY Bt398.00
Forecasts and Valuation
Airports of Thailand (AOT TB, TP: Bt455.0)
Solid long-term fundamentals
FY Sep (Bt m) 2014A 2015A 2016A 2017F
Revenue 37,585 43,969 50,962 55,373
EBITDA 21,157 26,880 31,024 33,731
Pre-tax Profit 15,269 23,335 24,424 28,089
Net Profit 12,220 18,729 19,571 22,536
Net Pft (Pre Ex.) 12,029 15,755 19,482 22,536
Net Pft Gth (Pre-ex) (%) 21.1 31.0 23.7 15.7
EPS (Bt) 8.55 13.1 13.7 15.8
EPS Pre Ex. (Bt) 8.42 11.0 13.6 15.8
EPS Gth Pre Ex (%) 21 31 24 16
Diluted EPS (Bt) 8.55 13.1 13.7 15.8
Net DPS (Bt) 4.94 5.00 4.20 4.80
BV Per Share (Bt) 67.9 76.0 84.9 96.5
PE (X) 46.5 30.4 29.1 25.2
PE Pre Ex. (X) 47.3 36.1 29.2 25.2
P/Cash Flow (X) 30.0 22.8 18.7 21.4
EV/EBITDA (X) 26.5 20.6 17.4 16.1
Net Div Yield (%) 1.2 1.3 1.1 1.2
P/Book Value (X) 5.9 5.2 4.7 4.1
Net Debt/Equity (X) CASH CASH CASH CASH
ROAE (%) 13.0 18.2 17.0 17.4
Source: Company, DBS Vickers
Temporary impact from the crackdown of zero-dollar tours. Thailand still offers cost-competitive travelling and a variety of destinations. Also, the Thailand tourism industry has shown its resilience by rebounding rapidly in the wake of several unfavourable events in the past.
Government’s stimuli to boost international tourist arrivals
to Thailand. The cut in visa fees on arrival temporarily
from Bt2,000 to Bt1,000 and waiver of visa fees of
Bt1,000 for foreign tourists from 19 nations including
China, Bhutan, India, Taiwan, and Saudi Arabia, which will
be implemented from 1 Dec to 28 Feb 2017, will surely
boost international arrivals to Thailand.
Non-aeronautical business to be another earnings driver.
Besides passenger service charges, we expect concession
revenue to drive earnings growth further. The additional
concession revenue would come from additional
commercial space at i) Don Muang airport (from 6,144
sqm to 33,253 sqm), ii) Phuket airport (from 5,229 sqm to
10,289 sqm), and iii) increase of revenue sharing at
Suvarnbhumi Airport from 18% in FY16 to 19% in FY17.

Market Focus
Page 5
BUY Bt31.00 Forecasts and Valuation
Ch. Karnchang (CK TB, TP: 40.0)
King of infrastructure plays
FY Dec (Bt m) 2014A 2015A 2016F 2017F
Revenue 32,951 34,912 47,389 44,833
EBITDA 3,776 3,178 4,981 5,978
Pre-tax Profit 2,700 2,719 2,559 2,154
Net Profit 2,296 2,193 2,184 1,968
Net Pft (Pre Ex.) 992 182 2,184 1,968
Net Pft Gth (Pre-ex) (%) nm (81.7) 1,102.2 (9.9)
EPS (Bt) 1.36 1.29 1.29 1.16
EPS Pre Ex. (Bt) 0.59 0.11 1.29 1.16
EPS Gth Pre Ex (%) nm (82) 1,102 (10)
Diluted EPS (Bt) 1.39 1.33 1.32 1.19
Net DPS (Bt) 0.35 0.40 0.39 0.35
BV Per Share (Bt) 11.3 12.1 13.2 14.0
PE (X) 22.9 23.9 24.0 26.7
PE Pre Ex. (X) 52.9 289.1 24.0 26.7
P/Cash Flow (X) 48.4 nm nm 377.5
EV/EBITDA (X) 23.7 32.0 23.5 20.1
Net Div Yield (%) 1.1 1.3 1.2 1.1
P/Book Value (X) 2.7 2.6 2.3 2.2
Net Debt/Equity (X) 1.9 2.3 2.8 2.8
ROAE (%) 12.9 11.1 10.2 8.5
Source: Company, DBS Vickers
We see abundant opportunities for CK, thanks to the
rollout of infrastructure projects – especially the MRT
works which CK has a strong competitive edge. We expect
the infrastructure spending in FY17 to reach Bt500bn
CK has gained 32% market share of the bidding result of
the Bt77bn MRT orange line, which is the highest market
share among other major contractors
Additionally, we expect CK to secure the M&E system and
O&M service* contracts for the blue line extension project,
worth Bt25bn, from Bangkok Expressway and Metro PCL
(BEM TB), this year
* Operations Service and Maintenance (O&M); Mechanical and
Electrical (M&E)
Reiterate BUY; currently CK is the top pick in the
contractor sector. Our target price of Bt40.0 is based on
SOP valuation, comprising Bt15 for the construction
business and Bt25 for its investment.
BUY Bt62.50 Forecasts and Valuation
CPALL (CPALL TB, TP: Bt75.00)
Persistent strength
FY Dec (Bt m) 2014A 2015A 2016F 2017F
Revenue 357,766 391,817 436,663 492,038
EBITDA 26,802 32,554 35,880 41,077
Pre-tax Profit 12,589 16,884 19,963 25,017
Net Profit 10,200 13,682 16,219 20,094
Net Pft (Pre Ex.) 9,823 13,687 16,219 20,094
Net Pft Gth (Pre-ex) (%) (10.7) 39.3 18.5 23.9
EPS (Bt) 1.13 1.52 1.80 2.24
EPS Pre Ex. (Bt) 1.09 1.52 1.80 2.24
EPS Gth Pre Ex (%) (11) 39 19 24
Diluted EPS (Bt) 1.13 1.52 1.80 2.24
Net DPS (Bt) 0.82 1.07 1.26 1.57
BV Per Share (Bt) 3.43 4.16 4.82 5.49
PE (X) 55.3 41.0 34.6 28.0
PE Pre Ex. (X) 57.2 41.0 34.6 28.0
P/Cash Flow (X) 21.3 17.9 18.3 16.5
EV/EBITDA (X) 27.3 22.5 20.3 17.7
Net Div Yield (%) 1.3 1.7 2.0 2.5
P/Book Value (X) 18.2 15.0 13.0 11.4
Net Debt/Equity (X) 4.7 4.0 3.4 3.0
ROAE (%) 34.3 40.2 40.2 43.4
Source: Company, DBS Vickers
Driven by aggressive expansion plan. CPALL continues to
aggressively expand the number of outlets. It plans to roll
out at least 700 stores p.a. and has a target to reach
12,000 stores in the next three years.
Expanding margins. CPALL’s gross margin should be
healthy, thanks to economies of scale from a larger
network and increasing contribution from higher-margin
products such as ready-to-eat meals and health and beauty
items.
Healthier balance sheet. CPALL issued perpetual
debentures worth c.Bt10bn in Nov to refinance its existing
debts. The perpetual debenture would be classified as
equity and will lower its debt to equity (we expect the end-
2016 ratio to fall from 4.5x in 3Q16 to 3.5x). Interest
expenses on the perpetual debenture will not be booked in
P&L statements, but instead flow from retained earnings in
the balance sheet. However, this should have only a
minimal impact on its ability to pay dividends.
Market Focus
Page 6
BUY Bt57.25
Forecasts and Valuation
Group Lease (GL TB, TP: Bt88.00)
The best has yet to come
FY Dec (Btm) 2014A 2015A 2016F 2017F
Pre-prov. Profit 630 1,083 1,593 2,849
Net Profit 116 583 1,097 2,209
Net Pft (Pre Ex.) 116 583 1,097 2,209
Net Pft Gth (Pre-ex) (%) (51.7) 402.0 88.1 101.5
EPS (Bt) 0.11 0.41 0.72 1.35
EPS Pre Ex. (Bt) 0.11 0.41 0.72 1.35
EPS Gth Pre Ex (%) (56) 269 77 87
Diluted EPS (Bt) 0.11 0.41 0.72 1.35
PE Pre Ex. (X) 519.2 140.7 79.6 42.5
Net DPS (Bt) 0.06 0.16 0.28 0.34
Div Yield (%) 0.1 0.3 0.5 0.6
ROAE Pre Ex. (%) 4.9 11.5 14.0 19.6
ROAE (%) 4.9 11.5 14.0 19.6
ROA (%) 1.8 6.5 7.8 12.2
BV Per Share (Bt) 2.39 5.29 5.30 8.79
P/Book Value (x) 24.0 10.8 10.8 6.5
Source: Company, DBS Vickers
At present, it has presence in five countries outside
Thailand. GL now has investments in Thailand and five
other countries, namely Cambodia, Laos, Indonesia,
Myanmar, and Sri Lanka. The company is now operating
three key businesses, i.e. hire purchase, asset-backed
loans, and microfinance. Its unique Digital Finance Platform
is very successful and has now been used in, and will also
be applied to GL’s operations in other countries.
Leveraging its large customer/supplier networks. Other
than HP loans, GL now also provides asset-backed loans to
retail customers and working capital loans to suppliers
(SMEs). GL also earns consulting services fees from
suppliers on services rendered to enable its products to
reach potential customers. Those non-HP businesses are
more profitable and will soon become a substantial part of
GL’s income.
Growth story does not end here. GL is always looking for
new investment opportunities across countries, banking on
the 2.5bn potential customers worldwide who have no
credit history and no access to traditional finance. GL
believes it can utilise its Digital Finance Platform and expand
into the rural areas of several countries. In three years, GL
expects overseas businesses to contribute 90% of its profit.
BUY Bt33.50 Forecasts and Valuation
Indorama Ventures (IVL TB, TP: Bt42.00)
Earnings optimism continues
FY Dec (Bt m) 2014A 2015A 2016F 2017F
Revenue 243,907 234,698 231,568 251,435
EBITDA 12,736 16,905 28,203 30,505
Pre-tax Profit 3,586 8,769 20,154 14,015
Net Profit 1,675 6,609 16,208 10,048
Net Pft (Pre Ex.) 234 2,935 9,581 10,048
Net Pft Gth (Pre-ex) (%) nm 1,153.7 226.4 4.9
EPS (Bt) 0.35 1.37 3.37 2.09
EPS Pre Ex. (Bt) 0.05 0.61 1.99 2.09
EPS Gth Pre Ex (%) nm 1,154 226 5
Diluted EPS (Bt) 0.35 1.37 3.37 2.09
Net DPS (Bt) 0.38 0.48 1.18 0.73
BV Per Share (Bt) 15.1 16.6 19.1 20.2
PE (X) 96.3 24.4 10.0 16.1
PE Pre Ex. (X) 688.9 54.9 16.8 16.1
P/Cash Flow (X) 7.2 6.5 4.2 8.1
EV/EBITDA (X) 17.8 14.3 9.0 8.7
Net Div Yield (%) 1.1 1.4 3.5 2.2
P/Book Value (X) 2.2 2.0 1.8 1.7
Net Debt/Equity (X) 0.8 0.9 0.9 1.0
ROAE (%) 2.5 8.7 18.9 10.6
Source: Company, DBS Vickers
Positive view is intact. IVL’s earnings outlook should be
driven by sales volume growth and more contribution from
high value-added products. Its share price performance
however has not fully reflected this positive development.
HVA capacity to boost earnings and margins. Several
acquisitions of high-value-added (HVA) products in 2016
would continue to lift IVL’s margin and its market
positioning in specialty chemical markets. These HVA
products would be the key factor in stabilising IVL’s core
EBITDA/ton in the longer term given its steady margins.
Core EBITDA/ton of HVA in 9M16 at US$225/ton was way
above that of commodity-grade products, which only
averaged US$54/ton.
Core EBITDA/ton is expected to gradually improve. We
estimate IVL’s core EBITDA/ton to gradually increase from
US$93/ton in 2015 to US$97-98 by 2018, given a higher
proportion of HVA products in its portfolio. This is
expected to rise to >US$100/ton by 2019 when the ethane
cracker in the US starts operations in late 2017 after the
completion of the refurbishment of the plant.
Beneficiary of strong USD. IVL is one of the beneficiaries of
strong USD as its product price is linked to USD while
operating cost is largely in local currencies. Its local
presence in each region also protects the company from
trade barrier.

Market Focus
Page 7
BUY Bt24.70
Forecasts and Valuation
Muangthai Leasing (MTLS TB, TP: Bt32.00)
Stellar growth
FY Dec (Btm) 2014A 2015A 2016F 2017F
Pre-prov. Profit 694 1,056 2,065 3,140
Net Profit 544 825 1,392 2,098
Net Pft (Pre Ex.) 544 825 1,392 2,098
Net Pft Gth (Pre-ex) (%) 54.8 51.6 68.7 50.8
EPS (Bt) 0.32 0.39 0.66 0.99
EPS Pre Ex. (Bt) 0.32 0.39 0.66 0.99
EPS Gth Pre Ex (%) 39 21 69 51
Diluted EPS (Bt) 0.32 0.39 0.66 0.99
PE Pre Ex. (X) 76.8 63.5 37.6 25.0
Net DPS (Bt) 0.13 0.20 0.25 0.30
Div Yield (%) 0.5 0.8 1.0 1.2
ROAE Pre Ex. (%) 15.5 15.3 22.7 28.3
ROAE (%) 15.5 15.3 22.7 28.3
ROA (%) 7.4 7.5 7.3 6.8
BV Per Share (Bt) 3.02 2.67 3.12 3.86
P/Book Value (x) 8.2 9.3 7.9 6.4
Source: Company, DBS Vickers
Aggressive branch expansion. MTLS targets to have 1,600
branches by end-2016 and 2,200 by end-2017. In 3Q16,
279 branches were added, making the total number at
1,515.
Robust balance sheet. Its strong balance sheet is the key
factor to support the company’s aggressive business
expansion (NPL=0.95%; coverage ratio >280%; and D/E
ratio=2.4x at end-3Q16).
Strong growth in portfolio and earnings. We expect
MTLS's loan portfolio and EPS to expand 87%/46% and
69%/51% respectively in FY16/17F
BUY, with Bt32.00 TP. Our TP is based on GGM (21%
ROE, 10% growth, and 11% cost of equity).
BUY Bt496.00 Forecasts and Valuation
Siam Cement (SCC TB, TP: Bt580.00)
Lift from regional presence
FY Dec (Bt m) 2014A 2015A 2016F 2017F
Revenue 487,545 439,614 424,972 448,236
EBITDA 67,256 89,639 95,657 99,105
Pre-tax Profit 41,928 59,793 67,112 66,367
Net Profit 33,615 45,400 53,212 51,264
Net Pft (Pre Ex.) 33,615 45,400 53,212 51,264
Net Pft Gth (Pre-ex) (%) (8.0) 35.1 17.2 (3.7)
EPS (Bt) 28.0 37.8 44.3 42.7
EPS Pre Ex. (Bt) 28.0 37.8 44.3 42.7
EPS Gth Pre Ex (%) (8) 35 17 (4)
Diluted EPS (Bt) 28.0 37.8 44.3 42.7
Net DPS (Bt) 12.5 16.0 17.8 17.2
BV Per Share (Bt) 148 172 199 225
PE (X) 17.7 13.1 11.2 11.6
PE Pre Ex. (X) 17.7 13.1 11.2 11.6
P/Cash Flow (X) 12.5 8.8 7.7 8.2
EV/EBITDA (X) 11.8 8.9 8.3 8.0
Net Div Yield (%) 2.5 3.2 3.6 3.5
P/Book Value (X) 3.4 2.9 2.5 2.2
Net Debt/Equity (X) 0.8 0.7 0.5 0.5
ROAE (%) 19.8 23.7 23.9 20.1
Source: Company, DBS Vickers
Chemical segment still the key earnings driver. The
chemical segment including its associate in Indonesia could
still be the key driver for earnings, the cement and building
materials segment is expected to provide upside potential
to profit in 2017-18F given more cement demand for
infrastructure projects in Thailand and ASEAN.
Focusing on adding high value-added products. SCC has
continued to emphasise its strategic move to increase the
proportion of HVA products in its portfolio since 2004 in
order to reduce volatility from commodity-grade products,
and improve margins. Revenue from HVA products already
accounted for 38% of total revenue.
Strong presence in CLMV market. SCC has been proactive
in expanding its business into Cambodia, Laos, Myanmar
and Vietnam (CLMV) with revenue contribution from this
market accounting for 12.8% of total sales revenue in
9M16. This was mainly from cement business; capacity in
this market accounts for 20% of total cement capacity. Its
first cement plant in the CLMV market started operations
in 2007 in Cambodia. A new plant in Laos will commence
operations in 1H17.
Market Focus
Page 8
BUY Bt60.25 Forecasts and Valuation
TISCO Financial Group (TISCO TB; TP Bt65.00) The tide has turned
FY Dec (Btm) 2014A 2015A 2016F 2017F
Pre-prov. Profit 9,692 10,468 10,133 10,489
Net Profit 4,250 4,250 5,035 5,870
Net Pft (Pre Ex.) 4,250 4,250 5,035 5,870
Net Pft Gth (Pre-ex) (%) 1.7 0.0 18.5 16.6
EPS (Bt) 5.31 5.31 6.29 7.33
EPS Pre Ex. (Bt) 5.31 5.31 6.29 7.33
EPS Gth Pre Ex (%) (1) 0 18 17
Diluted EPS (Bt) 5.31 5.31 6.29 7.33
PE Pre Ex. (X) 11.4 11.3 9.6 8.2
Net DPS (Bt) 2.00 2.40 2.40 2.50
Div Yield (%) 3.3 4.0 4.0 4.1
ROAE Pre Ex. (%) 17.4 15.8 17.0 17.7
ROAE (%) 17.4 15.8 17.0 17.7
ROA (%) 1.3 1.4 1.8 2.1
BV Per Share (Bt) 32.1 35.1 39.0 43.9
P/Book Value (x) 1.9 1.7 1.5 1.4
Source: Company, DBS Vickers
Loan growth to resume in 2017. After three consecutive
years of portfolio contraction, TISCO expects its auto hire
purchase (HP) portfolio to continue to contract for some
time in 2017 but with flattish or marginal growth by the
end of the year. With that and the strong growth in
consumer loans as well as SME loans, the total portfolio is
likely to see growth in 2017. TISCO’s loan portfolio now
comprises 63% auto HP, 19% corporate, 8% SME, and
9% consumer loans
NPL ratio passed its peak; credit cost on downtrend.
Unlike big banks, TISCO had faced asset-quality problems
first and from auto HP loans. Now, we believe the asset-
quality cycle has already passed its bottom, and we expect
credit cost to go down further in 2017. Recall that over
the course of 2016, as TISCO’s asset quality continued to
improve along with its strong earnings performance (albeit
from the cost side), TISCO has set up general provisions to
counter cycles and cushion against future economic
uncertainties – resulting in a stronger coverage ratio. With
that, we believe TISCO does not need to provide excess
reserve to boost its coverage ratio.
Improvement expected from top- to bottom-line. We
expect to see improvements in TISCO’s top- to bottom-line
in 2017. Its top-line growth should be driven by both NII
(loan and NIM expansion) and non-NII (improving economy
and capital market). Credit cost should be lower than
2016’s, in line with improving asset quality and coverage
ratio.
BUY Bt28.00 Forecasts and Valuation
Taokaenoi Food & Marketing (TKN TB, TP: Bt32) Better and stronger
FY Dec (Bt m) 2014A 2015A 2016F 2017F
Revenue 2,695 3,500 4,595 6,252
EBITDA 381 636 1,090 1,504
Pre-tax Profit 255 495 937 1,321
Net Profit 199 397 750 1,140
Net Pft (Pre Ex.) 190 391 750 1,140
Net Pft Gth (Pre-ex) (%) 44.3 106.1 91.9 52.0
EPS (Bt) 0.19 0.38 0.54 0.83
EPS Pre Ex. (Bt) 0.19 0.37 0.54 0.83
EPS Gth Pre Ex (%) 44 100 46 52
Diluted EPS (Bt) 0.19 0.38 0.54 0.83
Net DPS (Bt) 0.20 0.30 0.33 0.50
BV Per Share (Bt) 0.35 1.75 1.55 1.88
PE (X) 143.8 74.2 51.5 33.9
PE Pre Ex. (X) 150.6 75.4 51.5 33.9
P/Cash Flow (X) 110.1 51.2 48.1 31.3
EV/EBITDA (X) 75.7 44.6 34.4 24.8
Net Div Yield (%) 0.7 1.1 1.2 1.8
P/Book Value (X) 81.0 16.0 18.0 14.9
Net Debt/Equity (X) 0.8 CASH CASH CASH
ROAE (%) 65.2 36.1 37.6 48.1
Source: Company, DBS Vickers
Thailand’s leader of seaweed snacks manufacturer. TKN’s
brand, Taokaenoi, is well recognised among local and
foreign customers and has a market share of 66% for
Thailand’s seaweed snacks. Its products are available
through all main distribution channels in Thailand and it is
expanding overseas. Exports sales account for 56% of total
sales and its products are available in 35 countries.
New plant with BOI tax privileges (+90% capacity) will
come online in 1Q17. To support the high demand (mainly
driven by export sales to China), TKN is constructing a new
plant in Ayutthaya. The new plant with a designed capacity
of 6,000 tons (+90% capacity) is expected to be completed
in early 2017. With the tax privileges, we expect TKN
effective tax rate would reduce from 20% in FY16F to
14% in FY17F and 7% in FY18F. TKN has plans for more
automation to improve efficiency and reduce labour costs.
Robust 3-year earnings CAGR of 38% (2016-2019F). We
believe TKN will deliver impressive earnings growth of
92%, 52%, 36% and 27% in FY16, FY17, FY18 and FY19,
respectively. The robust growth will be driven by i) a sharp
increase in sales, supported by the high demand with the
new capacity coming online, and ii) improving gross
margins, as it enhances its operational efficiency.
Market Focus
Page 9
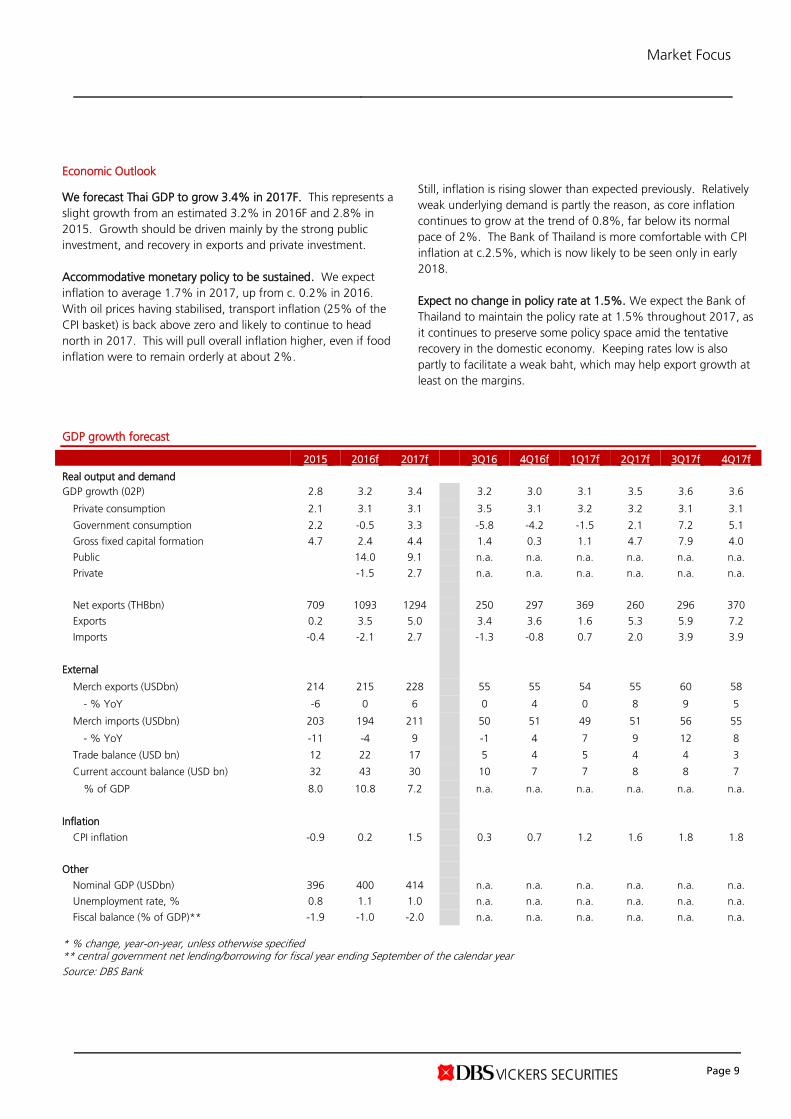
Economic Outlook
We forecast Thai GDP to grow 3.4% in 2017F. This represents a
slight growth from an estimated 3.2% in 2016F and 2.8% in
2015. Growth should be driven mainly by the strong public
investment, and recovery in exports and private investment.
Accommodative monetary policy to be sustained. We expect
inflation to average 1.7% in 2017, up from c. 0.2% in 2016.
With oil prices having stabilised, transport inflation (25% of the
CPI basket) is back above zero and likely to continue to head
north in 2017. This will pull overall inflation higher, even if food
inflation were to remain orderly at about 2%.
Still, inflation is rising slower than expected previously. Relatively
weak underlying demand is partly the reason, as core inflation
continues to grow at the trend of 0.8%, far below its normal
pace of 2%. The Bank of Thailand is more comfortable with CPI
inflation at c.2.5%, which is now likely to be seen only in early
2018.
Expect no change in policy rate at 1.5%. We expect the Bank of
Thailand to maintain the policy rate at 1.5% throughout 2017, as
it continues to preserve some policy space amid the tentative
recovery in the domestic economy. Keeping rates low is also
partly to facilitate a weak baht, which may help export growth at
least on the margins.
GDP growth forecast
2015 2016f 2017f
3Q16 4Q16f 1Q17f 2Q17f 3Q17f 4Q17f
Real output and demand
GDP growth (02P) 2.8 3.2 3.4
3.2 3.0 3.1 3.5 3.6 3.6
Private consumption 2.1 3.1 3.1
3.5 3.1 3.2 3.2 3.1 3.1
Government consumption 2.2 -0.5 3.3
-5.8 -4.2 -1.5 2.1 7.2 5.1
Gross fixed capital formation 4.7 2.4 4.4
1.4 0.3 1.1 4.7 7.9 4.0
Public
14.0 9.1
n.a. n.a. n.a. n.a. n.a. n.a.
Private
-1.5 2.7
n.a. n.a. n.a. n.a. n.a. n.a.
Net exports (THBbn) 709 1093 1294
250 297 369 260 296 370
Exports 0.2 3.5 5.0
3.4 3.6 1.6 5.3 5.9 7.2
Imports -0.4 -2.1 2.7
-1.3 -0.8 0.7 2.0 3.9 3.9
External
Merch exports (USDbn) 214 215 228
55 55 54 55 60 58
- % YoY -6 0 6
0 4 0 8 9 5
Merch imports (USDbn) 203 194 211
50 51 49 51 56 55
- % YoY -11 -4 9
-1 4 7 9 12 8
Trade balance (USD bn) 12 22 17
5 4 5 4 4 3
Current account balance (USD bn) 32 43 30
10 7 7 8 8 7
% of GDP 8.0 10.8 7.2
n.a. n.a. n.a. n.a. n.a. n.a.
Inflation
CPI inflation -0.9 0.2 1.5
0.3 0.7 1.2 1.6 1.8 1.8
Other
Nominal GDP (USDbn) 396 400 414
n.a. n.a. n.a. n.a. n.a. n.a.
Unemployment rate, % 0.8 1.1 1.0
n.a. n.a. n.a. n.a. n.a. n.a.
Fiscal balance (% of GDP)** -1.9 -1.0 -2.0
n.a. n.a. n.a. n.a. n.a. n.a.
* % change, year-on-year, unless otherwise specified ** central government net lending/borrowing for fiscal year ending September of the calendar year
Source: DBS Bank

Market Focus
Page 10
Earnings Outlook
2016F universe net profit growth estimated at 36%. The strong
earnings growth would be boosted largely by the Energy sector,
mainly from PTTEP and PTT.
Earnings should continue to grow, albeit at a much slower pace
of 7% in 2017. Our current forecast is a bit conservative
compared with consensus earnings growth of 15% for 2017.
We believe the key difference was mainly in the banking and
energy sector, due to different in provisioning and oil price
assumptions.
Earnings growth by sector*
YE Dec (Btm) FY15A FY16F FY17F FY16F
Gwt
FY17F
Gwt
Banking 168,413 172,810 185,241 3% 7% Finance 4,003 5,115 7,036 28% 38% Con. Mat. 50,478 56,102 54,395 11% -3% Chemicals 27,112 38,579 36,653 42% -5% Contractors 6,049 4,604 5,556 -24% 21% Property 42,709 42,140 45,536 -1% 8% - Commercial 7,880 9,201 10,092 17% 10% - Residential 32,976 32,421 34,532 -2% 7% - Industrial 1,853 518 912 -72% 76% Property Fund 21,374 25,351 27,338 19% 8% Energy 18,959 150,708 161,145 695% 7% Media 164 281 436 72% 55% Commerce 24,795 29,308 35,232 18% 20% Transport 11,186 33,157 38,320 196% 16% Tourism 1,874 2,283 2,710 22% 19% Telecom 46,521 34,530 32,651 -26% -5% Electronics 13,019 11,909 13,033 -9% 9% Food 23,798 26,519 28,606 11% 8% Health Care Services
12,120 12,875 14,708 6% 14%
Total 475,892 646,271 688,595 36% 7%
Source: Companies and DBS Vickers * Companies under DBSV coverage
Valuation
Thai market is now trading at 2017F PE of 14.5x. This is slightly
higher than the 10-year average PE of 14.3x. Compared to
regional markets, the Thai market’s PE is higher than the regional
average PE of 14.0x.
Our SET Index target is at 1650. This is based on our conservative
2017 EPS growth of 7% and a PE of 15.5x based on 0.5SD of
historical average.
Regional comparison: PE vs. EPS growth
EPS Gth (%) PE (x)
16F 17F 16F 17F
Singapore (4.7) 12.1 16.1 14.4
HK HSI (5.2) 11.8 11.9 10.7
HK HSCCI (Red) (6.8) 25.7 12.4 9.9
HK HSCEI (H) (5.6) 9.2 7.6 6.9
CSI300 (1.3) 13.5 14.2 12.5
SH Comp 7.0 13.6 14.8 13.0
SZ Comp (5.2) 11.8 11.9 10.7
Malaysia 0.2 9.2 17.2 15.8
Thailand 35.8 7.1 15.5 14.5
Indonesia 18.4 17.5 15.6 13.3
Simple Average 3.3 13.2 13.7 12.7
Source: DBS Bank, DBS Vickers
Valuation by sector*
PE (x)
YE Dec FY15A FY16F FY17F
Banking 10.0 10.1 9.4 Finance 40.0 32.4 24.5 Con. Mat. 12.4 11.1 11.5 Chemicals 16.4 11.5 12.2 Contractors 20.4 26.8 22.2 Property 13.9 14.1 13.1 - Commercial 32.3 27.7 25.2 - Residential 9.6 9.9 9.3 - Industrial 11.4 41.3 23.5 Property Fund 16.1 14.5 13.5 Energy 112.8 13.8 12.6 Media 111.6 66.1 43.1 Commerce 36.1 30.7 25.5 Transport 72.3 24.4 21.1 Tourism 34.6 28.4 24.0 Telecom 12.4 16.7 17.7 Electronics 16.6 18.2 16.6 Food 21.2 19.4 18.0 Health Care Services 44.1 41.1 36.0 Total 20.9 15.5 14.5 Source: SET, DBS Vickers * Companies under DBSV coverage
SET: PE band
Source: SET, DBS Vickers
5
7
9
11
13
15
17
19
21
0
200
400
600
800
1,000
1,200
1,400
1,600
2016F
SET Index (LHS)P/E (x)Median (14.3x)Median+0.5SD (15.7x)Median-0.5SD (13x)
SET P/E Ratio

Market Focus
Page 11
Market Overview and Outlook
2016 Recap
The best performer in the region in 2016. The SET Index surged
19.8% in 2016, making it the best-performing market in the
region. It outperformed regional peers which rose 3.5% during
the same period. The rally was due mainly to the return of
foreign fund flows to the Thai market.
Foreign investors were net buyers of Bt77.9bn of the Thai market
in 2016. Local retail investors were net sellers with the net sell
position amounting to Bt94.6bn. Local institutional investors
were also net sellers, with a net sell position of Bt8.7bn. In terms
of proprietary trading, brokers were net buyers of Bt25.4bn.
The market was led by Paper (+84.5%), Mining (+62.1%),
Professional Services (+51.0%), and Commerce (+41.0%). The
key underperformers in 2016 were Media (-7.9%), and Insurance
(-4.0%).
Mid- and Small-cap stocks led the rally. In 2016, the FTSE
Mid/Small Cap index surged 63%, while the FTSE Large cap
index grew 17%.
SET Index performance vs peers
Dec 2016 2016
Dax 7.9% 6.9%
FTSE 5.3% 14.4%
Nikkei 4.4% 0.4%
Dow Jones 3.3% 13.4%
S&P 500 1.8% 9.5%
NASDAQ 1.1% 7.5%
Indo 2.9% 15.3%
Korea 2.2% 3.3%
SET 2.2% 19.8%
Malay 1.4% -3.0%
Phil 0.9% -1.6%
Taiwan 0.1% 11.0%
India -0.1% 1.8%
Sing -0.8% -0.1%
MXFEJ -2.5% 3.5%
HK -3.5% 0.4%
Shanghai -4.5% -12.3%
H-shares -4.5% -2.8%
Source: Bloomberg Finance L.P., DBS Vickers
Sector performance
Sector Dec 2016 2016
AGRI 18% 58%
STEEL 16% 47%
ETRON 7% 19%
PKG 7% 44%
MINE 7% 62%
PERSON 7% 39%
AUTO 5% 6%
ENERG 5% 38%
PAPER 4% 85%
BANK 4% 18%
CONMAT 3% 1%
MEDIA 3% -8%
HOME 3% 8%
INSUR 3% -4%
IMM 2% 6%
SET 2% 20%
ICT 2% 5%
PROP 2% 5%
PETRO 2% 36%
FOOD 1% 35%
CONS 1% 0%
COMM 1% 41%
FASHION -1% -1%
HELTH -1% 9%
FIN -1% 34%
TOURISM -2% -4%
PROF -2% 51%
PF&REIT -2% 10%
TRANS -2% 15%
Source: Bloomberg Finance L.P., DBS Vickers
Market Focus
Page 12
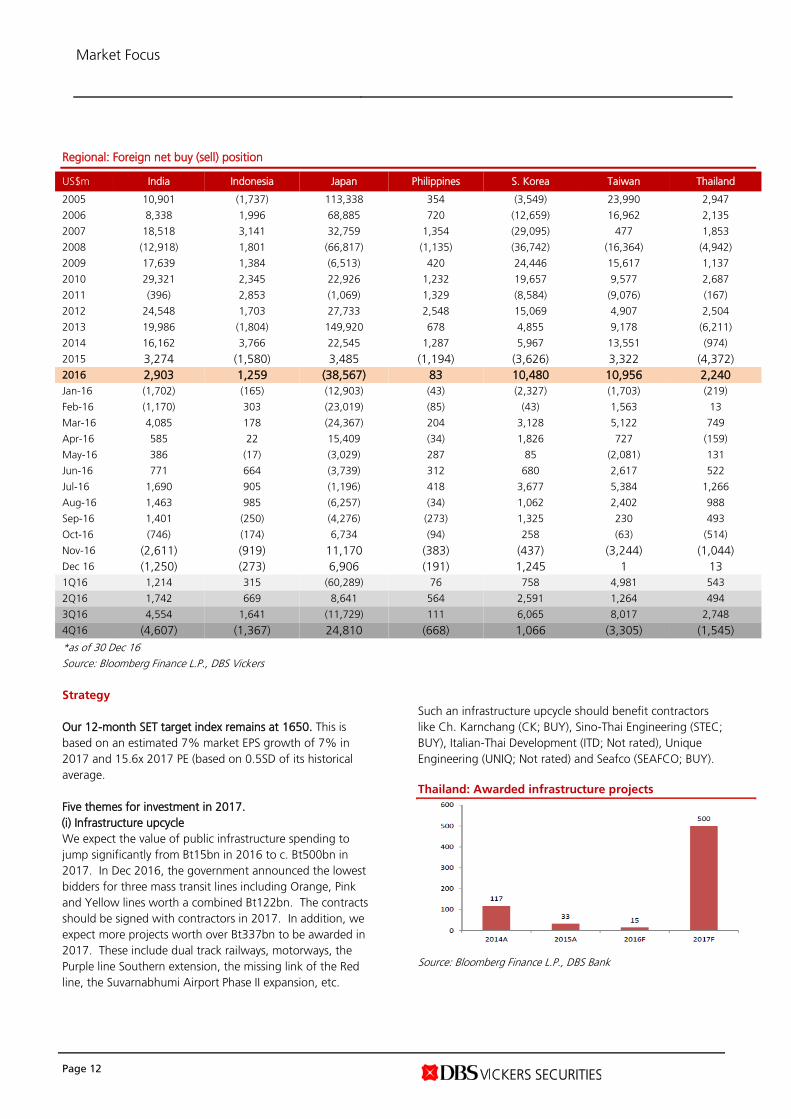
Regional: Foreign net buy (sell) position
US$m India Indonesia Japan Philippines S. Korea Taiwan Thailand
2005 10,901 (1,737) 113,338 354 (3,549) 23,990 2,947
2006 8,338 1,996 68,885 720 (12,659) 16,962 2,135
2007 18,518 3,141 32,759 1,354 (29,095) 477 1,853
2008 (12,918) 1,801 (66,817) (1,135) (36,742) (16,364) (4,942)
2009 17,639 1,384 (6,513) 420 24,446 15,617 1,137
2010 29,321 2,345 22,926 1,232 19,657 9,577 2,687
2011 (396) 2,853 (1,069) 1,329 (8,584) (9,076) (167)
2012 24,548 1,703 27,733 2,548 15,069 4,907 2,504
2013 19,986 (1,804) 149,920 678 4,855 9,178 (6,211)
2014 16,162 3,766 22,545 1,287 5,967 13,551 (974)
2015 3,274 (1,580) 3,485 (1,194) (3,626) 3,322 (4,372)
2016 2,903 1,259 (38,567) 83 10,480 10,956 2,240
Jan-16 (1,702) (165) (12,903) (43) (2,327) (1,703) (219)
Feb-16 (1,170) 303 (23,019) (85) (43) 1,563 13
Mar-16 4,085 178 (24,367) 204 3,128 5,122 749
Apr-16 585 22 15,409 (34) 1,826 727 (159)
May-16 386 (17) (3,029) 287 85 (2,081) 131
Jun-16 771 664 (3,739) 312 680 2,617 522
Jul-16 1,690 905 (1,196) 418 3,677 5,384 1,266
Aug-16 1,463 985 (6,257) (34) 1,062 2,402 988
Sep-16 1,401 (250) (4,276) (273) 1,325 230 493
Oct-16 (746) (174) 6,734 (94) 258 (63) (514)
Nov-16 (2,611) (919) 11,170 (383) (437) (3,244) (1,044)
Dec 16 (1,250) (273) 6,906 (191) 1,245 1 13
1Q16 1,214 315 (60,289) 76 758 4,981 543
2Q16 1,742 669 8,641 564 2,591 1,264 494
3Q16 4,554 1,641 (11,729) 111 6,065 8,017 2,748
4Q16 (4,607) (1,367) 24,810 (668) 1,066 (3,305) (1,545)
*as of 30 Dec 16
Source: Bloomberg Finance L.P., DBS Vickers
Strategy
Our 12-month SET target index remains at 1650. This is
based on an estimated 7% market EPS growth of 7% in
2017 and 15.6x 2017 PE (based on 0.5SD of its historical
average.
Five themes for investment in 2017.
(i) Infrastructure upcycle
We expect the value of public infrastructure spending to
jump significantly from Bt15bn in 2016 to c. Bt500bn in
2017. In Dec 2016, the government announced the lowest
bidders for three mass transit lines including Orange, Pink
and Yellow lines worth a combined Bt122bn. The contracts
should be signed with contractors in 2017. In addition, we
expect more projects worth over Bt337bn to be awarded in
2017. These include dual track railways, motorways, the
Purple line Southern extension, the missing link of the Red
line, the Suvarnabhumi Airport Phase II expansion, etc.
Such an infrastructure upcycle should benefit contractors
like Ch. Karnchang (CK; BUY), Sino-Thai Engineering (STEC;
BUY), Italian-Thai Development (ITD; Not rated), Unique
Engineering (UNIQ; Not rated) and Seafco (SEAFCO; BUY).
Thailand: Awarded infrastructure projects
Source: Bloomberg Finance L.P., DBS Bank
Market Focus
Page 13
(ii) Superior earnings growth outlook
Although our current estimates show market earnings to
inch up only 3% this year, vs consensus estimated growth of
10%, we see superior earnings growth outlook at some
selected companies. Such growth is boosted mainly by
company-specific factors e.g. capacity expansion, outlet
expansion, margin expansion, rising profit contribution from
JV and affiliates, acquisition growth, etc.
The companies that we expect exceptional earnings growth
in 2017 include Ananda Development (ANAN), Indorama
Ventures (IVL), Taokaenoi Marketing (TKN), Muangthai
Leasing (MTLS), Beauty Community (BEAUTY), FN Factory
Outlet (FN) and Workpoint Entertainment (WORK),
Companies with strong earnings growth in 2017
Source: DBS Vickers
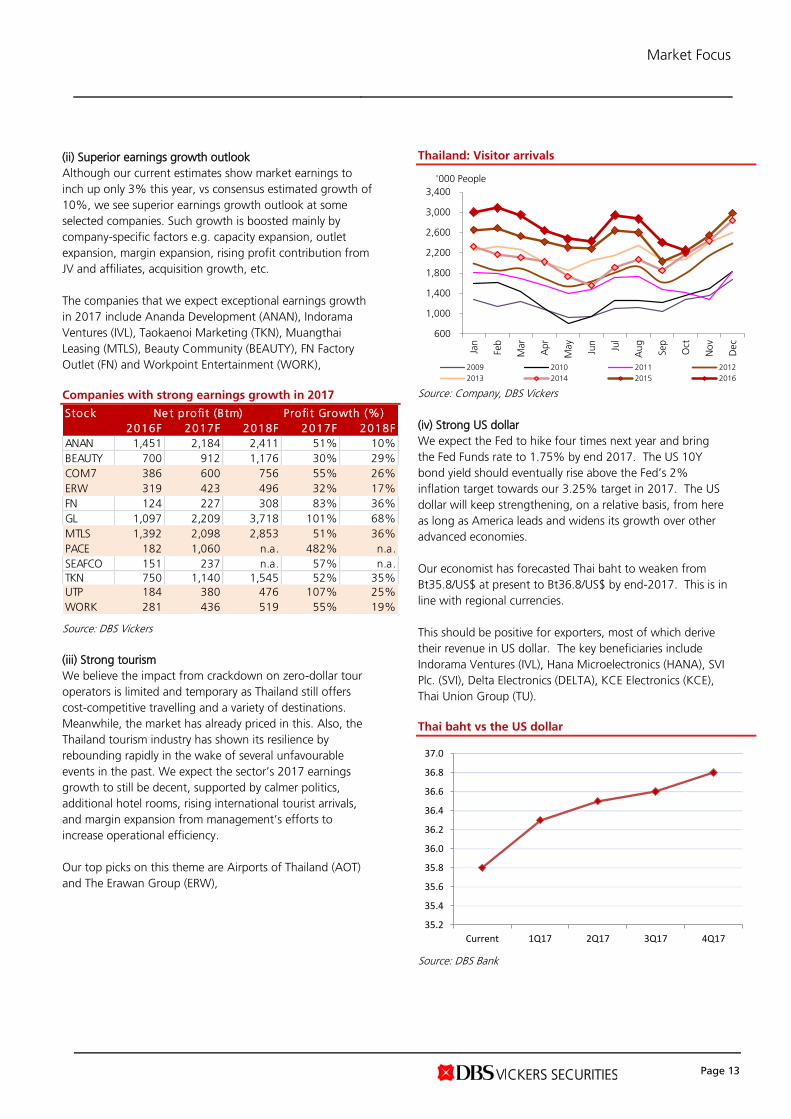
(iii) Strong tourism
We believe the impact from crackdown on zero-dollar tour
operators is limited and temporary as Thailand still offers
cost-competitive travelling and a variety of destinations.
Meanwhile, the market has already priced in this. Also, the
Thailand tourism industry has shown its resilience by
rebounding rapidly in the wake of several unfavourable
events in the past. We expect the sector’s 2017 earnings
growth to still be decent, supported by calmer politics,
additional hotel rooms, rising international tourist arrivals,
and margin expansion from management’s efforts to
increase operational efficiency.
Our top picks on this theme are Airports of Thailand (AOT)
and The Erawan Group (ERW),
Thailand: Visitor arrivals
Source: Company, DBS Vickers
(iv) Strong US dollar
We expect the Fed to hike four times next year and bring
the Fed Funds rate to 1.75% by end 2017. The US 10Y
bond yield should eventually rise above the Fed’s 2%
inflation target towards our 3.25% target in 2017. The US
dollar will keep strengthening, on a relative basis, from here
as long as America leads and widens its growth over other
advanced economies.
Our economist has forecasted Thai baht to weaken from
Bt35.8/US$ at present to Bt36.8/US$ by end-2017. This is in
line with regional currencies.
This should be positive for exporters, most of which derive
their revenue in US dollar. The key beneficiaries include
Indorama Ventures (IVL), Hana Microelectronics (HANA), SVI
Plc. (SVI), Delta Electronics (DELTA), KCE Electronics (KCE),
Thai Union Group (TU).
Thai baht vs the US dollar
Source: DBS Bank
Stock Profi t Growth (%)
2016F 2017F 2018F 2017F 2018F
ANAN 1,451 2,184 2,411 51% 10%
BEAUTY 700 912 1,176 30% 29%
COM7 386 600 756 55% 26%
ERW 319 423 496 32% 17%
FN 124 227 308 83% 36%
GL 1,097 2,209 3,718 101% 68%
MTLS 1,392 2,098 2,853 51% 36%
PACE 182 1,060 n.a. 482% n.a.
SEAFCO 151 237 n.a. 57% n.a.
TKN 750 1,140 1,545 52% 35%
UTP 184 380 476 107% 25%
WORK 281 436 519 55% 19%
Ne t profi t (Btm)
600
1,000
1,400
1,800
2,200
2,600
3,000
3,400
Jan
Feb
Mar
Ap
r
May
Jun
Jul
Au
g
Sep
Oct
No
v
Dec
'000 People
2009 2010 2011 2012
2013 2014 2015 2016
35.2
35.4
35.6
35.8
36.0
36.2
36.4
36.6
36.8
37.0
Current 1Q17 2Q17 3Q17 4Q17

Market Focus
Page 14
(v) CLMV exposure
Despite the weak economic growth at home, a number of
listed companies have ventured into high-growth CLMV
countries to expand their revenue and profit. Thailand’s
GDP is estimated to grow 3.4% in 2017, vs Cambodia
7.1%, Laos 7.1%, Myanmar 8.3% and Vietnam 6.0%.
CLMV have more exciting GDP growth vs Thailand
Source: OECD, DBS Vickers
Companies that have been very successful in expanding into
CLMV include Group Lease (GL), Carabao Group (CBG),
Beauty Community (BEAUTY), Charoen Pokphand Foods
(CPF), Amata Corporation (AMATA), Ch.Karnchang (CK),
and Siam Cement (SCC).
Sector weighting. We recommend that investors be
Overweight on the Construction Contractors, Finance, and
Commerce sectors. These sectors should see strong earnings
growth outlook next year. We rate Media, Telecom and
REIT sectors as Underweight.
SET: Our sector weightings
Source: DBS Vickers
Country
2016 2016F 2017F
Cambodia 7.0 7.1 7.1
Laos 7.4 7.1 7.3
Myanmar 8.7 8.3 8.4
Vietnam 6.7 6.0 6.2
Thailand 2.8 3.2 3.4
Re a l GDP Growth (%)
Sector Reason Top buys
Overweight
Contractor Beneficiary of rising government infrastructure spending CK, STEC
Finance Strong earnings growth outlook GL, MTLS
Commerce Recovering consumption CPALL, BEAUTY
Neutral
Bank Prefer smaller banks to big banks TISCO, TCAP
Building Materials Supported by high value-added and innovative products SCC
Electronics Beneficiary of weak baht HANA, SVI
Energy Market has factored in oil price recovery assumption BCP, PTT
Foods Strong recovery in domestic meat prices and shrimp units TKN
Healthcare Positive outlook but stretched valuation LPH, BDMS
Petrochemicals Olefins chain in good shape, attractive valuation IVL, EPG
Property Prefer those with strong earnings growth outlook ANAN, LH
Transportation Prefer airport to airline AOT, AAV, BEM
Tourism Prefer company with exceptional growth ERW
Underweight
Telecom Fierce competition continues -
REITs Yield spread have compressed, amidst rising bond yields CPNRF, LHHOTEL
Media High competition WORK

Market Focus
Page 15
Sector Update
Tourism Sector
Overweight
Analyst Namida ARTISPONG +662 657 7833 [email protected]
Price Target Price PE
2017F
Div Yld
2017F
EPS CAGR 15-17
(Bt) (Bt) Rec (x) (%) (%)
AOT TB 398.00 455.00 BUY 25.2 1.2 9.7 CENTEL TB 39.75 47.00 BUY 23.5 1.7 16.8 MINT TB 35.75 50.00 BUY 24.1 1.2 -3.7
Source: Company, DBS Vickers
SET Index vs Tourism Sector Stocks
Source: SET, DBS Vickers
Thailand: Visitor arrivals
Source: Company, DBS Vickers
Tourism still going strong 2016 target was revised down
Expect international tourist arrivals to Thailand to
continue to grow
Overweight tourism sector with ERW as top pick
Outlook
2016 target was revised down. Following the passing of
our beloved late King in Oct 2016, hotel operators have
revised down its 2016 revenue target given the expected
impact on their operations in 4Q16 from cancellations of
hotel rooms and postponements of hotel-related activities at
conventions. Meanwhile, Thailand’s Tourism Ministry has
revised down 2016 international tourist arrivals to Thailand
from 34m to 32.4m (+8.4% y-o-y) due to impact from
crackdown on zero-dollar tours. Nevertheless, several
stimulus packages were launched in 4Q16 by the
government to boost consumer spending such as tax break
for domestic tourists for travelling in Thailand and the cut in
visa fees on arrival temporarily for many countries.
Look beyond to 2017. We believe the impact from
crackdown on zero-dollar tours and mourning period is
limited and temporary, as Thailand still offers cost-
competitive travelling and a variety of destinations.
Meanwhile, the market has already priced in this. Also, the
Thailand tourism industry has shown its resilience by
rebounding rapidly in the wake of several unfavourable
events in the past. We expect the sector’s 2017 earnings
growth to still be decent supported by additional hotel
rooms, rising international tourist arrivals, and margin
expansion from management’s efforts to increase
operational efficiency.
ERW is our top buy. Its earnings are now more resilient
given its diversification into lower-end hotel segments. Rising
international tourist arrivals to Thailand would help drive
ERW’s hotel operations as it has the highest exposure to
Thailand's tourism sector. ERW is also taking its first step
overseas into the Philippines in 4Q16. ERW targets to have
20 hotels in the Philippines by FY20F; including three in
Manila that are now under construction. In the next five
years, 13% of EBITDA is expected to be contributed by assets
in the Philippines.
We remain a buy call on AOT. We believe the recent share
price has already priced in concerns over the impact of the
crackdown on zero-dollar tours. The cut in visa fees on arrival
temporarily for foreign tourists from 19 nations including
China, Bhutan, India, Taiwan, and Saudi Arabia, which will
be implemented from 1 Dec to 28 Feb 2017, will surely boost
international arrivals to Thailand.
80%
90%
100%
110%
120%
130%
Jan
-16
Feb
-16
Mar-
16
Ap
r-1
6
May-
16
Jun-1
6
Jul-1
6
Au
g-1
6
Sep
-16
Oct
-16
Nov-
16
Dec-
16
Jan
-17
SET Index AOT TB CENTEL TB MINT TB
600
1,000
1,400
1,800
2,200
2,600
3,000
3,400
Jan
Feb
Mar
Ap
r
May
Jun
Jul
Au
g
Sep
Oct
No
v
Dec
'000 People
2009 2010 2011 2012
2013 2014 2015 2016
Market Focus
Page 16
Construction Sector
Overweight
Analyst Apichaya KETRUTTANABORVORN +662 657 7823 [email protected]
Price Target
Price PE
2017F
Div Yld
2017F
EPS CAGR 15-17
(Bt) (Bt) Rec (x) (%) (%)
CK TB 31.00 40.00 BUY 26.0 1.1 -5.3 STEC TB 27.75 31.00 BUY 28.2 1.8 -0.8 ITD TB* 4.92 NR NR 1.98 0.0 -26.7 UNIQ TB* 19.80 NR NR 19.7 2.0 27.6
* no coverage
Source: Company, DBS Vickers
Thailand: Awarded infrastructure projects
Source: Bloomberg Finance L.P., DBS Bank
Thailand: Bidding result of MRT orange line
* A 60:40 joint venture between CK and STEC
** A 75:15:10 joint venture of BTS, STEC and RATCH
Source: Company, DBS Vickers
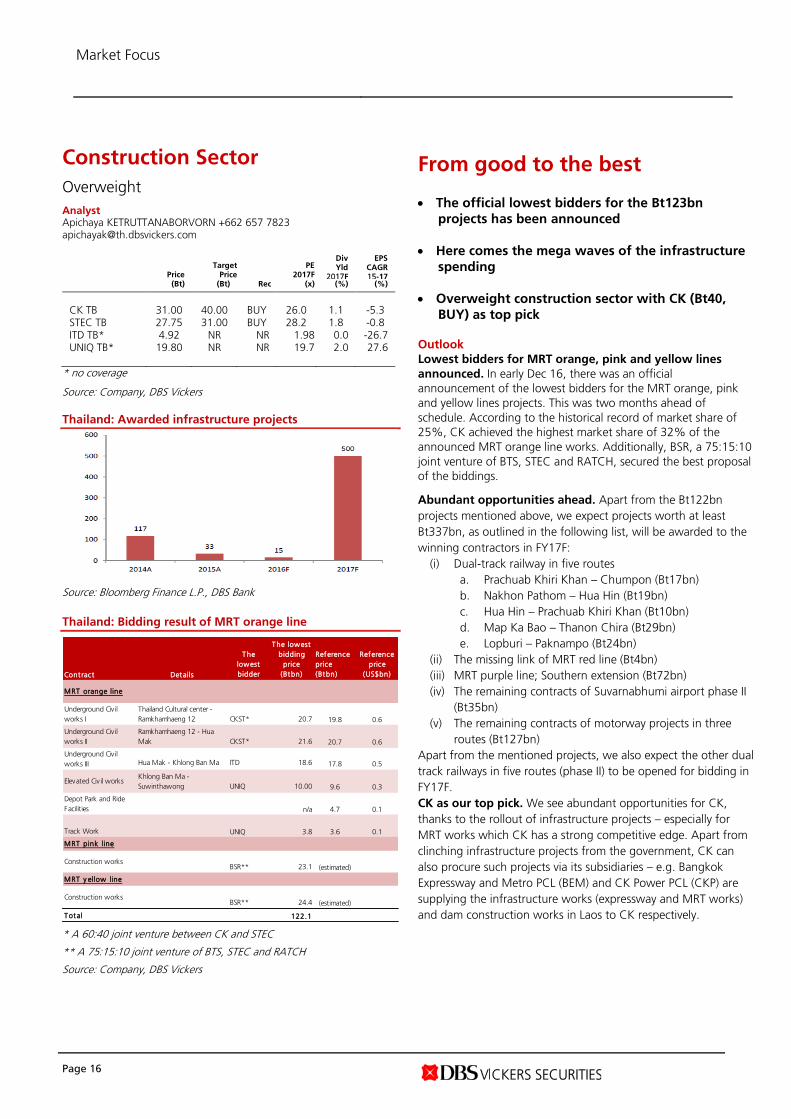
From good to the best The official lowest bidders for the Bt123bn
projects has been announced
Here comes the mega waves of the infrastructure
spending
Overweight construction sector with CK (Bt40,
BUY) as top pick
Outlook
Lowest bidders for MRT orange, pink and yellow lines
announced. In early Dec 16, there was an official
announcement of the lowest bidders for the MRT orange, pink
and yellow lines projects. This was two months ahead of
schedule. According to the historical record of market share of
25%, CK achieved the highest market share of 32% of the
announced MRT orange line works. Additionally, BSR, a 75:15:10
joint venture of BTS, STEC and RATCH, secured the best proposal
of the biddings.
Abundant opportunities ahead. Apart from the Bt122bn
projects mentioned above, we expect projects worth at least
Bt337bn, as outlined in the following list, will be awarded to the
winning contractors in FY17F:
(i) Dual-track railway in five routes
a. Prachuab Khiri Khan – Chumpon (Bt17bn)
b. Nakhon Pathom – Hua Hin (Bt19bn)
c. Hua Hin – Prachuab Khiri Khan (Bt10bn)
d. Map Ka Bao – Thanon Chira (Bt29bn)
e. Lopburi – Paknampo (Bt24bn)
(ii) The missing link of MRT red line (Bt4bn)
(iii) MRT purple line; Southern extension (Bt72bn)
(iv) The remaining contracts of Suvarnabhumi airport phase II
(Bt35bn)
(v) The remaining contracts of motorway projects in three
routes (Bt127bn)
Apart from the mentioned projects, we also expect the other dual
track railways in five routes (phase II) to be opened for bidding in
FY17F.
CK as our top pick. We see abundant opportunities for CK,
thanks to the rollout of infrastructure projects – especially for
MRT works which CK has a strong competitive edge. Apart from
clinching infrastructure projects from the government, CK can
also procure such projects via its subsidiaries – e.g. Bangkok
Expressway and Metro PCL (BEM) and CK Power PCL (CKP) are
supplying the infrastructure works (expressway and MRT works)
and dam construction works in Laos to CK respectively.
Cont ract Details
The
lowest
bidder
The lowest
bidding
price
(Btbn)
Reference
price
(Btbn)
Reference
price
(US$bn)
Underground Civ il
works I
Thailand Cultural center -
Ramkhamhaeng 12 CKST* 20.7 19.8 0.6
Underground Civ il
works II
Ramkhamhaeng 12 - Hua
Mak CKST* 21.6 20.7 0.6
Underground Civ il
works III Hua Mak - Khlong Ban Ma ITD 18.6 17.8 0.5
Elevated Civ il worksKhlong Ban Ma -
Suwinthawong UNIQ 10.00 9.6 0.3
Depot Park and Ride
Facilities n/a 4.7 0.1
Track Work UNIQ 3.8 3.6 0.1
Construction worksBSR** 23.1 (estimated)
Construction worksBSR** 24.4 (estimated)
Total 122.1
MRT orange line
MRT pink line
MRT y ellow line
Market Focus
Page 17
Finance Sector
Overweight
Analyst Thaninee SATIRAREUNGCHAI, CFA +662 657 7837 [email protected]
Price Target
Price PE
2017F
Div Yld
2017F
EPS CAGR 15-17
(Bt) (Bt) Rec (x) (%) (%)
AEONTS TB 103.50 130.00 BUY 9.5 3.6 2.5 GL TB 57.25 88.00 BUY 42.5 0.6 81.9 MTLS TB 24.70 32.00 BUY 25.0 1.2 59.5
Source: Company, DBS Vickers
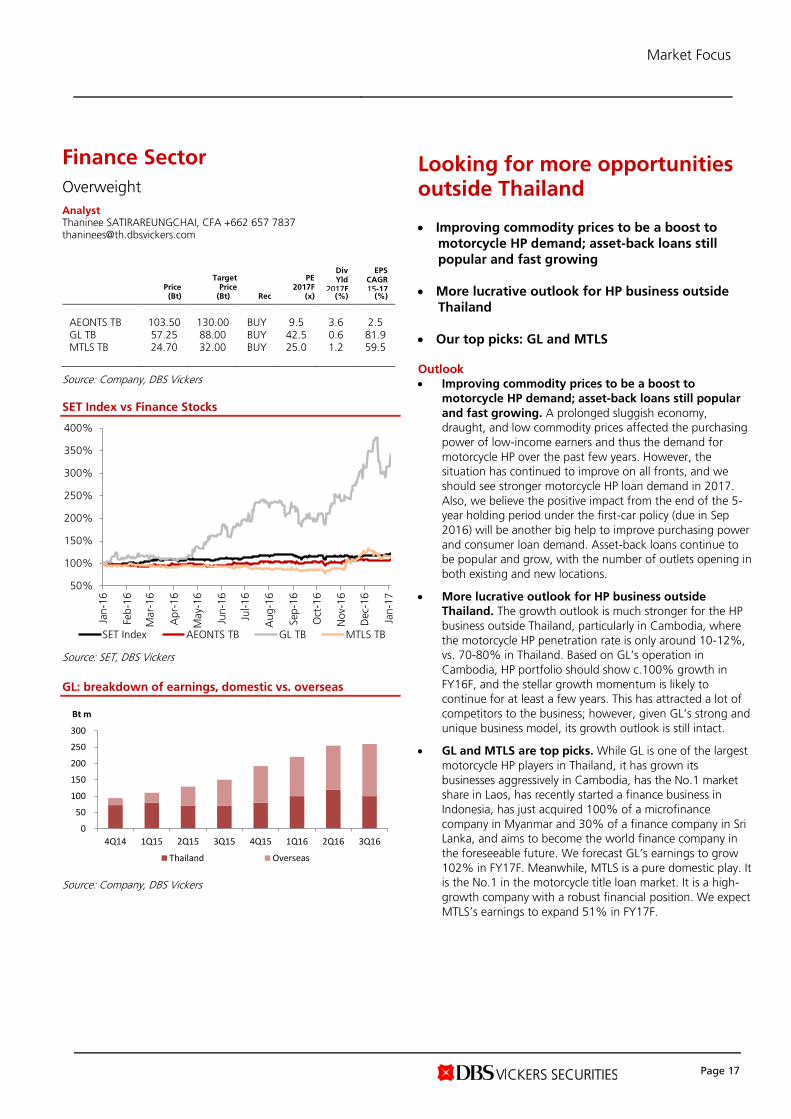
SET Index vs Finance Stocks
Source: SET, DBS Vickers
GL: breakdown of earnings, domestic vs. overseas
Source: Company, DBS Vickers
Looking for more opportunities outside Thailand Improving commodity prices to be a boost to
motorcycle HP demand; asset-back loans still
popular and fast growing
More lucrative outlook for HP business outside
Thailand
Our top picks: GL and MTLS
Outlook
Improving commodity prices to be a boost to
motorcycle HP demand; asset-back loans still popular
and fast growing. A prolonged sluggish economy,
draught, and low commodity prices affected the purchasing
power of low-income earners and thus the demand for
motorcycle HP over the past few years. However, the
situation has continued to improve on all fronts, and we
should see stronger motorcycle HP loan demand in 2017.
Also, we believe the positive impact from the end of the 5-
year holding period under the first-car policy (due in Sep
2016) will be another big help to improve purchasing power
and consumer loan demand. Asset-back loans continue to
be popular and grow, with the number of outlets opening in
both existing and new locations.
More lucrative outlook for HP business outside
Thailand. The growth outlook is much stronger for the HP
business outside Thailand, particularly in Cambodia, where
the motorcycle HP penetration rate is only around 10-12%,
vs. 70-80% in Thailand. Based on GL’s operation in
Cambodia, HP portfolio should show c.100% growth in
FY16F, and the stellar growth momentum is likely to
continue for at least a few years. This has attracted a lot of
competitors to the business; however, given GL’s strong and
unique business model, its growth outlook is still intact.
GL and MTLS are top picks. While GL is one of the largest
motorcycle HP players in Thailand, it has grown its
businesses aggressively in Cambodia, has the No.1 market
share in Laos, has recently started a finance business in
Indonesia, has just acquired 100% of a microfinance
company in Myanmar and 30% of a finance company in Sri
Lanka, and aims to become the world finance company in
the foreseeable future. We forecast GL’s earnings to grow
102% in FY17F. Meanwhile, MTLS is a pure domestic play. It
is the No.1 in the motorcycle title loan market. It is a high-
growth company with a robust financial position. We expect
MTLS’s earnings to expand 51% in FY17F.
50%
100%
150%
200%
250%
300%
350%
400%
Jan
-16
Feb
-16
Mar-
16
Ap
r-1
6
May-
16
Jun-1
6
Jul-1
6
Au
g-1
6
Sep
-16
Oct
-16
No
v-1
6
Dec-
16
Jan
-17
SET Index AEONTS TB GL TB MTLS TB
0
50
100
150
200
250
300
4Q14 1Q15 2Q15 3Q15 4Q15 1Q16 2Q16 3Q16
Bt m
Thailand Overseas
Market Focus
Page 18
Banking Sector
Neutral
Analyst Thaninee SATIRAREUNGCHAI, CFA +662 657 7837 [email protected]
Price Target
Price PE
2017F
Div Yld
2017F
EPS CAGR 15-17
(Bt) (Bt) Rec (x) (%) (%)
BBL TB 159.50 180.00 BUY 9.0 4.4 -0.3 KBANK TB 177.50 195.00 BUY 12.5 2.3 -7.4 KKP TB 59.00 70.00 BUY 8.4 6.8 34.0 KTB TB 17.70 18.60 HOLD 9.5 4.0 -5.8 TMB TB 2.10 2.30 HOLD 11.7 2.9 -8.3 SCB TB 152.50 167.00 BUY 10.8 3.6 0.7 TISCO TB 60.25 65.00 BUY 8.2 4.1 17.5 TCAP TB 44.00 53.00 BUY 7.4 4.8 13.5
Source: Company, DBS Vickers
SET Index vs Banking Sector
Source: SET, DBS Vickers
NPL ratio on a down trend for small banks
Source: Company, DBS Vickers
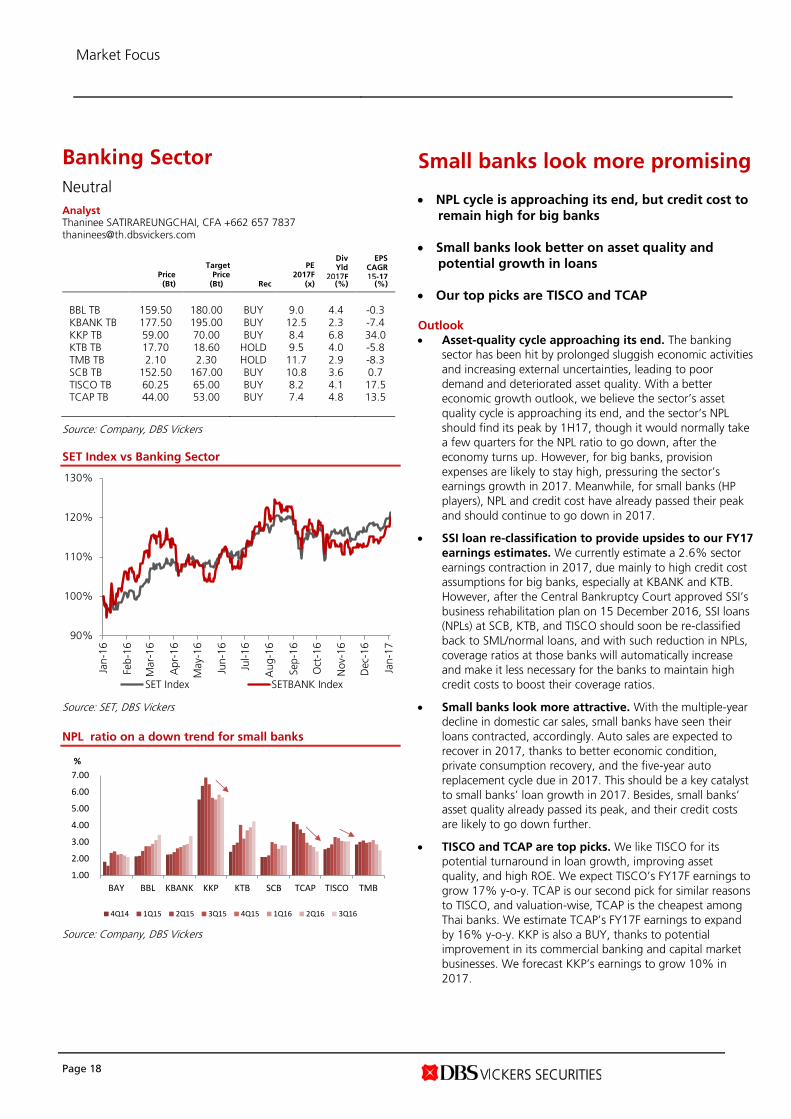
Small banks look more promising NPL cycle is approaching its end, but credit cost to
remain high for big banks
Small banks look better on asset quality and
potential growth in loans
Our top picks are TISCO and TCAP
Outlook
Asset-quality cycle approaching its end. The banking
sector has been hit by prolonged sluggish economic activities
and increasing external uncertainties, leading to poor
demand and deteriorated asset quality. With a better
economic growth outlook, we believe the sector’s asset
quality cycle is approaching its end, and the sector’s NPL
should find its peak by 1H17, though it would normally take
a few quarters for the NPL ratio to go down, after the
economy turns up. However, for big banks, provision
expenses are likely to stay high, pressuring the sector’s
earnings growth in 2017. Meanwhile, for small banks (HP
players), NPL and credit cost have already passed their peak
and should continue to go down in 2017.
SSI loan re-classification to provide upsides to our FY17
earnings estimates. We currently estimate a 2.6% sector
earnings contraction in 2017, due mainly to high credit cost
assumptions for big banks, especially at KBANK and KTB.
However, after the Central Bankruptcy Court approved SSI’s
business rehabilitation plan on 15 December 2016, SSI loans
(NPLs) at SCB, KTB, and TISCO should soon be re-classified
back to SML/normal loans, and with such reduction in NPLs,
coverage ratios at those banks will automatically increase
and make it less necessary for the banks to maintain high
credit costs to boost their coverage ratios.
Small banks look more attractive. With the multiple-year
decline in domestic car sales, small banks have seen their
loans contracted, accordingly. Auto sales are expected to
recover in 2017, thanks to better economic condition,
private consumption recovery, and the five-year auto
replacement cycle due in 2017. This should be a key catalyst
to small banks’ loan growth in 2017. Besides, small banks’
asset quality already passed its peak, and their credit costs
are likely to go down further.
TISCO and TCAP are top picks. We like TISCO for its
potential turnaround in loan growth, improving asset
quality, and high ROE. We expect TISCO’s FY17F earnings to
grow 17% y-o-y. TCAP is our second pick for similar reasons
to TISCO, and valuation-wise, TCAP is the cheapest among
Thai banks. We estimate TCAP’s FY17F earnings to expand
by 16% y-o-y. KKP is also a BUY, thanks to potential
improvement in its commercial banking and capital market
businesses. We forecast KKP’s earnings to grow 10% in
2017.
90%
100%
110%
120%
130%
Jan
-16
Feb
-16
Mar-
16
Ap
r-1
6
May-
16
Jun-1
6
Jul-1
6
Au
g-1
6
Sep
-16
Oct
-16
No
v-1
6
Dec-
16
Jan
-17
SET Index SETBANK Index
1.00
2.00
3.00
4.00
5.00
6.00
7.00
BAY BBL KBANK KKP KTB SCB TCAP TISCO TMB
%
4Q14 1Q15 2Q15 3Q15 4Q15 1Q16 2Q16 3Q16

Market Focus
Page 19
Real Estate Sector
Neutral
Analyst Wasu MATTANAPOTCHANART +66 2657 7826 [email protected]
Price Target
Price PE
2017F
Div Yld
2017F
EPS CAGR 15-17
(Bt) (Bt) Rec (x) (%) (%)
ANAN TB 4.94 5.60 BUY 7.5 4.0 34.5 AP TB 7.50 8.50 BUY 7.1 4.9 12.8 LALIN TB 4.62 4.90 BUY 7.5 6.4 19.3 LH TB 9.80 11.50 BUY 13.4 6.0 3.9 LPN TB 12.10 8.60 SELL 12.6 4.0 -23.4 PF TB 0.90 1.05 HOLD 13.6 4.2 18.4 PRIN TB 1.44 1.61 BUY 7.2 5.1 92.2 PSH TB 22.50 27.00 BUY 6.7 7.5 -0.9 QH TB 2.58 2.70 HOLD 7.7 5.8 7.3 RML TB 1.42 1.13 FV 7.6 1.6 -13.6 SC TB 3.42 3.78 HOLD 7.6 6.1 2.2 SIRI TB 1.66 1.32 FV
VALUED
10.1 5.0 -20.0 SPALI TB 25.00 25.00 HOLD 8.0 4.7 11.1
Source: Company, DBS Vickers
SET Index vs Real Estate Sector Stocks
Source: SET, DBS Vickers
Selective BUYs on companies with strong FY17F profits Downward revisions of 2016 targets were
prevalent
Earnings growth expected to improve in FY17F
ANAN, LH and PSH are our top picks
Outlook
Downward revisions of 2016 targets were prevalent.
The SETPROP Index and all eight property developers under
our coverage have underperformed the SET Index in 2016.
Given elevated household-debt level (c.80%) and falling
Consumer Confidence Index during the first six months of
the year (from 76.1 in Dec-15 to 71.6 in Jun 16), developers
were ready to launch most of their condominium projects in
late-3Q16 and 4Q16. However, things took turn for the
worse in 4Q16 since the passing of the late king; marketing
activities were almost non-existent during the 30 days after
13 Oct, and consumer confidence began to fall again. As a
result, developers cut their combined 2016 targets of
transfers by 7%, presales by 15% and new launches by
11%. The developers are expected to end FY16F with
meagre earnings growth of 3%.
Earnings growth expected to improve in FY17F. The
sector’s normalised profit growth is expected to accelerate
slightly to 6% in FY17F, thanks to the outstanding growth
at ANAN (+51%), AP (+28%) and LH (+15%). A major
positive catalyst for the sector in 2017 is that the owners of
the tax-exempt first cars under the government programme
that ran from Sep 11 to Dec 12 will already have repaid
most of their debt, leading to improved mortgage
borrowers’ profiles.
ANAN, LH and PSH are our top picks. Thanks to the JV
turnaround, ANAN (BUY, Bt5.60 TP) is expected to have the
strongest earnings growth in the industry next year at 51%;
its FY17F transfers (including JV’s) of Bt24.1bn (+45% y-o-y)
are already 74% secured, implying the highest revenue
visibility in the industry. For LH, our FY17F earnings of
Bt8.8bn (+6% y-o-y) could be raised substantially if we
include potential gains on sales of i) Grande Centre Point
Ratchadamri Hotel (c.Bt900m gain), and ii) a rental
apartment in the US. PSH (BUY, Bt27.0 TP) is a yield play
with 7.5% FY17F yield and 21% potential upside to our TP.
80%
90%
100%
110%
120%
130%
Jan
-16
Feb
-16
Mar-
16
Ap
r-1
6
May-
16
Jun-1
6
Jul-1
6
Au
g-1
6
Sep
-16
Oct
-16
No
v-1
6
Dec-
16
Jan
-17
SET Index SETPROP Index

Market Focus
Page 20
Healthcare Sector
Neutral
Analyst Apichaya KETRUTTANABORVORN +662 657 7823 [email protected]
Price Target
Price PE
2017F
Div Yld
2017F
EPS CAGR 15-17
(Bt) (Bt) Rec (x) (%) (%)
BH TB 181.00 160.00 FV 33.6 1.5 6.9 BDMS TB 23.10 27.50 BUY 36.4 1.1 11.4 CHG TB 2.86 3.30 BUY 43.6 1.6 15.8 RJH TB 25.50 30.00 BUY 27.7 1.4 61.2 LPH TB 9.65 10.90 BUY 34.4 1.7 44.7
Source: Company, DBS Vickers
Healthcare sector: FY17 earnings growth
Source: Bloomberg Finance L.P., DBS Bank
National population and proportion of elderly
Source: Company, DBS Vickers
Domestic demand remains the key driver Expect the middle-income focused hospitals to
outperform the premium hospital
Low-risk business with a long-term growth story
Maintain Neutral on the sector; with BDMS, CHG
and RJH as top picks
Outlook
Expect the middle-income focused hospitals to offer
healthy growth after its major investment in FY16. We
expect the middle-income-focused hospitals, i.e. CHG, LPH,
RJH, and including BDMS due to its well-diversified portfolio,
to outperform the premium hospitals. This was on the back
of (i) strong domestic demand growth especially for the mid-
tier hospitals, given the economic slowdown, and (ii) the
capacity expansion and the increasing revenue intensity from
the major investments in FY16.
Upside risk from the potential increase of the
reimbursed rate of social security system (SSS). Given
that the payment structure was revised in 2012 and a
number of private hospitals have exited the SSS scheme, we
expect an increase in the reimbursed rate. However, we
have not included this in our forecast. The hospitals that will
benefit from the increase in the reimbursed rate of SSS are
CHG, LPH and RJH.
Limited growth for premium hospitals. We are
concerned that the medical tourist volume will remain soft,
given weak oil prices and the global economic slowdown.
The premium hospitals, especially BH, should have limited
growth at least for the next three years. This is on the back
of the decline in the number of Middle East patients, which
account for 20% of BH's revenue and offer high margins.
Ageing society, a long-term catalyst. A higher
population of older people is inevitable in Thailand, and this
will help support demand for medical services in the long
run despite c.1% population growth p.a. The Office of the
National Economic and Social Development Board (NESDB)
expects 23% of the country’s population (15m people) to be
older than 60 years old in 2025, up from 14% (9m) in 2017.
10%
6.0%
26%
24%
19%
0%
5%
10%
15%
20%
25%
30%
BDMS BH CHG LPH RJH
Market Focus
Page 21
Telecommunications Sector
Underweight
Analyst Wasu MATTANAPOTCHANART +66 2657 7826 [email protected]
Price Target
Price PE
2017F
Div Yld
2017F
EPS CAGR 15-17
(Bt) (Bt) Rec (x) (%) (%)
ADVANC TB 147.00 154.00
HOLD 15.8 5.1 -16.0 ILINK TB 21.00 24.00 BUY 15.8 2.1 29.8 SAMTEL TB 9.95 9.50 FV 20.2 3.0 -13.1 DTAC TB 37.75 33.00 FV 29.6 2.5 -28.4 TRUE TB* 7.15 NR NR nm 0.0 nm DIF TB 14.00 16.60 BUY 13.5 7.4 11.2 JASIF TB 11.70 11.20 BUY 12.0 8.3 6.6
* no coverage
Source: Company, DBS Vickers
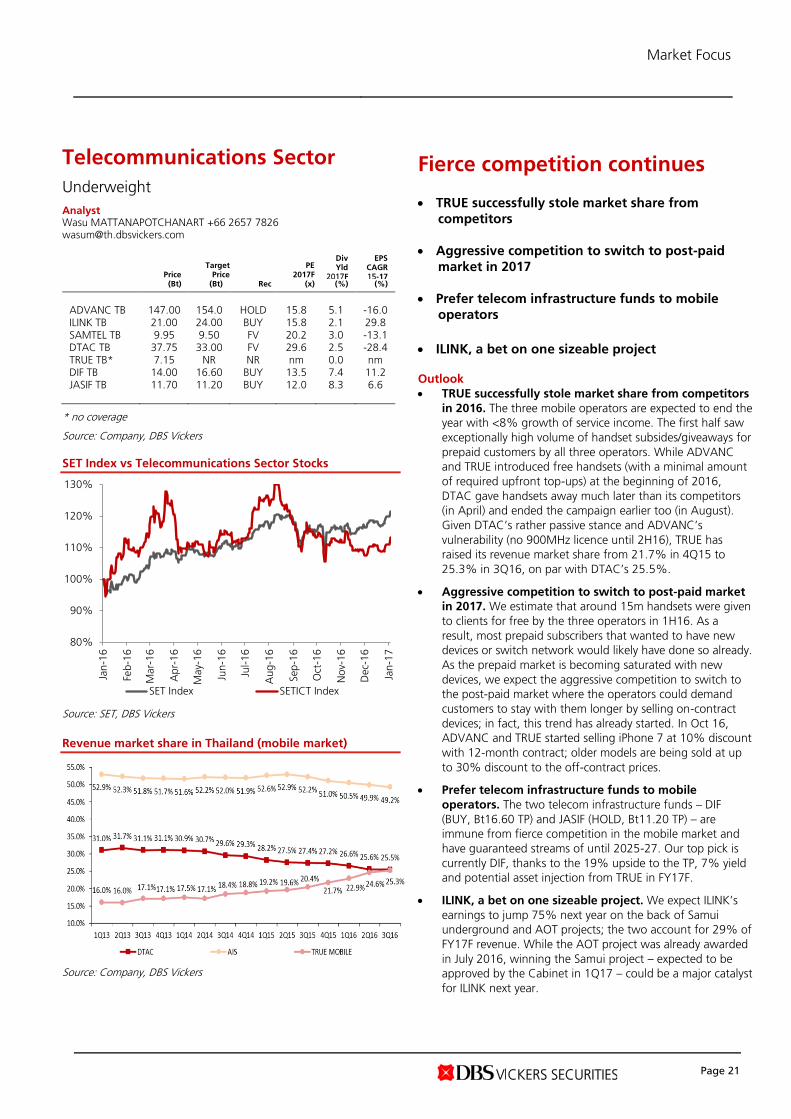
SET Index vs Telecommunications Sector Stocks
Source: SET, DBS Vickers
Revenue market share in Thailand (mobile market)
Source: Company, DBS Vickers
Fierce competition continues TRUE successfully stole market share from
competitors
Aggressive competition to switch to post-paid
market in 2017
Prefer telecom infrastructure funds to mobile
operators
ILINK, a bet on one sizeable project
Outlook
TRUE successfully stole market share from competitors
in 2016. The three mobile operators are expected to end the
year with <8% growth of service income. The first half saw
exceptionally high volume of handset subsides/giveaways for
prepaid customers by all three operators. While ADVANC
and TRUE introduced free handsets (with a minimal amount
of required upfront top-ups) at the beginning of 2016,
DTAC gave handsets away much later than its competitors
(in April) and ended the campaign earlier too (in August).
Given DTAC’s rather passive stance and ADVANC’s
vulnerability (no 900MHz licence until 2H16), TRUE has
raised its revenue market share from 21.7% in 4Q15 to
25.3% in 3Q16, on par with DTAC’s 25.5%.
Aggressive competition to switch to post-paid market
in 2017. We estimate that around 15m handsets were given
to clients for free by the three operators in 1H16. As a
result, most prepaid subscribers that wanted to have new
devices or switch network would likely have done so already.
As the prepaid market is becoming saturated with new
devices, we expect the aggressive competition to switch to
the post-paid market where the operators could demand
customers to stay with them longer by selling on-contract
devices; in fact, this trend has already started. In Oct 16,
ADVANC and TRUE started selling iPhone 7 at 10% discount
with 12-month contract; older models are being sold at up
to 30% discount to the off-contract prices.
Prefer telecom infrastructure funds to mobile
operators. The two telecom infrastructure funds – DIF
(BUY, Bt16.60 TP) and JASIF (HOLD, Bt11.20 TP) – are
immune from fierce competition in the mobile market and
have guaranteed streams of until 2025-27. Our top pick is
currently DIF, thanks to the 19% upside to the TP, 7% yield
and potential asset injection from TRUE in FY17F.
ILINK, a bet on one sizeable project. We expect ILINK’s
earnings to jump 75% next year on the back of Samui
underground and AOT projects; the two account for 29% of
FY17F revenue. While the AOT project was already awarded
in July 2016, winning the Samui project – expected to be
approved by the Cabinet in 1Q17 – could be a major catalyst
for ILINK next year.
80%
90%
100%
110%
120%
130%
Jan
-16
Feb
-16
Mar-
16
Ap
r-1
6
May-
16
Jun-1
6
Jul-1
6
Au
g-1
6
Sep
-16
Oct
-16
No
v-1
6
Dec-
16
Jan
-17
SET Index SETICT Index

Market Focus
Page 22
Electronics Sector
Neutral
Analyst NANTIKA WIANGPHOEM +662 657 7823 [email protected]
Price Target
Price PE
2017F
Div Yld
2017F
EPS CAGR 15-17
(Bt) (Bt) Rec (x) (%) (%)
SVI TB 5.10 5.20 BUY 14.9 3.4 -37.7 DELTA TB 81.50 76.00 HOL
D 16.1 4.0 -3.2
HANA TB 39.50 31.00 HOLD
15.7 3.8 -1.0 KCE TB 122.00 121.00 BUY 18.2 2.2 32.4
Source: Company, DBS Vickers
SET Index vs Electronics Sector Stocks
Source: SET, DBS Vickers
11M16 electronic export sales
Products (USD m) 11M15 11M16 % change
Computer 225 202 -9.9%
Computer parts & accessories 13,377 12,275 -8.2%
Integrated circuits & parts 7,077 7,008 -1.0%
Printed circuits 1,223 1,126 -7.9%
Telecommunication equipment 3,274 3,273 0.0%
Other electrical apparatus 4,203 4,509 7.3%
Total 29,379 28,393 -3.4%
Source: Company, DBS Vickers
A recovery that is priced in Electronics market gets back on track
Baht depreciation, better margin
Stretched valuation for the sector
Outlook
Electronics export sales started registering growth
from Nov 16. Thailand electronics export sales eased 4.1%
y-o-y in 9M16, and signs of a recovery were seen in
November 16 with growth of 5.6% and this growth trend
should continue in December 16 and 2017 (after hitting a
trough). However, we expect export sales growth to be just
moderate as some end-product markets are still weak.
According to Gartner’s research, worldwide IT device sales
are expected to recover but still register mild growth of
c.0.4% in 2017 from a slow PC market. Also, smartphones
should continue growing albeit at a slower pace of c.8% in
2017 (vs double-digit growth previously) as the market has
matured in some developed countries.
Strong growth expected in automotive electronics. The
growth of automotive electronics is expected to continue
outperforming other electronic products. According to N.T.
Information’s research, passenger car sales are expected to
grow at a 10-year CAGR of 3.3% (2010-2020F), while
electronics component sales will expand at a higher 8-year
CAGR of 6.6% (2012-2020F). The exponential growth is
mainly driven by convenience requirements and the
emerging trend of autonomous and electric cars, which will
require more electronic parts.
Weak baht trend. Since the election of the next US
President, USD has become stronger and it is expected to be
on an uptrend in 2017. Thus, the weak baht trend will
benefit companies in the electronic sector, as most of them
are export-oriented and hence, derive the bulk of their
revenue in USD. The baht’s depreciation will allow the sector
to register wider margins and net profit improvement in
2017.
KCE is our top pick with stretched valuation. Given that
the automotive electronics market has been growing rapidly
of late and the emerging trend of plug-in hybrid cars and
electronic cars, the growth prospects of the electronics
sector should be sustainable in the long term. Thus, we like
KCE which currently has high exposure to the automotive
segment at c.71% of total sales. Also, the company is
expected to deliver strong earnings growth of 26% in 2017.
However, it seems that the strong growth has already been
priced in KCE’s stock price – hence, we think that there is
limited upside potential to our TP.
80%
90%
100%
110%
120%
130%
Jan
-16
Feb
-16
Mar-
16
Ap
r-1
6
May-
16
Jun-1
6
Jul-1
6
Au
g-1
6
Sep
-16
Oct
-16
No
v-1
6
Dec-
16
Jan
-17
SET Index SETELEC Index

Market Focus
Page 23
Energy Sector
Neutral
Analyst Chaipat THANAWATTANO +66 2657 7827 [email protected]
Price Target
Price PE
2017F
Div Yld
2017F
EPS CAGR 13-17
(Bt) (Bt) Rec (x) (%) (%)
BANPU TB 19.20 11.90 FV 58.6 1.0 nm BCP TB 33.50 39.00 BUY 7.5 5.4 22.0 EPG TB 12.90 17.00 BUY 20.5 1.5 50.8 GPSC TB 37.25 42.00 BUY 17.2 2.9 30.4 GUNKUL TB 5.65 6.00 BUY 24.7 1.2 43.7 IRPC TB 4.80 5.30 HOLD 10.1 4.0 1.5 PTT TB 372.00 370.0
0 BUY 11.5 3.5 115
PTTEP TB 96.25 86.00 HOLD 24.4 1.8 nm RATCH TB 50.00 60.00 HOLD 9.6 5.2 53.7 TOP TB 72.25 65.00 HOLD 10.1 4.6 9.7
Source: Company, DBS Vickers
SET Index vs. SET Energy Index
Source: SET, DBS Vickers
Thailand Energy – Earnings Performance
Source: Company, DBS Vickers
Selective BUY stance maintained
More positive on oil price outlook
Volatile oil price could be a threat for oil refiners
Top picks are BCP and PTT
2016 overview
Favourable share price performance in 2016. The Energy
sector outperformed the overall market in 2016, up 37%
YTD, compared with +18% for the market. Behind this was
the strong share price performance of PTT (+51%) and
PTTEP (+66%) although the average oil price for the year
declined by 16% y-o-y to US$44/bbl, in line with our
expectation. This reflects market optimism on OPEC’s
agreement to curb supply, following the cartel’s meeting in
late-Nov 16.
Average oil price down 16% y-o-y. The average Brent oil
price in 2016 weakened 16% y-o-y in 2016 to US$44/bbl
but on the side-way uptrend, especially in 4Q16. The sharp
rise in 4Q16 reflected market’s optimism on OPEC’s
agreement in lowering production by 1.2mbd for six
months, starting from Jan 17. This has marked the first
production cut of the cartel since 2008.
Gross refining margin (GRM) narrowed 20% y-o-y. The
average GRM in Singapore market weakened 20% y-o-y to
US$6.2/bbl in 2016. Nonetheless, the sharp decline was due
to an abnormally high base in 2015 given the spike of
gasoline demand. We think that 2016 GRM returned to the
normal level, i.e. in line with 10-year average.
Coal price swung back sharply on supply shock. Thermal
coal price recovered sharply from c.US$50/ton in 1H16 to
>US$100/t in Oct 16 on supply shock given the Chinese
government’s policy to curb supply by shortening working
hours. Coupled with lower supply from Indonesia due to
unfavourable weather, coal supply in the seaborne market
fell sharply while demand continued to rise. Nonetheless, the
high coal price could not be sustained and weakened by
nearly 20% within four weeks from its peak in mid-Nov 16.
Sharp recovery of earnings performance in 9M16. The
aggregate profit of the energy sector improved remarkably
in 9M16, +324% y-o-y, despite lower oil prices and GRM.
This was due to the absence of huge impairment charges on
assets that were booked in 3Q15 no thanks to weak oil
prices. The strong earnings performance in 9M16 was led by
PTTEP and PTT. Oil refiners also booked stronger profit from
inventory gains as oil prices continued to improve from a
very low base.

Market Focus
Page 24
Oil Price Movement
Source: Bloomberg Finance L.P., DBS Vickers Singapore Refining Margin (Hydrocraking)
Source: Datastream, DBS Vickers
Thermal Coal Price
Source: NEX, DBS Vickers
Outlook
Oil price recovery in 2017F. DBSV regional oil and gas team
expects the Brent oil price to increase to a range of US$55-
60/bbl in 2017F, up from US$45-55/bbl in 4Q16. OPEC’s
recent agreement to cut supply from Jan 17 to Jun 17,
joined by some key non-OPEC producers, is likely to
accelerate oil rebalancing (potentially achieving equilibrium
in 1Q17) and price recovery. Confidence has also been
boosted by Saudi Arabia’s tone for deeper cuts. Nonetheless,
we remain cautious on the longer-term price assumption at
US$60-65/bbl. We view that the real impact of OPEC’s
supply cut still has to be seen depending on whether OPEC
could keep production within quota. Also, this still depends
on the response from US shale drillers if prices move towards
the more lucrative levels of US$60/bbl, and the energy policy
of US President-elect Donald Trump. Further, the US dollar
appreciation and interest rate hikes may add to pressure on
oil prices as well. The wildcard remains the shift in
geopolitics under US President-elect Donald Trump.
Refining margin could pick up slightly on more
balanced market. With stable growth of demand for
refined oil products, we expect GRM to pick up slightly in
2017F to US$6.5-6.8/bbl. The key driver could be higher
demand for diesel and jet fuel, which accounts for more
than half of Thai oil refiners’ product yield. On the supply
side, we expect net additional capacity to remain slightly
lower than demand growth, with the capacity in China as a
swing factor, mainly the teapot refinery. The key risk for the
industry is the volatile oil price which could cause inventory
gains or losses. Nonetheless, in the near term, we believe
higher demand in winter, which is expected to be colder
than last year’s, would buoy GRM to hover at US$7-8/bbl.
Coal price could stay firm. Managed supply in thermal
cola market could continue to hold up coal prices in 2017F
although the US$100/t level may not be reached. We expect
the average coal price to stay in the range of US$70-80/t to
ensure that coal miners could stay afloat with some profit.
We believe what could cap the upside of coal prices is a
more attractive price of liquefied natural gas (LNG) for
power plants. Higher coal prices could also attract miners to
increase production to reap the benefit.
High base performance in 2016 is key factor on small
improvement in 2017F. The profit growth of Thai energy
stocks in DBSV universe is expected at only 4% y-o-y in
2017F due to a high base in 2016. This projection remains
conservative given that oil prices could overshoot our
expectation. However, we maintain our forecast as the oil
market could remain volatile in 2017 both from the actual
supply and the stronger USD.
Strategy. We maintain our Neutral weight on the sector
after a big rally in 2016. Our stance of the sector is selective
BUYs on laggard plays like BCP due to their attractive
valuation and dividend yield. We also like PTT for its
improving earnings performance, thanks to its business
diversification. The listing of its oil retail business could be a
share price catalyst, in addition to stronger oil prices.
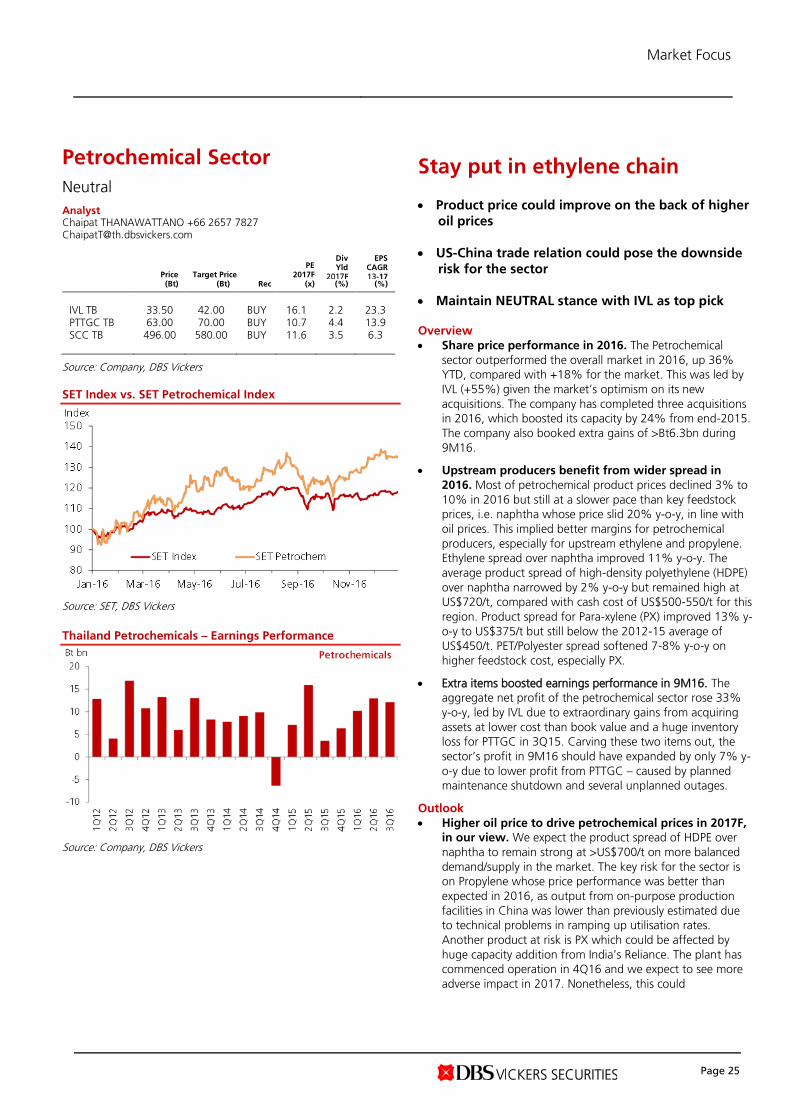
Market Focus
Page 25
Petrochemical Sector
Neutral
Analyst Chaipat THANAWATTANO +66 2657 7827 [email protected]
Price Target Price PE
2017F
Div Yld
2017F
EPS CAGR 13-17
(Bt) (Bt) Rec (x) (%) (%)
IVL TB 33.50 42.00 BUY 16.1 2.2 23.3 PTTGC TB 63.00 70.00 BUY 10.7 4.4 13.9 SCC TB 496.00 580.00 BUY 11.6 3.5 6.3
Source: Company, DBS Vickers
SET Index vs. SET Petrochemical Index
Source: SET, DBS Vickers
Thailand Petrochemicals – Earnings Performance
Source: Company, DBS Vickers
Stay put in ethylene chain Product price could improve on the back of higher
oil prices
US-China trade relation could pose the downside
risk for the sector
Maintain NEUTRAL stance with IVL as top pick
Overview
Share price performance in 2016. The Petrochemical
sector outperformed the overall market in 2016, up 36%
YTD, compared with +18% for the market. This was led by
IVL (+55%) given the market’s optimism on its new
acquisitions. The company has completed three acquisitions
in 2016, which boosted its capacity by 24% from end-2015.
The company also booked extra gains of >Bt6.3bn during
9M16.
Upstream producers benefit from wider spread in
2016. Most of petrochemical product prices declined 3% to
10% in 2016 but still at a slower pace than key feedstock
prices, i.e. naphtha whose price slid 20% y-o-y, in line with
oil prices. This implied better margins for petrochemical
producers, especially for upstream ethylene and propylene.
Ethylene spread over naphtha improved 11% y-o-y. The
average product spread of high-density polyethylene (HDPE)
over naphtha narrowed by 2% y-o-y but remained high at
US$720/t, compared with cash cost of US$500-550/t for this
region. Product spread for Para-xylene (PX) improved 13% y-
o-y to US$375/t but still below the 2012-15 average of
US$450/t. PET/Polyester spread softened 7-8% y-o-y on
higher feedstock cost, especially PX.
Extra items boosted earnings performance in 9M16. The
aggregate net profit of the petrochemical sector rose 33%
y-o-y, led by IVL due to extraordinary gains from acquiring
assets at lower cost than book value and a huge inventory
loss for PTTGC in 3Q15. Carving these two items out, the
sector’s profit in 9M16 should have expanded by only 7% y-
o-y due to lower profit from PTTGC – caused by planned
maintenance shutdown and several unplanned outages.
Outlook
Higher oil price to drive petrochemical prices in 2017F,
in our view. We expect the product spread of HDPE over
naphtha to remain strong at >US$700/t on more balanced
demand/supply in the market. The key risk for the sector is
on Propylene whose price performance was better than
expected in 2016, as output from on-purpose production
facilities in China was lower than previously estimated due
to technical problems in ramping up utilisation rates.
Another product at risk is PX which could be affected by
huge capacity addition from India’s Reliance. The plant has
commenced operation in 4Q16 and we expect to see more
adverse impact in 2017. Nonetheless, this could

Market Focus
Page 26
Product spread: HDPE-Naphtha
Source: Datastream, DBS Vickers
Paraxylene Price and Spread over Naphtha
Source: Datastream, DBS Vickers
be positive for PET/Polyester producers on lower feedstock
cost.
Chinese demand could soften from US trade policy. On
the demand side, the key concern is Chinese demand which
could be affected by the trade relationship between the US
and China under the new US President.
Near-term lower product spread is expected. In the near
term, we believe that the product spread could soften again
in Dec 16-Jan 17 given potentially higher naphtha prices –
which could move up in tandem with oil prices. Also we
expect stock building ahead of the year-end period to be
slow on the back of seasonal impact which could affect
HDPE price during the low season. The restocking is
expected to take place ahead of Chinese New Year at the
end of Jan 17.
Net profit could weaken y-o-y in 2017F. We expect 2017
profit of the petrochemical stocks in DBSV’s universe to
decline slightly y-o-y due to the high base in 2016 given the
aforementioned extraordinary gains. The core profit would
continue to rise by 15% y-o-y. This would be driven by
healthier performance of PTTGC after several plant
shutdowns in 2016. We also expect IVL’s core EBITDA
margin to gradually improve as a result of more contribution
from high value-added and specialty products.
Stay NEUTRAL. In view of the share price outperformance in
2016, we are NEUTRAL on the sector. We have BUY ratings
on all petrochemical stocks in DBSV’s universe but prefer IVL
for its improving outlook for core earnings, driven by high
value-added products and its leading position in the global
market for PET/Polyester and automotive-related specialty
products. We believe the market remains too pessimistic on
its core EBITDA margin and its re-rating in 2017F is likely to
take place. We also like SCC for its solid earnings
performance and financial position, and healthy ROE and
EPG on the back of its improving earnings outlook, driven by
the automotive plastic segment. The key catalyst for the
stock is new orders from European automakers which will
launch SUV cars in 2017-18.

Market Focus
Page 27
Revisions to recommendations
Company Revision to Rec. Revision Reason
Current Previous Date
Upgrade
HANA HOLD Fully Valued 2 Dec 16 We see signs of a market recovery from 4Q16 onwards and a better outlook in 2017. The market should bottom out and the margin should improve from a weak baht and better economies of scale. Thus, we revised up our forecast and upgraded our rating from FULLY VALUED to HOLD.
COM7 BUY Hold 6 Dec 16 As the progress of operating True shop is faster than expected, we revised our assumption of operating True shop to 120 shops – up from 80 shops in our earlier
forecast. Also, COM7 has recently acquired 44 shops from BKK Telecom 999 and these shops will boost COM7’s revenue from 2017. We took into account the factors mentioned above and came up with a higher TP of Bt17.5 (from Bt13.3 previously). Hence, with the potential upside and strong growth outlook, we upgrade our rating from HOLD to BUY.
LPN FULLY VALUED Sell 16 Dec 16 We revised FY17F earnings upward by 4% as the company has just clinched two new land plots for launches and completions for 2017. Presales are expected to rise substantially this year thanks to high-end launches.
Downgrade None
Initiating Coverage and Equity Explorer
Company Rec. TP Price Date Reason
Initiating Coverage FN Factory Outlet BUY 10.40 28 Dec 16 Bright earnings outlook
Source: Company, DBS Vickers

Market Focus
Page 28
DBS Vickers recommendations are based an Absolute Total Return* Rating system, defined as follows:
STRONG BUY (>20% total return over the next 3 months, with identifiable share price catalysts within this time frame)
BUY (>15% total return over the next 12 months for small caps, >10% for large caps)
HOLD (-10% to +15% total return over the next 12 months for small caps, -10% to +10% for large caps)
FULLY VALUED (negative total return i.e. > -10% over the next 12 months)
SELL (negative total return of > -20% over the next 3 months, with identifiable catalysts within this time frame)
Share price appreciation + dividends
Completed Date: 29 Dec 2016 15:51:07 Dissemination Date: 6 Jan 2017 07:14:56
GENERAL DISCLOSURE/DISCLAIMER
This report is prepared by DBS Vickers Securities (Thailand) Co, Ltd. This report is solely intended for the clients of DBS Bank Ltd, DBS Vickers
Securities (Singapore) Pte Ltd, its respective connected and associated corporations and affiliates only and no part of this document may be (i)
copied, photocopied or duplicated in any form or by any means or (ii) redistributed without the prior written consent of DBS Vickers Securities
(Thailand) Co, Ltd.
The research set out in this report is based on information obtained from sources believed to be reliable, but we (which collectively refers to DBS
Bank Ltd, its respective connected and associated corporations, affiliates and their respective directors, officers, employees and agents (collectively,
the “DBS Group”)) do not make any representation or warranty as to its accuracy, completeness or correctness. Opinions expressed are subject to
change without notice. This document is prepared for general circulation. Any recommendation contained in this document does not have regard
to the specific investment objectives, financial situation and the particular needs of any specific addressee. This document is for the information of
addressees only and is not to be taken in substitution for the exercise of judgement by addressees, who should obtain separate independent legal
or financial advice. The DBS Group accepts no liability whatsoever for any direct, indirect and/or consequential loss (including any claims for loss of
profit) arising from any use of and/or reliance upon this document and/or further communication given in relation to this document. This
document is not to be construed as an offer or a solicitation of an offer to buy or sell any securities. The DBS Group, along with its affiliates and/or
persons associated with any of them may from time to time have interests in the securities mentioned in this document. The DBS Group may have
positions in, and may effect transactions in securities mentioned herein and may also perform or seek to perform broking, investment banking and
other banking services for these companies.
Any valuations, opinions, estimates, forecasts, ratings or risk assessments herein constitutes a judgment as of the date of this report, and there can
be no assurance that future results or events will be consistent with any such valuations, opinions, estimates, forecasts, ratings or risk assessments.
The information in this document is subject to change without notice, its accuracy is not guaranteed, it may be incomplete or condensed and it
may not contain all material information concerning the company (or companies) referred to in this report and the DBS Group is under no
obligation to update the information in this report.
This publication has not been reviewed or authorized by any regulatory authority in Singapore, Hong Kong or elsewhere. There is no planned
schedule or frequency for updating research publication relating to any issuer.
The valuations, opinions, estimates, forecasts, ratings or risk assessments described in this report were based upon a number of estimates and
assumptions and are inherently subject to significant uncertainties and contingencies. It can be expected that one or more of the estimates on
which the valuations, opinions, estimates, forecasts, ratings or risk assessments were based will not materialize or will vary significantly from actual
results. Therefore, the inclusion of the valuations, opinions, estimates, forecasts, ratings or risk assessments described herein IS NOT TO BE RELIED
UPON as a representation and/or warranty by the DBS Group (and/or any persons associated with the aforesaid entities), that:
(a) such valuations, opinions, estimates, forecasts, ratings or risk assessments or their underlying assumptions will be achieved, and
(b) there is any assurance that future results or events will be consistent with any such valuations, opinions, estimates, forecasts, ratings or risk
assessments stated therein.
Please contact the primary analyst for valuation methodologies and assumptions associated with the covered companies or price targets.
Any assumptions made in this report that refers to commodities, are for the purposes of making forecasts for the company (or companies)
mentioned herein. They are not to be construed as recommendations to trade in the physical commodity or in the futures contract relating to the
commodity referred to in this report.
DBS Vickers Securities (USA) Inc ("DBSVUSA")"), a U.S.-registered broker-dealer, does not have its own investment banking or research
department, has not participated in any public offering of securities as a manager or co-manager or in any other investment banking transaction
in the past twelve months and does not engage in market-making.

Market Focus
Page 29
ANALYST CERTIFICATION
The research analyst(s) primarily responsible for the content of this research report, in part or in whole, certifies that the views about the
companies and their securities expressed in this report accurately reflect his/her personal views. The analyst(s) also certifies that no part of his/her
compensation was, is, or will be, directly, or indirectly, related to specific recommendations or views expressed in the report. The DBS Group has
procedures in place to eliminate, avoid and manage any potential conflicts of interests that may arise in connection with the production of
research reports. As of 19 Dec 2016, the analyst(s) and his/her spouse and/or relatives who are financially dependent on the analyst(s), do not hold
interests in the securities recommended in this report (“interest” includes direct or indirect ownership of securities). The research analyst(s)
responsible for this report operates as part of a separate and independent team to the investment banking function of the DBS Group and
procedures are in place to ensure that confidential information held by either the research or investment banking function is handled
appropriately.
COMPANY-SPECIFIC / REGULATORY DISCLOSURES
1. DBS Vickers Securities (Thailand) Co, Ltd and its subsidiaries do not have a proprietary position in the securities recommended in this report
as of 5 Jan 2017.
Compensation for investment banking services:
2. DBSVUSA does not have its own investment banking or research department, nor has it participated in any public offering of securities as a
manager or co-manager or in any other investment banking transaction in the past twelve months. Any US persons wishing to obtain further
information, including any clarification on disclosures in this disclaimer, or to effect a transaction in any security discussed in this document
should contact DBSVUSA exclusively.
DBS Bank Ltd., DBSVS, DBSVUSA, their subsidiaries and/or other affiliates beneficially own a total of 1% of any class of common equity
securities of TMB Bank as of 5 Jan 2017
Disclosure of previous investment recommendation produced:
3. DBS Bank Ltd, DBS Vickers Securities (Singapore) Pte Ltd (''DBSVS''), their subsidiaries and/or other affiliates may have published other
investment recommendations in respect of the same securities / instruments recommended in this research report during the preceding 12
months. Please contact the primary analyst listed in the first page of this report to view previous investment recommendations published by
DBS Bank Ltd, DBS Vickers Securities (Singapore) Pte Ltd (''DBSVS''), their subsidiaries and/or other affiliates in the preceding 12 months.
RESTRICTIONS ON DISTRIBUTION
General This report is not directed to, or intended for distribution to or use by, any person or entity who is a citizen or resident of or located in any locality, state, country or other jurisdiction where such distribution, publication, availability or use would be contrary to law or regulation.
Australia This report is being distributed in Australia by DBS Bank Ltd. (“DBS”) or DBS Vickers Securities (Singapore) Pte Ltd (“DBSVS”), both of which are exempted from the requirement to hold an Australian Financial Services Licence under the Corporation Act 2001 (“CA”) in respect of financial services provided to the recipients. Both DBS and DBSVS are regulated by the Monetary Authority of Singapore under the laws of Singapore, which differ from Australian laws. Distribution of this report is intended only for “wholesale investors” within the meaning of the CA.
Hong Kong This report is being distributed in Hong Kong by or on behalf of, and is attributable to DBS Vickers (Hong Kong) Limited which is licensed and regulated by the Hong Kong Securities and Futures Commission and/or by DBS Bank (Hong Kong) Limited which is regulated by the Hong Kong Monetary Authority and the Securities and Futures Commission. Where this publication relates to a research report, unless otherwise stated in the research report(s), DBS Bank (Hong Kong) Limited is not the issuer of the research report(s). This publication including any research report(s) is/are distributed on the express understanding that, whilst the information contained within is believed to be reliable, the information has not been independently verified by DBS Bank (Hong Kong) Limited. This report is intended for distribution in Hong Kong only to professional investors (as defined in the Securities and Futures Ordinance (Chapter 571 of the Laws of Hong Kong) and any rules promulgated thereunder.)
For any query regarding the materials herein, please contact Paul Yong (CE. No. ASE988) at [email protected].
Indonesia This report is being distributed in Indonesia by PT DBS Vickers Securities Indonesia.
Malaysia This report is distributed in Malaysia by AllianceDBS Research Sdn Bhd ("ADBSR"). Recipients of this report, received from ADBSR are to contact the undersigned at 603-2604 3333 in respect of any matters arising from or in connection with this report. In addition to the General Disclosure/Disclaimer found at the preceding page, recipients of this report are advised that ADBSR (the preparer of this report), its holding company Alliance Investment Bank Berhad, their respective connected and associated corporations, affiliates, their directors, officers, employees, agents and parties related or associated with any of them may have positions in, and may effect transactions in the securities mentioned herein and may also perform or seek to perform broking, investment banking/corporate advisory and other services for the subject companies. They may also have received compensation and/or seek to obtain compensation for broking, investment banking/corporate advisory and other services from the subject companies.
Wong Ming Tek, Executive Director, ADBSR
Market Focus
Page 30
Singapore This report is distributed in Singapore by DBS Bank Ltd (Company Regn. No. 196800306E) or DBSVS (Company Regn No. 198600294G), both of which are Exempt Financial Advisers as defined in the Financial Advisers Act and regulated by the Monetary Authority of Singapore. DBS Bank Ltd and/or DBSVS, may distribute reports produced by its respective foreign entities, affiliates or other foreign research houses pursuant to an arrangement under Regulation 32C of the Financial Advisers Regulations. Where the report is distributed in Singapore to a person who is not an Accredited Investor, Expert Investor or an Institutional Investor, DBS Bank Ltd accepts legal responsibility for the contents of the report to such persons only to the extent required by law. Singapore recipients should contact DBS Bank Ltd at 6327 2288 for matters arising from, or in connection with the report.
Thailand This report is being distributed in Thailand by DBS Vickers Securities (Thailand) Co Ltd. Research reports distributed are only intended for institutional clients only and no other person may act upon it.
United Kingdom This report is produced by DBS Vickers Securities (Thailand) Co, Ltd which is regulated by the Securities and Exchange Commission, Thailand. This report is disseminated in the United Kingdom by DBS Vickers Securities (UK) Ltd, ("DBSVUK"). DBSVUK is authorised and regulated by the Financial Conduct Authority in the United Kingdom.
In respect of the United Kingdom, this report is solely intended for the clients of DBSVUK, its respective connected and associated corporations and affiliates only and no part of this document may be (i) copied, photocopied or duplicated in any form or by any means or (ii) redistributed without the prior written consent of DBSVUK. This communication is directed at persons having professional experience in matters relating to investments. Any investment activity following from this communication will only be engaged in with such persons. Persons who do not have professional experience in matters relating to investments should not rely on this communication.
Dubai
This research report is being distributed in The Dubai International Financial Centre (“DIFC”) by DBS Bank Ltd., (DIFC Branch) having its office at PO Box 506538, 3
rd Floor, Building 3, East Wing, Gate Precinct, Dubai International Financial Centre (DIFC),
Dubai, United Arab Emirates. DBS Bank Ltd., (DIFC Branch) is regulated by The Dubai Financial Services Authority. This research report is intended only for professional clients (as defined in the DFSA rulebook) and no other person may act upon it.
United States This report was prepared by DBS Vickers Securities (Thailand) Co, Ltd. DBSVUSA did not participate in its preparation. The research analyst(s) named on this report are not registered as research analysts with FINRA and are not associated persons of DBSVUSA. The research analyst(s) are not subject to FINRA Rule 2241 restrictions on analyst compensation, communications with a subject company, public appearances and trading securities held by a research analyst. This report is being distributed in the United States by DBSVUSA, which accepts responsibility for its contents. This report may only be distributed to Major U.S. Institutional Investors (as defined in SEC Rule 15a-6) and to such other institutional investors and qualified persons as DBSVUSA may authorize. Any U.S. person receiving this report who wishes to effect transactions in any securities referred to herein should contact DBSVUSA directly and not its affiliate.
Other jurisdictions In any other jurisdictions, except if otherwise restricted by laws or regulations, this report is intended only for qualified, professional, institutional or sophisticated investors as defined in the laws and regulations of such jurisdictions.
DBS Vickers Securities (Thailand) Co, Ltd
989 Siam Piwat Tower Building, 9th, 14th-15th Floor Rama 1 Road, Pathumwan, Bangkok Thailand 10330
Tel. 66 2 657 7831, Fax: 66 2 658 1269 Company Regn. No 0105539127012
Securities and Exchange Commission, Thailand.
Related Documents