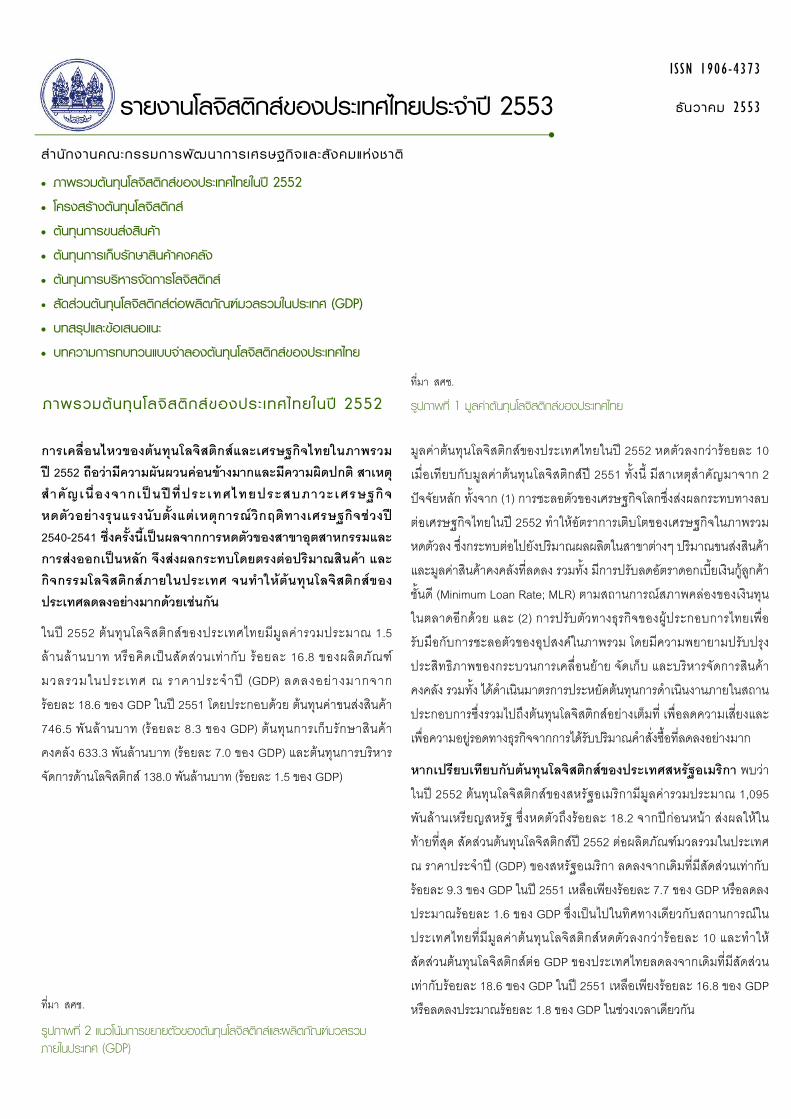
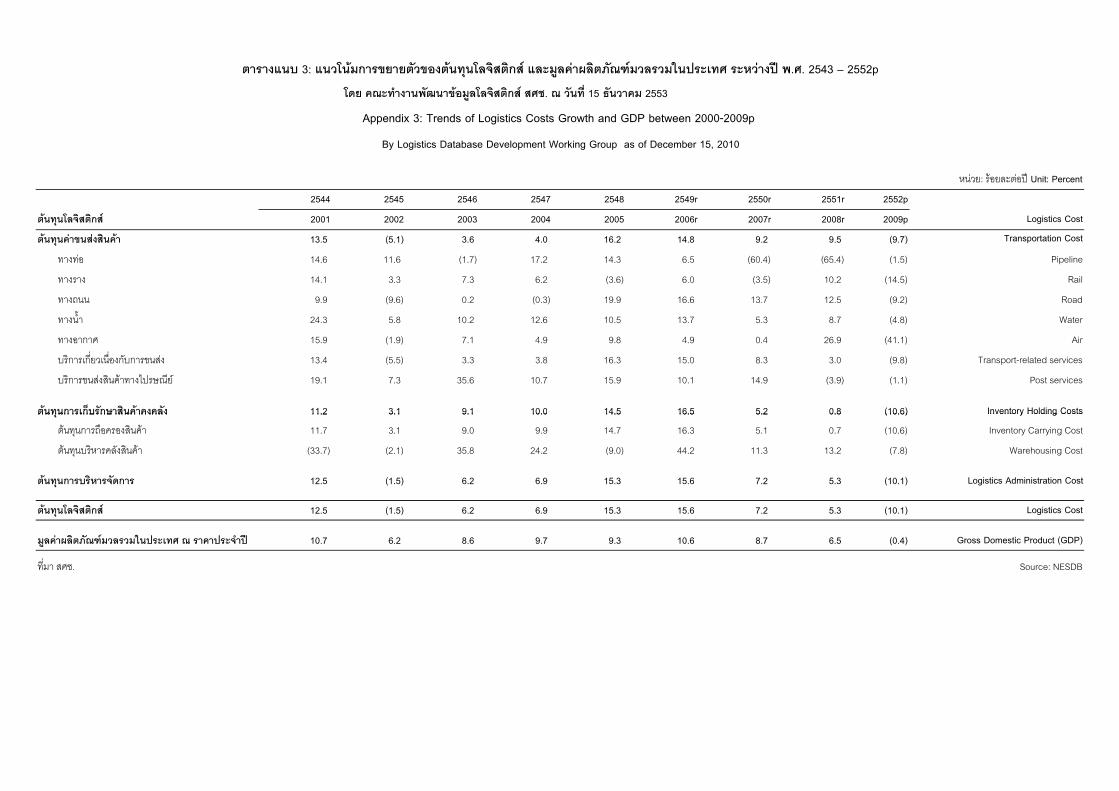
มูลคาตนทุนโลจิสติกสของประเทศไทยในป 2552 หดตัวลงกวารอยละ 10 เมื่อเทียบกับมูลคาตนทุนโลจิสติกสป 2551 ทั้งนี้ มีสาเหตุสําคัญมาจาก 2 ปจจัยหลัก ทั้งจาก (1) การชะลอตัวของเศรษฐกิจโลกซึ่งสงผลกระทบทางลบ ตอเศรษฐกิจไทยในป 2552 ทําใหอัตราการเติบโตของเศรษฐกิจในภาพรวม หดตัวลง ซึ่งกระทบตอไปยังปริมาณผลผลิตในสาขาตางๆ ปริมาณขนสงสินคา และมูลคาสินคาคงคลังที่ลดลง รวมทั้ง มีการปรับลดอัตราดอกเบี้ยเงินกูลูกคา ชั้นดี (Minimum Loan Rate; MLR) ตามสถานการณสภาพคลองของเงินทุน ในตลาดอีกดวย และ (2) การปรับตัวทางธุรกิจของผูประกอบการไทยเพื่อ รับมือกับการชะลอตัวของอุปสงคในภาพรวม โดยมีความพยายามปรับปรุง ประสิทธิภาพของกระบวนการเคลื่อนยาย จัดเก็บ และบริหารจัดการสินคา คงคลัง รวมทั้ง ไดดําเนินมาตรการประหยัดตนทุนการดําเนินงานภายในสถาน ประกอบการซึ่งรวมไปถึงตนทุนโลจิสติกสอยางเต็มที่ เพื่อลดความเสี่ยงและ เพื่อความอยูรอดทางธุรกิจจากการไดรับปริมาณคําสั่งซื้อที่ลดลงอยางมาก หากเปรียบเทียบกับตนทุนโลจิสติกสของประเทศสหรัฐอเมริกา พบวา ในป 2552 ตนทุนโลจิสติกสของสหรัฐอเมริกามีมูลคารวมประมาณ 1,095 พันลานเหรียญสหรัฐ ซึ่งหดตัวถึงรอยละ 18.2 จากปกอนหนา สงผลใหใน ทายที่สุด สัดสวนตนทุนโลจิสติกสป 2552 ตอผลิตภัณฑมวลรวมในประเทศ ณ ราคาประจําป (GDP) ของสหรัฐอเมริกา ลดลงจากเดิมที่มีสัดสวนเทากับ รอยละ 9.3 ของ GDP ในป 2551 เหลือเพียงรอยละ 7.7 ของ GDP หรือลดลง ประมาณรอยละ 1.6 ของ GDP ซึ่งเปนไปในทิศทางเดียวกับสถานการณใน ประเทศไทยที่มีมูลคาตนทุนโลจิสติกสหดตัวลงกวารอยละ 10 และทําให สัดสวนตนทุนโลจิสติกสตอ GDP ของประเทศไทยลดลงจากเดิมที่มีสัดสวน เทากับรอยละ 18.6 ของ GDP ในป 2551 เหลือเพียงรอยละ 16.8 ของ GDP หรือลดลงประมาณรอยละ 1.8 ของ GDP ในชวงเวลาเดียวกัน การเคลื่อนไหวของตนทุนโลจิสติกสและเศรษฐกิจไทยในภาพรวม ป 2552 ถือวามีความผันผวนคอนขางมากและมีความผิดปกติ สาเหตุ สําคัญเนื่องจากเปนปที่ประเทศไทยประสบภาวะเศรษฐกิจ หดตัวอยางรุนแรงนับตั้งแตเหตุการณวิกฤติทางเศรษฐกิจชวงป 2540-2541 ซึ่งครั้งนี้เปนผลจากการหดตัวของสาขาอุตสาหกรรมและ การสงออกเปนหลัก จึงสงผลกระทบโดยตรงตอปริมาณสินคา และ กิจกรรมโลจิสติกสภายในประเทศ จนทําใหตนทุนโลจิสติกสของ ประเทศลดลงอยางมากดวยเชนกัน ในป 2552 ตนทุนโลจิสติกสของประเทศไทยมีมูลคารวมประมาณ 1.5 ลานลานบาท หรือคิดเปนสัดสวนเทากับ รอยละ 16.8 ของผลิตภัณฑ มวลรวมในประเทศ ณ ราคาประจําป (GDP) ลดลงอยางมากจาก รอยละ 18.6 ของ GDP ในป 2551 โดยประกอบดวย ตนทุนคาขนสงสินคา 746.5 พันลานบาท (รอยละ 8.3 ของ GDP) ตนทุนการเก็บรักษาสินคา คงคลัง 633.3 พันลานบาท (รอยละ 7.0 ของ GDP) และตนทุนการบริหาร จัดการดานโลจิสติกส 138.0 พันลานบาท (รอยละ 1.5 ของ GDP) ภาพรวมต้นทุนโลจิสติกส์ของประเทศไทยในปี 2552 สํานักงานคณะกรรมการพัฒนาการเศรษฐกิจและสังคมแห่งชาติ รายงานโลจิสติกส์ของประเทศไทยประจําปี 2553 ธันวาคม 2553 ISSN 1906-4373 รูปภาพที่ 1 มูลค่าต้นทุนโลจิสติกส์ของประเทศไทย รูปภาพที่ 2 แนวโน้มการขยายตัวของต้นทุนโลจิสติกส์และผลิตภัณฑ์มวลรวม ภายในประเทศ (GDP) ที่มา สศช. ที่มา สศช. ภาพรวมต้นทุนโลจิสติกส์ของประเทศไทยในปี 2552 โครงสร้างต้นทุนโลจิสติกส์ ต้นทุนการขนส่งสินค้า ต้นทุนการเก็บรักษาสินค้าคงคลัง ต้นทุนการบริหารจัดการโลจิสติกส์ สัดส่วนต้นทุนโลจิสติกส์ต่อผลิตภัณฑ์มวลรวมในประเทศ (GDP) บทสรุปและข้อเสนอแนะ บทความการทบทวนแบบจําลองต้นทุนโลจิสติกส์ของประเทศไทย

Welcome message from author
This document is posted to help you gain knowledge. Please leave a comment to let me know what you think about it! Share it to your friends and learn new things together.
Transcript
มูลคาตนทุนโลจิสติกสของประเทศไทยในป 2552 หดตัวลงกวารอยละ 10 เม่ือเทียบกับมูลคาตนทุนโลจิสติกสป 2551 ท้ังน้ี มีสาเหตุสําคัญมาจาก 2 ปจจัยหลัก ท้ังจาก (1) การชะลอตัวของเศรษฐกิจโลกซึ่งสงผลกระทบทางลบตอเศรษฐกิจไทยในป 2552 ทําใหอัตราการเติบโตของเศรษฐกิจในภาพรวม หดตัวลง ซึ่งกระทบตอไปยังปริมาณผลผลิตในสาขาตางๆ ปริมาณขนสงสินคา และมูลคาสินคาคงคลังท่ีลดลง รวมท้ัง มีการปรับลดอัตราดอกเบ้ียเงินกูลูกคาชั้นดี (Minimum Loan Rate; MLR) ตามสถานการณสภาพคลองของเงินทุนในตลาดอีกดวย และ (2) การปรับตัวทางธุรกิจของผูประกอบการไทยเพ่ือรับมือกับการชะลอตัวของอุปสงคในภาพรวม โดยมีความพยายามปรับปรุงประสิทธิภาพของกระบวนการเคล่ือนยาย จัดเก็บ และบริหารจัดการสินคา คงคลัง รวมท้ัง ไดดําเนินมาตรการประหยัดตนทุนการดําเนินงานภายในสถานประกอบการซึ่งรวมไปถึงตนทุนโลจิสติกสอยางเต็มท่ี เพ่ือลดความเส่ียงและเพ่ือความอยูรอดทางธุรกิจจากการไดรับปริมาณคําสั่งซื้อท่ีลดลงอยางมาก
หากเปรียบเทียบกับตนทุนโลจิสติกสของประเทศสหรัฐอเมริกา พบวา ในป 2552 ตนทุนโลจิสติกสของสหรัฐอเมริกามีมูลคารวมประมาณ 1,095 พันลานเหรียญสหรัฐ ซึ่งหดตัวถึงรอยละ 18.2 จากปกอนหนา สงผลใหในทายท่ีสุด สัดสวนตนทุนโลจิสติกสป 2552 ตอผลิตภัณฑมวลรวมในประเทศ ณ ราคาประจําป (GDP) ของสหรัฐอเมริกา ลดลงจากเดิมท่ีมีสัดสวนเทากับรอยละ 9.3 ของ GDP ในป 2551 เหลือเพียงรอยละ 7.7 ของ GDP หรือลดลงประมาณรอยละ 1.6 ของ GDP ซึ่งเปนไปในทิศทางเดียวกับสถานการณในประเทศไทยท่ีมีมูลคาตนทุนโลจิสติกสหดตัวลงกวารอยละ 10 และทําใหสัดสวนตนทุนโลจิสติกสตอ GDP ของประเทศไทยลดลงจากเดิมท่ีมีสัดสวนเทากับรอยละ 18.6 ของ GDP ในป 2551 เหลือเพียงรอยละ 16.8 ของ GDP หรือลดลงประมาณรอยละ 1.8 ของ GDP ในชวงเวลาเดียวกัน
การเคล่ือนไหวของตนทุนโลจิสติกสและเศรษฐกิจไทยในภาพรวม ป 2552 ถือวามีความผันผวนคอนขางมากและมีความผิดปกติ สาเหตุสําคัญเนื่องจากเปนปที่ประเทศไทยประสบภาวะเศรษฐกิจ หดตัวอยางรุนแรงนับต้ังแตเหตุการณวิกฤติทางเศรษฐกิจชวงป 2540-2541 ซึ่งครั้งนี้เปนผลจากการหดตัวของสาขาอุตสาหกรรมและ การสงออกเปนหลัก จึงสงผลกระทบโดยตรงตอปริมาณสินคา และกิจกรรมโลจิสติกสภายในประเทศ จนทําใหตนทุนโลจิสติกสของประเทศลดลงอยางมากดวยเชนกัน
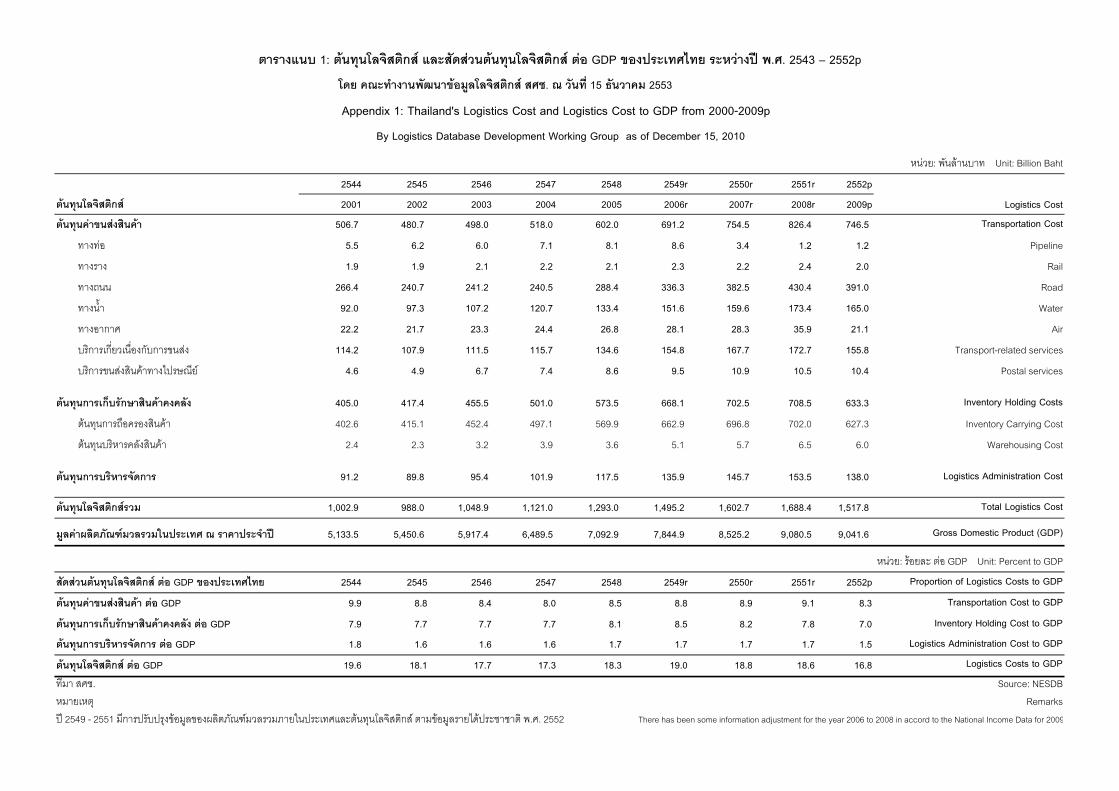
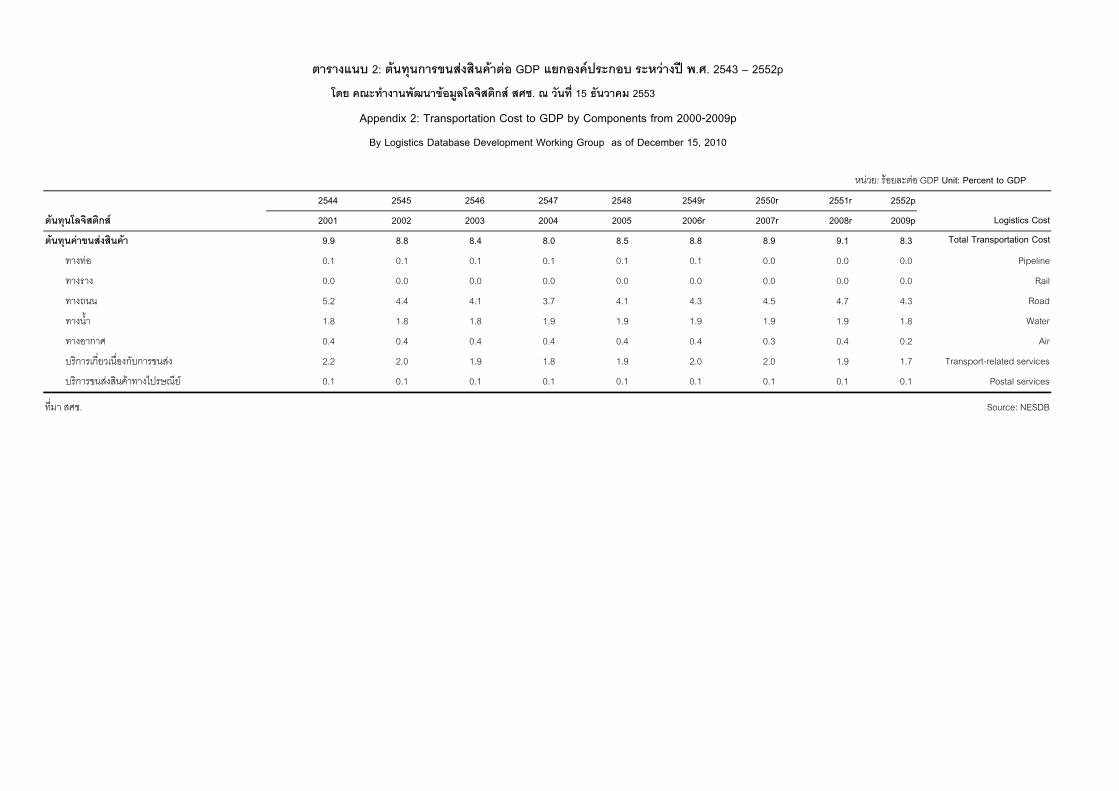
ในป 2552 ตนทุนโลจิสติกสของประเทศไทยมีมูลคารวมประมาณ 1.5 ลานลานบาท หรือคิดเปนสัดสวนเทากับ รอยละ 16.8 ของผลิตภัณฑ มวลรวมในประเทศ ณ ราคาประจําป (GDP) ลดลงอยางมากจาก รอยละ 18.6 ของ GDP ในป 2551 โดยประกอบดวย ตนทุนคาขนสงสินคา 746.5 พันลานบาท (รอยละ 8.3 ของ GDP) ตนทุนการเก็บรักษาสินคา คงคลัง 633.3 พันลานบาท (รอยละ 7.0 ของ GDP) และตนทุนการบริหารจัดการดานโลจิสติกส 138.0 พันลานบาท (รอยละ 1.5 ของ GDP)
ภาพรวมต้นทุน โลจิสติกส์ของประ เทศไทยในปี 2552
สํา นักงานคณะกรรมการพัฒนาการเศรษฐกิจและ สังคมแห่งชาติ
รายงานโลจิสติกส์ของประเทศไทยประจําปี 2553 ธันวาคม 2553
ISSN 1906-4373
รูปภาพท่ี 1 มูลค่าต้นทุนโลจิสติกส์ของประเทศไทย
รูปภาพท่ี 2 แนวโน้มการขยายตัวของต้นทุนโลจิสติกส์และผลิตภัณฑ์มวลรวมภายในประเทศ (GDP)
ท่ีมา สศช.
ท่ีมา สศช.
ภาพรวมต้นทุนโลจิสติกส์ของประเทศไทยในปี 2552
โครงสร้างต้นทุนโลจิสติกส์
ต้นทุนการขนส่งสินค้า
ต้นทุนการเก็บรักษาสินค้าคงคลัง
ต้นทุนการบริหารจัดการโลจิสติกส์
สัดส่วนต้นทุนโลจิสติกส์ต่อผลิตภัณฑ์มวลรวมในประเทศ (GDP)
บทสรุปและข้อเสนอแนะ
บทความการทบทวนแบบจําลองต้นทุนโลจิสติกส์ของประเทศไทย
ท่ีมา สศช.
ความสําคัญและสามารถปรับรูปแบบธุรกิจในลักษณะท่ีลดปริมาณสินคาคงคลัง รวมทั้งบริหารจัดการตนทุนการเก็บรักษาสินคาคงคลังใหลดลงมาโดยตลอด สําหรับตนทุนการบริหารจัดการดานโลจิสติกส มีสัดสวนเกือบเทาเดิมท่ีประมาณรอยละ 9 ของตนทุนโลจิสติกสรวม
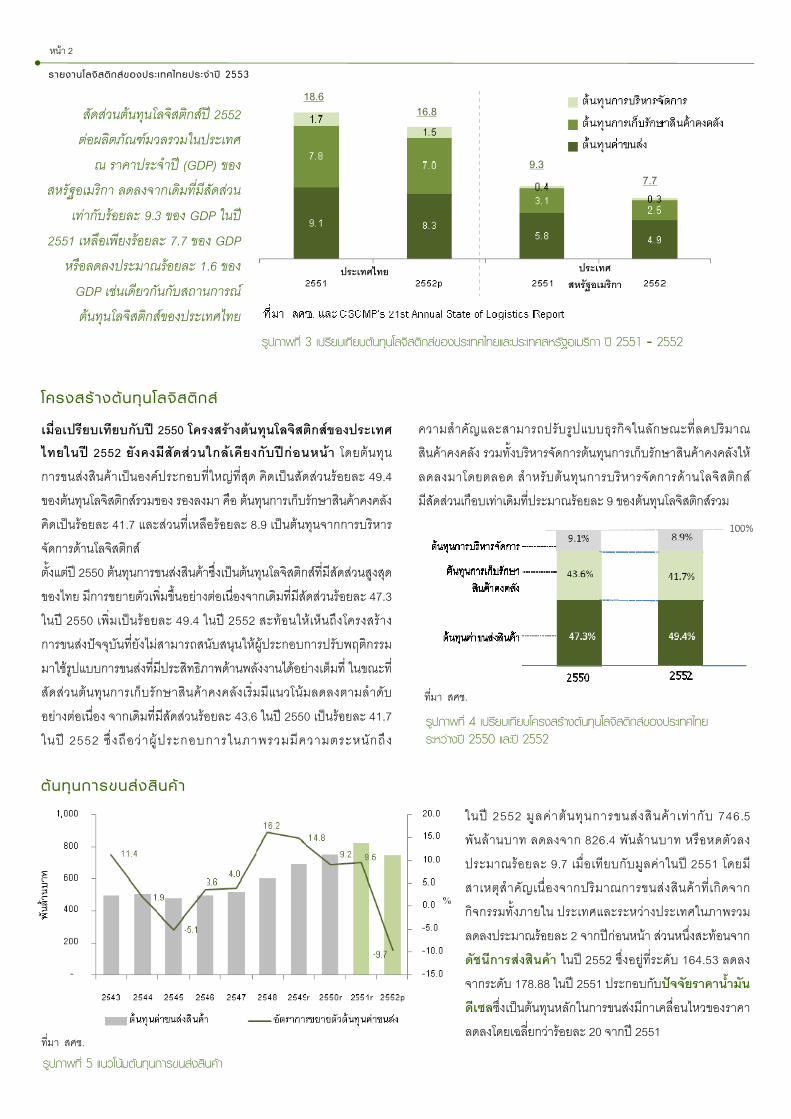
เม่ือเปรียบเทียบกับป 2550 โครงสรางตนทุนโลจิสติกสของประเทศไทยในป 2552 ยังคงมีสัดสวนใกลเคียงกับปกอนหนา โดยตนทุน การขนสงสินคาเปนองคประกอบท่ีใหญท่ีสุด คิดเปนสัดสวนรอยละ 49.4 ของตนทุนโลจิสติกสรวมของ รองลงมา คือ ตนทุนการเก็บรักษาสินคาคงคลัง คิดเปนรอยละ 41.7 และสวนท่ีเหลือรอยละ 8.9 เปนตนทุนจากการบริหารจัดการดานโลจิสติกส ต้ังแตป 2550 ตนทุนการขนสงสินคาซึ่งเปนตนทุนโลจิสติกสท่ีมีสัดสวนสูงสุดของไทย มีการขยายตัวเพ่ิมขึ้นอยางตอเน่ืองจากเดิมท่ีมีสัดสวนรอยละ 47.3 ในป 2550 เพ่ิมเปนรอยละ 49.4 ในป 2552 สะทอนใหเห็นถึงโครงสราง การขนสงปจจุบันท่ียังไมสามารถสนับสนุนใหผูประกอบการปรับพฤติกรรมมาใชรูปแบบการขนสงท่ีมีประสิทธิภาพดานพลังงานไดอยางเต็มท่ี ในขณะท่ีสัดสวนตนทุนการเก็บรักษาสินคาคงคลังเร่ิมมีแนวโนมลดลงตามลําดับ อยางตอเน่ือง จากเดิมท่ีมีสัดสวนรอยละ 43.6 ในป 2550 เปนรอยละ 41.7 ในป 2552 ซึ่ งถือวาผูประกอบการในภาพรวมมีความตระหนักถึง
ต้นทุนการขนส่งสินค้ า
หนา 2
รายงานโลจิสติกส์ของประ เทศไทยประ จําปี 2553
รูปภาพท่ี 3 โครงสร้างต้นทุนโลจิสติกส์ของประเทศไทยและประเทศที่พัฒนาแล้ว
โครงสร้ างต้นทุน โลจิสติกส์
รูปภาพท่ี 3 เปรียบเทียบต้นทุนโลจิสติกส์ของประเทศไทยและประเทศสหรัฐอเมริกา ปี 2551 - 2552
รูปภาพท่ี 4 เปรียบเทียบโครงสร้างต้นทุนโลจิสติกส์ของประเทศไทยระหว่างปี 2550 และปี 2552
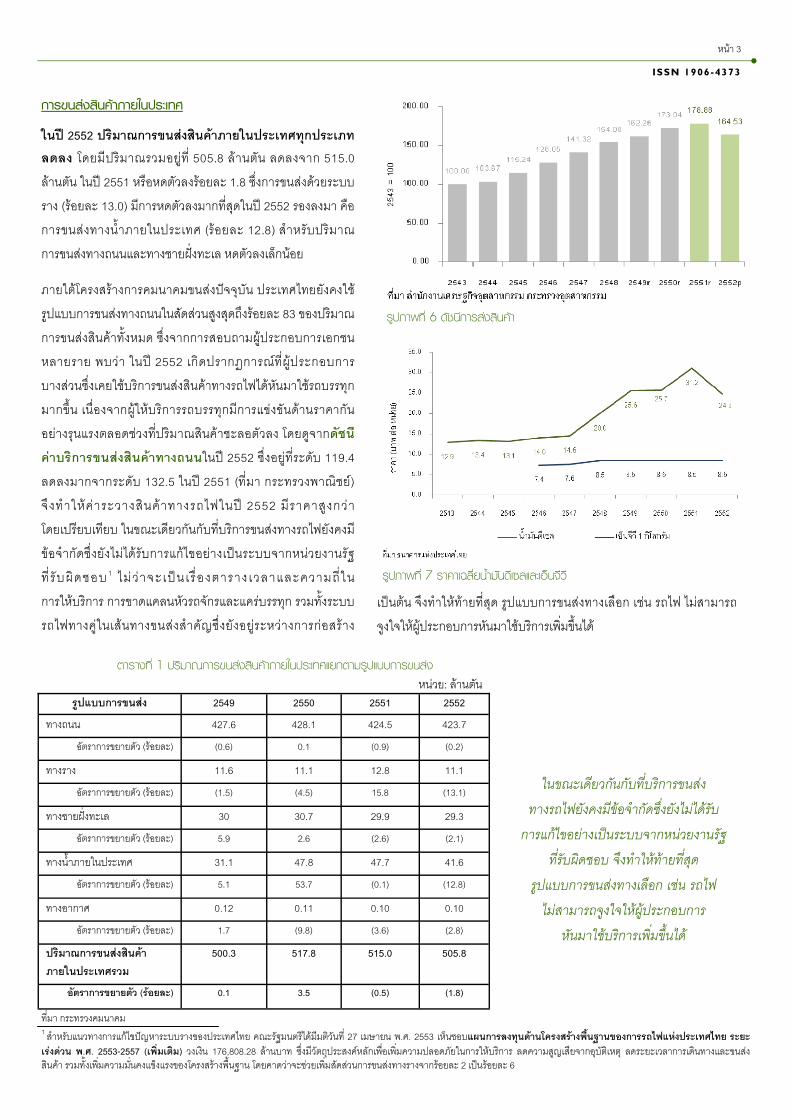
ในป 2552 มูลคาตนทุนการขนสงสินคาเทากับ 746.5 พันลานบาท ลดลงจาก 826.4 พันลานบาท หรือหดตัวลงประมาณรอยละ 9.7 เม่ือเทียบกับมูลคาในป 2551 โดยมีสาเหตุสําคัญเน่ืองจากปริมาณการขนสงสินคาท่ีเกิดจากกิจกรรมทั้งภายใน ประเทศและระหวางประเทศในภาพรวม ลดลงประมาณรอยละ 2 จากปกอนหนา สวนหน่ึงสะทอนจากดัชนีการสงสินคา ในป 2552 ซึ่งอยูท่ีระดับ 164.53 ลดลงจากระดับ 178.88 ในป 2551 ประกอบกับปจจัยราคาน้ํามันดีเซลซึ่งเปนตนทุนหลักในการขนสงมีกาเคลื่อนไหวของราคาลดลงโดยเฉล่ียกวารอยละ 20 จากป 2551
สัดสวนตนทุนโลจิสติกสป 2552 ตอผลิตภัณฑมวลรวมในประเทศ ณ ราคาประจําป (GDP) ของ
สหรัฐอเมริกา ลดลงจากเดิมที่มีสัดสวนเทากับรอยละ 9.3 ของ GDP ในป
2551 เหลือเพียงรอยละ 7.7 ของ GDP หรือลดลงประมาณรอยละ 1.6 ของ
GDP เชนเดียวกันกับสถานการณตนทุนโลจิสติกสของประเทศไทย
ประเทศไทย ประเทศสหรัฐอเมริกา
18.6 16.8
9.3 7.7
รูปภาพท่ี 5 แนวโน้มต้นทุนการขนส่งสินค้า
ท่ีมา สศช.
การขนส่งสินค้าภายในประเทศ
ในป 2552 ปริมาณการขนสงสินคาภายในประเทศทุกประเภทลดลง โดยมีปริมาณรวมอยูท่ี 505.8 ลานตัน ลดลงจาก 515.0 ลานตัน ในป 2551 หรือหดตัวลงรอยละ 1.8 ซึ่งการขนสงดวยระบบราง (รอยละ 13.0) มีการหดตัวลงมากที่สุดในป 2552 รองลงมา คือ การขนสงทางนํ้าภายในประเทศ (รอยละ 12.8) สําหรับปริมาณ การขนสงทางถนนและทางชายฝงทะเล หดตัวลงเล็กนอย
ภายใตโครงสรางการคมนาคมขนสงปจจุบัน ประเทศไทยยังคงใชรูปแบบการขนสงทางถนนในสัดสวนสูงสุดถึงรอยละ 83 ของปริมาณการขนสงสินคาท้ังหมด ซึ่งจากการสอบถามผูประกอบการเอกชนหลายราย พบวา ในป 2552 เกิดปรากฏการณท่ีผูประกอบการบางสวนซึ่งเคยใชบริการขนสงสินคาทางรถไฟไดหันมาใชรถบรรทุกมากขึ้น เน่ืองจากผูใหบริการรถบรรทุกมีการแขงขันดานราคากัน อยางรุนแรงตลอดชวงท่ีปริมาณสินคาชะลอตัวลง โดยดูจากดัชนีคาบริการขนสงสินคาทางถนนในป 2552 ซึ่งอยูท่ีระดับ 119.4 ลดลงมากจากระดับ 132.5 ในป 2551 (ท่ีมา กระทรวงพาณิชย) จึงทําใหคาระวางสินคาทางรถไฟในป 2552 มีราคาสูงกวา โดยเปรียบเทียบ ในขณะเดียวกันกับท่ีบริการขนสงทางรถไฟยังคงมีขอจํากัดซึ่งยังไมไดรับการแกไขอยางเปนระบบจากหนวยงานรัฐ ท่ี รับผิดชอบ 1 ไม ว าจะเปน เ ร่ืองตาราง เวลาและความถ่ีใน การใหบริการ การขาดแคลนหัวรถจักรและแครบรรทุก รวมทั้งระบบรถไฟทางคูในเสนทางขนสงสําคัญซึ่งยังอยูระหวางการกอสราง
เปนตน จึงทําใหทายท่ีสุด รูปแบบการขนสงทางเลือก เชน รถไฟ ไมสามารถ จูงใจใหผูประกอบการหันมาใชบริการเพ่ิมขึ้นได
หนา 3
ISSN 1906-4373
ตารางท่ี 1 ปริมาณการขนส่งสินค้าภายในประเทศแยกตามรูปแบบการขนส่ง
รูปภาพท่ี 6 ดชันีการส่งสินค้า
รูปภาพท่ี 7 ราคาเฉล่ียนํ้ามันดีเซลและเอ็นจีวี
1 สําหรับแนวทางการแกไขปญหาระบบรางของประเทศไทย คณะรัฐมนตรีไดมีมติวันที่ 27 เมษายน พ.ศ. 2553 เห็นชอบแผนการลงทนุดานโครงสรางพืน้ฐานของการรถไฟแหงประเทศไทย ระยะเรงดวน พ.ศ. 2553-2557 (เพิ่มเติม) วงเงิน 176,808.28 ลานบาท ซึ่งมีวัตถุประสงคหลักเพ่ือเพ่ิมความปลอดภัยในการใหบริการ ลดความสูญเสียจากอุบัติเหตุ ลดระยะเวลาการเดนิทางและขนสงสินคา รวมทั้งเพ่ิมความม่ันคงแข็งแรงของโครงสรางพ้ืนฐาน โดยคาดวาจะชวยเพ่ิมสดัสวนการขนสงทางรางจากรอยละ 2 เปนรอยละ 6
ในขณะเดียวกันกับที่บริการขนสง ทางรถไฟยังคงมีขอจํากัดซึ่งยังไมไดรับการแกไขอยางเปนระบบจากหนวยงานรัฐ
ที่รับผิดชอบ จึงทําใหทายที่สุด รูปแบบการขนสงทางเลือก เชน รถไฟ ไมสามารถจูงใจใหผูประกอบการ
หันมาใชบริการเพิ่มขึ้นได
หนวย: ลานตัน รูปแบบการขนสง 2549 2550 2551 2552
ทางถนน 427.6 428.1 424.5 423.7
อัตราการขยายตัว (รอยละ) (0.6) 0.1 (0.9) (0.2)
ทางราง 11.6 11.1 12.8 11.1
อัตราการขยายตัว (รอยละ) (1.5) (4.5) 15.8 (13.1)
ทางชายฝงทะเล 30 30.7 29.9 29.3
อัตราการขยายตัว (รอยละ) 5.9 2.6 (2.6) (2.1)
ทางนํ้าภายในประเทศ 31.1 47.8 47.7 41.6
อัตราการขยายตัว (รอยละ) 5.1 53.7 (0.1) (12.8)
ทางอากาศ 0.12 0.11 0.10 0.10
อัตราการขยายตัว (รอยละ) 1.7 (9.8) (3.6) (2.8)
ปริมาณการขนสงสินคาภายในประเทศรวม
500.3 517.8 515.0 505.8
อัตราการขยายตัว (รอยละ) 0.1 3.5 (0.5) (1.8)
ที่มา กระทรวงคมนาคม
2 นิตยสาร Logistics Digest, ฉบับที่ 54, เดือนกนัยายน 2552
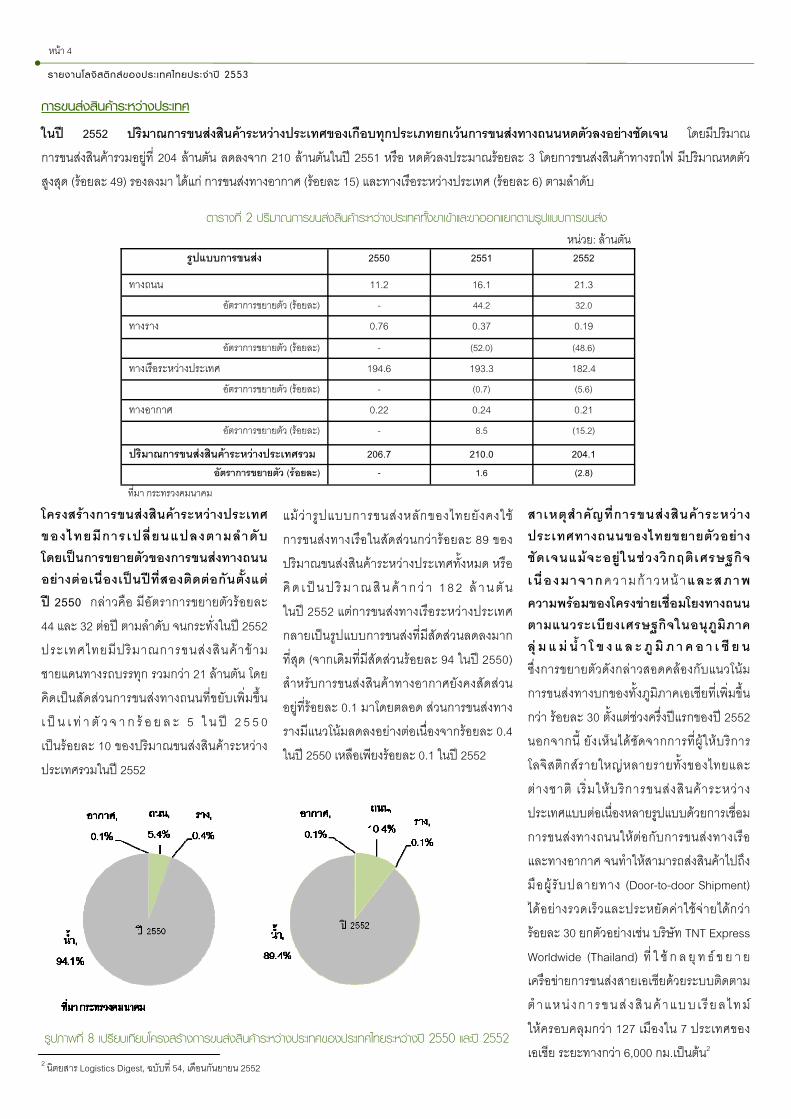
โครงสรางการขนสงสินคาระหวางประเทศของไทยมีการเป ล่ียนแปลงตามลํา ดับ โดยเปนการขยายตัวของการขนสงทางถนนอยางตอเนื่องเปนปที่สองติดตอกันต้ังแต ป 2550 กลาวคือ มีอัตราการขยายตัวรอยละ 44 และ 32 ตอป ตามลําดับ จนกระท่ังในป 2552 ประเทศไทยมีปริมาณการขนสงสินคาขาม ชายแดนทางรถบรรทุก รวมกวา 21 ลานตัน โดยคิดเปนสัดสวนการขนสงทางถนนท่ีขยับเพ่ิมขึ้นเ ป น เ ท า ตั ว จ า ก ร อ ย ล ะ 5 ใ น ป 2 5 5 0 เปนรอยละ 10 ของปริมาณขนสงสินคาระหวางประเทศรวมในป 2552
การขนส่งสินค้าระหว่างประเทศ
ในป 2552 ปริมาณการขนสงสินคาระหวางประเทศของเกือบทุกประเภทยกเวนการขนสงทางถนนหดตัวลงอยางชัดเจน โดยมีปริมาณ การขนสงสินคารวมอยูท่ี 204 ลานตัน ลดลงจาก 210 ลานตันในป 2551 หรือ หดตัวลงประมาณรอยละ 3 โดยการขนสงสินคาทางรถไฟ มีปริมาณหดตัวสูงสุด (รอยละ 49) รองลงมา ไดแก การขนสงทางอากาศ (รอยละ 15) และทางเรือระหวางประเทศ (รอยละ 6) ตามลําดับ
รายงานโลจิสติกส์ของประ เทศไทยประ จําปี 2553
รูปภาพท่ี 8 เปรียบเทียบโครงสร้างการขนส่งสินค้าระหว่างประเทศของประเทศไทยระหว่างปี 2550 และปี 2552
ตารางท่ี 2 ปริมาณการขนส่งสินค้าระหว่างประเทศท้ังขาเข้าและขาออกแยกตามรูปแบบการขนส่ง
หนา 4
แมวารูปแบบการขนสงหลักของไทยยังคงใช การขนสงทางเรือในสัดสวนกวารอยละ 89 ของปริมาณขนสงสินคาระหวางประเทศท้ังหมด หรือคิ ด เ ป น ป ริ ม าณ สินค า ก ว า 1 8 2 ล า น ตั น ในป 2552 แตการขนสงทางเรือระหวางประเทศกลายเปนรูปแบบการขนสงท่ีมีสัดสวนลดลงมากท่ีสุด (จากเดิมท่ีมีสัดสวนรอยละ 94 ในป 2550) สําหรับการขนสงสินคาทางอากาศยังคงสัดสวนอยูท่ีรอยละ 0.1 มาโดยตลอด สวนการขนสงทางรางมีแนวโนมลดลงอยางตอเน่ืองจากรอยละ 0.4 ในป 2550 เหลือเพียงรอยละ 0.1 ในป 2552
สาเหตุสําคัญที่การขนสงสินคาระหวางประเทศทางถนนของไทยขยายตัวอยางชัดเจนแมจะอยูในชวงวิกฤติเศรษฐกิจ เนื่ อ งมาจากความก า วหน าและสภาพ ความพรอมของโครงขายเช่ือมโยงทางถนนตามแนวระเบียงเศรษฐกิจในอนุภูมิภาค ลุ ม แ ม น้ํ า โ ข ง แ ล ะ ภู มิ ภ า ค อ า เ ซี ย น ซึ่งการขยายตัวดังกลาวสอดคลองกับแนวโนม การขนสงทางบกของทั้งภูมิภาคเอเชียท่ีเพ่ิมขึ้นกวา รอยละ 30 ต้ังแตชวงคร่ึงปแรกของป 2552 นอกจากน้ี ยังเห็นไดชัดจากการที่ผูใหบริการ โลจิสติกสรายใหญหลายรายท้ังของไทยและตางชาติ เ ร่ิมใหบริการขนสงสินคาระหวางประเทศแบบตอเน่ืองหลายรูปแบบดวยการเชื่อมการขนสงทางถนนใหตอกับการขนสงทางเรือและทางอากาศ จนทําใหสามารถสงสินคาไปถึงมือผู รับปลายทาง (Door-to-door Shipment) ไดอยางรวดเร็วและประหยัดคาใชจายไดกวารอยละ 30 ยกตัวอยางเชน บริษัท TNT Express Worldwide (Thailand) ท่ี ใ ช ก ล ยุ ท ธ ข ย า ยเครือขายการขนสงสายเอเชียดวยระบบติดตามตํ าแหน ง ก า รขนส ง สิ นค า แบบ เ รี ยล ไทม ใหครอบคลุมกวา 127 เมืองใน 7 ประเทศของเอเชีย ระยะทางกวา 6,000 กม.เปนตน2
หนวย: ลานตัน รูปแบบการขนสง 2550 2551 2552
ทางถนน 11.2 16.1 21.3 อัตราการขยายตัว (รอยละ) - 44.2 32.0
ทางราง 0.76 0.37 0.19
อัตราการขยายตัว (รอยละ) - (52.0) (48.6)
ทางเรือระหวางประเทศ 194.6 193.3 182.4 อัตราการขยายตัว (รอยละ) - (0.7) (5.6)
ทางอากาศ 0.22 0.24 0.21 อัตราการขยายตัว (รอยละ) - 8.5 (15.2)
ปริมาณการขนสงสินคาระหวางประเทศรวม 206.7 210.0 204.1 อัตราการขยายตัว (รอยละ) - 1.6 (2.8)
ที่มา กระทรวงคมนาคม
ISSN 1906-4373
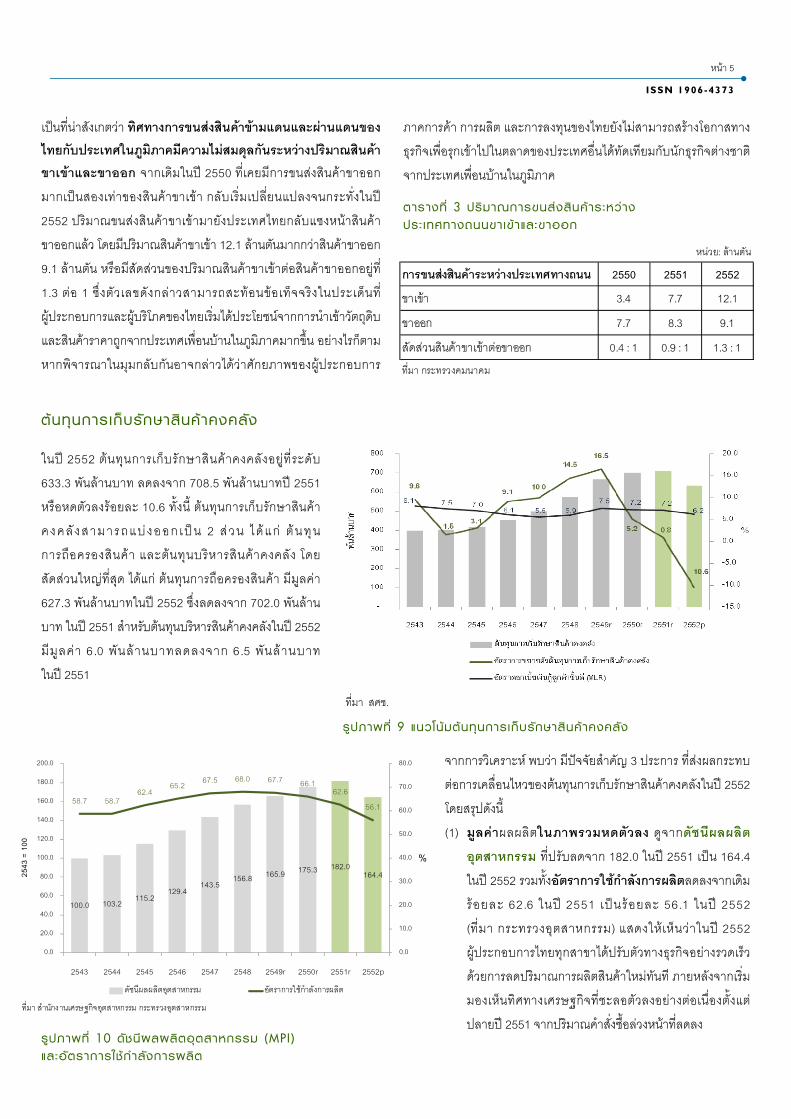
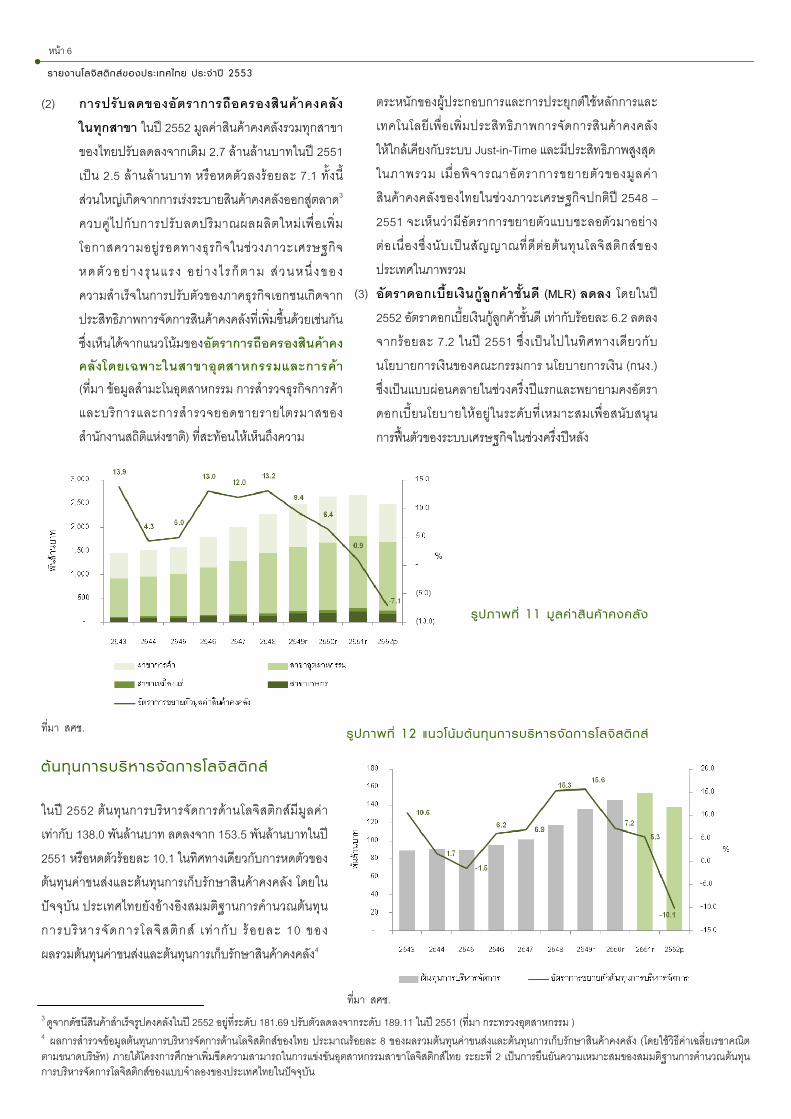
จากการวิเคราะห พบวา มีปจจัยสําคัญ 3 ประการ ท่ีสงผลกระทบตอการเคลื่อนไหวของตนทุนการเก็บรักษาสินคาคงคลังในป 2552 โดยสรุปดังน้ี (1) มูลคาผลผลิตในภาพรวมหดตัวลง ดูจากดัชนีผลผลิต
อุตสาหกรรม ท่ีปรับลดจาก 182.0 ในป 2551 เปน 164.4 ในป 2552 รวมท้ังอัตราการใชกําลังการผลิตลดลงจากเดิมรอยละ 62.6 ในป 2551 เปนรอยละ 56.1 ในป 2552 (ท่ีมา กระทรวงอุตสาหกรรม) แสดงใหเห็นวาในป 2552 ผูประกอบการไทยทุกสาขาไดปรับตัวทางธุรกิจอยางรวดเร็วดวยการลดปริมาณการผลิตสินคาใหมทันที ภายหลังจากเร่ิมมองเห็นทิศทางเศรษฐกิจท่ีชะลอตัวลงอยางตอเน่ืองต้ังแตปลายป 2551 จากปริมาณคําสั่งซื้อลวงหนาท่ีลดลง
ในป 2552 ตนทุนการเก็บรักษาสินคาคงคลังอยู ท่ีระดับ 633.3 พันลานบาท ลดลงจาก 708.5 พันลานบาทป 2551 หรือหดตัวลงรอยละ 10.6 ท้ังน้ี ตนทุนการเก็บรักษาสินคา คงคลั งสามารถแบ งออก เป น 2 ส วน ได แก ตน ทุน การถือครองสินคา และตนทุนบริหารสินคาคงคลัง โดยสัดสวนใหญท่ีสุด ไดแก ตนทุนการถือครองสินคา มีมูลคา 627.3 พันลานบาทในป 2552 ซึ่งลดลงจาก 702.0 พันลานบาท ในป 2551 สําหรับตนทุนบริหารสินคาคงคลังในป 2552 มีมูลคา 6.0 พันลานบาทลดลงจาก 6.5 พันลานบาท ในป 2551
ภาคการคา การผลิต และการลงทุนของไทยยังไมสามารถสรางโอกาสทางธุรกิจเพ่ือรุกเขาไปในตลาดของประเทศอื่นไดทัดเทียมกับนักธุรกิจตางชาติจากประเทศเพ่ือนบานในภูมิภาค
เปนท่ีนาสังเกตวา ทิศทางการขนสงสินคาขามแดนและผานแดนของไทยกับประเทศในภูมิภาคมีความไมสมดุลกันระหวางปริมาณสินคาขาเขาและขาออก จากเดิมในป 2550 ท่ีเคยมีการขนสงสินคาขาออกมากเปนสองเทาของสินคาขาเขา กลับเร่ิมเปลี่ยนแปลงจนกระท่ังในป 2552 ปริมาณขนสงสินคาขาเขามายังประเทศไทยกลับแซงหนาสินคา ขาออกแลว โดยมีปริมาณสินคาขาเขา 12.1 ลานตันมากกวาสินคาขาออก 9.1 ลานตัน หรือมีสัดสวนของปริมาณสินคาขาเขาตอสินคาขาออกอยูท่ี 1.3 ตอ 1 ซึ่งตัวเลขดังกลาวสามารถสะทอนขอเท็จจริงในประเด็นท่ีผูประกอบการและผูบริโภคของไทยเร่ิมไดประโยชนจากการนําเขาวัตถุดิบและสินคาราคาถูกจากประเทศเพ่ือนบานในภูมิภาคมากขึ้น อยางไรก็ตาม หากพิจารณาในมุมกลับกันอาจกลาวไดวาศักยภาพของผูประกอบการ
ต้นทุนการเก็บรักษาสินค้ าคงคลัง
ตารางที่ 3 ปริมาณการขนส่งสินค้ าร ะหว่าง ประ เทศทางถนนขา เข้ า แล ะขาออก
รูปภาพที่ 9 แนวโน้มต้นทุนการเก็บรักษาสินค้ าคงคลัง
หนวย: ลานตัน
การขนสงสินคาระหวางประเทศทางถนน 2550 2551 2552
ขาเขา 3.4 7.7 12.1
ขาออก 7.7 8.3 9.1
สัดสวนสินคาขาเขาตอขาออก 0.4 : 1 0.9 : 1 1.3 : 1ที่มา กระทรวงคมนาคม
หนา 5
รูปภาพที่ 10 ดัชนีผลผลิตอุตสาหกรรม (MPI ) และอัตราการใ ช้กํ าลังการผลิต
ท่ีมา สศช.
100.0 103.2 115.2129.4
143.5 156.8 165.9 175.3 182.0164.4
58.7 58.762.4
65.2 67.5 68.0 67.7 66.162.6
56.1
0.0
10.0
20.0
30.0
40.0
50.0
60.0
70.0
80.0
0.0
20.0
40.0
60.0
80.0
100.0
120.0
140.0
160.0
180.0
200.0
2543 2544 2545 2546 2547 2548 2549r 2550r 2551r 2552p
%
ท่ีมา สํานักงานเศรษฐกิจอุตสาหกรรม กระทรวงอุตสาหกรรม
2543
= 1
00
ดัชนีผลผลิตอุตสาหกรรม อัตราการใชกําลังการผลิต
3 ดูจากดัชนีสินคาสําเร็จรูปคงคลังในป 2552 อยูท่ีระดับ 181.69 ปรับตัวลดลงจากระดับ 189.11 ในป 2551 (ท่ีมา กระทรวงอุตสาหกรรม ) 4 ผลการสํารวจขอมูลตนทุนการบริหารจัดการดานโลจิสติกสของไทย ประมาณรอยละ 8 ของผลรวมตนทุนคาขนสงและตนทุนการเก็บรักษาสินคาคงคลัง (โดยใชวิธีคาเฉล่ียเรขาคณิต ตามขนาดบริษัท) ภายใตโครงการศึกษาเพิ่มขีดความสามารถในการแขงขันอุตสาหกรรมสาขาโลจิสติกสไทย ระยะท่ี 2 เปนการยืนยันความเหมาะสมของสมมติฐานการคํานวณตนทุนการบริหารจัดการโลจิสติกสของแบบจําลองของประเทศไทยในปจจุบัน
รายงานโลจิสติกส์ของประ เทศไทย ประจําปี 2553
ต้นทุนการบริหารจัดการโลจิสติกส์
ในป 2552 ตนทุนการบริหารจัดการดานโลจิสติกสมีมูลคาเทากับ 138.0 พันลานบาท ลดลงจาก 153.5 พันลานบาทในป 2551 หรือหดตัวรอยละ 10.1 ในทิศทางเดียวกับการหดตัวของตนทุนคาขนสงและตนทุนการเก็บรักษาสินคาคงคลัง โดยในปจจุบัน ประเทศไทยยังอางอิงสมมติฐานการคํานวณตนทุนการบริหารจัดการโลจิสติกส เท ากับ รอยละ 10 ของ ผลรวมตนทุนคาขนสงและตนทุนการเก็บรักษาสินคาคงคลัง4
รูปภาพที่ 11 มูลค่ าสินค้ าคงคลัง
รูปภาพที่ 12 แนวโน้มต้นทุนการบริหารจัดการโลจิสติกส์
หนา 6
ตระหนักของผูประกอบการและการประยุกตใชหลักการและเทคโนโลยีเพ่ือเพ่ิมประสิทธิภาพการจัดการสินคาคงคลัง ใหใกลเคียงกับระบบ Just-in-Time และมีประสิทธิภาพสูงสุด ในภาพรวม เ ม่ือพิจารณาอัตราการขยายตัวของมูลคา สินคาคงคลังของไทยในชวงภาวะเศรษฐกิจปกติป 2548 – 2551 จะเห็นวามีอัตราการขยายตัวแบบชะลอตัวมาอยางตอเน่ืองซึ่งนับเปนสัญญาณท่ีดีตอตนทุนโลจิสติกสของประเทศในภาพรวม
(3) อัตราดอกเบี้ยเงินกูลูกคาช้ันดี (MLR) ลดลง โดยในป 2552 อัตราดอกเบ้ียเงินกูลูกคาชั้นดี เทากับรอยละ 6.2 ลดลงจากรอยละ 7.2 ในป 2551 ซึ่งเปนไปในทิศทางเดียวกับนโยบายการเงินของคณะกรรมการ นโยบายการเงิน (กนง.) ซึ่งเปนแบบผอนคลายในชวงคร่ึงปแรกและพยายามคงอัตราดอกเบี้ยนโยบายใหอยูในระดับท่ีเหมาะสมเพ่ือสนับสนุน การฟนตัวของระบบเศรษฐกิจในชวงคร่ึงปหลัง
ท่ีมา สศช.
ท่ีมา สศช.
(2) การปรับลดของอัตราการถือครองสินคาคงคลัง
ในทุกสาขา ในป 2552 มูลคาสินคาคงคลังรวมทุกสาขาของไทยปรับลดลงจากเดิม 2.7 ลานลานบาทในป 2551เปน 2.5 ลานลานบาท หรือหดตัวลงรอยละ 7.1 ท้ังน้ี สวนใหญเกิดจากการเรงระบายสินคาคงคลังออกสูตลาด3 ควบคูไปกับการปรับลดปริมาณผลผลิตใหมเพ่ือเพ่ิมโอกาสความอยูรอดทางธุรกิจในชวงภาวะเศรษฐกิจ หดตัวอย า ง รุนแรง อย า ง ไ รก็ ตาม ส วนห น่ึ งของความสําเร็จในการปรับตัวของภาคธุรกิจเอกชนเกิดจากประสิทธิภาพการจัดการสินคาคงคลังท่ีเพ่ิมขึ้นดวยเชนกัน ซึ่งเห็นไดจากแนวโนมของอัตราการถือครองสินคาคงคลังโดยเฉพาะในสาขาอุตสาหกรรมและการคา (ท่ีมา ขอมูลสํามะโนอุตสาหกรรม การสํารวจธุรกิจการคาและบริการและการสํารวจยอดขายรายไตรมาสของสํานักงานสถิติแหงชาติ) ท่ีสะทอนใหเห็นถึงความ
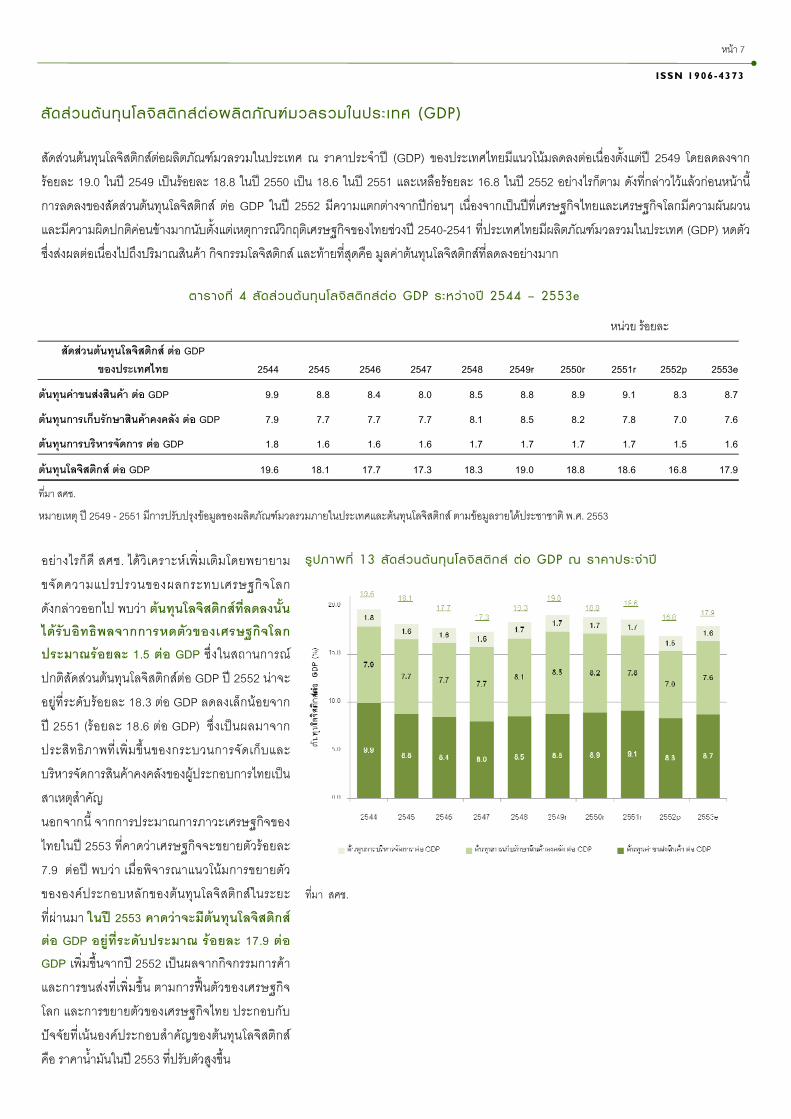
อยางไรก็ดี สศช. ไดวิเคราะหเพ่ิมเติมโดยพยายามขจัดความแปรปรวนของผลกระทบเศรษฐกิจโลกดังกลาวออกไป พบวา ตนทุนโลจิสติกสที่ลดลงนั้น ไดรับอิทธิพลจากการหดตัวของเศรษฐกิจโลกประมาณรอยละ 1.5 ตอ GDP ซึ่งในสถานการณปกติสัดสวนตนทุนโลจิสติกสตอ GDP ป 2552 นาจะอยูท่ีระดับรอยละ 18.3 ตอ GDP ลดลงเล็กนอยจาก ป 2551 (รอยละ 18.6 ตอ GDP) ซึ่งเปนผลมาจากประสิทธิภาพท่ีเพ่ิมขึ้นของกระบวนการจัดเก็บและบริหารจัดการสินคาคงคลังของผูประกอบการไทยเปนสาเหตุสําคัญ นอกจากนี้ จากการประมาณการภาวะเศรษฐกิจของไทยในป 2553 ท่ีคาดวาเศรษฐกิจจะขยายตัวรอยละ 7.9 ตอป พบวา เม่ือพิจารณาแนวโนมการขยายตัวขององคประกอบหลักของตนทุนโลจิสติกสในระยะ ท่ีผานมา ในป 2553 คาดวาจะมีตนทุนโลจิสติกสตอ GDP อยูที่ระดับประมาณ รอยละ 17.9 ตอ GDP เพ่ิมขึ้นจากป 2552 เปนผลจากกิจกรรมการคาและการขนสงท่ีเพ่ิมขึ้น ตามการฟนตัวของเศรษฐกิจโลก และการขยายตัวของเศรษฐกิจไทย ประกอบกับปจจัยท่ีเนนองคประกอบสําคัญของตนทุนโลจิสติกส คือ ราคานํ้ามันในป 2553 ท่ีปรับตัวสูงขึ้น
สัดสวนตนทุนโลจิสติกสตอผลิตภัณฑมวลรวมในประเทศ ณ ราคาประจําป (GDP) ของประเทศไทยมีแนวโนมลดลงตอเน่ืองต้ังแตป 2549 โดยลดลงจาก รอยละ 19.0 ในป 2549 เปนรอยละ 18.8 ในป 2550 เปน 18.6 ในป 2551 และเหลอืรอยละ 16.8 ในป 2552 อยางไรก็ตาม ดังท่ีกลาวไวแลวกอนหนาน้ี การลดลงของสัดสวนตนทุนโลจิสติกส ตอ GDP ในป 2552 มีความแตกตางจากปกอนๆ เน่ืองจากเปนปท่ีเศรษฐกิจไทยและเศรษฐกิจโลกมีความผันผวนและมีความผิดปกติคอนขางมากนับต้ังแตเหตุการณวิกฤติเศรษฐกิจของไทยชวงป 2540-2541 ท่ีประเทศไทยมีผลิตภัณฑมวลรวมในประเทศ (GDP) หดตัว ซึ่งสงผลตอเน่ืองไปถึงปริมาณสินคา กิจกรรมโลจิสติกส และทายท่ีสุดคือ มูลคาตนทุนโลจิสติกสท่ีลดลงอยางมาก
ตารางที่ 4 สัดส่วนต้นทุน โลจิสติกส์ต่อ GDP ระหว่างปี 2544 – 2553e
รูปภาพที่ 13 สัดส่วนต้นทุน โลจิสติกส์ ต่อ GDP ณ ราคาประจํ าปี
สัดส่วนต้นทุน โลจิสติกส์ต่อผลิตภัณฑ์มวลรวมในประ เทศ (GDP)
หนา 7
ISSN 1906-4373
ท่ีมา สศช.
สัดสวนตนทุนโลจิสติกส ตอ GDP
ของประเทศไทย 2544 2545 2546 2547 2548 2549r 2550r 2551r 2552p 2553e
ตนทุนคาขนสงสินคา ตอ GDP 9.9 8.8 8.4 8.0 8.5 8.8 8.9 9.1 8.3 8.7
ตนทุนการเก็บรักษาสินคาคงคลัง ตอ GDP 7.9 7.7 7.7 7.7 8.1 8.5 8.2 7.8 7.0 7.6
ตนทุนการบริหารจัดการ ตอ GDP 1.8 1.6 1.6 1.6 1.7 1.7 1.7 1.7 1.5 1.6
ตนทุนโลจิสติกส ตอ GDP 19.6 18.1 17.7 17.3 18.3 19.0 18.8 18.6 16.8 17.9
ที่มา สศช.
หมายเหตุ ป 2549 - 2551 มีการปรับปรุงขอมูลของผลิตภัณฑมวลรวมภายในประเทศและตนทุนโลจิสติกส ตามขอมูลรายไดประชาชาติ พ.ศ. 2553
หนวย รอยละ
มาตรการสนับสนุนใหเอกชนมีความต่ืนตัวและมีความสามารถ รวมทั้งสรางแรงจูงใจในการเรงปรับปรุงประสิทธิภาพการบริหารจัดการโลจิสติกสดวยตนเอง เ น่ืองจากเห็นไดอยางชัดเจนวา แนวทางการพัฒนากําลังคนหรือการยกระดับประสิทธิภาพของธุรกิจดวยโครงการที่ภาครัฐดําเนินการเพียงลําพังคงไมสามารถสรางธุรกิจไทยใหมีศักยภาพในการแขงขันไดทันกับสถานการณท่ีกําลังเกิดขึ้นได ดังน้ัน หนวยงานรัฐท่ีเกี่ยวของควรมุงเนนมาตรการสําคัญ คือ การพัฒนาตัวชี้วัดประสิทธิภาพดานโลจิสติกสในแตละกลุมอุตสาหกรรมของไทยเพ่ือใหผูประกอบการสามารถนํามาใชประเมินความสามารถของตนเองวามีประสิทธิภาพแตละดานเปนอยางไร เม่ือเทียบกับผูประกอบการ รายอื่นในกลุมอุตสาหกรรมเดียวกัน และเพ่ือนํามากําหนดแนวทางปรับปรุงประสิทธิภาพของตนเอง
การเรงพัฒนางานดานการอํานวยความสะดวกทางการคา และสนับสนุนใหมีการใชรูปแบบการขนสงที่ประหยัดพลังงานท้ังระบบรางและระบบนํ้า รวมถึงการใชเทคนิคและเทคโนโลยีที่ทันสมัยสําหรับบริหารกิจกรรมโลจิสติกสแตละดานอยางมีประสิทธิภาพ ยังคงเปนมาตรการท่ีตองผลักดันอยางตอเน่ืองเพราะเปนการแกปญหาเชิงโครงสรางและสามารถชวยเพ่ิมประสิทธิภาพไดอยางยั่งยืนท้ังในระยะสั้นและระยะยาว
นอกจากน้ี แนวโนมการแขงขันท่ีเขมขนขึ้นอยางตอเน่ืองในธุรกิจใหบริการโลจิสติกส อันเน่ืองมาจากการที่บริษัทขามชาติรายใหญๆ ในธุรกิจน้ีจากทั่วโลกใชประเทศไทยเปนฐานธุรกิจเพ่ือบุกตลาดในภูมิภาค กลายเปนปจจัยคุกคามความอยูรอดของผูประกอบการไทยอยางเห็น ไดชัด แตในขณะเดียวกันก็สะทอนใหเห็นโอกาสท่ีจะขยายพ้ืนท่ีตลาดใหกวางขวางและเพ่ิมโอกาสในการอยูรอดทางธุรกิจมากขึ้นหากมี การดําเนินกลยุทธอยางเหมาะสม ดังน้ัน แนวนโยบายในชวงตอไปท่ีควรใหความสําคัญเชนกัน คือ การสนับสนุนและเรงเตรียมความพรอมของผูประกอบการไทยทั้งภาคการผลิต การคา และบริการใหมีความพรอมที่จะออกไปสูตลาดในระดับภูมิภาค
จากผลการวิเคราะหขอมูลและสถานการณแวดลอมทางเศรษฐกิจรวมท้ังทิศทางการปรับตัวของภาคธุรกิจในประเทศ อาจกลาวไดวา แนวโนม การลดลงของตนทุนโลจิสติกสของประเทศไทยในป 2552 มีลักษณะเชนเดียวกับประเทศอื่น กลาวคือ มีปจจัยกระทบหลักมาจาก การหดตัวอยางรุนแรงของสถานการณเศรษฐกิจโลกและภาวะธุรกิจระหวางประเทศต้ังแตปลายป 2551 ซึ่งไดสงผลกระทบตอเน่ืองมายังภาวะธุรกิจในเอเชียรวมถึงประเทศไทยตลอดท้ังป 2552
อย าง ไรก็ตาม การทบทวนสถานการณและสํ ารวจขอ เ ท็จจ ริ ง ในชวงท่ีผานมาของผูประกอบการธุรกิจภายในประเทศ ธุรกิจสงออก รวมไปถึงธุรกิจผูใหบริการโลจิสติกส พบวา การลดลงของตนทุน โลจิสติกสไทยยังมีสาเหตุสวนหนึ่งมาจากการท่ีผูประกอบการไทยสามารถปรับตัวทางธุรกิจดวยการใชกลยุทธเพิ่มประสิทธิภาพ ในการบริหารจัดการกิจกรรมดานโลจิสติกสของตนเอง เพ่ือลดตนทุนการดําเนินธุรกิจและเพ่ิมประสิทธิภาพในการตอบสนองความตองการของลูกคาซึ่งความสามารถในการเลือกใชกลยุทธดานโลจิสติกสของผูประกอบการดังกลาว สวนหน่ึงคงกลาวไดวา เปนผลมาจากการดําเนินนโยบายอยางตอเน่ืองในชวงท่ีผานมาท่ีสรางใหผูประกอบการสวนใหญตระหนักถึงความสําคัญของการใชกิจกรรมโลจิสติกสเปนเคร่ืองมือ เชิงกลยุทธในการแขงขัน โดยการจัดสัมมนาและฝกอบรมอยางเขมขนแกกําลังคนดานโลจิสติกส ในตลาดแรงงานกวา 50,000 คนตลอด ชวงท่ีผานมาซึ่งไดชวยใหเกิดการปรับตัวเพ่ิมผลิตภาพของการบริหารจัดการโลจิสติกสของภาคธุรกิจไปแลวระดับหน่ึง สะทอนใหเห็นจากแนวโนมท่ีลดลงตอเน่ืองของตนทุนการบริหารจัดการสินคาคงคลัง
เม่ือเทียบกับกําลังคนท่ีควรไดรับการพัฒนาในภาพรวมจํานวนคนท่ีผานการอบรมดังกลาวยังถือไดวานอยมากประมาณ รอยละ 1 ของกําลังคนโลจิสติกสรวม จึงยังอาจไมสามารถชักนําใหเกิดผลกระทบในวงกวางระดับประเทศอยางเปนรูปธรรมเทาท่ีควร ดังน้ัน ขอเสนอแนะแนวทางการผลักดันการพัฒนาระบบโลจิสติกสของประเทศไทยในชวงตอไป ยังตองใหความสําคัญกับประเด็นการพัฒนา ดังตอไปน้ี การเรงพัฒนาขีดความสามารถของกําลังคนดานโลจิสติกสไปสู
ความเปนมืออาชีพ ท่ีสามารถพรอมรับมือกับภาวะการแขงขันระดับภูมิภาคภายหลั งจากที่ เศรษฐกิจโลกและภูมิภาคฟน ตัวแลว นอกจากน้ี รูปแบบการแขงขันท่ีระดับหวงโซอุปทานของประเทศยังคงเปนกระแสหลักของการยกระดับความสามารถในการแขงขันของธรุกจิท่ัวโลกซึ่งรวมถึงประเทศไทย ดังน้ัน จึงมีความจําเปนตองเร่ิมเตรียมกําลังคนรองรับอยางจริงจัง
บทสรุปและข้อ เสนอแนะ
รายงานโลจิสติกส์ของประ เทศไทย ประจําปี 2553
หนา 8
ประเทศไดดําเนินการจนไดแบบจําลองท่ีใชในการคํานวณตัวเลขตนทุน โลจิสติกสตอผลิตภัณฑมวลรวมของประเทศและเผยแพรในรายงาน โลจิสติกสเปนประจําทุกป โดยสามารถสรุปความเปนมาในการดําเนินงาน รวมถึงผลสรุปของการศึกษาเพ่ือจัดทําแบบจําลองตนทุนโลจิสติกสของประเทศไทย ไดดังน้ี
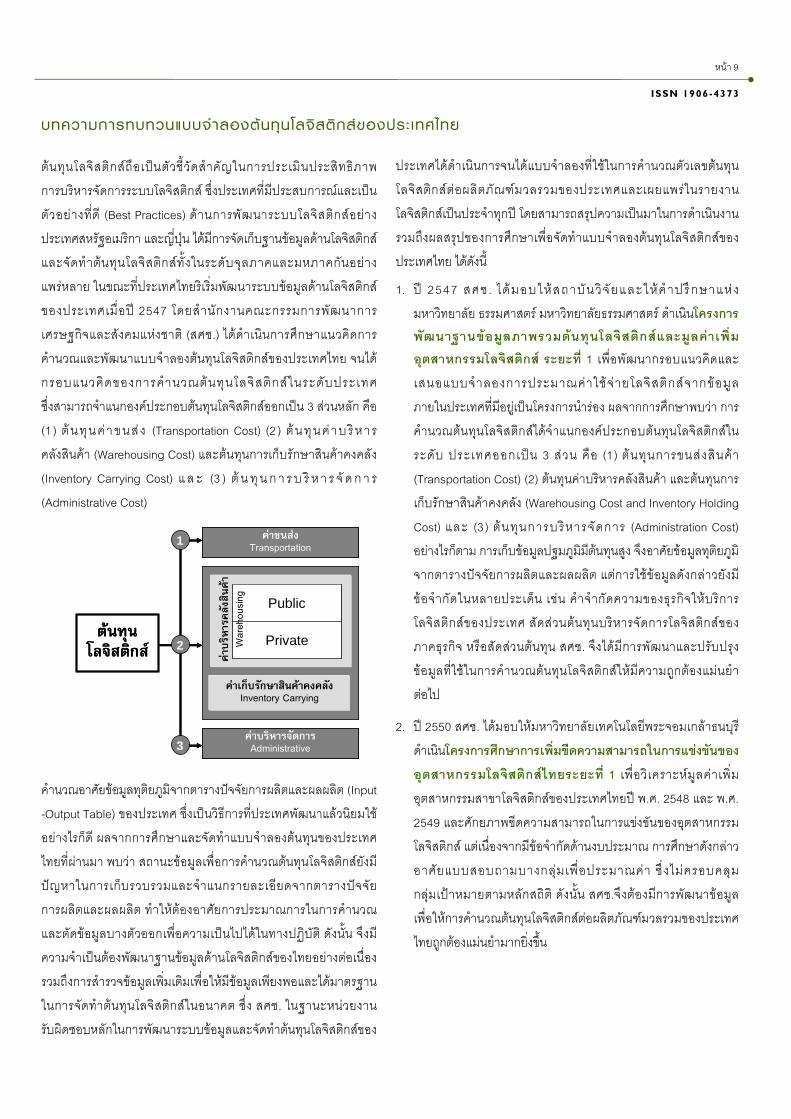
1. ป 2547 สศช . ไดมอบใหสถาบัน วิจั ยและให คํ าป รึกษาแห งมหาวิทยาลัย ธรรมศาสตร มหาวิทยาลัยธรรมศาสตร ดําเนินโครงการพัฒนาฐานขอมูลภาพรวมตนทุนโลจิสติกสและมูลคาเพิ่มอุตสาหกรรมโลจิสติกส ระยะที่ 1 เพ่ือพัฒนากรอบแนวคิดและเสนอแบบจําลองการประมาณคาใชจายโลจิสติกสจากขอมูลภายในประเทศที่มีอยูเปนโครงการนํารอง ผลจากการศึกษาพบวา การคํานวณตนทุนโลจิสติกสไดจําแนกองคประกอบตนทุนโลจิสติกสในระดับ ประเทศออกเปน 3 สวน คือ (1) ตนทุนการขนสงสินคา (Transportation Cost) (2) ตนทุนคาบริหารคลังสินคา และตนทุนการเก็บรักษาสินคาคงคลัง (Warehousing Cost and Inventory Holding Cost) และ (3 ) ตนทุนการบริหารจัดการ (Administration Cost) อยางไรก็ตาม การเก็บขอมูลปฐมภูมิมีตนทุนสูง จึงอาศัยขอมูลทุติยภูมิจากตารางปจจัยการผลิตและผลผลิต แตการใชขอมูลดังกลาวยังมีขอจํากัดในหลายประเด็น เชน คําจํากัดความของธุรกิจใหบริการ โลจิสติกสของประเทศ สัดสวนตนทุนบริหารจัดการโลจิสติกสของ ภาคธุรกิจ หรือสัดสวนตนทุน สศช. จึงไดมีการพัฒนาและปรับปรุงขอมูลท่ีใชในการคํานวณตนทุนโลจิสติกสใหมีความถูกตองแมนยําตอไป
2. ป 2550 สศช. ไดมอบใหมหาวิทยาลัยเทคโนโลยีพระจอมเกลาธนบุรี ดําเนินโครงการศึกษาการเพ่ิมขีดความสามารถในการแขงขันของอุตสาหกรรมโลจิสติกสไทยระยะที่ 1 เพ่ือวิเคราะหมูลคาเพ่ิมอุตสาหกรรมสาขาโลจิสติกสของประเทศไทยป พ.ศ. 2548 และ พ.ศ. 2549 และศักยภาพขีดความสามารถในการแขงขันของอุตสาหกรรม โลจิสติกส แตเน่ืองจากมีขอจํากัดดานงบประมาณ การศึกษาดังกลาวอาศัยแบบสอบถามบางกลุมเ พ่ือประมาณคา ซึ่งไมครอบคลุมกลุมเปาหมายตามหลักสถิติ ดังน้ัน สศช.จึงตองมีการพัฒนาขอมูลเพ่ือใหการคํานวณตนทุนโลจิสติกสตอผลิตภัณฑมวลรวมของประเทศไทยถูกตองแมนยํามากยิ่งขึ้น
ตนทุนโลจิสติกสถือเปนตัวชี้ วัดสําคัญในการประเมินประสิทธิภาพ การบริหารจัดการระบบโลจิสติกส ซึ่งประเทศท่ีมีประสบการณและเปนตัวอยางท่ีดี (Best Practices) ดานการพัฒนาระบบโลจิสติกสอยางประเทศสหรัฐอเมริกา และญี่ปุน ไดมีการจัดเก็บฐานขอมูลดานโลจิสติกสและจัดทําตนทุนโลจิสติกสท้ังในระดับจุลภาคและมหภาคกันอยางแพรหลาย ในขณะท่ีประเทศไทยริเร่ิมพัฒนาระบบขอมูลดานโลจิสติกสของประเทศเม่ือป 2547 โดยสํานักงานคณะกรรมการพัฒนาการเศรษฐกิจและสังคมแหงชาติ (สศช.) ไดดําเนินการศึกษาแนวคิดการคํานวณและพัฒนาแบบจําลองตนทุนโลจิสติกสของประเทศไทย จนไดกรอบแนวคิดของการคํานวณตนทุนโลจิสติกสในระดับประเทศ ซึ่งสามารถจําแนกองคประกอบตนทุนโลจิสติกสออกเปน 3 สวนหลัก คือ (1 ) ต น ทุนค าขนส ง (Transportation Cost) (2 ) ต น ทุนค าบ ริหารคลังสินคา (Warehousing Cost) และตนทุนการเก็บรักษาสินคาคงคลัง (Inventory Carrying Cost) แ ล ะ (3 ) ต น ทุ น ก า ร บ ริ ห า ร จั ด ก า ร (Administrative Cost)
คํานวณอาศัยขอมูลทุติยภูมิจากตารางปจจัยการผลิตและผลผลิต (Input-Output Table) ของประเทศ ซึ่งเปนวิธีการท่ีประเทศพัฒนาแลวนิยมใช อยางไรก็ดี ผลจากการศึกษาและจัดทําแบบจําลองตนทุนของประเทศไทยท่ีผานมา พบวา สถานะขอมูลเพ่ือการคํานวณตนทุนโลจิสติกสยังมีปญหาในการเก็บรวบรวมและจําแนกรายละเอียดจากตารางปจจัย การผลิตและผลผลิต ทําใหตองอาศัยการประมาณการในการคํานวณ และตัดขอมูลบางตัวออกเพ่ือความเปนไปไดในทางปฏิบัติ ดังน้ัน จึงมีความจําเปนตองพัฒนาฐานขอมูลดานโลจิสติกสของไทยอยางตอเน่ือง รวมถึงการสํารวจขอมูลเพ่ิมเติมเพ่ือใหมีขอมูลเพียงพอและไดมาตรฐานในการจัดทําตนทุนโลจิสติกสในอนาคต ซึ่ง สศช. ในฐานะหนวยงานรับผิดชอบหลักในการพัฒนาระบบขอมูลและจัดทําตนทุนโลจิสติกสของ
บทความการทบทวนแบบจําลองต้นทุน โลจิสติกส์ของประ เทศไทย
หนา 9
ISSN 1906-4373
ตนทุน
โลจิสตกิส
คาขนสง
Transportation
คาบริหารจัดการ
Administrative
คาเก็บรักษาสินคาคงคลงั Inventory Carrying
Public
Private
คาบรหิารคลังสินคา
War
ehou
sing
ตนทุน
โลจิสตกิส
คาขนสง
Transportation
คาบริหารจัดการ
Administrative
คาเก็บรักษาสินคาคงคลงั Inventory Carrying
Public
Private
คาบรหิารคลังสินคา
War
ehou
sing
คาเก็บรักษาสินคาคงคลงั Inventory Carrying
Public
Private
Public
Private
คาบรหิารคลังสินคา
War
ehou
sing
1
2
3
ผลการศึกษาพบวา ตนทุนการถือครองสินคาคงคลังของไทยในป 2551 คํานวณโดยวิธีการหาคาเฉล่ียแบบเรขาคณิต (Geometric Means) จําแนกตามกลุมอุตสาหกรรมและตามขนาดของบริษัท เปนวิธีท่ีมีความเหมาะสมมากที่สุด ไดประมาณ 155,777 ลานบาท หรือรอยละ 1.72 ของผลิตภัณฑมวลรวมภายในประเทศไทย โดยคิดเปนคาเสียโอกาสทางการเงิน β อยูท่ีรอยละ 5.21 ซึ่งมีความแตกตางจากสมมติฐานในแบบจํ าลอง ท่ี สศช . ใช เ ท ากั บ ร อยละ 1 9 อย า ง มี นัยสํ า คัญ อยางไรก็ตาม ยังไมสามารถดําเนินการปรับสมมติฐานดังกลาวได เน่ืองจากขอมูลการสํารวจแสดงใหเห็นวา ผูประกอบการสวนใหญของไทยโดยเฉพาะในกิจการขนาดกลางและขนาดยอม ไมมีการเก็บขอมูลอยางเปนระบบไมวาจะเปนคาภาษีสินคา คาเสื่อมราคา คาสินคาหมดสมัย/เสื่อมสภาพ หรือคาประกันภัยสินคา จึงมีขอเสนอแนะเพ่ิมเติมใหดําเนินการศึกษาขอมูลทุติยภูมิเกี่ยวกับรายละเอียดองคประกอบของ β
หรือคาใชจายอื่นๆท่ีเกี่ยวของกับการถือครองสินคาคงคลังท่ีเหมาะสม ของไทยตอไป เชน คาภาษีสินคาคงคลัง คาประกันภัย (Insurance) คาสินคาหมดสมัย /เสื่ อมสภาพ (Obsolescence) และคาสินคา ขาดจํานวนหดหาย (Shrinkage, Pilferage) เพ่ือประเมินหาคาใชจายอื่นๆท่ีเกี่ยวของกับการถือครองสินคาคงคลังท่ีเหมาะสมตอไป
3. ป 2551 สศช. ไดมอบหมายให บริษัท เอฟฟนิต้ี จํากัด ดําเนินโครงการศึกษาการเพ่ิมขีดความสามารถในการแขงขันอุตสาหกรรมสาขาโลจิสติกสไทย ระยะที่ 2 เพ่ือสํารวจขอมูลตนทุนบริหารจัดการ (Administrative Cost) ป พ.ศ.2550 โดยการคํานวณตนทุนบริหารจัดการของประเทศไทยไดใชรอยละ 10 ของตนทุนรวมระหวางตนทุนคาขนสงและตนทุนการบริการคลังสินคาและเก็บรักษาสินคาคงคลัง ซึ่งเปน Benchmark ของตางประเทศ ดังน้ัน จึงไดดําเนินโครงการฯ เพ่ือศึกษาวา ตนทุนบริหารจัดการ รอยละ 10 เหมาะสมกับการคํานวณตนทุนบริหารจัดการดาน โลจิสติกสของประเทศไทยหรือไม ซึ่งจากการศึกษาพบวา ตนทุน การบริหารจัดการดานโลจิสติกสของไทยท่ีไดจากการสํารวจขอมูลผูประกอบการ คิดเปนประมาณรอยละ 8 ของผลรวมตนทุนคาขนสงและตนทุนการเก็บรักษาสินคาคงคลัง โดยใชวิธีคาเฉลี่ยเรขาคณิต ตามขนาดบริษัทน้ัน ไมมีความแตกตางอยางมีนัยยะสําคัญ จึงเปนการยืนยันความเหมาะสมของสมมติฐานการคํานวณตนทุน การบริหารจัดการของแบบจําลองในปจจุบัน (รอยละ 10)
4. ป 2552 สศช . ไดมอบหมายใหบริษัท เอฟฟนิ ต้ี จํากัด ดําเนินโครงการศึกษาการเพ่ิมขีดความสามารถในการแขงขันอุตสาหกรรมสาขาโลจิสติกสไทย ระยะที่ 3 เพ่ือสํารวจขอมูลตนทุนการถือครองสินคา (Inventory Carrying Cost) และคาใชจายตาง ๆ ท่ีเกี่ยวของกับการถือครองสินคาของผูประกอบการไทยป พ.ศ. 2551 เพ่ือนําผลท่ีไดไปประมาณการตนทุนการเก็บรักษาสินคาคลัง (Inventory Holding Cost) ของประเทศไทย โดยการคํานวณตนทุนการถือครองสินคาของประเทศไทยในปจจุบันไดนําวิธีการคํานวณของ CASS มาปรับใชซึ่งแบงออกเปน 2 สวน คือ (1) ดอกเบี้ย (Interest) อางอิงจาก 1-Month AA Financial Commercial Paper Rate ของธนาคารแหงประเทศไทย และ (2) คาภาษี คาเสื่อมราคา และคาประกัน หรือคิดเปนคาเสียโอกาสทางการเงิน β ซึ่งคิดเปนคาคงท่ีเทากับรอยละ 19 จากสูตรของ Alford-Bangs Production Handbook Formula ในขณะที่มูลคาของ Values of all business inventory น้ั น สามา รถป ร ะ เ มิ น ได จ า ก มู ลค า ผลผลิ ต ข อ ง ภาคเศรษฐกิจท่ีแทจริง (Real Sector) และมูลคาผลผลิตของสาขาคาปลีกคาสง และผลสํามะโนอุตสาหกรรมของสํานักงานสถิติแหงชาติ ดังน้ัน จึงไดกําหนดวัตถุประสงคของโครงการฯ น้ี เพ่ือศึกษาถึงความเหมาะสมของคาเสียโอกาสทางการเงิน β ท่ีใชในการคํานวณตนทุนการถือครองสินคาคงคลังของประเทศสหรัฐอเมริกา (รอยละ 19) กับบริบทของประเทศไทย
รายงานโลจิสติกส์ของประ เทศไทย ประจําปี 2553
หนา 10
962 ถ .กรุง เกษม เ ขตป้อมปราบ กรุง เทพมหานคร 10110
โทรศัพท์ : 662-280-4085 ต่อ 6190 ประภาศรี พงษ์วัฒนา 6192 กิ่ งกมล เ ลิศธิตินันท์กุล 3623 สุกิตติ์ ศิวนันท์สกุล 3405 อณูวรรณ วงศ์พิ เชษฐ์ หรือ นพจิตร เห ลืองช่อสิริ แฟ็กซ์ : 662-280-1860
สํา นักงานคณะกรรมการพัฒนาการเศรษฐกิจและ สังคมแห่งชาติ (สศช . )
www.nesdb.go. th
Unit: Billion Baht�����: ����� �� Unit: Billion Baht
2544 2545 2546 2547 2548 2549r 2550r 2551r 2552p
2001 2002 2003 2004 2005 2006r 2007r 2008r 2009p
��������� �!�"!#���� 506.7 480.7 498.0 518.0 602.0 691.2 754.5 826.4 746.5 Transportation Cost
������ 5.5 6.2 6.0 7.1 8.1 8.6 3.4 1.2 1.2 Pipeline
������ 1.9 1.9 2.1 2.2 2.1 2.3 2.2 2.4 2.0 Rail
������ 266.4 240.7 241.2 240.5 288.4 336.3 382.5 430.4 391.0 Road
����!"� 92.0 97.3 107.2 120.7 133.4 151.6 159.6 173.4 165.0 Water
�����%�& 22.2 21.7 23.3 24.4 26.8 28.1 28.3 35.9 21.1 Air
�(%��)%*+��)�,+��% %��-�.�� 114.2 107.9 111.5 115.7 134.6 154.8 167.7 172.7 155.8 Transport-related services
�(%��-�.��.(�4�����56�78*�9 4.6 4.9 6.7 7.4 8.6 9.5 10.9 10.5 10.4 Postal services
������(�)*(+,)-(.�!#�����"�/-" 405.0 417.4 455.5 501.0 573.5 668.1 702.5 708.5 633.3 Inventory Holding Costs
:���;�%���,�4���.(�4�� 402.6 415.1 452.4 497.1 569.9 662.9 696.8 702.0 627.3 Inventory Carrying Cost
:���;� �(���4�.(�4�� 2.4 2.3 3.2 3.9 3.6 5.1 5.7 6.5 6.0 Warehousing Cost
������(�),)#7�)8-9(�) 91.2 89.8 95.4 101.9 117.5 135.9 145.7 153.5 138.0 Logistics Administration Cost
������>/8#!�#(!?)@A 1,002.9 988.0 1,048.9 1,121.0 1,293.0 1,495.2 1,602.7 1,688.4 1,517.8 Total Logistics Cost
AC/���D/#�E-FG?A@/)@AH�I)J*�K F )���I)J8L�IM 5,133.5 5,450.6 5,917.4 6,489.5 7,092.9 7,844.9 8,525.2 9,080.5 9,041.6 Gross Domestic Product (GDP)\
2544 2545 2546 2547 2548 2549r 2550r 2551r 2552p Proportion of Logistics Costs to GDP
��������� �!�"!#���� ��V GDP 9.9 8.8 8.4 8.0 8.5 8.8 8.9 9.1 8.3 Transportation Cost to GDP
������(�)*(+,)-(.�!#�����"�/-" ��V GDP 7.9 7.7 7.7 7.7 8.1 8.5 8.2 7.8 7.0 Inventory Holding Cost to GDP
������(�),)#7�)8-9(�) ��V GDP 1.8 1.6 1.6 1.6 1.7 1.7 1.7 1.7 1.5 Logistics Administration Cost to GDP
������>/8#!�#(!? ��V GDP 19.6 18.1 17.7 17.3 18.3 19.0 18.8 18.6 16.8 Logistics Costs to GDP
�*+L� .&M. Source: NESDB�L��)�:; Remarks6T 2549 - 2551 L*%��6� 6�;�-��LU-��V(:W8X9L���LW��Y�6�Z)�&[Z:���;�\](.:(%.9 :�L-��LU���5^�6�ZM�M�:( �.&. 2552 There has been some information adjustment for the year 2006 to 2008 in accord to the National Income Data for 2009
!-9!�@�������>/8#!�#(!? ��V GDP V"I)J*�KW�X
�����: ����Z :�� GDP Unit: Percent to GDP
��)�"Y�, 1: ������>/8#!�#(!? Y/J!-9!�@�������>/8#!�#(!? ��V GDP V"I)J*�KW�X )J7@��"IM Z.K. 2543 [ 2552p
Logistics Cost������>/8#!�#(!?
>9X �FJ�L�"��Z-\�� �VAC/>/8#!�#(!? !K]. F @-��^_ 15 -̀�@��A 2553
Appendix 1: Thailand's Logistics Cost and Logistics Cost to GDP from 2000-2009p
By Logistics Database Development Working Group as of December 15, 2010
�����: ���� � GDP Unit: Percent to GDP
2544 2545 2546 2547 2548 2549r 2550r 2551r 2552p
2001 2002 2003 2004 2005 2006r 2007r 2008r 2009p
�������� !�"�#"$��� 9.9 8.8 8.4 8.0 8.5 8.8 8.9 9.1 8.3 Total Transportation Cost
����� 0.1 0.1 0.1 0.1 0.1 0.1 0.0 0.0 0.0 Pipeline
������ 0.0 0.0 0.0 0.0 0.0 0.0 0.0 0.0 0.0 Rail
������ 5.2 4.4 4.1 3.7 4.1 4.3 4.5 4.7 4.3 Road
����&'� 1.8 1.8 1.8 1.9 1.9 1.9 1.9 1.9 1.8 Water
����-�. 0.4 0.4 0.4 0.4 0.4 0.4 0.3 0.4 0.2 Air
0�1-��2-34��2�54�-60-��7�8�� 2.2 2.0 1.9 1.8 1.9 2.0 2.0 1.9 1.7 Transport-related services
0�1-��7�8��81�>����?@�AB3�C 0.1 0.1 0.1 0.1 0.1 0.1 0.1 0.1 0.1 Postal services Post services
�34D� 8.E. Source: NESDB
By Logistics Database Development Working Group as of December 15, 2010
� 7 #8�9 2: ������: 7!�"�#"$��� ��; GDP 8<:;#�=>7?:;9 7?@A� #>B C.D. 2543 E 2552p
Appendix 2: Transportation Cost to GDP by Components from 2000-2009p
JK< �L?�M # �CNO� !�;PQRJRS$"�$:"= "DT. L AN��UV 15 WN�A �P 2553
������JRS$"�$:"= Logistics Cost
2544 2545 2546 2547 2548 2549r 2550r 2551r 2552p
2001 2002 2003 2004 2005 2006r 2007r 2008r 2009p
������������������� 13.5 (5.1) 3.6 4.0 16.2 14.8 9.2 9.5 (9.7) Transportation Cost
������ 14.6 11.6 (1.7) 17.2 14.3 6.5 (60.4) (65.4) (1.5) Pipeline
������ 14.1 3.3 7.3 6.2 (3.6) 6.0 (3.5) 10.2 (14.5) Rail
������ 9.9 (9.6) 0.2 (0.3) 19.9 16.6 13.7 12.5 (9.2) Road
���� !� 24.3 5.8 10.2 12.6 10.5 13.7 5.3 8.7 (4.8) Water
�����&�' 15.9 (1.9) 7.1 4.9 9.8 4.9 0.4 26.9 (41.1) Air
)�*&��+&,-./+�0-��&1)&��2�3�� 13.4 (5.5) 3.3 3.8 16.3 15.0 8.3 3.0 (9.8) Transport-related services
)�*&��2�3��3*�9:����;<�=>,.? 19.1 7.3 35.6 10.7 15.9 10.1 14.9 (3.9) (1.1) Post services
�����%�&'%()&*%+����������,*� 11.2 3.1 9.1 10.0 14.5 16.5 5.2 0.8 (10.6) Inventory Holding Costs
�&��5�) 3: 5�78��9%�&�:�: *7�;� �����8,<�� �%�= 5,>9?,���@,� A*BC=97,&79D�E&>'�F &>G7���EH I.F. 2543 J 2552p
Appendix 3: Trends of Logistics Costs Growth and GDP between 2000-2009p
8W: �B>�X����I*Y����;9?,8,<�� �%�= �FZ. B 7*��[\ 15 ]*�7��9 2553
�����8,<�� �%�= Logistics Cost
By Logistics Database Development Working Group as of December 15, 2010
@��/.: �:�.BCD��<E Unit: Percent
�����%�&'%()&*%+����������,*� 11.2 3.1 9.1 10.0 14.5 16.5 5.2 0.8 (10.6) Inventory Holding Costs
D:��F�&���0�9���3*�9:� 11.7 3.1 9.0 9.9 14.7 16.3 5.1 0.7 (10.6) Inventory Carrying Cost
D:��F�)�*@��9B1�3*�9:� (33.7) (2.1) 35.8 24.2 (9.0) 44.2 11.3 13.2 (7.8) Warehousing Cost
�����%�&)&�G�&<*W%�& 12.5 (1.5) 6.2 6.9 15.3 15.6 7.2 5.3 (10.1) Logistics Administration Cost
�����8,<�� �%�= 12.5 (1.5) 6.2 6.9 15.3 15.6 7.2 5.3 (10.1) Logistics Cost
9?,���@,� A*BC=97,&79D�E&>'�F B &���E&><X�EH 10.7 6.2 8.6 9.7 9.3 10.6 8.7 6.5 (0.4) Gross Domestic Product (GDP)
�,-M� 3'N. Source: NESDB
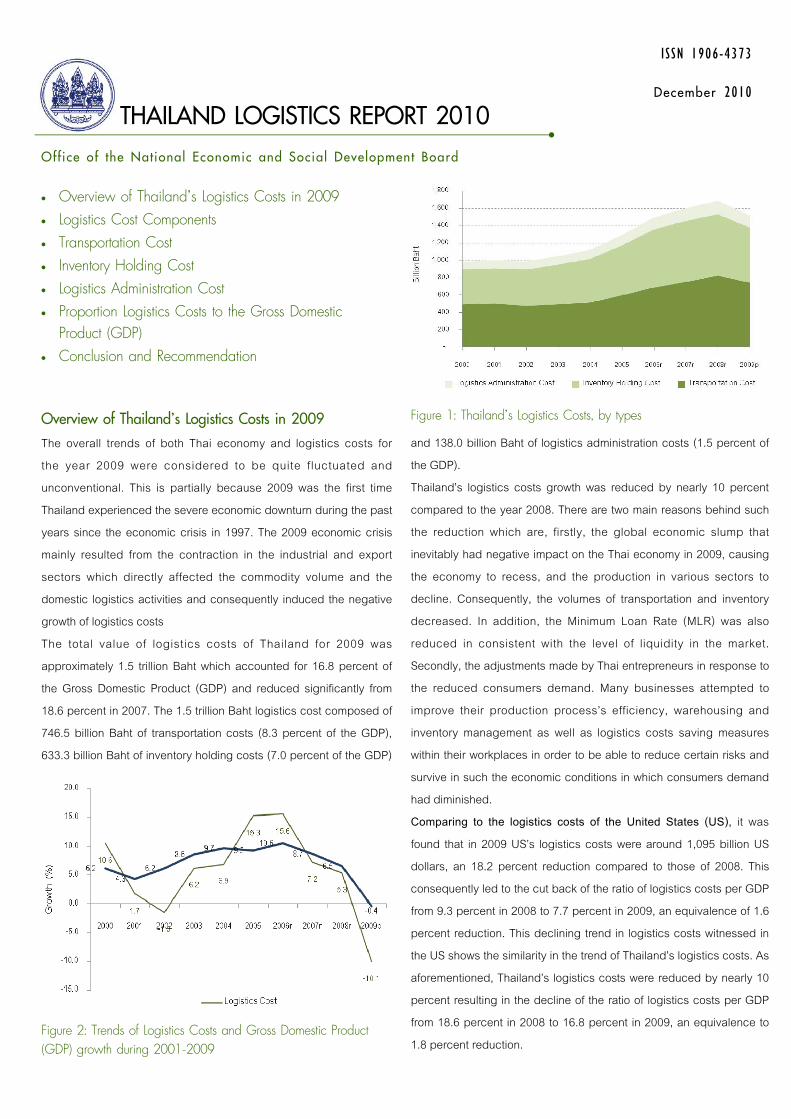
Figure 2: Trends of logistics costs and gross domestic product (GDP) growth during 2001-2009
Overview of Thailand’s Logistics Costs in 2009 Logistics Cost Components Transportation Cost Inventory Holding Cost Logistics Administration Cost Proportion Logistics Costs to the Gross Domestic
Product (GDP) Conclusion and Recommendation
and 138.0 billion Baht of logistics administration costs (1.5 percent of the GDP). Thailand’s logistics costs growth was reduced by nearly 10 percent compared to the year 2008. There are two main reasons behind such the reduction which are, firstly, the global economic slump that inevitably had negative impact on the Thai economy in 2009, causing the economy to recess, and the production in various sectors to decline. Consequently, the volumes of transportation and inventory decreased. In addition, the Minimum Loan Rate (MLR) was also reduced in consistent with the level of liquidity in the market. Secondly, the adjustments made by Thai entrepreneurs in response to the reduced consumers demand. Many businesses attempted to improve their production process’s efficiency, warehousing and inventory management as well as logistics costs saving measures within their workplaces in order to be able to reduce certain risks and survive in such the economic conditions in which consumers demand had diminished. Comparing to the logistics costs of the United States (US), it was found that in 2009 US’s logistics costs were around 1,095 billion US dollars, an 18.2 percent reduction compared to those of 2008. This consequently led to the cut back of the ratio of logistics costs per GDP from 9.3 percent in 2008 to 7.7 percent in 2009, an equivalence of 1.6 percent reduction. This declining trend in logistics costs witnessed in the US shows the similarity in the trend of Thailand’s logistics costs. As aforementioned, Thailand’s logistics costs were reduced by nearly 10 percent resulting in the decline of the ratio of logistics costs per GDP from 18.6 percent in 2008 to 16.8 percent in 2009, an equivalence to 1.8 percent reduction.
The overall trends of both Thai economy and logistics costs for the year 2009 were considered to be quite fluctuated and unconventional. This is partially because 2009 was the first time Thailand experienced the severe economic downturn during the past years since the economic crisis in 1997. The 2009 economic crisis mainly resulted from the contraction in the industrial and export sectors which directly affected the commodity volume and the domestic logistics activities and consequently induced the negative growth of logistics costs The total value of logistics costs of Thailand for 2009 was approximately 1.5 trillion Baht which accounted for 16.8 percent of the Gross Domestic Product (GDP) and reduced significantly from 18.6 percent in 2007. The 1.5 trillion Baht logistics cost composed of 746.5 billion Baht of transportation costs (8.3 percent of the GDP), 633.3 billion Baht of inventory holding costs (7.0 percent of the GDP)
Off ice of the Nat iona l Economic and Soc ia l Deve lopment Board
THAILAND LOGISTICS REPORT 2010 December 2010
ISSN 1906-4373
Figure 1: Thailand’s Logistics Costs, by types Overview of Thailand’s Logistics Costs in 2009
Figure 2: Trends of Logistics Costs and Gross Domestic Product (GDP) growth during 2001-2009
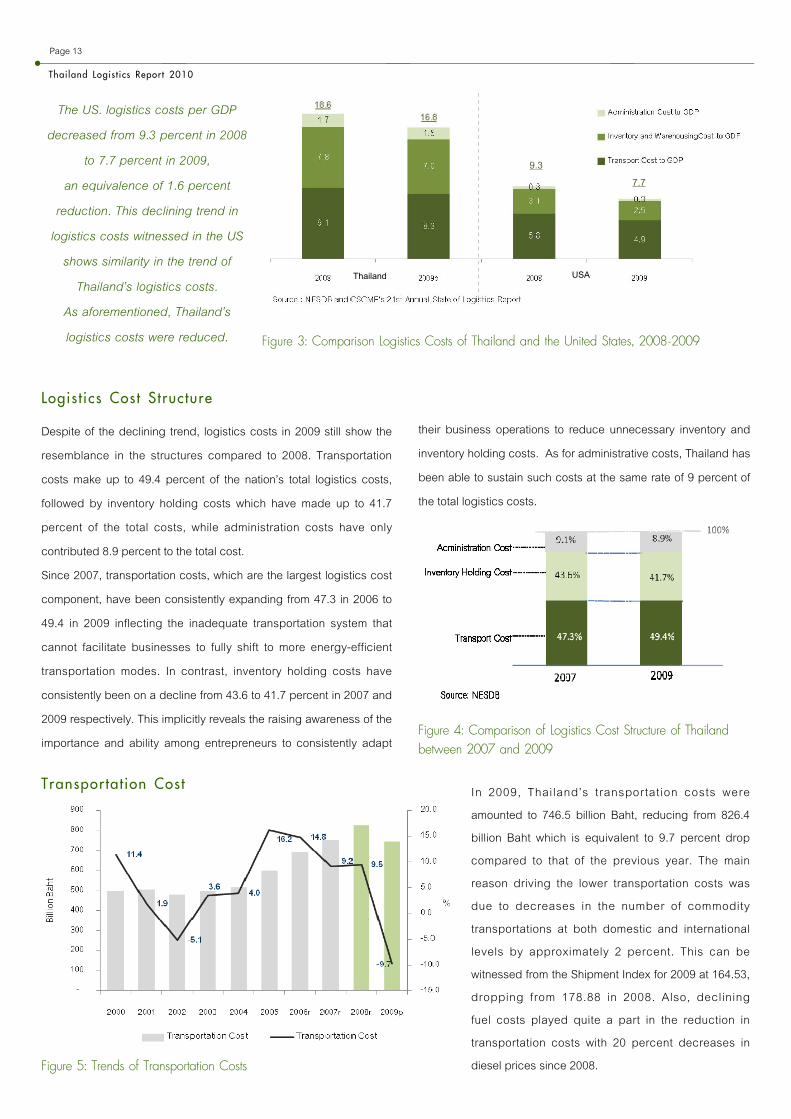
Figure 5: Trends of Transportation Costs
their business operations to reduce unnecessary inventory and inventory holding costs. As for administrative costs, Thailand has been able to sustain such costs at the same rate of 9 percent of the total logistics costs.
Despite of the declining trend, logistics costs in 2009 still show the resemblance in the structures compared to 2008. Transportation costs make up to 49.4 percent of the nation’s total logistics costs, followed by inventory holding costs which have made up to 41.7 percent of the total costs, while administration costs have only contributed 8.9 percent to the total cost. Since 2007, transportation costs, which are the largest logistics cost component, have been consistently expanding from 47.3 in 2006 to 49.4 in 2009 inflecting the inadequate transportation system that cannot facilitate businesses to fully shift to more energy-efficient transportation modes. In contrast, inventory holding costs have consistently been on a decline from 43.6 to 41.7 percent in 2007 and 2009 respectively. This implicitly reveals the raising awareness of the importance and ability among entrepreneurs to consistently adapt
Transpor ta t ion Cos t
Page 13
Thai land Logis t i cs Repor t 2010
Logis t i cs Cos t S t ruc ture
Figure 3: Comparison Logistics Costs of Thailand and the United States, 2008-2009
Figure 4: Comparison of Logistics Cost Structure of Thailand between 2007 and 2009
In 2009, Thailand’s transportation costs were amounted to 746.5 billion Baht, reducing from 826.4 billion Baht which is equivalent to 9.7 percent drop compared to that of the previous year. The main reason driving the lower transportation costs was due to decreases in the number of commodity transportations at both domestic and international levels by approximately 2 percent. This can be witnessed from the Shipment Index for 2009 at 164.53, dropping from 178.88 in 2008. Also, declining fuel costs played quite a part in the reduction in transportation costs with 20 percent decreases in diesel prices since 2008.
The US. logistics costs per GDP decreased from 9.3 percent in 2008
to 7.7 percent in 2009, an equivalence of 1.6 percent
reduction. This declining trend in logistics costs witnessed in the US
shows similarity in the trend of Thailand’s logistics costs.
As aforementioned, Thailand’s logistics costs were reduced.
Thailand USA
9.3 7.7
Unit: Million Tons
Domestic Freight
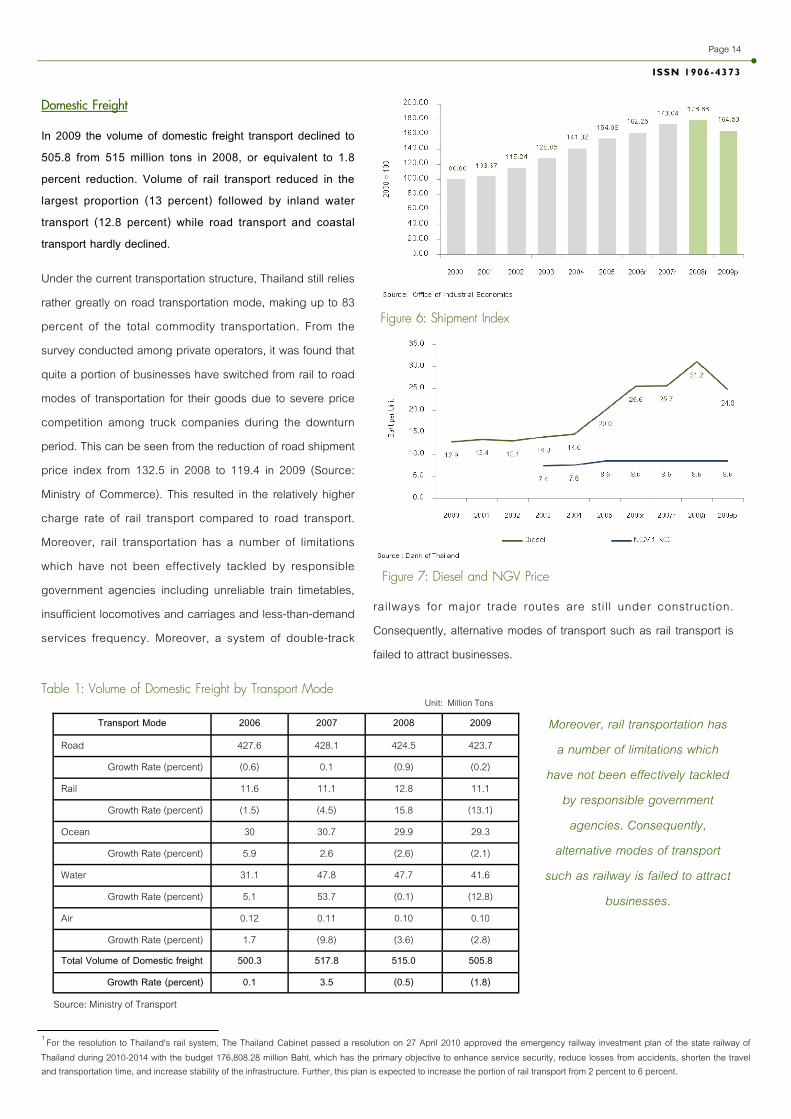
In 2009 the volume of domestic freight transport declined to 505.8 from 515 million tons in 2008, or equivalent to 1.8 percent reduction. Volume of rail transport reduced in the largest proportion (13 percent) followed by inland water transport (12.8 percent) while road transport and coastal transport hardly declined.
Under the current transportation structure, Thailand still relies rather greatly on road transportation mode, making up to 83 percent of the total commodity transportation. From the survey conducted among private operators, it was found that quite a portion of businesses have switched from rail to road modes of transportation for their goods due to severe price competition among truck companies during the downturn period. This can be seen from the reduction of road shipment price index from 132.5 in 2008 to 119.4 in 2009 (Source: Ministry of Commerce). This resulted in the relatively higher charge rate of rail transport compared to road transport. Moreover, rail transportation has a number of limitations which have not been effectively tackled by responsible government agencies including unreliable train timetables, insufficient locomotives and carriages and less-than-demand services frequency. Moreover, a system of double-track
railways for major trade routes are stil l under construction. Consequently, alternative modes of transport such as rail transport is failed to attract businesses.
Page 14
ISSN 1906-4373
Table 1: Volume of Domestic Freight by Transport Mode
Figure 6: Shipment Index
Figure 7: Diesel and NGV Price
1 For the resolution to Thailand's rail system, The Thailand Cabinet passed a resolution on 27 April 2010 approved the emergency railway investment plan of the state railway of Thailand during 2010-2014 with the budget 176,808.28 million Baht, which has the primary objective to enhance service security, reduce losses from accidents, shorten the travel and transportation time, and increase stability of the infrastructure. Further, this plan is expected to increase the portion of rail transport from 2 percent to 6 percent.
Moreover, rail transportation has a number of limitations which
have not been effectively tackled by responsible government agencies. Consequently,
alternative modes of transport such as railway is failed to attract
businesses.
Transport Mode 2006 2007 2009
Road 427.6 428.1 423.7
Growth Rate (percent) (0.6) 0.1 (0.2)
Rail 11.6 11.1 11.1
Growth Rate (percent) (1.5) (4.5) (13.1)
Ocean 30 30.7 29.3
Growth Rate (percent) 5.9 2.6 (2.1)
Water 31.1 47.8 41.6
Growth Rate (percent) 5.1 53.7 (12.8)
Total Volume of Domestic freight 500.3 517.8 505.8
Growth Rate (percent) 0.1 3.5 (1.8)
2008
424.5
(0.9)
12.8
15.8
29.9
(2.6)
47.7
(0.1)
515.0
(0.5)
Air 0.12 0.11 0.10 0.10
Growth Rate (percent) 1.7 (9.8) (3.6) (2.8)
Source: Ministry of Transport
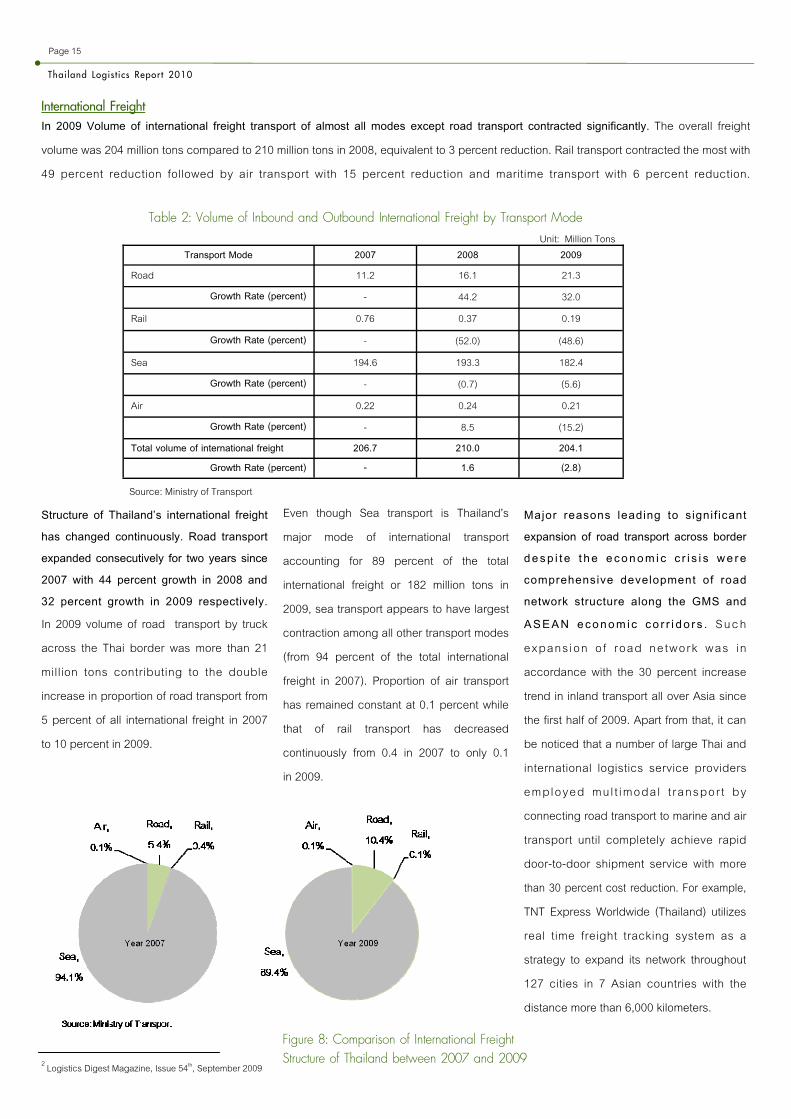
Structure of Thailand’s international freight has changed continuously. Road transport expanded consecutively for two years since 2007 with 44 percent growth in 2008 and 32 percent growth in 2009 respectively. In 2009 volume of road transport by truck across the Thai border was more than 21 million tons contributing to the double increase in proportion of road transport from 5 percent of all international freight in 2007 to 10 percent in 2009.
International Freight In 2009 Volume of international freight transport of almost all modes except road transport contracted significantly. The overall freight volume was 204 million tons compared to 210 million tons in 2008, equivalent to 3 percent reduction. Rail transport contracted the most with 49 percent reduction followed by air transport with 15 percent reduction and maritime transport with 6 percent reduction.
Thai land Logis t i cs Repor t 2010
Page 15
Even though Sea transport is Thailand’s major mode of international transport accounting for 89 percent of the total international freight or 182 million tons in 2009, sea transport appears to have largest contraction among all other transport modes (from 94 percent of the total international freight in 2007). Proportion of air transport has remained constant at 0.1 percent while that of rail transport has decreased continuously from 0.4 in 2007 to only 0.1 in 2009.
Major reasons leading to signif icant expansion of road transport across border desp i t e t he econom i c c r i s i s we re comprehensive development of road network structure along the GMS and ASEAN econom ic co r r i do r s . S u c h expans ion o f road ne twork was in accordance with the 30 percent increase trend in inland transport all over Asia since the first half of 2009. Apart from that, it can be noticed that a number of large Thai and international logistics service providers employed mul t imoda l t ranspor t by connecting road transport to marine and air transport until completely achieve rapid door-to-door shipment service with more than 30 percent cost reduction. For example, TNT Express Worldwide (Thailand) utilizes real time freight tracking system as a strategy to expand its network throughout 127 cities in 7 Asian countries with the distance more than 6,000 kilometers.
2 Logistics Digest Magazine, Issue 54th, September 2009
Table 2: Volume of Inbound and Outbound International Freight by Transport Mode
Source: Ministry of Transport
Transport Mode 2007 2008 2009 Road 11.2 16.1 21.3
Growth Rate (percent) - 44.2 32.0
Rail 0.76 0.37 0.19
Growth Rate (percent) - (52.0) (48.6)
Sea 194.6 193.3 182.4 Growth Rate (percent) - (0.7) (5.6)
Air 0.22 0.24 0.21 Growth Rate (percent) - 8.5 (15.2)
Total volume of international freight 206.7 210.0 204.1 Growth Rate (percent) - 1.6 (2.8)
Unit: Million Tons
Figure 8: Comparison of International Freight Structure of Thailand between 2007 and 2009
Source: Ministry of Transport
ISSN 1906-4373
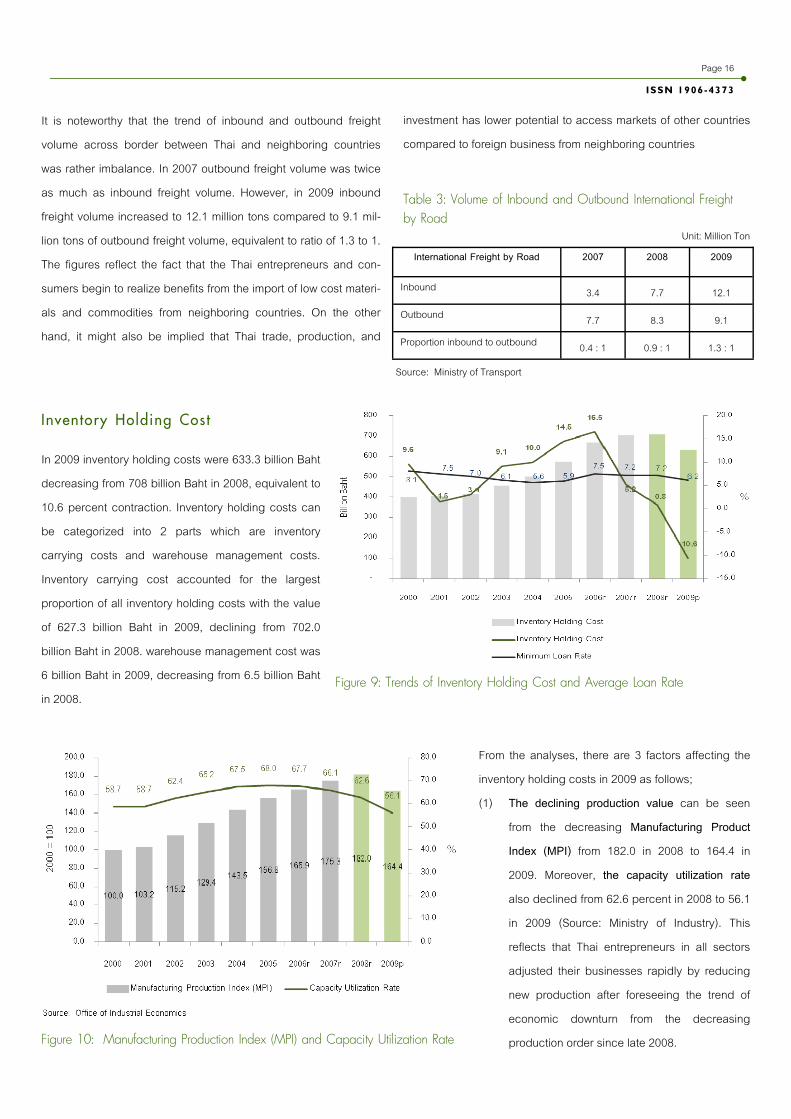
From the analyses, there are 3 factors affecting the inventory holding costs in 2009 as follows; (1) The declining production value can be seen
from the decreasing Manufacturing Product
Index (MPI) from 182.0 in 2008 to 164.4 in 2009. Moreover, the capacity utilization rate also declined from 62.6 percent in 2008 to 56.1 in 2009 (Source: Ministry of Industry). This reflects that Thai entrepreneurs in all sectors adjusted their businesses rapidly by reducing new production after foreseeing the trend of economic downturn from the decreasing production order since late 2008.
In 2009 inventory holding costs were 633.3 billion Baht decreasing from 708 billion Baht in 2008, equivalent to 10.6 percent contraction. Inventory holding costs can be categorized into 2 parts which are inventory carrying costs and warehouse management costs. Inventory carrying cost accounted for the largest proportion of all inventory holding costs with the value of 627.3 billion Baht in 2009, declining from 702.0 billion Baht in 2008. warehouse management cost was 6 billion Baht in 2009, decreasing from 6.5 billion Baht in 2008.
investment has lower potential to access markets of other countries compared to foreign business from neighboring countries
It is noteworthy that the trend of inbound and outbound freight volume across border between Thai and neighboring countries was rather imbalance. In 2007 outbound freight volume was twice as much as inbound freight volume. However, in 2009 inbound freight volume increased to 12.1 million tons compared to 9.1 mil-lion tons of outbound freight volume, equivalent to ratio of 1.3 to 1. The figures reflect the fact that the Thai entrepreneurs and con-sumers begin to realize benefits from the import of low cost materi-als and commodities from neighboring countries. On the other hand, it might also be implied that Thai trade, production, and
Inven tory Hold ing Cos t
Page 16
Figure 10: Manufacturing Production Index (MPI) and Capacity Utilization Rate
Figure 9: Trends of Inventory Holding Cost and Average Loan Rate
Table 3: Volume of Inbound and Outbound International Freight by Road
International Freight by Road 2007 2008 2009
Inbound 3.4 7.7 12.1
Outbound 7.7 8.3 9.1
Proportion inbound to outbound 0.4 : 1 0.9 : 1 1.3 : 1
Unit: Million Ton
Thai land Logis t i cs Repor t 2010
Logis t i cs Adminis t ra t ion Cos t
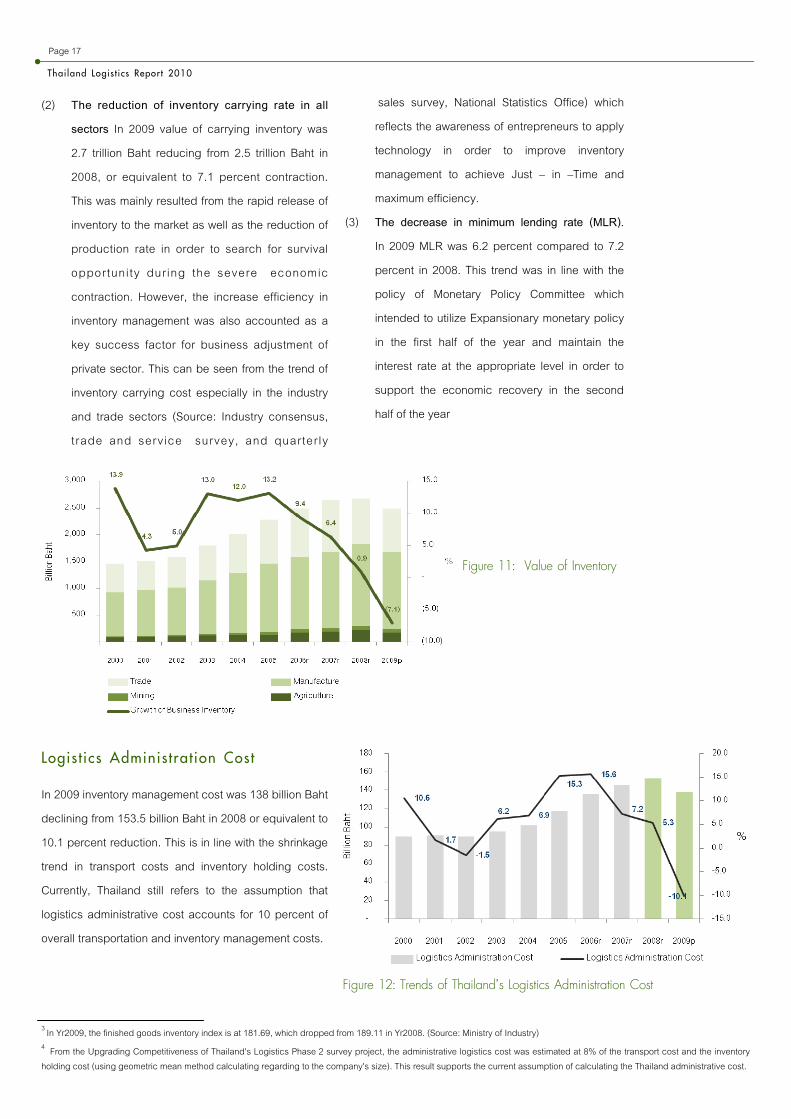
In 2009 inventory management cost was 138 billion Baht declining from 153.5 billion Baht in 2008 or equivalent to 10.1 percent reduction. This is in line with the shrinkage trend in transport costs and inventory holding costs. Currently, Thailand still refers to the assumption that logistics administrative cost accounts for 10 percent of overall transportation and inventory management costs.
Figure 11: Value of Inventory
Page 17
sales survey, National Statistics Office) which reflects the awareness of entrepreneurs to apply technology in order to improve inventory management to achieve Just – in –Time and maximum efficiency.
(3) The decrease in minimum lending rate (MLR).
In 2009 MLR was 6.2 percent compared to 7.2 percent in 2008. This trend was in line with the policy of Monetary Policy Committee which intended to utilize Expansionary monetary policy in the first half of the year and maintain the interest rate at the appropriate level in order to support the economic recovery in the second half of the year
Figure 12: Trends of Thailand’s Logistics Administration Cost
3 In Yr2009, the finished goods inventory index is at 181.69, which dropped from 189.11 in Yr2008. (Source: Ministry of Industry) 4 From the Upgrading Competitiveness of Thailand's Logistics Phase 2 survey project, the administrative logistics cost was estimated at 8% of the transport cost and the inventory holding cost (using geometric mean method calculating regarding to the company's size). This result supports the current assumption of calculating the Thailand administrative cost.
(2) The reduction of inventory carrying rate in all
sectors In 2009 value of carrying inventory was 2.7 trillion Baht reducing from 2.5 trillion Baht in 2008, or equivalent to 7.1 percent contraction. This was mainly resulted from the rapid release of inventory to the market as well as the reduction of production rate in order to search for survival opportunity during the severe economic contraction. However, the increase efficiency in inventory management was also accounted as a key success factor for business adjustment of private sector. This can be seen from the trend of inventory carrying cost especially in the industry and trade sectors (Source: Industry consensus, t rade and service survey, and quarter ly
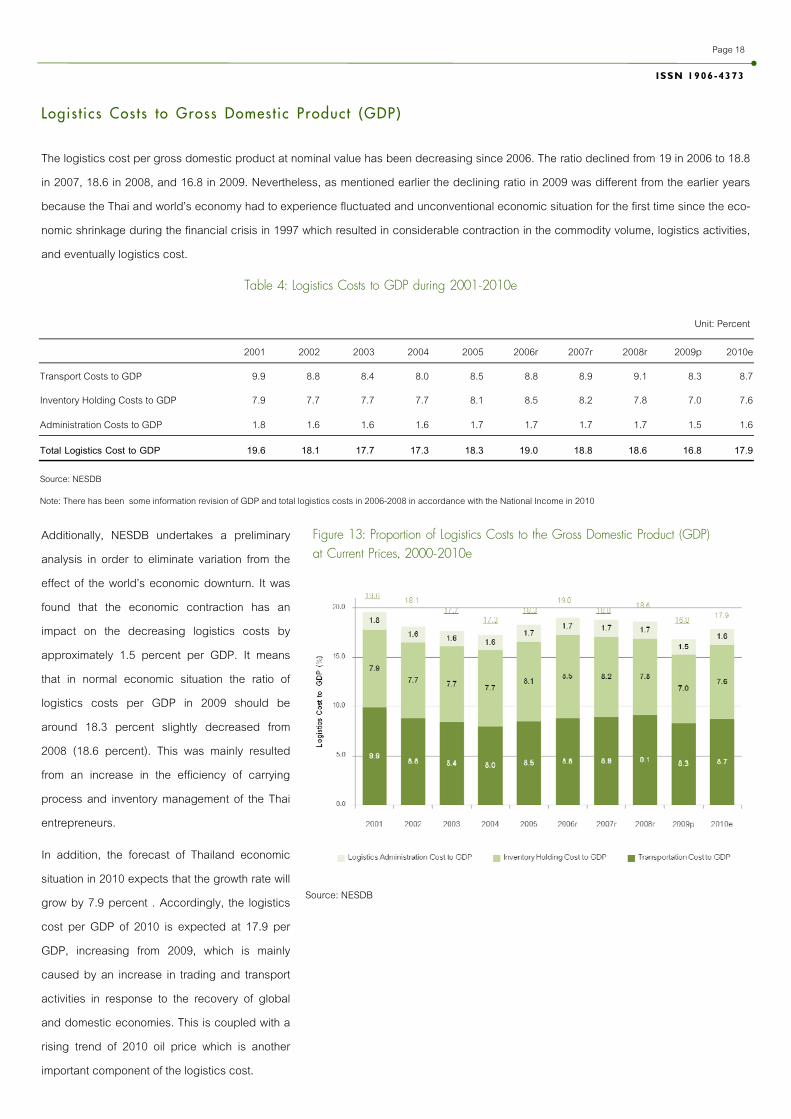
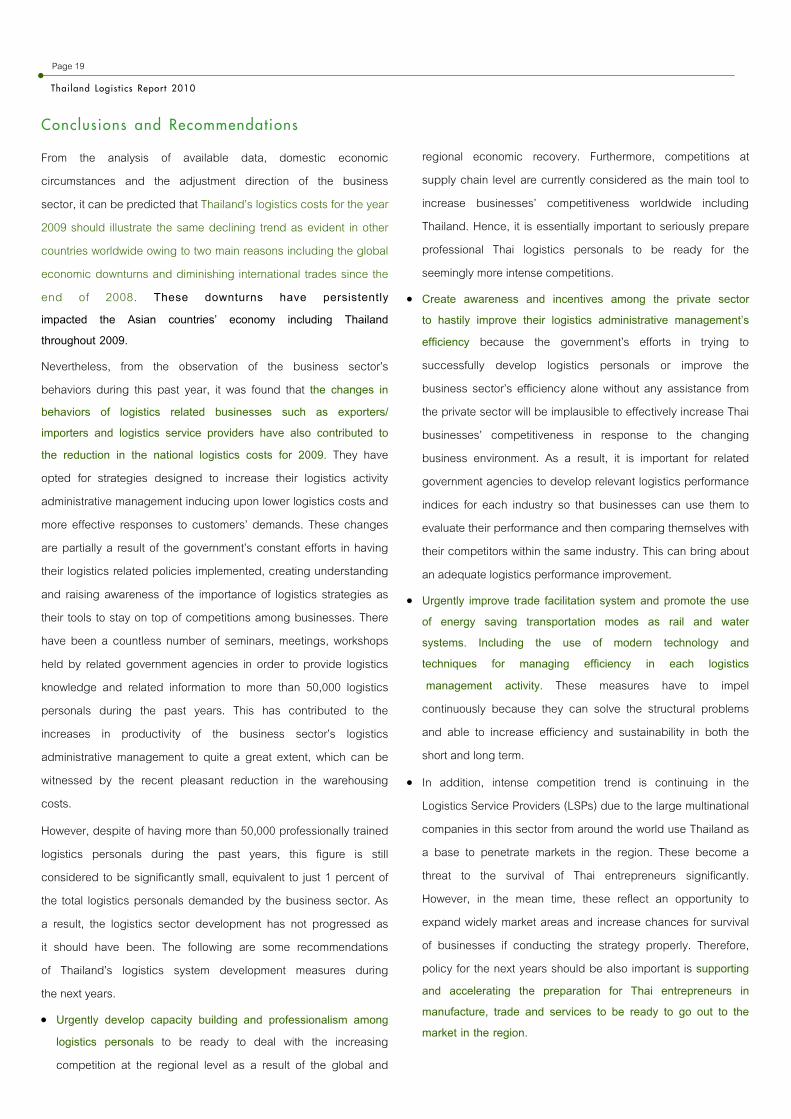
Additionally, NESDB undertakes a preliminary analysis in order to eliminate variation from the effect of the world’s economic downturn. It was found that the economic contraction has an impact on the decreasing logistics costs by approximately 1.5 percent per GDP. It means that in normal economic situation the ratio of logistics costs per GDP in 2009 should be around 18.3 percent slightly decreased from 2008 (18.6 percent). This was mainly resulted from an increase in the efficiency of carrying process and inventory management of the Thai entrepreneurs.
In addition, the forecast of Thailand economic situation in 2010 expects that the growth rate will grow by 7.9 percent . Accordingly, the logistics cost per GDP of 2010 is expected at 17.9 per GDP, increasing from 2009, which is mainly caused by an increase in trading and transport activities in response to the recovery of global and domestic economies. This is coupled with a rising trend of 2010 oil price which is another important component of the logistics cost.
The logistics cost per gross domestic product at nominal value has been decreasing since 2006. The ratio declined from 19 in 2006 to 18.8 in 2007, 18.6 in 2008, and 16.8 in 2009. Nevertheless, as mentioned earlier the declining ratio in 2009 was different from the earlier years because the Thai and world’s economy had to experience fluctuated and unconventional economic situation for the first time since the eco-nomic shrinkage during the financial crisis in 1997 which resulted in considerable contraction in the commodity volume, logistics activities, and eventually logistics cost.
Table 4: Logistics Costs to GDP during 2001-2010e
Figure 13: Proportion of Logistics Costs to the Gross Domestic Product (GDP) at Current Prices, 2000-2010e
Logis t i cs Cos ts to Gross Domes t ic Produc t (GDP)
Page 18
ISSN 1906-4373
2001 2002 2003 2004 2005 2006r 2007r 2008r 2009p 2010e
Transport Costs to GDP 9.9 8.8 8.4 8.0 8.5 8.8 8.9 9.1 8.3 8.7
Inventory Holding Costs to GDP 7.9 7.7 7.7 7.7 8.1 8.5 8.2 7.8 7.0 7.6
Administration Costs to GDP 1.8 1.6 1.6 1.6 1.7 1.7 1.7 1.7 1.5 1.6
Total Logistics Cost to GDP 19.6 18.1 17.7 17.3 18.3 19.0 18.8 18.6 16.8 17.9
Source: NESDB
Note: There has been some information revision of GDP and total logistics costs in 2006-2008 in accordance with the National Income in 2010
Unit: Percent
Source: NESDB
regional economic recovery. Furthermore, competitions at supply chain level are currently considered as the main tool to increase businesses’ competitiveness worldwide including Thailand. Hence, it is essentially important to seriously prepare professional Thai logistics personals to be ready for the seemingly more intense competitions.
Create awareness and incentives among the private sector to hastily improve their logistics administrative management’s efficiency because the government’s efforts in trying to successfully develop logistics personals or improve the business sector’s efficiency alone without any assistance from the private sector will be implausible to effectively increase Thai businesses’ competitiveness in response to the changing business environment. As a result, it is important for related government agencies to develop relevant logistics performance indices for each industry so that businesses can use them to evaluate their performance and then comparing themselves with their competitors within the same industry. This can bring about an adequate logistics performance improvement.
Urgently improve trade facilitation system and promote the use of energy saving transportation modes as rail and water systems. Including the use of modern technology and techniques for managing efficiency in each logistics management activity. These measures have to impel continuously because they can solve the structural problems and able to increase efficiency and sustainability in both the short and long term.
In addition, intense competition trend is continuing in the Logistics Service Providers (LSPs) due to the large multinational companies in this sector from around the world use Thailand as a base to penetrate markets in the region. These become a threat to the survival of Thai entrepreneurs significantly. However, in the mean time, these reflect an opportunity to expand widely market areas and increase chances for survival of businesses if conducting the strategy properly. Therefore, policy for the next years should be also important is supporting and accelerating the preparation for Thai entrepreneurs in manufacture, trade and services to be ready to go out to the market in the region.
From the analysis of available data, domestic economic circumstances and the adjustment direction of the business sector, it can be predicted that Thailand’s logistics costs for the year 2009 should illustrate the same declining trend as evident in other countries worldwide owing to two main reasons including the global economic downturns and diminishing international trades since the end of 2008. These downturns have persistently impacted the Asian countries’ economy including Thailand throughout 2009.
Nevertheless, from the observation of the business sector’s behaviors during this past year, it was found that the changes in behaviors of logistics related businesses such as exporters/importers and logistics service providers have also contributed to the reduction in the national logistics costs for 2009. They have opted for strategies designed to increase their logistics activity administrative management inducing upon lower logistics costs and more effective responses to customers’ demands. These changes are partially a result of the government’s constant efforts in having their logistics related policies implemented, creating understanding and raising awareness of the importance of logistics strategies as their tools to stay on top of competitions among businesses. There have been a countless number of seminars, meetings, workshops held by related government agencies in order to provide logistics knowledge and related information to more than 50,000 logistics personals during the past years. This has contributed to the increases in productivity of the business sector’s logistics administrative management to quite a great extent, which can be witnessed by the recent pleasant reduction in the warehousing costs.
However, despite of having more than 50,000 professionally trained logistics personals during the past years, this figure is still considered to be significantly small, equivalent to just 1 percent of the total logistics personals demanded by the business sector. As a result, the logistics sector development has not progressed as it should have been. The following are some recommendations of Thailand’s logistics system development measures during the next years.
Urgently develop capacity building and professionalism among logistics personals to be ready to deal with the increasing competition at the regional level as a result of the global and
Conc lus ions and Recommendat ions
Thai land Logis t i cs Repor t 2010
Page 19
www.nesdb.go. th
962 Krung Kasem Rd. Pomprab Bangkok 10110
Off ice of the Nat iona l Economic and Soc ia l Deve lopment Board (NESDB)
Te l : 662-280-4085 ex t . 6190 Prapasr i Pongwat tana 6192 Kingkamon Loed th i t inunkun 3623 Suki t S ivanunsaku l 3405 Anuwan Vongpiche t or Nopphachi t Luangchos i r i Fax : 662-280-1860
Offi
ce o
f th
e N
atio
nal
Econ
omic
and
Soc
ial
Dev
elop
men
t Bo
ard
(NES
DB)
สํานัก
งานค
ณะกรร
มการ
พัฒ
นากา
รเศร
ษฐกิจ
และสังค
มแห่ง
ชาติ
(สศช
.)
Related Documents