October 2014 Strictly Private and Confidential TGI 3Q RESULTS

TGIi & Cálidda conference call Q3 14
Jul 25, 2015
Welcome message from author
This document is posted to help you gain knowledge. Please leave a comment to let me know what you think about it! Share it to your friends and learn new things together.
Transcript

October 2014
Strictly Private and Confidential
TGI 3Q RESULTS

2
Table of contents
1. TGI overview and history
2. Key updates
3. Financial and operating highlights
4. Questions and Answers
Appendix
1. Economic industry and regulatory environment
2. Shareholders and management team
3. EEB Overview

1. TGI overview and history

4
Overview
Stable and growing Colombian economy with sound investment environment
Constructive and stable regulatory framework
Largest natural gas pipeline system in Colombia
Stable and predictable cash flow generation, strongly indexed to the US Dollar
Strong and consistent financial performance
Experienced management team with solid track record in the sector
Expertise, financial strength and support of shareholders
Natural monopoly in a regulated environment
Strategically located pipeline network

Company history
TGI history Pipeline network Highlights
Owns ~61% of the national pipeline network (3,957 km) and transports 52% of the gas consumed in the country
− Serves ~70% of Colombia’s population, reaching the most populated areas (Bogota, Cali, Medellin, the coffee region and Piedemonte Llanero, among others)
− Has access to the two main production regions, La Guajira and Cusiana/Cupiagua
25% interest in Contugas (Peru)
− 30-year concession for natural gas transportation and distribution
TGI was created as a result of the privatization of Ecogás and has experienced remarkable growth since then, under
the leadership of its controlling shareholders, EEB and CVCI
Creation of Ecogas
1997
2005
Start of Ecogas Privatization Process
2006
Ecogas assets awarded to EEB
Creation of TGI
Inaugural bond issuance
Transfer of first
BOMT pipeline
(GBS)
Pipelines
exchange with
Promigas
CVCI
capitalization
Transfer of
second BOMT
pipeline
(Centragas)
Cusiana
expansion phase
I: start of
operations
Refinancing of
subordinated debt
with EEB
2008
TGI takes over the O&M of owned pipelines
Refinancing of
bonds issued in
2007
Cusiana
expansion
phase II: start of
operations
TGI takes over
the O&M of
compressor
stations
Awarded
investment
grade rating by
Moody’s and
Fitch
2010
Awarded
investment grade
rating by S&P
Headquarters
relocation from
Bucaramanga to
Bogotá
Redesign of
organizational
structure
2012
2013
2007
2009
2011
2014 EEB acquired
31.92% stake in
TGI from TRG
(formerly CVCI)
Cartagena Refinery
Barrancabermeja Refinery Bucaramanga
Bogota
Neiva
Cali
Medellin
3.15 tcf
1.97 tcf
Eastern Producers: Ecopetrol Equion
Upper Magdalena Valley
Lower and Middle Magdalena Valley
Northern Producers: Chevron Ecopetrol 1.89 tcf
References
TGI Pipelines
Natural Gas Reserves
City
Field Refinery
Third Party Pipelines
Source: Mining and Energy Planning Unit. National Hydrocarbons Agency.
5
Sabana Compressor
starts operations
Contugas Concession
starts operations
TGI´s first dividend
Payment

2. Key Updates
6

7
Key updates
Since 2H 2011, TGI designed a strategy to improve its credit ratings in order to (i) reduce financial
expenses, (ii) provide better access to debt capital markets and (iii) broaden its potential investor
base
On August 28th, Standard & Poor’s affirmed the TGI corporate debt and issuer rating in ‘BBB-‘,
perspective stable
On October 28th, Fitch Ratings upgraded TGI’s corporate debt and issuer rating from ‘BBB-’ to
‘BBB’, with stable perspective
TGI’s current ratings are as follows:
Baa3 Stable Outlook
BBB Stable Outlook
BBB- Stable Outlook
Fitch upgraded TGI’s credit rating to BBB on Oct 28, 2014

Hedge Restructuring
Key updates
• During the first quarter of 2014, TGI executed synthetic unwinds to cap losses
related to 3 of 4 cross-currency swaps booked in 2009
• On September 2014, TGI executed the forth synthetic unwind hedging the whole
cross-currency swaps booked in 2009

TGI’s acquisition
9
EEB closed the TGI 31,92% share acquisition on the first half of 2014
To bridge the acquisition EEB used cash on hand and short term financings
USD $ 645 MM were disbursed on September 2014 trough credit facilities to IELAH
On September 2014 IELAH repaid to TGI the USD 129 MM short term loan that bridged the acquisition
TGI is currently working on the merger with IELAH, this merger is expected to take place the 2Q 2015
Key updates
In ordinary session held on October 29th 2014, the General Shareholders Meeting approved the
distribution of reserves and the net profits of the first eight months of 2014, amounting ~ USD 250
mm
Dividends Declared
On July 7th TGI started operations of La Sabana Compression Station
Civil work continues end up the project which to the date has a completion of 91%.
La Sabana Compression Station

3. Financial and operating highlights
10

11
Solid operational performance
(1)The trend line refers to the ratio: Firm contracted capacity/available capacity. The Available capacity differs from the Total Capacity as TGI requires a percentage of it for its own use. Source: Company information.
Network length
(km)
Capacity
(MMscfd)
Firm Contracted Capacity(1)
(MMscfd)
Transported Volume Gas Losses Load factor
(MMscfd) (%) (%)
3,702
3,529
3,774 3,774
3,957 3,957 3,957
2008 2009 2010 2011 2012 2013 3Q-14
478 478 548
618
730 730 730
2008 2009 2010 2011 2012 2013 3Q-14
427 437 485
560 604 628 652
90% 92% 90%
92%
85% 88%
92%
2008 2009 2010 2011 2012 2013 3Q-14
371 396
422 420 422 454
500
2008 2009 2010 2011 2012 2013 3Q-14
0.1%
0.2%
0.6% 0.5% 0.5%
0.4%
0.0%
2008 2009 2010 2011 2012 2013 3Q-14
66% 69% 71%
58% 59% 61% 63%
2008 2009 2010 2011 2012 2013 3Q-14

12
Strong contract structure and stable and predictable cash flow generation
TGI’s revenues are highly predictable, with approximately 98% coming from regulated tariffs that are reviewed at least every 5 years, ensuring cash flow stability and attractive rates of return
Main sectors served by the Company (72(1)% of revenues) present stable consumption patterns (no seasonality)
The Company enjoys excellent contract quality
− 100% of TGI’s contracts are firm contracts with an average remaining life of 8 years
− 82.8% of regulated revenues are fixed tariffs, not dependent on transported volume
− 63%(2) of revenues denominated in US Dollars
Revenues breakdown
(% of revenues)
Source: Company information. (1) Includes Distributors, Ecopetrol´s refinery and Natural gas for Vehicles. (2) TGI calculations (3) Ecopetrol accounts for most of this revenue.
TGI’s revenues are highly predictable as a result of regulated tariffs and stable consumption
Source: TGI as of June 30- 2014
By Client By Sector
Ecopetrol 15%
Gas Natural 19%
Gases de Occidente
16% EPM 12%
Isagen 7%
Others 31%
Distributor 55%
Refinery 13%
Thermal 20%
Commercial 3%
Vehicles 4%
Others* 6%

13
Strong and consistent financial performance
Revenues EBITDA and EBITDA margin
Funds from operations (1)
(US$ in millions – average exchange rate for each period)
Source: Company information
Historical Capex - YTD
(US$ in millions – average exchange rate for each period)
(US$ in millions – average exchange rate for each period) (US$ in millions – average exchange rate for each period)
(1)FFO calculated as net income plus depreciation, amortization and provisions, adjusted for effect from exchange rate and hedges.
On 2012 FFO includes the LM transaction premium~ USD 69 million (one time event)
238 252
294
338
390
465 480
2008 2009 2010 2011 2012 2013 LTM-143Q
194 196 222
257
289
359 378
82% 78%
75% 76% 74% 77% 79%
2008 2009 2010 2011 2012 2013 LTM-143Q
84 96 104 114
129
268 254
2008 2009 2010 2011 2012 2013 LTM-143Q
13.9
69.1
174.1
387.0
185.1
31.9 27.8
2008 2009 2010 2011 2012 2013 3Q-14

14
Strong and consistent financial performance
Total debt / EBITDA
Financial debt breakdown (3)
Subordination Agreement
The lender is EEB (major shareholder)
No repayment of principal allowed before payment of senior debt
Interest can only be paid if there is no default or event of default and if the payment does not trigger any such scenario
Subordinated debt acceleration is not allowed until senior debt is not repaid
Source: Company information. Total debt includes senior debt, subordinated debt and mark-to-market. Note: Ratios calculated in local currency. (1) Senior Net debt excluding EEB´s short term intercompany Loans. Including the ICL the ratio lowers to 1.2x (2) Interest coverage ratio calculated as EBITDA / Net interest (3) Senior debt stands for the US$750 million Senior Unsecured Notes due 2022. Subordinated debt stands for intercompany loan with EEB.
Senior net debt (1) / EBITDA Interest coverage (2)
2.0 2.0 2.0 2.5
4.0
5.9 6.4
2008 2009 2010 2011 2012 2013 3Q-14
6.5
5.6 5.4 4.9
4.2 3.5 3.4
2008 2009 2010 2011 2012 2013 3Q-14
3.7 3.3 3.4
2.7 2.4
1.5 1,6
2008 2009 2010 2011 2012 2013 3Q-14

4. Questions and answers

16
Investor Relations
For more information about TGI contact our Investor Relations team:
Antonio José Angarita Vega
CFO
+57 (1) 3138400 - ext 2110
Sergio Andrés Hernández Acosta
Finance Manager
+57 (1) 3138400 - ext. 2450
Fabián Sánchez Aldana
IR Advisor - EEB
+57 (1) 3268000 - ext. 1827
http://www.tgi.com.co

Appendix 1 – Economic industry and regulatory environment

Source: Banco de la República, DNP, MINHACIENDA., Bloomberg
5-year CDS Foreign currency reserves
Real GDP growth and inflation Foreign direct investment
(US$ in billions) (% growth)
(%) (US$ in billions)
Stable and growing Colombian economy with sound investment environment
Despite the recent global economic slowdown, Colombia has experienced positive economic growth and an increase in industrial activity, supported by a steady flow of investment
5% 5%
7% 7%
4%
2%
4%
7%
4% 4% 4% 6% 5%
4%
6%
8%
2%
3% 4%
2% 2%
3%
0.0%
2.0%
4.0%
6.0%
8.0%
10.0%
2004 2005 2006 2007 2008 2009 2010 2011 2012 2013 2014(e)-
Real GDP growth
Inflation
0
100
200
300
400
500
600
700
01-0
4
06-0
4
11-0
4
04-0
5
09-0
5
02-0
6
07-0
6
12-0
6
05-0
7
10-0
7
03-0
8
08-0
8
01-0
9
06-0
9
11-0
9
04-1
0
09-1
0
02-1
1
07-1
1
12-1
1
05-1
2
10-1
2
03-1
3
08-1
3
01-1
4
06-1
4
9 10 11 11 14 15 15
21 24 25
28 32
37
44 47
-5.0%
5.0%
15.0%
25.0%
35.0%
45.0%
0
10
20
30
40
50
2000 2001 2002 2003 2004 2005 2006 2007 2008 2009 2010 2011 2012 2013 2014
International reservesDebt as % of GDP
2 3 2 2 3
10
7
9 11
7 6
15 15 16
5
-
3.0
6.0
9.0
12.0
15.0
18.0
2000 2001 2002 2003 2004 2005 2006 2007 2008 2009 2010 2011 2012 2013 20142Q
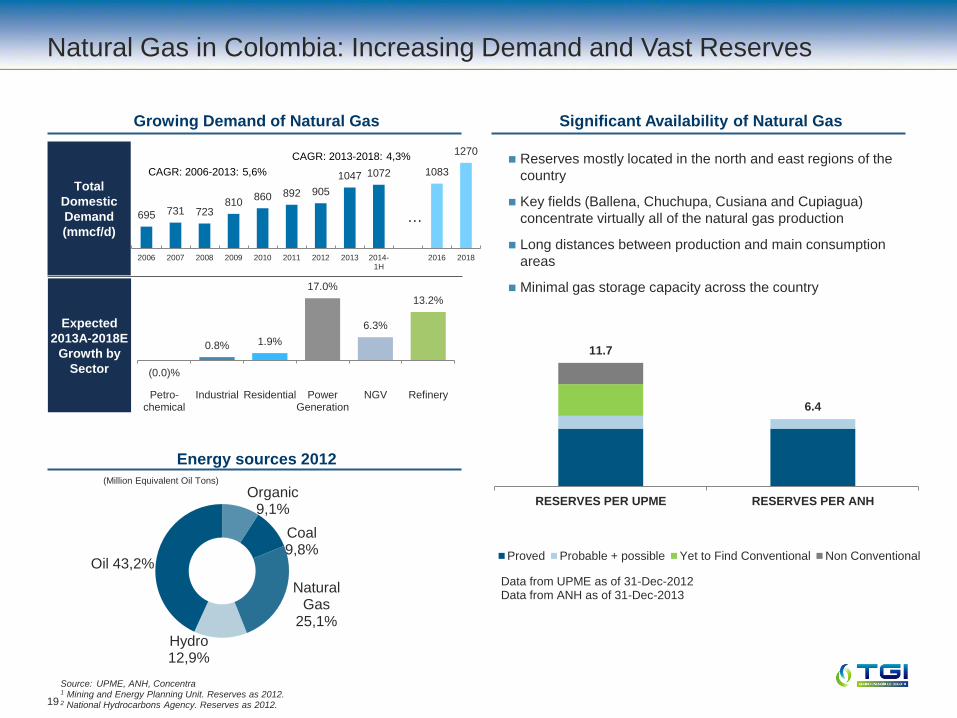
695 731 723 810
860 892 905
1047 1072 1083
1270
2006 2007 2008 2009 2010 2011 2012 2013 2014-1H
2016 2018
CAGR: 2006-2013: 5,6%
CAGR: 2013-2018: 4,3%
…
Source: UPME, ANH, Concentra 1 Mining and Energy Planning Unit. Reserves as 2012. 2 National Hydrocarbons Agency. Reserves as 2012.
Energy sources 2012
Growing Demand of Natural Gas Significant Availability of Natural Gas
Reserves mostly located in the north and east regions of the
country
Key fields (Ballena, Chuchupa, Cusiana and Cupiagua)
concentrate virtually all of the natural gas production
Long distances between production and main consumption
areas
Minimal gas storage capacity across the country
Total
Domestic
Demand
(mmcf/d)
Expected
2013A-2018E
Growth by
Sector
Natural Gas in Colombia: Increasing Demand and Vast Reserves
(0.0)%
0.8% 1.9%
17.0%
6.3%
13.2%
Petro-chemical
Industrial Residential PowerGeneration
NGV Refinery
19
Data from UPME as of 31-Dec-2012 Data from ANH as of 31-Dec-2013
11.7
6.4
RESERVES PER UPME RESERVES PER ANH
Proved Probable + possible Yet to Find Conventional Non Conventional
Organic 9,1%
Coal 9,8%
Natural Gas
25,1%
Hydro 12,9%
Oil 43,2%
(Million Equivalent Oil Tons)

Regulatory framework established to attract private sector investment
Law 142 (1994) establishes system of open entry to the natural gas transportation sector − No term limitation for the provision
of the service − Assets used in the provision of the
service are not owned by the state but by the company providing such service
CREG required by law to seek input from market participants
CREG is an independent regulatory body that controls natural gas regulation − Sets tariffs, promotes competition
and monitors quality of service
Tariff calculation based on the principle of financial feasibility and economic efficiency
Tariffs are set in order to allow the service provider to: − Recover operational costs and
investments − Obtain a return on investment
comparable to what an efficient company would obtain in a sector of similar risk
Cost recovery, attractive regulated return on investment and protection against inflation
Transporters are given full recovery of operating and maintenance expenses − Adjusted by Colombian Price
Index (CPI) Dollar indexation of investment
remuneration tariff Different rates of return applied
when determining fixed and variable charges
Constructive and stable regulatory framework
Source: Company information.
The Colombian gas transportation regulatory framework was established to attract private strategic investors and to provide adequate cost recovery and regulated returns

CREG RESOLUTIONS 083 AND 112 OF 2014
Establishes regulations for natural gas market.
Definition of contractual arrangements in the primary market.
Definition of marketing mechanisms.
Defines secondary market with its respective regulations.
The following reliability aspects in the Decree have not yet been defined by the Regulatory Commission:
The CREG will establish the reliability criteria which shall secure the demand coverage and must set the rules for the evaluation and remuneration of these investment projects.
CREG RESOLUTION 047 OF 2014
Recent Regulatory Decisions
The regulatory framework for natural gas transportation in Colombia is in a stage of important definitions. The main recent regulatory decisions are:
CREG RESOLUTION 089 OF 2013
21
DECREE 2100 OF 2011
Establishes the principles that will be considered in the next natural gas transportation tariff update process.
The resolution mentions the principles that will be kept from the actual tariff methodology.
Remuneration based on contracts. Price cap methodology.
It also mentions aspects that must be evaluated.
System expansion based on government signals.
Tariff calculation based on historical demand and not projected.
The resolution CREG 083 proposes the methodology to determine the WACC for regulated activities including gas transportation.
The resolution CREG 112, proposes the value for the Beta Adjustment (Delta Beta - Δβ) , which recognizes the difference between the reference market in the USA and the Colombian Regulatory framework.
Both resolutions were available for agents comments’, and the final resolutions are expected to be issued at the end of the year.

Appendix 2 – Shareholders and management team

23
David Riaño
CEO
19 Electrical Engineer (Universidad de La Salle); Masters in Industrial Engineering
(Universidad de Los Andes); Masters in Economics (Pontificia Universidad Javeriana)
Over 19 years of experience in technical and economic regulation of gas and electricity
sector (CREG, Colombian Electricity Generators Association, Superintendency of Energy
and Gas, Superintendency of Public Services)
Former Regulatory Affairs Manager at TGI SA ESP
CEO of TGI since October 2014
Antonio J.
Angarita
CFO 20
Officer Key highlights Years of relevant experience
Experienced management team with solid track record in the sector TGI is led by an experienced and seasoned management team
Carlos A. Torres
Vice-President of
Legal Affairs
20 Lawyer (Universidad de Los Andes); Business Law (Universidad de Los Andes)
Over 20 years of experience in the Oil and Gas Industry
Former General Counsel at Petrobras Colombia
Degree in Civil Engineering and MBA from Universidad de los Andes (Bogotá)
Over 20 years of experience in financial management in different industries, former IRO in
EEB, CFO in Bayport Colombia, Regional CFO in Amnet Central America (Tigo Home),
Financial Controller and Financial Planning Manager in Colombia Movil (Tigo), Head of
Financial Planning in ETB, Head of Management Control in Codensa and Advisor of the CFO
in EEB.
TGI’s CFO since July 2014
Jorge Gonzalez
COO
20 Civil Engineer (Universidad de Los Andes); Specialization Studies in Finance (Universidad
de Los Andes)
Over 17 years of experience in the natural gas industry
Former NGV Manager at Gas Natural S.A.E.S.P.
Carlos Toledo
Vice-President for
Administration and
services
8 Degree in Law from the Universidad UNICIENCIA.
Degree in Electrical Engineering and specialization in telecommunications from Universidad
Industrial de Santander Master’s degree in Applied Political Studies from FIIAPP.
Master in Social Cohesion from Universidad de Mendez Pelayo, España.
Over 7 years serving the public and private sectors
Vice-President for Administration and Public Relations since May 2012.

Appendix 3 – EEB Overview

EEB Strategy and Overview Strategy
Transportation and distribution
of energy
Key facts
More than 100 years’ experience in the sector; founded in 1896.
Regional leader in the energy sector; major player in the entire electricity
and natural gas value chains (except E&P); operations in Colombia,
Peru, and Guatemala.
Largest stockholder is the District of Bogota - 76.2%.
Stock listed on the Colombia stock exchange; EEB adheres to global
standards of corporate governance.
The EEB Group is one of the largest issuers of equity and debt in
Colombia
USD Million 3Q 2014
Operating revenue 844.7
Operating profit 302.0
EBITDA LTM 974.5
Net Income 463.2
Consolidated - Covenants 3Q 2014
Leverage Ratio 2.33
Interest Coverage Ratio 10.22
Focus on
natural
monopolies
Ample access
to capital
markets
Ambitious
projects in
execution
Growth in
controlled
subsidiaries
Sound
regulatory
framework
Experienced
management
and partners

Disclaimer
This presentation contains statements that are forward-looking within the meaning of Section 27A of the Securities Act of 1933, as amended (the “Securities Act”), and Section 21E of the Securities Exchange Act of 1934, as amended. Such forward-looking statements are only predictions and are not guarantees of future performance. All statements other than statements of historical fact are, or may be deemed to be, forward-looking statements. Forward-looking statements include, among other things, statements concerning the potential exposure of TGI, its consolidated subsidiaries and related companies to market risks and statements expressing management’ expectations, beliefs, estimates, forecasts, projections and assumptions. These forward-looking statements are identified by their use of terms and phrases such as “anticipate”, “believe”, “could”, “estimate”, “expect”, “intend”, “may”, “plan”, “objectives”, ”outlook”, “probably”, “project”, “will”, “seek”, “target”, “risks”, “goals”, “should” and similar terms and phrases. Forward-looking statements are statements of future expectations that are based on management’s current expectations and assumptions and involve known and unknown risks and uncertainties that could cause actual results, performance or events to differ materially from those expressed or implied in these statements. Although TGI believes that the expectations and assumptions reflected in such forward-looking statements are reasonable based on information currently available to TGI’s management, such expectations and assumptions are necessarily speculative and subject to substantial uncertainty, and as a result, TGI cannot guarantee future results or events. TGI does not undertake any obligation to update any forward-looking statement or other information to reflect events or circumstances occurring after the date of this presentation or to reflect the occurrence of unanticipated events.


Cálidda´s 3Q 2014 Results

I. Significant Developments
II. Commercial Performance
III. Operational Performance
IV. Financial Performance and Key Metrics
V. Questions and Answers Session
Annexes:
(i) Strong Sponsorship with Optimal Experience
(ii) Experienced and Proven Management Team & Board
2
Table of Contents

I. Significant Developments
II. Commercial Performance
III. Operational Performance
IV. Financial Performance and Key Metrics
V. Questions and Answers Session
Annexes:
(i) Strong Sponsorship with Optimal Experience
(ii) Experienced and Proven Management Team & Board
Table of Contents
3

In July OSINERGMIN published the resolution that sets Cálidda´s tariff regime for the next 4 years (from May 8th, 2014 to May 7th, 2018). The approved average distribution tariff was increased by 6.37% when compared to the 2010 – 2014 average distribution tariff.
In addition, OSINERGMIN resolution establishes an investment plan (capex) of US$ 428 MM for the period 2014 – 2017.
Also in July, Cálidda started to expand sales to the residential segment at regular sales price of installation services, without promotional discounts*
As part of our expansion plan, Cálidda has started working on the environmental impact study in the southern district of Lima called Cañete.
As of September, Cálidda has a client base of 235,000 customers, 67% more than in Q3 2013.
Significant Developments
1) Total Adjusted Revenues and Adjusted EBITDA Margin exclude Pass-through and IFRIC 12 revenues.
4
Significant Developments
6,889 15,945 29,048
39,543 60,097
71,452
19,188 35,133
64,181
103,724
163,821
235,273
0
50,000
100,000
150,000
200,000
250,000
0
25,000
50,000
75,000
100,000
2009 2010 2011 2012 2013 YTD 2014
Connections Performance
Period connections Collected connections
(*) Mechanism set up to increase residential sales in medium-low income households by discounting 50% the sales price of installation services. The 50% discount is known as “promotional discount” and is factored in the distribution tariff
Main Results - YTD Q3 2014 Q3 2013 Var %
Invoiced Volume (MMCFD): 672 558 20%
Total Revenues (USD MM): 443.6 296.8 49%
Total Adj. Revenues (USD MM) 1 : 139.6 102.5 36%
EBITDA (USD MM): 70.9 50.5 40%
Adjusted EBITDA Margin: 50.8% 49.3% --
Total Network Lenght (km): 4,450 3,094 44%
Accumulated Clients: 235,273 141,146 67%

I. Significant Developments
II. Commercial Performance
III. Operational Performance
IV. Financial Performance and Key Metrics
V. Questions and Answers Session
Annexes:
(i) Strong Sponsorship with Optimal Experience
(ii) Experienced and Proven Management Team & Board
Table of Contents
5

Client Base
Our clients in this segment have an installed capacity close to 3,500 MW, representing 37% of Peru’s overall power generation capacity (*).
Up to Q3, Cálidda has connected a total of 19 new industrial plants.
A new cluster of industries in northeast Lima has been identified (Puente Piedra), and one client has already been connected (Compañía Peruana de Vidrios) to Cálidda´s distribution system. In the first stage of expansion in this cluster, a group of 11 clients will be soon connected.
6
Power Generation
Industrial
(*) Source: Executive Yearbook of Electricity of 2013 – MEM.
8
11 13 13
16 16
0
5
10
15
20
2009 2010 2011 2012 2013 Q3 2014
321 360
394 429
466 485
0
100
200
300
400
500
600
2009 2010 2011 2012 2013 Q3 2014

Client Base (Cont’d)
Up to Q3, Cálidda has connected to the distribution system a total of 9 new NGV service stations, and currently there are more than 188,000 vehicles already converted to natural gas running in the cities of Lima and Callao.
Further consumption in this segment is expected to come from the public transportation buses, as they gradually switch their fuel source from diesel to natural gas.
Up to Q3, Cálidda has added 71,424 clients to the Residential & Commercial segment.
In the Residential segment only, 70,645 new clients have been connected in 2014, and as a result a total of 231,341 households currently use natural gas.
In the Commercial segment, Cálidda has increased in 2014 its efforts to connect more businesses to the distribution system, reaching 779 new clients up to Q3 and therefore having a total of 3,216 commercial clients.
NGV Stations
Residential & Commercial
7
103 143 172 192 206 215
81,029 103,712
126,586 151,781
171,541 188,124
0
50,000
100,000
150,000
200,000
0
100
200
300
400
2009 2010 2011 2012 2013 Q3 2014
NGV Stations Converted Vehicles
18,756 34,619
63,602
103,090
163,133
234,557
0
50,000
100,000
150,000
200,000
250,000
2009 2010 2011 2012 2013 Q3 2014

Volume Sold MMCFD
In Q3 Cálidda increased its volume sold by 20% compared to Q3 2013, mainly explained by the addition of Fénix Power (82 MMCFD) and Termochilca (45 MMCFD) since the 2H 2013. Additionally, Cálidda has agreed to distribute 20 MMCFD of additional volume to Kallpa power generator.
As of Q3, 76 % of the volume sold is explained by firm contracts (take or pay), the majority of them corresponding to the power generation clients.
8
52.2%
63.9%
71.6% 71.6%
72.5% 69.9%
74.2%
13.4%
10.6%
8.8%
9.7%
9.6% 10.6%
9.2%
34.0%
25.0%
19.2%
18.1%
17.2% 18.8%
15.8%
182
303
457
508
577 558
672
2009 2010 2011 2012 2013 Q3 2013 Q3 2014
Residential &Commercial
Industrial
NGV Stations
Power Generation

Volume Sold by Client Segment MMCFD
NGV Stations Residential & Commercial
Industrial Power Generation
9
95
193
327 364
418 402
499
0
100
200
300
400
500
600
2009 2010 2011 2012 2013 Q3 2013 Q3 2014
62
76
88 92
99 98 107
0
20
40
60
80
100
120
2009 2010 2011 2012 2013 Q3 2013 Q3 2014
24
32
40
49 56 55
61
0
10
20
30
40
50
60
70
2009 2010 2011 2012 2013 Q3 2013 Q3 2014
0.8 1.3
1.9
2.9
3.9 3.7
5.5
0
1
2
3
4
5
6
2009 2010 2011 2012 2013 Q3 2013 Q3 2014

I. Significant Developments
II. Commercial Performance
III. Operational Performance
IV. Financial Performance and Key Metrics
V. Questions and Answers Session
Annexes:
(i) Strong Sponsorship with Optimal Experience
(ii) Experienced and Proven Management Team & Board
Table of Contents
10

Operational Performance
Distribution System Infrastructure
Network Efficiency
In the first nine months of 2014, Cálidda has built 18 km of steel high pressure network and 1,028 km of polyethylene secondary network, which is built in great extent to reach new household clients.
The pace of expansion in areas with polyethylene network built (rings) has increased considerably this year, reaching 111,997 rings in Q3 2014 compared to 53,066 rings in Q3 2013 .
Cálidda’s entire distribution system consists of 4,450 km of underground pipelines.
The network penetration rate has reached 53% in the last quarter.
The district of San Juan de Lurigancho is the one with the highest penetration rate at 71%.
This year Cálidda has planned on entering into 5 more districts: Callao, Ate, Puente Piedra, Imperial and Cañete.
11
Clie
nts
(‘0
00
)
273 303 359 387 408 426 701
1,020 1,465
2,163
2,996
4,024
974 1,324
1,824
2,550
3,404
4,450
0
1,000
2,000
3,000
4,000
5,000
2009 2010 2011 2012 2013 Q3 2014
km
Steel Network Polyethylene Network Total
19 35 64
104
164
235
94 126
174
244
331
443
20%
28%
37% 42% 50%
53%
0%
10%
20%
30%
40%
50%
60%
0
100
200
300
400
500
600
2009 2010 2011 2012 2013 Q3 2014Total Clients Potential Clients*
(*) Clients who are adjacent to Cálidda's distribution

I. Significant Developments
II. Commercial Performance
III. Operational Performance
IV. Financial Performance and Key Metrics
V. Questions and Answers Session
Annexes:
(i) Strong Sponsorship with Optimal Experience
(ii) Experienced and Proven Management Team & Board
Table of Contents
12
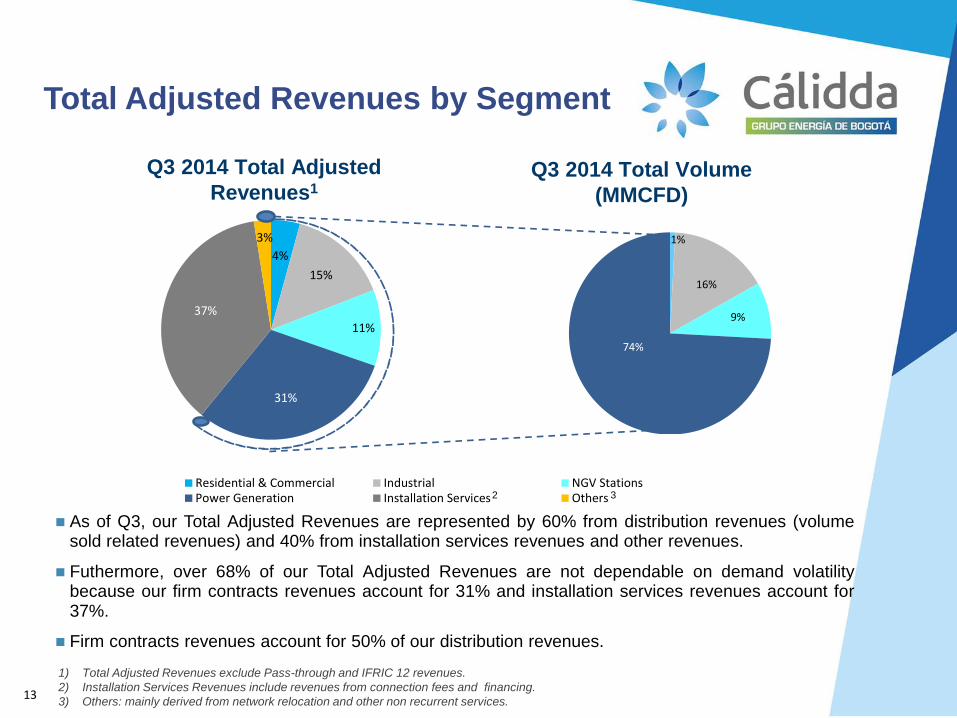
Total Adjusted Revenues by Segment
2
1) Total Adjusted Revenues exclude Pass-through and IFRIC 12 revenues.
2) Installation Services Revenues include revenues from connection fees and financing.
3) Others: mainly derived from network relocation and other non recurrent services.
3
13
1%
16%
9%
74%
4%
15%
11%
31%
37%
3%
Residential & Commercial Industrial NGV StationsPower Generation Installation Services Others
Q3 2014 Total Adjusted
Revenues1 Q3 2014 Total Volume
(MMCFD)
As of Q3, our Total Adjusted Revenues are represented by 60% from distribution revenues (volume sold related revenues) and 40% from installation services revenues and other revenues.
Futhermore, over 68% of our Total Adjusted Revenues are not dependable on demand volatility because our firm contracts revenues account for 31% and installation services revenues account for 37%.
Firm contracts revenues account for 50% of our distribution revenues.

Financial Performance Million US$
Funds from Operations (FFO)1
EBITDA & Adj. EBITDA Margin (%) Total Revenues
14
Debt & Net Debt / EBITDA2
43 64 103 125 146 103 140 116 125
201 245
315
194
304
160 188
304
370
461
297
444
2009 2010 2011 2012 2013 Q3 2013 Q3 2014
Total Adjusted Revenues Pass-through & IFRIC 12
19 29
59 64
72
92
44.5% 46.1%
57.6% 51.6% 49.3%
50.8%
2009 2010 2011 2012 2013 LTM Q32014EBITDA Adjusted EBITDA Margin
12
18
40 43
36
58
2009 2010 2011 2012 2013 LTM Q32014
3.9x 3.9x
2.8x 3.0x
4.4x
3.4x
3.1x 3.1x
2.3x 2.3x
3.0x 2.8x
2009 2010 2011 2012 2013 LTM Q32014Debt / EBITDA Net Debt / EBITDA
2) Net Debt = Debt - Cash Balance. 1) FFO = Net Profit + Depreciation + Amortization

Financial Metrics
Interest Coverage2 FFO / Net Debt
Debt / Capitalization (%) Total Debt1
2) In 2013 ratio does not include 2013’s debt prepayment penalties (USD 7.8
MM)
1) Total Debt: net of debt associated costs.
15
41.4%
49.8% 54.1%
49.2%
56.6% 53.8%
2009 2010 2011 2012 2013 LTM Q32014
3.5x 3.8x
5.8x 5.5x 5.6x
6.4x
2009 2010 2011 2012 2013 LTM Q3 2014
20.9% 20.2%
28.9% 28.3%
16.8%
22.5%
2009 2010 2011 2012 2013 LTM Q32014
28 67
119 149
318 318
47
47
47 47
75
114
166 196
318 318
2009 2010 2011 2012 2013 LTM Q32014Senior Debt Shareholders' Subordinated Debt
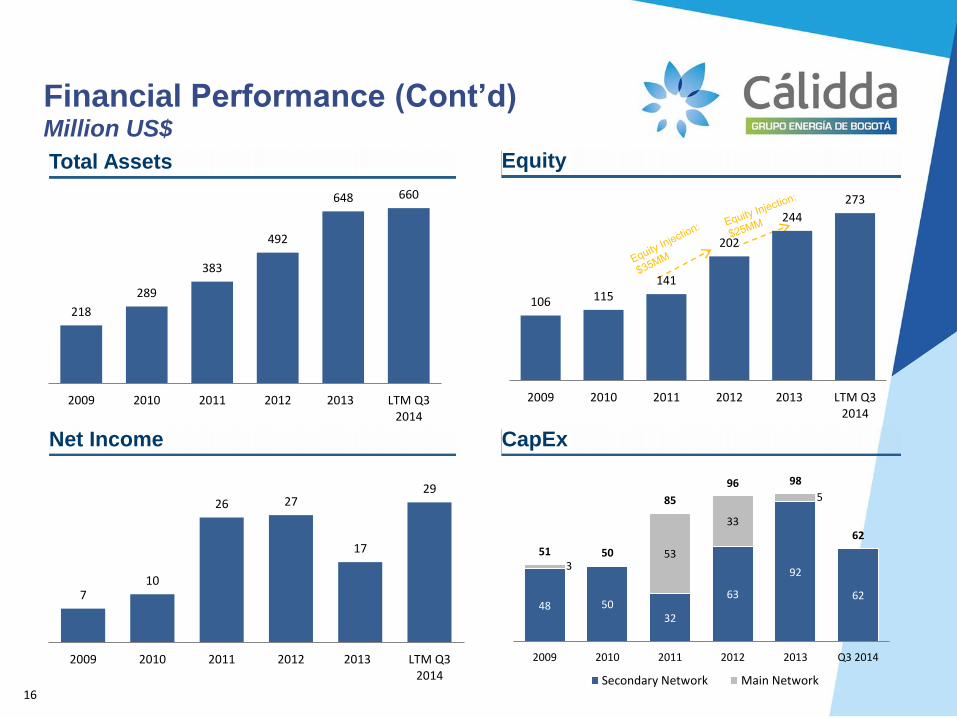
CapEx
Financial Performance (Cont’d) Million US$
Net Income
Equity Total Assets
16
218
289
383
492
648 660
2009 2010 2011 2012 2013 LTM Q32014
106 115 141
202
244
273
2009 2010 2011 2012 2013 LTM Q32014
48 50 32
63
92
62
3 53
33
5
51 50
85
96 98
62
2009 2010 2011 2012 2013 Q3 2014
Secondary Network Main Network
7 10
26 27
17
29
2009 2010 2011 2012 2013 LTM Q32014

I. Significant Developments
II. Commercial Performance
III. Operational Performance
IV. Financial Performance and Key Metrics
V. Questions and Answers Session
Annexes:
(i) Strong Sponsorship with Optimal Experience
(ii) Experienced and Proven Management Team & Board
Table of Contents
17

For more information about Cálidda, please contact our Investor Relations team:
http://calidda.com.pe/inversionistas/
http://www.grupoenergiadebogota.com.co
Adolfo Heeren
CEO
Rafael Andrés Salamanca Rodriguez
Investor Relations Advisor GEB
+57 1 326 8000 – ext. 1675
Isaac Finger
CFO
+51 1 625 7310
Investor Relations
18
Mathius Sersen
Finance Director
+51 1 625 7390

I. Significant Developments
II. Commercial Performance
III. Operational Performance
IV. Financial Performance and Key Metrics
V. Questions and Answers Session
Annexes:
(i) Strong Sponsorship with Optimal Experience
(ii) Experienced and Proven Management Team & Board
Table of Contents
19

Strong Sponsorship with
Optimal Experience
– Leading energy holding company with interests across the electricity
and natural gas sectors in Colombia, Peru and Guatemala.
– Founded in 1896, controlled by the Distrito de Bogotá since 1956 with a
76.2% ownership stake.
– Leader in the Energy Sector: major player in the transmission and
distribution of electricity and natural gas.
– Only vertically-integrated and one of the largest natural gas distribution
and transportation companies in Colombia.
– Founded in 1974 by the government of Colombia. Currently controlled
by Grupo Aval.
– Major player in the gas distribution sector in Colombia through Gases
de Occidente, Surtigas and Gases del Caribe.
– Participation in the power distribution in Colombia and
telecommunications sector in Panama and Costa Rica.
– EEB has 15.6% stake in Promigas.
Controlling Investments
Non Controlling Investments
Non Controlling Investments
Controlling Shareholder – 60% Ownership in Cálidda
Shareholder – 40% Ownership in Cálidda
Controlling Investments
20
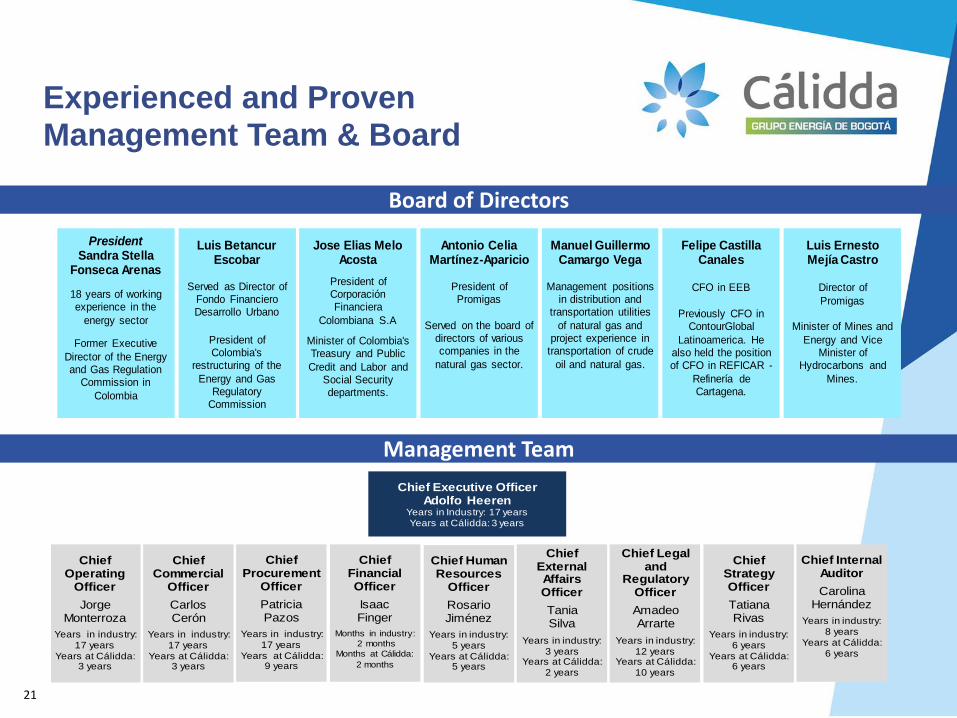
Experienced and Proven Management Team & Board
Board of Directors
Management Team
PresidentSandra Stella
Fonseca Arenas
18 years of working experience in the
energy sector
Former Executive
Director of the Energy and Gas Regulation
Commission in
Colombia
Luis BetancurEscobar
Served as Director of Fondo Financiero Desarrollo Urbano
President of Colombia's
restructuring of the
Energy and Gas Regulatory
Commission
Jose Elias Melo Acosta
President of Corporación Financiera
Colombiana S.A
Minister of Colombia's Treasury and Public
Credit and Labor and Social Security departments.
Antonio CeliaMartínez-Aparicio
President ofPromigas
Served on the board of directors of various companies in the
natural gas sector.
Manuel GuillermoCamargo Vega
Management positions in distribution and
transportation utilities
of natural gas and project experience in
transportation of crude
oil and natural gas.
Felipe Castilla Canales
CFO in EEB
Previously CFO in ContourGlobal
Latinoamerica. He also held the position of CFO in REFICAR -
Refinería de Cartagena.
Luis ErnestoMejía Castro
Director of
Promigas
Minister of Mines and
Energy and Vice Minister of
Hydrocarbons and
Mines.
21
Chief Operating
Officer
JorgeMonterroza
Years in industry:17 years
Years at Cálidda:3 years
Chief Executive OfficerAdolfo Heeren
Years in Industry: 17 yearsYears at Cálidda: 3 years
Chief Commercial
Officer
CarlosCerón
Years in industry:17 years
Years at Cálidda:3 years
ChiefProcurement
Officer
PatriciaPazos
Years in industry:17 years
Years at Cálidda:9 years
Chief FinancialOfficer
IsaacFinger
Months in industry:
2 months
Months at Cálidda:
2 months
Chief Human Resources
Officer
RosarioJiménez
Years in industry:5 years
Years at Cálidda:5 years
Chief External Affairs Officer
TaniaSilva
Years in industry:3 years
Years at Cálidda:2 years
Chief Legal and
Regulatory Officer
AmadeoArrarte
Years in industry:12 years
Years at Cálidda:10 years
Chief Strategy Officer
TatianaRivas
Years in industry:6 years
Years at Cálidda:6 years
Chief Internal Auditor
CarolinaHernández
Years in industry:8 years
Years at Cálidda:6 years

Disclaimer
The information provided here is for informational and illustrative purposes only and is
not, and does not seek to be, a source of legal or financial advice on any subject. This
information does not constitute an offer of any sort and is subject to change without
notice.
Cálidda and its Shareholders expressly disclaim any responsibility for actions taken or
not taken based on this information. Neither Cálidda nor its Shareholders accept any
responsibility for losses that might result from the execution of the proposals or
recommendations herein presented. Neither Cálidda nor its Shareholders are
responsible for any content that may originate with third parties. Cálidda or its
Shareholders may have provided, or might provide in the future, information that is
inconsistent with the information herein presented.
22
Related Documents