The textiles, clothing and leather manufacturing sector in the EU is diverse in the goods that it produces; they range from traditional woollen weaves to high-tech cellulosic synthetic yarns and from industrial filters to cotton bed linen. The sector serves a broad range of specialist and mass production markets, both at home and abroad, that respond to fashion and style (such as clothes and soft furnishings) and technical specifications (such as protective wear and factory work wear). The European textiles, clothing and leather manufacturing sector is in a state of continuous restructuring and modernisation. With the aim of trying to manage this change, various approaches and Community programmes have been put in place, such as the structural funds (2007–2013), the new globalisation adjustment fund, the European Technology Platform and the Competitiveness and Innovation Programme. Pressure for change continues to come from consumer developments, technological advances, the changes in different production costs, the growth in retailers’ purchasing power, environmental issues on chemical use and wastewater discharge (see Chapter 5 on the many regulatory issues being addressed and the 1996 IPPC Directive, and the ongoing development of the REACH chemicals policy in particular) and the emergence of important international competitors. The response of the sector has centred on a move to higher value added goods (such as innovative industrial textiles or niche products), the sub-contracting of labour-intensive work or relocation of production facilities (firstly towards lower labour-cost zones in central and eastern Europe – see Map 3.1 for more detail - and then to the pan-Euro-Mediterranean zone), the use of labelling to underline respect of labour and environmental regulations, and the imposition of intellectual property rights (as provided for in the European Parliament and Council Directive 2004/48/EC) to help counter large-scale copying or counterfeiting of designs, models, brands and trademarks. Perhaps the greatest pressure for accelerated change within the EU textiles, clothing and leather manufacturing sector now comes from international trade issues: these concern the elimination of textile and clothing import quotas that took place on 1 January 2005 and the ongoing negotiations on tariffs and non-tariff barriers (such as import charges and other taxes and duties) within the Doha Development Round of world trade talks. The issues faced have been highlighted by recent trade disputes with China, when a textile trade row began after a surge in imports (detailed in the subchapters that follow) of certain textile and clothing goods from China during the first few months of 2005. The European Commission initiated safeguard investigations, followed by the bilateral ‘Shanghai’ agreement with China. This agreement aims to manage the growth of some textile and clothing imports (1) to between 8 % and 12.5 % per annum until the end of 2007, while enabling the affected segments of the EU’s industrial sector (largely clustered in Greece, Italy and Portugal) time to adjust. The strength of the agreement was tested as imports for some goods rose above these restraints a few months later and incurred blocks at points of entry. However, the situation was resolved and then cemented by Commission Regulation (EC) No 1478/2005 of 12 September 2005 which amended common rules for imports of certain textile products. More recently, the European Commission has imposed punitive tariff duties on leather shoes from China and Vietnam after concluding that these countries had been paying hidden subsidies to their respective footwear industries, thereby allowing them to send goods to Europe at markedly lower prices than those in Asia. Textiles, clothing, leather and footwear Chapter 3: textiles, clothing, leather and footwear 65 This chapter covers the manufacture of textiles, clothing, fur and leather goods, as defined by NACE Subsections DB and DC, hereafter referred to as textiles, clothing and leather manufacturing. The manufacture of textiles (NACE Division 17) is dealt with in the first subchapter, while the manufacture of wearing apparel and the dressing and dyeing of fur (NACE Division 18), hereafter called the manufacture of clothing, is the subject of the second subchapter. The final subchapter concentrates on the manufacture of leather and leather products including that of footwear (as covered by NACE Division 19), hereafter referred to as leather manufacturing. NACE 17: manufacture of textiles; 17.1: preparation and spinning of textile fibres; 17.2: textile weaving; 17.3: finishing of textiles; 17.4: manufacture of made-up textile articles, except apparel; 17.5: manufacture of other textiles; 17.6: manufacture of knitted and crocheted fabrics; 17.7: manufacture of knitted and crocheted articles; 18: manufacture of wearing apparel; dressing and dyeing of fur; 18.1: manufacture of leather clothes; 18.2: manufacture of other wearing apparel and accessories; 18.3: dressing and dyeing of fur; manufacture of articles of fur; 19: tanning and dressing of leather; manufacture of luggage, handbags, saddlery, harness and footwear; 19.1: tanning and dressing of leather; 19.2: manufacture of luggage, handbags and the like, saddlery and harness; 19.3: manufacture of footwear. (1) The agreement covers the following categories: t-shirts, pullovers, men's trousers, blouses, dresses, brassieres, flax yarn, cotton fabrics, bed linen, and table and kitchen linen.

Welcome message from author
This document is posted to help you gain knowledge. Please leave a comment to let me know what you think about it! Share it to your friends and learn new things together.
Transcript
The textiles, clothing and leather manufacturing
sector in the EU is diverse in the goods that it
produces; they range from traditional woollen
weaves to high-tech cellulosic synthetic yarns and
from industrial filters to cotton bed linen. The
sector serves a broad range of specialist and mass
production markets, both at home and abroad,
that respond to fashion and style (such as clothes
and soft furnishings) and technical specifications
(such as protective wear and factory work wear).
The European textiles, clothing and leather
manufacturing sector is in a state of continuous
restructuring and modernisation. With the aim of
trying to manage this change, various approaches
and Community programmes have been put in
place, such as the structural funds (2007–2013),
the new globalisation adjustment fund, the
European Technology Platform and the
Competitiveness and Innovation Programme.
Pressure for change continues to come from
consumer developments, technological advances,
the changes in different production costs, the
growth in retailers’ purchasing power,
environmental issues on chemical use and
wastewater discharge (see Chapter 5 on the many
regulatory issues being addressed and the 1996
IPPC Directive, and the ongoing development of
the REACH chemicals policy in particular) and the
emergence of important international
competitors. The response of the sector has
centred on a move to higher value added goods
(such as innovative industrial textiles or niche
products), the sub-contracting of labour-intensive
work or relocation of production facilities (firstly
towards lower labour-cost zones in central and
eastern Europe – see Map 3.1 for more detail -
and then to the pan-Euro-Mediterranean zone),
the use of labelling to underline respect of labour
and environmental regulations, and the
imposition of intellectual property rights (as
provided for in the European Parliament and
Council Directive 2004/48/EC) to help counter
large-scale copying or counterfeiting of designs,
models, brands and trademarks.
Perhaps the greatest pressure for accelerated
change within the EU textiles, clothing and
leather manufacturing sector now comes from
international trade issues: these concern the
elimination of textile and clothing import
quotas that took place on 1 January 2005 and
the ongoing negotiations on tariffs and
non-tariff barriers (such as import charges and
other taxes and duties) within the Doha
Development Round of world trade talks. The
issues faced have been highlighted by recent
trade disputes with China, when a textile trade
row began after a surge in imports (detailed in
the subchapters that follow) of certain textile
and clothing goods from China during the first
few months of 2005. The European
Commission initiated safeguard investigations,
followed by the bilateral ‘Shanghai’ agreement
with China. This agreement aims to manage
the growth of some textile and clothing
imports (1) to between 8 % and 12.5 % per
annum until the end of 2007, while enabling
the affected segments of the EU’s industrial
sector (largely clustered in Greece, Italy and
Portugal) time to adjust. The strength of the
agreement was tested as imports for some
goods rose above these restraints a few months
later and incurred blocks at points of entry.
However, the situation was resolved and then
cemented by Commission Regulation
(EC) No 1478/2005 of 12 September 2005
which amended common rules for imports of
certain textile products. More recently, the
European Commission has imposed punitive
tariff duties on leather shoes from China and
Vietnam after concluding that these countries
had been paying hidden subsidies to their
respective footwear industries, thereby
allowing them to send goods to Europe at
markedly lower prices than those in Asia.
Textiles, clothing, leather and footwear
Chapter 3: textiles, clothing, leather and footwear
65
This chapter covers the manufacture of textiles,
clothing, fur and leather goods, as defined by
NACE Subsections DB and DC, hereafter
referred to as textiles, clothing and leather
manufacturing. The manufacture of textiles
(NACE Division 17) is dealt with in the first
subchapter, while the manufacture of wearing
apparel and the dressing and dyeing of fur
(NACE Division 18), hereafter called the
manufacture of clothing, is the subject of the
second subchapter. The final subchapter
concentrates on the manufacture of leather
and leather products including that of footwear
(as covered by NACE Division 19), hereafter
referred to as leather manufacturing.
NACE17: manufacture of textiles;17.1: preparation and spinning of textile
fibres;17.2: textile weaving;17.3: finishing of textiles;17.4: manufacture of made-up textile
articles, except apparel;17.5: manufacture of other textiles;17.6: manufacture of knitted and crocheted
fabrics;17.7: manufacture of knitted and crocheted
articles;18: manufacture of wearing apparel;
dressing and dyeing of fur;18.1: manufacture of leather clothes;18.2: manufacture of other wearing apparel
and accessories;18.3: dressing and dyeing of fur;
manufacture of articles of fur;19: tanning and dressing of leather;
manufacture of luggage, handbags, saddlery, harness and footwear;
19.1: tanning and dressing of leather;19.2: manufacture of luggage, handbags
and the like, saddlery and harness;19.3: manufacture of footwear.
(1) The agreement covers the following categories: t-shirts, pullovers, men's trousers, blouses, dresses,brassieres, flax yarn, cotton fabrics, bed linen, andtable and kitchen linen.
66
Chapter 3: textiles, clothing, leather and footwear NACE DB and DC
0 150 750 km
ACORES P
0 100
MADEIRA P
0 25
CANARIAS E
0 100
GUADELOUPE
F 0 25
MARTINIQUE
F 0 20REUNION
F 0 20
GUYANE
F 0 100
<= 0.5 %
> 0.5 % and <= 1 %
> 1 % and <= 3 %
> 3 %
Data not available
0 50
CYPRUS
0 10
MALTA
2003 NUTS 2
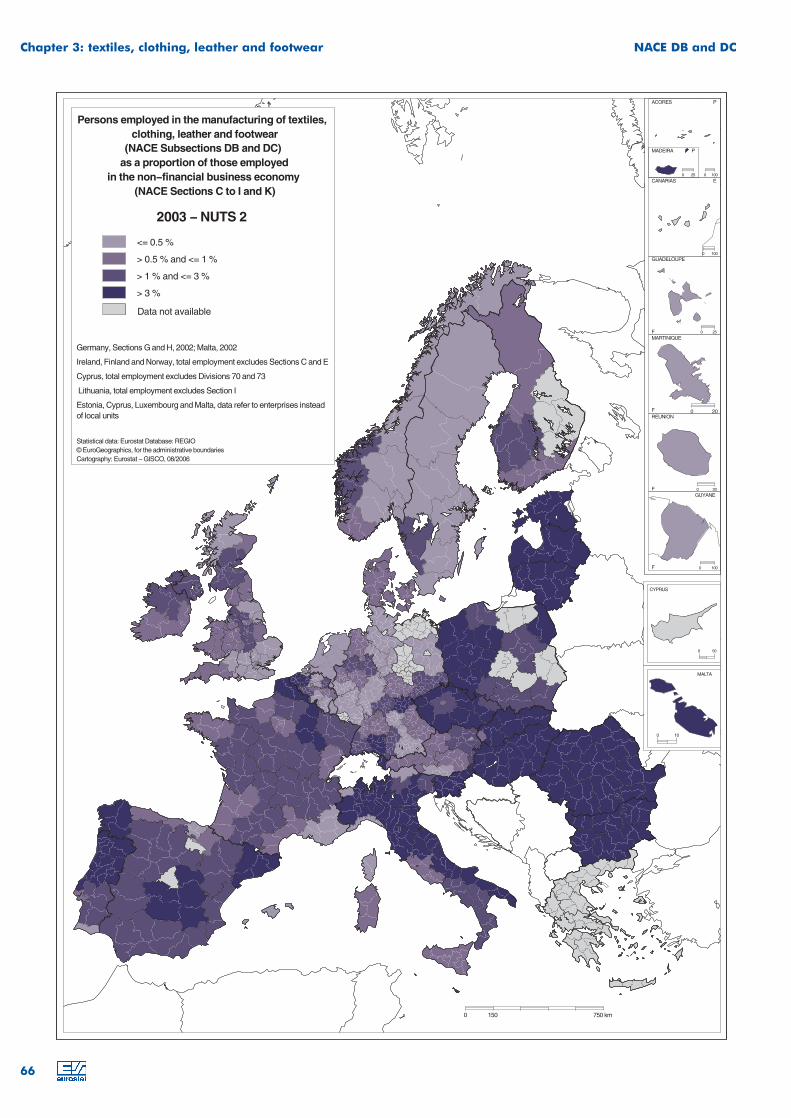
Persons employed in the manufacturing of textiles,clothing, leather and footwear
(NACE Subsections DB and DC)as a proportion of those employed
in the financial business economy(NACE Sections C to I and K)
Germany, Sections G and H, 2002; Malta, 2002
Ireland, Finland and Norway, total employment excludes Sections C and E
Cyprus, total employment excludes Divisions 70 and 73
Lithuania, total employment excludes Section I
Estonia, Cyprus, Luxembourg and Malta, data refer to enterprises insteadof local units
Statistical data: Eurostat Database: REGIO© EuroGeographics, for the administrative boundariesCartography: Eurostat GISCO, 08/2006
STRUCTURAL PROFILE
The textiles, clothing and leather
manufacturing sector of the EU-25 (NACE
Subsections DB and DC) generated
EUR 66.0 billion of value added in 2003 and
employed 3.0 million people (see Table 3.1).
Within industry as a whole (NACE
Sections C to E), the textiles, clothing and
leather manufacturing sector was considerably
more significant in terms of employment
(8.5 % of total industrial employment in 2003)
than in terms of value added (3.9 % of
industrial value added in 2003).
Within the textiles, clothing and leather
manufacturing sector, textile manufacturing
(covering the activities within NACE
Division 17) accounted for half of the value
added generated in 2003. The manufacture of
clothing (as defined by the activities in NACE
Division 18) generated about one third of the
value added of the sector as a whole and was
the second largest activity in these terms. In
terms of employment, however, a slightly
higher proportion of workers within the sector
were engaged in the manufacture of clothing
than textiles in 2003. By both measures, the
manufacture of leather and leather products
(NACE Division 19) was the smallest subsector
within the textiles, clothing and leather
manufacturing sector.
In each of the three subsectors within the
textiles, clothing and leather manufacturing
sector, Italy was the principal manufacturing
Member State both in terms of value added
and employment. A little over one third
(34.1 %) of the value added generated by the
textiles, clothing and leather manufacturing
sector as a whole in the EU-25 came from Italy
in 2003 (EUR 22.5 billion). The other main
textiles, clothing and leather manufacturing
countries within the EU-25 were France (a
12.5 % share of the EU-25 value added),
Germany (12.2 %), Spain (10.1 %) and the
United Kingdom (9.8 %). In relative terms,
however, Portugal, Lithuania and Estonia were
more specialised (even) than Italy in textiles,
clothing and leather manufacturing (see
Table 3.2), which contributed more than a
tenth of industrial value added in 2003, more
than double the EU-25 average (3.9 %).
67
NACE DB and DC Chapter 3: textiles, clothing, leather and footwear
Box 3.1: end of the Agreement on Textiles and Clothing
Most of the world’s trade is governed by rules adopted through the World Trade Organisation (WTO), of which the general agreement on tariffs and
trade (GATT) is one of the most important. It is a multilateral treaty intended to help reduce trade barriers between signatory countries and to promote
trade through tariff concessions. Before 1995, however, trade in textiles and clothing was organised on the basis of bilateral agreements that set
quotas for exports from developing countries to industrial countries under a special trade regime outside normal GATT rules. These quotas were
negotiated bilaterally and were governed by the rules of the Multifibre Arrangement (MFA), which permitted selective quantitative restrictions when
surges in imports of particular products caused, or threatened to cause, serious damage to textiles or clothing manufacturing in the importing country.
From 1 January 1995, international trade in textiles and clothing underwent a fundamental change, as a ten-year transitional programme was agreed
under the auspices of the WTO, namely, the Agreement on Textiles and Clothing (ATC). The ATC was a transitional instrument to oversee the
integration of textile and clothing products into normal GATT rules, by means of progressively removing quotas. As of 1 January 2005 textile and
clothing products were opened up to free trade.
Table 3.1 ___________________________________________________________________________________________________________________________
Manufacture of textiles, clothing and leather products (NACE Subsections DB and DC)
Structural profile, EU-25, 2003
(1) Rounded estimates based on non-confidential data.Source: Eurostat (SBS)
Value added
(EUR million)
Share of industrial
value added
(%)
Number of
persons employed
(thousands)
Share of industrial
employment
(%)
Textiles, clothing and leather products (1) 66 000 3.9 3 000 8.5
Textiles (1) 33 000 1.9 1 170 3.3
Clothing (1) 22 100 1.3 1 200 3.4
Leather 11 581 0.7 517 1.5
Table 3.2 ___________________________________________________________________________________________________________________________
Manufacture of textiles, clothing and leather products (NACE Subsections DB and DC)
Value added and employment: ranking of the top 5 Member States, 2003
(1) Hungary, Malta, Slovakia and Sweden, 2002; Denmark, Greece, Cyprus, Latvia, Austria, not available.(2) Sweden, provisional; Hungary, Malta and Slovakia, 2002; Denmark, Greece, Cyprus and Austria, not available.(3) Slovakia and Sweden, 2002; Denmark, Greece, Ireland, Cyprus, Latvia, Hungary, Malta and Austria, not available.(4) Sweden, provisional; Hungary, Malta and Slovakia, 2002; Denmark, Greece, Ireland, Cyprus and Austria, not available.Source: Eurostat (SBS)
Rank
Highest
value added
(EUR million) (1)
Share in EU-25
value added
(%) (1)
Highest number of
persons employed
(thousands) (2)
Share in EU-25
employment
(%) (2)
Highest share of
national industrial
value added
(%) (3)
Highest share of
national industrial
employment
(%) (4)
1 Italy (22 479.8) 34.1 Italy (757.5) 25.2 Portugal (14.9) Portugal (30.8)
2 France (8 247.0) 12.5 Poland (298.9) 10.0 Lithuania (11.4) Lithuania (23.5)
3 Germany (8 046.9) 12.2 Portugal (284.9) 9.5 Estonia (10.7) Estonia (18.8)
4 Spain (6 695.6) 10.1 Spain (279.6) 9.3 Italy (10.1) Italy (15.4)
5 United Kingdom (6 481.3) 9.8 France (227.4) 7.6 Luxembourg (7.7) Malta (14.9)
The map on page 66 shows the contribution of
the textiles, clothing and leather manufacturing
sector to employment within the non-financial
business economy (NACE Sections C to I and K)
of each region. The most specialised region (at
the level of detail shown in the map) was Norte
(Portugal) and there were a number of specialist
regions in Italy. The map also shows the
concentration of specialist textiles, clothing and
leather regions in central and eastern Europe,
particularly in Romania and Bulgaria, but also
certain regions of Slovakia and Hungary,
Slovenia and the Baltic Member States (which
are each considered as a single region at the
level of detail in the map).
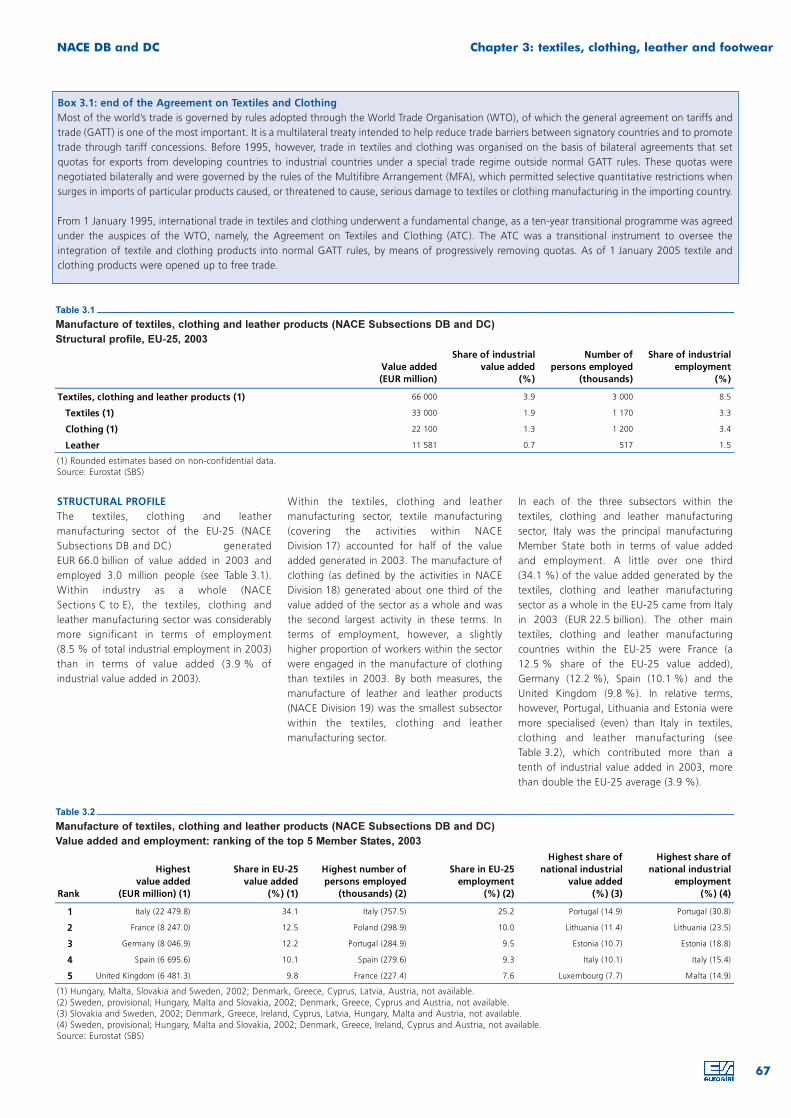
The marked downward trend in the index of
production for the textiles, clothing and leather
manufacturing sector continued during the
period 1995 to 2005 (with an average decline
of 4.3 % per annum), with some acceleration
towards the end of this period (declines of
more than 6 % were recorded in three of the
last four years): this was in sharp contrast to the
generally upward trend for industry as a whole
- see Figure 3.1.
Between 1995 and 2003, the output price
index for textiles, clothing and leather
manufacturing increased at a similar pace to
the average for industry as a whole. However,
the strength of competition is probably the
main reason why output prices for textiles,
clothing and leather manufacturing did not
respond to higher energy prices in 2004 and
2005 in the same way as many other industrial
activities.
Small and medium-sized enterprises (SMEs),
which employed less than 250 people,
dominated the textiles, clothing and leather
manufacturing sector in the EU-25. SMEs
employed 2.1 million people throughout the
EU-25 in 2003 (78.1 % of the total workforce)
and generated EUR 48.3 billion of value added
(72.9 % of the total).
68
Chapter 3: textiles, clothing, leather and footwear NACE DB and DC
Figure 3.1 _____________________________________________________________________________
Manufacture of textiles, clothing and leather products (NACE Subsections DB and DC)
Evolution of main indicators, EU-25 (2000=100)
Source: Eurostat (STS)
70
80
90
100
110
120
1995 1997 1999 2001 2003 2005
Total industry
Textiles, clothing and leather products
70
80
90
100
110
120
1995 1997 1999 2001 2003 2005
Total industry
Textiles, clothing and leather products
Index of production Index of domestic output prices
Figure 3.2 _____________________________________________________________________________
Manufacture of textiles, clothing and leather products (NACE Subsections DB and DC)
Share of value added by enterprise size class, EU-25, 2003 (%)
(1) Rounded estimates based on non-confidential data.(2) Rounded estimate based on non-confidential data for 1 to 9 persons employed.Source: Eurostat (SBS)
0%
25%
50%
75%
100%
Textiles, clothing and
leather products (1)
Textiles (2) Clothing (1) Leather
1 to 9 persons employed 10 to 49 persons employed 50 to 249 persons employed 250+ persons employed
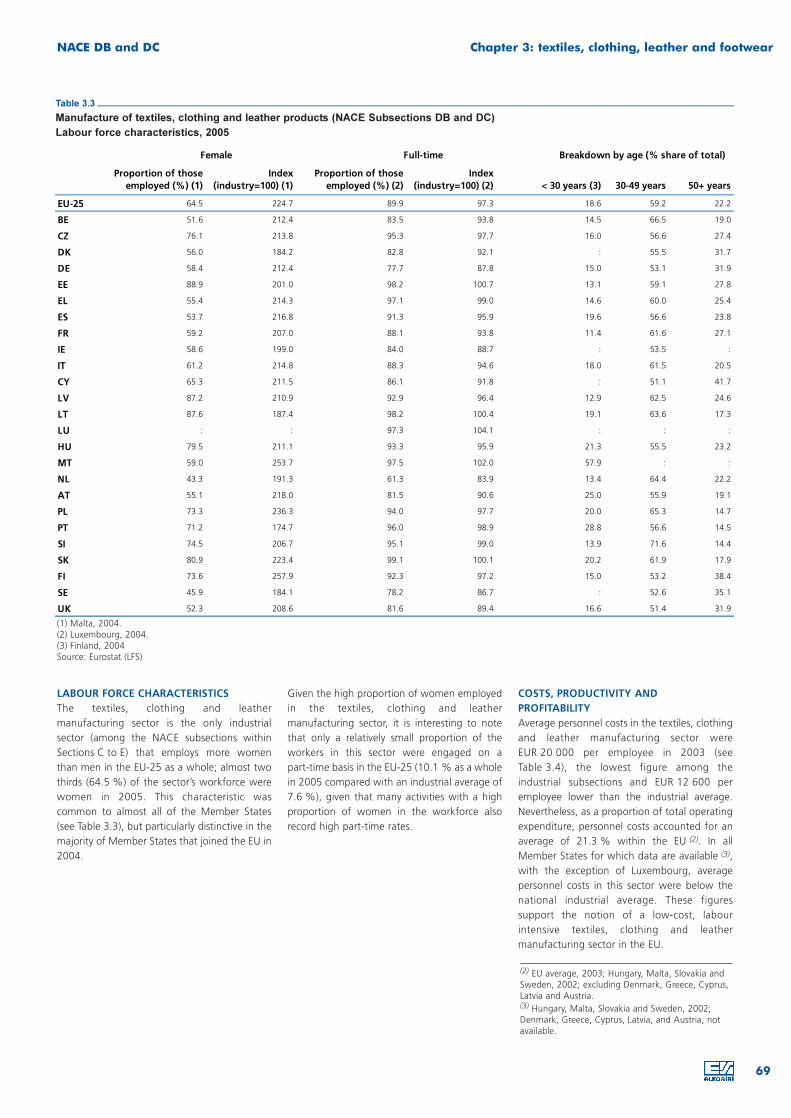
LABOUR FORCE CHARACTERISTICS
The textiles, clothing and leather
manufacturing sector is the only industrial
sector (among the NACE subsections within
Sections C to E) that employs more women
than men in the EU-25 as a whole; almost two
thirds (64.5 %) of the sector’s workforce were
women in 2005. This characteristic was
common to almost all of the Member States
(see Table 3.3), but particularly distinctive in the
majority of Member States that joined the EU in
2004.
Given the high proportion of women employed
in the textiles, clothing and leather
manufacturing sector, it is interesting to note
that only a relatively small proportion of the
workers in this sector were engaged on a
part-time basis in the EU-25 (10.1 % as a whole
in 2005 compared with an industrial average of
7.6 %), given that many activities with a high
proportion of women in the workforce also
record high part-time rates.
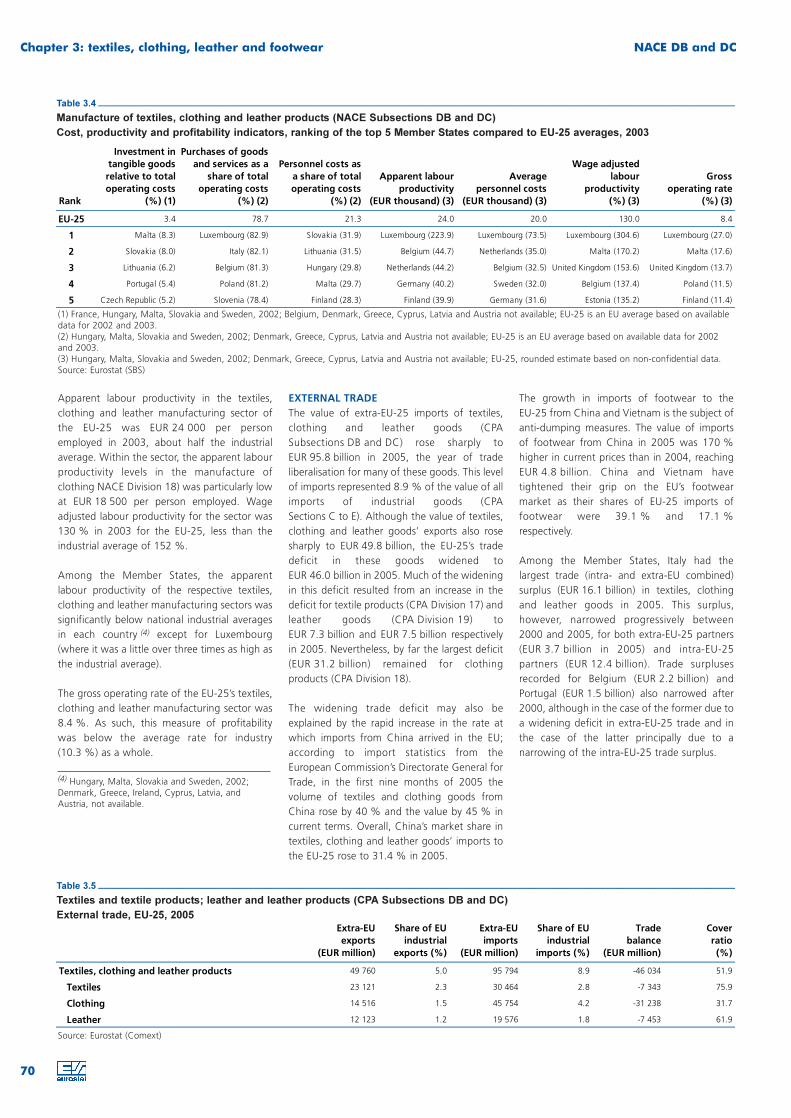
COSTS, PRODUCTIVITY AND
PROFITABILITY
Average personnel costs in the textiles, clothing
and leather manufacturing sector were
EUR 20 000 per employee in 2003 (see
Table 3.4), the lowest figure among the
industrial subsections and EUR 12 600 per
employee lower than the industrial average.
Nevertheless, as a proportion of total operating
expenditure, personnel costs accounted for an
average of 21.3 % within the EU (2). In all
Member States for which data are available (3),
with the exception of Luxembourg, average
personnel costs in this sector were below the
national industrial average. These figures
support the notion of a low-cost, labour
intensive textiles, clothing and leather
manufacturing sector in the EU.
69
NACE DB and DC Chapter 3: textiles, clothing, leather and footwear
Table 3.3 ___________________________________________________________________________________________________________________________
Manufacture of textiles, clothing and leather products (NACE Subsections DB and DC)
Labour force characteristics, 2005
(1) Malta, 2004.(2) Luxembourg, 2004.(3) Finland, 2004Source: Eurostat (LFS)
Proportion of those
employed (%) (1)
Index
(industry=100) (1)
Proportion of those
employed (%) (2)
Index
(industry=100) (2) < 30 years (3) 30-49 years 50+ years
EU-25 64.5 224.7 89.9 97.3 18.6 59.2 22.2
BE 51.6 212.4 83.5 93.8 14.5 66.5 19.0
CZ 76.1 213.8 95.3 97.7 16.0 56.6 27.4
DK 56.0 184.2 82.8 92.1 : 55.5 31.7
DE 58.4 212.4 77.7 87.8 15.0 53.1 31.9
EE 88.9 201.0 98.2 100.7 13.1 59.1 27.8
EL 55.4 214.3 97.1 99.0 14.6 60.0 25.4
ES 53.7 216.8 91.3 95.9 19.6 56.6 23.8
FR 59.2 207.0 88.1 93.8 11.4 61.6 27.1
IE 58.6 199.0 84.0 88.7 : 53.5 :
IT 61.2 214.8 88.3 94.6 18.0 61.5 20.5
CY 65.3 211.5 86.1 91.8 : 51.1 41.7
LV 87.2 210.9 92.9 96.4 12.9 62.5 24.6
LT 87.6 187.4 98.2 100.4 19.1 63.6 17.3
LU : : 97.3 104.1 : : :
HU 79.5 211.1 93.3 95.9 21.3 55.5 23.2
MT 59.0 253.7 97.5 102.0 57.9 : :
NL 43.3 191.3 61.3 83.9 13.4 64.4 22.2
AT 55.1 218.0 81.5 90.6 25.0 55.9 19.1
PL 73.3 236.3 94.0 97.7 20.0 65.3 14.7
PT 71.2 174.7 96.0 98.9 28.8 56.6 14.5
SI 74.5 206.7 95.1 99.0 13.9 71.6 14.4
SK 80.9 223.4 99.1 100.1 20.2 61.9 17.9
FI 73.6 257.9 92.3 97.2 15.0 53.2 38.4
SE 45.9 184.1 78.2 86.7 : 52.6 35.1
UK 52.3 208.6 81.6 89.4 16.6 51.4 31.9
Female Full-time Breakdown by age (% share of total)
(2) EU average, 2003; Hungary, Malta, Slovakia andSweden, 2002; excluding Denmark, Greece, Cyprus,Latvia and Austria.(3) Hungary, Malta, Slovakia and Sweden, 2002;Denmark, Greece, Cyprus, Latvia, and Austria, notavailable.
Apparent labour productivity in the textiles,
clothing and leather manufacturing sector of
the EU-25 was EUR 24 000 per person
employed in 2003, about half the industrial
average. Within the sector, the apparent labour
productivity levels in the manufacture of
clothing NACE Division 18) was particularly low
at EUR 18 500 per person employed. Wage
adjusted labour productivity for the sector was
130 % in 2003 for the EU-25, less than the
industrial average of 152 %.
Among the Member States, the apparent
labour productivity of the respective textiles,
clothing and leather manufacturing sectors was
significantly below national industrial averages
in each country (4) except for Luxembourg
(where it was a little over three times as high as
the industrial average).
The gross operating rate of the EU-25’s textiles,
clothing and leather manufacturing sector was
8.4 %. As such, this measure of profitability
was below the average rate for industry
(10.3 %) as a whole.
EXTERNAL TRADE
The value of extra-EU-25 imports of textiles,
clothing and leather goods (CPA
Subsections DB and DC) rose sharply to
EUR 95.8 billion in 2005, the year of trade
liberalisation for many of these goods. This level
of imports represented 8.9 % of the value of all
imports of industrial goods (CPA
Sections C to E). Although the value of textiles,
clothing and leather goods’ exports also rose
sharply to EUR 49.8 billion, the EU-25’s trade
deficit in these goods widened to
EUR 46.0 billion in 2005. Much of the widening
in this deficit resulted from an increase in the
deficit for textile products (CPA Division 17) and
leather goods (CPA Division 19) to
EUR 7.3 billion and EUR 7.5 billion respectively
in 2005. Nevertheless, by far the largest deficit
(EUR 31.2 billion) remained for clothing
products (CPA Division 18).
The widening trade deficit may also be
explained by the rapid increase in the rate at
which imports from China arrived in the EU;
according to import statistics from the
European Commission’s Directorate General for
Trade, in the first nine months of 2005 the
volume of textiles and clothing goods from
China rose by 40 % and the value by 45 % in
current terms. Overall, China’s market share in
textiles, clothing and leather goods’ imports to
the EU-25 rose to 31.4 % in 2005.
The growth in imports of footwear to the
EU-25 from China and Vietnam is the subject of
anti-dumping measures. The value of imports
of footwear from China in 2005 was 170 %
higher in current prices than in 2004, reaching
EUR 4.8 billion. China and Vietnam have
tightened their grip on the EU’s footwear
market as their shares of EU-25 imports of
footwear were 39.1 % and 17.1 %
respectively.
Among the Member States, Italy had the
largest trade (intra- and extra-EU combined)
surplus (EUR 16.1 billion) in textiles, clothing
and leather goods in 2005. This surplus,
however, narrowed progressively between
2000 and 2005, for both extra-EU-25 partners
(EUR 3.7 billion in 2005) and intra-EU-25
partners (EUR 12.4 billion). Trade surpluses
recorded for Belgium (EUR 2.2 billion) and
Portugal (EUR 1.5 billion) also narrowed after
2000, although in the case of the former due to
a widening deficit in extra-EU-25 trade and in
the case of the latter principally due to a
narrowing of the intra-EU-25 trade surplus.
70
Chapter 3: textiles, clothing, leather and footwear NACE DB and DC
Table 3.4 ___________________________________________________________________________________________________________________________
Manufacture of textiles, clothing and leather products (NACE Subsections DB and DC)
Cost, productivity and profitability indicators, ranking of the top 5 Member States compared to EU-25 averages, 2003
(1) France, Hungary, Malta, Slovakia and Sweden, 2002; Belgium, Denmark, Greece, Cyprus, Latvia and Austria not available; EU-25 is an EU average based on availabledata for 2002 and 2003.(2) Hungary, Malta, Slovakia and Sweden, 2002; Denmark, Greece, Cyprus, Latvia and Austria not available; EU-25 is an EU average based on available data for 2002and 2003.(3) Hungary, Malta, Slovakia and Sweden, 2002; Denmark, Greece, Cyprus, Latvia and Austria not available; EU-25, rounded estimate based on non-confidential data.Source: Eurostat (SBS)
Rank
Investment in
tangible goods
relative to total
operating costs
(%) (1)
Purchases of goods
and services as a
share of total
operating costs
(%) (2)
Personnel costs as
a share of total
operating costs
(%) (2)
Apparent labour
productivity
(EUR thousand) (3)
Average
personnel costs
(EUR thousand) (3)
Wage adjusted
labour
productivity
(%) (3)
Gross
operating rate
(%) (3)
EU-25 3.4 78.7 21.3 24.0 20.0 130.0 8.4
1 Malta (8.3) Luxembourg (82.9) Slovakia (31.9) Luxembourg (223.9) Luxembourg (73.5) Luxembourg (304.6) Luxembourg (27.0)
2 Slovakia (8.0) Italy (82.1) Lithuania (31.5) Belgium (44.7) Netherlands (35.0) Malta (170.2) Malta (17.6)
3 Lithuania (6.2) Belgium (81.3) Hungary (29.8) Netherlands (44.2) Belgium (32.5) United Kingdom (153.6) United Kingdom (13.7)
4 Portugal (5.4) Poland (81.2) Malta (29.7) Germany (40.2) Sweden (32.0) Belgium (137.4) Poland (11.5)
5 Czech Republic (5.2) Slovenia (78.4) Finland (28.3) Finland (39.9) Germany (31.6) Estonia (135.2) Finland (11.4)
Table 3.5 ___________________________________________________________________________________________________________________________
Textiles and textile products; leather and leather products (CPA Subsections DB and DC)
External trade, EU-25, 2005
Source: Eurostat (Comext)
Extra-EU
exports
(EUR million)
Share of EU
industrial
exports (%)
Extra-EU
imports
(EUR million)
Share of EU
industrial
imports (%)
Trade
balance
(EUR million)
Cover
ratio
(%)
Textiles, clothing and leather products 49 760 5.0 95 794 8.9 -46 034 51.9
Textiles 23 121 2.3 30 464 2.8 -7 343 75.9
Clothing 14 516 1.5 45 754 4.2 -31 238 31.7
Leather 12 123 1.2 19 576 1.8 -7 453 61.9
(4) Hungary, Malta, Slovakia and Sweden, 2002;Denmark, Greece, Ireland, Cyprus, Latvia, andAustria, not available.
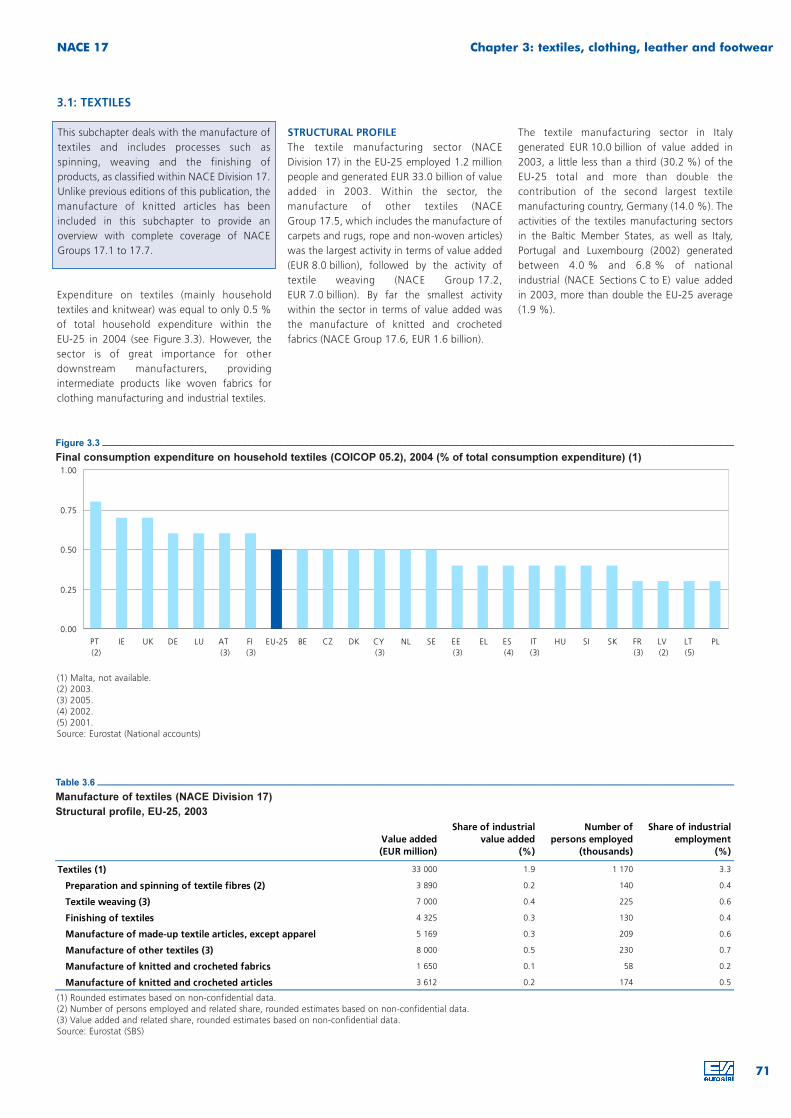
3.1: TEXTILES
Expenditure on textiles (mainly household
textiles and knitwear) was equal to only 0.5 %
of total household expenditure within the
EU-25 in 2004 (see Figure 3.3). However, the
sector is of great importance for other
downstream manufacturers, providing
intermediate products like woven fabrics for
clothing manufacturing and industrial textiles.
STRUCTURAL PROFILE
The textile manufacturing sector (NACE
Division 17) in the EU-25 employed 1.2 million
people and generated EUR 33.0 billion of value
added in 2003. Within the sector, the
manufacture of other textiles (NACE
Group 17.5, which includes the manufacture of
carpets and rugs, rope and non-woven articles)
was the largest activity in terms of value added
(EUR 8.0 billion), followed by the activity of
textile weaving (NACE Group 17.2,
EUR 7.0 billion). By far the smallest activity
within the sector in terms of value added was
the manufacture of knitted and crocheted
fabrics (NACE Group 17.6, EUR 1.6 billion).
The textile manufacturing sector in Italy
generated EUR 10.0 billion of value added in
2003, a little less than a third (30.2 %) of the
EU-25 total and more than double the
contribution of the second largest textile
manufacturing country, Germany (14.0 %). The
activities of the textiles manufacturing sectors
in the Baltic Member States, as well as Italy,
Portugal and Luxembourg (2002) generated
between 4.0 % and 6.8 % of national
industrial (NACE Sections C to E) value added
in 2003, more than double the EU-25 average
(1.9 %).
71
NACE 17 Chapter 3: textiles, clothing, leather and footwear
This subchapter deals with the manufacture of
textiles and includes processes such as
spinning, weaving and the finishing of
products, as classified within NACE Division 17.
Unlike previous editions of this publication, the
manufacture of knitted articles has been
included in this subchapter to provide an
overview with complete coverage of NACE
Groups 17.1 to 17.7.
Figure 3.3 __________________________________________________________________________________________________________________________
Final consumption expenditure on household textiles (COICOP 05.2), 2004 (% of total consumption expenditure) (1)
(1) Malta, not available.(2) 2003.(3) 2005.(4) 2002.(5) 2001.Source: Eurostat (National accounts)
0.00
0.25
0.50
0.75
1.00
PT
(2)
IE UK DE LU AT
(3)
FI
(3)
EU-25 BE CZ DK CY
(3)
NL SE EE
(3)
EL ES
(4)
IT
(3)
HU SI SK FR
(3)
LV
(2)
LT
(5)
PL
Table 3.6 ___________________________________________________________________________________________________________________________
Manufacture of textiles (NACE Division 17)
Structural profile, EU-25, 2003
(1) Rounded estimates based on non-confidential data.(2) Number of persons employed and related share, rounded estimates based on non-confidential data.(3) Value added and related share, rounded estimates based on non-confidential data.Source: Eurostat (SBS)
Value added
(EUR million)
Share of industrial
value added
(%)
Number of
persons employed
(thousands)
Share of industrial
employment
(%)
Textiles (1) 33 000 1.9 1 170 3.3
Preparation and spinning of textile fibres (2) 3 890 0.2 140 0.4
Textile weaving (3) 7 000 0.4 225 0.6
Finishing of textiles 4 325 0.3 130 0.4
Manufacture of made-up textile articles, except apparel 5 169 0.3 209 0.6
Manufacture of other textiles (3) 8 000 0.5 230 0.7
Manufacture of knitted and crocheted fabrics 1 650 0.1 58 0.2
Manufacture of knitted and crocheted articles 3 612 0.2 174 0.5
During the period 1995 to 2005, there were
two distinct developments in the production
index of the EU-25’s textiles manufacturing
activity. Between 1995 and 2000, there was a
relatively small decline in output compared with
that for textiles, clothing and leather
manufacturing (NACE Subsections DB and DC)
as a whole, with rises in 1997 and 2000
partially offsetting declines in other years. After
2000, however, there was a steady and steep
decline in the production index of textiles
manufacturing (an average rate of 4.2 % per
annum), a pattern reflected within six of the
seven NACE groups covered by this subchapter
(the exception being the output of other
72
Chapter 3: textiles, clothing, leather and footwear NACE 17
Table 3.7 ___________________________________________________________________________________________________________________________
Manufacture of textiles (NACE Division 17)
Value added and employment: ranking of the top 5 Member States, 2003
(1) Luxembourg, Hungary, Malta and Sweden, 2002; Greece, not available.(2) Sweden, provisional; Luxembourg, Hungary and Malta, 2002; Greece, not available.(3) Luxembourg, Hungary, Malta and Sweden, 2002; Greece and Ireland, not available.(4) Sweden, provisional; Luxembourg, Hungary and Malta, 2002; Greece and Ireland, not available.Source: Eurostat (SBS)
Rank
Highest
value added
(EUR million) (1)
Share in EU-25
value added
(%) (1)
Highest number of
persons employed
(thousands) (2)
Share in EU-25
employment
(%) (2)
Highest share of
national industrial
value added
(%) (3)
Highest share of
national industrial
employment
(%) (4)
1 Italy (9 982.3) 30.2 Italy (285.9) 24.4 Luxembourg (6.8) Portugal (9.4)
2 Germany (4 631.8) 14.0 Germany (116.8) 10.0 Portugal (5.7) Estonia (7.9)
3 United Kingdom (3 828.0) 11.6 Spain (105.0) 9.0 Estonia (5.5) Lithuania (6.4)
4 France (3 756.5) 11.4 France (104.8) 9.0 Italy (4.5) Belgium (5.9)
5 Spain (2 905.9) 8.8 United Kingdom (101.9) 8.7 Lithuania (4.2) Latvia (5.8)
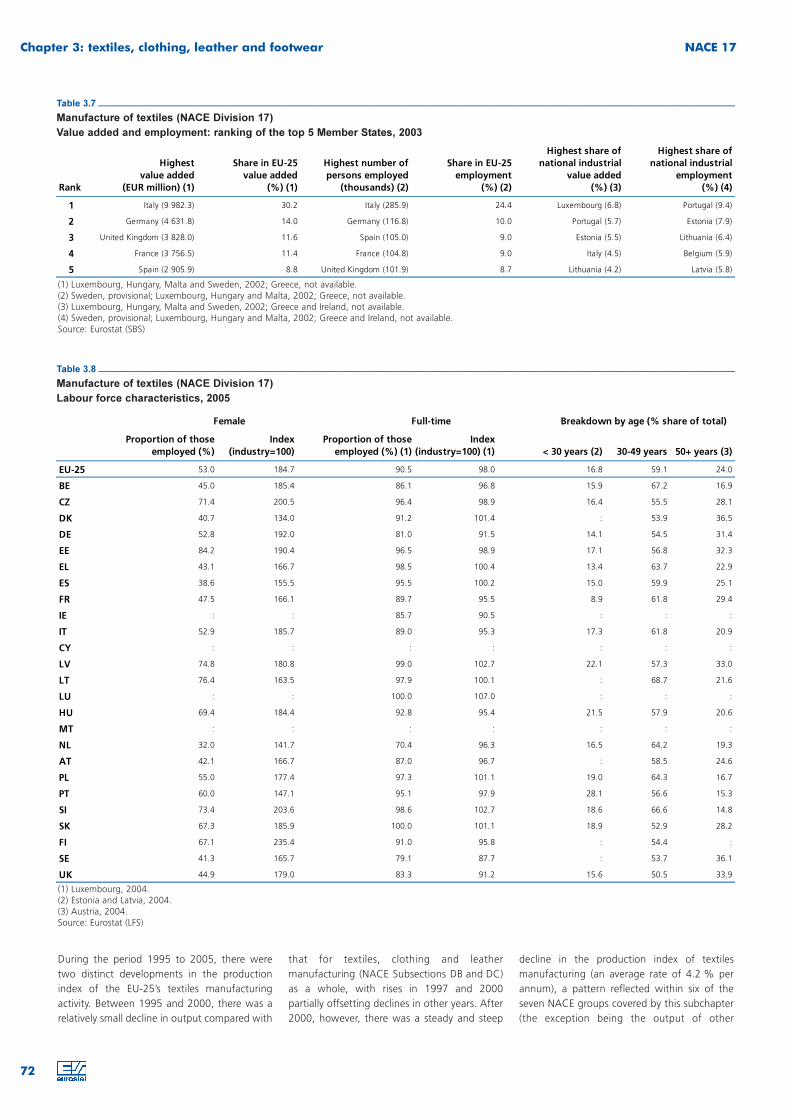
Table 3.8 ___________________________________________________________________________________________________________________________
Manufacture of textiles (NACE Division 17)
Labour force characteristics, 2005
(1) Luxembourg, 2004.(2) Estonia and Latvia, 2004.(3) Austria, 2004.Source: Eurostat (LFS)
Proportion of those
employed (%)
Index
(industry=100)
Proportion of those
employed (%) (1)
Index
(industry=100) (1) < 30 years (2) 30-49 years 50+ years (3)
EU-25 53.0 184.7 90.5 98.0 16.8 59.1 24.0
BE 45.0 185.4 86.1 96.8 15.9 67.2 16.9
CZ 71.4 200.5 96.4 98.9 16.4 55.5 28.1
DK 40.7 134.0 91.2 101.4 : 53.9 36.5
DE 52.8 192.0 81.0 91.5 14.1 54.5 31.4
EE 84.2 190.4 96.5 98.9 17.1 56.8 32.3
EL 43.1 166.7 98.5 100.4 13.4 63.7 22.9
ES 38.6 155.5 95.5 100.2 15.0 59.9 25.1
FR 47.5 166.1 89.7 95.5 8.9 61.8 29.4
IE : : 85.7 90.5 : : :
IT 52.9 185.7 89.0 95.3 17.3 61.8 20.9
CY : : : : : : :
LV 74.8 180.8 99.0 102.7 22.1 57.3 33.0
LT 76.4 163.5 97.9 100.1 : 68.7 21.6
LU : : 100.0 107.0 : : :
HU 69.4 184.4 92.8 95.4 21.5 57.9 20.6
MT : : : : : : :
NL 32.0 141.7 70.4 96.3 16.5 64.2 19.3
AT 42.1 166.7 87.0 96.7 : 58.5 24.6
PL 55.0 177.4 97.3 101.1 19.0 64.3 16.7
PT 60.0 147.1 95.1 97.9 28.1 56.6 15.3
SI 73.4 203.6 98.6 102.7 18.6 66.6 14.8
SK 67.3 185.9 100.0 101.1 18.9 52.9 28.2
FI 67.1 235.4 91.0 95.8 : 54.4 :
SE 41.3 165.7 79.1 87.7 : 53.7 36.1
UK 44.9 179.0 83.3 91.2 15.6 50.5 33.9
Female Full-time Breakdown by age (% share of total)
textiles – NACE Group 17.5 – which declined at
a much slower rate). Nevertheless, the decline
in the output of textiles after 2000 was slower
than for textiles, clothing and leather
manufacturing as a whole, where the index of
production fell on average by 5.7 % per annum
during the period 2000 to 2005.
Although the majority of the workforce in the
textiles manufacturing sector were women
(53.0 % in 2005), the proportion was less than
that for textiles, clothing and leather
manufacturing as a whole (64.5 %). In the
Baltic Member States, as well as the Czech
Republic, Slovenia and Hungary the female
proportion of the textiles workforce remained
at or above 70 % of the total workforce.
COSTS, PRODUCTIVITY AND
PROFITABILITY
The apparent labour productivity of the EU-25’s
textiles manufacturing sector (NACE
Division 17) was EUR 29 000 per person
employed on average across the EU-25 in 2003.
Within the sector, there was a significant spread
in apparent labour productivity among the
seven NACE groups that make up the sector;
the lowest level (EUR 20 800 per person) being
recorded for the manufacture of knitted and
crocheted articles (NACE Group 17.7) and the
highest (EUR 35 800, EU (5) average) for the
manufacture of other textiles (NACE
Group 17.5).
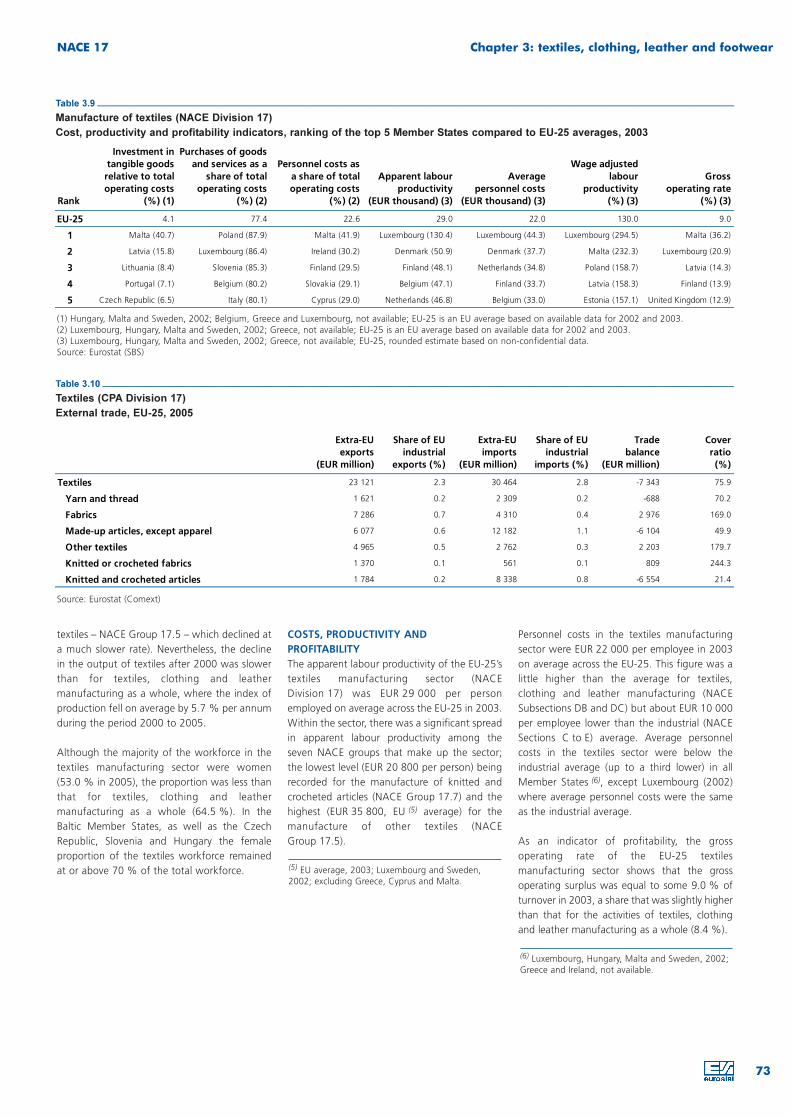
Personnel costs in the textiles manufacturing
sector were EUR 22 000 per employee in 2003
on average across the EU-25. This figure was a
little higher than the average for textiles,
clothing and leather manufacturing (NACE
Subsections DB and DC) but about EUR 10 000
per employee lower than the industrial (NACE
Sections C to E) average. Average personnel
costs in the textiles sector were below the
industrial average (up to a third lower) in all
Member States (6), except Luxembourg (2002)
where average personnel costs were the same
as the industrial average.
As an indicator of profitability, the gross
operating rate of the EU-25 textiles
manufacturing sector shows that the gross
operating surplus was equal to some 9.0 % of
turnover in 2003, a share that was slightly higher
than that for the activities of textiles, clothing
and leather manufacturing as a whole (8.4 %).
73
NACE 17 Chapter 3: textiles, clothing, leather and footwear
Table 3.9 ___________________________________________________________________________________________________________________________
Manufacture of textiles (NACE Division 17)
Cost, productivity and profitability indicators, ranking of the top 5 Member States compared to EU-25 averages, 2003
(1) Hungary, Malta and Sweden, 2002; Belgium, Greece and Luxembourg, not available; EU-25 is an EU average based on available data for 2002 and 2003.(2) Luxembourg, Hungary, Malta and Sweden, 2002; Greece, not available; EU-25 is an EU average based on available data for 2002 and 2003.(3) Luxembourg, Hungary, Malta and Sweden, 2002; Greece, not available; EU-25, rounded estimate based on non-confidential data.Source: Eurostat (SBS)
Rank
Investment in
tangible goods
relative to total
operating costs
(%) (1)
Purchases of goods
and services as a
share of total
operating costs
(%) (2)
Personnel costs as
a share of total
operating costs
(%) (2)
Apparent labour
productivity
(EUR thousand) (3)
Average
personnel costs
(EUR thousand) (3)
Wage adjusted
labour
productivity
(%) (3)
Gross
operating rate
(%) (3)
EU-25 4.1 77.4 22.6 29.0 22.0 130.0 9.0
1 Malta (40.7) Poland (87.9) Malta (41.9) Luxembourg (130.4) Luxembourg (44.3) Luxembourg (294.5) Malta (36.2)
2 Latvia (15.8) Luxembourg (86.4) Ireland (30.2) Denmark (50.9) Denmark (37.7) Malta (232.3) Luxembourg (20.9)
3 Lithuania (8.4) Slovenia (85.3) Finland (29.5) Finland (48.1) Netherlands (34.8) Poland (158.7) Latvia (14.3)
4 Portugal (7.1) Belgium (80.2) Slovakia (29.1) Belgium (47.1) Finland (33.7) Latvia (158.3) Finland (13.9)
5 Czech Republic (6.5) Italy (80.1) Cyprus (29.0) Netherlands (46.8) Belgium (33.0) Estonia (157.1) United Kingdom (12.9)
Table 3.10 __________________________________________________________________________________________________________________________
Textiles (CPA Division 17)
External trade, EU-25, 2005
Source: Eurostat (Comext)
Extra-EU
exports
(EUR million)
Share of EU
industrial
exports (%)
Extra-EU
imports
(EUR million)
Share of EU
industrial
imports (%)
Trade
balance
(EUR million)
Cover
ratio
(%)
Textiles 23 121 2.3 30 464 2.8 -7 343 75.9
Yarn and thread 1 621 0.2 2 309 0.2 -688 70.2
Fabrics 7 286 0.7 4 310 0.4 2 976 169.0
Made-up articles, except apparel 6 077 0.6 12 182 1.1 -6 104 49.9
Other textiles 4 965 0.5 2 762 0.3 2 203 179.7
Knitted or crocheted fabrics 1 370 0.1 561 0.1 809 244.3
Knitted and crocheted articles 1 784 0.2 8 338 0.8 -6 554 21.4
(5) EU average, 2003; Luxembourg and Sweden,2002; excluding Greece, Cyprus and Malta.
(6) Luxembourg, Hungary, Malta and Sweden, 2002;Greece and Ireland, not available.
EXTERNAL TRADE
Extra-EU-25 trade of textile products (CPA
Groups 17.1 to 17.7) increased considerably in
2005: the value of extra-EU exports rose sharply
to EUR 23.1 billion and the value of extra-EU
imports, particularly from China (see
Table 3.11), even more to EUR 30.5 billion. The
widening of the trade deficit for textile
products as a whole to EUR 7.3 billion in 2005
from EUR 4.6 billion in 2004 is explained largely
by the EUR 2.0 billion widening of the trade
deficit (to EUR 6.1 billion in 2005) for made-up
articles, except apparel (CPA Group 17.4). The
value of imports of made-up articles, except
apparel more than doubled to EUR 12.2 billion.
The largest trade deficit, however, among the
seven CPA groups within this subchapter was
EUR 6.6 billion for knitted and crocheted
articles (CPA Group 17.7).
In contrast, the EU-25’s trade surplus for other
textiles n.e.c. (CPA Group 17.5) continued to
grow, doubling from its 2000 level to
EUR 2.2 billion in 2005, principally from the fall
in the value of imports of carpets and rugs.
Woven textile products (CPA Group 17.2) had
the largest trade surplus (EUR 3.0 billion),
however, among the textile products groups
that make up this CPA division. The trade
surplus in woven textile products in 2005 was
markedly lower, nevertheless, than its recent
peak level (recorded in 2002), as a result of a
sharp decline in extra-EU exports.
The value of textile product exports from Italy
(EUR 12.5 billion) and the United Kingdom
(EUR 12.4 billion) were higher than for any
other Member State in 2005 and represented a
joint 38.3 % share of EU-25 Member States’
exports (intra- and extra-EU-25). In the case of
the United Kingdom, the value of exports to
non-member countries was one half (49.9 %)
of the value of total textile exports, a slightly
higher proportion that in the case of Italy
(43.3 %).
The United Kingdom was also the largest
importer of textile products (EUR 17.1 billion),
accounting for one quarter (25.0 %) of EU-25
imports, considerably more than the next highest
share, which was for Germany (15.9 %). Italy
registered the largest trade surplus
(EUR 6.0 billion) for textile products among the
Member States, with Belgium being the only
other Member State with a significant trade
surplus (EUR 2.2 billion). In contrast, the United
Kingdom recorded by far the largest trade deficit
(EUR 4.7 billion) in these products in 2005.
3.2: CLOTHING
The market for clothing within the EU has often
been considered as mature. However, this
perception is changing as EU-25 clothing
manufacturers try to respond to the challenges
posed by greater global competition, changing
consumer patterns as the EU-25 population
ages, and the number of households (particularly
single person ones) grows, and a falling
proportion of household expenditure spent on
clothing (down from 5.5 % in 1995 to 4.9 % in
2004) at a time when prices have been falling.
Clothing manufacturers within the EU-25 are
looking to harness new production techniques
and develop innovative, new, value added
products (incorporating new yarn forms and
fibres that may respond to elements like light,
74
Chapter 3: textiles, clothing, leather and footwear NACE 17; NACE 18
This subchapter contains information on
various clothing manufacturing activities
(hereafter referred to as clothing
manufacturing), as defined by NACE
Division 18: the manufacture of leather
clothes, work wear, outerwear, underwear, and
articles of fur.
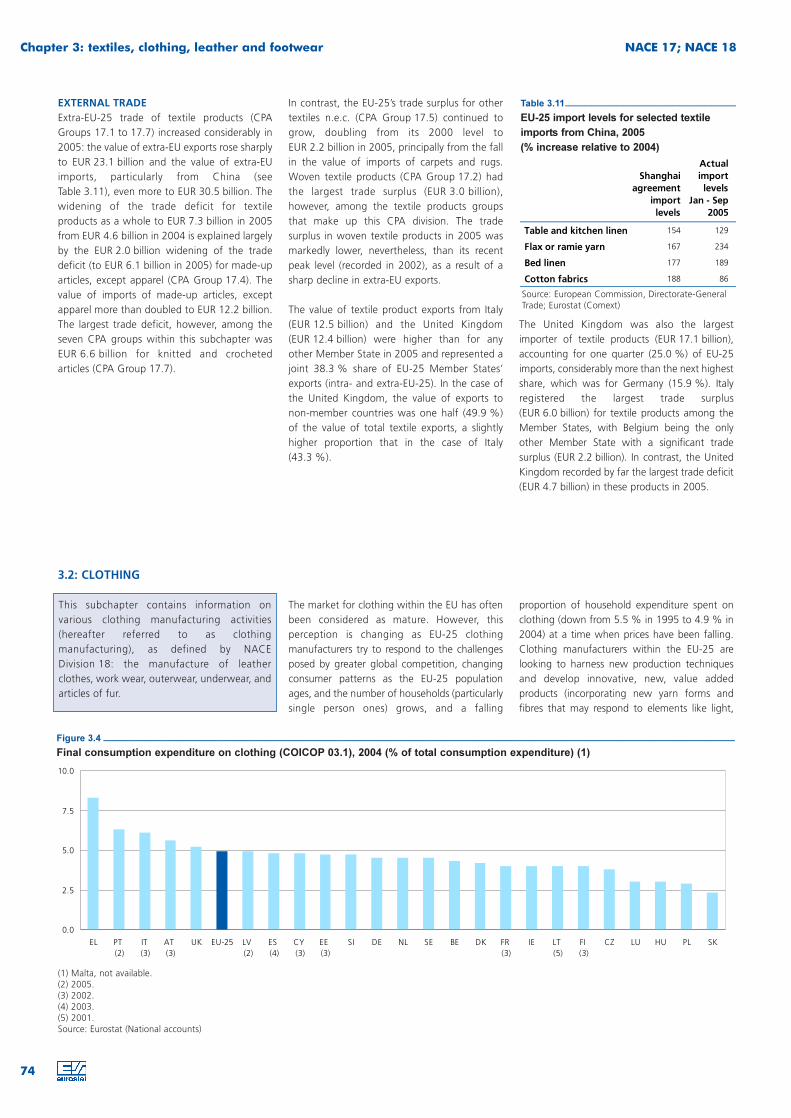
Table 3.11_________________________________
EU-25 import levels for selected textile
imports from China, 2005
(% increase relative to 2004)
Source: European Commission, Directorate-GeneralTrade; Eurostat (Comext)
Shanghai
agreement
import
levels
Actual
import
levels
Jan - Sep
2005
Table and kitchen linen 154 129
Flax or ramie yarn 167 234
Bed linen 177 189
Cotton fabrics 188 86
Figure 3.4 __________________________________________________________________________________________________________________________
Final consumption expenditure on clothing (COICOP 03.1), 2004 (% of total consumption expenditure) (1)
(1) Malta, not available.(2) 2005.(3) 2002.(4) 2003.(5) 2001.Source: Eurostat (National accounts)
0.0
2.5
5.0
7.5
10.0
EL PT
(2)
IT
(3)
AT
(3)
UK EU-25 LV
(2)
ES
(4)
CY
(3)
EE
(3)
SI DE NL SE BE DK FR
(3)
IE LT
(5)
FI
(3)
CZ LU HU PL SK
heat, humidity, bacteria - so-called ‘smart’
clothes - or conduct electric currents that could
provide a range of services - so called ‘intelligent’
clothes) for different segments of the market as
a way of meeting these challenges.
STRUCTURAL PROFILE
The clothing manufacturing sector (NACE
Division 18) in the EU-25 generated
EUR 22.1 billion of value added in 2003, which
represented almost one third (33.1 %) of the
value added generated by the activities of
textiles, clothing and leather manufacturing as
a whole (NACE Subsections DB and DC). The
sector is dominated by the manufacture of
other wearing apparel and accessories (NACE
Group 18.2), which provided almost all
(96.8 %) of the value added generated within
the sector and almost all (97.0 %) of the
1.2 million people in the workforce of the
sector. The remaining activities of the
manufacture of leather clothes (NACE
Group 18.1) and dressing and dyeing of fur;
manufacture of articles of fur (NACE
Group 18.3) were of similar, small size in terms
of their respective workforces and value added.
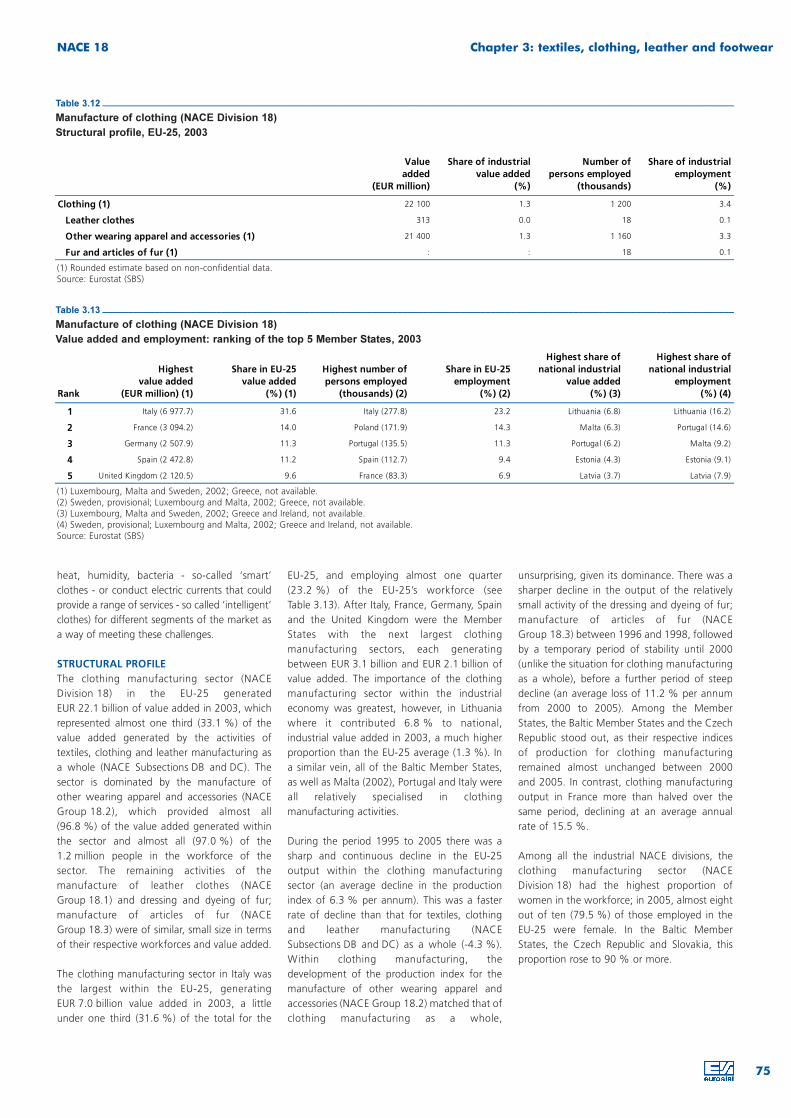
The clothing manufacturing sector in Italy was
the largest within the EU-25, generating
EUR 7.0 billion value added in 2003, a little
under one third (31.6 %) of the total for the
EU-25, and employing almost one quarter
(23.2 %) of the EU-25’s workforce (see
Table 3.13). After Italy, France, Germany, Spain
and the United Kingdom were the Member
States with the next largest clothing
manufacturing sectors, each generating
between EUR 3.1 billion and EUR 2.1 billion of
value added. The importance of the clothing
manufacturing sector within the industrial
economy was greatest, however, in Lithuania
where it contributed 6.8 % to national,
industrial value added in 2003, a much higher
proportion than the EU-25 average (1.3 %). In
a similar vein, all of the Baltic Member States,
as well as Malta (2002), Portugal and Italy were
all relatively specialised in clothing
manufacturing activities.
During the period 1995 to 2005 there was a
sharp and continuous decline in the EU-25
output within the clothing manufacturing
sector (an average decline in the production
index of 6.3 % per annum). This was a faster
rate of decline than that for textiles, clothing
and leather manufacturing (NACE
Subsections DB and DC) as a whole (-4.3 %).
Within clothing manufacturing, the
development of the production index for the
manufacture of other wearing apparel and
accessories (NACE Group 18.2) matched that of
clothing manufacturing as a whole,
unsurprising, given its dominance. There was a
sharper decline in the output of the relatively
small activity of the dressing and dyeing of fur;
manufacture of articles of fur (NACE
Group 18.3) between 1996 and 1998, followed
by a temporary period of stability until 2000
(unlike the situation for clothing manufacturing
as a whole), before a further period of steep
decline (an average loss of 11.2 % per annum
from 2000 to 2005). Among the Member
States, the Baltic Member States and the Czech
Republic stood out, as their respective indices
of production for clothing manufacturing
remained almost unchanged between 2000
and 2005. In contrast, clothing manufacturing
output in France more than halved over the
same period, declining at an average annual
rate of 15.5 %.
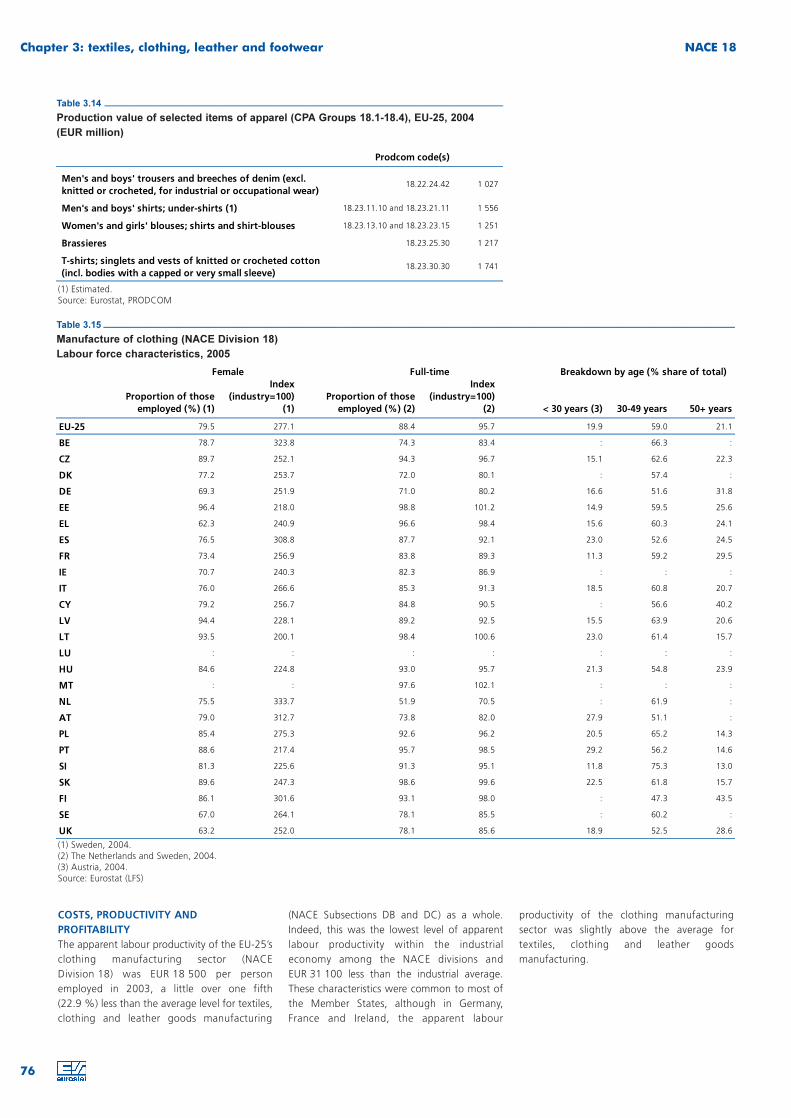
Among all the industrial NACE divisions, the
clothing manufacturing sector (NACE
Division 18) had the highest proportion of
women in the workforce; in 2005, almost eight
out of ten (79.5 %) of those employed in the
EU-25 were female. In the Baltic Member
States, the Czech Republic and Slovakia, this
proportion rose to 90 % or more.
75
NACE 18 Chapter 3: textiles, clothing, leather and footwear
Table 3.12 __________________________________________________________________________________________________________________________
Manufacture of clothing (NACE Division 18)
Structural profile, EU-25, 2003
(1) Rounded estimate based on non-confidential data.Source: Eurostat (SBS)
Value
added
(EUR million)
Share of industrial
value added
(%)
Number of
persons employed
(thousands)
Share of industrial
employment
(%)
Clothing (1) 22 100 1.3 1 200 3.4
Leather clothes 313 0.0 18 0.1
Other wearing apparel and accessories (1) 21 400 1.3 1 160 3.3
Fur and articles of fur (1) : : 18 0.1
Table 3.13 __________________________________________________________________________________________________________________________
Manufacture of clothing (NACE Division 18)
Value added and employment: ranking of the top 5 Member States, 2003
(1) Luxembourg, Malta and Sweden, 2002; Greece, not available.(2) Sweden, provisional; Luxembourg and Malta, 2002; Greece, not available.(3) Luxembourg, Malta and Sweden, 2002; Greece and Ireland, not available.(4) Sweden, provisional; Luxembourg and Malta, 2002; Greece and Ireland, not available.Source: Eurostat (SBS)
Rank
Highest
value added
(EUR million) (1)
Share in EU-25
value added
(%) (1)
Highest number of
persons employed
(thousands) (2)
Share in EU-25
employment
(%) (2)
Highest share of
national industrial
value added
(%) (3)
Highest share of
national industrial
employment
(%) (4)
1 Italy (6 977.7) 31.6 Italy (277.8) 23.2 Lithuania (6.8) Lithuania (16.2)
2 France (3 094.2) 14.0 Poland (171.9) 14.3 Malta (6.3) Portugal (14.6)
3 Germany (2 507.9) 11.3 Portugal (135.5) 11.3 Portugal (6.2) Malta (9.2)
4 Spain (2 472.8) 11.2 Spain (112.7) 9.4 Estonia (4.3) Estonia (9.1)
5 United Kingdom (2 120.5) 9.6 France (83.3) 6.9 Latvia (3.7) Latvia (7.9)
COSTS, PRODUCTIVITY AND
PROFITABILITY
The apparent labour productivity of the EU-25’s
clothing manufacturing sector (NACE
Division 18) was EUR 18 500 per person
employed in 2003, a little over one fifth
(22.9 %) less than the average level for textiles,
clothing and leather goods manufacturing
(NACE Subsections DB and DC) as a whole.
Indeed, this was the lowest level of apparent
labour productivity within the industrial
economy among the NACE divisions and
EUR 31 100 less than the industrial average.
These characteristics were common to most of
the Member States, although in Germany,
France and Ireland, the apparent labour
productivity of the clothing manufacturing
sector was slightly above the average for
textiles, clothing and leather goods
manufacturing.
76
Chapter 3: textiles, clothing, leather and footwear NACE 18
Table 3.14 _____________________________________________________________________________
Production value of selected items of apparel (CPA Groups 18.1-18.4), EU-25, 2004
(EUR million)
(1) Estimated.Source: Eurostat, PRODCOM
Prodcom code(s)
Men's and boys' trousers and breeches of denim (excl.
knitted or crocheted, for industrial or occupational wear)18.22.24.42 1 027
Men's and boys' shirts; under-shirts (1) 18.23.11.10 and 18.23.21.11 1 556
Women's and girls' blouses; shirts and shirt-blouses 18.23.13.10 and 18.23.23.15 1 251
Brassieres 18.23.25.30 1 217
T-shirts; singlets and vests of knitted or crocheted cotton
(incl. bodies with a capped or very small sleeve)18.23.30.30 1 741
Table 3.15 __________________________________________________________________________________________________________________________
Manufacture of clothing (NACE Division 18)
Labour force characteristics, 2005
(1) Sweden, 2004.(2) The Netherlands and Sweden, 2004.(3) Austria, 2004.Source: Eurostat (LFS)
Proportion of those
employed (%) (1)
Index
(industry=100)
(1)
Proportion of those
employed (%) (2)
Index
(industry=100)
(2) < 30 years (3) 30-49 years 50+ years
EU-25 79.5 277.1 88.4 95.7 19.9 59.0 21.1
BE 78.7 323.8 74.3 83.4 : 66.3 :
CZ 89.7 252.1 94.3 96.7 15.1 62.6 22.3
DK 77.2 253.7 72.0 80.1 : 57.4 :
DE 69.3 251.9 71.0 80.2 16.6 51.6 31.8
EE 96.4 218.0 98.8 101.2 14.9 59.5 25.6
EL 62.3 240.9 96.6 98.4 15.6 60.3 24.1
ES 76.5 308.8 87.7 92.1 23.0 52.6 24.5
FR 73.4 256.9 83.8 89.3 11.3 59.2 29.5
IE 70.7 240.3 82.3 86.9 : : :
IT 76.0 266.6 85.3 91.3 18.5 60.8 20.7
CY 79.2 256.7 84.8 90.5 : 56.6 40.2
LV 94.4 228.1 89.2 92.5 15.5 63.9 20.6
LT 93.5 200.1 98.4 100.6 23.0 61.4 15.7
LU : : : : : : :
HU 84.6 224.8 93.0 95.7 21.3 54.8 23.9
MT : : 97.6 102.1 : : :
NL 75.5 333.7 51.9 70.5 : 61.9 :
AT 79.0 312.7 73.8 82.0 27.9 51.1 :
PL 85.4 275.3 92.6 96.2 20.5 65.2 14.3
PT 88.6 217.4 95.7 98.5 29.2 56.2 14.6
SI 81.3 225.6 91.3 95.1 11.8 75.3 13.0
SK 89.6 247.3 98.6 99.6 22.5 61.8 15.7
FI 86.1 301.6 93.1 98.0 : 47.3 43.5
SE 67.0 264.1 78.1 85.5 : 60.2 :
UK 63.2 252.0 78.1 85.6 18.9 52.5 28.6
Female Full-time Breakdown by age (% share of total)
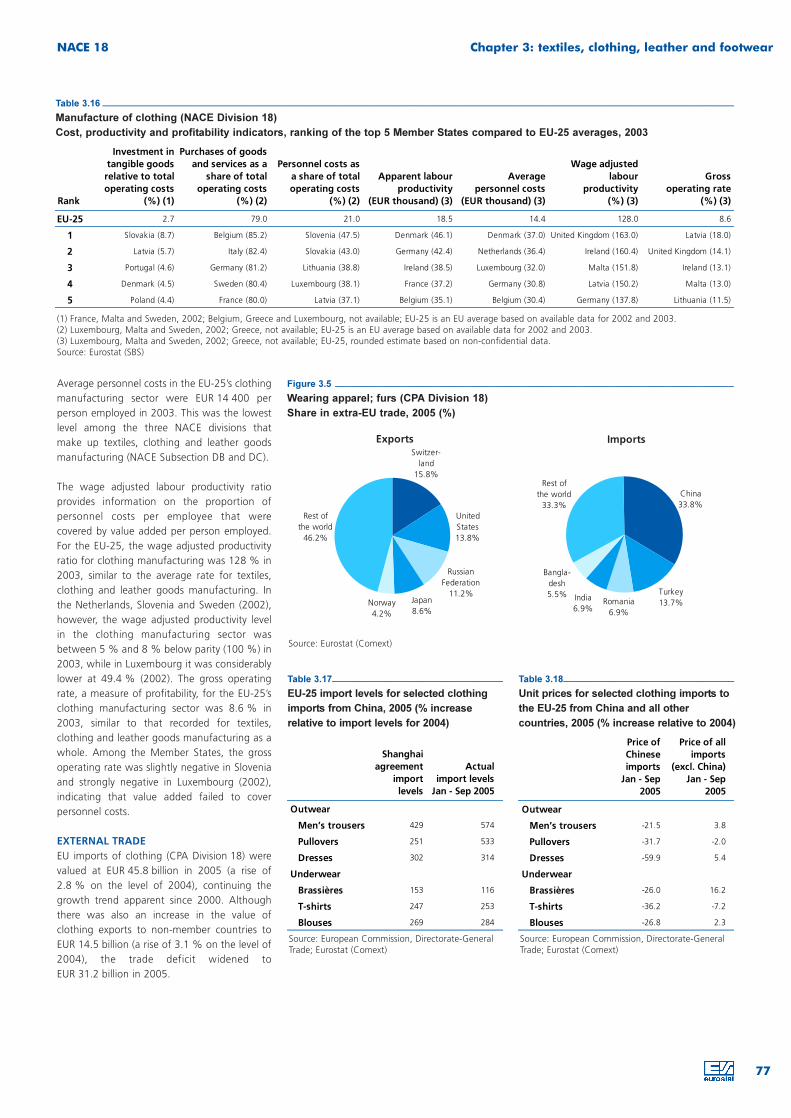
Average personnel costs in the EU-25’s clothing
manufacturing sector were EUR 14 400 per
person employed in 2003. This was the lowest
level among the three NACE divisions that
make up textiles, clothing and leather goods
manufacturing (NACE Subsection DB and DC).
The wage adjusted labour productivity ratio
provides information on the proportion of
personnel costs per employee that were
covered by value added per person employed.
For the EU-25, the wage adjusted productivity
ratio for clothing manufacturing was 128 % in
2003, similar to the average rate for textiles,
clothing and leather goods manufacturing. In
the Netherlands, Slovenia and Sweden (2002),
however, the wage adjusted productivity level
in the clothing manufacturing sector was
between 5 % and 8 % below parity (100 %) in
2003, while in Luxembourg it was considerably
lower at 49.4 % (2002). The gross operating
rate, a measure of profitability, for the EU-25’s
clothing manufacturing sector was 8.6 % in
2003, similar to that recorded for textiles,
clothing and leather goods manufacturing as a
whole. Among the Member States, the gross
operating rate was slightly negative in Slovenia
and strongly negative in Luxembourg (2002),
indicating that value added failed to cover
personnel costs.
EXTERNAL TRADE
EU imports of clothing (CPA Division 18) were
valued at EUR 45.8 billion in 2005 (a rise of
2.8 % on the level of 2004), continuing the
growth trend apparent since 2000. Although
there was also an increase in the value of
clothing exports to non-member countries to
EUR 14.5 billion (a rise of 3.1 % on the level of
2004), the trade deficit widened to
EUR 31.2 billion in 2005.
77
NACE 18 Chapter 3: textiles, clothing, leather and footwear
Table 3.16 __________________________________________________________________________________________________________________________
Manufacture of clothing (NACE Division 18)
Cost, productivity and profitability indicators, ranking of the top 5 Member States compared to EU-25 averages, 2003
(1) France, Malta and Sweden, 2002; Belgium, Greece and Luxembourg, not available; EU-25 is an EU average based on available data for 2002 and 2003.(2) Luxembourg, Malta and Sweden, 2002; Greece, not available; EU-25 is an EU average based on available data for 2002 and 2003.(3) Luxembourg, Malta and Sweden, 2002; Greece, not available; EU-25, rounded estimate based on non-confidential data.Source: Eurostat (SBS)
Rank
Investment in
tangible goods
relative to total
operating costs
(%) (1)
Purchases of goods
and services as a
share of total
operating costs
(%) (2)
Personnel costs as
a share of total
operating costs
(%) (2)
Apparent labour
productivity
(EUR thousand) (3)
Average
personnel costs
(EUR thousand) (3)
Wage adjusted
labour
productivity
(%) (3)
Gross
operating rate
(%) (3)
EU-25 2.7 79.0 21.0 18.5 14.4 128.0 8.6
1 Slovakia (8.7) Belgium (85.2) Slovenia (47.5) Denmark (46.1) Denmark (37.0) United Kingdom (163.0) Latvia (18.0)
2 Latvia (5.7) Italy (82.4) Slovakia (43.0) Germany (42.4) Netherlands (36.4) Ireland (160.4) United Kingdom (14.1)
3 Portugal (4.6) Germany (81.2) Lithuania (38.8) Ireland (38.5) Luxembourg (32.0) Malta (151.8) Ireland (13.1)
4 Denmark (4.5) Sweden (80.4) Luxembourg (38.1) France (37.2) Germany (30.8) Latvia (150.2) Malta (13.0)
5 Poland (4.4) France (80.0) Latvia (37.1) Belgium (35.1) Belgium (30.4) Germany (137.8) Lithuania (11.5)
Figure 3.5 _____________________________________________________________________________
Wearing apparel; furs (CPA Division 18)
Share in extra-EU trade, 2005 (%)
Source: Eurostat (Comext)
Japan
8.6%Norway
4.2%
Rest of
the world
46.2%
Russian
Federation
11.2%
United
States
13.8%
Switzer-
land
15.8%
China
33.8%
Turkey
13.7%Romania
6.9%
Rest of
the world
33.3%
India
6.9%
Bangla-
desh
5.5%
Exports Imports
Table 3.17_________________________________
EU-25 import levels for selected clothing
imports from China, 2005 (% increase
relative to import levels for 2004)
Source: European Commission, Directorate-GeneralTrade; Eurostat (Comext)
Shanghai
agreement
import
levels
Actual
import levels
Jan - Sep 2005
Outwear
Men’s trousers 429 574
Pullovers 251 533
Dresses 302 314
Underwear
Brassières 153 116
T-shirts 247 253
Blouses 269 284
Table 3.18_________________________________
Unit prices for selected clothing imports to
the EU-25 from China and all other
countries, 2005 (% increase relative to 2004)
Source: European Commission, Directorate-GeneralTrade; Eurostat (Comext)
Price of
Chinese
imports
Jan - Sep
2005
Price of all
imports
(excl. China)
Jan - Sep
2005
Outwear
Men’s trousers -21.5 3.8
Pullovers -31.7 -2.0
Dresses -59.9 5.4
Underwear
Brassières -26.0 16.2
T-shirts -36.2 -7.2
Blouses -26.8 2.3
At a more detailed level, the largest clothing
trade deficits (at the CPA class level) in 2005
were recorded for outwear (CPA Class 18.22)
and underwear (CPA Class 18.23), where
deficits reached EUR 14.4 billion and
EUR 12.9 billion respectively.
Italy recorded a trade surplus of EUR 4.1 billion
for clothing products in 2005, by far the largest
among the Member States. The next highest
trade surpluses were registered for Portugal
and Poland at EUR 0.8 billion. There were also
smaller surpluses in most of the Member States
that joined the EU in 2004 (the Czech Republic
and Cyprus being the exceptions).
The relatively modest change in the value of
clothing imports to the EU-25 from
non-member countries masks not only a stark
change in the source of those imports but also
considerable changes in volumes and unit
prices. Clothing imports to the EU-25 from
China accounted for 34 % of the market in
2005, reaching the share that the Chinese
authorities and the European Commission had
estimated in August 2005 would be reached by
the end of the Shanghai Agreement in 2007.
Greater imports from China often displaced
imports from other Asian countries (like Hong
Kong, Indonesia and Bangladesh), as well as
some North African countries and also
Romania. This dominant position of Chinese
products in the EU-25 market for clothing
imports was achieved through a strong growth
in import volumes (often beyond the
negotiated Shanghai Agreement levels), while
average unit prices fell (see
Tables 3.17 and 3.18).
3.3: LEATHER AND FOOTWEAR
Trade aside, some of the other important issues
for the European tanning activity concern the
availability, quality and yield of hides and skins
(bovine and ovine) as well as reducing the
impact on the environment. According to the
Confederation of National Associations of
Tanners and Dressers of the EU (COTANCE),
tanning activity in Europe has reduced the use
of water in the tanning process, the discharge
of chromium and also pollution in
wastewater (7). Nevertheless, the use of
chemicals remains important in the production
of some leather goods, so this industry will be
affected by the EU’s new chemical legislation
(REACH) - see Chapter 5 for more details -
which at the time of writing is expected to be
adopted by the end of 2006. With a view to
these issues, new Community-funded research
is being conducted into cost effective
bio-manufacturing processes.
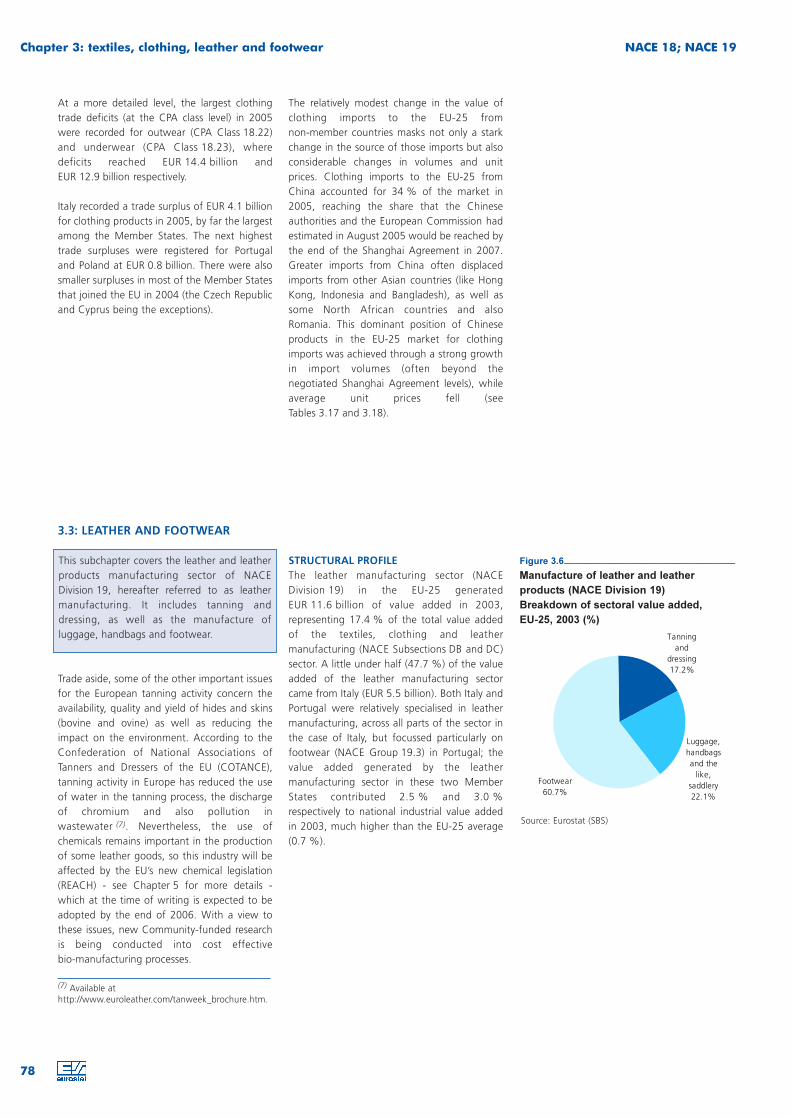
STRUCTURAL PROFILE
The leather manufacturing sector (NACE
Division 19) in the EU-25 generated
EUR 11.6 billion of value added in 2003,
representing 17.4 % of the total value added
of the textiles, clothing and leather
manufacturing (NACE Subsections DB and DC)
sector. A little under half (47.7 %) of the value
added of the leather manufacturing sector
came from Italy (EUR 5.5 billion). Both Italy and
Portugal were relatively specialised in leather
manufacturing, across all parts of the sector in
the case of Italy, but focussed particularly on
footwear (NACE Group 19.3) in Portugal; the
value added generated by the leather
manufacturing sector in these two Member
States contributed 2.5 % and 3.0 %
respectively to national industrial value added
in 2003, much higher than the EU-25 average
(0.7 %).
78
Chapter 3: textiles, clothing, leather and footwear NACE 18; NACE 19
This subchapter covers the leather and leather
products manufacturing sector of NACE
Division 19, hereafter referred to as leather
manufacturing. It includes tanning and
dressing, as well as the manufacture of
luggage, handbags and footwear.
(7) Available athttp://www.euroleather.com/tanweek_brochure.htm.
Figure 3.6_________________________________
Manufacture of leather and leather
products (NACE Division 19)
Breakdown of sectoral value added,
EU-25, 2003 (%)
Source: Eurostat (SBS)
Luggage,
handbags
and the
like,
saddlery
22.1%
Tanning
and
dressing
17.2%
Footwear
60.7%
Apart from a small rise in output in 1997, the
production index of leather manufacturing in
the EU-25 declined steadily and sharply over
the period between 1995 and 2005 (an
average annual fall of 5.5 %). After 2000, the
rate of decline in leather manufacturing output
accelerated, principally as a result of falling
output for footwear (an average decline of
9.4 % per annum between 2000 and 2005).
A small majority of the EU-25’s workforce in the
leather manufacturing sector were women
(53.0 % in 2005), significantly less than the
proportion recorded for textiles, clothing and
leather manufacturing as a whole (64.5 %). In
Hungary, Estonia and Slovakia the female
proportion of the workforce was situated
between 70 % and 75 %, while in Greece and
Spain women were in the minority (about 40 %
of the workforce).
COSTS, PRODUCTIVITY AND
PROFITABILITY
Both average personnel costs (EUR 17 100 per
employee) and apparent labour productivity
(EUR 22 400 per person employed) within the
EU-25’s leather manufacturing sector were
below the average for textiles, clothing and
leather manufacturing in 2005. Indeed, the
apparent labour productivity of the leather
manufacturing sector was less than half the
level recorded for the EU-25 industrial average,
and between 35 % and 70 % lower than
national industrial averages across all of the
Member States for which information was
available (8).
The wage adjusted productivity ratio for the
EU-25’s leather manufacturing sector was
130.7 %, a similar level to that recorded for
textiles, clothing and leather manufacturing as
a whole. The gross operating rate of 7.8 % in
2005 was lower, however, than the EU-25
average (8.4 %) for the textiles, clothing and
leather manufacturing. This characteristic was
noted for the majority of the Member States,
although not in Germany, France, Ireland, the
Netherlands or the United Kingdom.
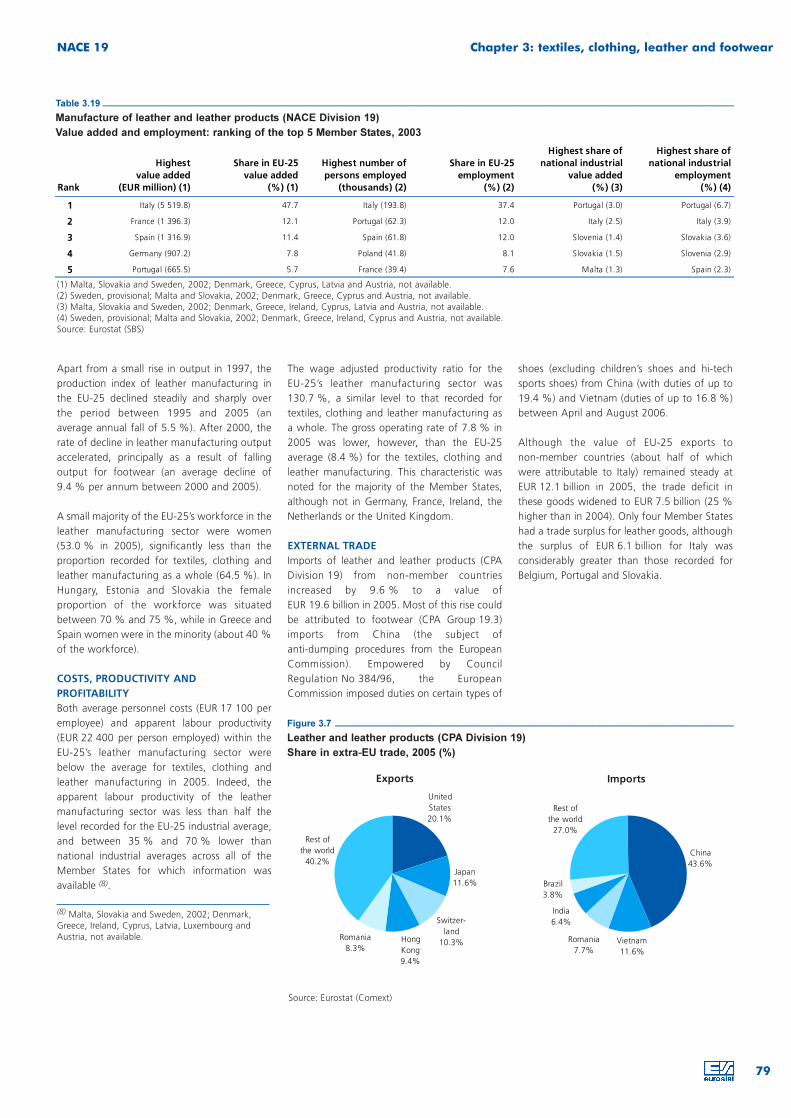
EXTERNAL TRADE
Imports of leather and leather products (CPA
Division 19) from non-member countries
increased by 9.6 % to a value of
EUR 19.6 billion in 2005. Most of this rise could
be attributed to footwear (CPA Group 19.3)
imports from China (the subject of
anti-dumping procedures from the European
Commission). Empowered by Council
Regulation No 384/96, the European
Commission imposed duties on certain types of
shoes (excluding children’s shoes and hi-tech
sports shoes) from China (with duties of up to
19.4 %) and Vietnam (duties of up to 16.8 %)
between April and August 2006.
Although the value of EU-25 exports to
non-member countries (about half of which
were attributable to Italy) remained steady at
EUR 12.1 billion in 2005, the trade deficit in
these goods widened to EUR 7.5 billion (25 %
higher than in 2004). Only four Member States
had a trade surplus for leather goods, although
the surplus of EUR 6.1 billion for Italy was
considerably greater than those recorded for
Belgium, Portugal and Slovakia.
79
NACE 19 Chapter 3: textiles, clothing, leather and footwear
Table 3.19 __________________________________________________________________________________________________________________________
Manufacture of leather and leather products (NACE Division 19)
Value added and employment: ranking of the top 5 Member States, 2003
(1) Malta, Slovakia and Sweden, 2002; Denmark, Greece, Cyprus, Latvia and Austria, not available.(2) Sweden, provisional; Malta and Slovakia, 2002; Denmark, Greece, Cyprus and Austria, not available.(3) Malta, Slovakia and Sweden, 2002; Denmark, Greece, Ireland, Cyprus, Latvia and Austria, not available.(4) Sweden, provisional; Malta and Slovakia, 2002; Denmark, Greece, Ireland, Cyprus and Austria, not available.Source: Eurostat (SBS)
Rank
Highest
value added
(EUR million) (1)
Share in EU-25
value added
(%) (1)
Highest number of
persons employed
(thousands) (2)
Share in EU-25
employment
(%) (2)
Highest share of
national industrial
value added
(%) (3)
Highest share of
national industrial
employment
(%) (4)
1 Italy (5 519.8) 47.7 Italy (193.8) 37.4 Portugal (3.0) Portugal (6.7)
2 France (1 396.3) 12.1 Portugal (62.3) 12.0 Italy (2.5) Italy (3.9)
3 Spain (1 316.9) 11.4 Spain (61.8) 12.0 Slovenia (1.4) Slovakia (3.6)
4 Germany (907.2) 7.8 Poland (41.8) 8.1 Slovakia (1.5) Slovenia (2.9)
5 Portugal (665.5) 5.7 France (39.4) 7.6 Malta (1.3) Spain (2.3)
Figure 3.7 _____________________________________________________________________________
Leather and leather products (CPA Division 19)
Share in extra-EU trade, 2005 (%)
Source: Eurostat (Comext)
United
States
20.1%
Japan
11.6%
Hong
Kong
9.4%
Romania
8.3%
Rest of
the world
40.2%
Switzer-
land
10.3%
China
43.6%
Vietnam
11.6%
Brazil
3.8%
Rest of
the world
27.0%
Romania
7.7%
India
6.4%
Exports Imports
(8) Malta, Slovakia and Sweden, 2002; Denmark,Greece, Ireland, Cyprus, Latvia, Luxembourg andAustria, not available.
80
Chapter 3: textiles, clothing, leather and footwear NACE 17; NACE 18
Table 3.20 __________________________________________________________________________________________________________________________
Manufacture of textiles (NACE Division 17)
Main indicators, 2003 (1)
(1) Luxembourg, Hungary and Malta, 2002. (2) EU-25, rounded estimate based on non-confidential data. (3) EU-25, 2002. (4) Sweden, provisional. (5) Sweden, 2002.Source: Eurostat (SBS)
EU-25 BE CZ DK DE EE EL ES FR IE IT CY LV LT LU HU MT
Turnover (EUR million) (2) 110 000 6 867 1 773 1 039 14 847 288 : 9 470 14 173 416 36 074 33 172 333 537 683 56
Production (EUR million) : 6 620 1 688 1 010 13 787 282 : 9 261 13 735 379 35 768 31 168 326 527 610 54
Value added at factor cost (EUR million) (2) 33 000 1 818 555 359 4 632 88 : 2 906 3 757 128 9 982 12 62 101 169 197 34
Gross operating surplus (EUR million) (3) 10 594 595 220 101 924 32 : 801 661 9 3 508 4 25 23 112 27 20
Purchases of goods and services (EUR million) : 4 963 1 259 686 10 084 201 : 6 827 10 492 276 26 081 21 113 230 362 481 20
Gross investment in tangible goods (EUR million) : : 104 34 425 12 : 345 363 11 1 585 0 24 26 : 45 14
Number of persons employed (thousands) (2) 1 170 39 58 7 117 11 : 105 105 4 286 1 11 19 1 35 1
Personnel costs (EUR million) (2) 23 600 1 223 334 258 3 708 56 : 2 105 3 095 119 6 474 9 38 77 57 171 14
App. labour productivity (EUR thous./pers. emp.) (2) 29.0 47.1 9.5 50.9 39.6 7.7 : 27.7 35.8 29.2 34.9 15.7 5.9 5.2 130.4 5.7 27.0
Average personnel costs (EUR thous./employee) (2) 22.0 33.0 6.1 37.7 32.7 4.9 : 21.3 29.9 27.8 26.6 11.6 3.7 4.0 44.3 5.3 11.6
Wage adjusted labour productivity (%) (2) 130.0 142.7 156.4 135.0 121.2 157.1 : 129.8 119.9 105.1 131.0 135.3 158.3 128.9 294.5 106.6 232.3
Gross operating rate (%) (2) 9.0 8.7 12.4 9.7 6.2 11.1 : 8.5 4.7 2.0 9.7 11.1 14.3 7.0 20.9 3.9 36.2
Investment per person employed (EUR thousand) : : 1.8 4.8 3.6 1.0 : 3.3 3.5 2.4 5.5 0.6 2.2 1.3 : 1.3 10.8
NL AT PL PT SI SK FI SE UK BG HR RO TR IS LI NO CH
Turnover (EUR million) (4) 2 748 2 344 2 500 4 152 1 098 274 658 1 103 10 113 400 : 818 : : : 490 :
Production (EUR million) (4) 2 609 2 188 2 235 4 065 675 256 643 1 023 9 433 401 : 837 : : : 443 :
Value added at factor cost (EUR million) (5) 800 801 696 1 267 201 84 256 359 3 828 105 : 293 : : : 179 :
Gross operating surplus (EUR million) (5) 240 243 308 360 45 7 92 88 1 307 42 : 111 : : : 43 :
Purchases of goods and services (EUR million) (4) 1 946 1 568 2 822 2 908 901 186 406 660 6 227 317 : 591 : : : 319 :
Gross investment in tangible goods (EUR million) (4) 67 74 144 271 41 16 33 40 329 80 : 145 : : : 22 :
Number of persons employed (thousands) (4) 17 18 85 87 13 18 5 10 102 35 : 98 : : : 4 :
Personnel costs (EUR million) (5) 561 559 388 907 155 77 170 272 2 521 63 : 183 : : : 136 :
App. labour productivity (EUR thous./pers. emp.) (5) 46.8 44.0 8.2 14.5 15.0 4.6 48.1 37.5 37.6 3.0 : 3.0 : : : 46.1 :
Average personnel costs (EUR thous./employee) (5) 34.8 31.9 5.1 10.6 11.9 4.2 33.7 32.8 25.7 1.8 : 1.9 : : : 35.2 :
Wage adjusted labour productivity (%) (5) 134.5 137.9 158.7 136.6 126.1 109.3 142.9 114.3 146.3 162.9 : 159.1 : : : 131.0 :
Gross operating rate (%) (5) 8.7 10.4 12.3 8.7 4.1 2.6 13.9 8.2 12.9 10.5 : 13.5 : : : 8.8 :
Investment per person employed (EUR thousand) (4) 3.9 4.1 1.7 3.1 3.0 0.9 6.2 4.2 3.2 2.3 : 1.5 : : : 5.6 :
Table 3.21 __________________________________________________________________________________________________________________________
Manufacture of clothing (NACE Division 18)
Main indicators, 2003 (1)
(1) Luxembourg and Malta, 2002. (2) EU-25, rounded estimate based on non-confidential data. (3) Belgium and France, 2002. (4) Sweden, provisional. (5) Sweden, 2002.Source: Eurostat (SBS)
EU-25 BE CZ DK DE EE EL ES FR IE IT CY LV LT LU HU MT
Turnover (EUR million) (2) 79 500 1 682 615 560 10 110 179 : 7 580 12 606 305 27 842 82 118 350 2 1 002 161
Production (EUR million) : 1 697 582 557 9 100 151 : 7 475 11 260 246 26 635 72 115 347 2 865 160
Value added at factor cost (EUR million) (2) 22 100 316 244 151 2 508 68 : 2 473 3 094 103 6 978 31 58 162 1 315 57
Gross operating surplus (EUR million) (2) 6 860 70 64 41 772 10 : 794 700 40 2 553 9 21 40 0 60 21
Purchases of goods and services (EUR million) : 1 413 385 408 7 478 110 : 5 132 9 566 197 20 692 51 63 192 1 676 94
Gross investment in tangible goods (EUR million) (3) : 36 13 24 103 7 : 175 186 5 957 1 6 14 : 30 2
Number of persons employed (thousands) (2) 1 200 9 50 3 59 13 : 113 83 3 278 2 14 49 0 63 3
Personnel costs (EUR million) (2) 15 200 246 180 110 1 736 58 : 1 678 2 394 63 4 425 22 37 122 1 255 36
App. labour productivity (EUR thous./pers. emp.) (2) 18.5 35.1 4.9 46.1 42.4 5.2 : 21.9 37.2 38.5 25.1 12.8 4.1 3.3 15.8 5.0 17.5
Average personnel costs (EUR thous./employee) (2) 14.4 30.4 4.6 37.0 30.8 4.4 : 16.4 29.6 24.0 19.8 11.0 2.7 2.5 32.0 4.3 11.5
Wage adjusted labour productivity (%) (2) 128.0 115.2 105.0 124.3 137.8 116.2 : 134.0 125.6 160.4 126.6 115.5 150.2 131.6 49.4 115.9 151.8
Gross operating rate (%) (2) 8.6 4.2 10.4 7.3 7.6 5.6 : 10.5 5.6 13.1 9.2 10.5 18.0 11.5 -9.8 6.0 13.0
Investment per person employed (EUR thousand) (3) : 3.5 0.3 7.2 1.7 0.5 : 1.6 2.0 1.8 3.4 0.4 0.4 0.3 : 0.5 0.6
NL AT PL PT SI SK FI SE UK BG HR RO TR IS LI NO CH
Turnover (EUR million) (4) 616 953 1 951 3 951 267 253 577 351 6 370 675 : 1 658 : : : 153 :
Production (EUR million) (4) 544 799 1 863 3 774 243 238 484 303 5 504 656 : 1 642 : : : 145 :
Value added at factor cost (EUR million) (5) 165 257 751 1 360 124 114 193 96 2 121 255 : 770 : : : 50 :
Gross operating surplus (EUR million) (5) 50 38 218 267 -2 10 52 34 899 65 : 240 : : : 16 :
Purchases of goods and services (EUR million) (4) 448 704 1 240 2 604 139 139 391 206 4 118 437 : 970 : : : 103 :
Gross investment in tangible goods (EUR million) (4) 7 16 77 171 9 21 10 6 95 62 : 165 : : : 2 :
Number of persons employed (thousands) (4) 5 10 172 136 14 28 6 3 64 147 : 329 : : : 1 :
Personnel costs (EUR million) (5) 115 219 534 1 093 126 105 142 62 1 222 189 : 530 : : : 34 :
App. labour productivity (EUR thous./pers. emp.) (5) 34.5 26.4 4.4 10.0 8.9 4.0 35.0 26.9 33.3 1.7 : 2.3 : : : 48.7 :
Average personnel costs (EUR thous./employee) (5) 36.4 25.0 3.8 8.5 9.7 3.7 27.6 29.1 20.4 1.4 : 1.6 : : : 33.1 :
Wage adjusted labour productivity (%) (5) 94.9 105.5 113.7 118.2 92.4 109.3 126.9 92.2 163.0 128.5 : 144.2 : : : 147.0 :
Gross operating rate (%) (5) 8.2 4.0 11.1 6.8 -0.6 3.9 9.0 9.8 14.1 9.7 : 14.5 : : : 10.8 :
Investment per person employed (EUR thousand) (4) 1.5 1.6 0.4 1.3 0.6 0.7 1.7 1.6 1.5 0.4 : 0.5 : : : 2.0 :
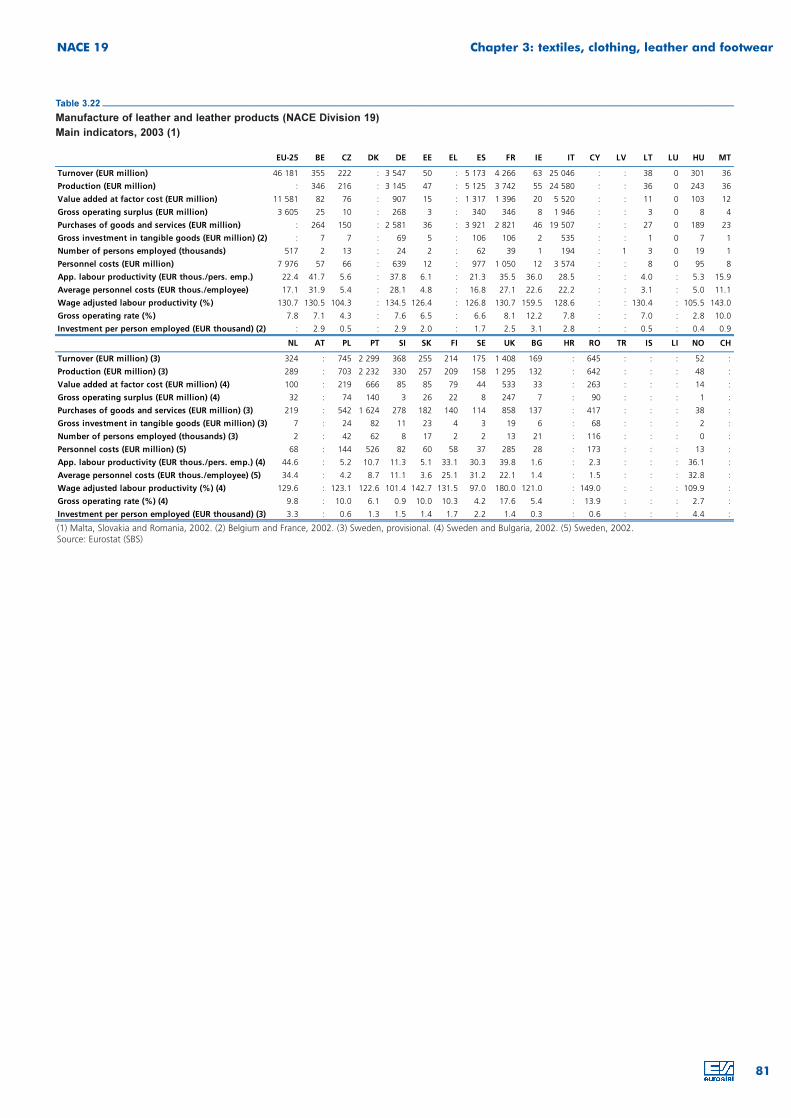
81
NACE 19 Chapter 3: textiles, clothing, leather and footwear
Table 3.22 __________________________________________________________________________________________________________________________
Manufacture of leather and leather products (NACE Division 19)
Main indicators, 2003 (1)
(1) Malta, Slovakia and Romania, 2002. (2) Belgium and France, 2002. (3) Sweden, provisional. (4) Sweden and Bulgaria, 2002. (5) Sweden, 2002.Source: Eurostat (SBS)
EU-25 BE CZ DK DE EE EL ES FR IE IT CY LV LT LU HU MT
Turnover (EUR million) 46 181 355 222 : 3 547 50 : 5 173 4 266 63 25 046 : : 38 0 301 36
Production (EUR million) : 346 216 : 3 145 47 : 5 125 3 742 55 24 580 : : 36 0 243 36
Value added at factor cost (EUR million) 11 581 82 76 : 907 15 : 1 317 1 396 20 5 520 : : 11 0 103 12
Gross operating surplus (EUR million) 3 605 25 10 : 268 3 : 340 346 8 1 946 : : 3 0 8 4
Purchases of goods and services (EUR million) : 264 150 : 2 581 36 : 3 921 2 821 46 19 507 : : 27 0 189 23
Gross investment in tangible goods (EUR million) (2) : 7 7 : 69 5 : 106 106 2 535 : : 1 0 7 1
Number of persons employed (thousands) 517 2 13 : 24 2 : 62 39 1 194 : 1 3 0 19 1
Personnel costs (EUR million) 7 976 57 66 : 639 12 : 977 1 050 12 3 574 : : 8 0 95 8
App. labour productivity (EUR thous./pers. emp.) 22.4 41.7 5.6 : 37.8 6.1 : 21.3 35.5 36.0 28.5 : : 4.0 : 5.3 15.9
Average personnel costs (EUR thous./employee) 17.1 31.9 5.4 : 28.1 4.8 : 16.8 27.1 22.6 22.2 : : 3.1 : 5.0 11.1
Wage adjusted labour productivity (%) 130.7 130.5 104.3 : 134.5 126.4 : 126.8 130.7 159.5 128.6 : : 130.4 : 105.5 143.0
Gross operating rate (%) 7.8 7.1 4.3 : 7.6 6.5 : 6.6 8.1 12.2 7.8 : : 7.0 : 2.8 10.0
Investment per person employed (EUR thousand) (2) : 2.9 0.5 : 2.9 2.0 : 1.7 2.5 3.1 2.8 : : 0.5 : 0.4 0.9
NL AT PL PT SI SK FI SE UK BG HR RO TR IS LI NO CH
Turnover (EUR million) (3) 324 : 745 2 299 368 255 214 175 1 408 169 : 645 : : : 52 :
Production (EUR million) (3) 289 : 703 2 232 330 257 209 158 1 295 132 : 642 : : : 48 :
Value added at factor cost (EUR million) (4) 100 : 219 666 85 85 79 44 533 33 : 263 : : : 14 :
Gross operating surplus (EUR million) (4) 32 : 74 140 3 26 22 8 247 7 : 90 : : : 1 :
Purchases of goods and services (EUR million) (3) 219 : 542 1 624 278 182 140 114 858 137 : 417 : : : 38 :
Gross investment in tangible goods (EUR million) (3) 7 : 24 82 11 23 4 3 19 6 : 68 : : : 2 :
Number of persons employed (thousands) (3) 2 : 42 62 8 17 2 2 13 21 : 116 : : : 0 :
Personnel costs (EUR million) (5) 68 : 144 526 82 60 58 37 285 28 : 173 : : : 13 :
App. labour productivity (EUR thous./pers. emp.) (4) 44.6 : 5.2 10.7 11.3 5.1 33.1 30.3 39.8 1.6 : 2.3 : : : 36.1 :
Average personnel costs (EUR thous./employee) (5) 34.4 : 4.2 8.7 11.1 3.6 25.1 31.2 22.1 1.4 : 1.5 : : : 32.8 :
Wage adjusted labour productivity (%) (4) 129.6 : 123.1 122.6 101.4 142.7 131.5 97.0 180.0 121.0 : 149.0 : : : 109.9 :
Gross operating rate (%) (4) 9.8 : 10.0 6.1 0.9 10.0 10.3 4.2 17.6 5.4 : 13.9 : : : 2.7 :
Investment per person employed (EUR thousand) (3) 3.3 : 0.6 1.3 1.5 1.4 1.7 2.2 1.4 0.3 : 0.6 : : : 4.4 :

Related Documents