___________________________________________________________ Thesis Submitted in Partial Fulfillment of the Requirements for the Degree of Master in Science in Textile Engineering The Swedish School of Textiles 2014-05-19 Report no: 2014.14.02 ________________________________________________________________________________________ Textile Sensor Using Piezoelectric Fibers for Measuring Dynamic Compression in a Bowel Stent - An Experimental Study - Author: Anna Vahlberg Description: Thesis submitted for the degree of Master in Science in Textile Engineering

Welcome message from author
This document is posted to help you gain knowledge. Please leave a comment to let me know what you think about it! Share it to your friends and learn new things together.
Transcript

___________________________________________________________
Thesis Submitted in Partial Fulfillment of the Requirements for the Degree of Master in Science in Textile Engineering
The Swedish School of Textiles
2014-05-19
Report no:
2014.14.02
________________________________________________________________________________________
Textile Sensor Using Piezoelectric Fibers
for Measuring Dynamic Compression in a
Bowel Stent
- An Experimental Study -
Author: Anna Vahlberg
Description: Thesis submitted for the degree of Master in Science in Textile
Engineering

Title: Textile Sensor Using Piezoelectric Fibers for Measuring Dynamic
Compression in a Bowel Stent
Author: Anna Vahlberg
Supervisor: Anja Lund
Cooperation partners: Swedish School of Textile and the Department of
Surgery at Södra Älvsborgs Sjukhus
Examiner: Vincent Nierstrasz
The Swedish School of Textiles
Report No. 2014.14.02

Abstract
In this experimental study the in-lined poled piezoelectric poly(vinylidene
fluoride)(PVDF) bicomponent fiber was investigated the suitability in applications
within the area of textile sensors when used in a bowel stent. Today there are only
piezoelectric films made of PVDF available. Compared to a film, a fiber increases
the amounts of application abilities.
In this study a plain weave, resembling a coordinate system was made of the
piezoelectric PVDF fiber and tested on top of two different beds; one hard and
one elastic made of foam. The structure was then developed into two structures;
one integrated in the stents structure with a plain weave pattern and one secondary
structure as a plain weave placed onto the stent. Two test methods were developed
in order to resemble the bowel movements to test the two piezoelectric PVDF
fiber based structures. A reliability test in a reometer was made of the fiber, giving
high differences in mean values. An in vivo test was conducted in a pig where the
stent was placed in the orifice of the stomach.
Both structures shown response when both developed methods was used. Due to
large irregularities within the piezoelectric PVDF fiber the evaluation between the
two structures was not possible. The most favorable structure was the secondary
structure due to the larger continuous process ability and application areas. It was
also seen that the reliability of the piezoelectric PVDF fiber is low, giving a non-
reliable sensor.
Key words: Piezoelectricity, advanced textile structure, textile sensor,
piezoelectric poly(vinylidene fluoride), (PVDF), textile medical device, self-
sensing stent.

Popular Abstract
Piezoelectricity is a phenomenon when a piezoelectric material is pressed which
generates a voltage output. There are several textile polymers where the
phenomenon can be created, one of those is poly(vinylidene fluoride) (PVDF).
Recent research at Swerea IVF and the Swedish School of Textiles have found
that it is possible to make a piezoelectric fiber of PVDF. In this study it was
investigated whether or not the fiber is suitable as a textile sensor measuring
muscle movements placed in a stent used for the bowel.
Two structures were investigated in this study; one where the piezoelectric PVDF
fiber was integrated in the structure of the stent and the other as a secondary
structure sewn onto the structure of the stent. Two test methods were developed to
resemble bowel movements. An animal test on a pig was done in order to test
when the stent was subjected to real muscle movements.
It was shown that it is possible to use both structures as textile sensors to measure
muscle movements in a bowel. The most favorable structure when considering the
versatility was the secondary structure.

Table of content
1. Introduction ................................................................................................................... 1
1.1 Background description ........................................................................................ 1
1.2 Aim ........................................................................................................................... 2
1.2.1 Research questions ....................................................................................... 2
1.3 Delimitations ........................................................................................................... 2
2. Theory ............................................................................................................................ 3
2.1 Smart textiles .......................................................................................................... 3
2.1.2. Textile sensors ............................................................................................... 3
2.2 Piezoelectricity ....................................................................................................... 4
2.3 Piezoelectric polymers .......................................................................................... 5
2.3.1 Poly (vinylidene fluoride) PVDF ................................................................... 5
2.4 Poling ....................................................................................................................... 6
2.5 Inner and outer electrode ..................................................................................... 6
2.6 The stent and the human body ............................................................................ 7
2.6.1 Stents ............................................................................................................... 7
2.6.2 Basic anatomy and placing of the stent ...................................................... 8
2.7 EndoFLIP – measuring the compressions within a bowel stent ..................... 9
2.8 Patents and other measuring systems for the bowel ....................................... 9
2.8.1 Measuring system for the bowel .................................................................. 9
2.8.2 Stent with a piezoelectric element ............................................................. 10
2.8.3 Other patents with sensing stents .............................................................. 10
3. Materials used in this study ...................................................................................... 11
3.1 The piezoelectric yarn – a bicomponent fiber ................................................. 11
3.3 Conductive material ............................................................................................. 11
3.3.1 Silver paint ..................................................................................................... 11
3.3.2 Copper tape ................................................................................................... 11
3.3.3 Copper thread ............................................................................................... 11
3.3.4 Coating ........................................................................................................... 11
3.4 Attachment materials .......................................................................................... 11
3.4.1 Thread ............................................................................................................ 12
3.4.2 Glue ................................................................................................................ 12
3.5 Stent ....................................................................................................................... 12
3.6 Secondary structure ............................................................................................ 12

4 Method .......................................................................................................................... 13
4.1 Yarn making for samples .................................................................................... 13
4.1.1 Pre-shrinking and pre-shrinkage test ........................................................ 13
4.1.2 Coating ........................................................................................................... 13
4.1.3 Preparation of connection to the inner electrode ..................................... 13
4.1.4 Pre-testing of piezoelectricity ...................................................................... 13
4.2 Replicability test ................................................................................................... 14
4.2.1 Testing in low pH .......................................................................................... 14
4.3 Textile structures .................................................................................................. 15
4.3.1 First sample ................................................................................................... 15
4.3.2 Integrated textile structure ........................................................................... 16
4.3.3 Secondary textile structure ......................................................................... 17
4.4 Methods for simulating bowel movements ....................................................... 17
4.4.1 Ring compression method .......................................................................... 18
4.4.2 Ring movement method .............................................................................. 19
4.5 Testing of the stent .............................................................................................. 20
4.5.1 Test with ring compression method ........................................................... 21
4.5.2 Test with ring movement method ............................................................... 22
4.6 Testing after poled in direct contact .................................................................. 22
4.7 In vivo .................................................................................................................... 22
5. Result ........................................................................................................................... 24
5.1 Pre-shrinking ........................................................................................................ 24
5.2 Replicability test ................................................................................................... 24
5.1.2 Testing in low pH .......................................................................................... 24
5.3 Sample 0 ............................................................................................................... 25
5.4 Ring compression testing ................................................................................... 25
5.4.1 Sample 1 ........................................................................................................ 26
5.4.2 Sample 2 ........................................................................................................ 27
5.4.3 Double sided test .......................................................................................... 28
5.5 Ring movement testing ....................................................................................... 29
5.4.1 Sample 1 ........................................................................................................ 29
5.4.2 Sample 2 ........................................................................................................ 30
5.4.3 Double sided test .......................................................................................... 30
5.6 Testing after poled in direct contact .................................................................. 31

5.7 In vivo testing ........................................................................................................ 32
6. Discussion ................................................................................................................... 33
6.1 Shrinkage test ...................................................................................................... 33
6.2 Textile structures and sample selection ........................................................... 33
6.2.1 Sample 0 ........................................................................................................ 34
6.2.2 Sample 1 ........................................................................................................ 34
6.2.3 Sample 2 ........................................................................................................ 34
6.3 Material selection ................................................................................................. 34
6.4 Construction of testing methods ........................................................................ 35
6.5 Applicability of testing methods to different stents .......................................... 36
6.6 Replicability test ................................................................................................... 36
6.7 Poling in direct contact ........................................................................................ 37
6.8 In vivo testing ........................................................................................................ 37
6.9 Evaluation of the developed test methods after the in vivo testing .............. 37
6.10 Application in the bowel .................................................................................... 38
7. Conclusion .................................................................................................................. 40
8. Further Research ....................................................................................................... 40
9. Acknowledgement ...................................................................................................... 41
10. References................................................................................................................ 42
Appendix A – Ring compression method ...................................................................... i
Appendix B – Ring movement method ......................................................................... ii
Appendix C – Sample 0 ................................................................................................... ii
Appendix D – Curves ring compression method ........................................................ vi
Appendix E – Curves ring movement method ............................................................xii

1
1. Introduction Textile based sensors are considered to be a smart textile. The definition of a
smart textile is: a material or structure which has the ability to sense and react to
surrounding conditions and stimuli. One example of a stimulus is mechanical e.g.
dynamic compression. The major reason for why the development occurred is the
flexibility and drapability of a textile. These abilities increases e.g. comfort in a
worn item. (Schwarz, A. et al.,2010)
1.1 Background description
A stent is a device used for keeping the patency of a hollow organ in order to
secure liquid flow. Today the use of stents has increased from the initial
application in the throat to a number of different areas. The range goes from usage
in blood vessels to the bowel1 for keeping the patency and enabling liquid flow,
additionally covering holes and gaps. Usually they are preferred to use instead of
major surgery and are considered to be very helpful. Though, the stent itself can
cause problems, such as ingrowth. (O´Brien, C, & Sparkman, 1997)
A piezoelectric material such as poly(vinylidene fluoride) (PVDF) has the ability
to generate voltage when a mechanical stress is subjected. (Lund. A., et. al. 2012)
Today, the piezoelectric PVDF can be found in energy harvesting devices. There
are also several applications within the medical area e.g. for measuring heart beats
while integrated in a stent for blood vessels. (Ward K., et al., 2005) The PVDF is
a commercially available polymer and can be found in many application areas
such as resonators, speakers, measuring pressure, vibration and acceleration.
(Fulmer, 1998)
There is a need to measure the bowel movements without extra forces applied
than of the stent. During surgery the surgeons have seen that the bowel
movements actually increases when put under pressure from forceps. It is crucial
to understand why and how the bowel moves since stents used in the orifice of the
stomach or in the bowel starts moving away from the intended area after only one
week. By increasing the knowledge of the bowel movements the design of the
stent can be improved. (Bergström & Park, 2014)
1 Bowel describes the whole digestive tract from the mouth to the anus in animals. When used
describing human anatomy the bowel describes the digestive tract after the stomach to the anus.
(Nationalencyklopedin, 2014)

2
1.2 Aim
The aim with this study is to investigate whether a piezoelectric fiber could be
used as a textile sensor, sensing dynamic compression when integrated in a stent
used for the bowel.
1.2.1 Research questions
The main research questions for this master thesis are addressed as follows:
1. Can a piezoelectric PVDF fiber be used measuring dynamic compression
radially in a stent placed in a bowel?
a. Can a matrix of piezoelectric PVDF yarns be used to place to
locate the point of pressure in a textile structure and illustrate the
pressure distribution in real-time?
2. Which textile production method is suitable to integrate the piezoelectric
fiber be integrated in a textile structure such as a stent?
a. Is it beneficial to integrate the piezoelectric fiber directly into the
structure of the stent in order to measure bowel movements?
b. Is it beneficial to integrate the piezoelectric fiber via a secondary
structure used on the surface of the stent in order to measure bowel
movements?
1.3 Delimitations
The master thesis is limited to use a piezoelectric material made of a PVDF
bicomponent fiber with a core of carbon black (CB) and high density polyethylene
(HDPE). The incorporation of the piezoelectric fiber is done in stents made for the
bowel. During the manufacturing the fiber was in-lined poled at Swerea IVF, a
continuous textile process. The primary aim is to use a continuous textile
processed fiber. Materials used must withstand C due to the
conditions to cure the outer electrode. A conductive silicone coating with CB was
used as an outer electrode in this study, however when used in living bowel this
may be excluded due to the body liquids are conductive. The piezoelectric
characterization was limited to measuring the voltage output during compression
using a four channel PicoScope2 at the Swedish School of Textile.
2 A PC Oscilloscope where all data is transferred directly from the oscilloscope to a computer and
used for recording output voltage. (PicoTech, 2014)
3
2. Theory
Within this chapter important subjects and aspects of the project are introduced. A
brief introduction of what a smart textile is as well as what piezoelectricity is.
A simple description of the stent and the anatomy of the bowel are also included.
2.1 Smart textiles
Today there is a lot of research conducted worldwide within the area of smart
textiles. Six functions have been defined which a smart textile system can have;
sensing, actuating, powering, communication, data processing and
interconnecting. Though the smart functions may not be actual textile, but
electronics incorporated within the textile. The system is still considered to be a
smart textile. The precondition is the system e.g. a garment should be flexible,
high in comfort when worn and durable to ordinary textile maintenance such as
washing. (Schwarz, A. et al.,2010)
The smart textile systems are divided after their abilities in three major groups:
Passive smart textiles
Active smart textiles
Very smart textiles
The function of a passive smart textile is the sensing function and is the most
simplest. An active smart textile has the function of sensing stimulus but can also
react upon it. The very smart textiles have the ability to sense, react and the gift to
adapt to the new circumstances. There are a number of different stimuli smart
textiles can react on e.g. chemicals, pressure, temperature and pH. (Schwarz, A. et
al.,2010)
2.1.2. Textile sensors
The definition of a sensor is a device which provides information and the
information is usually in the form of electrical signal. A smart textile in the form
of textile sensor has the sensing function, thus it can sense changes in the
environment. Usually when the application is within the smart textile area, the
sensors used are piezo-resistive and pressure sensors. A large part of the smart
textile development is actually the development of textile sensors. The majority of
the sensors have their application within the medical field. (Schwarz, A. et
al.,2010) Research has been done where textile based sensors was used in order to
monitor heart rate. (Gupta, 2010) (Osman R. M. A., et al., 2011)
Sensors are usually divided into two major groups for classification reasons;
active and passive sensors. A passive sensor, as the name suggests require an
external power source in order to function and to convert the input into a useable
response. Whereas an active sensor does not need an external power source in
order to convert the input energy. Thus within the smart textiles area, a passive
sensor is usually made out of conductive fibers and an active sensor can be based
on the piezoelectric effect. (Carpi & De Rossi, 2005) There is a patent where the
4
function is described to be measurement of the heart rate and energy harvesting
within a stent placed in the coronary blood vessels using piezoelectric PVDF.
(Ward K., et al., 2005) The patent is described further in section 2.8.2.
2.1.2.1 Reliability of a sensor
When a sensor is evaluated, whether or not it is suitable for the application in
aspect of e.g. detection area or optimal arrangement of components, a common
evaluation is to investigate the reliability of the sensor. The properties concerning
the sensors detection area is set before the evaluation is taken part. Since detection
area is one of the major factors when determine if a sensor is reliable or not. A
“bl ck s ” wi hin h d c i n a is not suitable, giving the sensor a low
reliability. Additionally, it is crucial h “bl ck s s” n d i g l i i s
within the sensor component material. Thus the material itself in a sensor needs to
be reliable in order for the sensor to be reliable. (Noguchi, 1997)
2.2 Piezoelectricity
Piezoelectricity can be defined as changes in polarization proportional to the
applied strain. (Tichý J. et al., 2010) Whether or not a material can be
piezoelectric is dependent on the crystalline unit structure. If the crystalline unit
has an atomic structures which is arranged non-symmetrical, the crystals wills act
as dipoles. (Lando & Doll, 1968) The piezoelectric properties can be found in
various number of materials such as; ceramics, polymers and silk. (Harrison &
Ounaies, 2014)
When a material is piezoelectric and a mechanical stress is applied, the dielectric
displacement will increase as a response to the applied stress. The phenomenon is
called the direct effect. It is also possible to direct it the phenomena the other way
around, giving a mechanical deformation is induced by an electrical charge. When
the phenomenon is induced by an electrical charge the effect is called the
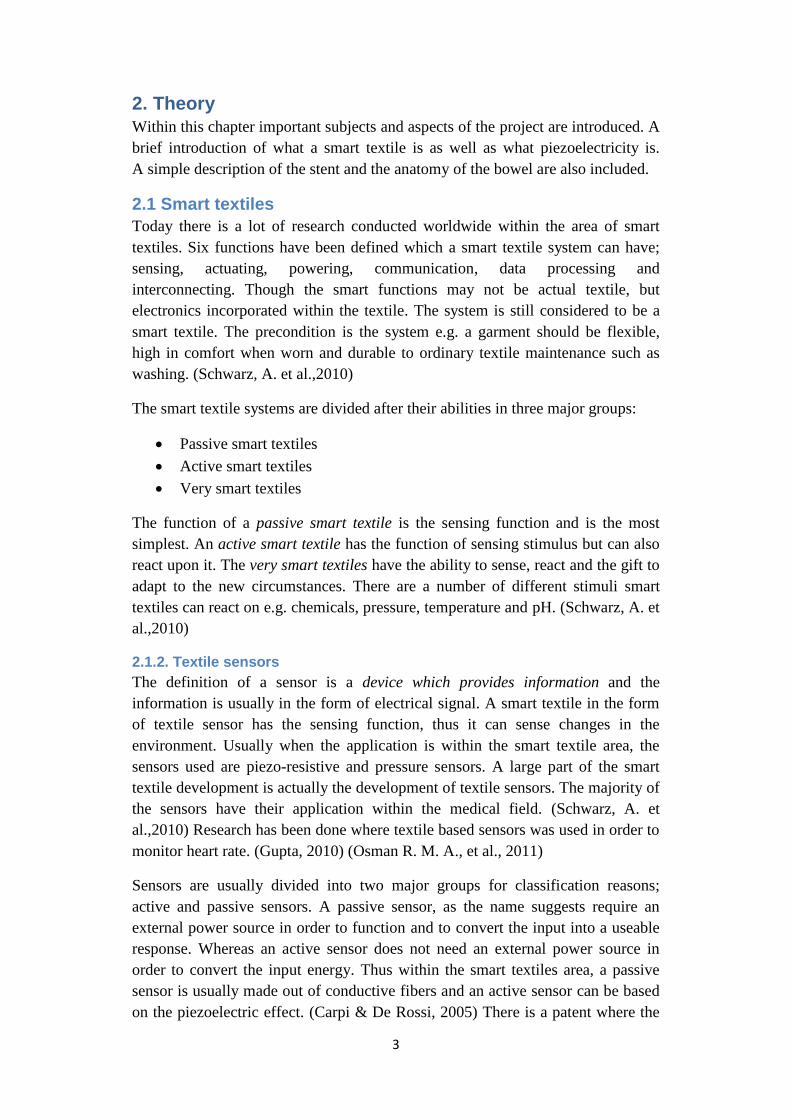
converse effect. (Harrison & Ounaies, 2014) When producing pressure and
compression sensitive sensors the use of the direct effect is ideal. (Ashruf, 2002)
The compression caused by pressure, which gives an output is shown in figure 1.
Figure 1 A single PVDF fiber when undergoing compression from an object (red arrow) giving compression in the interface between the fiber and the object causing strain in the bottom of the fiber (green arrows).
5
In order to characterize the piezoelectric properties of a material two piezoelectric
coefficients can be used. (Lund & Hagström, 2010) The first is the voltage
constant g and the other is the strain constant d. The voltage constant relates
electrical charge produced due to an applied mechanical stress and the strain
constant relates the mechanical strain produced when an electrical charge is
applied to the material. (Das-Gupta & Doughty, 1978)
Piezoelectric materials are more suited for measuring dynamic strain and
compression. However it is not suitable to use them in sensors measuring static
load due to a leakage of current. At first the piezoelectric material will have an
output due to the dynamic strain change and if the load is kept constant the output
will decrease back to zero. (Ashruf, 2002) If there is a need to measure both static
load and dynamic compression the piezoelectric material must be combined with
a material that has the ability to measure static load.
2.3 Piezoelectric polymers
There are several different textile fibers that can be man-made into piezoelectric
materials, such as PVDF, polypropylene (PP), polyethylene terepfhtalate (PET)
and polyamides with odd numbers (e.g. PA5). (Qaiss A. et al., 2012) (Liu, Z. H. et
al., 2013) (Murata Y. et al., 1998) Polymers are more suitable to make sensors
than e.g. ceramics. The polymers have a higher piezoelectric voltage than the
ceramics. Due to the ability for all the named polymers to be processed as a textile
fiber, the sensors made by a polymer can be more flexible than one made of brittle
ceramics. But there are several other favorable attributes polymers have compared
to ceramics; low density, low dielectric constant and low elastic stiffness.
Combined, these properties gives the piezoelectric polymers a property preferred
when producing a sensor; a high voltage sensitivity. (Harrison & Ounaies, 2014)
2.3.1 Poly (vinylidene fluoride) PVDF
The polymer PVDF is as the name suggests several monomers which are
connected into a longer chain: a polymer chain. Due to the differences in charges,
each monomer has an inherent dipole moment. (Sirohi & Chopra, 2000) As seen
in figure 2 the hydrogen (H) atom is slightly charged positive and the fluorine (F)
atom is negatively charged when the carbon (C) atom is considered. The PVDF
has the ability to crystallize in four different phases. The most favorable phase to
achieve the highest piezoelectric effect it is the β- phase the Form I. The β- phase
has a high polarity compared to the other phases which can be seen in figure 2.
The β- phase is in trans conformation. PVDF usually crystallize in the form of the
α-phase the so called Form II. (Lando & Doll, 1968) The most favorable phase
energetically is the α-phase. Due to the configuration of the monomers, a
conformation of trans and gauche the α-phase is non-polar. (Hasegawa R. et al.,
1972)

6
Figure 2 Configuration of the two PVDF phases; α-phase (left) and β- phase (right). Note how the atoms of different polarity are placed in the two forms and uniformity of the placement in the β- phase.
The conformation of the α-phase has the possibility to convert to the β- phase. The
conversion is possible by applying mechanical stress at a certain temperature.
(Matsushige & Takemura, 1983) After the mechanical stretch, all the β- phase
crystallites are randomly oriented within the material. (Dargaville, o.a., 2005) To
achieve the piezoelectric property a poling process is necessary. Not everything is
yet known of what is happening in the poling process, except that the crystals in
the polymer are affected by the electrical field and creates a net polarization. Due
to the net polarization all the crystals align. The alignment of the crystals changes
when a mechanical stress is applied to the material. The change in alignment
causes a energy change at the surface. To be able to register these energy changes
two electrodes needs to be connected on each side of the material. (Lund, A. et al.,
2012)
2.4 Poling
The principle of poling a material can be described as; a material is exposed to an
electrical field either in a contact or non contact mode. When a material is poled
in contact mode two electrodes are connected to both sides of the material. The
electrodes are connected to a high voltage supply. On the other hand when in non
contact mode the material is placed between a high potential electrode and a
grounded counterpart. The non contact mode goes under the name corona poling.
Recent studies have shown that the corona poling does not have as high effect on
the net polarization as the direct poling has. (Nilsson, E. et al., 2013)
2.5 Inner and outer electrode
In recent studies, the electrode can be incorporated in the fiber structure while
being melt spun as a bicomponent fiber. The electrode would then be an inner
electrode. The most favorable placement of the electrode is along and placed in
the core of the fiber. For this study the conductive material in the inner electrode
is CB. In order to have as much output as possible the outer electrode needs to
cover a large area. (Lund, A. et al., 2012)
In order to be able to collect the generated charges from the PVDF sheath of the
bicomponent fiber an outer electrode has to be applied. (Lund, A. et al., 2012)
There has been shown in recent studies that it is possible to use different
conductive materials e.g. CB in combination with HDPE and conductive silicone
rubber (Lund, A. et al., 2012) (Nilsson, E. et al., 2013). Though, it is not always
positive to use a non-metallic outer electrode. Due to the higher resistance in the
7
non-metallic materials the piezoelectric output voltage will decrease. (Nilsson, E.
et al., 2013)
2.6 The stent and the human body
In this section the application of the stent is briefly described as well as the basic
anatomy and properties of the stomach and bowel.
2.6.1 Stents
The word stent and the meaning of the stent started appearing in print and used as
a surgical vocabulary in the beginning of the 1970s. (Bloom, D. A. et al., 1999) A
stent is a cylindrical device used to ensure the patency of an anastomosis3, often to
allow drainage of the specific area. (O´Brien, C, & Sparkman, 1997) It was in the
beginning of the 1990s when the uses of stents in the gastrointestinal tract first
was described. (Kang, 2010) A vast number of the development of the stents
today, is in the area of cardiovascular diseases. But there is still development of
stents for the bowel. However, the research is very inspired by the development of
the stents for blood vessels. The major mechanical properties desired for the stent
is a durable wall and a high radial force. These properties are altered when the
application and the size of the stent is changed. Stents with the property of a high
expandability have a tendency of a higher degree of a restoring force when bent.
Unfortunately, if these are used somewhere which is inappropriate, the stent can
actually cause ulceration or perforation. (O´Brien, C, & Sparkman, 1997)
There are two major groups of stents used today; covered and uncovered. The
covered ones are used when the stent is inserted where it must keep the patency or
reduce obstructions but also to cover any openings e.g. ulcers4. The covered stent
has the theoretical advantage to reduce the tumour ingrowth. Though, due to being
covered the friction is reduced causing an increase in migration compared to a non
covered stent. The second, the uncovered has the advantage of less migration than
the covered stent, but instead has higher possibility of ingrowth. The higher risk
of ingrowth in an uncovered stent is due to the application, often in the bowel
when a tumour reduces the patency of the bowel. The area where the stent is
placed gives large compression forces causing the tissue into the structure of the
stent. The tumour also holds the stent in place in a higher degree than the covered
stent. (Maudgil, D. D. et al., 2001)
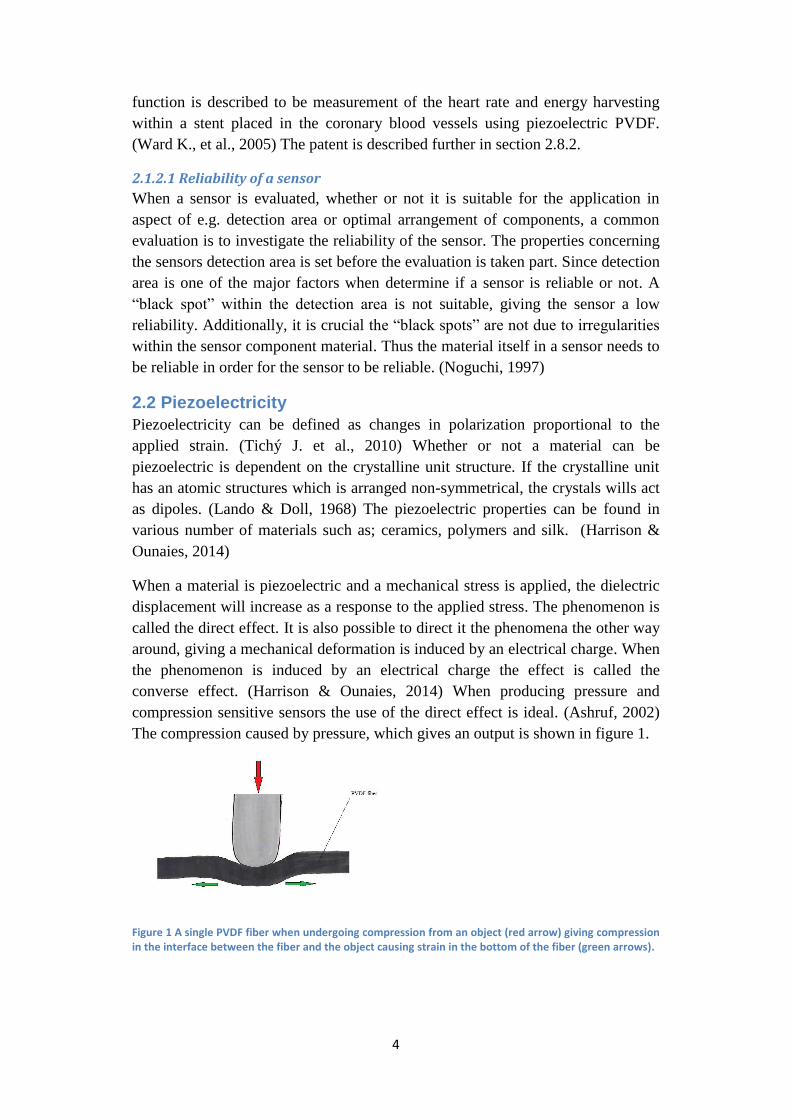
A popular type of stents, so called self-expanding metallic stents (SEMS) is often
used while treating acute colonic obstruction and can be seen in figure 3. They
were first described by Dohmoto in 1994. The SEMS have been used in two
major areas; firstly, in bowel obstructions for patients with metastatic cancer or
patient to sick for a major surgery. The second; used s “b idg s g y”
3 A natural or manmade, by surgery connection between aperture means e.g. between different
parts of the bowel or between blood vessels. (Nationalencyklopedin, 2014) 4 A so called bleeding ulcer is when gastric juice leaks out in the abdominal and can cause major
infections and pains. (Thachuk, 2008)
8
meaning having more time to optimize the health of the patient before a major
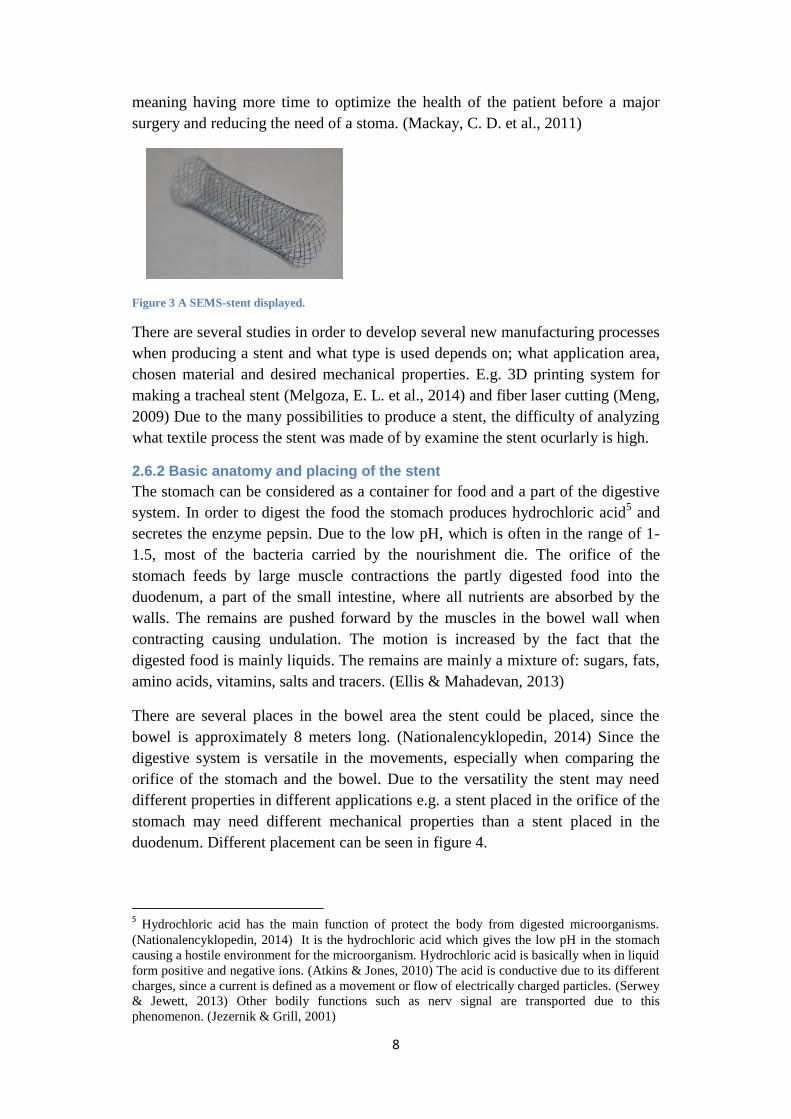
surgery and reducing the need of a stoma. (Mackay, C. D. et al., 2011)
Figure 3 A SEMS-stent displayed.
There are several studies in order to develop several new manufacturing processes
when producing a stent and what type is used depends on; what application area,
chosen material and desired mechanical properties. E.g. 3D printing system for
making a tracheal stent (Melgoza, E. L. et al., 2014) and fiber laser cutting (Meng,
2009) Due to the many possibilities to produce a stent, the difficulty of analyzing
what textile process the stent was made of by examine the stent ocurlarly is high.
2.6.2 Basic anatomy and placing of the stent
The stomach can be considered as a container for food and a part of the digestive
system. In order to digest the food the stomach produces hydrochloric acid5 and
secretes the enzyme pepsin. Due to the low pH, which is often in the range of 1-
1.5, most of the bacteria carried by the nourishment die. The orifice of the
stomach feeds by large muscle contractions the partly digested food into the
duodenum, a part of the small intestine, where all nutrients are absorbed by the
walls. The remains are pushed forward by the muscles in the bowel wall when
contracting causing undulation. The motion is increased by the fact that the
digested food is mainly liquids. The remains are mainly a mixture of: sugars, fats,
amino acids, vitamins, salts and tracers. (Ellis & Mahadevan, 2013)
There are several places in the bowel area the stent could be placed, since the
bowel is approximately 8 meters long. (Nationalencyklopedin, 2014) Since the
digestive system is versatile in the movements, especially when comparing the
orifice of the stomach and the bowel. Due to the versatility the stent may need
different properties in different applications e.g. a stent placed in the orifice of the
stomach may need different mechanical properties than a stent placed in the
duodenum. Different placement can be seen in figure 4.
5 Hydrochloric acid has the main function of protect the body from digested microorganisms.
(Nationalencyklopedin, 2014) It is the hydrochloric acid which gives the low pH in the stomach
causing a hostile environment for the microorganism. Hydrochloric acid is basically when in liquid
form positive and negative ions. (Atkins & Jones, 2010) The acid is conductive due to its different
charges, since a current is defined as a movement or flow of electrically charged particles. (Serwey
& Jewett, 2013) Other bodily functions such as nerv signal are transported due to this
phenomenon. (Jezernik & Grill, 2001)

9
Figure 4 An overview of the placement of the organs are in the human body where the described
organs are colored. The figure also shows examples of different stent placement in the abdomen. The
grey areas represent in this example, cancer tumors which cause the blockage in the bowel. The
placement to the left represent when the placement of the stent is straight and to the right when the
placement is where the intestine is convoluted which could enhance displacement.
2.7 EndoFLIP – measuring the compressions within a bowel
stent There are today few ways of measuring bowel movements. One of the most used
methods is EndoFLIP (Endolumenal Functional Lumen Imaging Probe)
measuring system. It is used to measure hollow organs and sphincteric6 regions
within the gastrointestinal7 tract. The technique inserts a balloon catheter where
the measured area is. A conductive solution is injected into the balloon catheter.
Due to the liquid applied, from the inside, a force is applied to the measured area
in the bowel. Within the balloon an array of electrodes are situated measuring
voltages. With the help of the measured voltage the diameter is estimated and with
the help of a software program projects in 3D the differences in diameter.
(Crospon Inc, 2014)
Due to the applied pressure from within the EndoFLIP measuring system, the
actual measurement is not measuring the implication the stent has done to the
bowel movements but also what the EndoFLIP induces. Due to the increase of the
bowel movement caused by the measuring method, the EndoFLIP is not ideal to
use when measuring force impact and dynamic forces caused by the stent.
(Bergström & Park, 2014)
2.8 Patents and other measuring systems for the bowel
Measuring systems used previously are described as well as relevant and recent
patents within the area are described.
2.8.1 Measuring system for the bowel
During a study where the variations in movements from the esophagus to the
colon were investigated a measuring system was used. The recording system was
6 A sphincter is a muscle which has the shape of a ring. The function is to close an orifice or
passage e.g. the orifice of the stomach. (Nationalencyklopedin, 2014) 7 A medical term to describe something that belongs to the digestive tract. (Nationalencyklopedin,
2014)
10
built of four polyvinyl tubes where 12 sideholes were cut. Inside each tube three
lumens were located, additionally with 12 sensors. The total length of the tube
was 185 cm. The individual study lasted for two days, where the objects were
fasting the first day and having a liquid meal the second day. The data recorder
were; velocity of propagation (cm/min), maximum frequency of contractions
(No./min) and the duration (min). The results varied largely depending on the
measurement area. The frequency range was from 6.1 to 11.7 No/min, where the
highest was found closer to the stomach and the lowest in the colon area. (Kellow,
J. E. et al., 1986)
2.8.2 Stent with a piezoelectric element
There exists one patent describe where a piezoelectric PVDF fiber is incorporated
in a stent s n c iv s ns c ll d “S l -s nsing S n s” CA 6334 9
A1. The patent describes a medically implantable stent where the content is of at
least one piezoelectric material. There are several new properties described for the
stent which is not found in stents in the commercial market; anticoagulant
delivery or any other therapeutic effect, self powering as well as sending an
electrical signal to device outside of the body giving the physician the possibility
to estimate the condition of the surrounding tissue. The described application
areas for the stent: placement in the heart e.g. the coronary artery, vascular,
airways, gastrointestinal, urologic and for drug-eluting. The piezoelectric element
gives the stent the possibility to remotely change the amount of drug-release,
harvesting energy which would be used for drive various actuators which can be
activated with an external electrical signal. Due to the piezoelectric element a
battery is excluded. The piezoelectric element gives and voltage output from the
pulsatile flow through the stent of e.g. blood flow, airway flow, urine flow and
bile flow. (Ward, Ounaies, & Vetrovec, 2005)
2.8.3 Other patents with sensing stents
There are numerous different patents concerning sensoring stents, two are briefly
described in this section due to the large similarities between the sensoring
systems.
Fi s ly h “S n l w S ns ” wh he placement for the stent is in a blood
vessel, where a Micro-Mechanical System (MEMS) ultrasound generator is used
for determining patency of the blood vessel and flow rate through. Also any
pressure drop is measured from the one end to the other. A transmitter is used to
provide the signals to an externally placed receiver. (Hoffer, 2009) Secondly, the
pressure-sensing stent is for vascular measurement, while placed in the human
body. A flow parameter sensor is used to measure rate or flow through the stent
and transmits the signal to a receiver placed outside of the body. (Govari &
Fenster, 1997)

11
3. Materials used in this study
In the following sections the specific materials used for this project are described
more detailed. The dimensions were measured with a Masuer caliper.
3.1 The piezoelectric yarn – a bicomponent fiber
The bicomponent PVDF fiber as a yarn of 950 dtex was used in the warp and weft
of the grid used integrated in the stent and as the secondary structure on top of the
stent. The yarn was made of 24 filaments each 39.6 dtex. The material used for
the sheat in the bicomponent fiber was PVDF homopolymer, (Solef 1006). The
core material is used as an inner electrode due to its electrical conductivity. The
core material is a mixture of HDPE (ASPUN 6835A) and 30 % carbon black
(Ensaco 260) which was used to create the conductivity. While melt-spinning the
PVDF fiber was drawn with a solid state draw (SSDR) of 2.3. During the spinning
the bicomponent fiber was in-lined poled with the voltage of -9 kV. In order to
achieve the in-line poling one of the last stretching wheels was removed in favor
of the in-line poling equipment. The sample was made 2013-12-11 at Swerea IVF
in Mölndal. The technical data was provided by Swerea IVF.
3.3 Conductive material
The materials used, due to its conductivity is described in the following sections.
3.3.1 Silver paint
The conductive material used for connecting the inner electrode was a silver paint
c ll d “Ag Silv P in ” Ag Sci n i ic Ld . c n ining silv icl s.
3.3.2 Copper tape
A conductive copper tape from 3M was used to connect the silver paint and
additionally the inner electrode. The conductive tape gives a higher surface for the
probes to be attached upon.
3.3.3 Copper thread
A conductive thread made of copper was used to extend the outer electrode while
testing. The thread was a monofilament from Leoni with a diameter of 0.1 mm.
3.3.4 Coating
One material was used in this study as an outer electrode. A coating was chosen
due to its ease in applying evenly compared to twist the PVDF with a conductive
yarn. A thin layer of Elastosil® LR 3162 A/B from Wacker Chemie AG is applied
to the surface of yarn. The coating is an electrically conductive two component
silicone rubber. The vulcanization of the rubber is done by mixing the A- and B-
component and with a relative short curing time with heat. The estimated
conductivity given by the supplier is 0.09 S/cm.
3.4 Attachment materials
The materials used in order to fasten the piezoelectric PVDF fiber are described in
following two sections.

12
3.4.1 Thread
The material used to fasten the piezoelectric fiber to the carrier and the stent was a
thread used in overlock machines. The thread was from the company Ackermann-
Göggingen AG nd c ll d “Synton” wi h 6 / d x and made of polyester.
3.4.2 Glue
In order to fasten the piezoelectric fiber in the stent structure, a glue was used
from Loctite called Superglue Precision was used.
3.5 Stent
The stents used in this study kindly supplied by Södra Älvsborgs Sjukhus were
n c d by M.I. T ch (K ) “H n s n ” d s in h b w l. It
is of a SEMS type, the dimensions are given in figure 5. The stent has larger flare
ends for an anti-migration effect, flexible structure and radiopaque8 markers.
Figure 5 A display of the stent used in this study. All the dimensions are given while measuring in an
uncompressed state which varies if any force is applied.
3.6 Secondary structure
The material used for the secondary structure is a mosquito net found in many
conventional stores. The one used in this study has the weave construction of a
plain weave see figure 6. The warp and weft are made of polyester filament yarns.
The whole structure is coated after weaving with polyvinylchloride (PVC) in a
grey color, giving a stable no shearing structure but still a drapable textile.
Figure 6 The plain weave mosquito net displayed showing that the plain weave has a quadratic shape.
8 Visible while taking x-ray photographs.

13
4 Method
This chapter presents the preparation of the used materials, how the different
testing structures were made, describing developed methods and how the
characterization was conducted.
4.1 Yarn making for samples
The different steps in preparing the yarn are described in detail below.
4.1.1 Pre-shrinking and pre-shrinkage test
All bicomponent PVDF yarns were pre-shrinked before use. The pre-shrinking
was made by placing the yarn on paper and placed in an oven with temperature
C for 1 hour. After heating, the samples were left reduce the temperature to
room temperature before other use or process.
Due to the observation, while handling the fiber in high temperatures, the fiber
sh nk, “ -sh ink g s ” w s c nd c d. 10 meters of the bicomponent
PVDF was taken and carefully cut into 10 pieces of 1 meter. The pieces where
heated in an oven at temperature C for 1 hour. After heating, all fiber pieces
where left to reduce the temperature to room temperature. All samples where
carefully measured post heating and compared to initial length.
4.1.2 Coating
All samples were prepared with coating Elastosil® LR 3162 A/B. The two
component silicone rubber coating was mixed in ration of 1:1, according to the
n c ’s ins c i ns. Th c ing w s c lly li d h bic n n
PVDF fiber which was placed on greaseproof paper, with a spatula. The spatula
was used to cover and align the filaments. They samples were moved onto a
second greaseproof paper. The coated fibers where cured in an oven at
temperature C for 1 hour. All samples where reduced to room temperature
before other use.
4.1.3 Preparation of connection to the inner electrode
To be able to connect the core of the fiber, the inner electrode, a paste was needed
to be applied. A scalpel was used to cut the fiber. The scalpel has a lower degree
of shearing to the fiber ends than a scissor when cutting. Th s “Ag Silv
P in ” was smeared at the end of the fiber and approximately one centimeter
further along the fiber. A piece copper tape was applied on top of the silver paint,
enabling a steady connection to the probe. The other fiber ends was sealed off
with Superglue Precision in order to avoid short cuts in the circuit.
4.1.4 Pre-testing of piezoelectricity
Every fiber was characterized with respect to its piezoelectric activity before any
application to make sure the production of each sample was successfully made.
The inner and outer electrode was connected to a PicoScope 5000 Series. Then the
sample was stretched, by hand in order to see if the sample gave a response. All
samples which gave response were used in further testing.

14
4.2 Replicability test
This replicability test is made to evaluate the differences between produced
samples. Additionally, the test was conducted to evaluate the replicability of the
produced samples and estimate the reliability of the sensor. The test is conducted
in quantative measures and random sampling. The test was conducted in a
reometer ”Physica MCR 500” from Paar Physics situated at the Swedish School
of Textile in order to achieve the exact strain and frequency to enable the same
test conditions.
10 meters of pre-shrunken bicomponent PVDF was taken and cut into pieces of 1
meter. One sample of 20 cm was cut out of every 1 meter piece at random origin.
The origin was determined with a random number generator. The cut samples
were coated with Elastosil® LR 3162 A/B according to the instructions
concerning coating and connecting the inner electrode in section 4.1.2. The
coating was placed in the middle of the sample with the length of 15 cm leaving
2.5 cm of uncoated yarn on each side. All samples where coated with masking
tape to ensure electrical insulation from the rheometer.
Each sample was tested 5 times. During testing a Picoscope was connected to the
piezoelectric yarn and the voltage output was recorded. Pre-programmed settings
made for testing fibers was used in the software for the reometer. The settings
used were: an increase of momentum of 4 mNm until stretched, the applied
momentum of 2.8 mNm with the frequency of 5 Hz. The mean value (MV) from
each testing curve was used in further calculations.
4.2.1 Testing in low pH
The application area which is the bowel has harsh conditions considering pH. A
simple test was conducted to record if a low pH affects the piezoelectric PVDF
fiber and the coating. 3 glass beakers were filled with 200 ml of 30% hydrochloric
acid in each. The pH was measured with litmus paper to ensure a pH of 1. 3
different samples where made. Sample 1 was the piezoelectric PVDF yarn which
was cut into a piece of 10 cm. Sample 2, a coated piezoelectric PVDF fiber of 10
cm. Sample 3, a square of the coating. Each sample was placed in a beaker which
was enclosed and left for 24 h. The samples were after 24 h taken from the
beakers and dried in room temperature.
Two different tests were conducted when the sample had been in acid for 24 h:
Rubbing with a paper onto the surface
Strain until breakage
The evaluation was done ocularly. Each sample was compared with an untreated
sample of same sort and evaluated from each other.

15
4.3 Textile structures
The structures used in this study have a resemblance of a grid with the pattern of a
loose plain weave. The construction was chosen due to a grid has the same pattern
as a coordinate system, giving the warp a y-axel and the weft an x-axel. When
there is more than 2 points in a reference system a 3D image is possible to project.
The same theory can be applied on a square where the number of points increases
from 3 to 4. If the reference point shown in figure 7, while measuring has the
value zero and the remaining points have different values from the reference point
a “height” difference can be estimated when considering the value of the reference
point. Giving a 2D grid, which is bent in the third dimension. The evaluation
method is used during measurements of the two different structures described in
following sections.
Figure 7 The figure to the left defines how many points needed to illustrate a 3 dimensional structure.
The figure to the right shows how the reference point (where the red arrow is pointed) is related to
each corner in a square when in a coordinate system. By relating the reference point to the other three
points (corners) shown with green arrows in the figure, a 3 dimensional projection of a reference
system is possible.
All samples in the following sections which where integrated in a structure had a
copper thread connected to the outer electrode. The cooper thread is extension of
the outer electrode when tested to avoid strain from testing equipment. One
copper thread was used for each piezoelectric PVDF yarn.
4.3.1 First sample
In order to test if it is possible to make a useful coordinate system of a
piezoelectric PVDF fiber a test sample called sample 0, with 4 piezoelectric
PVDF yarns making a square was done. Sample 0 was made with 4 PVDF fibers
prepared according to section 4.1 with dimensions of 10 cm yarn and 5 cm of
coated area. The 4 yarns were placed on a carrier of a plain weave mosquito net as
shown in figure 8. In order to place and keep them in a strained position, all yarns
were sewn onto the carrier in the structural pattern of a plain weave and a square.
16
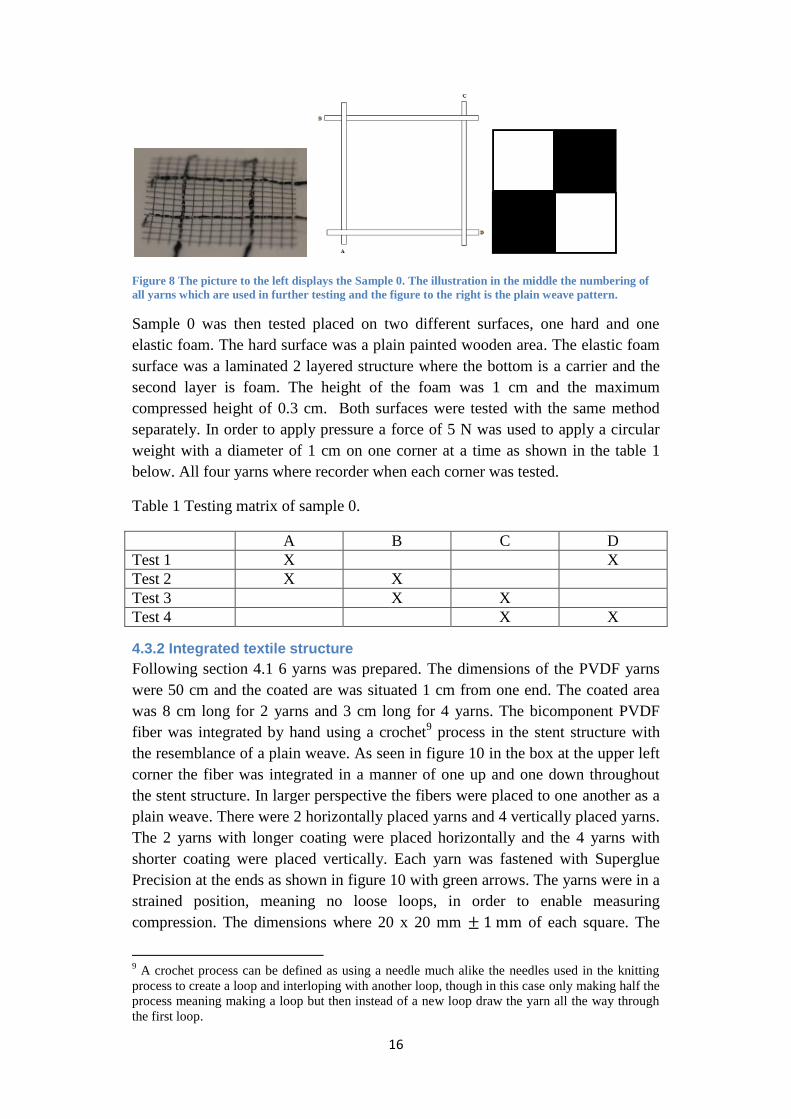
Figure 8 The picture to the left displays the Sample 0. The illustration in the middle the numbering of
all yarns which are used in further testing and the figure to the right is the plain weave pattern.
Sample 0 was then tested placed on two different surfaces, one hard and one
elastic foam. The hard surface was a plain painted wooden area. The elastic foam
surface was a laminated 2 layered structure where the bottom is a carrier and the
second layer is foam. The height of the foam was 1 cm and the maximum
compressed height of 0.3 cm. Both surfaces were tested with the same method
separately. In order to apply pressure a force of 5 N was used to apply a circular
weight with a diameter of 1 cm on one corner at a time as shown in the table 1
below. All four yarns where recorder when each corner was tested.
Table 1 Testing matrix of sample 0.
A B C D
Test 1 X X
Test 2 X X
Test 3 X X
Test 4 X X
4.3.2 Integrated textile structure
Following section 4.1 6 yarns was prepared. The dimensions of the PVDF yarns
were 50 cm and the coated are was situated 1 cm from one end. The coated area
was 8 cm long for 2 yarns and 3 cm long for 4 yarns. The bicomponent PVDF
fiber was integrated by hand using a crochet9 process in the stent structure with
the resemblance of a plain weave. As seen in figure 10 in the box at the upper left
corner the fiber was integrated in a manner of one up and one down throughout
the stent structure. In larger perspective the fibers were placed to one another as a
plain weave. There were 2 horizontally placed yarns and 4 vertically placed yarns.
The 2 yarns with longer coating were placed horizontally and the 4 yarns with
shorter coating were placed vertically. Each yarn was fastened with Superglue
Precision at the ends as shown in figure 10 with green arrows. The yarns were in a
strained position, meaning no loose loops, in order to enable measuring
compression. The dimensions where 20 x 20 mm of each square. The
9 A crochet process can be defined as using a needle much alike the needles used in the knitting
process to create a loop and interloping with another loop, though in this case only making half the
process meaning making a loop but then instead of a new loop draw the yarn all the way through
the first loop.
17
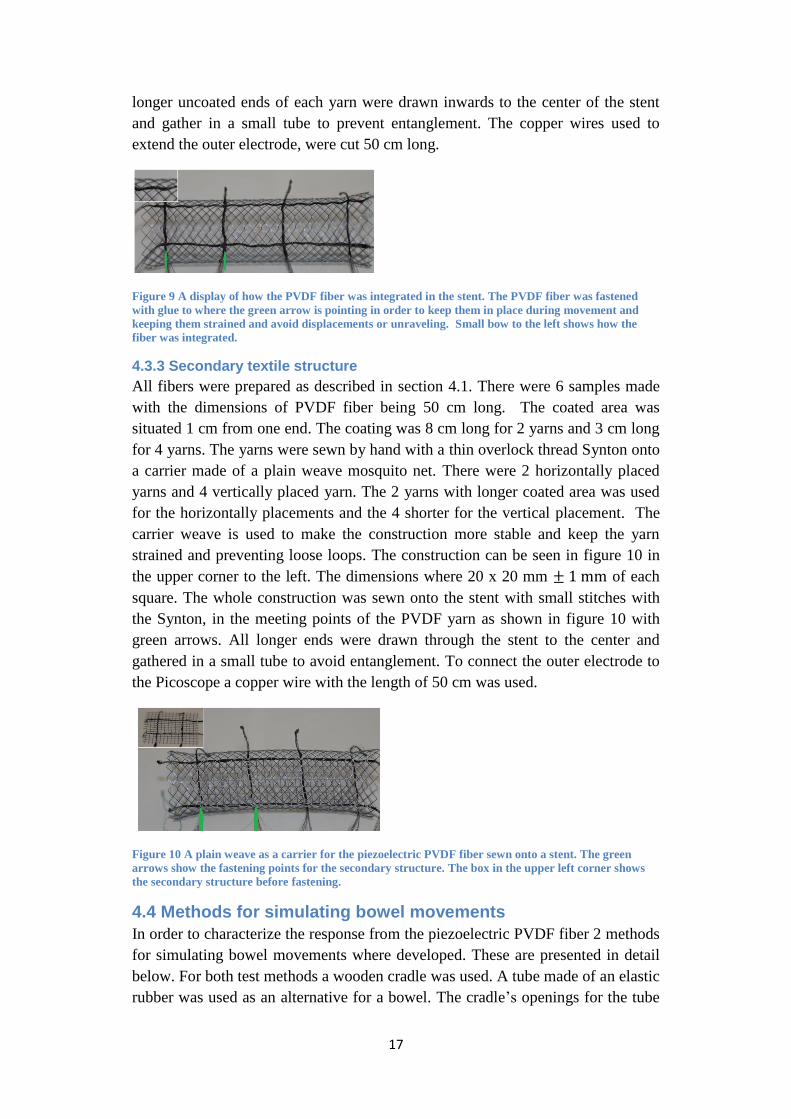
longer uncoated ends of each yarn were drawn inwards to the center of the stent
and gather in a small tube to prevent entanglement. The copper wires used to
extend the outer electrode, were cut 50 cm long.
Figure 9 A display of how the PVDF fiber was integrated in the stent. The PVDF fiber was fastened
with glue to where the green arrow is pointing in order to keep them in place during movement and
keeping them strained and avoid displacements or unraveling. Small bow to the left shows how the
fiber was integrated.
4.3.3 Secondary textile structure
All fibers were prepared as described in section 4.1. There were 6 samples made
with the dimensions of PVDF fiber being 50 cm long. The coated area was
situated 1 cm from one end. The coating was 8 cm long for 2 yarns and 3 cm long
for 4 yarns. The yarns were sewn by hand with a thin overlock thread Synton onto
a carrier made of a plain weave mosquito net. There were 2 horizontally placed
yarns and 4 vertically placed yarn. The 2 yarns with longer coated area was used
for the horizontally placements and the 4 shorter for the vertical placement. The
carrier weave is used to make the construction more stable and keep the yarn
strained and preventing loose loops. The construction can be seen in figure 10 in
the upper corner to the left. The dimensions where 20 x 20 mm of each
square. The whole construction was sewn onto the stent with small stitches with
the Synton, in the meeting points of the PVDF yarn as shown in figure 10 with
green arrows. All longer ends were drawn through the stent to the center and
gathered in a small tube to avoid entanglement. To connect the outer electrode to
the Picoscope a copper wire with the length of 50 cm was used.
Figure 10 A plain weave as a carrier for the piezoelectric PVDF fiber sewn onto a stent. The green
arrows show the fastening points for the secondary structure. The box in the upper left corner shows
the secondary structure before fastening.
4.4 Methods for simulating bowel movements
In order to characterize the response from the piezoelectric PVDF fiber 2 methods
for simulating bowel movements where developed. These are presented in detail
below. For both test methods a wooden cradle was used. A tube made of an elastic
rubber was used as an alternative for a bowel. The cradle’s openings for the tube

18
were slighter smaller than the tube in order for it to stay in place. The tube was cut
in a length where approximately 1.5-2 cm on each side of the cradle was sticking
out. While testing, the tube was in a stretch condition, meaning the tube was not
bending anywhere inside of the cradle. Additionally, clamps were used to fasten
the elastic tube to each side of the cradle. The testing method ring compression
was fastened with an additional rack for stabilizing the setup. The testing method
ring movement was not fastened with any additional clamps. Both of the named
methods are described in following sections 4.4.1 and 4.4.2.
4.4.1 Ring compression method
The bowel mainly has muscle contractions to push the content of the bowel
forward to simulate the motion a ring compression test was developed. All the
engineering drawings can be found in Appendix A with the dimensions of each
part. Additionally, some of the dimensions are used in the calculations of the
torque10
, force11
and pressure12
.
A compression with the compressed shape of an oval, while in rest, a perfect
circle was made with one side movable and the other non-movable. A lever is
used to push a metal piece forward which presses the movable piece forward
causing compression of the stent. In order to apply force on the lever, a
dynamometer was hanged in the outer part of the lever. More details of where and
dimensions can be found in the drawings in Appendix A. As seen in figure 11 the
dynamometer is placed in a position where it draws the lever upwards, giving
strain to the stent.
Figure 11 A display of how the method was set-up. In the actual testing the stent is not as far out to the
side as it is in this picture, it shows only to understand the assembly. The large green arrow represent
where the force F1 is applied and is measured with a dynamometer.
10
Torque is defined as τ=r x F where F is the force vector, r is a vector and the distance from
where the force is applied and the torque is measured which gives that τ is the torque vector..
(Serwey & Jewett, 2013) 11
The force F is defined as follows: F=ma where the m is mass and a is the acceleration..
(Serwey & Jewett, 2013) 12
The pressure can be defined as follows
where F is the applied force and A is the area of
which the force is distributed over. (Serwey & Jewett, 2013)

19
In order to understand how much force and pressure was applied on the stent,
additionally following calculations, an approximation was done. The
measurement of the lever can be found in the sketches for the testing device in
Appendix B. The relationship for the force applied F1 and force transmitted F2 can
be approximated as follows with figure 12, a simplified reference drawing. All
friction forces were ignored.
When is measured with a dynamometer in neutral position:
, and
Figure 12 The relation while force is applied to the lever to the left. The force distribution of the force ,
the pressure when acting on the stent is displayed in the figure to the right colored with grey.
The following equation is retrieved from figure 14
Eq. 1
The applied when testing were , and
The pressure is approximated by calculating the area from the dimensions in
Appendix A and is illustrated in figure 15. Where the area is calculated with the
measured diameter of 20 mm during compression when giving
which gives the pressure affecting the stent:
4.4.2 Ring movement method
In order to resemble muscle contractions a ring movement method was done. All
engineering drawings and dimensions of each machine part can be found in
Appendix B. Some of the dimensions are used in calculations.
Four plastic wheels were fastened in an octagon shaped frame. The metallic frame
has one side with the possibility to open. The opening is fastened with a screw and

20
a screw-nut. All four wheels are mounted freely on its own axis in order for each
wheel to move separately. The montage gives the test area where the tube
containing the stent is placed. Due, to the properties of the montage the stent is
compressed circularly. The assembly is displayed in figure 13.
Figure 13 A display of the ring movement method. The stent is showing only for presentation purposes
only. When the method is used in tested the tube is fastened in the cradle and the stent is placed in the
middle in length direction of the tube.
The applied force is approximated by taking the force needed in the previous
method described in section 4.3.1 to achieve the same diameter which in both
cases is 20 mm.
4.5 Testing of the stent
The yarns were prepared according to sections 4.2.1 and 4.2.2, applied with each
structure on each side of the stent. The testing set-up is followed by the scheme
shown in figure 14. All tests are described with which yarns are tested and which
section the ring compression method device was placed. When both sides are
tested the setup for the background is the same but called sample 1 for the
integrated structure and sample 2 for the secondary structure. The ring
compression method is used in three different sections shown in figure 14 and the
ring movement method was rolled horizontal throughout the whole stent. The
settings in the software for the PicoScope were; a filtration of 10 Hz and a scale of
1 s/div.

21
Figure 14 A display of the order of the yarns and placement of the different sections. The setup is used
throughout this study.
4.5.1 Test with ring compression method
The test matrix which gives the different testing configurations on sample 1 and 2
with the ring compression method can be seen in table 2 below. Each side is tested
according to the matrix and is a one sided test. The number of tests is simplified.
Table 2. Testing matrix for ring compression method
A B C D E F Section 1 Section 2 Section 3
Test 1 X X X X X
Test 2 X X X X X
Test 3 X X X X X
Test 4 X X X X X
Test 5 X X X X X
Test 6 X X X X X
Test 7 X X X X X
Test 8 X X X X X
Test 9 X X X X X
When both structures are tested, a double sided test, sample 1 has the symbol X1
and sample 2 has the symbol X2. The test matrix with the different test
configurations are shown below in table 3. The number of test is simplified from
the previous one sided test.
Table 3 Testing matrix for ring compression method when both structures are
tested.
A B C D E F Section 1 Section 2 Section 3
Test 1 X1
X2
X1
X2
X
Test 2 X1
X2
X1
X2
X

22
Test 3 X1
X2
X1
X2
X
Test 4 X1
X2
X1
X2
X
4.5.2 Test with ring movement method
The one sided test matrix for the yarn configurations on sample 1 and 2 with the
ring movement method can be seen in table 4 below. The number of tests has
been decreased from the ring compression method due to the rolling motion
throughout the horizontal line of the stent which excludes the three regions.
Table 4 Testing matrix with ring movement method
A B C D E F
Test 1 X X X X
Test 2 X X X X
Test 3 X X X X
The test matrix for the double sided test can be seen in table 5. As in section 4.5.1
when conducting a double sided test the different X:s has the same meaning in
this section.
Table 5 Testing matrix with ring movement method when both structures are
tested.
A B C D E F
Test 1 X1
X2
X1
X2
Test 2 X1
X2
X1
X2
Test 3 X1
X2
X1
X2
4.6 Testing after poled in direct contact
The samples from section 4.5 when situated in the stent were poled with direct
contact in order to make sure the differences between the points are not
irregularities from the in-line poling. The sample was heated to a temperature of
6 C. The outer and inner electrode was connected to HV-Power Supply 0-10 kV
from PHYWE. A voltage of 1.5 kV was applied to the circuit during 10 seconds.
The ring compression method and the test matrix described in section 4.5.2 were
used.
4.7 In vivo
The in vivo test was a part of a larger framework in research of stents at Södra
Älvsborgs Sjukhus where there was a possibility to perform an in vivo test. One

23
pig was used in the in vivo test. The pig was anesthetized during testing. The stent
was inserted and placed where the orifice of the stomach was placed in the middle
of the stent. In order to increase bowel movements Neostigmin a medicinal
preparations was used. The Neostigmin13
injected intravenously in different
concentrations into the pig. Sample 1 was tested during the first injection14
of
Neostigmin. The test configuration of the yarns was A,B, D and E.
13
It is used to reverse neuromuscular blockade induced when anesthetic is used, since anesthetic is
often a muscle relaxant. (PharmaCoDane, 2014) 14
Further information is given after request to the author and/or supervisor

24
5. Result
The results are divided and followed by the order they where described in section
4. Concerning the ring compression method, the ring movement method and the
direct poling the main findings are presented. The results which are not displayed
in section 5 can be found in Appendix C-E to completion. The curves are
decreased to manageable size, where the output is visually comprehensible. All
yarns were connected numbered from the bottom and up after the numerical order
of the letters.
5.1 Pre-shrinking
The yarn was measured pre-heating and s -h ing in C. The total mean
value (MV) for the 10 yarns where 85.25 cm giving a shrinkage of 14.75%.
5.2 Replicability test
Each yarn was tested 5 times and the mean value from each curve was taken. A
MV from the 5 test was then calculated for each yarn and is displayed figure 15.
Figure 15 The individual MV of each tested yarn. Where the yarns are represented in the x-axis and
the total MV of each yarn are represented in the y-axis.
5.1.2 Testing in low pH
The samples were exposed to hydrochloric acid with pH 1 during 24 h. In table 6
the test result from the two testing methods are displayed. The evaluation was
conducted ocurlarly.
Table 6
Sample 1 2 3
Rubbing Clean paper Some CB stained
the paper
Some CB stained
the paper
Strain until
breakage
More brittle Slightly more
brittle
Slightly more
brittle
0
20
40
60
80
100
120
140
1 2 3 4 5 6 7 8 9 10
25
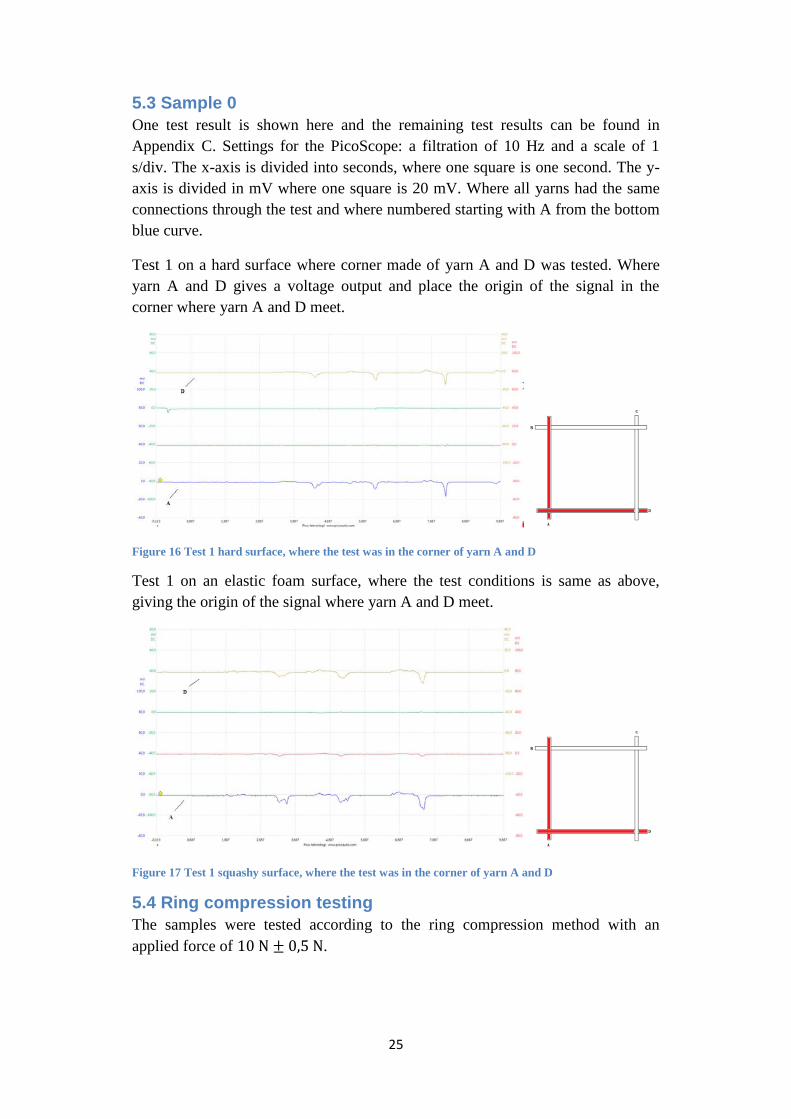
5.3 Sample 0
One test result is shown here and the remaining test results can be found in
Appendix C. Settings for the PicoScope: a filtration of 10 Hz and a scale of 1
s/div. The x-axis is divided into seconds, where one square is one second. The y-
axis is divided in mV where one square is 20 mV. Where all yarns had the same
connections through the test and where numbered starting with A from the bottom
blue curve.
Test 1 on a hard surface where corner made of yarn A and D was tested. Where
yarn A and D gives a voltage output and place the origin of the signal in the
corner where yarn A and D meet.
Figure 16 Test 1 hard surface, where the test was in the corner of yarn A and D
Test 1 on an elastic foam surface, where the test conditions is same as above,
giving the origin of the signal where yarn A and D meet.
Figure 17 Test 1 squashy surface, where the test was in the corner of yarn A and D
5.4 Ring compression testing
The samples were tested according to the ring compression method with an
applied force of .

26
5.4.1 Sample 1
Some of the resulting curves are displayed below. The result which is not
displayed here can be found in Appendix D. Settings for the PicoScope: a
filtration of 10 Hz and a scale of 1 s/div. The x-axis is divided into seconds, where
one square is one second. The y-axis is divided in mV where one square is 20 mV.
In figure 18 below test 1 is displayed. Where the two bottom curves give a clear
signal on the horizontal yarns where the actual pressure is and the two upper
curves, the vertical yarns gives a slight signal.
Figure 18 Test 1 Where the yarns A, B, E, and F are tested in section 1.
In figure 19 below test 4 is shown. Where the bottom curve the yarn A gives a
clear signal where the pressure is in the horizontal yarn and the vertical yarns has
a small signal.
Figure 19 Where the yarns A, D, E, and F are tested in section 1.
In figure 20 below test 7 is displayed. Where all curves show small output signal.
None of the yarns has a direct pressure.

27
Figure 20 Where the yarns C, D, E, and F, is tested in section 1.
5.4.2 Sample 2
A few result are presented in this section, the remaining can be found in Appendix
D. Settings for the PicoScope: a filtration of 10 Hz and a scale of 1 s/div. The x-
axis is divided into seconds, where one square is one second. The y-axis is divided
in mV where one square is 20 mV.
Test 1 is shown below in figure 21. The horizontal yarns A and B which are the
two bottom curves gives a higher output signal where the pressure is than the
vertical yarns which are not affected directly by the pressure.
Figure 21 Where yarns A, B, E, and F which are tested in section 1
Test 4 is shown below in figure 22. Where the bottom curve is the horizontal yarn
A giving a higher output signal due to the direct pressure compared to the vertical
yarns D, E and F which is not affected to direct pressure.
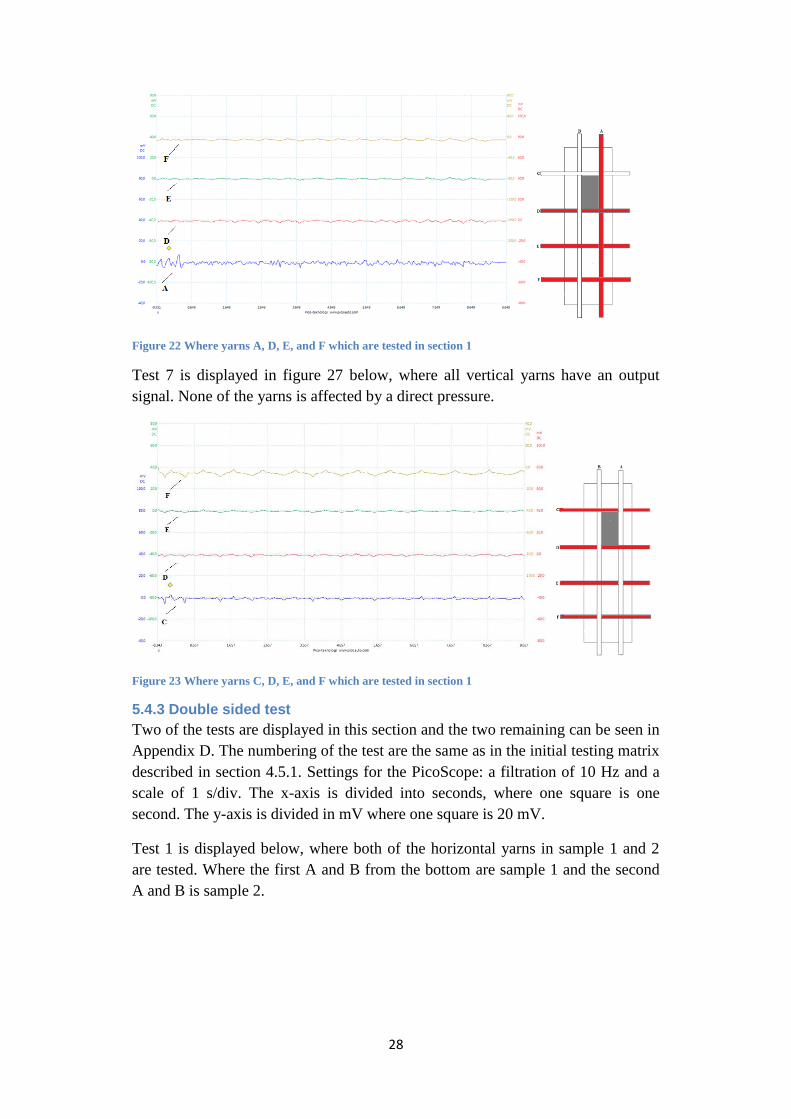
28
Figure 22 Where yarns A, D, E, and F which are tested in section 1
Test 7 is displayed in figure 27 below, where all vertical yarns have an output
signal. None of the yarns is affected by a direct pressure.
Figure 23 Where yarns C, D, E, and F which are tested in section 1
5.4.3 Double sided test
Two of the tests are displayed in this section and the two remaining can be seen in
Appendix D. The numbering of the test are the same as in the initial testing matrix
described in section 4.5.1. Settings for the PicoScope: a filtration of 10 Hz and a
scale of 1 s/div. The x-axis is divided into seconds, where one square is one
second. The y-axis is divided in mV where one square is 20 mV.
Test 1 is displayed below, where both of the horizontal yarns in sample 1 and 2
are tested. Where the first A and B from the bottom are sample 1 and the second
A and B is sample 2.

29
Figure 24 Where yarns A and B in both structures are tested in section 1.
Test 2 is displayed in figure 25 below where yarns C and D are tested
simultaneously in both sample 1 and 2. Where the first C and D from the bottom
is sample 1 and the second C and D is sample 2.
Figure 25 Where yarn C and D is tested in sample 1 and 2.
5.5 Ring movement testing
The samples were tested according to the ring movement method. The placement
of the yarns is described in section 4.5.
5.4.1 Sample 1
One test of three tests is displayed here and the two remaining can be found in
Appendix E. Settings for the PicoScope: a filtration of 10 Hz and a scale of 1
s/div. The x-axis is divided into seconds, where one square is one second. The y-
axis is divided in mV where one square is 20 mV.
Test 1 is shown in the figure 26 below where the 2 lower curves are the
horizontally placed A and B yarns which has constant pressure from the ring
method and the two upper curves represent the vertically placed yarns E and F.
The green curve yarn E has an output voltage before the brown curve yarn F. The
displacement of yarn F gives a origin of the signal in the structure.
30
Figure 26 Where the yarns A, B, E and F are tested from the left side.
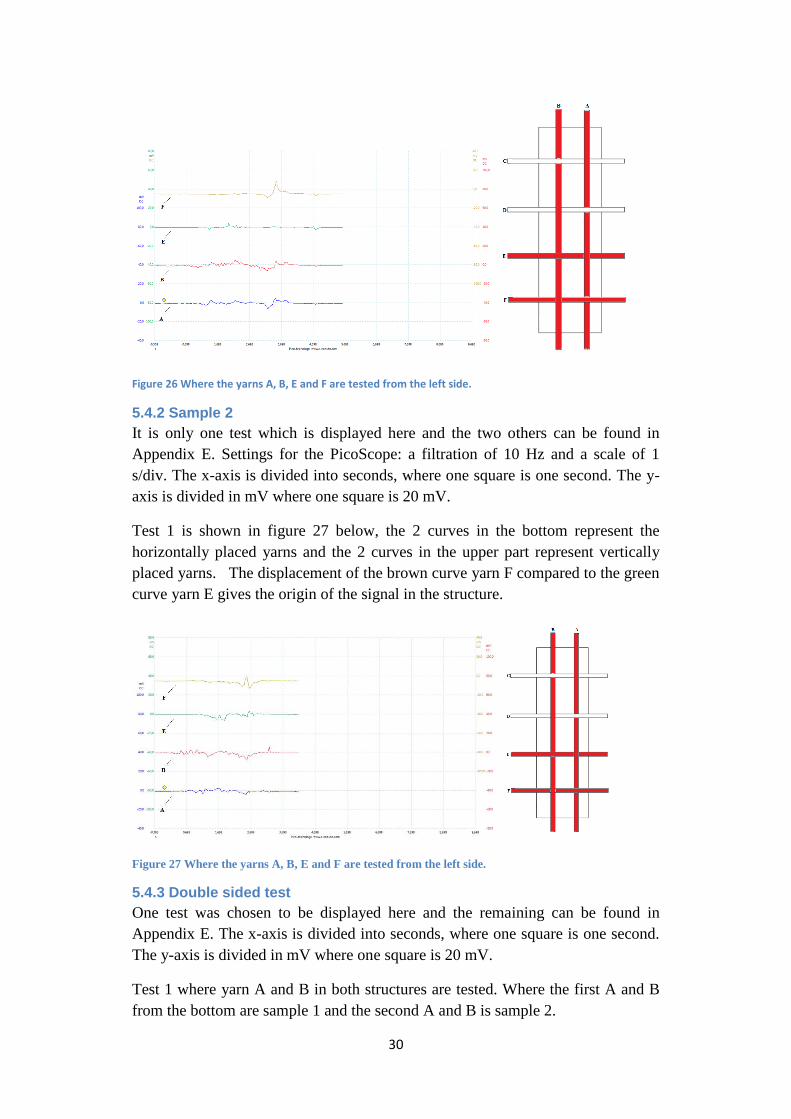
5.4.2 Sample 2
It is only one test which is displayed here and the two others can be found in
Appendix E. Settings for the PicoScope: a filtration of 10 Hz and a scale of 1
s/div. The x-axis is divided into seconds, where one square is one second. The y-
axis is divided in mV where one square is 20 mV.
Test 1 is shown in figure 27 below, the 2 curves in the bottom represent the
horizontally placed yarns and the 2 curves in the upper part represent vertically
placed yarns. The displacement of the brown curve yarn F compared to the green
curve yarn E gives the origin of the signal in the structure.
Figure 27 Where the yarns A, B, E and F are tested from the left side.
5.4.3 Double sided test
One test was chosen to be displayed here and the remaining can be found in
Appendix E. The x-axis is divided into seconds, where one square is one second.
The y-axis is divided in mV where one square is 20 mV.
Test 1 where yarn A and B in both structures are tested. Where the first A and B
from the bottom are sample 1 and the second A and B is sample 2.
31
Figure 28 Yarn A and B are tested
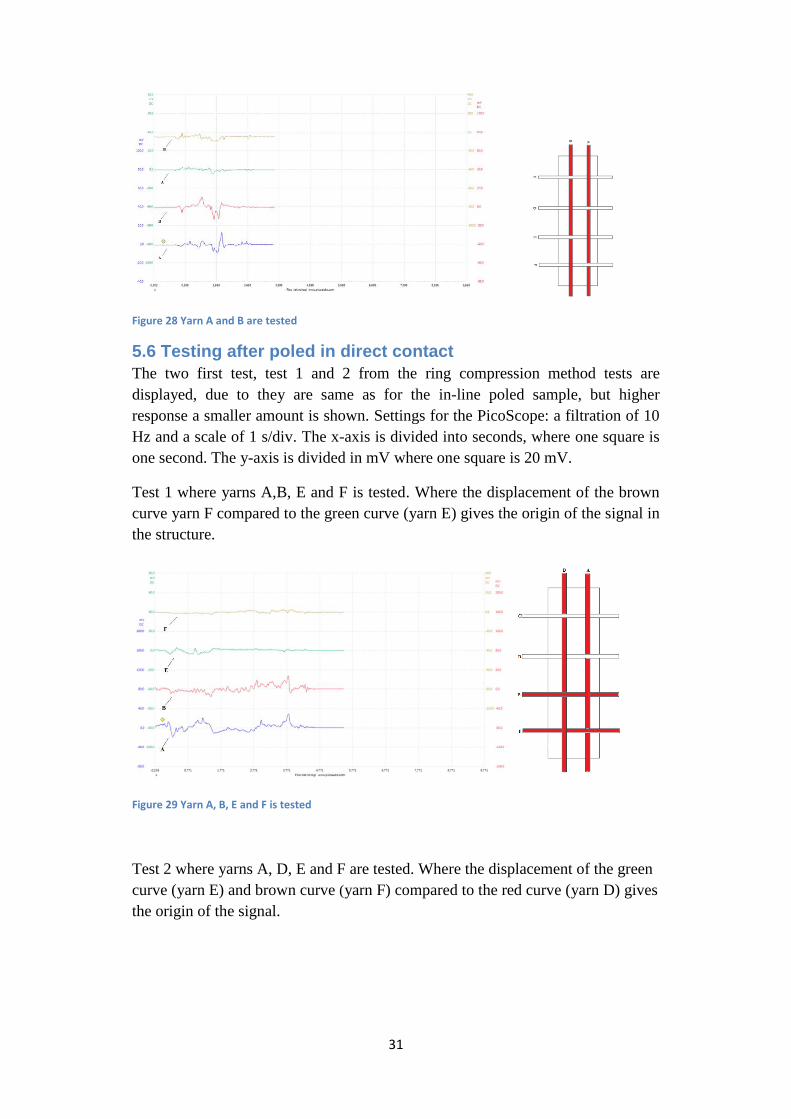
5.6 Testing after poled in direct contact
The two first test, test 1 and 2 from the ring compression method tests are
displayed, due to they are same as for the in-line poled sample, but higher
response a smaller amount is shown. Settings for the PicoScope: a filtration of 10
Hz and a scale of 1 s/div. The x-axis is divided into seconds, where one square is
one second. The y-axis is divided in mV where one square is 20 mV.
Test 1 where yarns A,B, E and F is tested. Where the displacement of the brown
curve yarn F compared to the green curve (yarn E) gives the origin of the signal in
the structure.
Figure 29 Yarn A, B, E and F is tested
Test 2 where yarns A, D, E and F are tested. Where the displacement of the green
curve (yarn E) and brown curve (yarn F) compared to the red curve (yarn D) gives
the origin of the signal.

32
Figure 30 Yarn A, D, E and F is tested
5.7 In vivo testing
The stent was placed in the orifice of the stomach, where yarns A, B, D and E
were tested after injection of Neostigmin. It was also observed that the breathing
did not disturb the recorded data. The x-axis is divided into seconds, where one
square is 10 seconds. The y-axis is divided in mV where one square is 20 mV.
Where a larger voltage output can be seen on the horizontal yarns A and B
compared to the vertical placed yarns D and E.
Figure 31 Test 1 where yarns A, B, D and E was tested. Where the numbering of the yarns started from
the bottom blue curve with yarn A.
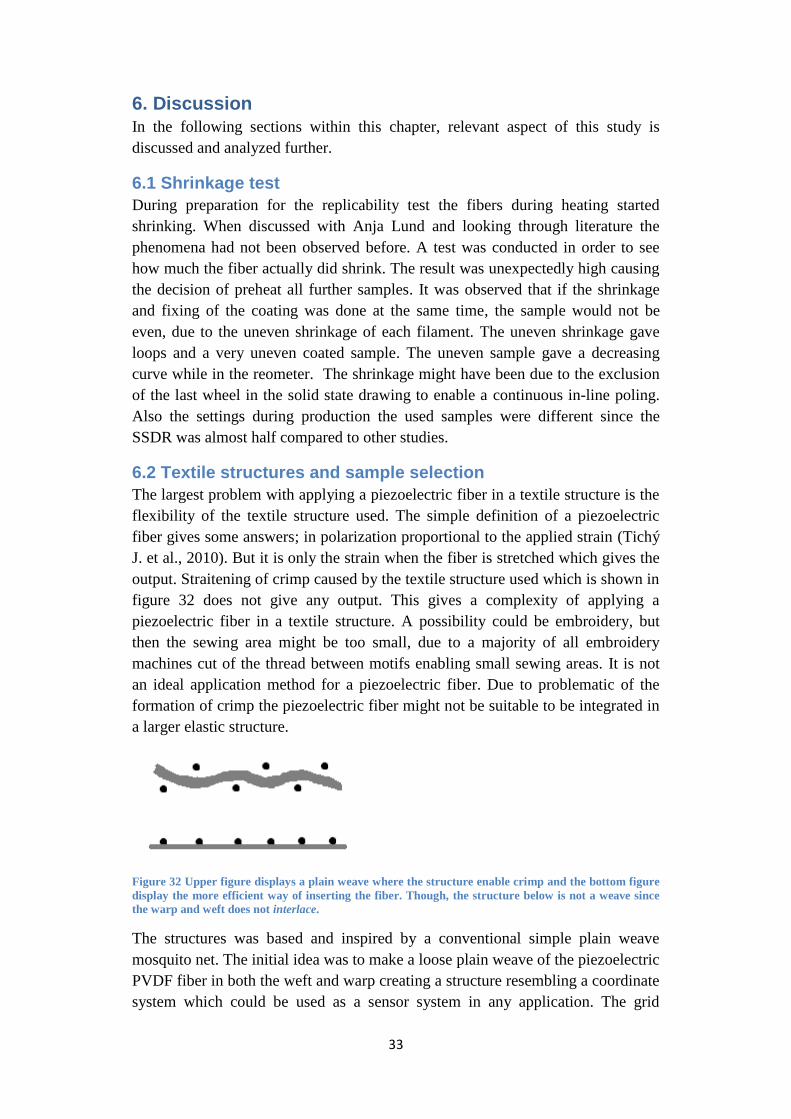
33
6. Discussion
In the following sections within this chapter, relevant aspect of this study is
discussed and analyzed further.
6.1 Shrinkage test
During preparation for the replicability test the fibers during heating started
shrinking. When discussed with Anja Lund and looking through literature the
phenomena had not been observed before. A test was conducted in order to see
how much the fiber actually did shrink. The result was unexpectedly high causing
the decision of preheat all further samples. It was observed that if the shrinkage
and fixing of the coating was done at the same time, the sample would not be
even, due to the uneven shrinkage of each filament. The uneven shrinkage gave
loops and a very uneven coated sample. The uneven sample gave a decreasing
curve while in the reometer. The shrinkage might have been due to the exclusion
of the last wheel in the solid state drawing to enable a continuous in-line poling.
Also the settings during production the used samples were different since the
SSDR was almost half compared to other studies.
6.2 Textile structures and sample selection
The largest problem with applying a piezoelectric fiber in a textile structure is the
flexibility of the textile structure used. The simple definition of a piezoelectric
fiber gives some answers; in polarization proportional to the applied strain (Tichý
J. et al., 2010). But it is only the strain when the fiber is stretched which gives the
output. Straitening of crimp caused by the textile structure used which is shown in
figure 32 does not give any output. This gives a complexity of applying a
piezoelectric fiber in a textile structure. A possibility could be embroidery, but
then the sewing area might be too small, due to a majority of all embroidery
machines cut of the thread between motifs enabling small sewing areas. It is not
an ideal application method for a piezoelectric fiber. Due to problematic of the
formation of crimp the piezoelectric fiber might not be suitable to be integrated in
a larger elastic structure.
Figure 32 Upper figure displays a plain weave where the structure enable crimp and the bottom figure
display the more efficient way of inserting the fiber. Though, the structure below is not a weave since
the warp and weft does not interlace.
The structures was based and inspired by a conventional simple plain weave
mosquito net. The initial idea was to make a loose plain weave of the piezoelectric
PVDF fiber in both the weft and warp creating a structure resembling a coordinate
system which could be used as a sensor system in any application. The grid
34
structure was also chosen due to the property of being less elastic than a knitted
structure. The first construction is unfortunately, since it is integrated in the
structure and individually designed depending on type of the stent a very
manually processed structure. The second structure´s purpose was to make a
structure which could work in symbiosis with the stent and measuring the bowel
movement. But the second structure could also be used as a generic structure on
the covered stents and in any application where compression needs to be
measured.
The evaluation between the 2 structures was done ocurlarly in the given curves.
The mean value is not an optimal evaluation since in the ring movement method
the displacement of e.g. the forth curve compared to the first is the actual result.
6.2.1 Sample 0
Sample 0 was chosen in order to see if the theoretical reasoning of creating a
coordinate system to place the origin of the signal was possible when used on a
hard and squashy surface. At first, the sample was actually done as a plain weave
structure by hand. But the coating process made the system unstable, the coating
was intended to keep the yarns in place which when applied by hand was not the
case, due to the process ability of the coating. It is difficult to apply the coating
due to the viscosity. Also the strain of the fiber was not satisfying and reducing
the size was not an option. Instead a carrier, in the form of plain weave mosquito
net was chosen and the piezoelectric PVDF yarn was sewn on by hand. The
testing showed that it worked due to the low voltage output from the yarns
forming the corners which was not tested.
6.2.2 Sample 1
The structure of sample 1 was chosen due to the theory that the piezoelectric yarn
would follow the stents movement during compression in a higher degree than
when applied as a secondary structure on top of the stent. The yarns was still in a
plain weave construction but had to be glued in the meeting points in order to
keep the strain. Making a knot in each did not work in order to keep the fiber in
place. Though, the fibers when in placed had some crimp when the stent was in
neutral position. By gluing the meeting points the thought was to keep a strain
while the stent was subjected to compression.
6.2.3 Sample 2
The structure of sample 2 was chosen due to the already discussed theory of
making a plain weave. From the beginning the yarn was loosely sewn onto the
carrier, though when testing few or none signals were recorded. Due to the low
output more stitches were used which also gave a higher output when using the
developed test methods.
6.3 Material selection
In this study PVDF was used due to its possibility, compared to PLA, a more
environmentally friendly fiber, can withstand harsh conditions in the bowel e.g.

35
pH 1. PVDF is also the polymer known to have the highest piezoelectric effect.
(Hottle, Bilec, & Landis, 2013) Early in the study the choice was to use a
continuously made, meaning an in-line poled piezoelectric fiber, merely due to the
fact that the only available at that time was an in-lined poled fiber. But the major
reason was to investigate whether or not a continuous textile processed
piezoelectric PVDF fiber was ready for applications.
The reason a carrier was used in this study was merely due to the aim of the study:
measure dynamic compression. Not to develop a perfect coated plain weave by
hand. The chosen mosquito net was used due to its structure, the even weave
which was coated giving few or none displacements of yarns during shearing
forces. This meant a very stable and form stable structure to work with during this
study.
Only one sort of stent was used in this study, an open, since it is easier to integrate
fibers in an open structure. But also due to the fact that there are several different
stent with different properties making the actual characterization of the
piezoelectric PVDF fiber more complex than it had to be.
The choice of using a silicone coating as an outer electrode was merely due to
remove the obstacle of having a liquid resembling gastric juice with a pH 1
inserted in the testing tube while using the test methods. The difficulty while
testing would increase and the safety decrease. The choice went to the conductive
silicone rubber Elastosil® LR 3162 due to its high conductivity and has been used
successfully in previous research on Swerea IVF and the Swedish School of
Textile.
6.4 Construction of testing methods
The possibilities of actually testing a piezoelectric fiber itself and when it is
integrated are fairly limited at the Swedish School of Textiles, especially for an
application such as a stent. Sure a tensile tester could be used, which is available
at the school. But the tensile tester applies the force evenly across the stent and
during a long time interval. Also the reometer could be used, which it was for the
replicability test, due to it was possible to set a fixed torque and the frequency.
Though, the problem with the reometer was the inability of testing the fibers when
integrated in a stent. The conditions in the bowel does not resemble the
movements these machine offers.
In order to have test conditions similar to the bowel two methods were developed
to achieve a testing and evaluation serving the purpose of measuring bowel
movement. The test methods were inspired by the movement of the bowel, both
by theoretical reading and discussing with the consulting surgeons since they have
seen actual bowel movements. But there is no certain way of knowing if it
actually is a good testing method for the specific application as in the bowel since
the area is much unexplored.

36
A further development of both test methods would be to combine them. The new
design would be by using the ring compression method and add a hydraulically
pressure to each wheel separately. The new design enables separate control and
pressure from each of the wheel giving a more dynamic pressure control but also
more ways of testing the piezoelectric PVDF fiber and different stent designs. The
more dynamic and the resemblance a test method has to the actual environment
i ’s ying s bl h b h s l is in d nd s nd h
complexity. The method would also be easier to apply to different stent sizes since
it is easier to change the testing diameter.
6.5 Applicability of testing methods to different stents
The test methods were developed in a manor where the differences in mechanical
properties between different stent for usage in a bowel where overseen, giving the
test methods a very versatile use. They where developed for the specific stents
used in the bowel and is not suitable for testing stents e.g. the application area the
heart.
There could be a potential problem while testing with the two developed method,
since the structure of the stent does not always behave the same way depending on
where the pressure is applied. Depending on the reaction of the stent the test
results could be different even though one thought it was the same measurement.
This can also be seen in the result where the curves for the horizontal placed yarns
tend to have higher output signal when testing with the ring compression method.
This property is very apparent when comparing test 2 and 3 in the double sided
test when using the ring compression method where they should in theory have
the same result, due to the symmetry of the stent but they do not. Test 3 gives
clearly a higher response compared to test 1. It is also evident when looking at the
curve from test 1, sample 1 in the ring compression method that the 2 bottom
curves should not in theory vary at all, but due to the structural behavior of the
stent they do while testing.
6.6 Replicability test
The measured differences can be due to a number of things. Since the fiber is spun
according to a conventional textile process the errors compared to laboratory
made fibers could be huge e.g. the fiber which was used in this study had a
significant smaller SSDR of 2.3 to the comparable laboratory made with a SSDR
of 4. Due to this the fiber might not have the same ratio between core and sheat,
giving different properties. It is also possible that the core, which was observed
while handling the fiber is not connected everywhere in e.g. a meter of filament,
causing a shortcut giving the whole yarn of 24 filaments different outputs
depending on where the breakage of the core occurred.
Making a sensor today of a piezoelectric PVDF fiber is possible but not reliable.
There could still be a use even thought the fiber is not reliable e.g. before all use
each fiber could be characterize of its own interval and then the irregularities in
37
the intervals could be corrected by a software. Though, this is not economically
defensible today since the advantages are less than the costs. The best way for the
future of this fiber is to optimize the continuous textile process in order to reduce
the irregularities.
6.7 Poling in direct contact
Since the replicability test showed that the irregularities were large of the required
batch an direct poling was done in order to reduce one of the errors, the in-line
poling. It is possible that the in-line poling gives uneven poling during a
continuous textile process. All the yarns where poled in direct contact and then all
test in the ring compression and movement test were done again to compare to the
previous ones. Due to this the comparison between the two structures is difficult
to do because of the structural problematic of the stent as well as the irregularities
in the piezoelectric PVDF fiber. The initial thought was that the 2 structures
would have more significant differences while measuring than the actual
measured response was.
The choice of poling in direct contact was also due to during the initial test it was
seen that small forces was not recorder by the fiber. In order to receive any results
from the in vivo testing the direct poling was done.
6.8 In vivo testing
During the testing only one structure was chosen to be tested, mainly due to time
limitations. The test configurations were reduced after careful contemplation with
the surgeons. Additionally due to the placement, in pularus, the orifice of the
stomach reduced the test configurations more. The theory during the testing was
that the stent used was too strong radially giving difficulties for the pularus to
contract properly. Due to smaller compression forces the responses were lower
than of the developed test methods. It could also be due to the pig stomach
empties in a different interval when considering time and frequency comparing to
the human stomach.
The choice of giving Neostigmin was due to when an animal is anesthetized, all
bodily functions comes to a rest or goes down in activity, even the bowel
movements. By giving the medicine the bowel movement increased enabling
measurement of the bowel movement. Unfortunately during the test, the medicine
decreased in enabling higher response after each injection. The theory was that the
medicine was tiring the bowel.
6.9 Evaluation of the developed test methods after the in vivo
testing
It is clear after the in vivo testing that the ring compression method resembles in
response to a sphincteric muscle such as the orifice of the stomach. The developed
test method is suitable to test sphincteric muscle movements. The other test
however cannot be evaluated since downwards contractions caused by the bowel

38
were never measured while in vivo testing. It is possible that the bowel does
actually compress more distributed on the stent while in the bowel than of the ring
compression method giving not as clear distinctions between the active sites.
6.10 Application in the bowel
The PVDF fiber is from the beginning a hydrophobic polymer and a high
chemical resistance. With those properties in mind, the fiber when exposed to a
pH 1 during 24 hours would not be affected by the low pH. In this study it clearly
shown that PVDF when in fiber form, a low pH gives a more brittle fiber. This
phenomena could be due to when the fiber is melt-spun and then drawn in solid
state, small cracks in micro scale may have developed. These cracks could then
enable the acid to migrate from the surface further into the fiber causing
degradation of the fiber. If the degradation has gone too far, eventually the acid
would reach the core, the inner electrode. Since the acid is conductive the core
would then be in contact via the acid, with the outer electrode causing a shortcut
in the circuit. The sensor would then be destroyed and not usable. Additionally the
extent of the poling, due to the degradation of the fiber would possibly decrease as
well. This was not tested in the low pH since the material is very irregular
produced.
On the other hand this unfortunate problem with a shortcut might not be an issue
since the main reason for wanting to measure bowel movements is to design the
perfect stent. The sensor might only be needed for one week, since it has been
shown that the movement of the stent starts already after one week. It is possible
that the actual measuring is needed only for a day or two. The measuring data
from the short period of time could then be used in a modeling program together
with a model of a stent and then simulate what different designs could cause
different muscle contractions.
When the piezoelectric PVDF fiber is integrated or used as a secondary structure
and with no shielding coating the possibility of mechanical abrasion between the
fiber and the metal threads in the stent is increased. Though, this might not be a
problem if the actual measuring is a couple of days but if it is longer than it could
be another aspect to consider.
It is not intended for the coating to be a part of the actual product since the
silicone contains CB. The affects of CB in a living organism is not fully
understood and investigated. The CB used in the silicone is supposed to aggregate
in order to increase the conductivity of the silicone. Though, the particles in that
case would be slightly larger, the problem of having the bowel absorb them and
transport them elsewhere inside the body could still exist, since the major function
of the bowel is to absorb nutrients in particle size of CB. But the problem would
on the other hand not be as large as it would be for e.g. nano tubes of carbon.
These have the ability of poking holes in surrounding tissue including the
brainstem. This problem of migrating CB could also be a possibility if the PVDF
39
is allowed to be degraded within the human body since the core contains CB, but
not in as high concentrations as of the coating.
Though, when integrated in a stent the fibers are measuring two different things:
the normal muscle contractions and the muscle contractions induced by the stent
itself. But the stent cannot sens h di nc b w n “n l” scl
contraction or an induced one. But this is the drawback of any measuring system
placed inside or integrated in a stent. On the other hand, the test result may be
compared to other measurement done in the bowel which excludes the stent,
giving a more nuanced picture of the result.

40
7. Conclusion In this report it has been show that it is possible to use a piezoelectric PVDF fiber
in order to measure compression when used in a stent for a bowel. The PVDF can
be used to place the origin of a signal within a textile structured system.
Due to irregularities in the material the structures cannot be compared to each
other. Both structures can be used in order to measure bowel movements. The
favorable structure when considering a covered stent, an uncovered stent and a
continuous textile process is the secondary structure.
The continuous textile processed in-lined poled piezoelectric PVDF fiber is not
yet suitable for making a reliable textile sensor measuring dynamic compression.
8. Further Research
In order to have further research more development needs to be conducted to
ensure the reliability of the piezoelectric PVDF fiber after a conventional textile
process such as in-lined poling and coating. Of course there are many suggestions
for further research within this area other than optimization and some of these are
listed below.
Develop a prototype which can be used as a commercial product.
Develop the bridge to conventional electronics: a connection between the
fiber and the data recorder.
Develop a visual projection of the recorded data in real time, giving a
comprehensive image to all users.
Characterize the time dependency of the applied strain which can be in
cooperated in software when used as a commercial product.

41
9. Acknowledgement
I would like to thank all participants in this very inspiring study, for making it
worthwhile and the things I´ve learned. A special thanks goes to my supervisor
Anja Lund whom has guided me throughout this project with wisdom. I am also
very thankful of all the help, encouragement and inspiration my two consulting
surgeons Per-Ola Park and Maria Bergström have given me throughout the
project.
But there are also some people whom I´d like to thank from The Swedish School
of Textiles; the two technicians Catrin Tammjärv and Maria Björklund for all help
and encouragement, Emanuel Gunnarsson whom have always encourage me
during stressful times and the bachelors in textile engineering for the company
and encouragement.
There is no words to describe the huge appreciation I have for my family and
friends who have supported me throughout, no matter the mood or how tiring I´ve
been.
Anna Vahlberg

42
10. References
Ashruf, C. M. (2002). Thin flexible pressure sensors. Sensor Review, Vol 22
(Issue 4), 322-327.
Atkins, P., & Jones, L. (2010). Chemical Principles - The Quest for Insight. New
York: W.H. Freeman and Company.
Bergström, M., & Park, P.-O. (2014, 05 13). Briefing about the current measuing
systems implications. (A. Vahlberg, Interviewer)
Bloom, D. A., Clayman, R. V., & McDougal, E. (1999). Stents and related terms:
a brief history. Urology, Volume 54, Issue 4, 767-771.
Carpi, F., & De Rossi, D. (2005). Electroactive polymer-based devices for e-
textiles in biomedicine. Information Technology in Biomedicine IEEE
Transactions on , 295-318.
Crospon Inc. (2014). Crospon Inc. Retrieved from www.crospon.com:
http://www.crospon.com/EndoFLIPTechnology.htm
Dargaville, T. R., Celina, C. M., Elliott, M. J., Chaplya, P. M., Jones, G. D.,
Mowery, M. D., . . . Martin, W. J. (2005). Characterization, Performance
and Optimization. Albuquerque, New Mexico: Sandia National
Laboratories.
Das-Gupta, D. K., & Doughty, K. (1978). Corona charging and the piezoelectric
effect in polyvinylidene fluoride . Journal of Applied Physics, 4601-4603.
Ellis, H., & Mahadevan, V. (2013). Clinical Anatomy : Applied Anatomy for
Students and Junior Doctors (13th Edition). Somerset: Wiley.
Fulmer, S. (1998). PVDF products. Metal Finishing, 87.
Govari, A., & Fenster, M. (1997). Patent No. US6053873 A. USA.
Gupta, S. (2010). E-textiles evolve to perform health monitoring functions . ATA
Journal Vol 21 Issue 2, 29-33.
Harrison, J. S., & Ounaies, Z. (. (2014, 02 28). Piezoelectric Polymers (Online).
Retrieved from http://www.cs.odu.edu/~mln/ltrs-pdfs/icase-2001-43.pdf
Hasegawa, R., Kobayashi, M., & Tadokoro, H. (1972). Molecular Conformation
and Packing of Poly(vinylidene fluoride). Stability of Three Crystalline
Forms and the Effect of High Pressure. Polymer Journal, 591-599.
Hoffer, L. (2009). Patent No. US20110054333 A1. USA.
Hottle, T. A., Bilec, M. M., & Landis, A. E. (2013). Sustainability assessments of
bio-based polymers. Polymer Degradation and Stability 98, 1898-1907.

43
Jezernik, S., & Grill, M. W. (2001). Optimal filtering of whole nerve signals.
Journal of Neuroscience Methods Vol 106 Issue 1, 101-110.
Kang, S.-G. (2010). Gastrointestinal Stent Update. Gut and Liver, Vol 4, 19-22.
Kellow, J. E., Philips, B. S., Tucker, R. L., & Haddad, A. C. (1986). Human
Interdigestive Motility: Variations in Patterns From Esophagus to Colon .
Gastroenterology, 386-395.
Liu, Z., Pan, C., Shen, Y., & Liang, P. (2013, March). Interfacial characteristics of
polyethylene terephthalate-based piezoelectric multi-layer films. Thin
Solid Films, 531, 284-293.
Lund, A., & Hagström, B. (2010). Melt Spinning of Poly(vinylidene fluoride)
Fib nd h In l nc S inning P s n β-Phase Crystallinity.
Journal of Applied Polymer Science Vol. 16 (Issue 5), 2685-2693.
Lund, A., Jonasson, C., Johansson, C., Haagensen, D., & Hagström, B. (2012).
Piezoelectric polymeric bicomponent fibers produced by melt spinning.
Journal of Applied Polymer Science, Vol. 126 (Issue 2), 490-500.
Mackay, C. D., Craig, W., Hussey, J. K., & Loudun, M. A. (2011). Self-
expanding metallic stents for large bowel obstruction. British Journal od
Surgery, 98(11), 1625-1629.
Lando, J. B., & Doll, W. W. (1968). The polymorphism of poly(vinylidene
fluoride). I. The effect of head-to-head structure. Journal of
Macromolecular Science, Part B: Physics, 205-218.
Matsushige, K., & Takemura, T. (1983). Crystal Transformation, Piezoelectricity,
and Ferroelectric Polarization Reversal in Poly(Vinylidene Fluoride).
Polymer Science and Technology, 115-137.
Maudgil, D., Aviv, R., Williams, M., & Watkinson, A. (2001). Gastrointestinal
stents - a review. Radiography, 153-158.
Melgoza, E. L., Vallicrosa, G., Serenó, L., Ciurana, J., & Rodríguez, C. A. (2014).
Rapid tooling using 3D printing system for manufacturing of customized
tracheal stent. Rapid Prototyping Journal, 20(1), 2-12.
Meng, H. (2009). Laser micro-processing of cardiovascular stent with fiber laser
cutting system. Optics & Laser Technology, 41(3), 300-302.
Murata, Y., Tsunashima, K., Umemura, J., & Koizumi, N. (1998, Feb).
Ferroelectric properties of polyamides consisting of hepta- and
nonamethylenediamines. IEEE Transactions on Dielectrics and Electrical
Insulation, 5, 92-102.

44
Nationalencyklopedin. (2014). Retrieved 05 21, 2014, from www.ne.se:
http://www.ne.se/lang/anastomos
Nationalencyklopedin. (2014). Retrieved 02 28, 2014, from www.ne.se:
http://www.ne.se/lang/tarm
Nationalencyklopedin. (2014). Retrieved 2 28, 2014, from www.ne.se:
http://www.ne.se/lang/gastrointestinal
Nationalencyklopedin. (2014). Retrieved 03 01, 2014, from www.ne.se:
http://www.ne.se/lang/saltsyra
Nationalencyklopedin. (2014, 03 02). Nationalencyklopedin. Retrieved from
www.ne.se: http://www.ne.se/sfinkter
Nilsson, E., Lund, A., Jonasson, C., Johansson, C., & Hagström, B. (2013). Poling
and characterization of piezoelectric polymer fibers for use in textile
sensors. Sensors and Actuators A: Physical Vol. 201, 477-486.
Noguchi, K. (1997, 11 01). System reliability of a sensor system considering the
detectable area. Electronics & communications in Japan. Part 3,
Fundamental electronic science, 80, 64-72.
O´Brien, C, J. J., & Sparkman, S. R. (1997). What Is a Stent and Where Can You
Get One? The American Journal of Cardiology, 79(9), 1306.
Osman, R. M., Rahim Abd, M. K., Samsuri, N. A., Salim, H. A., & Ali, M. F.
(2011). Embroidered fully textile wearable antenna for medical monitoring
applications. Progress In Electromagnetics Research Vol 117, 321-337.
PharmaCoDane, A. (2014, 05 13). FASS. Retrieved from www.fass.se:
http://www.fass.se/LIF/product?3&userType=2&nplId=19430311000013
&docType=6
PicoTech. (2014, 03 01). Pico Technology. Retrieved from www.picotech.com:
http://www.picotech.com/oscilloscope.html
Qaiss, A., Saidi, H., Fassi-Fehri, O., & Bousmina, M. (2012, Dec). Cellular
polypropylene-based piezoelectric films. Polymer Engineering & Science,
52, 2637-2644.
Schwarz, A., Langenhove, L. V., Guermonprez, P., & Deguillemont, D. (2010). A
roadmap on smart textiles. Textile Process, 99-180.
Serwey, A. R., & Jewett, J. W. (2013). Physics for Scientist and Engineers with
Modern Physics 9th Edition/International Edition. Gale: Brooks/Cole.

45
Sirohi, J., & Chopra, I. (2000). Fundamental Understanding of Piezoelectric Strain
Sensors. Journal of Intelligent material Systems and Structures Vol 11
(Issue 4), 246-257.
Thachuk, A. V. (2008). Stomach peptic ulcer: Confined gastric perforation.
Journal of diagnostic medical sonography, Vol 24, 39-42.
Tichý, J., E h , J., Ki ing , E., & Přív ská, J. ( ). Fundamentals of
Piezoelectric Sensorics. Berlin: Springer-Verlag.
Ward, K., Ounaies, Z., & Vetrovec, G. (2005). Patent No. US 20090036975 A1.
USA.
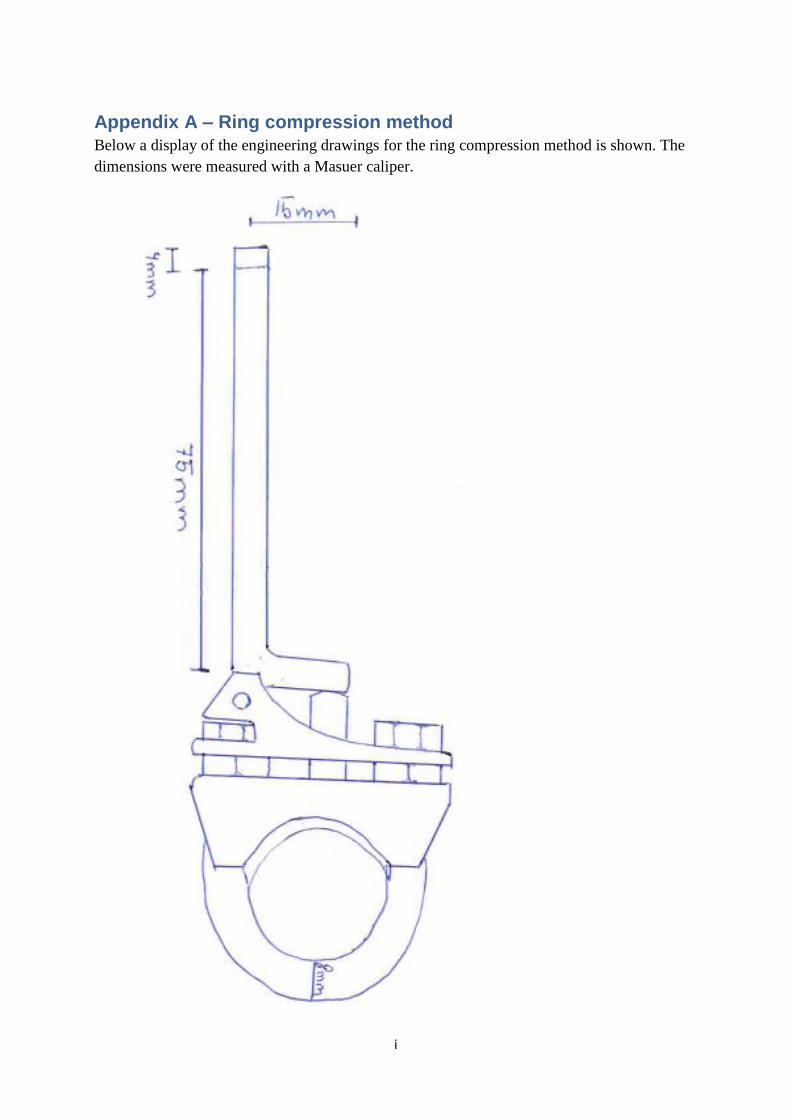
i
Appendix A – Ring compression method
Below a display of the engineering drawings for the ring compression method is shown. The
dimensions were measured with a Masuer caliper.

ii
Appendix B – Ring movement method
Below a display of the engineering drawings for the ring compression method is shown. The
dimensions were measured with a Masuer caliper.

iii
Appendix C – Sample 0
Settings for the PicoScope: a filtration of 10 Hz and a scale of 1 s/div. The x-axis is divided
into seconds, where one square is one second. The y-axis is divided in mV where one square
is 20 mV.
Hard surface Test 2 is displayed below, where it is clear that the output for yarn A and B are higher than
yarn C and D. The origin of the signal is from the corner where yarn A and B meet.
Figure 33 Testing in the corner of yarn A and B
Test 3 is displayed below, where it is clear that the output for yarn B and C re higher and
gives the origin of the signal where yarn B and C meet.
Figure 34 Testing in the corner of yarn B and C
Test 4 is displayed below, where it is clear that the output for yarn C and D, which gives the
origin of the signal where yarn C and D meet.
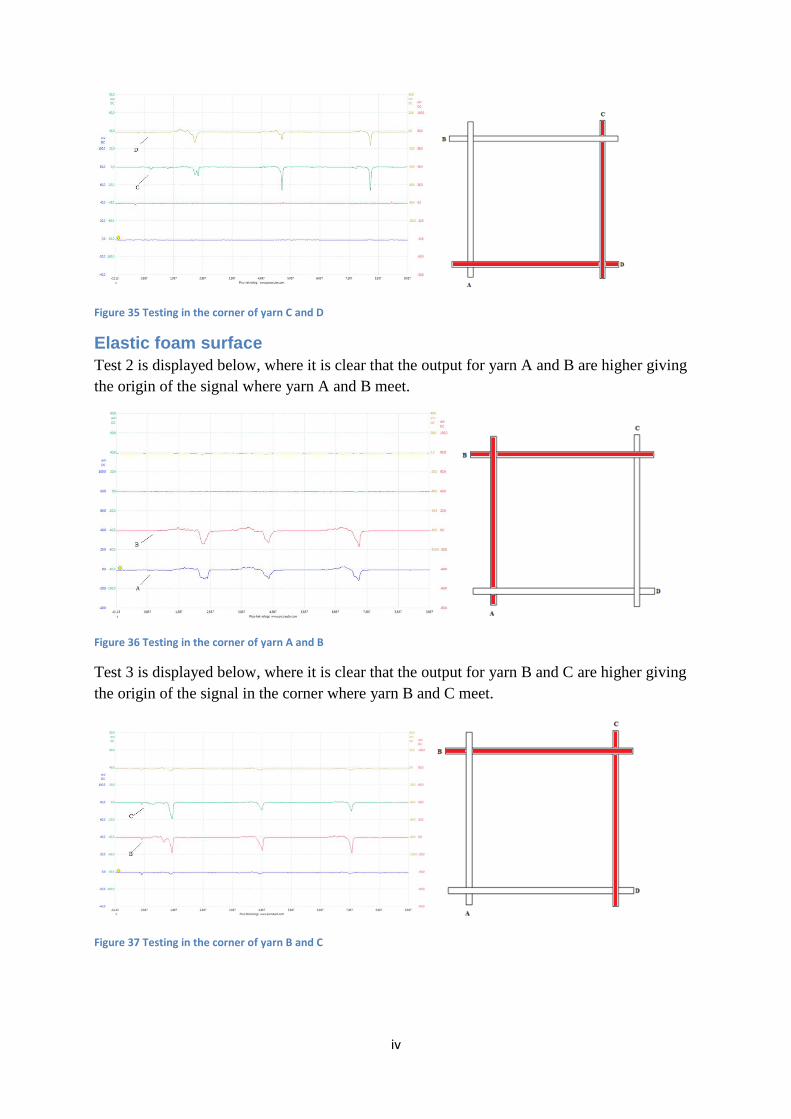
iv
Figure 35 Testing in the corner of yarn C and D
Elastic foam surface
Test 2 is displayed below, where it is clear that the output for yarn A and B are higher giving
the origin of the signal where yarn A and B meet.
Figure 36 Testing in the corner of yarn A and B
Test 3 is displayed below, where it is clear that the output for yarn B and C are higher giving
the origin of the signal in the corner where yarn B and C meet.
Figure 37 Testing in the corner of yarn B and C
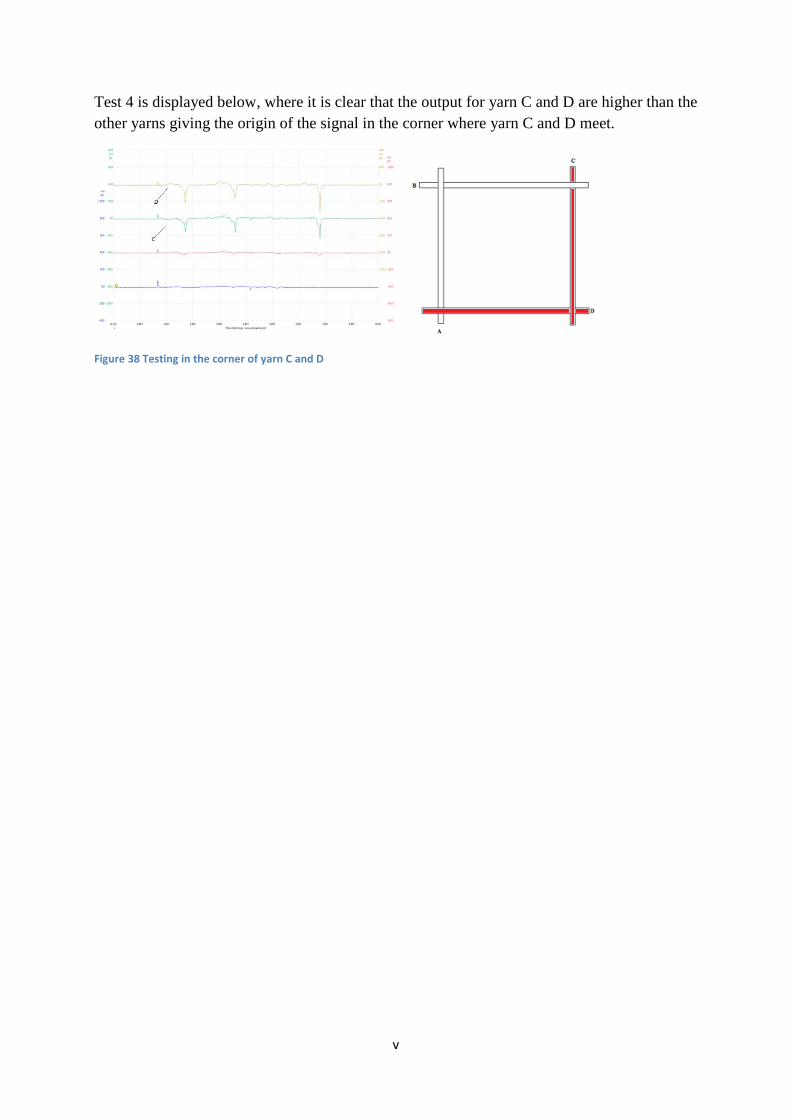
v
Test 4 is displayed below, where it is clear that the output for yarn C and D are higher than the
other yarns giving the origin of the signal in the corner where yarn C and D meet.
Figure 38 Testing in the corner of yarn C and D

vi
Appendix D – Curves ring compression method
Settings for the PicoScope: a filtration of 10 Hz and a scale of 1 s/div. The x-axis is divided
into seconds, where one square is one second. The y-axis is divided in mV where one square
is 20 mV.
Sample 1 Test 2 is displayed below. Where the output is slightly larger for the vertical yarn E and F
than for test 1, since the testing are is closer to yarn E and F.
Figure 39 Where yarns A, B, E and F where tested in section 2
Test 3 is displayed below. Where the output is slightly larger for the vertical E and F than for
test 2 due to the testing are is closer than test 1 and 2.
Figure 40 Where yarns A, B, E and F where tested in section 3.
Test 5 is shown in the figure below, where the output in the bottom curve is larger for the
horizontal yarn A and a small output in the vertical yarns D, E and F.
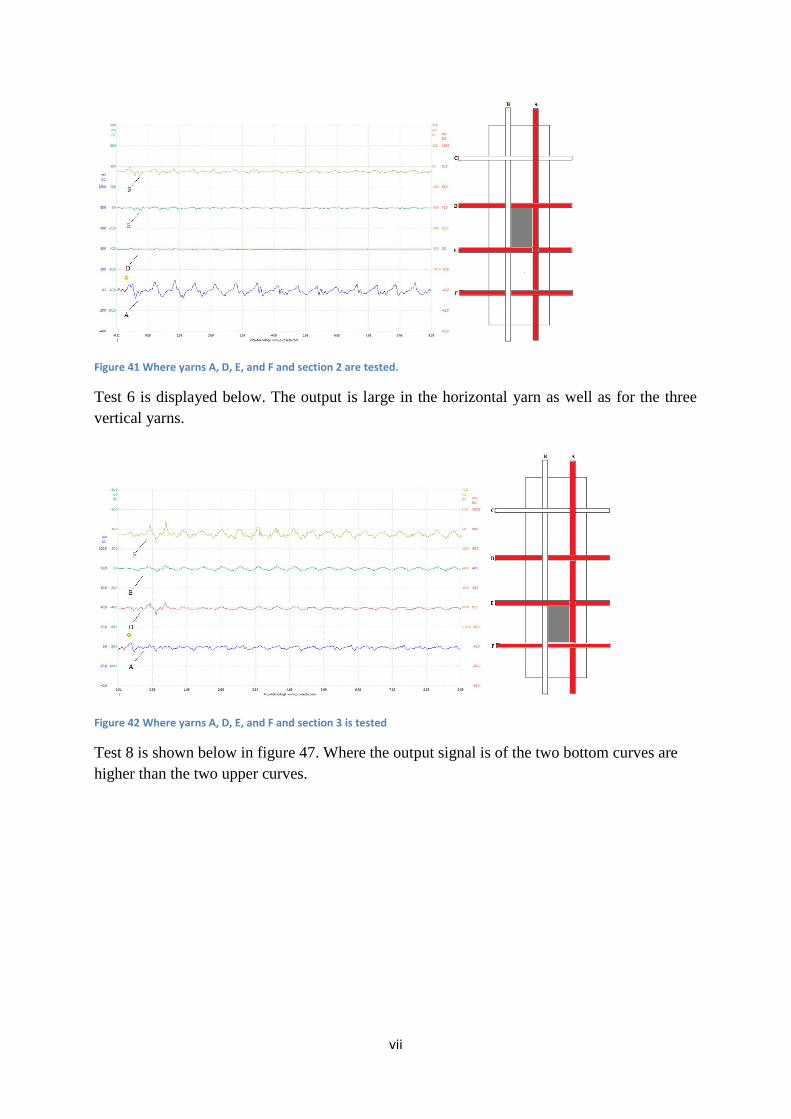
vii
Figure 41 Where yarns A, D, E, and F and section 2 are tested.
Test 6 is displayed below. The output is large in the horizontal yarn as well as for the three
vertical yarns.
Figure 42 Where yarns A, D, E, and F and section 3 is tested
Test 8 is shown below in figure 47. Where the output signal is of the two bottom curves are
higher than the two upper curves.

viii
Figure 43 Where yarns C, D, E, and F and section 2 is tested
Test 9 is displayed in figure 48 below. Where the signals decrease from the top due to the
testing area was section 3.
Figure 44 Where yarns C, D, E, and F and section 3 are tested.
Sample 2 Test 2 is displayed below in figure 49 where the output signals are higher for the horizontal
Figure 45 Where yarns A, B, E and F where tested in section 2

ix
Test 3 is shown below, where the output signals for the horizontal yarn is higher than the
vertical.
Figure 46 Where yarns A, B, E and F where tested in section 3.
Test 5 is displayed below in figure 51. Where there are output signals from the horizontal
yarns as well as the vertical yarns.
Figure 47 Where yarns A, D, E and F where tested in section 2.
Test 6 is shown in figure 52 below. Where there is output signal from the horizontal yarn and
the vertical yarns.
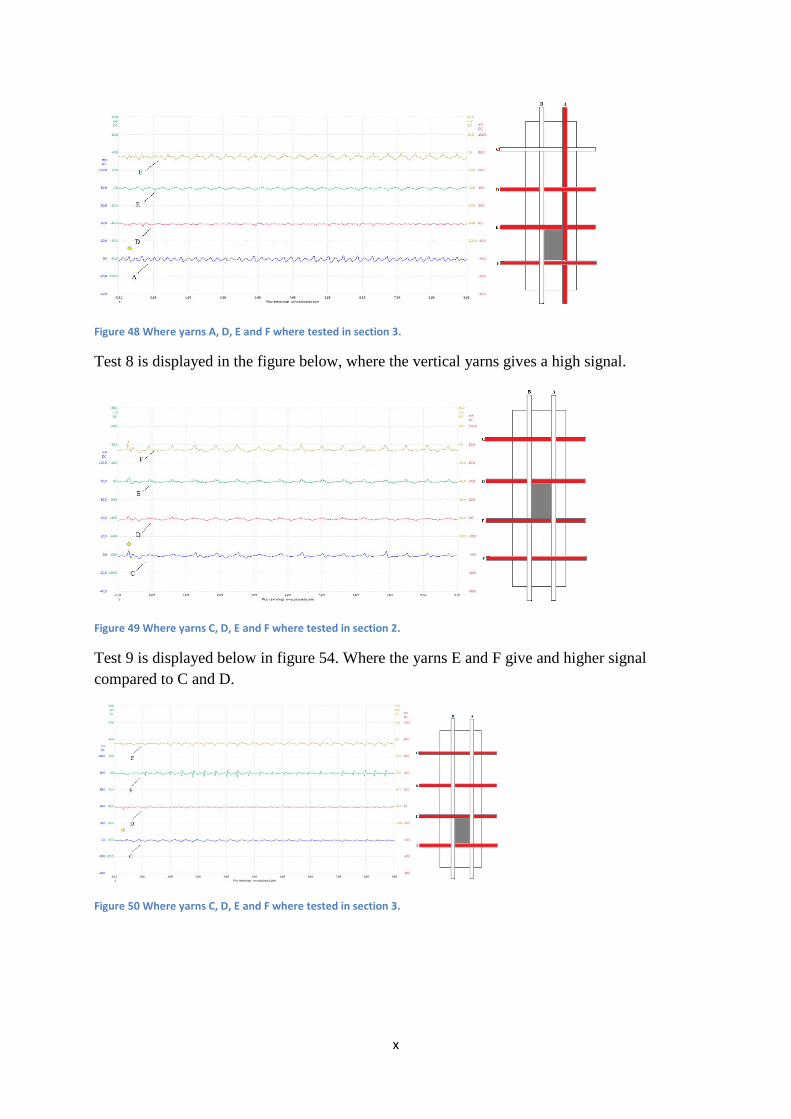
x
Figure 48 Where yarns A, D, E and F where tested in section 3.
Test 8 is displayed in the figure below, where the vertical yarns gives a high signal.
Figure 49 Where yarns C, D, E and F where tested in section 2.
Test 9 is displayed below in figure 54. Where the yarns E and F give and higher signal
compared to C and D.
Figure 50 Where yarns C, D, E and F where tested in section 3.

xi
Double sided test
Test 2 is shown in figure X below where the yarns C and D is simultaneously tested in both
sample 1 and 2. Where the first C and D from the bottom is sample 1 and the second C and D
is sample 2.
Figure 51 Where yarns C and D are tested in both sample 1 and 2 in section 2.
Test 3 is displayed below in figure 56, where yarns C and D are tested simultaneously in
sample 1 and 2. Where the first C and D from the bottom is sample 1 and the second C and D
is sample 2.
Figure 52 Where yarns C and D are tested in both sample 1 and 2 in section 3.

xii
Appendix E – Curves ring movement method
Settings for the PicoScope: a filtration of 10 Hz and a scale of 1 s/div. The x-axis is divided
into seconds, where one square is one second. The y-axis is divided in mV where one square
is 20 mV.
Sample 1 The remaining two results are displayed here.
Test 2 is shown in figure X below, where the horizontal yarn A is the curve in the bottom and
the three others is vertical placed yarns.
Figure 53 Where A, D, E, and F where the test started from the left side
Test 3is displayed in figure X below, where all four vertically placed yarns.
Figure 54 Where C, D, E, and F where the test started from the left side
Sample 2 The two remaining result are displayed here.
Test 2 is shown in figure X below. Where the bottom curve is the horizontal yarn A and the
three upper curves had the same order from the bottom as follows D, E and F.

xiii
Figure 55 Where A, D, E, and F where the test started from the left side
Test 3 is displayed below where the curves have the same order from the bottom as for the
tested vertically placed yarns: C, D, E and F.
Figure 56 Where the yarns C, D, E and F were tested from the left side.
Double sided test
The two remaining test result are displayed here.
Test 2 is shown in figure X below. Yarn C and D was tested in both structures simultaneously.
Where the first C and D from the bottom is sample 1 and the second C and D is sample 2.
Figure 57 Where C and D were tested in sample 1 and 2 from the left side
Test 3 is displayed in figure X below. Yarn C and E was tested in both structures
simultaneously. Where the first C and F from the bottom is sample 1 and the second C and F
is sample 2.
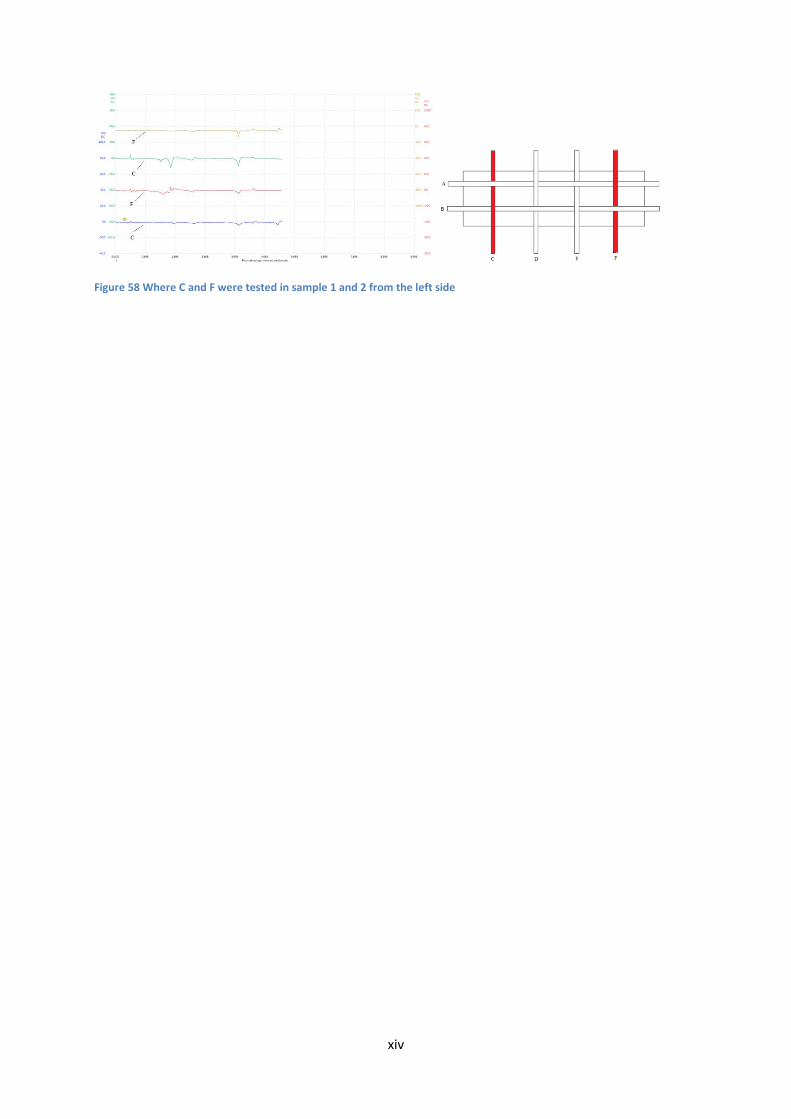
xiv
Figure 58 Where C and F were tested in sample 1 and 2 from the left side

xv
Visiting address: Skaraborgsvägen 3 ● Postal address: 506 30 BORÅS ● Web: http://www.hb.se/Textilhogskolan/
Related Documents


