Florida International University FIU Digital Commons FIU Electronic eses and Dissertations University Graduate School 10-31-2014 Text Analytics of Social Media: Sentiment Analysis, Event Detection and Summarization Chao Shen cshen001@cs.fiu.edu DOI: 10.25148/etd.FI14110776 Follow this and additional works at: hps://digitalcommons.fiu.edu/etd Part of the Databases and Information Systems Commons is work is brought to you for free and open access by the University Graduate School at FIU Digital Commons. It has been accepted for inclusion in FIU Electronic eses and Dissertations by an authorized administrator of FIU Digital Commons. For more information, please contact dcc@fiu.edu. Recommended Citation Shen, Chao, "Text Analytics of Social Media: Sentiment Analysis, Event Detection and Summarization" (2014). FIU Electronic eses and Dissertations. 1739. hps://digitalcommons.fiu.edu/etd/1739

Welcome message from author
This document is posted to help you gain knowledge. Please leave a comment to let me know what you think about it! Share it to your friends and learn new things together.
Transcript
Florida International UniversityFIU Digital Commons
FIU Electronic Theses and Dissertations University Graduate School
10-31-2014
Text Analytics of Social Media: Sentiment Analysis,Event Detection and SummarizationChao [email protected]
DOI: 10.25148/etd.FI14110776Follow this and additional works at: https://digitalcommons.fiu.edu/etd
Part of the Databases and Information Systems Commons
This work is brought to you for free and open access by the University Graduate School at FIU Digital Commons. It has been accepted for inclusion inFIU Electronic Theses and Dissertations by an authorized administrator of FIU Digital Commons. For more information, please contact [email protected].
Recommended CitationShen, Chao, "Text Analytics of Social Media: Sentiment Analysis, Event Detection and Summarization" (2014). FIU Electronic Thesesand Dissertations. 1739.https://digitalcommons.fiu.edu/etd/1739
FLORIDA INTERNATIONAL UNIVERSITY
Miami, Florida
TEXT ANALYTICS OF SOCIAL MEDIA: SENTIMENT ANALYSIS, EVENT
DETECTION AND SUMMARIZATION
A dissertation submitted in partial fulfillment of the
requirements for the degree of
DOCTOR OF PHILOSOPHY
in
COMPUTER SCIENCE
by
Chao Shen
2014
To: Dean Amir MirmiranCollege of Engineering and Computing
This dissertation, written by Chao Shen, and entitled Text Analytics of Social Media: Sen-timent Analysis, Event Detection and Summarization, having been approved in respect tostyle and intellectual content, is referred to you for judgment.
We have read this dissertation and recommend that it be approved.
Shu-Ching Chen
Debra VanderMeer
Jinpeng Wei
Bogdan Carbunar
Tao Li, Major Professor
Date of Defense: October 31, 2014
The dissertation of Chao Shen is approved.
Dean Amir MirmiranCollege of Engineering and Computing
Dean Lakshmi N. ReddiUniversity Graduate School
Florida International University, 2014
ii

c⃝ Copyright 2014 by Chao Shen
All rights reserved.
iii

DEDICATION
To my family.
iv
ACKNOWLEDGMENTS
There are so many to thank. First and foremost I want to thank my advisor, Professor Tao
Li. Without his encouragement and guidance, I would not have spent five enjoyable years
at FIU, and this dissertation would not have existed. He is one of the rare advisors that
students dream that they will find. I am grateful that he always stays with me in the best
and worst moments of my Ph.D journey. In the same vein, I want to thank Professor Shu-
ching Chen, Professor Debra VanderMeer, Professor Jinpeng Wei and Professor Bogdan
Carbunar for being my doctoral committee. They have provided me many valuable ques-
tions and useful suggestions for my dissertation. I extend my warmest thanks to Dr. Fei
Liu and Mr. Fuliang Weng in Bosch Research and Development Center, and Dr. Jian
Yin in Pacific Northwest National Laboratory, who gave me help and support during my
summer internships. And I would also like to thank all other my coauthors and labmates.
It was my great honor to work with them. Special thanks to all my friends in Miami and
the Bay Area for giving me joy and good memories in these years. Deepest graduate to
my family. I am indebted to my parents, my father, Datian Shen and especially to my
mother, Limin Ding. She recently passed away after fourteen-year brave fight against
cancer. I would like to thank my wife, Lin Ye, for her love, support, and understanding. I
love you.
v
ABSTRACT OF THE DISSERTATION
TEXT ANALYTICS OF SOCIAL MEDIA: SENTIMENT ANALYSIS, EVENT
DETECTION AND SUMMARIZATION
by
Chao Shen
Florida International University, 2014
Miami, Florida
Professor Tao Li, Major Professor
In the last decade, large numbers of social media services have emerged and been widely
used in people’s daily life as important information sharing and acquisition tools. With a
substantial amount of user-contributed text data on social media, it becomes a necessity
to develop methods and tools for text analysis for this emerging data, in order to better
utilize it to deliver meaningful information to users.
Previous work on text analytics in last several decades is mainly focused on traditional
types of text like emails, news and academic literatures, and several critical issues to text
data on social media have not been well explored: 1) how to detect sentiment from text
on social media; 2) how to make use of social media’s real-time nature; 3) how to address
information overload for flexible information needs.
In this dissertation, we focus on these three problems. First, to detect sentiment of
text on social media, we propose a non-negative matrix tri-factorization (tri-NMF) based
dual active supervision method to minimize human labeling efforts for the new type of
data. Second, to make use of social media’s real-time nature, we propose approaches to
detect events from text streams on social media. Third, to address information overload
for flexible information needs, we propose two summarization framework, dominating set
based summarization framework and learning-to-rank based summarization framework.
The dominating set based summarization framework can be applied for different types
vi

of summarization problems, while the learning-to-rank based summarization framework
helps utilize the existing training data to guild the new summarization tasks. In addition,
we integrate these techneques in an application study of event summarization for sports
games as an example of how to better utilize social media data.
vii
TABLE OF CONTENTS
CHAPTER PAGE
1. INTRODUCTION . . . . . . . . . . . . . . . . . . . . . . . . . . . . . . . . 11.1 Overview . . . . . . . . . . . . . . . . . . . . . . . . . . . . . . . . . . . . 11.2 Background . . . . . . . . . . . . . . . . . . . . . . . . . . . . . . . . . . . 21.3 Contribution of This Dissertation . . . . . . . . . . . . . . . . . . . . . . . . 41.4 Dissertation Outline . . . . . . . . . . . . . . . . . . . . . . . . . . . . . . . 6
2. RELATED WORK . . . . . . . . . . . . . . . . . . . . . . . . . . . . . . . . 82.1 Preprocessing of Social Media Text . . . . . . . . . . . . . . . . . . . . . . 82.2 Multi-document Summarization . . . . . . . . . . . . . . . . . . . . . . . . 92.3 Event Detection . . . . . . . . . . . . . . . . . . . . . . . . . . . . . . . . . 112.4 Sentiment Analysis . . . . . . . . . . . . . . . . . . . . . . . . . . . . . . . 13
3. TRI-NMF BASED ACTIVE DUAL SUPERVISION . . . . . . . . . . . . . . 153.1 Introduction . . . . . . . . . . . . . . . . . . . . . . . . . . . . . . . . . . . 153.2 Related Work . . . . . . . . . . . . . . . . . . . . . . . . . . . . . . . . . . 173.2.1 Active Learning and Dual Active Learning . . . . . . . . . . . . . . . . . 173.2.2 Dual Supervision . . . . . . . . . . . . . . . . . . . . . . . . . . . . . . . 183.3 Dual Supervision via Tri-NMF with Explicit Class Alignment . . . . . . . . 193.3.1 Learning with Dual Supervision via Tri-NMF . . . . . . . . . . . . . . . . 193.3.2 Modeling the Relationships between Word Classes and Document Classes . 203.3.3 Computing Algorithm . . . . . . . . . . . . . . . . . . . . . . . . . . . . 213.3.4 Probabilistic Interpretation of Tri-NMF . . . . . . . . . . . . . . . . . . . 223.4 A Unified Query Selection Scheme Using Reconstruction Error . . . . . . . . 233.4.1 Reconstruction Error . . . . . . . . . . . . . . . . . . . . . . . . . . . . . 243.4.2 Algorithm Description . . . . . . . . . . . . . . . . . . . . . . . . . . . . 253.5 Experiments . . . . . . . . . . . . . . . . . . . . . . . . . . . . . . . . . . . 263.5.1 Topic Classification . . . . . . . . . . . . . . . . . . . . . . . . . . . . . . 273.5.2 Sentiment Classification . . . . . . . . . . . . . . . . . . . . . . . . . . . 343.6 Summary . . . . . . . . . . . . . . . . . . . . . . . . . . . . . . . . . . . . 34
4. PARTICIPANT-BASED EVENT DETECTION ON TWITTER STREAMS . . 364.1 Introduction . . . . . . . . . . . . . . . . . . . . . . . . . . . . . . . . . . . 364.2 Participant-based Event Detection . . . . . . . . . . . . . . . . . . . . . . . 384.2.1 Participant Detection . . . . . . . . . . . . . . . . . . . . . . . . . . . . . 384.2.2 Mixture Model-based Event Detection . . . . . . . . . . . . . . . . . . . . 404.3 Experiments . . . . . . . . . . . . . . . . . . . . . . . . . . . . . . . . . . . 434.3.1 Experimental Data . . . . . . . . . . . . . . . . . . . . . . . . . . . . . . 434.3.2 Participant Detection Results . . . . . . . . . . . . . . . . . . . . . . . . . 464.3.3 Event Detection Results . . . . . . . . . . . . . . . . . . . . . . . . . . . 494.4 Summary . . . . . . . . . . . . . . . . . . . . . . . . . . . . . . . . . . . . 51
viii
5. MULTI-DOCUMENT SUMMARIZATION . . . . . . . . . . . . . . . . . . . 525.1 Multi-document Summarization using Dominating Set . . . . . . . . . . . . 525.1.1 Introduction . . . . . . . . . . . . . . . . . . . . . . . . . . . . . . . . . . 525.1.2 Related Work . . . . . . . . . . . . . . . . . . . . . . . . . . . . . . . . . 535.1.3 The Summarization Framework . . . . . . . . . . . . . . . . . . . . . . . 545.1.4 Experiments . . . . . . . . . . . . . . . . . . . . . . . . . . . . . . . . . 615.2 Multi-document Summarization Using Learning-to-Rank . . . . . . . . . . . 695.2.1 Related Work . . . . . . . . . . . . . . . . . . . . . . . . . . . . . . . . . 725.2.2 Model Learning . . . . . . . . . . . . . . . . . . . . . . . . . . . . . . . . 745.2.3 Training Data Construction: A Graph based Method . . . . . . . . . . . . 765.2.4 Feature Design . . . . . . . . . . . . . . . . . . . . . . . . . . . . . . . . 785.2.5 Experiments . . . . . . . . . . . . . . . . . . . . . . . . . . . . . . . . . 815.3 Summary . . . . . . . . . . . . . . . . . . . . . . . . . . . . . . . . . . . . 87
6. APPLICATION: EVENT SUMMARIZATION FOR SPORTS GAMES USINGTWITTER STREAMS . . . . . . . . . . . . . . . . . . . . . . . . . . . . . . 88
6.1 Introduction . . . . . . . . . . . . . . . . . . . . . . . . . . . . . . . . . . . 886.2 Framework Overview . . . . . . . . . . . . . . . . . . . . . . . . . . . . . . 896.3 Online Participant Detection . . . . . . . . . . . . . . . . . . . . . . . . . . 936.4 Online Update for a Temporal-Content Mixture Model . . . . . . . . . . . . 946.5 Experiments . . . . . . . . . . . . . . . . . . . . . . . . . . . . . . . . . . . 976.5.1 Participant Detection . . . . . . . . . . . . . . . . . . . . . . . . . . . . . 986.5.2 Event Summarization . . . . . . . . . . . . . . . . . . . . . . . . . . . . . 996.6 Summary . . . . . . . . . . . . . . . . . . . . . . . . . . . . . . . . . . . . 101
7. CONCLUSION AND FUTURE WORK . . . . . . . . . . . . . . . . . . . . 1027.1 Conclusion . . . . . . . . . . . . . . . . . . . . . . . . . . . . . . . . . . . 1027.2 Vision for the Future . . . . . . . . . . . . . . . . . . . . . . . . . . . . . . 103
BIBLIOGRAPHY . . . . . . . . . . . . . . . . . . . . . . . . . . . . . . . . . . 105
VITA . . . . . . . . . . . . . . . . . . . . . . . . . . . . . . . . . . . . . . . . . 121
ix
LIST OF TABLES
TABLE PAGE
1.1 A classification scheme created by [KH09]. . . . . . . . . . . . . . . . . . . 3
4.1 Statistics of the data set, including six NBA basketball games and the WWDC2012 conference event. . . . . . . . . . . . . . . . . . . . . . . . . . . . 44
4.2 An example clip of the play-by-play live coverage of an NBA game (Heat vsOkc). . . . . . . . . . . . . . . . . . . . . . . . . . . . . . . . . . . . . 45
4.3 Example participants automatically detected from the NBA game Spurs vsOkc (2012-5-31) and the WWDC’12 conference. . . . . . . . . . . . . . 46
4.4 Event detection results on participant streams. . . . . . . . . . . . . . . . . 49
4.5 Event detection results on the input streams. . . . . . . . . . . . . . . . . . 49
5.1 Brief description of the data set . . . . . . . . . . . . . . . . . . . . . . . . 62
5.2 Results on generic summarization. . . . . . . . . . . . . . . . . . . . . . . . 63
5.3 Results on query-focused summarization. . . . . . . . . . . . . . . . . . . . 63
5.4 Results on update summarization. . . . . . . . . . . . . . . . . . . . . . . . 66
5.5 A case study on comparative document summarization. . . . . . . . . . . . 67
5.6 Example rankings for the five sentences. . . . . . . . . . . . . . . . . . . . 75
5.7 Brief description of the data sets. . . . . . . . . . . . . . . . . . . . . . . . 81
5.8 Summarization performance comparison on DUC 2006. . . . . . . . . . . . 82
5.9 Summarization performance comparison on DUC 2007. . . . . . . . . . . . 82
6.1 Statistics of the data set, including five NBA basketball games event. . . . . 97
6.2 Performance comparison of methods for participant detection. . . . . . . . . 99
6.3 ROUGET-1 F-1 scores . . . . . . . . . . . . . . . . . . . . . . . . . . . . . 101
x
LIST OF FIGURES
FIGURE PAGE
3.1 Comparing the performance of dual supervision via Tri-NMF w/ and w/o theconstraint on S. . . . . . . . . . . . . . . . . . . . . . . . . . . . . . . . 27
3.2 Comparing the different query selection approaches in active learning viaTri-NMF with dual supervision. . . . . . . . . . . . . . . . . . . . . . . 29
3.3 Comparing the unified and interleaving scheme based on reconstruction error. 31
3.4 GRADS with reconstruction error and interleaving uncertainty. . . . . . . . 32
3.5 Example of query sequence. . . . . . . . . . . . . . . . . . . . . . . . . . . 33
3.6 Comparing active dual supervision using matrix factorization with GRADSon sentiment analysis. . . . . . . . . . . . . . . . . . . . . . . . . . . . 34
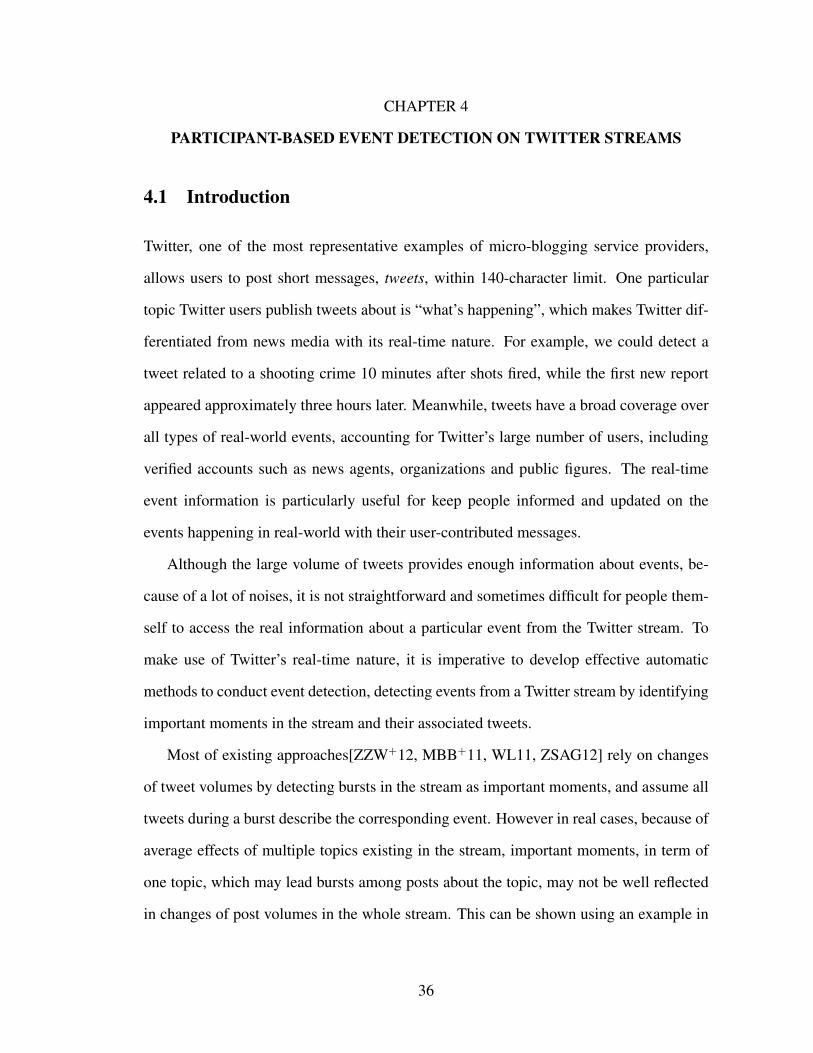
4.1 Example Twitter event stream (upper) and participant stream (lower). . . . . 37
4.2 Plate notation of the mixture model. . . . . . . . . . . . . . . . . . . . . . . 41
4.3 Participant detection performance. The upper figures represent the participant-level precision and recall scores, while the lower figures represent themention-level precision and recall. X-axis corresponds to the six NBAgames and the WWDC conference. . . . . . . . . . . . . . . . . . . . . 47
5.1 Graphical illustrations of multi-document summarization via the minimumdominating set. . . . . . . . . . . . . . . . . . . . . . . . . . . . . . . . 57
5.2 ROUGE-2 vs. threshold λ . . . . . . . . . . . . . . . . . . . . . . . . . . . 65
5.3 The framework of supervised learning for summarization. . . . . . . . . . . 70
5.4 Performance comparison of training data generation. . . . . . . . . . . . . . 84
5.5 Effects using cost sensitive loss. (Value of x-axis represents 1− threshold) . 85
5.6 Performance comparison using training data with multiple ranks. . . . . . . 86
6.1 System framework of the event summarization application for sports gamesusing Twitter streams. . . . . . . . . . . . . . . . . . . . . . . . . . . . 90
6.2 Screenshot of the sub-event list of the system. . . . . . . . . . . . . . . . . . 91
6.3 Screenshot of the sub-event details of the system. . . . . . . . . . . . . . . . 92
6.4 Illustration of how sub-events are detected online. . . . . . . . . . . . . . . 95
xi

CHAPTER 1
INTRODUCTION
1.1 Overview
With the popularity of Internet, the volume of online text documents (e.g., news and web
pages) are explosively growing. Text analytics such as document classification, cluster-
ing and summarization are developed to discover useful and meaningful information from
textual documents, for users to better understand the textual datasets. For example, docu-
ment clustering provides an efficient way in organizing web search results, and document
summarization can generate informative snippets to help users in web exploring.
In the last decade, large numbers of social media services have emerged and been
widely used in people’s daily life as important information sharing and acquisition tools.
New characteristics of text on social media impose challenges to the traditional text an-
alytics, which is focused on conventional text like news and general web pages. My
research goal is to develop text analytics for text data on social media by addressing its
differences from the conventional text data, to help users to better understand and utilize
a large volume of social media text. In particular, we focus on three dimensions: sen-
timent analysis, event detection and summarization, more specifically by answering the
following questions:
Sentiment analysis How to quickly train a sentiment analysis model for text on social
media with minimum human effort? Sentiment analysis is a critical step to understand
people’s preference and feelings from social media data. Most of the sentiment analysis
methods assume availablity of training data. Since existing models and tools trained on
traditional text are not applicable to text on social media due to the big differences in
1
language usage, new training data has to be labeled, which is a costly process. So we
need to find an effective way to label data to reduce human effort to minimum.
Event detection How to detect events discussed in social media and associated posts?
Because of social media’s real-time nature, large number of event-related posts exist on
social media, and can be used to update social media users and the public on what events
are happening in the world. Event detection aims to identify these events and their as-
sociated posts, so that information about an event discussed on social media can be well
organized and presented to users.
Multi-document summarization How to generate a summary aggregating informa-
tion from a large set of textual posts on social media for flexible information needs?
Multi-document summarization is typical a tool to overcome information overload. How-
ever because of heterogeneous topics and purposes of posts on social media, users may
impose different information needs, which requires different summaries of a set of textual
posts from different aspects.
1.2 Background
Social media is typical known as online services for interaction among people by creating,
sharing and exchanging information and ideas in real or virtual social networks [ABHH08].
It includes blogs and microblogs (e.g., Twitter1), content sharing communities (e.g., Flickr2,
YouTube3) social networks (e.g., Facebook4) and etc. In the last decade, these social
1http://www.twitter.com
2http://www.flickr.com
3http://www.youtube.com
4http://www.facebook.com
2

media sites are becoming increasingly popular and important information distribution
tools for users to share their statuses, experiences and interests. Consequently, substantial
amounts of user-contributed materials (e.g., photographs, videos, and textual content) are
constantly being uploaded to these sites of a wide variety of topics.
Although current social media is enriched with multi-media content like images and
videos, text is still one of the most important types of content, which can be used alone as
in most posts on Twitter and Facebook, or as descriptions and comments of photographs
and videos. In order to provide better services and deliver meaningful information to users
of social media and the public, it is imperative to create tools to conduct fundamental text
analysis to better understand and obtain basic information from a large volume of textual
posts on social media.
Social Media Type Typical Examplescollaborative projects Wikipediablogs and microblogs Twitter
social news networking sites Digg, Leakernetcontent communities YouTube, DailyMotion
social networking sites Facebookvirtual game-worlds World of Warcraftvirtual social worlds Second Life
Table 1.1: A classification scheme created by [KH09].
According to the classification scheme created by [KH09] described in Table1.1, there
are seven major types of social medias. In this dissertation, we are more focused on three
of them: blogs and microblog, content communities, and social networking sites, which
are in italic in Table1.1. Text information on these three types of social medias plays an
important role, and have the following fundamental differences compared to traditional
text:
• Text on social media is rich in sentiment information. It’s very common that people
express likes and dislikes through posts like status updates and comments. Thus so-
3

cial media is a source of crowd intelligence that can be used to investigate common
feelings about some particular topics.
• Text on social media carries a lot of real-time information. “What’s happening?”
is a typical question that users of social media answer by new posts. People report
or publish comments on the events they are experiencing of a wide variety of types
and scales around the world, ranging from a natural disasters to a sports game.
• Text on social media is heterogenous and large in volume. Varieties of tools like
applications of mobile devices enable users to easily generate and share content on
social media sites. Consequently, a large volume of text data, which serves different
purposes, is created over a wide range of topics.
Because of these differences, it is not applicable to simply adapt existing text analysis
techniques of traditional text data to social media data.
There have been many studies on social networks, which are the background struc-
ture behind social media, from fundamental research on the properties of a social net-
work [Kle00, KKT03] to applications like communities detection [LNK07, GN02, LLM10],
influential users identification [CHBG10, TSWY09, AW12], information diffusion [YL10,
GGLNT04, YC10], and social network evolution [BJN+02, KW06]. For text analytics,
while many existing techniques are developed for traditional text like emails, news and
academic documents, recent studies extend them to social media text by incorporating
information of the background social network [WLJH10, CWML13, CNN+10].
1.3 Contribution of This Dissertation
In this dissertation, we focus on developing effective methods for the following three
aspects corresponding to the three aforementioned characteristics of text on social media
(1) learning a sentiment analysis model for text on social media with minimum human
4
effort via active dual supervision from samples and features, (2) detecting events from
a social media stream, and (3) summarizing documents for various summarization tasks
for the flexible information needs from social media data. In the dissertation, a real-time
application of sports game summarization and analysis system using Twitter streams is
also presented integrating the developed techniques to demonstrate their usage in a real
case.
Active Learning with Dual Supervision for Sentiment Analysis We propose a new
active dual supervision approach, in which a classification model is learned actively using
labels of both samples and features for sentiment analysis [SL11b]. We first extend the
constrained non-negative tri-factorization framework, which incorporates labels of posts
and words as constraints, to explicitly model the corresponding relationships between
post classes and word classes. Then by making use of the reconstruction error criterion
in matrix factorization, we propose a unified scheme to evaluate the value of post and
word labels. Instead of comparing the estimated performance increase of new post labels
or word labels, our proposed scheme assumes that a better supervision (a post label or a
word label) should lead to a more accurate reconstruction of the original data matrix.
Participant Based Time-Content Mixture Model for Event Detection We propose a
participant-based method to detect important moments along a social media stream [SLWL13].
Instead of detecting important moments directly, we first dynamically identify partici-
pants, which are named entities frequently mentioned in the input stream, then “zooms-
in” the whole stream to the participant level. To detect important moments related to each
participant, we propose a time-content mixture model considering both volume changes
and topic changes along the stream, so that associated posts of an event are not only
temporally bursty but also topically coherent. Important moments detected for different
5

participants, if they are close enough, can be combined based on their co-occurrence to
get final events in the whole stream.
New Multi-document Summarization Frameworks for Flexible Information Require-
ments First we propose a multi-document summarization framework based on mini-
mum dominating set for various summarization tasks [SL10]. The framework is origi-
nated for generic summary, and can be extended for several other types of summarization
like query-focused summarization, update summarization and comparative summariza-
tion. For the query-focused summarization, we further propose a learning to rank based
summarization framework to allow users to define the information need using the training
data [SL11a].
Application: Event Summarization for Sports Games Using Twitter Streams In
this application study we propose to build an event summarization application for sports
games using Twitter streams, which provides an alternative way to be kept informed of
the progress of a sports game and audience’s responds from social media data. The appli-
cation integrates the aforementioned text analysis techniques. Based on the event detec-
tion results, summarization and sentiment analysis are employed to summarize the game’s
progress and audience’s supports for different levels: an event, a participant and the whole
game.
1.4 Dissertation Outline
The rest of the dissertation is organized as follows: Chapter 2 reviews the related work.
Chapter 3 proposes an approach for sentiment analysis with active dual supervision.
Chapter 4 improves event detection on social media streams by integrating changes of
data volume and content. Chapter 5 describes two summarization frameworks, the frame-
6

work based on minimum domination set for various document summarization, and the
framework based on learning to rank for query-focused summarization with training data.
Chapter 6 presents a real-time event summarization and analysis system for sports games
integrating event detection, sentiment analysis and summarization techniques. Finally,
Chapter 7 concludes the dissertation with future work.
7

CHAPTER 2
RELATED WORK
2.1 Preprocessing of Social Media Text
The original form of text is a string or a sequence of characters, which needs natural lan-
guage processing (NLP) techniques to extract information and relations for upper layer
text analysis like text mining and text retrieval. The most frequently used NLP techniques
for English, which this dissertation is focused on, include: Sentence Splitting, which di-
vides the whole text document into a list of sentences, Tokenization, which further divides
text of a sentence into a list of words or tokens, Part-of-speech (POS) Tagging, which as-
signs to every word in a sentence a Part-of-Speech tag, Shallow Parsing or Chunking,
which identifies unembedded noun, verb and adjective phrases in a sentence, and Named
Entity Recognition (NER), which recognizes named entities of predefined types like per-
son, location and organization in a sentence.
A number of toolkits are available for these NLP tasks as preprocessing of conven-
tional text data. The most widely used NLP toolkits include GATE [Cun02], OpenNLP [Bal05],
and Stanfard NLP [TKMS03, FGM05]. GATE is a general architecture for text en-
gineering for a wide variety of purposes of text analysis including annotation and se-
mantic engineering, but its core module is an extendable rule based annotation system
with a set of rules to conduct these preprocessing tasks. Both OpenNLP and Stan-
ford NLP are learning based systems, and conduct these NLP tasks as sequential la-
beling problems. OpenNLP employs maximum entropy models as the learning model
for all these tasks, while Stanfard NLP uses a maximum entropy model for POS tagging
and conditional random fields models for shallow parsing and NER recognition. Be-
sides the toolkits, POS tagging, shallow parsing and NER recognition attract in the last
decades many researchers to propose methods for better performance in term of accu-
8

racy or speeds. The state-of-the-art methods are learning based using conditional random
fields [LMP01, SMR07, SP03, ML03, JWL+06]. All these learning based methods need a
large annotated dataset for the training purpose, and the Penn Treebank (PTB) [MMS93],
which is composed of annotated news articles from Wall Street Journal, is the most widely
used one for conventional text in English.
With the popularity of social media, social media text, especially short posts and com-
ments in Facebook and microblogs in Twitter, imposes challenges and requires new meth-
ods. Comparing with conventional news text, social media text is short in length, written
often in an informal language style, and contains a lot of noises. Some work has been done
on POS tagging English tweets. [FCW+11] annotated a small treebank of 519 sentences
from Twitter, using the PTB annotation scheme. They reported a POS tagging accuracy
of 84,1% for an SVM-based tagger. TwitterNLP [RCME11] is a CRF-based tagger to
Twitter data with a tagging accuracy of 88,3% using the full 45 tags from the PTB and 4
additional tags for twitter-specific phenomena (retweets, at-mentions, hashtags and urls).
Ark-Tweet-NLP [GSO+11, OOD+13] is a fast tagger performing coarse-grained anal-
ysis for English microblogs with an accuracy around 92%. [OOD+13] also trained and
tested their tagger on the annotated data of [RCME11] and reported an accuracy of around
90% on the 45 PTB tags plus the 4 (unambiguous) twitter-specific tags. Ark-Tweet-NLP
mostly benefits from word clustering of unlabelled Twitter data using the latent Dirich-
let allocation (LDA) [BNJ03]. [Reh13] extended Ark-Tweet-NLP to POS tagging for
German.
2.2 Multi-document Summarization
As a fundamental and effective tool for document understanding and organization, multi-
document summarization enables better information service by creating concise and in-
9
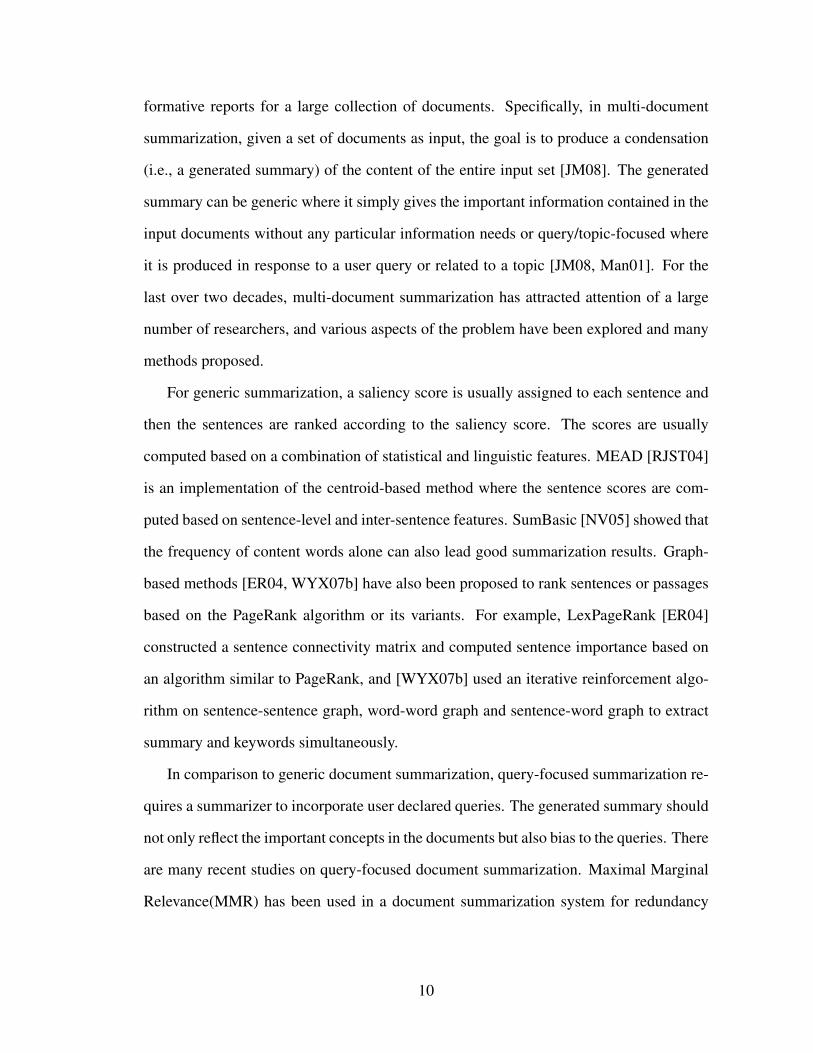
formative reports for a large collection of documents. Specifically, in multi-document
summarization, given a set of documents as input, the goal is to produce a condensation
(i.e., a generated summary) of the content of the entire input set [JM08]. The generated
summary can be generic where it simply gives the important information contained in the
input documents without any particular information needs or query/topic-focused where
it is produced in response to a user query or related to a topic [JM08, Man01]. For the
last over two decades, multi-document summarization has attracted attention of a large
number of researchers, and various aspects of the problem have been explored and many
methods proposed.
For generic summarization, a saliency score is usually assigned to each sentence and
then the sentences are ranked according to the saliency score. The scores are usually
computed based on a combination of statistical and linguistic features. MEAD [RJST04]
is an implementation of the centroid-based method where the sentence scores are com-
puted based on sentence-level and inter-sentence features. SumBasic [NV05] showed that
the frequency of content words alone can also lead good summarization results. Graph-
based methods [ER04, WYX07b] have also been proposed to rank sentences or passages
based on the PageRank algorithm or its variants. For example, LexPageRank [ER04]
constructed a sentence connectivity matrix and computed sentence importance based on
an algorithm similar to PageRank, and [WYX07b] used an iterative reinforcement algo-
rithm on sentence-sentence graph, word-word graph and sentence-word graph to extract
summary and keywords simultaneously.
In comparison to generic document summarization, query-focused summarization re-
quires a summarizer to incorporate user declared queries. The generated summary should
not only reflect the important concepts in the documents but also bias to the queries. There
are many recent studies on query-focused document summarization. Maximal Marginal
Relevance(MMR) has been used in a document summarization system for redundancy
10
removal [GMCK00], in which the best sentence is considered the one that is most similar
to the query and least similar to the text that is already in the summary. A non-negative
matrix factorization (NMF) based query-focused summarization method was proposed
in [WLZD08], which used the cosine similarity measure between the expanded query
and the semantic features obtained by NMF to rank sentences. Manifold ranking was
applied [WX09] to decide the relationship between the given query and the sentences by
making use of the relationship among all the sentences in the documents. Probability
models have also been proposed under different assumption on the generation process
of the documents and the queries [DIM06, HV09, TYC09]. A recent work [Wan09]
conducted subtopic analysis for document summarization, in which explicit or implicit
subtopics are discovered using heuristic syntactic rules and term co-occurrence.
2.3 Event Detection
The concept of event detection is first introduced by Topic detection and tracking (TDT),
which is a research program initiated by DARPA (Defense Advanced Research Projects
Agency) for finding and following the new events in streams of broadcast news stories1.
TDT consists of three major technical tasks, including the detection of unknown events,
the tracking of known events, and segmentation of a news source into stories. Many
promising research studies have arisen during the TDT evaluations, specifically within
the information retrieval and natural language processing communities [YPC98, APL98,
All02, KA04]. Most of them assume that all the documents in the given collections are
somehow related to a number of undiscovered events, and which can be discovered by
using text classification and text clustering techniques.
1http://projects.ldc.upenn.edu/TDT/
11

Attempts have been made to adapt the methods developed on formal document col-
lections to event detection on social media. For example, [POL10] proposed an algorithm
based on locality-sensitive hashing for detecting new events from a stream of Twitter
posts. However, the assumption that all the documents in the given collections are re-
lated to a number of events is not held on social media, since the related social media
posts about an event can easily be overwhelmed by a large volume of trivial ones. So
most recent studies are trying to address this issue. [BNG11] proposed an online cluster-
ing technique to group together the topically similar tweets and used a SVM classifier to
distinguish between the event and non-event clusters. [OKA10] proposed demo systems
to display the event-related themes and popular tweets, allowing the users to navigate
through their topic of interest. [ZZWV11] described an effort to perform data collection
and event recognition despite various limits to the free access of Twitter data. [DJZL12]
integrated both temporal information and users’ personal interests for bursty topic de-
tection from the microblogs. [RMEC12] described an open-domain event-extraction and
categorization system, which extracts an open-domain calendar of significant events from
Twitter.
Event detection has also been applied in summarization of social media streams,
where important events are first detected as parts of the summary. [MBB+11] introduced
a “TwitInfo” system to visually summarize and track the events on Twitter. They pro-
posed an automatic peak detection and labeling algorithm for the social streams. [CP11]
proposed an event summarization algorithm based on learning an underlying hidden state
representation of the event via hidden Markov models. [NMD12, ZSAG12] focused on
real-time event summarization, which detected the sub-events by identifying those mo-
ments where the tweet volume has sharp increases, then used various weighting schemes
to perform tweet selection and finally generates the event summary.
12

2.4 Sentiment Analysis
A typical problem in sentiment analysis is classifying a piece of text into “Positive”, “Neg-
ative” or “Neutral”. “Positive” means that the user expresses the support or likeness of the
target topic; “Negative” means the opposite; “Neutral” means that the text is objective.
Traditionally, the classification is conducted on reviews (including blogs and comments).
Various methods have been proposed to train a model for reviews of a particular domain
of products given existing labeled reviews [Gam04, PLV02, WWH05, MC04].
Now with the popularity of social network such as Facebook and Twitter, many people
express their opinions and comments about products, companies, politicians and events
on these social media sites. As social media has become an important data source for
companies to get feedback and for public affair persons to analysis the dynamic senti-
ment trends on public events, researchers have been working on how to adapt sentiment
classification to social media data, especially Twitter data. The key issue is training data.
With a large range of topics discussed on Twitter, it would be difficult to label enough
social media posts for each of topics manually. In order to generate automatically train-
ing data, Twitter tags and smileys were utilized in [DTR10, GBH09]. Similar ideas were
applied in [ZGD+11], where first a lexicon-based method was applied to generate high
precision low recall labels, and then these labels were used to training a learning-based
model to boost recall. Instead of using lexical “distant supervision” [GBH09], [ZGD+11]
made use of existing twitter sentiment services like Twendz2, Twitter Sentiment3 and
TweetFeel4 for labels, trained several models, each based on one data source, and finally
ensembled the classification results to reduce the bias and noise introduced by the training
2http://twendz.waggeneredstrom.com/
3http://twittersentiment.appspot.com/
4http://www.tweetfeel.com/
13

data. We can see that the supervision may come from lexicons in tweets, such as tags and
smileys, as well as from biased tweet labelers. To leverage both types of supervision into
a unified approach, dual supervision learning [SHM09] can be used. One of the methods
is to conduct non-negative matrix tri-factorization (tri-NMF), mapping both tweets and
terms in tweets into sentiment space, with as constraints a prior of labeled tweets and
terms [LZS09].
Another issue is that unlike traditionally studied reviews, social media posts are not
well organized with respect of target topics, which is important because in traditional sen-
timent analysis study, it has been shown that the different topic domains need different
classification models. [JYZ+11] introduced target-dependent features for sentiment anal-
ysis in Twitter, so given different target, features of a tweet may be different. [DWT+14]
integrated target information with a deep learning model, Adaptive Recursive Neural Net-
work, which automatically propagates sentiments of words towards the target. But still in
their work, training data was manually labeled, so the problem was only partially solved
unless we can effectively reduce the cost to generate training data.
Although the difference between social media text and traditionally studied reviews
imposes challenges for sentiment analysis, the social network structure behind the social
media can be utilized. [TLT+11] studied user-level sentiment, analyzing sentiment over
all tweets posted by a user about a target and assuming that close users share sentiment.
[HTTL13] presented a mathematical optimization formulation that incorporated the sen-
timent consistency over social network into the supervised learning process.
14
CHAPTER 3
TRI-NMF BASED ACTIVE DUAL SUPERVISION
3.1 Introduction
With the popularity of social network, many people express their opinions on social media
sites, like Facebook and Twitter. The large number of such posts makes social media rich
in sentiment and become an important sentiment data source. In order to utilize such
information on social media, it is a necessity to conduct sentiment analysis to classify a
post into “Positive”, “Negative” or “Neutral”. Even although sentiment analysis has been
well explored on text of product reviews [Gam04, PLV02, WWH05, MC04], it is still
challenging on social media, since with a wide range of topics discussed on social media,
it would be difficult to labeled enough posts for each of topics manually.
The challenge can be partially addressed by active learning, as an effective paradigm
to optimize the learning benefit from domain experts’ feedback and to reduce the cost of
acquiring labeled examples for supervised learning, has been intensively studied in re-
cent years [MN98, TK02, Set09]. Traditional approaches for active learning query the
human experts to obtain the labels for intelligently chosen data samples. However, in
text classification where the input data is generally represented as document-word ma-
trices, human supervision can be obtained on both documents and words. For example,
in sentiment analysis of product reviews, human labelers can label reviews as positive
or negative, they can also label the words that elicit positive sentiment (such as “sensa-
tional” and “electrifying”) as positive and words that evoke negative sentiment (such as
“depressed” and “unfulfilling”) as negative. It has been demonstrated that labeled words
(or feature supervision) can greatly reduce the number of labeled samples for building
high-quality classifiers [DMM08, ZE08]. In fact, different kinds of supervision generally
have different acquisition costs, different degrees of utility and are not mutually redun-
15
dant [SML09]. Ideally, effective active learning schemes should be able to utilize different
forms of supervision.
To incorporate the supervision on words and documents at same time into the active
learning scheme, recently an active dual supervision (or dual active learning) has been
proposed [MS09, SML09]. Comparing with traditional active learning, which aims to se-
lect the most “informative” examples (e.g., documents) for domain experts to label, active
dual supervision selects both the “informative” examples (e.g., documents) and features
(e.g., words) for labeling. For active dual supervision to be effective, there are three im-
portant components: a) an underlying learning mechanism that is able to learn from both
the labeled examples and features (i.e., incorporating supervision on both examples and
features); b) methods for estimating the value of information for example and feature la-
bels; and c) a scheme that should be able to trade-off the costs and benefits of the different
forms of supervision since they have different labeling costs and different benefits.
In the initial work on active dual supervision [SML09], a transductive bipartite graph
regularization approach is used for learning from both labeled examples and features. In
addition, uncertainty sampling and experimental design are used for selecting informative
examples and features for labeling. To trade-off between different types of supervision, a
simple probabilistic interleaving scheme where the active learner probabilistically queries
the example oracle and the feature oracle is used. One problem in their method is that the
values of acquiring the feature labels and the example labels are not on the same scale.
Recently, [LZS09] proposed a dual supervision method based on constrained non-
negative tri-factorization of the document-term matrix where the labeled features and
examples are naturally incorporated as sets of constraints. Having a framework for incor-
porating dual-supervision based on matrix factorization, gives rise to the natural question
of how to perform active dual supervision in this setting. Since rows and columns are
treated equally in estimating the errors of matrix factorization, another question is can we
16
make use of this characteristic of a matrix to address the scaling issue in comparing the
value of feature labels and example labels.
In this chapter, we study the problem of active dual supervision using non-negative
matrix tri-factorization. Our work is based on the dual supervision framework using con-
strained non-negative tri-factorization proposed in [LZS09]. We first extend the frame-
work to explicitly model the corresponding relationships between feature classes and ex-
ample classes. Then by making use of the reconstruction error criterion in matrix factor-
ization, we propose a unified scheme to evaluate the value of feature and example labels.
Instead of comparing the estimated performance increase of new feature labels or exam-
ple labels, our proposed scheme assumes that a better supervision (a feature label or a
example label) should lead to a more accurate reconstruction of the original data matrix.
In our proposed scheme, the value of feature labels and example labels is computed on the
same scale. The experiments show that our proposed unified scheme to query selection
(i.e., feature/example selection for labeling) outperforms the interleaving schemes and the
scheme based on expected log gain.
3.2 Related Work
Besides the literature of sentiment analysis discussed in 2.4, some previous research re-
sults that are most relevant to this work are highlighted in the following two directions:
active learning and dual supervision.
3.2.1 Active Learning and Dual Active Learning
A recent report [Set09] surveys in depth on active learning. In this section, we briefly
cover related work to position our contributions appropriately. Most prior work in active
learning has focused on pooled-based techniques, where examples from an unlabeled pool
17
are selected for labeling [CAL94]. With the study of learning from labeled features, many
research efforts on active learning with feature supervision are also reported [MSTPM05,
RMJ06]. [GHSC04] proposed the notion of feature uncertainty and incorporated the ac-
quired feature labels into learning by creating one-term mini-documents. [DSM09] per-
formed active learning via feature labeling using several uncertainty reduction heuristics
using the learning model developed in [DMM08]. [SML09] studied the problem of ac-
tive dual supervision from examples and features using a graph-based dual supervision
method with a simple probabilistic method for interleaving feature labels and example
labels. In our work, we develop our active dual supervision framework using constrained
non-negative tri-factorization and also propose a unified scheme to evaluate the value of
feature and example labels. We note the very recent work of [AMP10], which proposes
a unified approach for the dual active learning problem using expected utility where the
utility is defined as the log gain of the classification model with a new labeled document
or word. Conceptually, our proposed unified scheme is a special case of the expected util-
ity framework where the utility is computed using the matrix reconstruction error. The
utility based on the log gain of the classification model may not be reliable as small model
changes resulted from a single additional example label or feature label may not be re-
flected in the classification performance [AMP10]. The empirical comparisons show that
our proposed unified scheme based on reconstruction error outperforms the expected log
gain.
3.2.2 Dual Supervision
Note that a learning method that is capable of performing dual supervision (i.e., learning
from both labeled examples and features) is the basis for active dual supervision. Dual
supervision is a relatively new area of research and few methods have been developed for
18
dual supervision. In [SM08, SHM09], a bipartite graph regularization model (GRADS)
is used to diffuse label information along both sides of the document-term matrix and
to perform dual supervision for semi-supervised sentiment analysis. Conceptually, their
model implements a co-clustering assumption closely related to Singular Value Decom-
position (see also [Dhi01, ZHD+01] for more on this perspective). In [STUB08], standard
regularization models are constrained using graphs of word co-occurrences. In [MGL09],
Naive Bayes classifier is extended, where the parameters, the conditional word distribu-
tions given the classes, are estimated by combining multiple sources, e.g. document labels
and word labels. Our work is based on the dual supervision framework using constrained
non-negative tri-factorization.
3.3 Dual Supervision via Tri-NMF with Explicit Class Alignment
3.3.1 Learning with Dual Supervision via Tri-NMF
Our dual supervision model is based on non-negative matrix tri-factorization (Tri-NMF),
where the non-negative input document-word matrix is approximated by 3 factor matrices
asX ≈ GSF T , in which,X is an n×m document-term matrix,G is an n×k non-negative
orthogonal matrix representing the probability of generating a document from a document
cluster, F is an m × k non-negative orthogonal matrix representing the probability of
generating a word from a word cluster, and S is a k× k nonnegative matrix providing the
relationship between document cluster space and word cluster space.
While Tri-NMF is first applied in co-clustering, it is extended in [LZS09] to incorpo-
rate labeled words and documents as dual supervision via two loss terms in the objective
19

function of Tri-NMF as following:
minF,G,S
∥X −GSF T∥2 + α trace[(F − F0)TC1(F − F0)]
+ β trace[(G−G0)TC2(G−G0)]. (3.1)
Here, α > 0 is a parameter which determines the extent to which we enforce F ≈ F0 to
its labeled rows. C1 is a m×m diagonal matrix whose entry (C1)ii = 1 if the row of F0
is labeled, that is, the class of the i-th word is known and (C1)ii = 0 otherwise. β > 0 is a
parameter which determines the extent to which we enforce G ≈ G0 to its labeled rows.
C2 is a n× n diagonal matrix whose entry (C2)ii = 1 if the row of G0 is labeled, that is,
the category of the i-th document is known and (C2)ii = 0 otherwise. The squared loss
terms ensure that the solution for G,F in the otherwise unsupervised learning problem be
close to the prior knowledge G0, F0. So the partial labels on documents and words can be
described using G0 and F0, respectively.
3.3.2 Modeling the Relationships between Word Classes and Docu-
ment Classes
In the solution to Equation 3.1, we have S = GTXF , or
Slk = gTl Xfk =1
|Rl|1/2|Ck|1/2∑i∈Rl
∑j∈Ck
Xij, (3.2)
where |Rl| is the size of the l-th document class, and |Ck| is the size of the k-th word
class [DLPP06]. Note that Slk represents properly normalized within-class sum of weights
(l = k) and between-class sum of weights (l = k). So, S represents the relationship be-
tween the classes over documents and the classes over words. Under the assumption that
the i-th document class should correspond to the i-th word class, S should be an approx-
imate diagonal matrix, since the documents of i-th class is more likely to contain the
20
words of the i-th class. Note that S is not an exact diagonal matrix, since a document of
one class apparently can use words from other classes (especially G and F are required
to be approximately orthogonal, which means the classification is rigorous). However, in
Equation 3.1, there are no explicit constraints on the relationship between word classes
and document classes. Instead, the relationship is established and enforced implicitly
using existing labeled documents and words.
In active learning, the set of starting labeled documents or words is small, and this may
generate an ill-formed S, leading to an incorrect alignment of word classes and document
classes. To explicitly model the relationships between word classes and document classes,
we constrain the shape of S via an extra loss term in the objective function as follows:
minF,G,S
∥X −GSF T∥2 + α trace[(F − F0)TC1(F − F0)]
+ β trace[(G−G0)TC2(G−G0)] + γ trace[(S − S0)
T (S − S0)] (3.3)
where S0 is a diagonal matrix. We will discuss the choice of S0 in Section 3.3.4.
3.3.3 Computing Algorithm
This optimization problem can be solved using the following update rules
Gjk ← GjkXFS + βC2G0
(GGTXFS + βGGTC2G)jk, (3.4)
Sjk ← SjkF TXTG+ γS0
(F TFSGTG+ γS)jk, (3.5)
Fjk ← FjkXTGST + αC1F0
(FF TXTGST + αC1F )jk. (3.6)
The algorithm consists of an iterative procedure using the above three rules until conver-
gence.
Theorem 3.3.1 The solution satisfies the Karuch-Kuhn-Tucker (KKT) optimality condi-
tion, i.e., the algorithm converges correctly to a local optima.
21

Proof. Proof of the updates of F and G is the same as in [LZS09]. Here we focus on the
update rule of S. We want to minimize
L(S) = ∥X −GSF T∥+ α trace[(F − F0)TC1(F − F0)]
+ β trace[(G−G0)TC2(G−G0)] + γ trace[(S − S0)
T (S − S0)]. (3.7)
The gradient of L is
∂L∂S
= 2F TFSGTG− 2F TXTG+ 2γ(S − S0)
The KKT complementarity condition for the non-negativity of Sjk gives
[2F TFSGTG− 2F TXTG+ 2γ(S − S0)]jkSjk = 0.
This is the fixed point relation that local minima for S must satisfy, which is equivalent
with the update rule of S in Equation 3.6.
3.3.4 Probabilistic Interpretation of Tri-NMF
If X is L1 normalized, then the entries of X present the joint probability distribution of
word and document p(d, w), which can be decomposed as follows:
p(d, w) =∑
p(d, w|zd, zw)p(zd, zw), (3.8)
=∑
p(w|zw)p(d|zd)p(zd, zw), (3.9)
where we have used the conditional independence p(d, w|zd, zw) = p(w|zw)p(d|zd). Here
random variables w,d represent the word and document respectively, and zw, zd are latent
class variables.
If we set
Fil = p(w = wi|zw = l), (3.10)
Gjk = p(d = dj|zd = k), (3.11)
Skl = p(zd = k, zw = l), (3.12)
22
then
(GSF T )ij =∑k,l
Gd=di,zd=kSzd=k,zw=lFw=wj ,zw=k (3.13)
=∑k,l
[p(d = di|zd = k)p(w = wj|zw = l)p(zd = k, zw = l)] (3.14)
= p(d = di, w = wj). (3.15)
So if X is L1 normalized, the 3 factors G,F, S of Tri-NMF can be interpreted as the
conditional document distributions given the document class, conditional word distribu-
tions given the word class, and the joint distribution of a document class and a word
class. Given K word/document classes, according to the probability interpretation, we
can estimate S0 as follows:
[S0]kl = p(zd = k, zw = k) (3.16)
=
1/K l = k,
0 otherwise.(3.17)
3.4 A Unified Query Selection Scheme Using Reconstruction Error
An ideal active dual supervision scheme should be able to evaluate the value of acquiring
labels for documents and words on the same scale. In the initial study of dual active super-
vision, different scores are used for documents and words (e.g. uncertainty for documents
and certainty for words), and thus they are not on the same scale [SML09]. Recently, the
framework of Expected Utility (Estimated Risk Minimization) is proposed in [AMP10].
At each step of the framework, the next word or document selected for labeling is the one
that will result in the highest estimated improvement in classifier performance as defined
as:
EU(qj) =K∑k=1
P (qj = ck)U(qj = ck), (3.18)
23
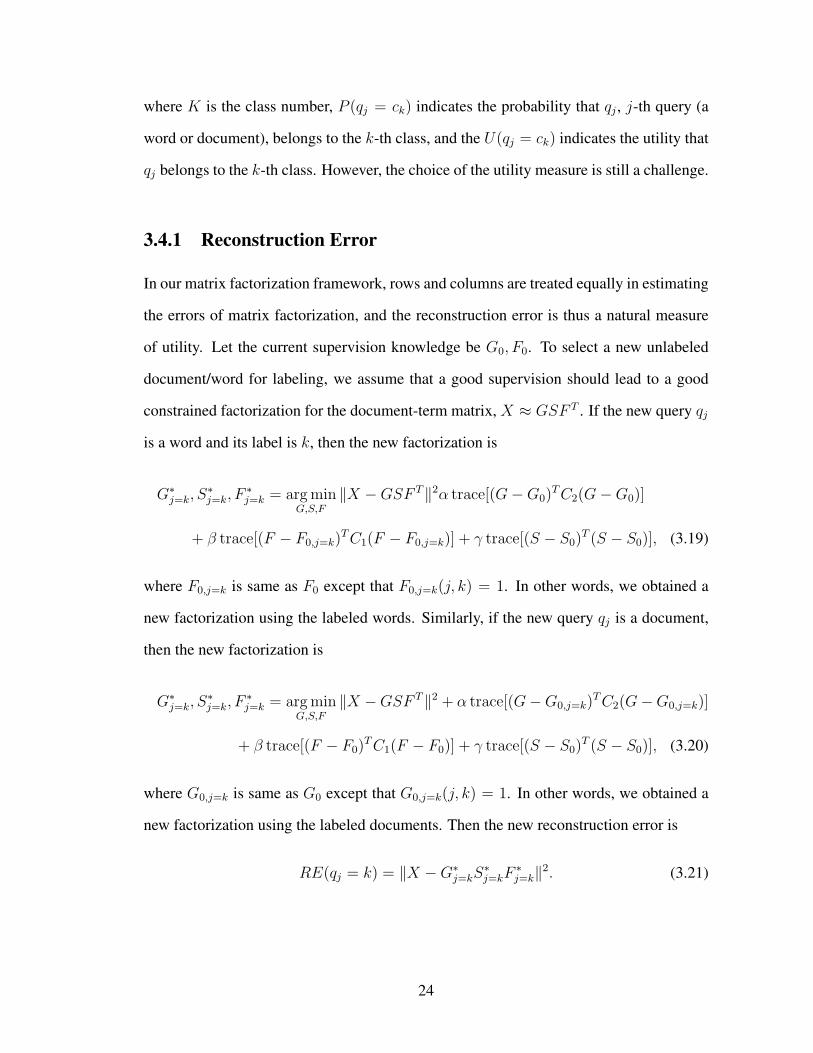
where K is the class number, P (qj = ck) indicates the probability that qj , j-th query (a
word or document), belongs to the k-th class, and the U(qj = ck) indicates the utility that
qj belongs to the k-th class. However, the choice of the utility measure is still a challenge.
3.4.1 Reconstruction Error
In our matrix factorization framework, rows and columns are treated equally in estimating
the errors of matrix factorization, and the reconstruction error is thus a natural measure
of utility. Let the current supervision knowledge be G0, F0. To select a new unlabeled
document/word for labeling, we assume that a good supervision should lead to a good
constrained factorization for the document-term matrix, X ≈ GSF T . If the new query qj
is a word and its label is k, then the new factorization is
G∗j=k, S
∗j=k, F
∗j=k = argmin
G,S,F∥X −GSF T∥2α trace[(G−G0)
TC2(G−G0)]
+ β trace[(F − F0,j=k)TC1(F − F0,j=k)] + γ trace[(S − S0)
T (S − S0)], (3.19)
where F0,j=k is same as F0 except that F0,j=k(j, k) = 1. In other words, we obtained a
new factorization using the labeled words. Similarly, if the new query qj is a document,
then the new factorization is
G∗j=k, S
∗j=k, F
∗j=k = argmin
G,S,F∥X −GSF T∥2 + α trace[(G−G0,j=k)
TC2(G−G0,j=k)]
+ β trace[(F − F0)TC1(F − F0)] + γ trace[(S − S0)
T (S − S0)], (3.20)
where G0,j=k is same as G0 except that G0,j=k(j, k) = 1. In other words, we obtained a
new factorization using the labeled documents. Then the new reconstruction error is
RE(qj = k) = ∥X −G∗j=kS
∗j=kF
∗j=k∥2. (3.21)
24
So the expected utility of a document or word label query, qj , can be computed as
EU(qj) =K∑k=1
P (qj = k) ∗ (−RE(qj = k)). (3.22)
3.4.2 Algorithm Description
Computational Improvement: It can be computationally intensive if the reconstruction
error is computed for all unknown documents and words. Inspired by [AMP10], we first
select the top 100 unknown words that the current model is most certain about, and the top
100 unknown documents that the current model is most uncertain about. Then we iden-
tify the words or documents in this pool with the highest expected utility (reconstruction
error). As discussed in Section 3.3.4, the posterior distribution for words and documents
can be estimated using the factors of Tri-NMF as follows:
p(zw = k|w = wi) ∝ p(w = wi|zw = k)K∑j=1
p(zw = k, zd = j) (3.23)
= Fik ∗K∑j=1
Skj. (3.24)
p(zd = k|d = di) ∝ p(d = di|zd = k)K∑j=1
p(zw = j, zd = k) (3.25)
= Gik ∗K∑j=1
Sjk. (3.26)
Thus, Equations 3.23 and 3.25 are used to perform the initial selection of top 100 unknown
words and top 100 unknown documents.
The overall algorithm procedure is described in Algorithm 1. First we iteratively
use the updating rules of Equation 3.6 to obtain the factorization G,F, S based on initial
labeled documents and words. Then to select a new query, for each unlabeled document or
word in the pool and for each possible class, we compute the reconstruction error with new
25
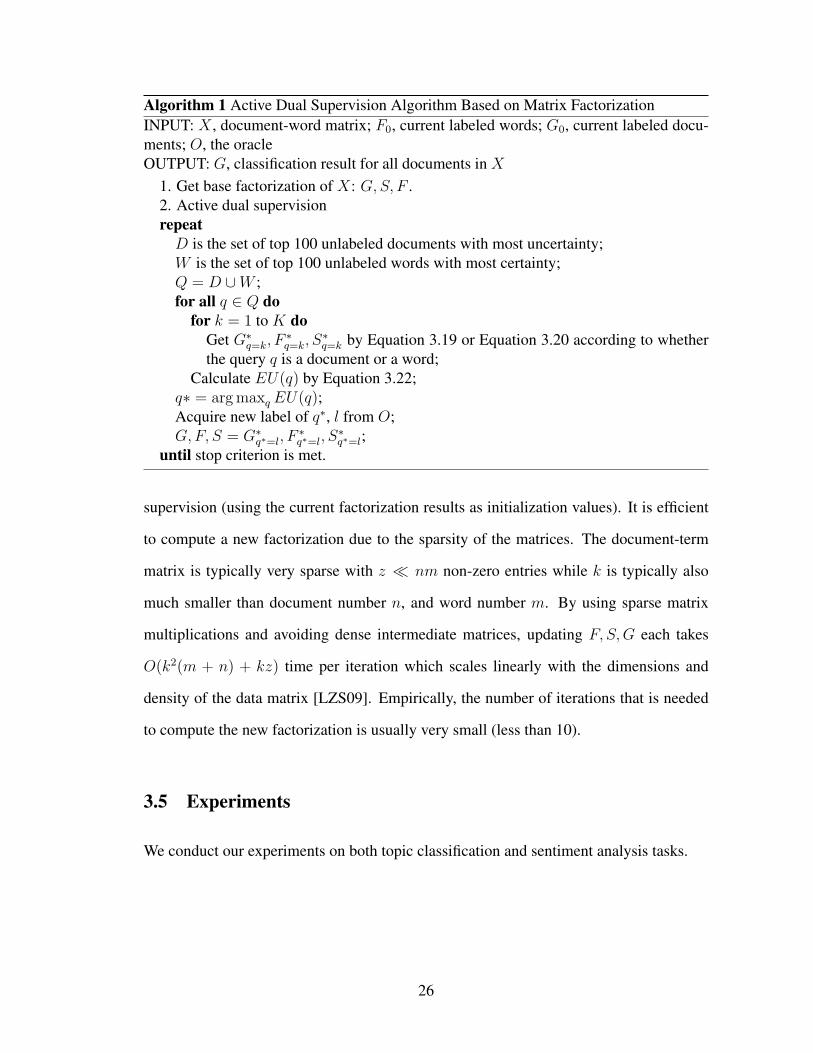
Algorithm 1 Active Dual Supervision Algorithm Based on Matrix FactorizationINPUT: X , document-word matrix; F0, current labeled words; G0, current labeled docu-ments; O, the oracleOUTPUT: G, classification result for all documents in X
1. Get base factorization of X: G,S, F .2. Active dual supervisionrepeatD is the set of top 100 unlabeled documents with most uncertainty;W is the set of top 100 unlabeled words with most certainty;Q = D ∪W ;for all q ∈ Q do
for k = 1 to K doGet G∗
q=k, F∗q=k, S
∗q=k by Equation 3.19 or Equation 3.20 according to whether
the query q is a document or a word;Calculate EU(q) by Equation 3.22;
q∗ = argmaxq EU(q);Acquire new label of q∗, l from O;G,F, S = G∗
q∗=l, F∗q∗=l, S
∗q∗=l;
until stop criterion is met.
supervision (using the current factorization results as initialization values). It is efficient
to compute a new factorization due to the sparsity of the matrices. The document-term
matrix is typically very sparse with z ≪ nm non-zero entries while k is typically also
much smaller than document number n, and word number m. By using sparse matrix
multiplications and avoiding dense intermediate matrices, updating F, S,G each takes
O(k2(m + n) + kz) time per iteration which scales linearly with the dimensions and
density of the data matrix [LZS09]. Empirically, the number of iterations that is needed
to compute the new factorization is usually very small (less than 10).
3.5 Experiments
We conduct our experiments on both topic classification and sentiment analysis tasks.
26
0.45
0.5
0.55
0.6
0.65
0.7
0.75
0.8
10-1020-15
30-2040-25
50-30400-50
500-60
600-70
700-80
800-90
Acc
urac
y
#labeled documents-#labeled words
w/o. constraint on Sw/. constraint on S
(a) baseball-hockey
0.5
0.55
0.6
0.65
0.7
0.75
0.8
0.85
10-1020-15
30-2040-25
50-30400-50
500-60
600-70
700-80
800-90
Acc
urac
y
#labeled documents-#labeled words
w/o. constraint on Sw/. constraint on S
(b) ibm-mac
0.5
0.55
0.6
0.65
0.7
0.75
10-1020-15
30-2040-25
50-30400-50
500-60
600-70
700-80
800-90
Acc
urac
y
#labeled documents-#labeled words
w/o. constraint on Sw/. constraint on S
(c) med-space
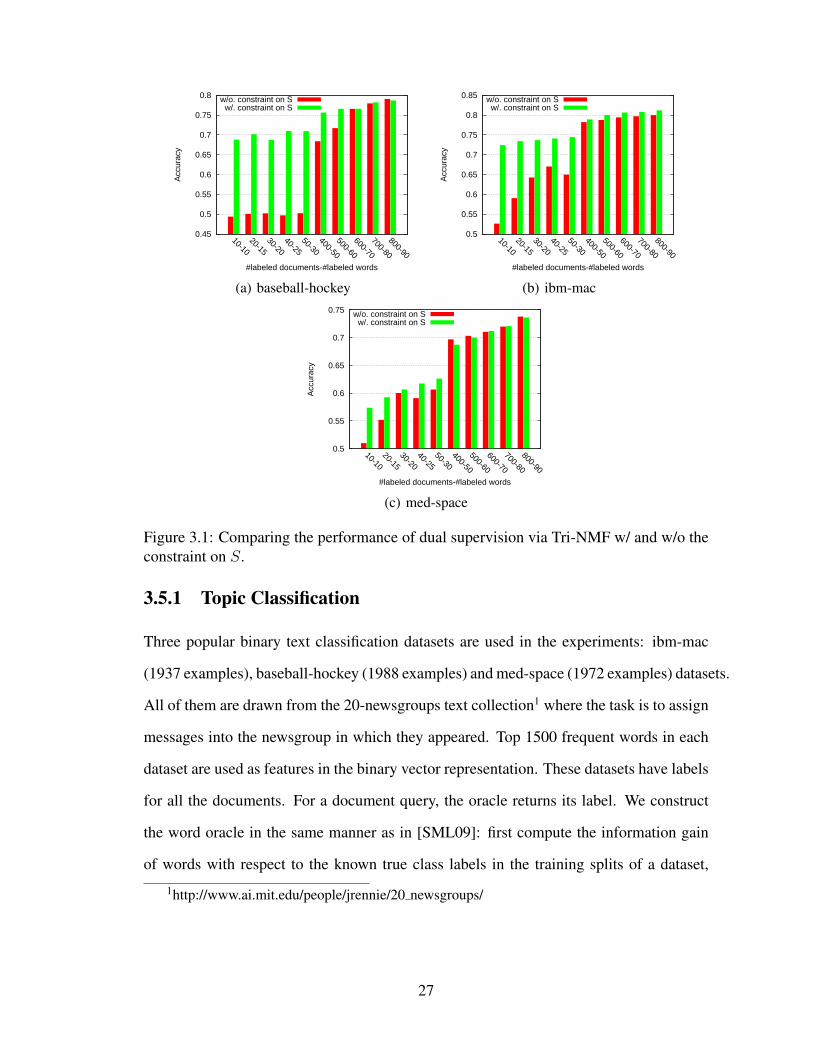
Figure 3.1: Comparing the performance of dual supervision via Tri-NMF w/ and w/o theconstraint on S.
3.5.1 Topic Classification
Three popular binary text classification datasets are used in the experiments: ibm-mac
(1937 examples), baseball-hockey (1988 examples) and med-space (1972 examples) datasets.
All of them are drawn from the 20-newsgroups text collection1 where the task is to assign
messages into the newsgroup in which they appeared. Top 1500 frequent words in each
dataset are used as features in the binary vector representation. These datasets have labels
for all the documents. For a document query, the oracle returns its label. We construct
the word oracle in the same manner as in [SML09]: first compute the information gain
of words with respect to the known true class labels in the training splits of a dataset,
1http://www.ai.mit.edu/people/jrennie/20 newsgroups/
27
and then the top 100 words as ranked by information gain are assigned the label which
is the class in which the word appears more frequently. To those words with labels, the
word oracle returns its label; otherwise, the oracle returns a “don’t know” response (no
word label is obtained for learning, but the word is excluded from the following query
selection).
Results are averaged over 10 random training-test splits. For each split, 30% examples
are used for testing. All methods are initialized by a random choice of 10 document
labels and 10 word labels. For simplicity, we follow the widely used cost model [RA07,
DMM08, SML09] where features are roughly 5 times cheaper to label than examples, so
we assume the cost is 1 for a word query and is 5 for a document query. We set α = β = 5,
γ = 1 for all the following experiments2.
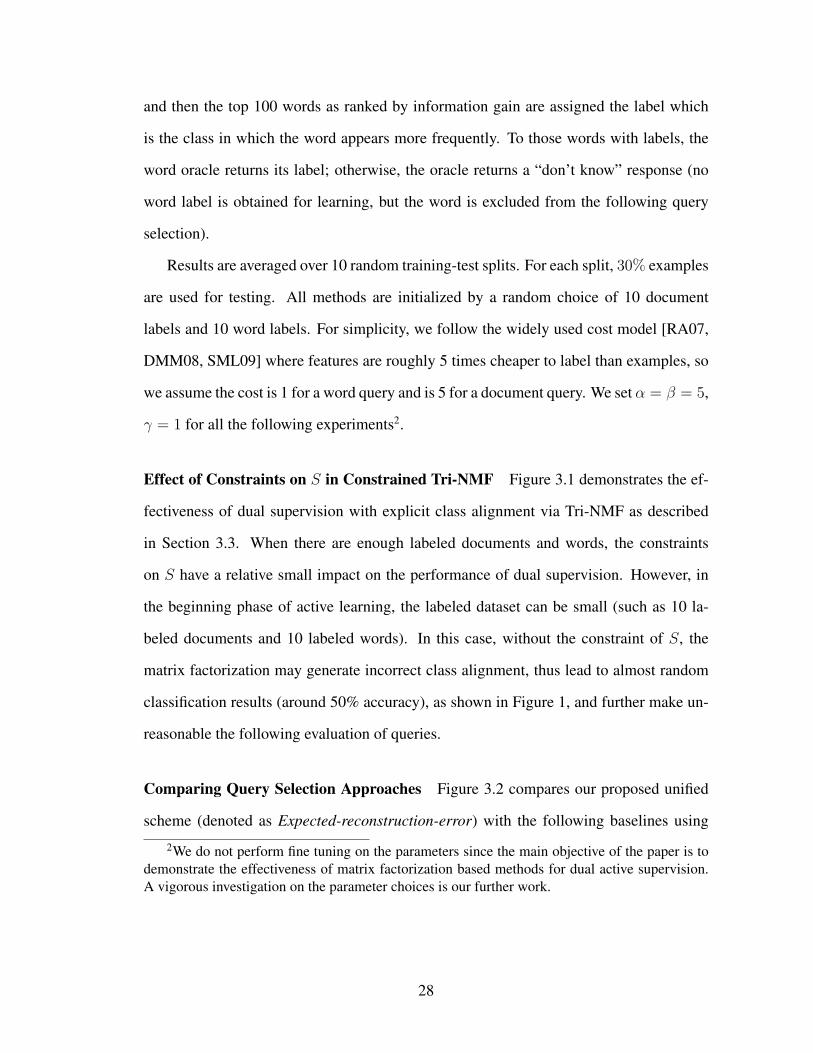
Effect of Constraints on S in Constrained Tri-NMF Figure 3.1 demonstrates the ef-
fectiveness of dual supervision with explicit class alignment via Tri-NMF as described
in Section 3.3. When there are enough labeled documents and words, the constraints
on S have a relative small impact on the performance of dual supervision. However, in
the beginning phase of active learning, the labeled dataset can be small (such as 10 la-
beled documents and 10 labeled words). In this case, without the constraint of S, the
matrix factorization may generate incorrect class alignment, thus lead to almost random
classification results (around 50% accuracy), as shown in Figure 1, and further make un-
reasonable the following evaluation of queries.
Comparing Query Selection Approaches Figure 3.2 compares our proposed unified
scheme (denoted as Expected-reconstruction-error) with the following baselines using
2We do not perform fine tuning on the parameters since the main objective of the paper is todemonstrate the effectiveness of matrix factorization based methods for dual active supervision.A vigorous investigation on the parameter choices is our further work.
28

0.7
0.72
0.74
0.76
0.78
0.8
0.82
0.84
0 100 200 300 400 500 600 700 800
Acc
urac
y
Labeling Cost
Expected-log-gainInterleaved-uncertainty-0.2Interleaved-uncertainty-0.4Interleaved-uncertainty-0.6Interleaved-uncertainty-0.8
Expected-reconstruction-error
(a) baseball-hockey
0.7
0.72
0.74
0.76
0.78
0.8
0.82
0 100 200 300 400 500 600 700 800
Acc
urac
yLabeling Cost
Expected-log-gainInterleaved-uncertainty-0.2Interleaved-uncertainty-0.4Interleaved-uncertainty-0.6Interleaved-uncertainty-0.8
Expected-reconstruction-error
(b) ibm-mac
0.56
0.58
0.6
0.62
0.64
0.66
0.68
0.7
0 100 200 300 400 500 600 700 800
Acc
urac
y
Labeling Cost
Expected-log-gainInterleaved-uncertainty-0.2Interleaved-uncertainty-0.4Interleaved-uncertainty-0.6Interleaved-uncertainty-0.8
Expected-reconstruction-error
(c) med-space
Figure 3.2: Comparing the different query selection approaches in active learning viaTri-NMF with dual supervision.
29
Tri-NMF as the classifier for dual supervision: (1). Interleaved-uncertainty which first
selects feature query by certainty and sample query by uncertainty and then combines the
two types of queries using an interleaving scheme. The interleaving probability (probabil-
ity to select the query as a document) is set as 0.2, 0.4, 0.6 and 0.8. (2). Expected-log-gain
which selects feature and sample query by maximizing the expected log gain. Expected-
reconstruction-error outperforms interleaving schemes with all the different interleaving
probability values with which we experimented. It also has a better performance than
Expected-log-gain. Although log gain is a finer-grained utility measure of classifier per-
formance than accuracy and has a good performance in the setting with a large set of
starting labeled documents (e.g., 100 documents), it is not reliable especially in the set-
ting with a small set of labeled data. Different from the Expected-log-gain, Expected-
reconstruction-error estimates the utility using the matrix reconstruction error, making
use of information of all documents and words, including those unlabeled.
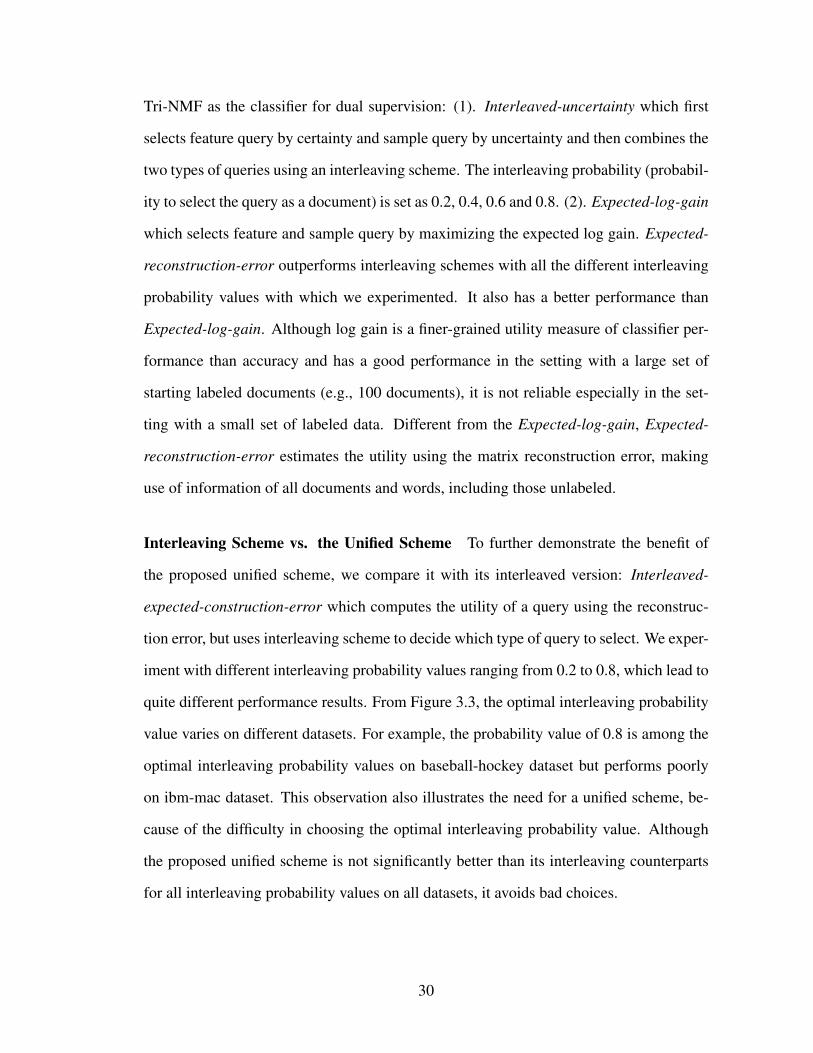
Interleaving Scheme vs. the Unified Scheme To further demonstrate the benefit of
the proposed unified scheme, we compare it with its interleaved version: Interleaved-
expected-construction-error which computes the utility of a query using the reconstruc-
tion error, but uses interleaving scheme to decide which type of query to select. We exper-
iment with different interleaving probability values ranging from 0.2 to 0.8, which lead to
quite different performance results. From Figure 3.3, the optimal interleaving probability
value varies on different datasets. For example, the probability value of 0.8 is among the
optimal interleaving probability values on baseball-hockey dataset but performs poorly
on ibm-mac dataset. This observation also illustrates the need for a unified scheme, be-
cause of the difficulty in choosing the optimal interleaving probability value. Although
the proposed unified scheme is not significantly better than its interleaving counterparts
for all interleaving probability values on all datasets, it avoids bad choices.
30
0.7
0.72
0.74
0.76
0.78
0.8
0.82
0.84
0 100 200 300 400 500 600 700 800
Acc
urac
y
Labeling Cost
Interleaved-expected-reconstruction-error-0.2Interleaved-expected-reconstruction-error-0.4Interleaved-expected-reconstruction-error-0.6Interleaved-expected-reconstruction-error-0.8
Expected-reconstruction-error
(a) baseball-hockey
0.68
0.7
0.72
0.74
0.76
0.78
0.8
0.82
0 100 200 300 400 500 600 700 800A
ccur
acy
Labeling Cost
Interleaved-expected-reconstruction-error-0.2Interleaved-expected-reconstruction-error-0.4Interleaved-expected-reconstruction-error-0.6Interleaved-expected-reconstruction-error-0.8
Expected-reconstruction-error
(b) ibm-mac
0.56
0.58
0.6
0.62
0.64
0.66
0.68
0.7
0 100 200 300 400 500 600 700 800
Acc
urac
y
Labeling Cost
Interleaved-expected-reconstruction-error-0.2Interleaved-expected-reconstruction-error-0.4Interleaved-expected-reconstruction-error-0.6Interleaved-expected-reconstruction-error-0.8
Expected-reconstruction-error
(c) med-space
Figure 3.3: Comparing the unified and interleaving scheme based on reconstruction error.
31

0.86
0.87
0.88
0.89
0.9
0.91
0.92
0.93
0.94
0 100 200 300 400 500 600 700 800
Acc
urac
y
Labeling Cost
GRADS-Interleaving-0.5GRADS-Reconstruction-Error
(a) baseball-hockey
0.62
0.64
0.66
0.68
0.7
0.72
0.74
0.76
0.78
0.8
0.82
0.84
0 100 200 300 400 500 600 700 800A
ccur
acy
Labeling Cost
GRADS-Interleaving-0.5GRADS-Reconstruction-Error
(b) ibm-mac
0.86
0.87
0.88
0.89
0.9
0.91
0.92
0.93
0 100 200 300 400 500 600 700 800
Acc
urac
y
Labeling Cost
GRADS-Interleaving-0.5GRADS-Reconstruction-Error
(c) med-space
Figure 3.4: GRADS with reconstruction error and interleaving uncertainty.
32
50 100 150 200 250 300
Que
ry T
ype
Query Sequence
Word
Document
Word
Document
(a) baseball-hockey
50 100 150 200 250 300
Que
ry T
ype
Query Sequence
Word
Document
(b) ibm-mac
Figure 3.5: Example of query sequence.
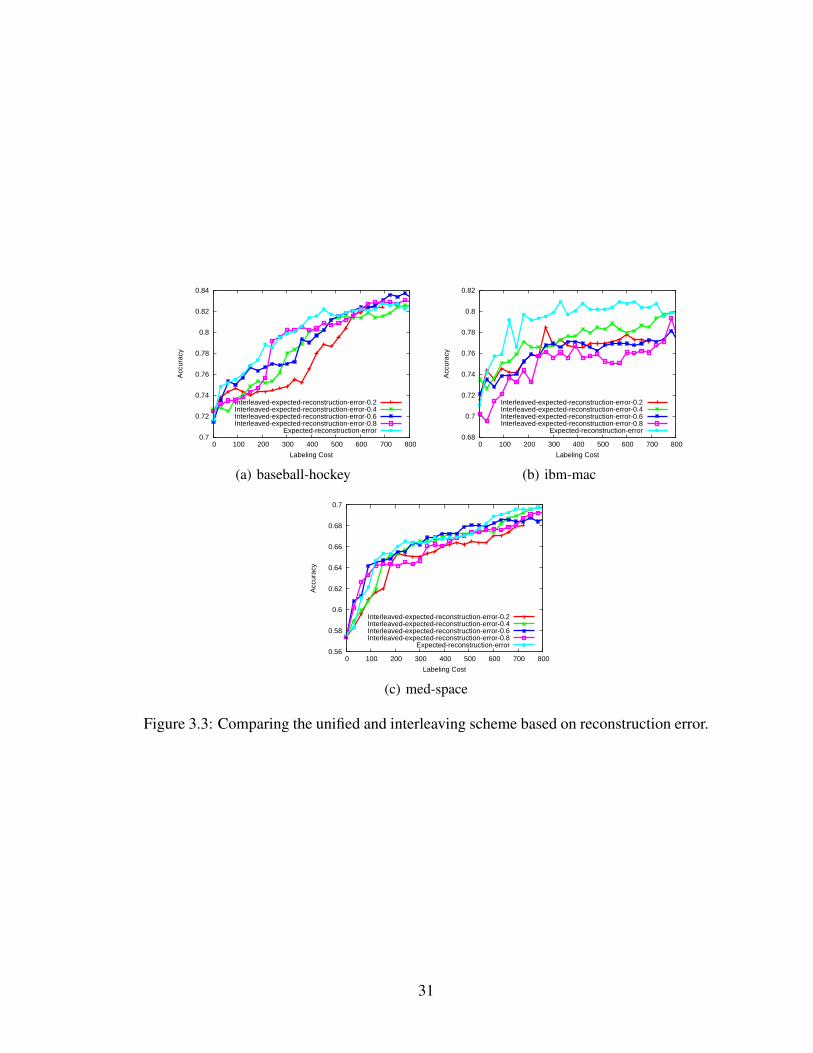
Figure 3.5 presents the sequence of different query types selected by our unified
scheme and it clearly demonstrates the distribution patterns of different query types. At
the beginning phase of active learning, word queries have much higher probabilities to be
selected, which is consistent with the result of previous work: feature labels can be more
effective than examples in text classification [DMM08]. And in the later learning phase,
documents are more likely to be selected, since the number of words that can benefit the
classification is much smaller than the effective documents.
Reconstruction Error vs. Interleaving uncertainty using GRADS It should be pointed
out that our unified scheme for query selection based on reconstruction error does not
rely on the estimation of model performance on training data and can be easily inte-
grated with other dual supervision models such as GRADS [SHM09]. Figure 3.4 shows
the comparison of GRADS using the interleaved scheme with an interleaving probability
of 0.5, and using our unified scheme based on reconstruction error. Among the 3 datasets
33
we used, the reconstruction error based approach outperforms the interleaving scheme on
baseball-hockey and ibm-mac, and has similar performance with the interleaving scheme
on med-space.
3.5.2 Sentiment Classification
0.5
0.55
0.6
0.65
0.7
0.75
0 100 200 300 400 500 600 700 800
Acc
urac
y
Labeling Cost
GRADS-Interleaving-0.2GRADS-Interleaving-0.4GRADS-Interleaving-0.6GRADS-Interleaving-0.8
Tri-NMF-Reconstruction-Error
Figure 3.6: Comparing active dual supervision using matrix factorization with GRADSon sentiment analysis.
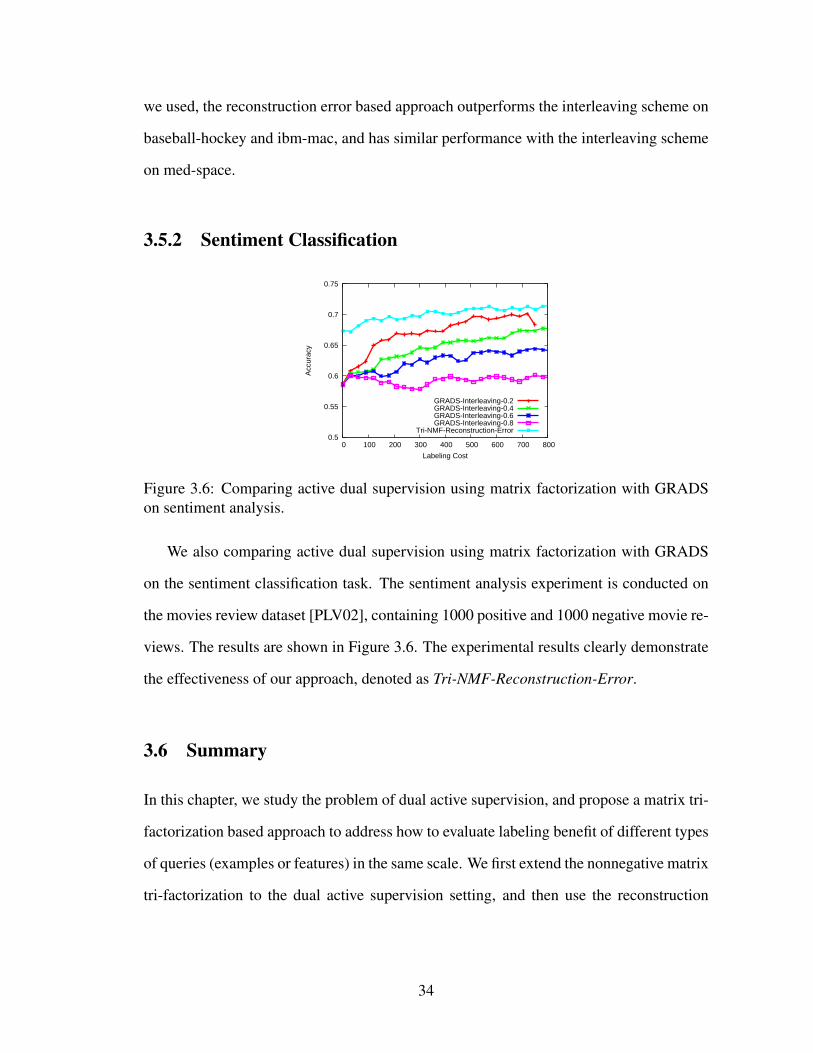
We also comparing active dual supervision using matrix factorization with GRADS
on the sentiment classification task. The sentiment analysis experiment is conducted on
the movies review dataset [PLV02], containing 1000 positive and 1000 negative movie re-
views. The results are shown in Figure 3.6. The experimental results clearly demonstrate
the effectiveness of our approach, denoted as Tri-NMF-Reconstruction-Error.
3.6 Summary
In this chapter, we study the problem of dual active supervision, and propose a matrix tri-
factorization based approach to address how to evaluate labeling benefit of different types
of queries (examples or features) in the same scale. We first extend the nonnegative matrix
tri-factorization to the dual active supervision setting, and then use the reconstruction
34

error to evaluate the value of feature and example labels. Experimental results show
that our proposed approach outperforms existing methods in both topic classification and
sentiment classification.
35
CHAPTER 4
PARTICIPANT-BASED EVENT DETECTION ON TWITTER STREAMS
4.1 Introduction
Twitter, one of the most representative examples of micro-blogging service providers,
allows users to post short messages, tweets, within 140-character limit. One particular
topic Twitter users publish tweets about is “what’s happening”, which makes Twitter dif-
ferentiated from news media with its real-time nature. For example, we could detect a
tweet related to a shooting crime 10 minutes after shots fired, while the first new report
appeared approximately three hours later. Meanwhile, tweets have a broad coverage over
all types of real-world events, accounting for Twitter’s large number of users, including
verified accounts such as news agents, organizations and public figures. The real-time
event information is particularly useful for keep people informed and updated on the
events happening in real-world with their user-contributed messages.
Although the large volume of tweets provides enough information about events, be-
cause of a lot of noises, it is not straightforward and sometimes difficult for people them-
self to access the real information about a particular event from the Twitter stream. To
make use of Twitter’s real-time nature, it is imperative to develop effective automatic
methods to conduct event detection, detecting events from a Twitter stream by identifying
important moments in the stream and their associated tweets.
Most of existing approaches[ZZW+12, MBB+11, WL11, ZSAG12] rely on changes
of tweet volumes by detecting bursts in the stream as important moments, and assume all
tweets during a burst describe the corresponding event. However in real cases, because of
average effects of multiple topics existing in the stream, important moments, in term of
one topic, which may lead bursts among posts about the topic, may not be well reflected
in changes of post volumes in the whole stream. This can be shown using an example in
36
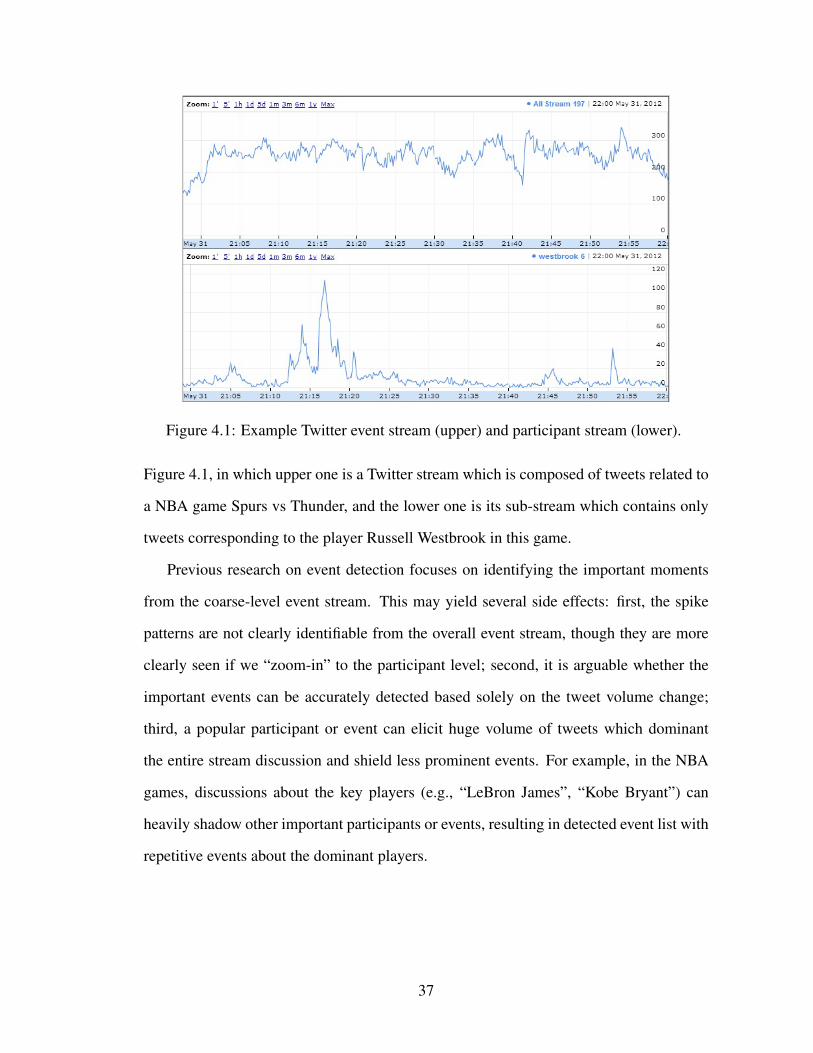
Figure 4.1: Example Twitter event stream (upper) and participant stream (lower).
Figure 4.1, in which upper one is a Twitter stream which is composed of tweets related to
a NBA game Spurs vs Thunder, and the lower one is its sub-stream which contains only
tweets corresponding to the player Russell Westbrook in this game.
Previous research on event detection focuses on identifying the important moments
from the coarse-level event stream. This may yield several side effects: first, the spike
patterns are not clearly identifiable from the overall event stream, though they are more
clearly seen if we “zoom-in” to the participant level; second, it is arguable whether the
important events can be accurately detected based solely on the tweet volume change;
third, a popular participant or event can elicit huge volume of tweets which dominant
the entire stream discussion and shield less prominent events. For example, in the NBA
games, discussions about the key players (e.g., “LeBron James”, “Kobe Bryant”) can
heavily shadow other important participants or events, resulting in detected event list with
repetitive events about the dominant players.
37

In this chapter, we propose a novel participant-based event detection approach, which
dynamically identifies the participants from data streams, and then “zooms-in” the twitter
stream to participant level to detect the important events related to each participant using
a novel time-content mixture model. Results show that the mixture model-based event
detection approach can efficiently incorporate the “burstiness” and “cohesiveness” of the
participant streams, and the participant-based event detection can effectively capture the
events that have otherwise been shadowed by the long-tail of other dominant events, yield-
ing final result with considerably better coverage than the state-of-the-art approach.
4.2 Participant-based Event Detection
We propose a novel participant-centered event detection approach that consists of two key
components: (1) “Participant Detection” dynamically identifies the event participants and
divides the entire stream into a number of participant streams (Section 4.2.1); (2) “Event
Detection” introduces a novel time-content mixture model approach (Section 4.2.2) to
identify the important events associated with each participant; these “participant-level
events” are then merged along the timeline to form a set of “global events”1, which capture
all the important moments in the given stream.
4.2.1 Participant Detection
We define event participants as the entities that play a significant role in the event. “Par-
ticipant” is a general concept to denote the event participating persons, organizations,
1We use “participant events” and “global events” respectively to represent the importantmoments happened on the participant-level and on the entire event-level. A “global event” mayconsist of one or more “participant events”. For example., the “steal” action in the basketball gametypically involves both the defensive and offensive players, and can be generated by merging thetwo participant-level events.
38

product lines, etc., each of which can be captured by a set of correlated proper nouns.
For example, the NBA player “LeBron Raymone James” can be represented by {LeBron
James, LeBron, LBJ, King James, L. James}, where each proper noun represents a unique
mention of the participant. In this work, we automatically identify the proper nouns from
tweet streams, filter out the infrequent ones using a threshold ψ, and cluster them into
individual event participants. This process allows us to dynamically identify the key par-
ticipating entities and provide a full-coverage for these participants in the detected events.
We formulate the participant detection in a hierarchical agglomerative clustering frame-
work. The CMU TweetNLP tool [GSO+11] was used for proper noun tagging. The proper
nouns (a.k.a., mentions) are grouped into clusters in a bottom-up fashion. Two mentions
are considered similar if they share (1) lexical resemblance, and (2) contextual similarity.
For example, in the following two tweets “Gotta respect Anthony Davis, still rocking the
unibrow”, “Anthony gotta do something about that unibrow”, the two mentions Anthony
Davis and Anthony are referring to the same participant and they share both character
overlap (“anthony”) and context words (“unibrow”, “gotta”). We use sim(ci, cj) to rep-
resent the similarity between two mentions ci and cj , defined as:
sim(ci, cj) = lex sim(ci, cj)× cont sim(ci, cj)
where the lexical similarity (lex sim(·)) is defined as a binary function representing
whether a mention ci is an abbreviation, acronym, or part of another mention cj , or if
the character edit distance between the two mentions is less than a threshold θ2:
lex sim(ci, cj)=
1 ci(cj) is part of cj(ci)
1 EditDist(ci, cj) < θ
0 Otherwise
2θ was empirically set as 0.2×min{|ci|, |cj |}
39

We define the context similarity (cont sim(·)) of two mentions as the cosine similarity
between their context vectors vi and vj . Note that on the tweet stream, two temporally
distant tweets can be very different even though they are lexically similar, e.g., two slam
dunk shots performed by the same player at different time points are different. We there-
fore restrain the context to a segment of the tweet stream |Sk| and then take the weighted
average of the segment-based similarity as the final context similarity. To build the con-
text vector, we use term frequency (TF) as the term weight and remove all the stop-words.
We use |D| to represent the total tweets in the event stream.
cont sim|Sk|(ci, cj) = cos(vi, vj)
cont sim(ci, cj) =∑k
|Sk||D|× cont sim|Sk|(ci, cj)
Similarity between two clusters of mentions are defined as the maximum possible simi-
larity between a pair of mentions, each from one cluster:
sim(Ci, Cj) = maxci∈Ci,cj∈Cj
sim(ci, cj)
We perform bottom-up agglomerative clustering on the mentions until a stopping thresh-
old δ has been reached for sim(Ci, Cj). The clustering approach naturally groups the
frequent proper nouns into participants. The participant streams are then formed by
gathering the tweets that contain one or more mentions in the participant cluster.
4.2.2 Mixture Model-based Event Detection
An event corresponds to a topic that emerges from the data stream, being intensively dis-
cussed during a time period, and then gradually fades away. The tweets corresponding to
an event thus demand not only “temporal burstiness” but also a certain degree of “lexical
cohesiveness”. To incorporate both the time and content aspects of the events, we propose
a mixture model approach for event detection. Figure 4.2 shows the plate notation.
40
t w
W
zπ|D|
μ σ θ θ'K B
Figure 4.2: Plate notation of the mixture model.
In the proposed model, each tweet d in the data stream D is generated from a topic
z, weighted by πz. Each topic is characterized by both its content and time aspects. The
content aspect is captured by a multinomial distribution over the words, parameterized
by θ; while the time aspect is characterized by a Gaussian distribution, parameterized by
µ and σ, with µ represents the average time point that the event emerges and σ deter-
mines the duration of the event. These distributions bear similarities with the previous
work [Hof99, All02, HV09]. In addition, there are often background or “noise” top-
ics that are being constantly discussed over the entire event evolvement process and do
not present the desired “burstiness” property. We use a uniform distribution U(tb, te) to
model the time aspect of these “background” topics, with tb and te being the event begin-
ning and end time points. The content aspect of a background topic is modeled by similar
multinomial distribution, parameterized by θ′. We use the maximum likelihood parameter
estimation. The data likelihood can be represented as:
L(D) =∏d∈D
∑z
{πzpz(td)∏w∈d
pz(w)}
where pz(td) models the timestamp of tweet d under the topic z; pz(w) corresponds to the
word distribution in topic z. They are defined as:
pz(td) =
N(td;µz, σz) if z is an event topic
U(tb, te) if z is background topic
41
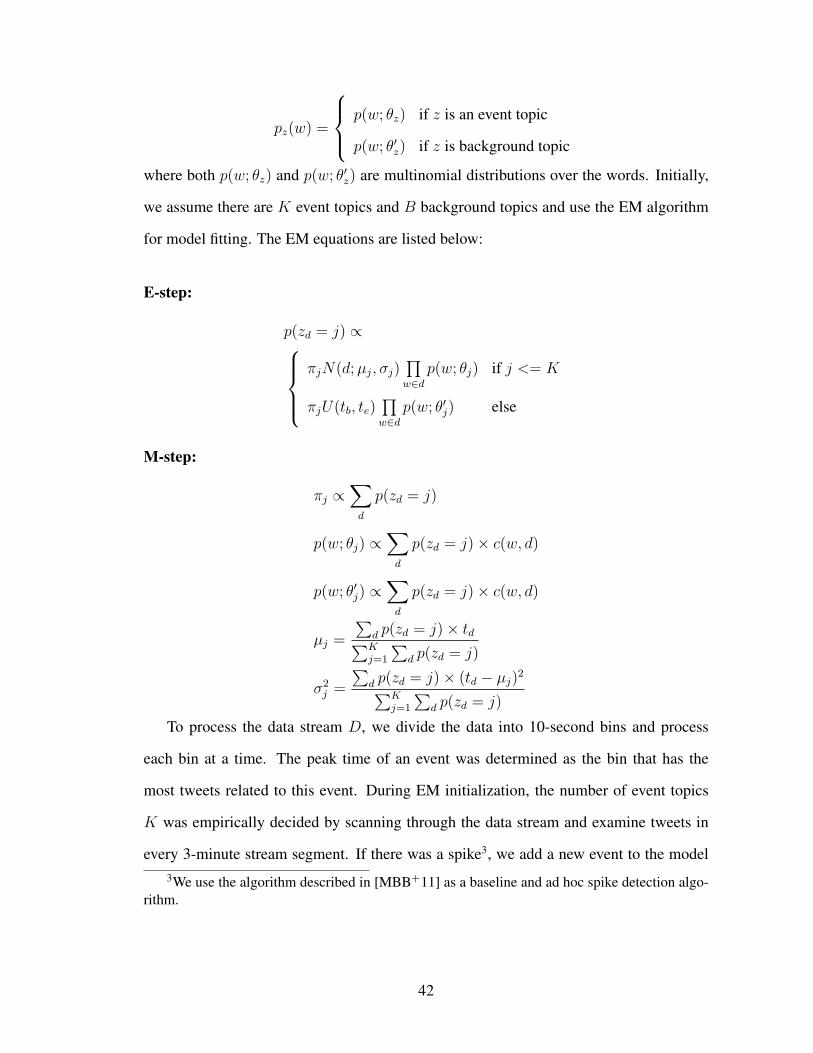
pz(w) =
p(w; θz) if z is an event topic
p(w; θ′z) if z is background topic
where both p(w; θz) and p(w; θ′z) are multinomial distributions over the words. Initially,
we assume there are K event topics and B background topics and use the EM algorithm
for model fitting. The EM equations are listed below:
E-step:
p(zd = j) ∝πjN(d;µj, σj)
∏w∈d
p(w; θj) if j <= K
πjU(tb, te)∏w∈d
p(w; θ′j) else
M-step:
πj ∝∑d
p(zd = j)
p(w; θj) ∝∑d
p(zd = j)× c(w, d)
p(w; θ′j) ∝∑d
p(zd = j)× c(w, d)
µj =
∑d p(zd = j)× td∑Kj=1
∑d p(zd = j)
σ2j =
∑d p(zd = j)× (td − µj)
2∑Kj=1
∑d p(zd = j)
To process the data stream D, we divide the data into 10-second bins and process
each bin at a time. The peak time of an event was determined as the bin that has the
most tweets related to this event. During EM initialization, the number of event topics
K was empirically decided by scanning through the data stream and examine tweets in
every 3-minute stream segment. If there was a spike3, we add a new event to the model3We use the algorithm described in [MBB+11] as a baseline and ad hoc spike detection algo-
rithm.
42
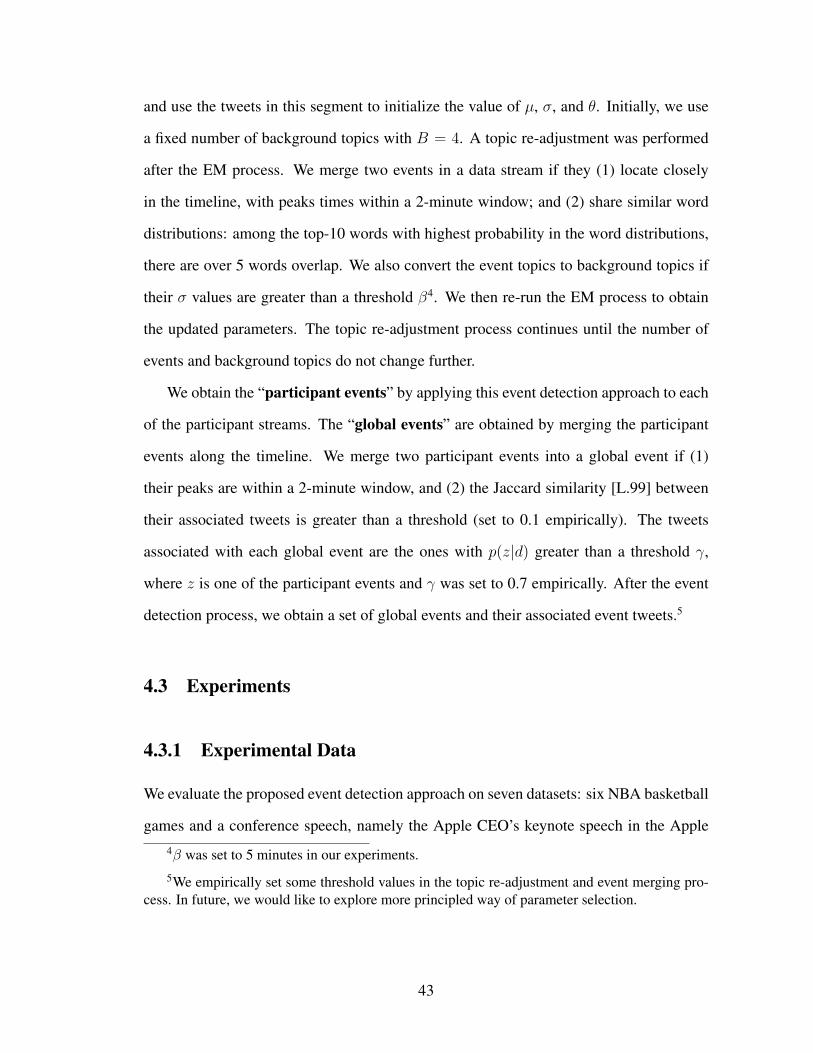
and use the tweets in this segment to initialize the value of µ, σ, and θ. Initially, we use
a fixed number of background topics with B = 4. A topic re-adjustment was performed
after the EM process. We merge two events in a data stream if they (1) locate closely
in the timeline, with peaks times within a 2-minute window; and (2) share similar word
distributions: among the top-10 words with highest probability in the word distributions,
there are over 5 words overlap. We also convert the event topics to background topics if
their σ values are greater than a threshold β4. We then re-run the EM process to obtain
the updated parameters. The topic re-adjustment process continues until the number of
events and background topics do not change further.
We obtain the “participant events” by applying this event detection approach to each
of the participant streams. The “global events” are obtained by merging the participant
events along the timeline. We merge two participant events into a global event if (1)
their peaks are within a 2-minute window, and (2) the Jaccard similarity [L.99] between
their associated tweets is greater than a threshold (set to 0.1 empirically). The tweets
associated with each global event are the ones with p(z|d) greater than a threshold γ,
where z is one of the participant events and γ was set to 0.7 empirically. After the event
detection process, we obtain a set of global events and their associated event tweets.5
4.3 Experiments
4.3.1 Experimental Data
We evaluate the proposed event detection approach on seven datasets: six NBA basketball
games and a conference speech, namely the Apple CEO’s keynote speech in the Apple4β was set to 5 minutes in our experiments.
5We empirically set some threshold values in the topic re-adjustment and event merging pro-cess. In future, we would like to explore more principled way of parameter selection.
43

Event Date Duration #TweetsLakers vs Okc 05/19/2012 3h10m 218,313
N Celtics vs 76ers 05/23/2012 3h30m 245,734B Celtics vs Heat 05/30/2012 3h30m 345,335A Spurs vs Okc 05/31/2012 3h 254,670
Heat vs Okc (1) 06/12/2012 3h30m 331,498Heat vs Okc (2) 06/21/2012 3h30m 332,223
Apple’s WWDC’12 Conf. 06/11/2012 3h30m 163,775
Table 4.1: Statistics of the data set, including six NBA basketball games and the WWDC2012 conference event.
Worldwide Developers Conference (WWDC 2012)6. Althought each of the datasets itself
can be seen corresponding to an event (referred to as an event topic in the following), our
goal is to detect finer-grained events, which are easier to evaluate.
We use the heterogeneous event topics to verify that the proposed approach can ro-
bustly and efficiently detect events on different types of Twitter streams. The tweet
streams corresponding to these topics are collected using the Twitter Streaming API7
with pre-defined keyword set. For NBA games, we use the team names, first name and
last name of the players and head coaches as keywords for retrieving the tweets related
to the event topic; for the WWDC conference, the keyword set contains about 20 terms
related to Apple, such as “wwdc”, “apple”, “mac”, etc. We crawl the tweets in real-
time when these scheduled events are taking place; nevertheless, certain non-event tweets
could be mis-included due to the broad coverage of the used keywords. During prepro-
cessing, we filter out the tweets containing URLs, non-English tweets, and retweets since
they are less likely containing new information regarding the event progress. Table 4.1
shows statistics of the event tweets after the filtering process. In total, there are over 1.8
million tweets used in the event detection experiments.
6https://developer.apple.com/wwdc/7https://dev.twitter.com/docs/streaming-apis
44
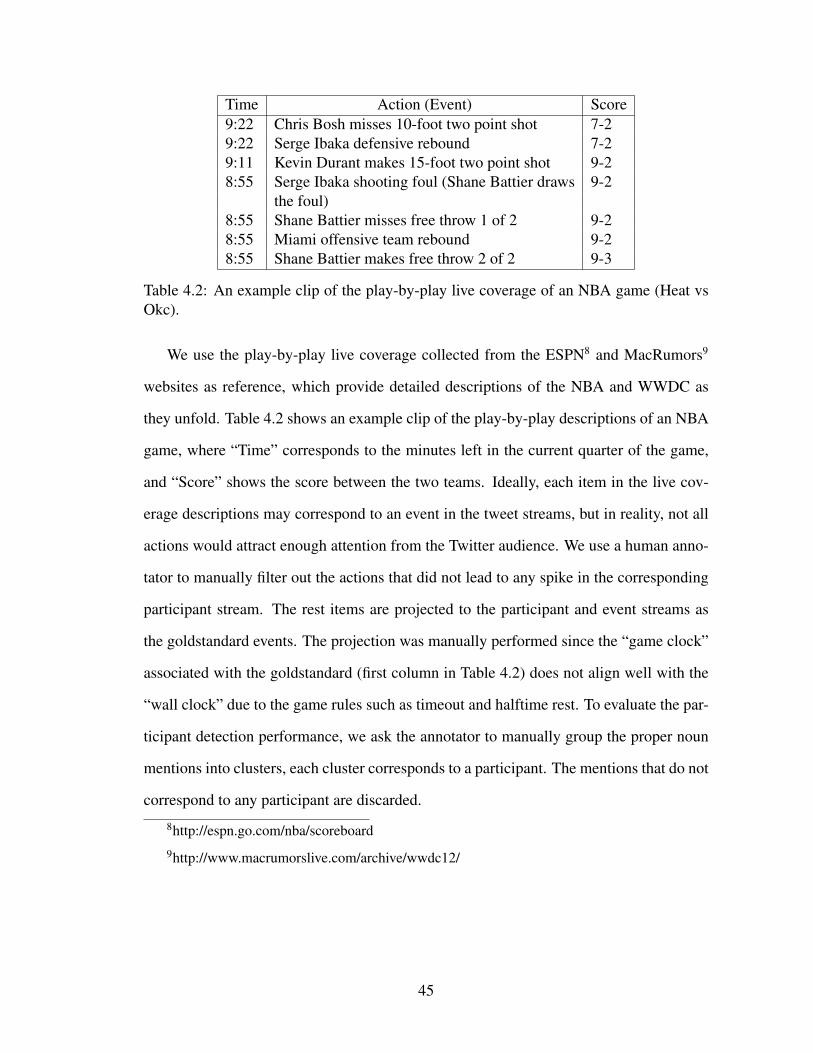
Time Action (Event) Score9:22 Chris Bosh misses 10-foot two point shot 7-29:22 Serge Ibaka defensive rebound 7-29:11 Kevin Durant makes 15-foot two point shot 9-28:55 Serge Ibaka shooting foul (Shane Battier draws 9-2
the foul)8:55 Shane Battier misses free throw 1 of 2 9-28:55 Miami offensive team rebound 9-28:55 Shane Battier makes free throw 2 of 2 9-3
Table 4.2: An example clip of the play-by-play live coverage of an NBA game (Heat vsOkc).
We use the play-by-play live coverage collected from the ESPN8 and MacRumors9
websites as reference, which provide detailed descriptions of the NBA and WWDC as
they unfold. Table 4.2 shows an example clip of the play-by-play descriptions of an NBA
game, where “Time” corresponds to the minutes left in the current quarter of the game,
and “Score” shows the score between the two teams. Ideally, each item in the live cov-
erage descriptions may correspond to an event in the tweet streams, but in reality, not all
actions would attract enough attention from the Twitter audience. We use a human anno-
tator to manually filter out the actions that did not lead to any spike in the corresponding
participant stream. The rest items are projected to the participant and event streams as
the goldstandard events. The projection was manually performed since the “game clock”
associated with the goldstandard (first column in Table 4.2) does not align well with the
“wall clock” due to the game rules such as timeout and halftime rest. To evaluate the par-
ticipant detection performance, we ask the annotator to manually group the proper noun
mentions into clusters, each cluster corresponds to a participant. The mentions that do not
correspond to any participant are discarded.
8http://espn.go.com/nba/scoreboard
9http://www.macrumorslive.com/archive/wwdc12/
45

Example Participants - NBA gamewestbrook, russell westbrookstephen jackson, steven jackson, jacksonjames, james harden, hardenibaka, serge ibakaoklahoma city thunder, oklahomagregg popovich, greg popovich, popovichkevin durant, kd, durantthunder, okc, #okc, okc thunder, #thunderExample Participants - WWDC Conferencemacbooks, mbp, macbook pro, macbook air,...google maps, google, apple mapswwdc, apple wwdc, #wwdcos, mountain, os x mountain, os xiphone 4s, iphone 3gs, iphone
Table 4.3: Example participants automatically detected from the NBA game Spurs vs Okc(2012-5-31) and the WWDC’12 conference.
4.3.2 Participant Detection Results
In Table 4.3, we show example participants that were automatically detected by the pro-
posed hierarchical agglomerative clustering approach. We note that the clusters include
various mentions of the same event participant, e.g., “gregg popovich”, “greg popovich”,
and “popovich” are both referring to the head coach of the team Spurs; “macbooks”,
“macbook pro”, “mbp” are referring to a line of products from Apple. Quantitatively, we
evaluate the participant detection results on both participant- and mention-level. Assume
the system-detected and the goldstandard participant clusters are Ts and Tg respectively.
We define a correct participant as a system detected participant with more than half
of its associated mentions are included in a goldstandard participant (referred to as the
hit participant). As a result, we can define the participant-level precision and recall as
46
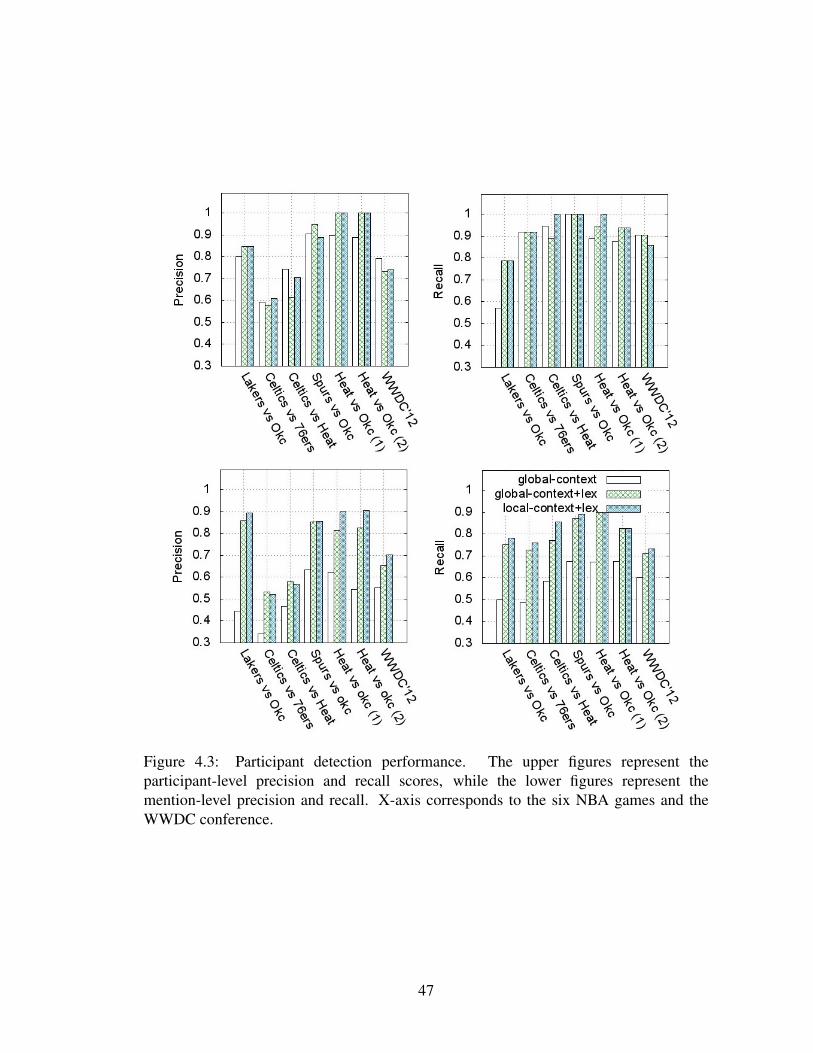
Figure 4.3: Participant detection performance. The upper figures represent theparticipant-level precision and recall scores, while the lower figures represent themention-level precision and recall. X-axis corresponds to the six NBA games and theWWDC conference.
47
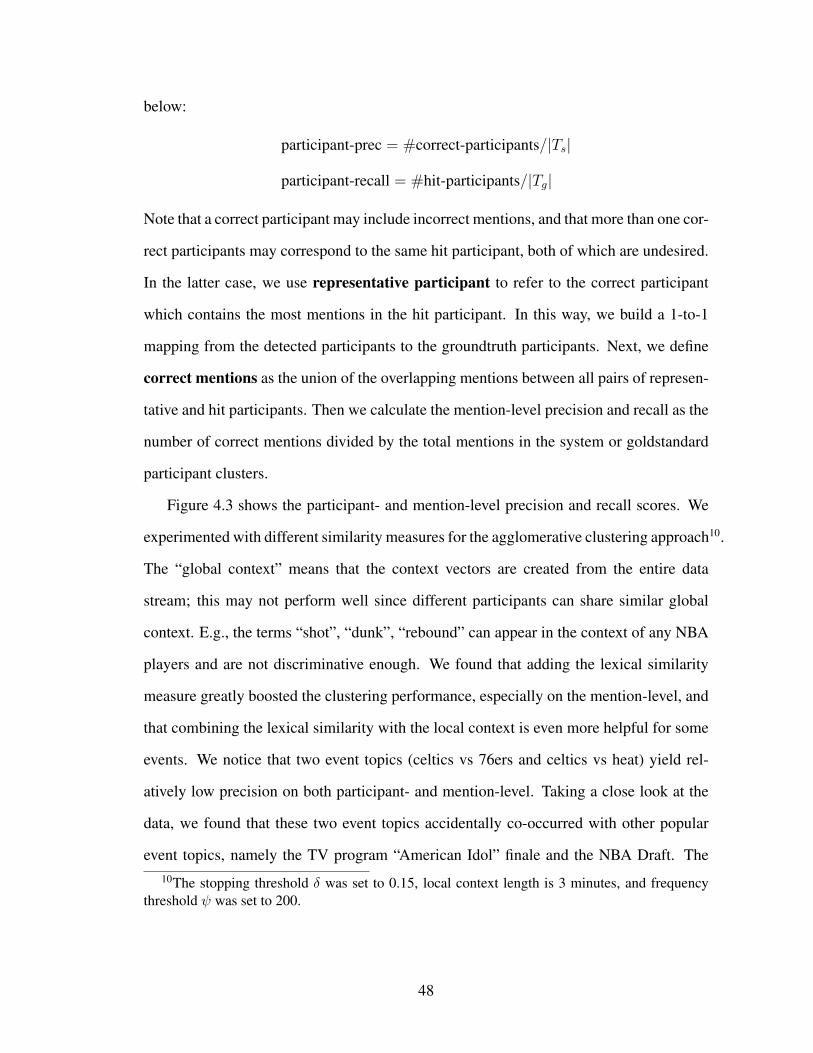
below:
participant-prec = #correct-participants/|Ts|
participant-recall = #hit-participants/|Tg|
Note that a correct participant may include incorrect mentions, and that more than one cor-
rect participants may correspond to the same hit participant, both of which are undesired.
In the latter case, we use representative participant to refer to the correct participant
which contains the most mentions in the hit participant. In this way, we build a 1-to-1
mapping from the detected participants to the groundtruth participants. Next, we define
correct mentions as the union of the overlapping mentions between all pairs of represen-
tative and hit participants. Then we calculate the mention-level precision and recall as the
number of correct mentions divided by the total mentions in the system or goldstandard
participant clusters.
Figure 4.3 shows the participant- and mention-level precision and recall scores. We
experimented with different similarity measures for the agglomerative clustering approach10.
The “global context” means that the context vectors are created from the entire data
stream; this may not perform well since different participants can share similar global
context. E.g., the terms “shot”, “dunk”, “rebound” can appear in the context of any NBA
players and are not discriminative enough. We found that adding the lexical similarity
measure greatly boosted the clustering performance, especially on the mention-level, and
that combining the lexical similarity with the local context is even more helpful for some
events. We notice that two event topics (celtics vs 76ers and celtics vs heat) yield rel-
atively low precision on both participant- and mention-level. Taking a close look at the
data, we found that these two event topics accidentally co-occurred with other popular
event topics, namely the TV program “American Idol” finale and the NBA Draft. The10The stopping threshold δ was set to 0.15, local context length is 3 minutes, and frequency
threshold ψ was set to 200.
48
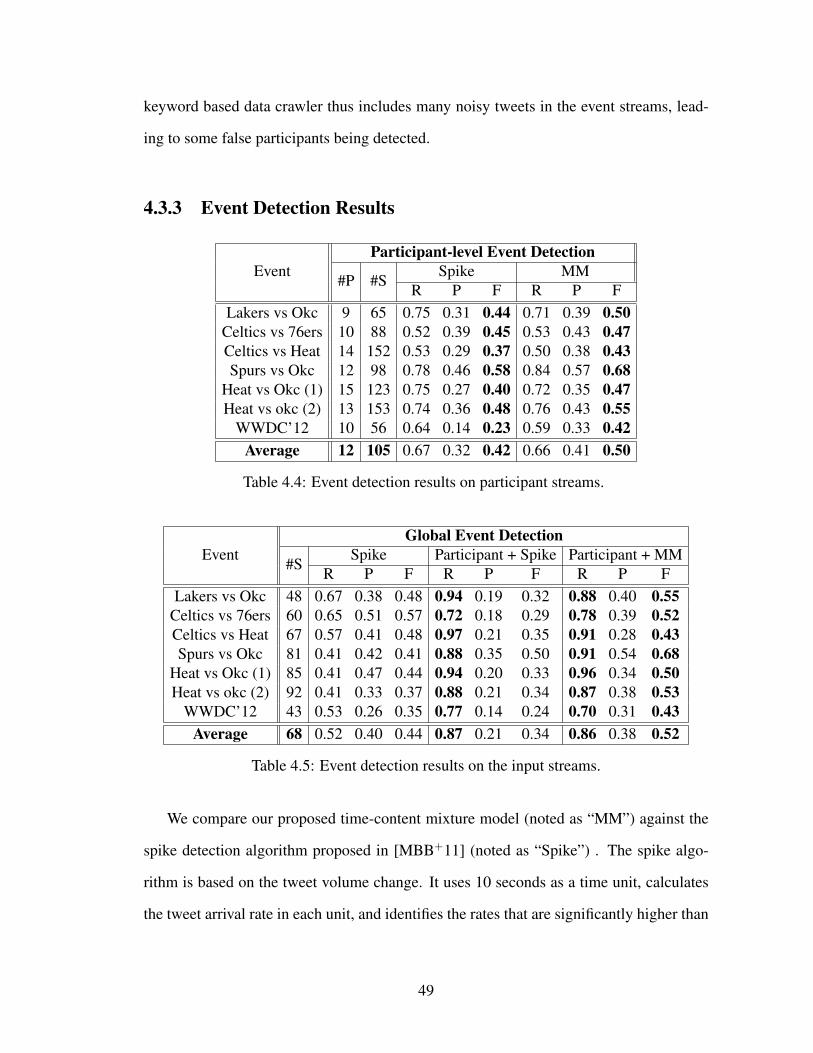
keyword based data crawler thus includes many noisy tweets in the event streams, lead-
ing to some false participants being detected.
4.3.3 Event Detection Results
Participant-level Event DetectionEvent
#P #SSpike MM
R P F R P FLakers vs Okc 9 65 0.75 0.31 0.44 0.71 0.39 0.50
Celtics vs 76ers 10 88 0.52 0.39 0.45 0.53 0.43 0.47Celtics vs Heat 14 152 0.53 0.29 0.37 0.50 0.38 0.43Spurs vs Okc 12 98 0.78 0.46 0.58 0.84 0.57 0.68
Heat vs Okc (1) 15 123 0.75 0.27 0.40 0.72 0.35 0.47Heat vs okc (2) 13 153 0.74 0.36 0.48 0.76 0.43 0.55
WWDC’12 10 56 0.64 0.14 0.23 0.59 0.33 0.42Average 12 105 0.67 0.32 0.42 0.66 0.41 0.50
Table 4.4: Event detection results on participant streams.
Global Event DetectionEvent
#SSpike Participant + Spike Participant + MM
R P F R P F R P FLakers vs Okc 48 0.67 0.38 0.48 0.94 0.19 0.32 0.88 0.40 0.55
Celtics vs 76ers 60 0.65 0.51 0.57 0.72 0.18 0.29 0.78 0.39 0.52Celtics vs Heat 67 0.57 0.41 0.48 0.97 0.21 0.35 0.91 0.28 0.43Spurs vs Okc 81 0.41 0.42 0.41 0.88 0.35 0.50 0.91 0.54 0.68
Heat vs Okc (1) 85 0.41 0.47 0.44 0.94 0.20 0.33 0.96 0.34 0.50Heat vs okc (2) 92 0.41 0.33 0.37 0.88 0.21 0.34 0.87 0.38 0.53
WWDC’12 43 0.53 0.26 0.35 0.77 0.14 0.24 0.70 0.31 0.43Average 68 0.52 0.40 0.44 0.87 0.21 0.34 0.86 0.38 0.52
Table 4.5: Event detection results on the input streams.
We compare our proposed time-content mixture model (noted as “MM”) against the
spike detection algorithm proposed in [MBB+11] (noted as “Spike”) . The spike algo-
rithm is based on the tweet volume change. It uses 10 seconds as a time unit, calculates
the tweet arrival rate in each unit, and identifies the rates that are significantly higher than
49
the mean tweet rate. For these rate spikes, the algorithm finds the local maximum of tweet
rate and identify a window surrounding the local maximum. We tune the parameter of the
“Spike” approach (set τ = 4) so that it yields similar recall values as the mixture model
approach. We then apply the “MM” and “Spike” approaches to both the participant and
event streams and evaluate the event detection performance. Results are shown in Ta-
ble 4.4. A system detected event is considered to match the goldstandard event if its peak
time is within a 2-minute window of the goldstandard.
We first apply the “Spike” and “MM” approach to the participant streams. The par-
ticipant streams on which we cannot detect any meaningful events have been excluded,
the resulting number of participants are listed in Table 4.4 and denoted as “#P”, and “#S”
is the summation number of events from all participant streams of each input dataset. In
general, we found the “MM” approach can perform better since it inherently incorporates
both the “burstiness” and “lexical cohesiveness” of the event tweets, while the “Spike”
approach relies solely on the “burstiness” property. Note that although we divide the en-
tire event stream into participant streams, some key participants still own huge amount
of discussion and the spike patterns are not always clearly identifiable. The time-content
mixture model gains advantages in these cases.
We apply three settings to detect global events on the data streams in Table 4.5.
“Spike” directly applies the spike algorithm on the entire event stream; the “Participant
+ Spike” and “Participant + MM” approaches first perform event detection on the partic-
ipant streams and then merge the detected events along the timeline to generate global
events. Note that there are fewer goldstandard events (“#S”) on the global streams since
each global event may correspond to one or multiple participant-level events. Because of
the averaging effect, spike patterns on the entire event stream is less obvious than those
on the participant streams. As a result, few spikes have been detected on the event stream
using the “Spike” algorithm, which leads to low recall as compared to other participant-
50

based approaches. It also indicates that, by dividing the entire event stream into partici-
pant streams, we have a better chance of identifying the events that have otherwise been
shadowed by the dominant events or participants. The two participant-based methods
yield similar recall but “Participant + Spike” yields slightly worse precision, since it is
very sensitive to the spikes on the participant-level, leading to the rise of false alarms.
The “Participant + MM” approach is much better in precision, which is consistent to our
findings on the participant streams.
4.4 Summary
Event detection is critical for text analysis of social media streams to capture the event-
related information. Existing methods reply on the volume change of the whole stream to
detect bursts or spikes. In this chapter, we propose a method which first divides the whole
stream into several participants streams, and then combines the information of volume
changes of the stream and topic changes. Experiments demonstrate that the proposed
method leads to more robust detection results.
51
CHAPTER 5
MULTI-DOCUMENT SUMMARIZATION
5.1 Multi-document Summarization using Dominating Set
5.1.1 Introduction
Multi-document summarization is a useful tool to address the information overload prob-
lem, which can be classified into extractive and abstractive summarization[Man01]. Ex-
tractive summarization methods select important sentences from the original documents,
while abstractive summarization methods attempt to rephrase the information in the text.
For different information needs, different summaries should be generated as different
views of the data set. In this dissertation, we focus on four types of summarization.
In this dissertation, we propose a new principled and versatile framework for multi-
document summarization using the minimum dominating set. Many known summariza-
tion tasks including generic, query-focused, update, and comparative summarization can
be modeled as different variations derived from the proposed framework. The framework
provides an elegant basis to establish the connections between various summarization
tasks while highlighting their differences.
In our framework, a sentence graph is first generated from the input documents where
vertices represent sentences and edges indicate that the corresponding vertices are similar.
A natural method for describing the extracted summary is based on the idea of graph dom-
ination [WL01]. A dominating set of a graph is a subset of vertices such that every vertex
in the graph is either in the subset or adjacent to a vertex in the subset; and a minimum
dominating set is a dominating set with the minimum size. The minimum dominating set
of the sentence graph can be naturally used to describe the summary: it is representative
since each sentence is either in the minimum dominating set or connected to one sentence
52

in the set; and it is with minimal redundancy since the set is of minimum size. Approxi-
mation algorithms are proposed for performing summarization and empirical experiments
are conducted to demonstrate the effectiveness of our proposed framework. Though the
dominating set problem has been widely used in wireless networks, this paper is the first
work on using it for modeling sentence extraction in document summarization.
5.1.2 Related Work
Query-Focused Summarization In query-focused summarization, the information of
the given topic or query should be incorporated into summarizers, and sentences suit-
ing the user’s declared information need should be extracted. Many methods for generic
summarization can be extended to incorporate the query information [SBC03, WLLH08].
[WYX07a] made full use of both the relationships among all the sentences in the docu-
ments and relationship between the given query and the sentences by manifold ranking.
Probability models have also been proposed with different assumptions on the generation
process of the documents and the queries [DIM06, HV09, TYC09].
Update Summarization and Comparative Summarization Update summarization
was introduced in Document Understanding Conference (DUC) 2007 [Dan07] and was a
main task of the summarization track in Text Analysis Conference (TAC) 2008 [DO08].
It is required to summarize a set of documents under the assumption that the reader has
already read and summarized the first set of documents as the main summary. To produce
the update summary, some strategies are required to avoid redundant information which
has already been covered by the main summary. One of the most frequently used methods
for removing redundancy is Maximal Marginal Relevance(MMR) [GMCK00]. Compara-
tive document summarization was proposed in [WZLG09a] to summarize the differences
between comparable document groups. A sentence selection approach was proposed in
53

[WZLG09a] to accurately discriminate the documents in different groups modeled by the
conditional entropy.
Dominating Set Many approximation algorithms have been developed for finding min-
imum dominating set for a given graph [GK98, TZTX07]. Kann [Kan92] show that the
minimum dominating set problem is equivalent to set cover problem, which is a well-
known NP-hard problem. Dominating set has been widely used for clustering in wireless
networks [CL02, HJ07]. It has been used to find topic words for hierarchical summariza-
tion [LCR01], where a set of topic words is extracted as a dominating set of word graph.
In our work, we use the minimum dominating set to formalize the sentence extraction for
document summarization.
5.1.3 The Summarization Framework
Sentence Graph Generation
To perform multi-document summarization via minimum dominating set, we need to first
construct a sentence graph in which each node is a sentence in the document collection.
In our work, we represent the sentences as vectors based on tf-isf, and then obtain the
cosine similarity for each pair of sentences. If the similarity between a pair of sentences
si and sj is above a given threshold λ, then there is an edge between si and sj .
For generic summarization, we use all sentences for building the sentence graph. For
query-focused summarization, we only use the sentences containing at least one term in
the query. In addition, when a query q is involved, we assign each node si a weight,
w(si) = d(si, q) = 1 − cos(si, q), to indicate the distance between the sentence and the
query q.
54

After building the sentence graph, we can formulate the summarization problem using
the minimum dominating set. A graphical illustration of the proposed framework is shown
in Figure 5.1.
The Minimum Dominating Set Problem
Given a graph G =< V,E >, a dominating set of G is a subset S of vertices with the
following property: each vertex of G is either in the dominating set S, or is adjacent to
some vertices in S.
Problem 5.1.1 Given a graph G, the minimum dominating set problem (MDS) is to find
a minimum size subset S of vertices, such that S forms a dominating set.
MDS is closely related to the set cover problem (SC), a well-known NP-hard problem.
Problem 5.1.2 Given F , a finite collection {S1, S2, . . . , Sn} of finite sets, the set cover
problem (SC) is to find the optimal solution
F ∗ = arg minF ′⊆F
|F ′| s.t.∪
S′∈F ′
S ′ =∪S∈F
S.
Theorem 5.1.3 There exists a pair of polynomial time reduction between MDS and SC.
Proof. Here we sketch the proof. To reduce from the minimum dominating set problem to
SC, For each input of the minimum dominating set problem, a graph G =< V,E > with
V = {1, . . . , n}, we can construct a finite collection of finite sets F = {S1, S2, . . . , Sn}
by defining Si = {i} ∪ {j ∈ [1..n] : (i, j) ∈ E}. A vertex i ∈ V can be covered
either by including Si, corresponding to including the node i in the dominating set, or by
including one of the sets Sj such that (i, j) ∈ E, corresponding to including node j in the
dominating set. Thus the minimum dominating set D∗ ⊆ V gives us the minimum set
cover F ∗ of the same size and every set cover of F gives us a dominating set of G. So
55
we have obtained a polynomial L-reduction from the minimum dominating set problem
to SC. Similarly, we can show that there is a polynomial time L-reduction from SC to the
minimum dominating set problems. More details can been found in [Kan92].
So, MDS is also NP-hard and it has been shown that there are no approximate solu-
tions within c log |V |, for some c > 0 [Fei98, RS97].
An Approximation Algorithm A greedy approximation algorithm for the SC problem
is described in [Joh73]. Basically, at each stage, the greedy algorithm chooses the set
which contains the largest number of uncovered elements.
Based on Theorem 5.1.3, we can obtain a greedy approximation algorithm for MDS.
Starting from an empty set, if the current subset of vertices is not the dominating set, a
new vertex which has the most number of the adjacent vertices that are not adjacent to
any vertex in the current set will be added.
Proposition 5.1.4 The greedy algorithm approximates SC within 1 + ln s where s is the
size of the largest set.
It was shown in [Joh73] that the approximation factor for the greedy algorithm is no
more than H(s) , the s-th harmonic number:
H(s) =s∑
k=1
1
k≤ ln s+ 1
Corollary 5.1.5 MDS has a approximation algorithm within 1 + ln∆ where ∆ is the
maximum degree of the graph.
Corollary 5.1.5 follows directly from Theorem 5.1.3 and Proposition 5.1.4.
56
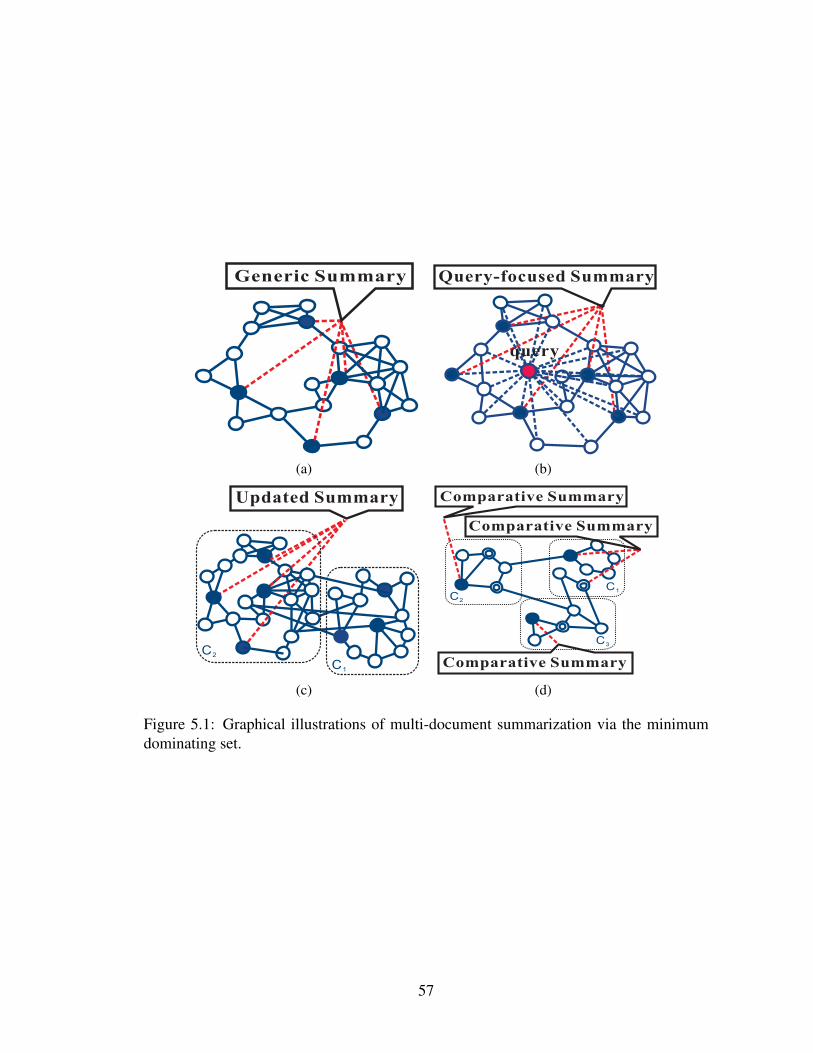
Generic Summary
(a)
Query-focused Summary
query
(b)
Updated Summary
C1
C2
(c)
Comparative Summary
Comparative Summary
Comparative Summary
C2
C1
C3
(d)
Figure 5.1: Graphical illustrations of multi-document summarization via the minimumdominating set.
57

Generic Summarization
Generic summarization is to extract the most representative sentences to capture the im-
portant content of the input documents. Without taking into account the length limitation
of the summary, we can assume that the summary should represent all the sentences in
the document set (i.e., every sentence in the document set should either be extracted or be
similar with one extracted sentence). Meanwhile, a summary should also be as short as
possible. Such summary of the input documents under the assumption is exactly the min-
imum dominating set of the sentence graph we constructed from the input documents in
Section 5.1.3. Therefore the summarization problem can be formulated as the minimum
dominating set problem.
Algorithm 2 Algorithm for Generic SummarizationINPUT: G, WOUTPUT: S1: S = ∅2: T = ∅3: while L(S) < W and V (G)! = S do4: for v ∈ V (G)− S do5: s(v) = |{ADJ(v)− T}|6: v∗ = argmaxv s(v)7: S = S ∪ {v∗}8: T = T ∪ADJ(v∗)
However, usually there is a length restriction for generating the summary. Moreover,
the MDS is NP-hard as shown in Section 5.1.3. Therefore, it is straightforward to use a
greedy approximation algorithm to construct a subset of the dominating set as the final
summary. In the greedy approach, at each stage, a sentence which is optimal according to
the local criteria will be extracted. Algorithm 2 describes an approximation algorithm for
generic summarization. In Algorithm 2, G is the sentence graph, L(S) is the length of the
summary, W is the maximal length of the summary, and ADJ(v) = {v′|(v′, v) ∈ E(G)}
58

is the set of vertices which are adjacent to the vertex v. A graphical illustration of generic
summarization using the minimum dominating set is shown in Figure 5.1(a).
Query-Focused Summarization
Letting G be the sentence graph constructed in Section 5.1.3 and q be the query, the
query-focused summarization can be modeled as
D∗ = argminD⊆G
∑s∈D d(s, q) (5.1)
s.t. D is a dominating set of G.
Note that d(s, q) can be viewed as the weight of vertex in G. Here the summary length is
minimized implicitly, since if D′ ⊆ D, then∑
s∈D′ d(s, q) ≤∑
s∈D d(s, q). The problem
in Eq.(5.1) is exactly a variant of the minimum dominating set problem, i.e., the minimum
weighted dominating set problem (MWDS).
Similar to MDS, MWDS can be reduced from the weighted version of the SC problem.
In the weighted version of SC, each set has a weight and the sum of weights of selected
sets needs to be minimized. To generate an approximate solution for the weighted SC
problem, instead of choosing a set i maximizing |SET (i)|, a set i minimizing w(i)|SET (i)| is
chosen, where SET (i) is composed of uncovered elements in set i, and w(i) is the weight
of set i. The approximate solution has the same approximation ratio as that for MDS, as
stated by the following theorem [Chv79].
Theorem 5.1.6 An approximate weighted dominating set can be generated with a size at
most 1 + log∆ · |OPT |, where ∆ is the maximal degree of the graph and OPT is the
optimal weighted dominating set.
59
Accordingly, from generic summarization to query-focused summarization, we just need
to modify line 6 in Algorithm 2 to
v∗ = argminv
w(v)
s(v), (5.2)
where w(v) is the weight of vertex v. A graphical illustration of query-focused summa-
rization using the minimum dominating set is shown in Figure 5.1(b).
Update Summarization
Give a query q and two sets of documents C1 and C2, update summarization is to generate
a summary of C2 based on q, given C1. Firstly, summary of C1, referred as D1 can be
generated. Then, to generate the update summary of C2, referred as D2, we assume D1
and D2 should represent all query related sentences in C2, and length of D2 should be
minimized.
Let G1 be the sentence graph for C1. First we use the method described in Sec-
tion 5.1.3 to extract sentences from G1 to form D1. Then we expand G1 to the whole
graph G using the second set of documents C2. G is then the graph presentation of the
document set including C1 and C2. We can model the update summary of C2 as
D∗ = argminD2
∑s∈D2
w(s) (5.3)
s.t. D2 ∪D1 is a dominating set of G.
Intuitively, we extract the smallest set of sentences that are closely related to the query
from C2 to complete the partial dominating set of G generated from D1. A graphical
illustration of update summarization using the minimum dominating set is shown in Fig-
ure 5.1(c), where vertices in the right rectangle represent the first document set C1, and
ones in the left represent the second document set where update summary is generated..
60
Comparative Summarization
Comparative document summarization aims to summarize the differences among com-
parable document groups. The summary produced for each group should emphasize its
difference from other groups [WZLG09a].
We extend our method for update summarization to generate the discriminant sum-
mary for each group of documents. Given N groups of documents C1, C2, . . . , CN , we
first generate the sentence graphs G1, G2, . . . , GN , respectively. To generate the sum-
mary for Ci, 1 ≤ i ≤ N , we view Ci as the update of all other groups. To extract a new
sentence, only the one connected with the largest number of sentences which have no
representatives in any groups will be extracted. We denote the extracted set as the com-
plementary dominating set, since for each group we obtain a subset of vertices dominating
those are not dominated by the dominating sets of other groups. To perform comparative
summarization, we first extract the standard dominating sets forG1, . . . , GN , respectively,
denoted as D1, . . . , DN . Then we extract the so-called complementary dominating set
CDi for Gi by continuing adding vertices in Gi to find the dominating set of ∪1≤j≤NGj
given D1, . . . , Di−1, Di+1, . . . , DN . A graphical illustration of comparative summariza-
tion is shown in Figure 5.1(d), where each rectangle represents a group of documents, and
vertices with rings are the dominating set for each group, while the solid vertices are the
complementary dominating set, which is extracted as comparative summaries.
5.1.4 Experiments
Data Sets
In the experiments, we evaluate the proposed framework on news data from DUC/TAC
which is widely used as benchmarks in the summarization community for the generic,
61
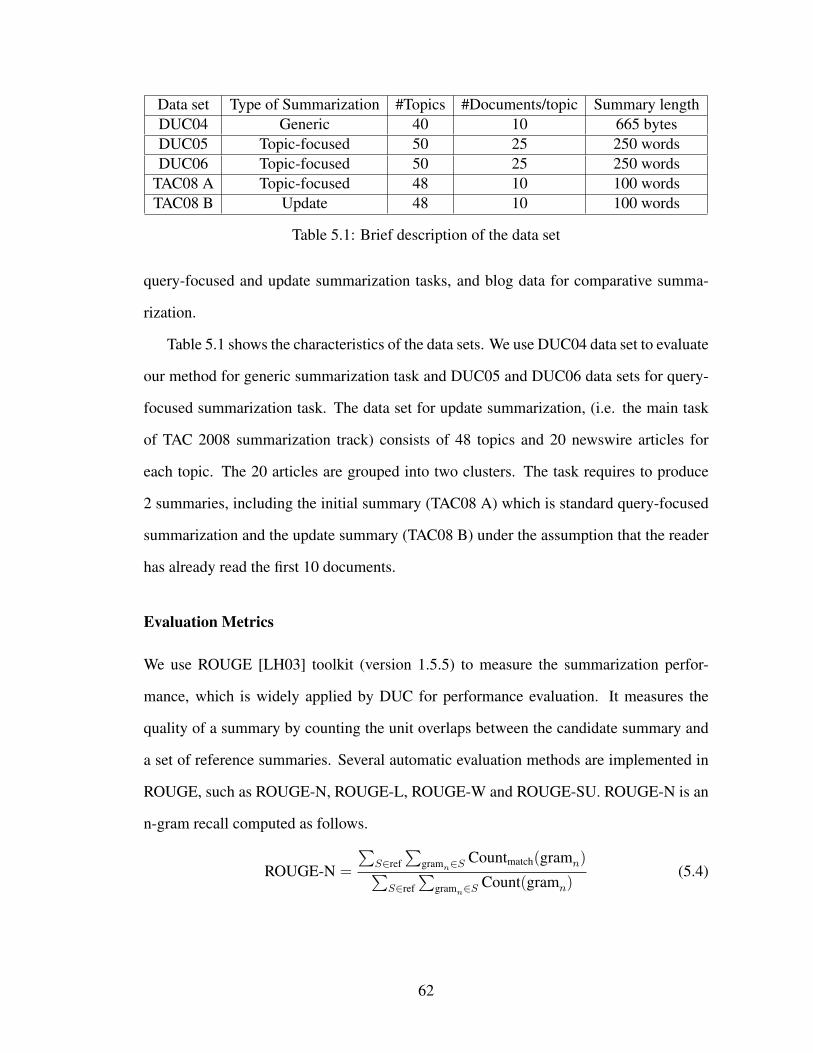
Data set Type of Summarization #Topics #Documents/topic Summary lengthDUC04 Generic 40 10 665 bytesDUC05 Topic-focused 50 25 250 wordsDUC06 Topic-focused 50 25 250 words
TAC08 A Topic-focused 48 10 100 wordsTAC08 B Update 48 10 100 words
Table 5.1: Brief description of the data set
query-focused and update summarization tasks, and blog data for comparative summa-
rization.
Table 5.1 shows the characteristics of the data sets. We use DUC04 data set to evaluate
our method for generic summarization task and DUC05 and DUC06 data sets for query-
focused summarization task. The data set for update summarization, (i.e. the main task
of TAC 2008 summarization track) consists of 48 topics and 20 newswire articles for
each topic. The 20 articles are grouped into two clusters. The task requires to produce
2 summaries, including the initial summary (TAC08 A) which is standard query-focused
summarization and the update summary (TAC08 B) under the assumption that the reader
has already read the first 10 documents.
Evaluation Metrics
We use ROUGE [LH03] toolkit (version 1.5.5) to measure the summarization perfor-
mance, which is widely applied by DUC for performance evaluation. It measures the
quality of a summary by counting the unit overlaps between the candidate summary and
a set of reference summaries. Several automatic evaluation methods are implemented in
ROUGE, such as ROUGE-N, ROUGE-L, ROUGE-W and ROUGE-SU. ROUGE-N is an
n-gram recall computed as follows.
ROUGE-N =
∑S∈ref
∑gramn∈S
Countmatch(gramn)∑S∈ref
∑gramn∈S
Count(gramn)(5.4)
62

DUC04ROUGE-2 ROUGE-SU
DUC Best 0.09216 0.13233Centroid 0.07379 0.12511
LexPageRank 0.08572 0.13097BSTM 0.09010 0.13218MDS 0.08934 0.13137
Table 5.2: Results on generic summarization.
DUC05 DUC06ROUGE-2 ROUGE-SU ROUGE-2 ROUGE-SU
DUC Best 0.0725 0.1316 0.09510 0.15470SNMF 0.06043 0.12298 0.08549 0.13981TMR 0.07147 0.13038 0.09132 0.15037Wiki 0.07074 0.13002 0.08091 0.14022
MWDS 0.07311 0.13061 0.09296 0.14797
Table 5.3: Results on query-focused summarization.
where n is the length of the n-gram, and ref stands for the reference summaries. Countmatch(gramn)
is the maximum number of n-grams co-occurring in a candidate summary and the refer-
ence summaries, and Count(gramn) is the number of n-grams in the reference summaries.
ROUGE-L uses the longest common subsequence (LCS) statistics, while ROUGE-W is
based on weighted LCS and ROUGE-SU is based on skip-bigram plus unigram. Each of
these evaluation methods in ROUGE can generate three scores (recall, precision and F-
measure). As we have similar conclusions in terms of any of the three scores, for simplic-
ity, in this paper, we only report the average F-measure scores generated by ROUGE-1,
ROUGE-2,ROUGE-L,ROUGE-W and ROUGE-SU4 (where skip length is 4) to compare
the implemented systems.
We apply a 5-fold cross-validation procedure to choose the threshold λ used for gen-
erating the sentence graph in our method.
63
Generic Summarization
We implement the following widely used or recent published methods for generic sum-
marization as the baseline systems to compare with our proposed method (denoted as
MDS). (1) Centroid: The method applies MEAD algorithm [RJST04] to extract sentences
according to the following three parameters: centroid value, positional value, and first-
sentence overlap. (2) LexPageRank: The method first constructs a sentence connectivity
graph based on cosine similarity and then selects important sentences based on the con-
cept of eigenvector centrality [ER04]. (3) BSTM: A Bayesian sentence-based topic model
making use of both the term-document and term-sentence associations [WZLG09b].
Our method outperforms the simple Centroid method and another graph-based Lex-
PageRank, and its performance is close to the results of the Bayesian sentence-based topic
model and those of the best team in the DUC competition. Note however that, like clus-
tering or topic based methods, BSTM needs the topic number as the input, which usually
varies by different summarization tasks and is hard to estimate.
Query-Focused Summarization
We compare our method (denoted as MWDS) described in Section 5.1.3 with some re-
cently published systems. (1) TMR [TYC09]: incorporates the query information into
the topic model, and uses topic based score and term frequency to estimate the im-
portance of the sentences. (2) SNMF [WLZD08]: calculates sentence-sentence simi-
larities by sentence-level semantic analysis, clusters the sentences via symmetric non-
negative matrix factorization, and extracts the sentences based on the clustering result.
(3) Wiki [Nas08]: uses Wikipedia as external knowledge to expand query and builds the
connection between the query and the sentences in documents.
Table 5.3 presents the experimental comparison of query-focused summarization on
the two datasets. From Table 5.3, we observe that our method is comparable with these
64
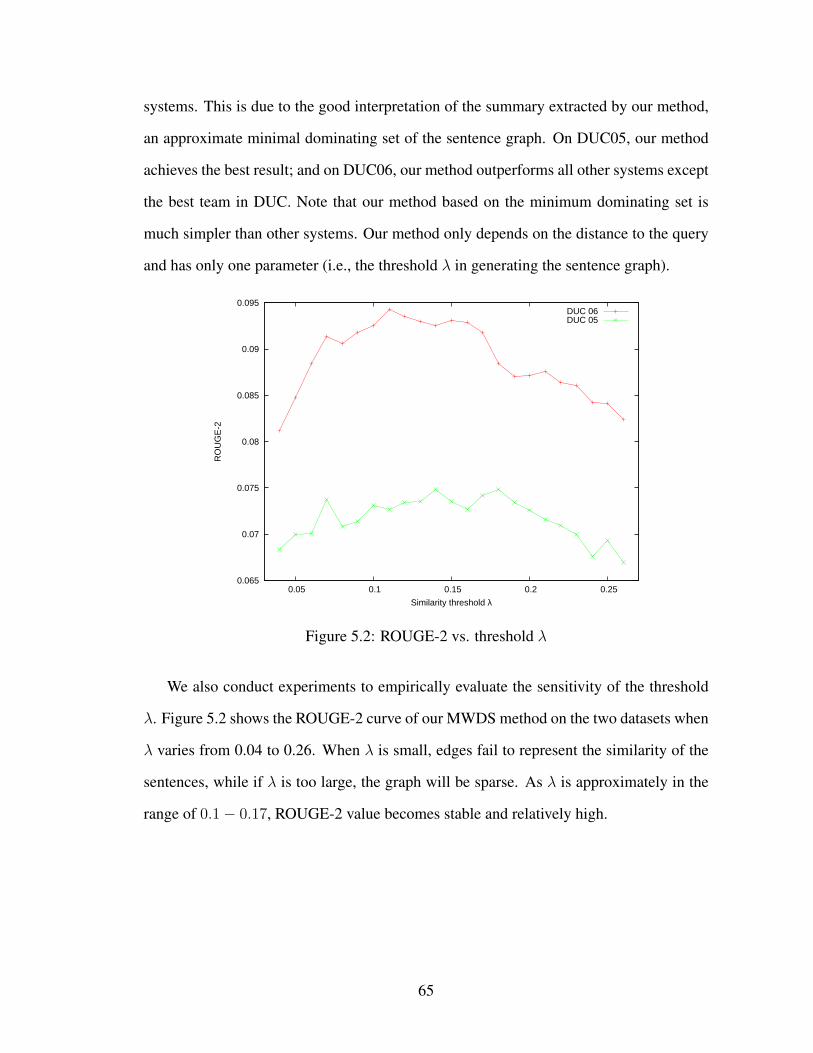
systems. This is due to the good interpretation of the summary extracted by our method,
an approximate minimal dominating set of the sentence graph. On DUC05, our method
achieves the best result; and on DUC06, our method outperforms all other systems except
the best team in DUC. Note that our method based on the minimum dominating set is
much simpler than other systems. Our method only depends on the distance to the query
and has only one parameter (i.e., the threshold λ in generating the sentence graph).
0.065
0.07
0.075
0.08
0.085
0.09
0.095
0.05 0.1 0.15 0.2 0.25
RO
UG
E-2
Similarity threshold λ
DUC 06DUC 05
Figure 5.2: ROUGE-2 vs. threshold λ
We also conduct experiments to empirically evaluate the sensitivity of the threshold
λ. Figure 5.2 shows the ROUGE-2 curve of our MWDS method on the two datasets when
λ varies from 0.04 to 0.26. When λ is small, edges fail to represent the similarity of the
sentences, while if λ is too large, the graph will be sparse. As λ is approximately in the
range of 0.1− 0.17, ROUGE-2 value becomes stable and relatively high.
65

Update Summarization
Table 5.4 presents the experimental results on update summarization. In Table 5.4, ‘TAC
Best” and “TAC Median” represent the best and median results from the participants of
TAC 2008 summarization track in the two tasks respectively according to the TAC 2008
report [DO08]. As seen from the results, the ROUGE scores of our methods are higher
than the median results. The good results of the best team typically come from the fact
that they utilize advanced natural language processing (NLP) techniques to resolve pro-
nouns and other anaphoric expressions. Although we can spend more efforts on the pre-
processing or language processing step, our goal here is to demonstrate the effectiveness
of formalizing the update summarization problem using the minimum dominating set and
hence we do not utilize advanced NLP techniques for preprocessing. The experimental
results demonstrate that our simple update summarization method based on the minimum
dominating set can lead to competitive performance for update summarization.
TAC08 A TAC08 BROUGE-2 ROUGE-SU ROUGE-2 ROUGE-SU
TAC Best 0.1114 0.14298 0.10108 0.13669TAC Median 0.08123 0.11975 0.06927 0.11046
MWDS 0.09012 0.12094 0.08117 0.11728
Table 5.4: Results on update summarization.
Comparative Summarization
We use the top six largest clusters of documents from TDT2 corpora to compare the
summary generated by different comparative summarization methods. The topics of the
six document clusters are as follows: topic 1: Iraq Issues; topic 2: Asia’s economic crisis;
topic 3: Lewinsky scandal; topic 4: Nagano Olympic Games; topic 5: Nuclear Issues in
Indian and Pakistan; and topic 6: Jakarta Riot. From each of the topics, 30 documents
are extracted randomly to produce a one-sentence summary. For comparison purpose, we
66

Topic Complementary Dominat-ing Set
Discriminative Sentence Se-lection
Dominating Set
1 · · · U.S. Secretary ofState Madeleine Albrightarrives to consult on thestand-off between theUnited Nations andIraq.
the U.S. envoy to theUnited Nations, BillRichardson, · · · play downChina’s refusal to supportthreats of military forceagainst Iraq
The United States andBritain do not trust Pres-ident Saddam and wantscdotswarning of seriousconsequences if Iraq vio-lates the accord.
2 Thailand’s currency, thebaht, dropped through akey psychological levelof · · · amid a regionalsell-off sparked by esca-lating social unrest in In-donesia.
Earlier, driven largely bythe declining yen, SouthKorea’s stock market fellby · · · , while the Nikkei225 benchmark indexdipped below 15,000 in themorning · · ·
In the fourth quarter, IBMCorp. earned $2.1 billion,up 3.4 percent from $2 bil-lion a year earlier.
3 · · · attorneys representingPresident Clinton andMonica Lewinsky.
The following night Isikoff· · · , where he directly fol-lowed the recitation of thetop-10 list: “Top 10 WhiteHouse Jobs That SoundDirty.”
In Washington, KenStarr’s grand jury contin-ued its investigation ofthe Monica Lewinskymatter.
4 Eight women and six menwere named Saturdaynight as the first U.S.Olympic SnowboardTeam as their sport getsset to make its debut inNagano, Japan.
this tunnel is finland’scross country version oftokyo’s alpine ski dome,and olympic skiers flockfrom russia, · · · , france andaustria this past summer towork out the kinks · · ·
If the skiers the men’ssuper-G and the women’sdownhill on Saturday,they will be back onschedule.
5 U.S. officials have an-nounced sanctions Wash-ington will impose on In-dia and Pakistan for con-ducting nuclear tests.
The sanctions would stopall foreign aid except forhumanitarian purposes, banmilitary sales to India · · ·
And Pakistan’s primeminister says his coun-try will sign the U.N.’scomprehensive ban onnuclear tests if Indiadoes, too.
6 · · · remain in force aroundJakarta, and at the Par-liament building wherethousands of studentsstaged a sit-in Tuesday· · · .
“President Suharto hasgiven much to his countryover the past 30 years, rais-ing Indonesia’s standing inthe world · · ·
What were the studentsdoing at the time you werethere, and what was thereaction of the students tothe troops?
Table 5.5: A case study on comparative document summarization.
67

extract the sentence with the maximal degree as the baseline. Note that the baseline can
be thought as an approximation of the dominating set using only one sentence. Table 5.5
shows the summaries generated by our method (complementary dominating set (CDS)),
discriminative sentence selection (DSS) [WZLG09a] and the baseline method. Some
unimportant words are skipped due to the space limit. The bold font is used to annotate
the phrases that are highly related with the topics, and italic font is used to highlight the
sentences that are not proper to be used in the summary. Our CDS method can extract
discriminative sentences for all the topics. DSS can extract discriminative sentences for
all the topics except topic 4. Note that the sentence extracted by DSS for topic 4 may
be discriminative from other topics, but it is deviated from the topic Nagano Olympic
Games. In addition, DSS tends to select long sentences which should not be preferred for
summarization purpose. The baseline method may extract some general sentences, such
as the sentence for topic 2 and topic 6 in Table 5.5.
68
5.2 Multi-document Summarization Using Learning-to-Rank
As a fundamental and effective tool for document understanding, organization, and navi-
gation, query-focused multi-document summarization has been very active and enjoying
a growing amount of attention with the ever-increasing growth of the social media docu-
ment data (e.g., blogs, tweets). For query-focused multi-document summarization, a sum-
marizer incorporates user declared queries and generates summaries that not only reflect
the important concepts in the input documents but also bias to the queries. Query-focused
multi-document summarization methods can be broadly classified into two types: extrac-
tive summarization and abstractive summarization. Extractive summarization usually se-
lects phrases or sentences from the input documents while abstractive summarization in-
volves paraphrasing components of input documents and sentence reformulation [KM02].
There are many recent studies on query-focused multi-document summarization and
most proposed techniques are extractive methods. Typical examples include methods
based on knowledge in Wikipedia [Nas08], information distance [LHZL09], non-negative
matrix factorization [WLZD08], graph theory [SL10] and graph ranking [OER05, WYX07a].
Generally speaking, the extracted sentences in the summary should be representative
or salient, capturing the important content related to the queries with minimal redun-
dancy [JM08]. In particular, these extractive summarization methods typically select the
sentences in the input documents to form the summary based on a set of content or linguis-
tic features, such as term frequency-inverse sentence frequency (tf-isf), sentence or term
position, salient or informative keywords, and discourse information. Various features
have been used to characterize the different aspects of the sentences and their relevance
to the queries.
69

. ..
NewDocuments
?Sentence
?Sentence ?
sentence
...
REDUNDANCYREMOVAL
Summary
RANK
Documents
Documents Summaries TRAINING DATAGENERATION
TRAINING
Documents
Documents SummariesDocuments
Documents Summaries
...
+++ sentence
sentence
Model
Sentence
Figure 5.3: The framework of supervised learning for summarization.
Supervised Learning for Summarization
By composing manual summaries, we can naturally create labeling data of query-focused
multi-document summarization is in the form of triples <query, document set, human
summaries>. However, in order to make use of this kind of data, and apply a standard
supervised learning algorithm (classification/regression/ranking) to learn a model to rank
the sentences for a new <query, document set> pair, the existing human labeling data
needs to be transformed first to generate the training data for supervised learning, that is,
to assign a label/score for each sentence. The general framework of an extractive summa-
rization system using supervised learning is given in Figure 5.3. The framework consists
of the following major components: (1) training data generation where the given human
summaries are transformed into the training data for supervised learning; (2) model learn-
ing where a supervised learning model is constructed to label/rank the sentences; and (3)
summary generation for new documents where the learned model is used for ranking the
sentences followed by redundancy removal. Note the data transformation is not trivial,
because human-generated summaries are abstractive and do not necessarily well match
the sentences in the documents. To solve this problem, in this paper, both the training
data generation and the subsequent model learning component are considered.
70
Recently, support vector regression (SVR), has been used to automatically combine
various sentence features for supervised summarization [OLL07]. However, since we
only need to differentiate the “summary sentence” and “non-summary sentence”, the
model is not necessary to fit the regression scores of the training data. In other words,
it should make no difference if we swap two non-summary sentences which are ranked
low in a ranked sentence list, even thougth their regression scores are different. So the
objective in regression model learning is too aggressive, measuring the average distance
between the predicted score and the true score for all sentences. Another reason of the
problem of regression model is that the true score for a sentence in the training set is
estimated automatically and the quality of the estimation is not guaranteed.
In this chapter, we proposes a method for text summarization based on ranking tech-
niques and explore the use of ranking SVM [Joa02], a learning to rank method, to train
the feature weights for query-focused multi-document summarization. To construct the
training data for ranking SVM, a rank label of “summary sentence” or “non-summary
sentence” needs to be assigned to the training sentences. This assignment generally relies
on a threshold of sentence scoring. Our experiments show that a small variation of the
threshold may lead to a substantial change on the performance of the trained model. The
sentences near the threshold are likely to be assigned with a wrong rank label, thus, intro-
ducing noise into the training set. To make the threshold less sensitive, we adopt a cost
sensitive loss in the ranking SVM’s objective function, giving less weights to those sen-
tence pairs whose relative positions are of less certainty. While there are existing works
on using ranking for summarization, the proposed method of cost sensitive loss will im-
prove the robustness of learning and extend the usefulness of rank-based summarization
techniques.
Our work also contribute to training data generation for supervised summarization.
Note that the problem of automatic training data generation is essential in trainable sum-
71
marizers. To better estimate the probability of a sentence in the document set to be a
summary sentence, we proposes a novel method by utilizing the sentence relationships to
improve the estimation of the probability in training data generation.
5.2.1 Related Work
Supervised Learning for Summarization
Supervised learning approaches have been successfully applied in single document sum-
marization, where the training data is available or easy to build. The most straightforward
way is to regard the sentence extraction task as a binary classification problem. [KPC95]
developed a trainable summarization system which adopted various features and used a
Bayesian classifier to learn the feature weights. The system performed better than other
systems using only a single feature. [HIMM02] trained a SVM model for important sen-
tence extraction and the model outperformed other classification models such as decision-
tree or boosting methods on the Japanese Text Summarization Challenge (TSC). To make
use of the sentence relations in a single document, sequential labeling methods are used
to extract a summary for a single document. [ZH03] applied a HMM-based model and
[SSL+07] proposed a conditional random field based framework.
For query-focused multi-document summarization, [ZHW05] applied the Conditional
Maximum Entropy, a classification model, on the DUC 2005 query-based summarization
task. Similar to those methods developed for single document summarization, the model
was trained on an existing training dataset where sentences are labeled as summary or
non-summary manually. [OLL07] constructed the training data by labeling the sentence
with a “true” score calculated according to human summaries, and then used support vec-
tor regression (SVR) to relate the “true” score of the sentence to its features. Similar
to [OLL07], in this paper, we construct the training data from human summaries. How-
72
ever, the learning to rank method is used in our work for query-focused multi-document
summarization.
Learning to Rank
Learning to rank, in parallel with learning for classification and regression, has been at-
tracting increasing interests in statistical learning for the last decade, because many ap-
plications such as web search and retrieval can be formalized as ranking problems.
Many of the learning to rank approaches are pairwise approaches, where the learning
to rank problem is approximated by a classification problem, and a classifier is learned
to tell whether a document is better than another. Recently, a number of authors have
proposed directly defining a loss function on a list of objects and directly optimizing
the loss function in learning [CQL+07, TGRM08]. Most of these list-wise approaches
directly optimize a performance measure in information retrieval, such as Mean Average
Precision (MAP) and Normalized Discounted Cumulative Gain (NDCG) [Liu09].
In the summarization task, there is no clear performance measure for the ranked sen-
tence list. Note that the ranked sentence list is still an intermediate result for summa-
rization and redundancy removal is needed to form the final summary. Hence, we de-
velop our summarization system based on ranking SVM, a typical pairwise learning to
rank method. Other pairwise learning to rank methods include RankBoost [FISS03] and
RankNet [BSR+05]. Our modification of ranking SVM is inspired by adopting cost sen-
sitive loss function to differentiate document pairs from different queries or in different
ranks [XCLH06, CXL+06].
Most learning to rank methods, however, are based on the available high-quality train-
ing data. This is not the case when we apply these methods for summarization, where the
training data needs to be automatically generated from the set of <query, document set,
human summaries> triples.
73
5.2.2 Model Learning
Under the feature-based summarization framework, normally the scoring function needs
to combine the impacts of various features. A common way is to use the linear combi-
nation of the features by tuning the weights of the features manually or empirically. The
problem of such a method is that when the number of the features gets larger, the com-
plexity of assigning weights grows exponentially. In this section, we explore the use of
ranking SVM, a pairwise learning to rank model, for obtaining credible and controllable
solutions for feature combinations.
Ranking SVM
Assume that a training set of labeled data is available. Given a training set (x1, y1), . . . , (xn, yn)
with xi ∈ ℜN and yi ∈ {1, . . . , R}. In the formulation of Herbrich et al. [HGO99], the
goal is to learn a function h(x) = wTx, so that for any pair of examples (xi, yi) and
(xj, yj) it holds that
h(xi) > h(xj)⇐⇒ yi > yj.
In this way, the task of learning to rank is formulated as the problem of classification
on pairs of instances. In particular, the SVM model can be applied and the task is thus
formulated as the following optimization problem:
minw,ξij≥0
12wTw + C
m
∑(i,j)∈P
ξij
s.t. ∀(i, j) ∈ P : wT (xi − xj) > 1− ξij,(5.5)
where P is the set of pairs (i, j) for which example i has a higher rank than example j,
i.e. P = {(i, j) : yi > yj}, m = |P |, and ξij’s are slack variables. This optimization
problem is equivalent to
minw
1
2CwTw +
1
m
∑(i,j)∈P
max{0, 1−wT (xi − xj)}, (5.6)
74

@1 @2 @3 @4 @5Ranking 1(Perfect) : s(.3) s(.7) n(.3) n(.7) n(.8)Ranking 2(Perfect) : s(.7) s(.3) n(.7) n(.3) n(.8)
Ranking 3 : s(.3) n(.7) s(.7) n(.3) n(.8)Ranking 4 : s(.7) n(.3) s(.3) n(.7) n(.8)
Table 5.6: Example rankings for the five sentences.
where the second term is called “empirical hinge loss”.
Cost Sensitive Loss
Since the rankings of the sentences in the training set (x1, y1), . . . , (xn, yn) are estimated,
applying the empirical hinge loss may not be proper. Let us consider the following ex-
ample. Given five sentences {s(.3), s(.7), n(.3), n(.7), n(.8)}, where ‘s’ and ‘n’ indicate
two possible ranks: summary and non-summary respectively, and the value in parenthe-
ses indicates the confidence score of the rank. Table 5.6 shows four possible rankings for
these five sentences. Ranking 1 and Ranking 2 are both perfect, since it does not matter
to swap two positions of both non-summary sentences or both summary sentences. Ap-
parently, neither Ranking 3 nor Ranking 4 is perfect, and without considering confidence,
they have the same quality. However, Ranking 4 should be better than Ranking 3 if we
take the confidence into consideration. For the pair < n(.7), s(.7) > in Ranking 3, n(.7)
is likely to be a non-summary sentence, and s(.7) is likely to be a summary sentence.
Therefore, we have good confidence that their relative positions should be swapped. For
the pair < n(.3), s(.3) > in Ranking 4, n(.3) is less likely to be a non-summary sentence
and s(.3) is less likely to be a summary sentence. Their relative positions may be correct
while their ranks might be mislabeled.
To deal with this problem, we adopt the idea of sensitive cost loss for SVM, and use
penalty weight σij for the loss function of each sentence pair. So the optimization problem
in Eq. (5.6) becomes
75

minw
1
2CwTw +
1
m
∑(i,j)∈P
max{0, σij(1−wT (xi − xj))}. (5.7)
In our task, for the sentence pair < xi,xj >, the sum of confidence scores of xi and
xj (represented by ci and cj , respectively) can be used as the penalty weights. In other
words,
σij = ci + cj.
Basically, a pair of a non-summary sentence and a summary sentence with small con-
fidence having reversed relative ranking positions will be less penalized than those with
high confidence. To solve the problem in Eq.(5.7), we can solve the equivalent problem
minw,ξij≥0
12wTw + C
m
∑(i,j)∈P
ξij
s.t. ∀(i, j) ∈ P : σij(wT (xi − xj)) ≥ σij − ξij.
(5.8)
5.2.3 Training Data Construction: A Graph based Method
In order to apply learning to rank for summarization, we need to have the labeled training
set in the form of (x1, y1), . . . , (xn, yn), where xi is a sentence and yi is the ranking
of the sentence. Given a set of triples <query, document set, manual summary set>,
instead of manually labeling the rank for every sentence, which is a time-consuming
task, we can estimate the rank of a sentence with the reference of the manual summaries.
For simplicity, we only assign the sentence with two possible ranks: summary or non-
summary1.
Note that generally human summaries do not contain redundancy. Therefore, to con-
struct the training data, the sentences that have similar meanings to sentences in human
1Since the ranks are estimated, more ranks may introduce more noise, and we show later onin our experiments that more ranks are not necessary.
76

summaries but of lexical diversity should also be labeled as summary sentences. So, in-
stead of simply comparing sentences in the document set with those in human summaries,
we take the training data construction as an extractive summarization task, where the sim-
ilarity between sentences in the documents set are also considered, and similar sentences
should have similar probabilities to be labeled as a summary sentence [OER05]. Different
from a standard extractive summarization, here redundancy removal is performed and the
human summaries are used as the query.
To estimate the probability score p(s|H) of a sentence s being labeled as a summary
sentence given the human summary set H , we measure its relevance with sentences in
the human summary set and its similarities with the other sentences in the document set.
Formally, p(s|H) is computed by the following formula:
p(s|H) = d∑v∈C
sim(s,v)∑z∈C sim(z,v)
p(v|H)
+(1− d) rel(s,H)∑z∈C rel(z,H)
,
(5.9)
where C is the set of all sentences in the document set, and d is a trade-off parameter in
the interval [0, 1], used to specify the relative contribution of the two terms in Eq.(5.9).
For bigger value of d, more importance is given to the sentence-to-sentence similarity
compared to sentence-to-human-summary relevance. The denominators in both terms are
used for normalization. The matrix form of Eq.(5.9) can be written as
p(k + 1) =MTp(k), (5.10)
M = dA+ (1− d)B, (5.11)
where M , A, and B are all square matrices. Elements in A represent the similarities
between sentences in the document set. All elements of i-th column in B are proportional
to rel(i|H). A and B are both normalized to make the sum of each row equal to 1. Note
77

that k represents the kth iteration, and p = [p1, . . . , pN ]T is the vector of sentence ranking
scores that we are looking for, which corresponds to the stationary distribution of the
matrixM . The iteration is guaranteed to converge to a unique stationary distribution given
that M is a stochastic matrix. To calculate the similarity of sentences in the document set,
we use the cosine similarity. To calculate rel(s,H), the sentence relevance given the
human summary set, we use
rel(s,H) = maxr∈H
ROUGE-2r(s), (5.12)
where r is a sentence in the human summary, and ROUGE-2r(s) is the ROUGE-2 score
of the sentence s with the reference r.
After estimating the score of every sentence in document set, a threshold is applied
to assign a sentence rank 1 indicating summary sentence if the score is larger than the
threshold, or otherwise rank 0 indicating non-summary sentence. The confidence score
can be defined as
ci = |p(xi|H)− threshold|. (5.13)
5.2.4 Feature Design
In our work, we use some common features that are widely used in the supervised sum-
marization methods [OLL07, SSL+07] as well as several features induced from the unsu-
pervised methods for learning the model. In total 20 features are used in our work.
Basic Features
The basic features are the commonly used features in previous summarization approaches,
which can be extracted directly without complicated computation. Given a query and
78
sentence pair, < q, xi >, the basic features used for learning are described as follows.
Position: The position feature, denoted by Pos, indicates the position of xi along the
sentence sequence of a document. If xi appears at the beginning of the document, Pos is
set to be 1; if it is at the end of the document, Pos is 2; Otherwise, Pos is set to be 3.
Length: The length feature is the number of terms contained in xi after removing the stop
words according to a stop word list.
Number of Frequent Thematic Words: Thematic words are the most frequent words
appeared in the documents after removing the stop words. Sentences containing more
thematic words are more likely to be summary sentences. We use the number of frequent
thematic words in xi as a feature. In our work, 5 frequency thresholds 10,20,50,100,
200 are used to define the frequent thematic words, thus generating 5 features for each
sentence.
Similarity to the Closest Neighboring Sentences: We also use the average similarity
between a sentence and its closest neighbors as features. In particular, we use “Intra Sim
to Pre N” and “Intra Sim to Next N” (N = 1, 2, 5) to record the average similarity of
xi to the previous N most similar sentences and to the next N most similar sentences
respectively, in the same document. “Inter Sim to N” (N = 1,2,5) is also used to record
the average similarity of xi to the N most similar sentences in different documents. We
use the cosine measure to compute the similarity measurement.
Similarity to the Query: The cosine similarity between the query q and the sentence xi is
also used as a feature.
Complex Features
Manifold Ranking Score: The ranking score is obtained for each sentence in the manifold-
ranking process to denote the biased information richness of the sentence. All sentences
in the document set plus the query description are considered as points {x0, x1, . . . , xn}
79
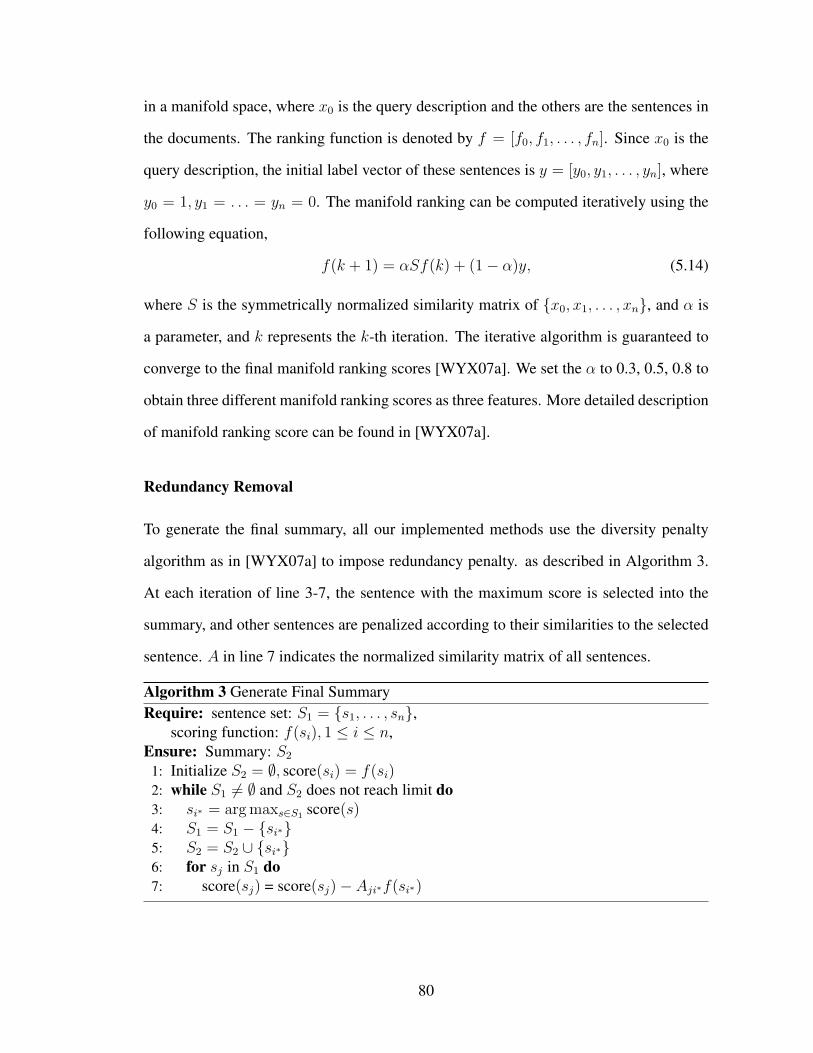
in a manifold space, where x0 is the query description and the others are the sentences in
the documents. The ranking function is denoted by f = [f0, f1, . . . , fn]. Since x0 is the
query description, the initial label vector of these sentences is y = [y0, y1, . . . , yn], where
y0 = 1, y1 = . . . = yn = 0. The manifold ranking can be computed iteratively using the
following equation,
f(k + 1) = αSf(k) + (1− α)y, (5.14)
where S is the symmetrically normalized similarity matrix of {x0, x1, . . . , xn}, and α is
a parameter, and k represents the k-th iteration. The iterative algorithm is guaranteed to
converge to the final manifold ranking scores [WYX07a]. We set the α to 0.3, 0.5, 0.8 to
obtain three different manifold ranking scores as three features. More detailed description
of manifold ranking score can be found in [WYX07a].
Redundancy Removal
To generate the final summary, all our implemented methods use the diversity penalty
algorithm as in [WYX07a] to impose redundancy penalty. as described in Algorithm 3.
At each iteration of line 3-7, the sentence with the maximum score is selected into the
summary, and other sentences are penalized according to their similarities to the selected
sentence. A in line 7 indicates the normalized similarity matrix of all sentences.
Algorithm 3 Generate Final SummaryRequire: sentence set: S1 = {s1, . . . , sn},
scoring function: f(si), 1 ≤ i ≤ n,Ensure: Summary: S2
1: Initialize S2 = ∅, score(si) = f(si)2: while S1 = ∅ and S2 does not reach limit do3: si∗ = argmaxs∈S1 score(s)4: S1 = S1 − {si∗}5: S2 = S2 ∪ {si∗}6: for sj in S1 do7: score(sj) = score(sj)− Aji∗f(si∗)
80

5.2.5 Experiments
Experiment Settings
We evaluate our proposed method for query-focused multi-document summarization on
the main tasks of DUC 2005, DUC 2006, and DUC 2007. Each task has a gold standard
data set consisting of document sets and reference summaries. In our experiments, DUC
2005 is used to train the model tested on DUC 2006, and DUC 2006 is used train the
model tested on DUC 2007. Table 5.7 lists the characteristics of the data sets.
DUC 2005 DUC 2006 DUC 2007#topics 50 50 45
#documents per topic 25-50 25 25Summary length 250 words 250 words 250 words
Table 5.7: Brief description of the data sets.
We use ROUGE toolkit (version 1.5.5) [LH03], described in Section 5.1.4, to measure
the summarization performance.
In the following experiments, we use ROUGE-1, ROUGE-2, ROUGE-W and ROUGE-
SU, of which ROUGE-2 and ROUGE-SU were adopted by DUC 2006 and DUC 2007 for
automatic performance evaluation, and all of which are widely used in summarization
research.
SVMRank [Joa06] is used as a tool for ranking SVM and also served as a basis for
ranking SVM with cost sensitive loss. The parameter C in Eq.(5.5) and Eq.(5.8) is set to
1 for all following experiments, and other parameters are set to the default values. The
threshold for assigning the two ranks to the sentences in training data generation is chosen
by 10-fold cross validation.
81
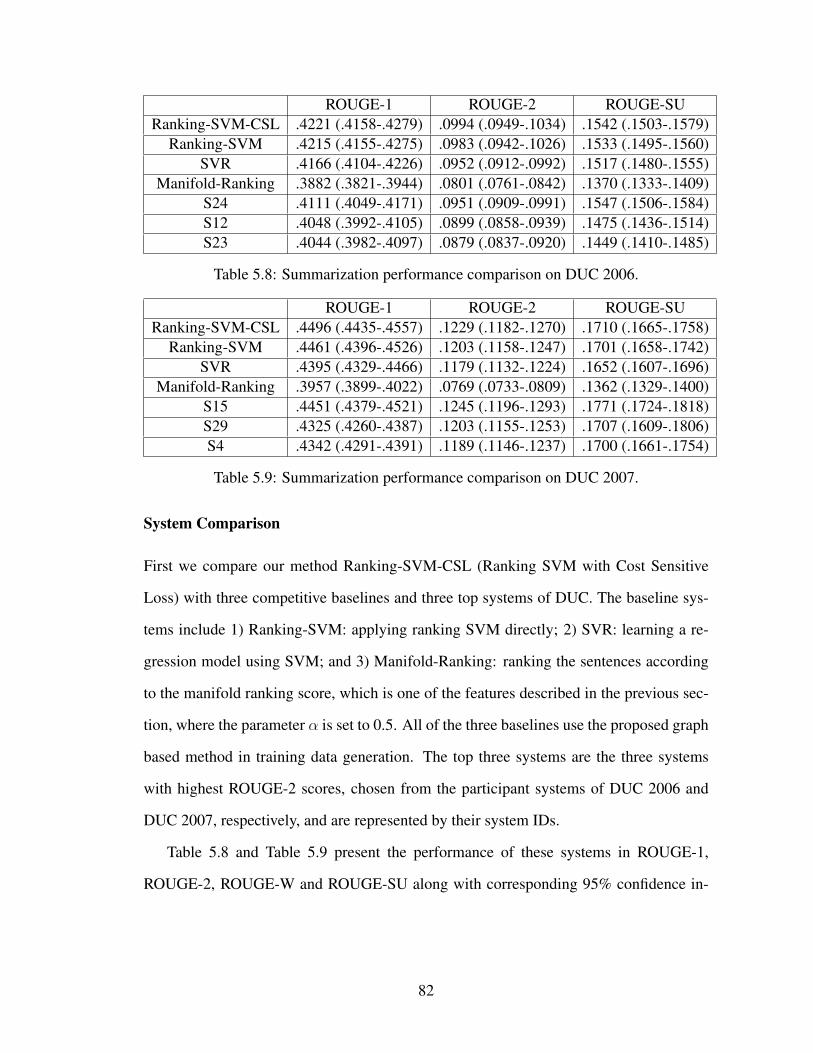
ROUGE-1 ROUGE-2 ROUGE-SURanking-SVM-CSL .4221 (.4158-.4279) .0994 (.0949-.1034) .1542 (.1503-.1579)
Ranking-SVM .4215 (.4155-.4275) .0983 (.0942-.1026) .1533 (.1495-.1560)SVR .4166 (.4104-.4226) .0952 (.0912-.0992) .1517 (.1480-.1555)
Manifold-Ranking .3882 (.3821-.3944) .0801 (.0761-.0842) .1370 (.1333-.1409)S24 .4111 (.4049-.4171) .0951 (.0909-.0991) .1547 (.1506-.1584)S12 .4048 (.3992-.4105) .0899 (.0858-.0939) .1475 (.1436-.1514)S23 .4044 (.3982-.4097) .0879 (.0837-.0920) .1449 (.1410-.1485)
Table 5.8: Summarization performance comparison on DUC 2006.
ROUGE-1 ROUGE-2 ROUGE-SURanking-SVM-CSL .4496 (.4435-.4557) .1229 (.1182-.1270) .1710 (.1665-.1758)
Ranking-SVM .4461 (.4396-.4526) .1203 (.1158-.1247) .1701 (.1658-.1742)SVR .4395 (.4329-.4466) .1179 (.1132-.1224) .1652 (.1607-.1696)
Manifold-Ranking .3957 (.3899-.4022) .0769 (.0733-.0809) .1362 (.1329-.1400)S15 .4451 (.4379-.4521) .1245 (.1196-.1293) .1771 (.1724-.1818)S29 .4325 (.4260-.4387) .1203 (.1155-.1253) .1707 (.1609-.1806)S4 .4342 (.4291-.4391) .1189 (.1146-.1237) .1700 (.1661-.1754)
Table 5.9: Summarization performance comparison on DUC 2007.
System Comparison
First we compare our method Ranking-SVM-CSL (Ranking SVM with Cost Sensitive
Loss) with three competitive baselines and three top systems of DUC. The baseline sys-
tems include 1) Ranking-SVM: applying ranking SVM directly; 2) SVR: learning a re-
gression model using SVM; and 3) Manifold-Ranking: ranking the sentences according
to the manifold ranking score, which is one of the features described in the previous sec-
tion, where the parameter α is set to 0.5. All of the three baselines use the proposed graph
based method in training data generation. The top three systems are the three systems
with highest ROUGE-2 scores, chosen from the participant systems of DUC 2006 and
DUC 2007, respectively, and are represented by their system IDs.
Table 5.8 and Table 5.9 present the performance of these systems in ROUGE-1,
ROUGE-2, ROUGE-W and ROUGE-SU along with corresponding 95% confidence in-
82
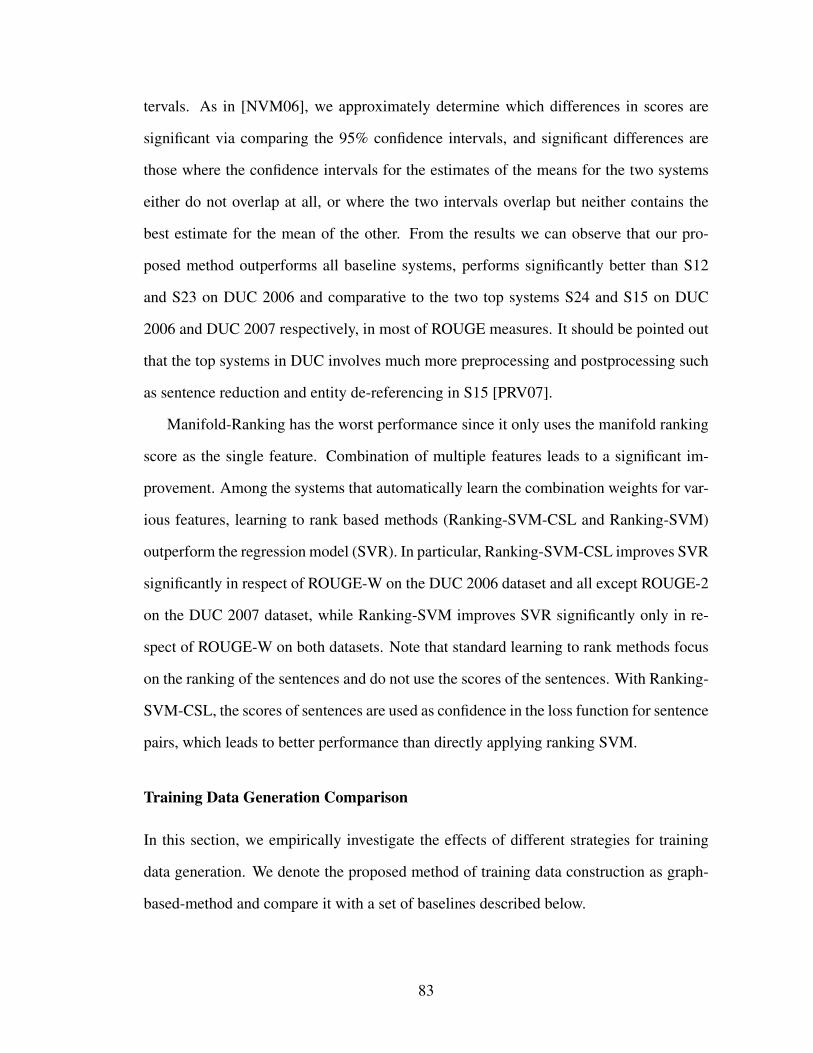
tervals. As in [NVM06], we approximately determine which differences in scores are
significant via comparing the 95% confidence intervals, and significant differences are
those where the confidence intervals for the estimates of the means for the two systems
either do not overlap at all, or where the two intervals overlap but neither contains the
best estimate for the mean of the other. From the results we can observe that our pro-
posed method outperforms all baseline systems, performs significantly better than S12
and S23 on DUC 2006 and comparative to the two top systems S24 and S15 on DUC
2006 and DUC 2007 respectively, in most of ROUGE measures. It should be pointed out
that the top systems in DUC involves much more preprocessing and postprocessing such
as sentence reduction and entity de-referencing in S15 [PRV07].
Manifold-Ranking has the worst performance since it only uses the manifold ranking
score as the single feature. Combination of multiple features leads to a significant im-
provement. Among the systems that automatically learn the combination weights for var-
ious features, learning to rank based methods (Ranking-SVM-CSL and Ranking-SVM)
outperform the regression model (SVR). In particular, Ranking-SVM-CSL improves SVR
significantly in respect of ROUGE-W on the DUC 2006 dataset and all except ROUGE-2
on the DUC 2007 dataset, while Ranking-SVM improves SVR significantly only in re-
spect of ROUGE-W on both datasets. Note that standard learning to rank methods focus
on the ranking of the sentences and do not use the scores of the sentences. With Ranking-
SVM-CSL, the scores of sentences are used as confidence in the loss function for sentence
pairs, which leads to better performance than directly applying ranking SVM.
Training Data Generation Comparison
In this section, we empirically investigate the effects of different strategies for training
data generation. We denote the proposed method of training data construction as graph-
based-method and compare it with a set of baselines described below.
83

0.08
0.085
0.09
0.095
0.1
0.105
0.11
0.115
0.12
0.125
DUC06-SVR
DUC06-RankingSVM
DUC06-RankingSVM-CSL
DUC07-SVR
DUC07-RankingSVM
DUC07-RankingSVM-CSL
RO
UG
E-2
Graph-Based-MethodBaseline-Sentence-Rouge2Baseline-Sentence-CosBaseline-Summary-Rouge2Baseline-Summary-Cos
0.14
0.145
0.15
0.155
0.16
0.165
0.17
0.175
DUC06-SVR
DUC06-RankingSVM
DUC06-RankingSVM-CSL
DUC07-SVR
DUC07-RankingSVM
DUC07-RankingSVM-CSL
RO
UG
E-S
U
Graph-Based-MethodBaseline-Sentence-Rouge2Baseline-Sentence-CosBaseline-Summary-Rouge2Baseline-Summary-Cos
Figure 5.4: Performance comparison of training data generation.
Given a summary set H for a query and a set of sentences {xi}Ni=1 in a set of docu-
ments, generally, the following strategy can be used to estimate the ranks of the sentences:
y∗i = maxe∈H
y∗i,e (5.15)
where y∗i is the estimated rank of sentence i, e is the reference which can be a sentence or
a summary inH , y∗i,e is a discretized result of sim(xi, e) where sim can be the cosine sim-
ilarity or ROUGE score of the sentence given the reference, representing the probability
xi is summary given the reference e.
We compare our graph-based method to this baseline strategy with different refer-
ences (sentence or summary) and different similarity measurements (cosine similarity or
ROUGE-2 score) and the comparison is shown in Figure 5.4. From the comparison, we
observe that: 1) Using sentence as the reference is much better than using the whole
summary, especially with the ROUGE score as the similarity function. This may due
84

0.095
0.096
0.097
0.098
0.099
0.1
0.101
0.102
0.2 0.25 0.3 0.35 0.4 0.45 0.5 0.55 0.6
RO
UG
E-2
1 - threshold
Ranking-SVM-CSLRanking-SVM
(a) DUC 2006
0.1155
0.116
0.1165
0.117
0.1175
0.118
0.1185
0.119
0.1195
0.2 0.25 0.3 0.35 0.4 0.45 0.5 0.55 0.6
RO
UG
E-2
1 - threshold
Ranking-SVM-CSLRanking-SVM
(b) DUC 2007
Figure 5.5: Effects using cost sensitive loss. (Value of x-axis represents 1− threshold)
to the fact that more different words in the whole summary may lead to a bias in favor
of those longer sentences having more overlapping grams with the reference, especially
using similarity functions with no normalization factor, like ROUGE-2 score. 2) Our
graph-based method outperforms other baseline strategies in most of combination of data
and learning models. This is because our graph-based method makes use of the sentence
relationships in the documents set, which has been shown as an important factor in a lot
of summarization work to score the sentences.
85

0.095
0.1
0.105
0.11
0.115
0.12
DUC06 DUC07
RO
UG
E-2
0.80+CSL0.800.80,0.600.75,0.500.80,0.70,0.50
Figure 5.6: Performance comparison using training data with multiple ranks.
Effect of Cost Sensitive Loss
In this section, we empirically investigate the effect of the cost sensitive loss. Figure 5.5(a)
and Figure 5.5(b) show the performance comparison between Rank-SVM-CSL (with cost
sensitive loss) and Ranking-SVM (without cost sensitive loss) for different thresholds on
DUC 2006 and DUC 2007, respectively. For most thresholds we test, cost sensitive loss
improves the performance on both DUC 2006 and DUC 2007. We can observe that the
performance of Ranking SVM, especially in Figure 5.5(b) changes frequently with the
variation of the threshold. Compared with directly using ranking SVM, the results of
Ranking-SVM-CSL are more stable.
Granularity of Rank
In our work, the sentences of the document set are divided into two ranks: summary
and non-summary. Here we use a case study to show that more ranks do not lead to
significant performance improvements. Instead of using only one threshold (0.8 in this
case), we map the sentences to more than two ranks by selecting more than one thresholds.
Intuitively, the number of summary sentences should be less than the number of non-
86

summary sentences. Hence the thresholds are chosen to make the number of sentences in
a higher rank less than that in a lower rank.
Figure 5.6 shows the performance using ranking SVM using different thresholds.
“+CSL” indicates learning with ranking SVM with cost sensitive loss. We observe that:
although using 3 or more ranks (i.e., with 2 or more thresholds) may lead to better re-
sults (e.g., (0.80,0.60) on DUC 2006 and DUC 2007, (0.75,0.50) on DUC 2007, and
(0.80,0.70,0.50) on DUC 2007), the improvement is unstable and small, compared with
the improvement made by 0.80+CSL (i.e., using threshold 0.8 followed by learning with
ranking SVM with cost sensitive loss). We leave it as future work to explore the effects
of applying cost sensitive loss to cases with more than two ranks.
5.3 Summary
In this chapter, we propose two frameworks for multi-document summarization for flexi-
ble information needs. The first framework models multi-document summarization using
the minimum dominating set, and shows it versatility to formulate many well-known sum-
marization tasks with simple and effective summarization methods. The second frame-
work incorporates a learning to rank approach, ranking SVM, to combine features for
extractive query-focus multi-document summarization. To apply ranking SVM for sum-
marization, we propose a graph-based method for training data generation by utilizing
the sentence relationships and introduce a cost sensitive loss to improve the robustness of
learning.
87
CHAPTER 6
APPLICATION: EVENT SUMMARIZATION FOR SPORTS GAMES USING
TWITTER STREAMS
6.1 Introduction
Thousands of events are being discussed on the social media websites everyday. Using
the social media, people report the events they are experiencing or publish comments on
the events in real-time, which are aggregated into a highly valuable stream of information
that informs us the events happening around the world. But on the other hand, the large
number of posts from millions of social media users often leads to the information over-
load problem. Those who search for the information related to a particular event often
find difficulty to get a big picture of it, given the overwhelmingly large collection of data.
Event summarization aims to provide a textual description of an event of interest to
address this problem. Given a data stream consisting of chronologically-ordered text
pieces related to an event, an event summarization system aims to generate an informative
textual description that can capture all the important moments and ideally the summary
should be produced in a progressive manner as the event unfolds.
Among these events, the sports games receive a lot of attention from the Twitter audi-
ence. In this chapter, we present a novel participant-centered event summarization appli-
cation for sports games using the Twitter stream. The application provides an alternative
way to be kept informed of the progress of a sports game and audience’s responds from the
social media data. The summary of the progress of a game can be delivered in real-time
to the sports fans who cannot make it to the game or watch it at home; the automatically
generated summary can also be supplied to the news reporters to assist with the writing
of the game recap which provides a full coverage of the exciting moments happened on
the playground.
88
To build the application, aforementioned text analysis methods on social media are
integrated. For a game, we first get a filtered Twitter stream using a set of keywords in-
cluding names of teams, players and coaches. Then the participant-based event detection
is applied on the event stream data to detect the important moments during the event, a.k.a
sub-events. The dominating set based summarization approach is then applied to the mul-
tiple tweets of each sub-event. Besides a summary, we also utilize a sentiment classifier
to automatically classify a tweet into one of the three categories “positive”,“negative” and
“neutral” to reflect the game audience’s emotion change during the game.
6.2 Framework Overview
We propose a novel participant-centered event summarization approach that consists of
three key components: (1) “Participant Detection” dynamically identifies the event par-
ticipants and divides the entire event stream into a number of participant streams ; (2)
“Sub-event Detection” introduces a novel time-content mixture model approach to iden-
tify the important sub-events associated with each participant; these “participant-level
sub-events” are then merged along the timeline to form a set of “global sub-events”1,
which capture all the important moments in the event stream; (3) “Summary Tweet Ex-
traction” extracts the representative tweets from the global sub-events and forms a com-
prehensive coverage of the event progress.
In Figure 6.1, we provide an overview of the system framework. It consists of three
main components: sub-event detection, participant detection and summary generation.
1We use “participant sub-events” and “global sub-events” respectively to represent the im-portant moments happened on the participant-level and on the entire event-level. A “global sub-event” may consist of one or more “participant sub-events”. For example., the “steal” action in thebasketball game typically involves both the defensive and offensive players, and can be generatedby merging the two participant-level sub-events.
89
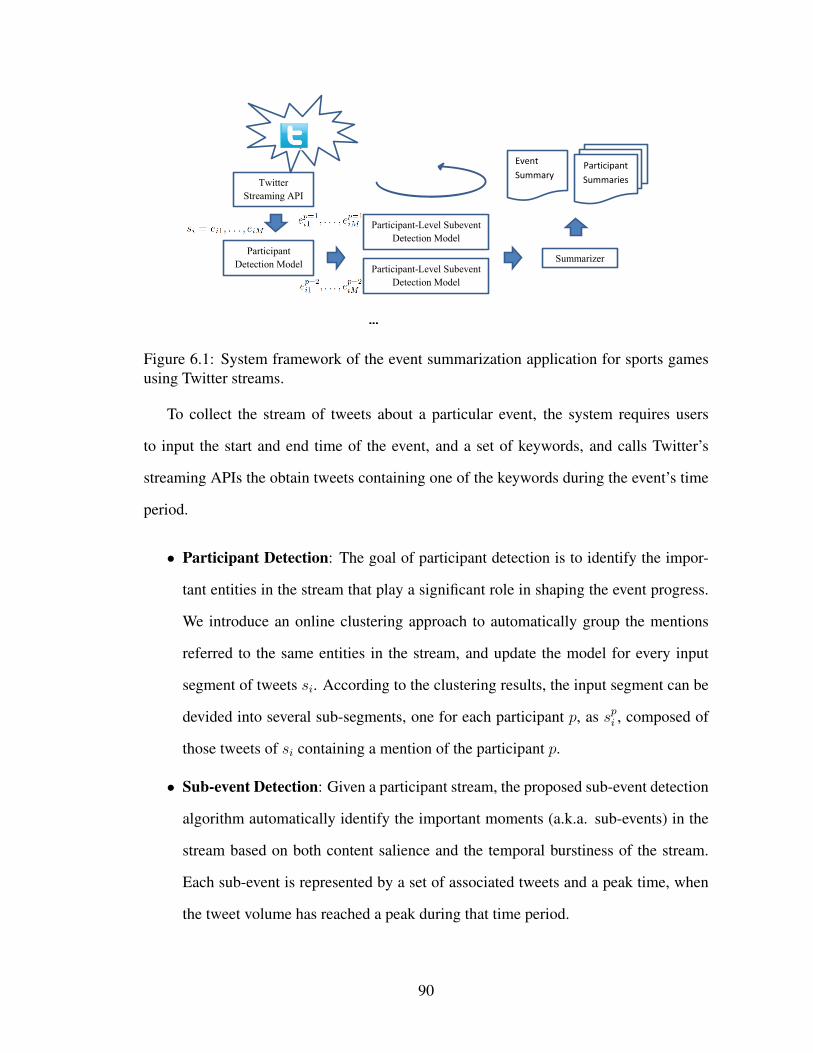
Participant
Detection Model
Participant-Level Subevent
Detection Model
Participant-Level Subevent
Detection Model
Streaming API
…
Summarizer
Event
Summary Participant
Summaries
Figure 6.1: System framework of the event summarization application for sports gamesusing Twitter streams.
To collect the stream of tweets about a particular event, the system requires users
to input the start and end time of the event, and a set of keywords, and calls Twitter’s
streaming APIs the obtain tweets containing one of the keywords during the event’s time
period.
• Participant Detection: The goal of participant detection is to identify the impor-
tant entities in the stream that play a significant role in shaping the event progress.
We introduce an online clustering approach to automatically group the mentions
referred to the same entities in the stream, and update the model for every input
segment of tweets si. According to the clustering results, the input segment can be
devided into several sub-segments, one for each participant p, as spi , composed of
those tweets of si containing a mention of the participant p.
• Sub-event Detection: Given a participant stream, the proposed sub-event detection
algorithm automatically identify the important moments (a.k.a. sub-events) in the
stream based on both content salience and the temporal burstiness of the stream.
Each sub-event is represented by a set of associated tweets and a peak time, when
the tweet volume has reached a peak during that time period.
90

Figure 6.2: Screenshot of the sub-event list of the system.
• Summary Generation: The summary generation module takes the input of sets of
tweets, each associated with a sub-events of a participant, and aims to generate a
high-quality textual summary as well as a sentiment summary.
In an online framework, each of these key components, including the sub-event de-
tection, participant detection, and summary generation, maintains a set of parameters and
they are constantly updated when a new segment of tweets become available.
Figure 6.2 and Figure 6.3 show screen-shots of our system. In Figure 6.2, users can
choose to replay a previous event or follow a current ongoing event. As the related tweets
of the chosen event are being fed into the system, filtered by predefined keywords related
with the event, new sub-events are detected and summarized automatically, and inserted
into the top of the main part of the page. The right side of the page lists participants
91

Figure 6.3: Screenshot of the sub-event details of the system.
of the event. The number by each participant indicates the number of tweets where this
participant is discussed, by which users can find the most popular participants so far. To
obtain more information about a participant users are interested in, they can furthur zoom-
in to a particular participant to list all the sub-events the participant is involved in so far.
After users click the arrow icon beside a sub-event summary in Figure 6.2, they go to a
detailed page of the sub-event as shown in Figure 6.3, including the list of all tweets about
the sub-events and a sentimental analysis result. For showing the aggregated sentiment
of Twitter users for each sub-event, the system calculates the numbers of positive and
negative tweets of the sub-event respectively, after conducting a sentiment classification
on each tweet.
92
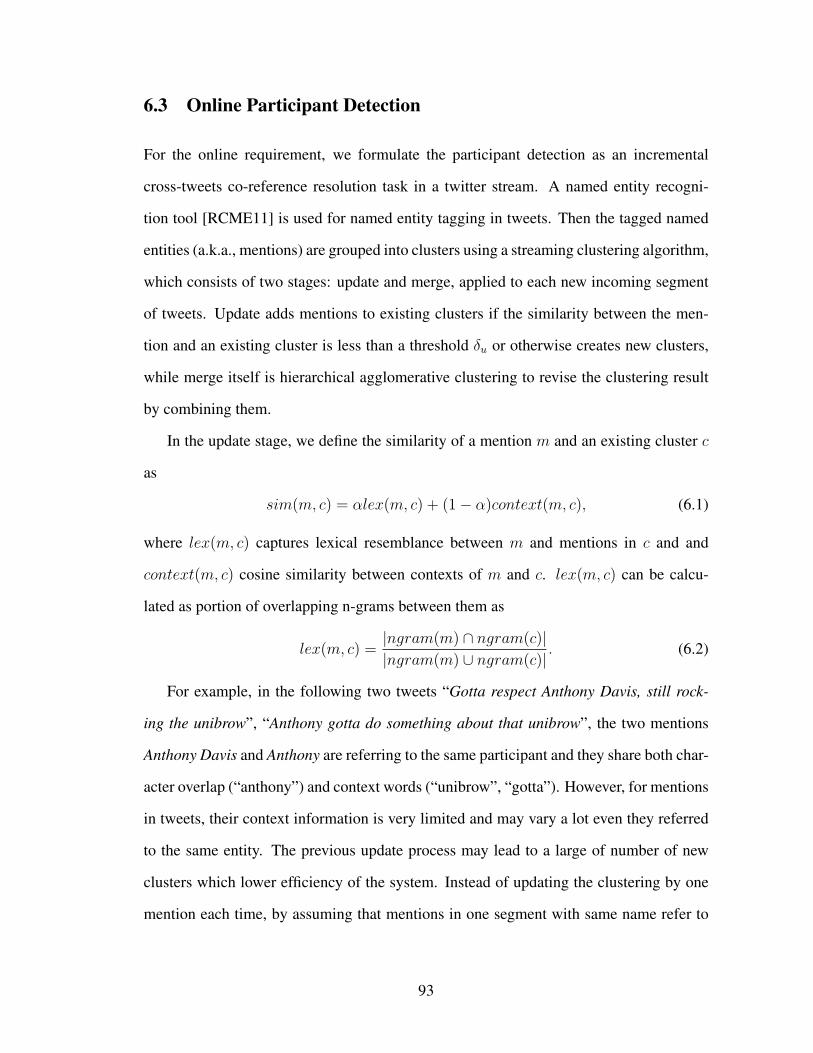
6.3 Online Participant Detection
For the online requirement, we formulate the participant detection as an incremental
cross-tweets co-reference resolution task in a twitter stream. A named entity recogni-
tion tool [RCME11] is used for named entity tagging in tweets. Then the tagged named
entities (a.k.a., mentions) are grouped into clusters using a streaming clustering algorithm,
which consists of two stages: update and merge, applied to each new incoming segment
of tweets. Update adds mentions to existing clusters if the similarity between the men-
tion and an existing cluster is less than a threshold δu or otherwise creates new clusters,
while merge itself is hierarchical agglomerative clustering to revise the clustering result
by combining them.
In the update stage, we define the similarity of a mention m and an existing cluster c
as
sim(m, c) = αlex(m, c) + (1− α)context(m, c), (6.1)
where lex(m, c) captures lexical resemblance between m and mentions in c and and
context(m, c) cosine similarity between contexts of m and c. lex(m, c) can be calcu-
lated as portion of overlapping n-grams between them as
lex(m, c) =|ngram(m) ∩ ngram(c)||ngram(m) ∪ ngram(c)|
. (6.2)
For example, in the following two tweets “Gotta respect Anthony Davis, still rock-
ing the unibrow”, “Anthony gotta do something about that unibrow”, the two mentions
Anthony Davis and Anthony are referring to the same participant and they share both char-
acter overlap (“anthony”) and context words (“unibrow”, “gotta”). However, for mentions
in tweets, their context information is very limited and may vary a lot even they referred
to the same entity. The previous update process may lead to a large of number of new
clusters which lower efficiency of the system. Instead of updating the clustering by one
mention each time, by assuming that mentions in one segment with same name refer to
93

the same entity, we first group all mentions with the same name in the segment, extract
context for the mentions and select a cluster to assign all these mentions to.
To further reduce the cluster number, since participants we want to detect are entities
that play significant roles, we can discard some infrequent entities. For a name, if there
are more than δl continuous slices in each of which there are more than δs mentions of
name, we activate the name. So we only keep track of mentions with frequent names.
In the merge stage, a hierarchical agglomerative clustering is conducted with a stop-
ping threshold δm. Since we suppose to have sufficient context information in this stage
and our goal to combine mentions with different names, here only context similarity is
used to measure the similarity between clusters while lexical resemblance is used as con-
straints. To combine two clusters, at least half of mentions in both clusters needs to be
lexically related with a mention in each other. A mention m is lexically related with men-
tion m′ if m(m′) is an abbreviation, acronym, or part of another mention m′(m), or or if
the character edit distance between the two mentions is less than a threshold θ2.
6.4 Online Update for a Temporal-Content Mixture Model
When we have all the tweets about the event, EM algorithm can be applied to the whole
data to train the event detection model, as proposed in Chapter 4. However, in real case,
we are more interesting in summarizing the on-going event in real-time.
To process a data stream D, we first split it into 10-second time slices D = s1, s2, . . ..
Each slice contains a set of tweets that were published during that time interval.
In an online processing mode using the same temporal-content mixture model, the
system iteratively consumes the new wnew slices of tweets each time to update the model
parameters with the most recent wworking slices of tweets in memory. The wworking slices
2θ was empirically set as 0.2×min{|m|, |m′|}
94
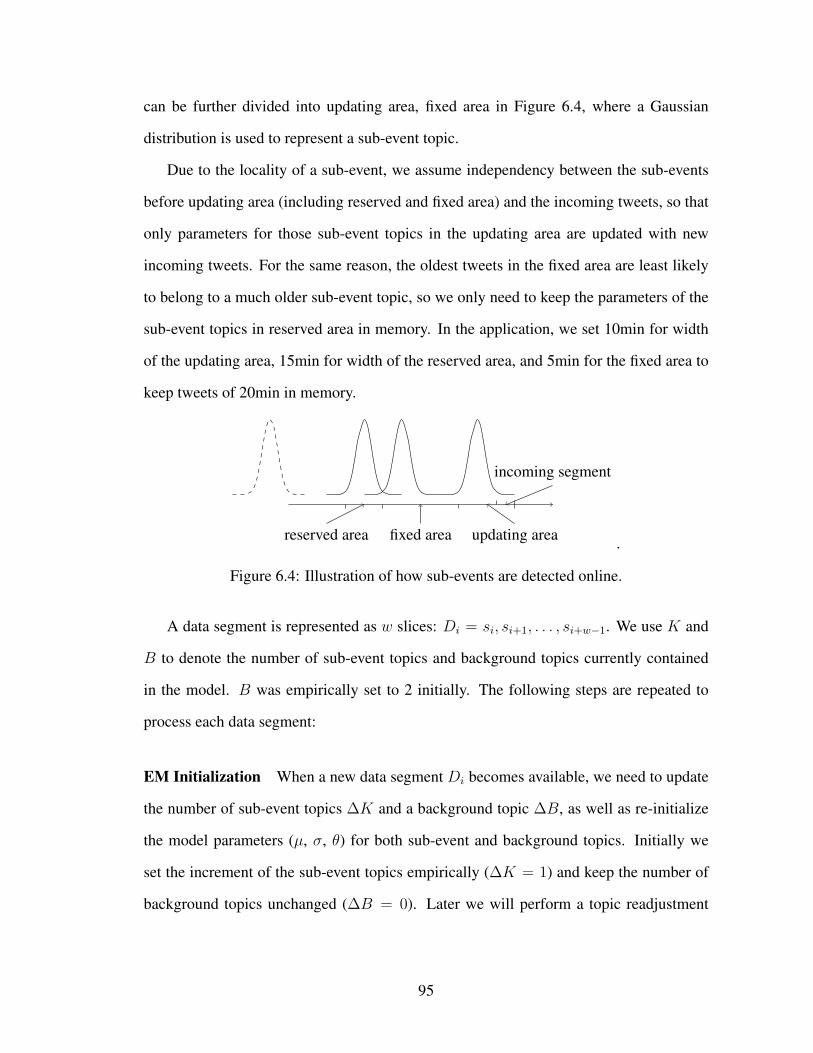
can be further divided into updating area, fixed area in Figure 6.4, where a Gaussian
distribution is used to represent a sub-event topic.
Due to the locality of a sub-event, we assume independency between the sub-events
before updating area (including reserved and fixed area) and the incoming tweets, so that
only parameters for those sub-event topics in the updating area are updated with new
incoming tweets. For the same reason, the oldest tweets in the fixed area are least likely
to belong to a much older sub-event topic, so we only need to keep the parameters of the
sub-event topics in reserved area in memory. In the application, we set 10min for width
of the updating area, 15min for width of the reserved area, and 5min for the fixed area to
keep tweets of 20min in memory.
..
reserved area
.
fixed area
.
updating area
.
incoming segment
.
Figure 6.4: Illustration of how sub-events are detected online.
A data segment is represented as w slices: Di = si, si+1, . . . , si+w−1. We use K and
B to denote the number of sub-event topics and background topics currently contained
in the model. B was empirically set to 2 initially. The following steps are repeated to
process each data segment:
EM Initialization When a new data segment Di becomes available, we need to update
the number of sub-event topics ∆K and a background topic ∆B, as well as re-initialize
the model parameters (µ, σ, θ) for both sub-event and background topics. Initially we
set the increment of the sub-event topics empirically (∆K = 1) and keep the number of
background topics unchanged (∆B = 0). Later we will perform a topic readjustment
95
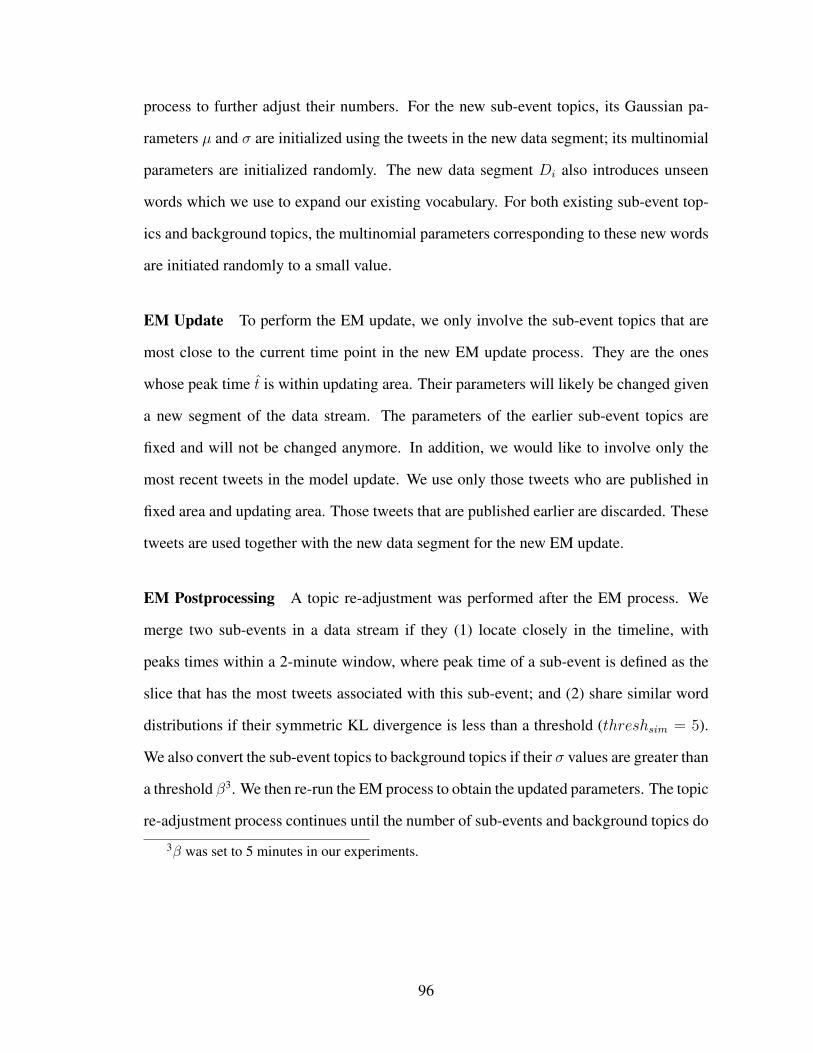
process to further adjust their numbers. For the new sub-event topics, its Gaussian pa-
rameters µ and σ are initialized using the tweets in the new data segment; its multinomial
parameters are initialized randomly. The new data segment Di also introduces unseen
words which we use to expand our existing vocabulary. For both existing sub-event top-
ics and background topics, the multinomial parameters corresponding to these new words
are initiated randomly to a small value.
EM Update To perform the EM update, we only involve the sub-event topics that are
most close to the current time point in the new EM update process. They are the ones
whose peak time t is within updating area. Their parameters will likely be changed given
a new segment of the data stream. The parameters of the earlier sub-event topics are
fixed and will not be changed anymore. In addition, we would like to involve only the
most recent tweets in the model update. We use only those tweets who are published in
fixed area and updating area. Those tweets that are published earlier are discarded. These
tweets are used together with the new data segment for the new EM update.
EM Postprocessing A topic re-adjustment was performed after the EM process. We
merge two sub-events in a data stream if they (1) locate closely in the timeline, with
peaks times within a 2-minute window, where peak time of a sub-event is defined as the
slice that has the most tweets associated with this sub-event; and (2) share similar word
distributions if their symmetric KL divergence is less than a threshold (threshsim = 5).
We also convert the sub-event topics to background topics if their σ values are greater than
a threshold β3. We then re-run the EM process to obtain the updated parameters. The topic
re-adjustment process continues until the number of sub-events and background topics do
3β was set to 5 minutes in our experiments.
96

not change further. We only output the sub-event topic is the number of associated tweets
in its peak time is larger than a threshold (=15).
We obtain the “participant sub-events” by applying this sub-event detection ap-
proach to each of the participant streams. The “global sub-events” are obtained by
merging the participant sub-events along the timeline. We merge two participant sub-
events into a global sub-event if (1) their peaks are within a 2-minute window, and (2) the
Jaccard similarity [L.99] between their associated tweets is greater than a threshold (set
to 0.1 empirically). The tweets associated with each global sub-event are the ones with
p(z|d) greater than a threshold γ, where z is one of the participant sub-events and γ was
set to 0.7 empirically. After the sub-event detection process, we obtain a set of global
sub-events and their associated event tweets.4
6.5 Experiments
Similar in Chapter 4, we evaluate the proposed event summarization application on five
NBA basketball games5 as shown in Table 6.1.
Event Date Duration #TweetsLakers vs Okc 05/19/2012 3h10m 218,313
N Celtics vs 76ers 05/23/2012 3h30m 245,734B Celtics vs Heat 05/30/2012 3h30m 345,335A Spurs vs Okc 05/31/2012 3h 254,670
Heat vs Okc 06/21/2012 3h30m 332,223
Table 6.1: Statistics of the data set, including five NBA basketball games event.
4We empirically set some threshold values in the topic re-adjustment and sub-event mergingprocess. In future, we would like to explore more principled way of parameter selection.
5We remove the game event Heat vs OKC on 06/12/2012, which is almost duplicated withHeat vs OKC on 06/21/2012, comparing with the datasets used in Chapter 4.
97

6.5.1 Participant Detection
We evaluate the participant detection similar as a cross-tweet co-reference solution task.
To build labeled co-reference data, for every event, we first sample hundreds to over a
thousand tweets containing one of 50 most frequent names in the event; then an annota-
tor labeled these sampled tweets with chains of entities. Singletons and those mentions
which are not referred to an actually participant of the event (e.g., “Kevin” referred to a
cousin of the tweet author, or “Jessica” referred to a performer on American Idols). B-
Cubed [BB98], is most widely used in co-reference resolution evaluation, is used as the
metric compare participant detection result and the labeled data. Recall score of B-Cubed
is calculated as:
B3R =
1
N
∑d∈D
∑m∈d
Om
Sm
(6.3)
where D, d and m are the set of documents, a document, and a mention, respectively.
Sm is the set of mentions of the annotated mention chain which contains m, while Om is
the overlap of Sm and the set of mentions of the system generated mention chain which
contains m. N is the total number of mentions in D. The precision is computed by
switching the role of annotated data and system generated data. F-measure is computed
as geometrical average of recall and precision.
We evaluate the participant detection method used in the application system, referred
to as SegmentUpdate, by comparing it with following baselines:
ExactMatch The method which clusters mentions only based on names.
TweetUpdate In update stage, clustering is updated once for a mention in a tweet.
IncNameHAC It is an incremental version of NameHAC, updating the hierarchical tree
based on the available part of the stream, by conducting further merge.
NameHAC Hierarchical agglomerative clustering on names of mentions, assuming men-
tions with the same name refer to the same entity. For a pair of names, their similarity is
98
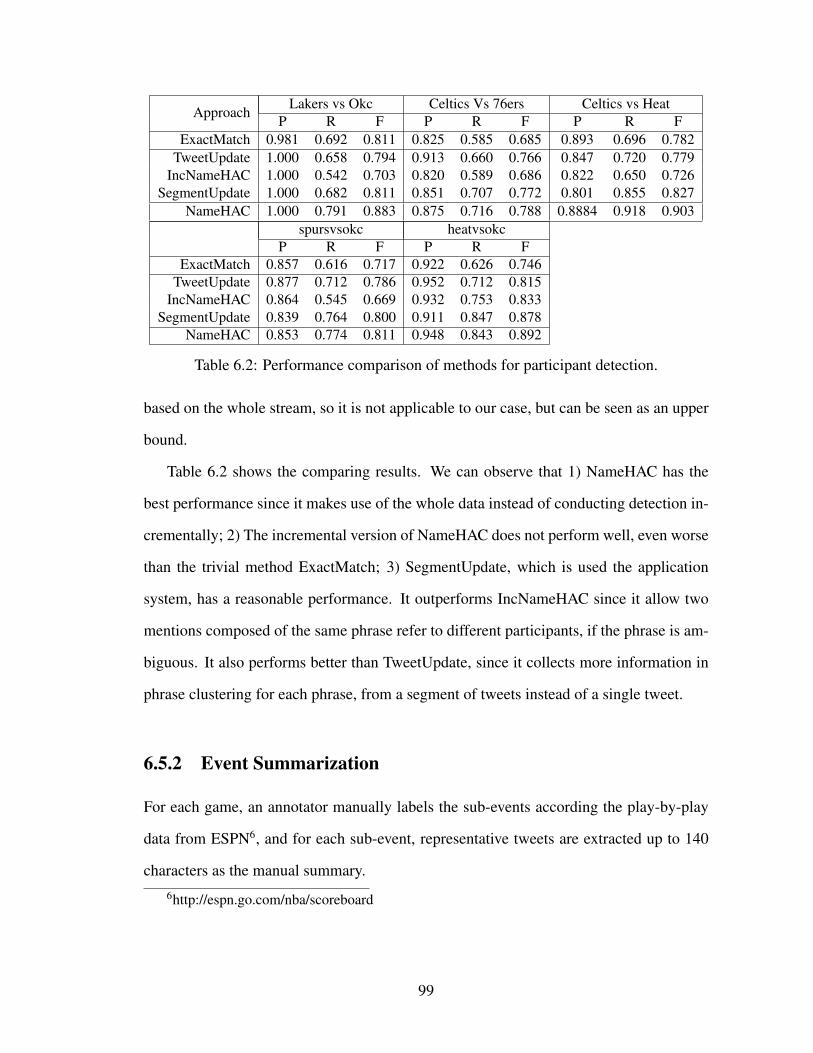
ApproachLakers vs Okc Celtics Vs 76ers Celtics vs Heat
P R F P R F P R FExactMatch 0.981 0.692 0.811 0.825 0.585 0.685 0.893 0.696 0.782
TweetUpdate 1.000 0.658 0.794 0.913 0.660 0.766 0.847 0.720 0.779IncNameHAC 1.000 0.542 0.703 0.820 0.589 0.686 0.822 0.650 0.726
SegmentUpdate 1.000 0.682 0.811 0.851 0.707 0.772 0.801 0.855 0.827NameHAC 1.000 0.791 0.883 0.875 0.716 0.788 0.8884 0.918 0.903
spursvsokc heatvsokcP R F P R F
ExactMatch 0.857 0.616 0.717 0.922 0.626 0.746TweetUpdate 0.877 0.712 0.786 0.952 0.712 0.815
IncNameHAC 0.864 0.545 0.669 0.932 0.753 0.833SegmentUpdate 0.839 0.764 0.800 0.911 0.847 0.878
NameHAC 0.853 0.774 0.811 0.948 0.843 0.892
Table 6.2: Performance comparison of methods for participant detection.
based on the whole stream, so it is not applicable to our case, but can be seen as an upper
bound.
Table 6.2 shows the comparing results. We can observe that 1) NameHAC has the
best performance since it makes use of the whole data instead of conducting detection in-
crementally; 2) The incremental version of NameHAC does not perform well, even worse
than the trivial method ExactMatch; 3) SegmentUpdate, which is used the application
system, has a reasonable performance. It outperforms IncNameHAC since it allow two
mentions composed of the same phrase refer to different participants, if the phrase is am-
biguous. It also performs better than TweetUpdate, since it collects more information in
phrase clustering for each phrase, from a segment of tweets instead of a single tweet.
6.5.2 Event Summarization
For each game, an annotator manually labels the sub-events according the play-by-play
data from ESPN6, and for each sub-event, representative tweets are extracted up to 140
characters as the manual summary.6http://espn.go.com/nba/scoreboard
99

To evaluate the final summaries of an event, we following the work in [TYO11] to
evaluate summarization for a document stream using a modified version of ROUGE [Lin04]
score, which widely used as automatic evaluation for document summarization tasks.
ROUGE measures the quality of a summary by counting the unit overlaps between the
candidate summary and a set of reference summaries. Several automatic evaluation
methods are implemented in ROUGE, such as ROUGE-N, ROUGE-L, ROUGE-W and
ROUGE-SU. ROUGE-N is an n-gram recall computed as follows:
ROUGE-N =
∑S∈ref
∑gramn∈S
Countmatch(gramn)∑S∈ref
∑gramn∈S
Count(gramn), (6.4)
where n is length of the n-gram, ref stands for the reference summaries, Countmatch(gramn)
is the number of co-occurring n-grams in a candidate summary and the reference sum-
maries, and Count(gramn) is the number of n-grams in the reference summaries. ROUGE-
L uses the longest common sub-sequence (LCS) statistics, while ROUGE-W is based on
weighted LCS and ROUGE-SU is based on skip-bigram plus unigram. Each of these eval-
uation methods in ROUGE can generate three scores (recall, precision and F-measure).
However, ROUGE score cannot be applied directly to summarization of a document
stream, in our case, a tweet stream about an event, since same n-grams that appear at dis-
tant time points describe different sub-events and should be regarded as different n-grams.
In our manually labeled and system generated summaries, each n-gram is associated with
the timestamp as the same of the sub-event the n-gram describes. Making use of such
temporal information, we modify ROUGE-N to ROUGET -N, calculated as
ROUGET -N =
∑S∈ref
∑gramt
n∈SCountmatchT (gramt
n)∑S∈ref
∑gramt
n∈SCount(gramt
n)(6.5)
where gramtn is a unique n-gram with a timestamp, and CountmatchT (gramt
n) returns the
minimum of occurrence of n-gram with timestamp t in S and the number of matched n-
grams in a candidate summary. The distance between the timestamp of a matched n-gram
and t needs to be within a constant, which set to 1 min in our experiments.
100

Methods Celtics Vs 76ers Celtics vs Heat Heat Vs Okc Lakers vs Okc Spurs Vs OkcSpike .2664 .31651 .2736 .2838 .2409+Participant .3240 .38784 .3016 .3399 .2917MM .3199 .38591 .3286 .3526 .2841+Participant .3571 .40162 .3493 .3899 .3063MMOnline
.3428 .3970 .3163 .3852 .3068+Participant
Table 6.3: ROUGET-1 F-1 scores
We compare the sub-event detection method used in the application system, referred
to as MixtureModelOnline+Participant to the spike detection method (Spike) [MBB+11]
and the method batch-mode (MM) proposed in Chapter 4 based or not based on partici-
pant detection results. Table 6.3 shows the summarization evaluation results for compar-
ing sub-event detection methods in term of the new evaluation metric ROUGET − 1 F-1
score. From Table 6.3, we have several observations: 1) sub-event detection conducted
based on participant streams leads to better summarization performance due to more ac-
curate sub-event detection results; 2) The temporal-content mixture model outperforms
the spike detection since the former takes the tweet content into consideration; 3) The on-
line version of temporal-content mixture model, MMOnline+Participant, under-performs
its batch counterpart, but their F-1 scores are close, which indicates that it still can lead to
a reasonable performance in the real application system.
6.6 Summary
In this chapter, we present an event summarization application for sports games using
Twitter streams, integrating the techniques we developed in Chapter 3-5. To make the sys-
tem applicable in real data, we propose the online version of participant based temporal-
content mixture model to conduct sub-event detection. Experiments show that it can
achieve similar performance with its batch counterpart.
101

CHAPTER 7
CONCLUSION AND FUTURE WORK
7.1 Conclusion
This dissertation develops text analysis tools using data mining and machine learning
techniques for critical problems in social media. New algorithms are proposed for dif-
ferent problems to address characteristics of text on social media. For each explored
problem, related work are reviewed and comprehensive experiments on real datasets and
applications are conducted. This dissertation mainly addressed challenges of text analyt-
ics on social media as follows:
• Although social media is rich in sentiment text, it is challenging to adapt traditional
sentiment analysis techniques, which are conducted on review text, to social media
text, because of lack of training data. Active learning can help to reduce the labeling
cost. For text data, labels of both documents and words can be utilized to minimize
the labeling effort.
• Event detection is critical for text analysis of social media streams to capture the
event-related information on social media. Existing methods reply on the volume
change of the stream to detect bursts or spikes. However for the social media data,
which often contains a lot of noise, these methods are not robust. Combining the
information of volume change and topic change of the stream leads to more robust
detection results.
• Summarization is an important tools to address information overload problem with
a large volume of social media data. In reality, there are various information needs
from social media, like comparing two document sets and finding their differences.
A versatile summarization model, or a summarization model which can be cus-
102

tomized, can meet the requirement for a summarizer to generate different sum-
maries for a set of textual posts from different aspects.
Specifically, the following key issues are addressed in this dissertation: (1) utilizing
labels of both documents and words to training a classification model with minimized la-
beling efforts (2) detecting events on data streams of social media, combined the temporal
feature, that an event attracts an increasing volume for a short time, and content features,
that an event should be a coherent topic (3) summarzing social media posts for different
information needs with a versatile summarization framework and a learning-based frame-
work, and (4) building a real-time event summarization and analysis system to utilize text
analysis methods in a real application scenario using social media data.
In summary, this dissertation demonstrates and advances the capability of text analysis
techniques for various problems on social media. The developed algorithms broadly rely
on text classification, ranking, and text clustering and modeling, and they are shown to be
effective to be integrated in an real-time social media application.
7.2 Vision for the Future
Social media data plays a more and more important role in our daily lives and in many
real applications (e.g., entertainment, health care, disaster management, and scientific
discovery). It increases the explosion of information, results in huge amounts of noisy,
unstructured, linked, temporal document data on the Internet, and imposes great chal-
lenges on text analytics.
My long-term research goal is to continue providing infrastructure of text analytics to
help users better understand the large social media data, and enable more developers to
build up applications utilizing social media. And in the near future, we will focus on the
103

following novel problems related to social media, all of which will be built on the thesis
work.
• Natural language processing and its evaluation. Natural language processing pro-
vides the fundamental basis for the upper layer of text analysis. There are still
many classical problems, like co-reference resolution and dis-ambiguity, not yet
addressed on the social media data yet. Moreover, although many tools exist, we
are lack of the evaluation of them on social media data, so that it is unclear whether
they can be applied on the new data with reasonable performance.
• Integration of social network information. Traditional text analysis tasks are usu-
ally based on the content of documents. In social media, documents contain not
only content but also users information, which further composes the whole social
network, so text analysis can base on user profiles and user communities etc. In
addition, other typical information of social networks like geotags, and document
organization structure like dialogs can be utilized to understand documents more
concretely.
• More Applications. Social media has a large impact in a wide range of applica-
tions including advertising, disaster management and identification recognization.
I believe that these are only a few of the opportunities that a series of better tools
of text analytics on social media can provide. I will seek collaborations on various
application domains to support the software development of applications based on
analysis of social media data.
104
BIBLIOGRAPHY
[ABHH08] T. Ahlqvist, A. Beck, M. Halonen, and S. Heinonen. Social mediaroadmaps: Exploring the futures triggered by social media. VTT Tiedot-teita - Research Notes, (2454), 2008.
[All02] James Allan. Topic detection and tracking: Event-based information orga-nization. Kluwer Academic Publishers Norwell, MA, USA, 2002.
[AMP10] J. Attenberg, P. Melville, and F. Provost. A unified approach to active dualsupervision for labeling features and examples. Machine Learning andKnowledge Discovery in Databases, pages 40–55, 2010.
[APL98] J. Allan, R. Papka, and V. Lavrenko. On-line new event detection and track-ing. In Proceedings of the 21st annual international ACM SIGIR conferenceon Research and development in information retrieval, pages 37–45. ACM,1998.
[AW12] S. Aral and D. Walker. Identifying influential and susceptible members ofsocial networks. Science, 337(6092):337–341, 2012.
[Bal05] Jason Baldridge. The opennlp project, 2005.
[BB98] A. Bagga and B. Baldwin. Algorithms for scoring coreference chains. InThe first international conference on language resources and evaluationworkshop on linguistics coreference, 1998.
[BJN+02] A.L. Barabasi, H. Jeong, Z. Neda, E. Ravasz, A. Schubert, and T. Vicsek.Evolution of the social network of scientific collaborations. Physica A:Statistical Mechanics and its Applications, 311(3):590–614, 2002.
[BNG11] Hila Becker, Mor Naaman, and Luis Gravano. Beyond trending topics:Real-world event identification on twitter. In Proceedings of the Fifth Inter-national AAAI Conference on Weblogs and Social Media, pages 438–441,2011.
[BNJ03] David Blei, Andrew Ng, and Michael Jordan. Latent dirichlet allocation.Journal of Machine Learning Research, pages 993–1022, 2003.
[BSR+05] Chris Burges, Tal Shaked, Erin Renshaw, Ari Lazier, Matt Deeds, NicoleHamilton, and Greg Hullender. Learning to rank using gradient descent.
105
In Proceedings of the 22nd international conference on Machine learning,pages 89–96. ACM, 2005.
[CAL94] D. Cohn, L. Atlas, and R. Ladner. Improving generalization with activelearning. Machine Learning, 15(2):201–221, 1994.
[CHBG10] M. Cha, H. Haddadi, F. Benevenuto, and P Gummadi. Measuring userinfluence in twitter: The million follower fallacy. In Proceedings of theFourth International AAAI Conference on Weblogs and Social Media, pages10–17, 2010.
[Chv79] V. Chvatal. A greedy heuristic for the set-covering problem. Mathematicsof operations research, 4(3):233–235, 1979.
[CL02] Y.P. Chen and A.L. Liestman. Approximating minimum size weakly-connected dominating sets for clustering mobile ad hoc networks. In Pro-ceedings of International Symposium on Mobile Ad hoc Networking &Computing. ACM, 2002.
[CNN+10] J. Chen, R. Nairn, L. Nelson, M. Bernstein, and E. Chi. Short and tweet:experiments on recommending content from information streams. In Pro-ceedings of SIGCHI, pages 1185–1194, 2010.
[CP11] D. Chakrabarti and K. Punera. Event summarization using tweets. In Pro-ceedings of the Fifth International AAAI Conference on Weblogs and SocialMedia, pages 66–73, 2011.
[CQL+07] Z. Cao, T. Qin, T.Y. Liu, M.F. Tsai, and H. Li. Learning to rank: frompairwise approach to listwise approach. In Proceedings of the 24th inter-national conference on Machine learning, pages 129–136. ACM, 2007.
[Cun02] Hamish Cunningham. Gate, a general architecture for text engineering.Computers and the Humanities, 36(2):223–254, 2002.
[CWML13] Y. Chang, X. Wang, Q. Mei, and Y. Liu. Towards twitter context sum-marization with user influence models. In Proceedings of the sixth ACMinternational conference on Web search and data mining, pages 527–536,2013.
[CXL+06] Y. Cao, J. Xu, T.Y. Liu, H. Li, Y. Huang, and H.W. Hon. Adapting rankingsvm to document retrieval. In Proceedings of the 29th annual international
106
ACM SIGIR conference on Research and development in information re-trieval, pages 186–193. ACM, 2006.
[Dan07] H.T. Dang. Overview of DUC 2007. In Proceedings of Document Under-standing Conference, pages 1–10, 2007.
[Dhi01] I.S. Dhillon. Co-clustering documents and words using bipartite spectralgraph partitioning. In Proceedings of the seventh ACM SIGKDD interna-tional conference on Knowledge discovery and data mining, pages 269–274. ACM, 2001.
[DIM06] H. Daume III and D. Marcu. Bayesian query-focused summarization. InProceedings of the 21st International Conference on Computational Lin-guistics and the 44th annual meeting of the Association for ComputationalLinguistics, pages 305–312. Association for Computational Linguistics,2006.
[DJZL12] Q. Diao, J. Jiang, F. Zhu, and E.P. Lim. Finding bursty topics from mi-croblogs. In Proceedings of the 50th Annual Meeting of the Association forComputational Linguistics, pages 536–544, 2012.
[DLPP06] C. Ding, T. Li, W. Peng, and H. Park. Orthogonal nonnegative matrix t-factorizations for clustering. In Proceedings of the 12th ACM SIGKDDinternational conference on Knowledge discovery and data mining, pages126–135. ACM, 2006.
[DMM08] G. Druck, G. Mann, and A. McCallum. Learning from labeled featuresusing generalized expectation criteria. In Proceedings of the 31st annualinternational ACM SIGIR conference on Research and development in in-formation retrieval, pages 595–602. ACM, 2008.
[DO08] Hoa Trang Dang and Karolina Owczarzak. Overview of the tac 2008 updatesummarization task. In Proceedings of Text Analysis Conference, 2008.
[DSM09] G. Druck, B. Settles, and A. McCallum. Active learning by labeling fea-tures. In Proceedings of the 2009 Conference on Empirical Methods inNatural Language Processing: Volume 1-Volume 1, pages 81–90. Associa-tion for Computational Linguistics, 2009.
[DTR10] D. Davidov, O. Tsur, and A. Rappoport. Enhanced sentiment learning us-ing twitter hashtags and smileys. In Proceedings of the 23th InternationalConference on Computational Linguistics, pages 241–249, 2010.
107
[DWT+14] L. Dong, F. Wei, C. Tan, D. Tang, M. Zhou, and K. Xu. Adaptive recursiveneural network for target-dependent twitter sentiment classification. In Pro-ceedings of the 52nd Annual Meeting of the Association for ComputationalLinguistics, pages 49–54, 2014.
[ER04] Gunes Erkan and Dragomir R Radev. Lexrank: Graph-based lexical cen-trality as salience in text summarization. JAIR, 22(1):457–479, 2004.
[FCW+11] Jennifer Foster, Ozlem Cetinoglu, Joachim Wagner, Joseph Le Roux,Stephen Hogan, Joakim Nivre, Deirdre Hogan, and Josef van Genabith.#hardtoparse: POS tagging and parsing the twitterverse. In Proceedings ofthe AAAI Workshop on Analyzing Microtext, pages 20–25, 2011.
[Fei98] U. Feige. A threshold of lnn for approximating set cover. Journal of theACM, 45(4):634–652, 1998.
[FGM05] Jenny Rose Finkel, Trond Grenager, and Christopher Manning. Incorpo-rating non-local information into information extraction systems by gibbssampling. In Proceedings of the 43rd Annual Meeting on Association forComputational Linguistics, pages 363–370. Association for ComputationalLinguistics, 2005.
[FISS03] Y. Freund, R. Iyer, R.E. Schapire, and Y. Singer. An efficient boostingalgorithm for combining preferences. The Journal of Machine LearningResearch, 4:933–969, 2003.
[Gam04] Michael Gamon. Sentiment classification on customer feedback data: noisydata, large feature vectors, and the role of linguistic analysis. In Proceed-ings of the 20th international conference on Computational Linguistics,pages 834–841, 2004.
[GBH09] A. Go, R. Bhayani, and L. Huang. Twitter sentiment classification usingdistant supervision. CS224N Project Report, Stanford, pages 1–12, 2009.
[GGLNT04] D. Gruhl, R. Guha, D. Liben-Nowell, and A. Tomkins. Information diffu-sion through blogspace. In Proceedings of the 13th international confer-ence on World Wide Web, pages 491–501, 2004.
[GHSC04] S. Godbole, A. Harpale, S. Sarawagi, and S. Chakrabarti. Documentclassification through interactive supervision of document and term labels.Knowledge Discovery in Databases: PKDD 2004, pages 185–196, 2004.
108
[GK98] S. Guha and S. Khuller. Approximation algorithms for connected dominat-ing sets. Algorithmica, 20(4):374–387, 1998.
[GMCK00] J. Goldstein, V. Mittal, J. Carbonell, and M. Kantrowitz. Multi-documentsummarization by sentence extraction. In NAACL-ANLP 2000 Workshopon Automatic summarization, pages 40–48. Association for ComputationalLinguistics, 2000.
[GN02] M. Girvan and M. Newman. Community structure in social and biologicalnetworks. Proceedings of the National Academy of Sciences, 99(12):7821–7826, 2002.
[GSO+11] K. Gimpel, N. Schneider, B. O’Connor, D. Das, D. Mills, J. Eisenstein,M. Heilman, D. Yogatama, J. Flanigan, and N. A. Smith. Part-of-speechtagging for twitter: Annotation, features, and experiments. In Proceedingsof the 49th Annual Meeting of the Association for Computational Linguis-tics: Human Language Technologies, pages 42–47, 2011.
[HGO99] R. Herbrich, T. Graepel, and K. Obermayer. Large margin rank boundariesfor ordinal regression. Advances in Neural Information Processing Systems,pages 115–132, 1999.
[HIMM02] T. Hirao, H. Isozaki, E. Maeda, and Y. Matsumoto. Extracting importantsentences with support vector machines. In Proceedings of the 19th Inter-national Conference on Computational Linguistics, pages 1–7. Associationfor Computational Linguistics, 2002.
[HJ07] B. Han and W. Jia. Clustering wireless ad hoc networks with weakly con-nected dominating set. Journal of Parallel and Distributed Computing,67(6):727–737, 2007.
[Hof99] T. Hofmann. Probabilistic latent semantic indexing. In Proceedings of the22th annual international ACM SIGIR conference on Research and devel-opment in information retrieval, pages 50–57, 1999.
[HTTL13] X. Hu, L. Tang, J. Tang, and H. Liu. Exploiting social relations for senti-ment analysis in microblogging. In Proceedings of the sixth ACM interna-tional conference on Web search and data mining, pages 537–546. ACM,2013.
[HV09] A. Haghighi and L. Vanderwende. Exploring content models for multi-document summarization. In Proceedings of Human Language Technolo-
109

gies: The 2009 Annual Conference of the North American Chapter of theAssociation for Computational Linguistics, pages 362–370. Association forComputational Linguistics, 2009.
[JM08] D. Jurafsky and J.H. Martin. Speech and language processing. PrenticeHall New York, 2008.
[Joa02] T. Joachims. Optimizing search engines using clickthrough data. In Pro-ceedings of the eighth ACM SIGKDD international conference on Knowl-edge discovery and data mining, pages 133–142. ACM, 2002.
[Joa06] Thorsten Joachims. Training linear svms in linear time. In Proceedings ofthe 12th ACM SIGKDD international conference on Knowledge discoveryand data mining, pages 217–226. ACM, 2006.
[Joh73] D.S. Johnson. Approximation algorithms for combinatorial problems. InProceedings of the fifth annual ACM symposium on Theory of computing,pages 38–49. ACM New York, NY, USA, 1973.
[JWL+06] F. Jiao, S. Wang, C.H. Lee, R. Greiner, and D. Schuurmans. Semi-supervised conditional random fields for improved sequence segmentationand labeling. In Proceedings of the 21st International Conference on Com-putational Linguistics and the 44th annual meeting of the Association forComputational Linguistics, pages 209–216. Association for ComputationalLinguistics, 2006.
[JYZ+11] L. Jiang, M. Yu, M. Zhou, X. Liu, and T. Zhao. Target-dependent twittersentiment classification. In Proceedings of the 49th Annual Meeting of theAssociation for Computational Linguistics, pages 151–160, 2011.
[KA04] G. Kumaran and J. Allan. Text classification and named entities for newevent detection. In Proceedings of the 27th annual international ACMSIGIR conference on Research and development in information retrieval,pages 297–304. ACM, 2004.
[Kan92] V. Kann. On the approximability of NP-complete optimization problems.PhD thesis, Department of Numerical Analysis and Computing Science,Royal Institute of Technology, Stockholm., 1992.
[KH09] A. M Kaplan and M. Haenlein. The fairyland of second life: Virtual socialworlds and how to use them. Business horizons, 52(6):563–572, 2009.
110

[KKT03] D. Kempe, J. Kleinberg, and E. Tardos. Maximizing the spread of influ-ence through a social network. In Proceedings of the ninth ACM SIGKDDinternational conference on Knowledge discovery and data mining, pages137–146, 2003.
[Kle00] J. Kleinberg. The small-world phenomenon: An algorithmic perspective.In Proceedings of the thirty-second annual ACM symposium on Theory ofcomputing, pages 163–170. ACM, 2000.
[KM02] K. Knight and D. Marcu. Summarization beyond sentence extraction: Aprobabilistic approach to sentence compression. Artificial Intelligence,139(1):91–107, 2002.
[KPC95] J. Kupiec, J. Pedersen, and F. Chen. A trainable document summarizer.In Proceedings of the 18th annual international ACM SIGIR conference onResearch and development in information retrieval, pages 68–73. ACM,1995.
[KW06] G. Kossinets and D. Watts. Empirical analysis of an evolving social net-work. Science, 311(5757):88–90, 2006.
[L.99] Lillian L. Measures of distributional similarity. In Proceedings of the 37thAnnual Meeting of the Association for Computational Linguistics, pages25–32, 1999.
[LCR01] D. Lawrie, W.B. Croft, and A. Rosenberg. Finding topic words for hier-archical summarization. In Proceedings of the 24th annual internationalACM SIGIR conference on Research and development in information re-trieval, pages 349–357, 2001.
[LH03] C.Y. Lin and E. Hovy. Automatic evaluation of summaries using n-gram co-occurrence statistics. In Proceedings of the 2003 Conference of the NorthAmerican Chapter of the Association for Computational Linguistics on Hu-man Language Technology, pages 71–78, 2003.
[LHZL09] C. Long, M. Huang, X. Zhu, and M. Li. Multi-document summarizationby information distance. In 2009 Ninth IEEE International Conference onData Mining, pages 866–871. IEEE, 2009.
[Lin04] Chin-Yew Lin. ROUGE: A package for automatic evaluation of summaries.In Text Summarization Branches Out: Proceedings of the ACL-04 Work-shop, pages 74–81, 2004.
111
[Liu09] T.Y. Liu. Learning to rank for information retrieval. Now Pub, 2009.
[LLM10] J. Leskovec, K. Lang, and M. Mahoney. Empirical comparison of algo-rithms for network community detection. In Proceedings of the 19th inter-national conference on World wide web, pages 631–640, 2010.
[LMP01] J. Lafferty, A. McCallum, and F. Pereira. Conditional random fields: Proba-bilistic models for segmenting and labeling sequence data. In Proceedingsof the Eighteenth International Conference on Machine Learning, pages282–289, 2001.
[LNK07] D. Liben-Nowell and J. Kleinberg. The link-prediction problem for socialnetworks. Journal of the American society for information science andtechnology, 58(7):1019–1031, 2007.
[LZS09] T. Li, Y. Zhang, and V. Sindhwani. A non-negative matrix tri-factorizationapproach to sentiment classification with lexical prior knowledge. In Pro-ceedings of the Joint Conference of the 47th Annual Meeting of the ACLand the 4th International Joint Conference on Natural Language Process-ing of the AFNLP: Volume 1-Volume 1, pages 244–252. Association forComputational Linguistics, 2009.
[Man01] I. Mani. Automatic summarization. Computational Linguistics, 28(2),2001.
[MBB+11] A. Marcus, M. Bernstein, O. Badar, D. Karger, S. Madden, and R. Miller.Twitinfo: Aggregating and visualizing microblogs for event exploration. InProceedings of the SIGCHI Conference on Human Factors in ComputingSystems, pages 227–236, 2011.
[MC04] T. Mullen and N. Collier. Sentiment analysis using support vector machineswith diverse information sources. In Proceedings of the Conference onEmpirical Methods in Natural Language Processing, pages 412–418, 2004.
[MGL09] P. Melville, W. Gryc, and R.D. Lawrence. Sentiment analysis of blogs bycombining lexical knowledge with text classification. In Proceedings of the15th ACM SIGKDD international conference on Knowledge discovery anddata mining, pages 1275–1284. ACM, 2009.
[ML03] Andrew McCallum and Wei Li. Early results for named entity recogni-tion with conditional random fields, feature induction and web-enhanced
112

lexicons. In Proceedings of the seventh conference on Natural languagelearning at HLT-NAACL 2003-Volume 4, pages 188–191. Association forComputational Linguistics, 2003.
[MMS93] M. Marcus, M. Marcinkiewicz, and B. Santorini. Building a large anno-tated corpus of english: The penn treebank. Computational linguistics,19(2):313–330, 1993.
[MN98] A.K. McCallum and K. Nigam. Employing EM and pool-based activelearning for text classification. In Machine Learning: Proceedings of theFifteenth International Conference, ICML. Citeseer, 1998.
[MS09] P. Melville and V. Sindhwani. Active dual supervision: Reducing the cost ofannotating examples and features. In Proceedings of the NAACL HLT 2009Workshop on Active Learning for Natural Language Processing, pages 49–57. Association for Computational Linguistics, 2009.
[MSTPM05] P. Melville, M. Saar-Tsechansky, F. Provost, and R. Mooney. An expectedutility approach to active feature-value acquisition. In Data Mining, FifthIEEE International Conference on, pages 745–748. IEEE, 2005.
[Nas08] V. Nastase. Topic-driven multi-document summarization with encyclope-dic knowledge and spreading activation. In Proceedings of the Conferenceon Empirical Methods in Natural Language Processing, pages 763–772.Association for Computational Linguistics, 2008.
[NMD12] J. Nichols, J. Mahmud, and C. Drews. Summarizing sporting events us-ing twitter. In Proceedings of the 2012 ACM Interntional Conference onIntelligent User Interfaces, pages 189–198, 2012.
[NV05] A. Nenkova and L. Vanderwende. The impact of frequency on summa-rization. Microsoft Research, Redmond, Washington, Tech. Rep. MSR-TR-2005-101, 2005.
[NVM06] A. Nenkova, L. Vanderwende, and K. McKeown. A compositional con-text sensitive multi-document summarizer: exploring the factors that influ-ence summarization. In Proceedings of the 29th annual international ACMSIGIR conference on Research and development in information retrieval,pages 573–580. ACM, 2006.
[OER05] J. Otterbacher, G. Erkan, and D.R. Radev. Using random walks forquestion-focused sentence retrieval. In Proceedings of the conference on
113
Human Language Technology and Empirical Methods in Natural LanguageProcessing, pages 915–922. Association for Computational Linguistics,2005.
[OKA10] B. O’Connor, M. Krieger, and D. Ahn. TweetMotif: Exploratory search andtopic summarization for twitter. In Proceedings of the Fourth InternationalAAAI Conference on Weblogs and Social Media, pages 384–385, 2010.
[OLL07] Y. Ouyang, S. Li, and W. Li. Developing learning strategies for topic-based summarization. In Proceedings of the sixteenth ACM conferenceon Conference on information and knowledge management, pages 79–86.ACM, 2007.
[OOD+13] O. Owoputi, B. OConnor, C. Dyer, K. Gimpel, N. Schneider, and N. Smith.Improved part-of-speech tagging for online conversational text with wordclusters. In Proceedings of NAACL-HLT, pages 380–390, 2013.
[PLV02] B. Pang, L. Lee, and S. Vaithyanathan. Thumbs up?: sentiment classifica-tion using machine learning techniques. In Proceedings of the conferenceon Empirical methods in natural language processing, pages 79–86. Asso-ciation for Computational Linguistics, 2002.
[POL10] S. Petrovic, M. Osborne, and V. Lavrenko. Streaming first story detectionwith application to twitter. In Proceedings of the 2010 Annual Conferenceof the North American Chapter of the Association for Computational Lin-guistics, pages 181–189, 2010.
[PRV07] P. Pingali, K. Rahul, and V. Varma. IIIT Hyderabad at DUC 2007. InProceedings of DUC 2007, 2007.
[RA07] H. Raghavan and J. Allan. An interactive algorithm for asking and incor-porating feature feedback into support vector machines. In Proceedingsof the 30th annual international ACM SIGIR conference on Research anddevelopment in information retrieval, pages 79–86. ACM, 2007.
[RCME11] A. Ritter, S. Clark, Mausam, and O. Etzioni. Named entity recognition intweets: An experimental study. In Proceedings of the Conference on Em-pirical Methods in Natural Language Processing, pages 1524–1534, 2011.
[Reh13] Ines Rehbein. Fine-grained pos tagging of german tweets. In LanguageProcessing and Knowledge in the Web, pages 162–175. Springer, 2013.
114
[RJST04] D.R. Radev, H. Jing, M. Stys, and D. Tam. Centroid-based summariza-tion of multiple documents. Information Processing and Management,40(6):919–938, 2004.
[RMEC12] A. Ritter, Mausam, O. Etzioni, and S. Clark. Open domain event extrac-tion from twitter. In Proceedings of the 18th ACM SIGKDD InternationalConference on Knowledge Discovery and Data Mining, pages 1104–1112,2012.
[RMJ06] H. Raghavan, O. Madani, and R. Jones. Active learning with feedbackon features and instances. The Journal of Machine Learning Research,7:1655–1686, 2006.
[RS97] R. Raz and S. Safra. A sub-constant error-probability low-degree test, and asub-constant error-probability PCP characterization of NP. In Proceedingsof the twenty-ninth annual ACM symposium on Theory of computing, pages475–484. ACM New York, NY, USA, 1997.
[SBC03] H. Saggion, K. Bontcheva, and H. Cunningham. Robust generic and query-based summarisation. In 10th Conference of the European Chapter of theAssociation for Computational Linguistics, pages 235–238, 2003.
[Set09] B. Settles. Active Learning Literature Survey. Technical Report 1648,2009.
[SHM09] V. Sindhwani, J. Hu, and A. Mojsilovic. Regularized co-clustering withdual supervision. In Advances in Neural Information Processing Systems,pages 1505–1512, 2009.
[SL10] C. Shen and T. Li. Multi-document summarization via the minimum dom-inating set. In Proceedings of the 23rd International Conference on Com-putational Linguistics, pages 984–992. Association for Computational Lin-guistics, 2010.
[SL11a] C. Shen and T. Li. Learning to rank for query-focused multi-documentsummarization. In Data Mining (ICDM), 2011 IEEE 11th InternationalConference on, pages 626–634. IEEE, 2011.
[SL11b] C. Shen and T. Li. A non-negative matrix factorization based approach foractive dual supervision from document and word labels. In Proceedingsof the Conference on Empirical Methods in Natural Language Processing,pages 949–958. Association for Computational Linguistics, 2011.
115

[SLWL13] C. Shen, F. Liu, F. Weng, and T. Li. A participant-based approach forevent summarization using twitter streams. In Proceedings of NAACL-HLT,pages 1152–1162, 2013.
[SM08] V. Sindhwani and P. Melville. Document-word co-regularization for semi-supervised sentiment analysis. In Proceedings of Data Mining, EighthIEEE International Conference on, pages 1025–1030. IEEE, 2008.
[SML09] V. Sindhwani, P. Melville, and R.D. Lawrence. Uncertainty sampling andtransductive experimental design for active dual supervision. In Proceed-ings of the 26th Annual International Conference on Machine Learning,pages 953–960. ACM, 2009.
[SMR07] C. Sutton, A. McCallum, and K. Rohanimanesh. Dynamic conditional ran-dom fields: Factorized probabilistic models for labeling and segmentingsequence data. The Journal of Machine Learning Research, 8:693–723,2007.
[SP03] F. Sha and F. Pereira. Shallow parsing with conditional random fields.In Proceedings of the 2003 Conference of the North American Chapterof the Association for Computational Linguistics on Human LanguageTechnology-Volume 1, pages 134–141. Association for Computational Lin-guistics, 2003.
[SSL+07] D. Shen, J.T. Sun, H. Li, Q. Yang, and Z. Chen. Document summarizationusing conditional random fields. In Proceedings of IJCAI, volume 7, pages2862–2867, 2007.
[STUB08] T. Sandler, P.P. Talukdar, L.H. Ungar, and J. Blitzer. Regularized learningwith networks of features. Advances in Neural Information ProcessingSystems, pages 1401–1408, 2008.
[TGRM08] M. Taylor, J. Guiver, S. Robertson, and T. Minka. SoftRank: optimizingnon-smooth rank metrics. In Proceedings of the international conferenceon Web search and web data mining, pages 77–86. ACM, 2008.
[TK02] Simon Tong and Daphne Koller. Support vector machine active learningwith applications to text classification. The Journal of Machine LearningResearch, 2:45–66, 2002.
[TKMS03] Kristina Toutanova, Dan Klein, Christopher D Manning, and Yoram Singer.Feature-rich part-of-speech tagging with a cyclic dependency network.
116

In Proceedings of the 2003 Conference of the North American Chapterof the Association for Computational Linguistics on Human LanguageTechnology-Volume 1, pages 173–180. Association for Computational Lin-guistics, 2003.
[TLT+11] C. Tan, L. Lee, J. Tang, L. Jiang, M. Zhou, and P. Li. User-level senti-ment analysis incorporating social networks. In Proceedings of the 17thACM SIGKDD international conference on Knowledge discovery and datamining, pages 1397–1405. ACM, 2011.
[TSWY09] Jie Tang, Jimeng Sun, Chi Wang, and Zi Yang. Social influence analysisin large-scale networks. In Proceedings of the 15th ACM SIGKDD inter-national conference on Knowledge discovery and data mining, pages 807–816, 2009.
[TYC09] J. Tang, L. Yao, and D. Chen. Multi-topic based Query-oriented Summa-rization. In Proceedings of SDM, pages 1147–1158, 2009.
[TYO11] Hiroya Takamura, Hikaru Yokono, and Manabu Okumura. Summarizinga document stream. In Proceedings of the 33rd European Conference onAdvances in Information Retrieval, pages 177–188, 2011.
[TZTX07] M.T. Thai, N. Zhang, R. Tiwari, and X. Xu. On approximation algorithmsof k-connected m-dominating sets in disk graphs. Theoretical ComputerScience, 385(1-3):49–59, 2007.
[Wan09] Xiaojun Wan. Topic analysis for topic-focused multi-document summa-rization. In Proceedings of the 18th ACM conference on Information andknowledge management, pages 1609–1612. ACM, 2009.
[WL01] J. Wu and H. Li. A dominating-set-based routing scheme in ad hoc wirelessnetworks. Telecommunication Systems, 18(1):13–36, 2001.
[WL11] Jianshu Weng and Bu-Sung Lee. Event detection in twitter. In Proceedingsof the Fifth International AAAI Conference on Weblogs and Social Media,pages 401–408, 2011.
[WLJH10] J. Weng, E.P. Lim, J. Jiang, and Q. He. Twitterrank: finding topic-sensitiveinfluential twitterers. In Proceedings of the third ACM international con-ference on Web search and data mining, pages 261–270, 2010.
117
[WLLH08] F. Wei, W. Li, Q. Lu, and Y. He. Query-sensitive mutual reinforcementchain and its application in query-oriented multi-document summarization.In Proceedings of the 31st annual international ACM SIGIR conference onResearch and development in information retrieval, pages 283–290. ACM,2008.
[WLZD08] Dingding Wang, Tao Li, Shenghuo Zhu, and Chris Ding. Multi-documentsummarization via sentence-level semantic analysis and symmetric matrixfactorization. In Proceedings of the 31st annual international ACM SIGIRconference on Research and development in information retrieval, pages307–314. ACM, 2008.
[WWH05] T. Wilson, J. Wiebe, and P. Hoffmann. Recognizing contextual polarityin phrase-level sentiment analysis. In Proceedings of the conference onhuman language technology and empirical methods in natural languageprocessing, pages 347–354, 2005.
[WX09] X. Wan and J. Xiao. Graph-Based Multi-Modality Learning for Topic-Focused Multi-Document Summarization. In Proceedings of IJCAI, pages1586–1591, 2009.
[WYX07a] X. Wan, J. Yang, and J. Xiao. Manifold-ranking based topic-focused multi-document summarization. In Proceedings of IJCAI, pages 2903–2908,2007.
[WYX07b] X. Wan, J. Yang, and J. Xiao. Towards an iterative reinforcement approachfor simultaneous document summarization and keyword extraction. In Pro-ceedings of the 45th annual meeting of the Association for ComputationalLinguistics, pages 543–552, 2007.
[WZLG09a] D. Wang, S. Zhu, T. Li, and Y. Gong. Comparative document summariza-tion via discriminative sentence selection. In Proceeding of the 18th ACMconference on Information and knowledge management, pages 1963–1966.ACM, 2009.
[WZLG09b] D. Wang, S. Zhu, T. Li, and Y. Gong. Multi-document summarizationusing sentence-based topic models. In Proceedings of the ACL-IJCNLP2009 Conference Short Papers, pages 297–300, 2009.
[XCLH06] J. Xu, Y. Cao, H. Li, and Y. Huang. Cost-sensitive learning of SVM forranking. In Proceedings of ECML, pages 833–840, 2006.
118

[YC10] Jiang Yang and Scott Counts. Predicting the speed, scale, and range ofinformation diffusion in twitter. ICWSM, pages 355–358, 2010.
[YL10] Jaewon Yang and Jure Leskovec. Modeling information diffusion in im-plicit networks. In Data Mining, 2010 IEEE 10th International Conferenceon, pages 599–608. IEEE, 2010.
[YPC98] Yiming Yang, Tom Pierce, and Jaime Carbonell. A study of retrospectiveand on-line event detection. In Proceedings of the 21st annual interna-tional ACM SIGIR conference on Research and development in informationretrieval, pages 28–36. ACM, 1998.
[ZE08] Omar F. Zaidan and Jason Eisner. Modeling annotators: A generative ap-proach to learning from annotator rationales. In Proceedings of the Confer-ence on Empirical Methods in Natural Language Processing, pages 31–40,2008.
[ZGD+11] L. Zhang, R. Ghosh, M. Dekhil, M. Hsu, and B. Liu. Combining lexicon-based and learning-based methods for twitter sentiment analysis. HP Lab-oratories, Technical Report HPL-2011, 89, 2011.
[ZH03] L. Zhou and E. Hovy. A web-trained extraction summarization system. InProceedings of the 2003 Conference of the North American Chapter of theAssociation for Computational Linguistics on Human Language Technol-ogy, pages 205–211. Association for Computational Linguistics, 2003.
[ZHD+01] H. Zha, X. He, C. Ding, H. Simon, and M. Gu. Bipartite graph partitioningand data clustering. In Proceedings of the tenth international conferenceon Information and knowledge management, pages 25–32. ACM, 2001.
[ZHW05] L. Zhao, X. Huang, and L. Wu. Fudan University at DUC 2005. In Pro-ceedings of DUC, 2005.
[ZSAG12] Arkaitz Zubiaga, Damiano Spina, Enrique Amigo, and Julio Gonzalo. To-wards real-time summarization of scheduled events from twitter streams. InProceedings of the 23rd ACM Conference on Hypertext and Social Media,pages 319–320, 2012.
[ZZW+12] Siqi Zhao, Lin Zhong, Jehan Wickramasuriya, Venu Vasudevan, RobertLiKamWa, and Ahmad Rahmati. Sportsense: Real-time detection of NFLgame events from twitter. Technical Report TR0511-2012, 2012.
119

[ZZWV11] Siqi Zhao, Lin Zhong, Jehan Wickramasuriya, and Venu Vasudevan. Hu-man as real-time sensors of social and physical events: A case study oftwitter and sports games. Technical Report TR0620-2011, Rice Universityand Motorola Labs, 2011.
120
VITA
CHAO SHEN
2006 B.S. of Computer ScienceFudan UniversityShanghai, P.R.China
2009 M.S. of Computer Application TechnologyFudan UniversityShanghai, P.R.China
2009-2014 Doctoral CandidateFlorida International UniversityMiami, FL, USA
PUBLICATIONS
• Wubai Zhou, Chao Shen, Tao Li, Shu-Ching Chen, Ning Xie, Jinpeng Wei. Gen-erating textual storyline to improve situation awareness in disaster management.In Proceedings of 2014 IEEE 13th International Conference on Information Reuseand Integration, 2014
• Wubai Zhou, Chao Shen, Tao Li, Shu-Ching Chen, Ning Xie, Jinpeng Wei. ABipartite-Graph Based Approach for Disaster Susceptibility Comparisons amongCities. In Proceedings of 2014 IEEE 13th International Conference on InformationReuse and Integration, 2014
• Li Zheng, Chao Shen, Liang Tang, Chunqiu Zeng, Tao Li, Steve Luis, and Shu-Ching Chen. Data Mining Meets the Needs of Disaster Information Management.In IEEE Transactions on Human-Machine Systems on 43 (5), 451-464, 2013
• Chunqiu Zeng, Yexi Jiang, Li Zheng, Jingxuan Li, Lei Li, Hongtai Li, Chao Shen,Wubai Zhou, Tao Li, Bing Duan, Ming Lei, and Pengnian Wang. FIU-Miner: AFast, Integrated, and User-Friendly System for Data Mining in Distributed Envi-ronment. In Proceedings of the 19th ACM SIGKDD international conference onKnowledge discovery and data mining, pages 1506-1509, 2013
• Chao Shen, Fei Liu, Fuliang Weng and Tao Li. A Participant-based Approach forEvent Summarization Using Twitter Streams. In Proceedings of the 2013 Confer-ence of the North American Chapter of the Association for Computational Linguis-tics: Human Language Technologies, pages 1152-1162, 2013
121
• Li Zheng, Chao Shen, Liang Tang, Chunqiu Zeng, Tao Li, Steve Luis, Shu-ChingChen and Jainendra K. Navlakha. Disaster SitRep - A Vertical Search Engine andInformation Analysis Tool in Disaster Management Domain. In Proceedings of2012 IEEE 13th International Conference on Information Reuse and Integration,pages 457-465, 2012
• Chao Shen, and Tao Li. Learning to Rank for Query-focused Multi-document Sum-marization. In Proceedings of 2011 IEEE 11th International Conference on DataMining, pages 626-634, 2011
• Chao Shen, and Tao Li. A Non-negative Matrix Factorization Based Approach forActive Dual Supervision from Document and Word Labels. In Proceedings of theConference on Empirical Methods in Natural Language Processing, 2011.
• Chao Shen, Tao Li, and Chris H.Q. Ding. Integrating Clustering and Multi-DocumentSummarization by Bi-mixture Probabilistic Latent Semantic Analysis (PLSA) withSentence Bases. In Proceedings of the 25th AAAI conference on artificial intelli-gence, pages 914-920, 2011.
• Li Zheng, Chao Shen, Liang Tang, Tao Li, Steve Luis, and Shu-Ching Chen. Ap-plying data mining techniques to address disaster information management chal-lenges on mobile devices. In Proceedings of the 17th ACM SIGKDD internationalconference on Knowledge discovery and data mining, pages 283-291, 2011.
• Chao Shen, Dingding Wang, and Tao Li. Topic Aspect Analysis for Multi-DocumentSummarization. In Proceedings of the 19th ACM international conference on In-formation and knowledge management, pages 1545-1548, 2010.
• Chao Shen and Tao Li, Multi-Document Summarization via the Minimum Domi-nating Set. In Proceedings of the 23rd International Conference on ComputationalLinguistics, pages 984-992, 2010.
• Li Zheng, Chao Shen, Liang Tang, Tao Li, Steve Luis, Shu-Ching Chen, and VagelisHristidis. Using Data Mining Techniques to Address Critical Information ExchangeNeeds in Disaster Aected Public-Private Networks. In Proceedings of the 16th ACMSIGKDD international conference on Knowledge discovery and data mining, 2010.
• Lei Li, Dingding Wang, Chao Shen, and Tao Li. Ontology-Enriched Multi-documentSummarization in Disaster Management. In Proceedings of the 33rd internationalACM SIGIR conference on Research and development in information retrieval,pages 819-820, 2010.
122
Related Documents


![About Gary Cokins Analytics-based Enterprise Performance ...€¦ · Text analytics [sentiment analysis] Financial control analytics [customer payment collections] Fraud analytics](https://static.cupdf.com/doc/110x72/5ead86e624621d20c233a78f/about-gary-cokins-analytics-based-enterprise-performance-text-analytics-sentiment.jpg)