Texas's International and Domestic Ports-to-Plains Region Trading Relationships 2004 2010 2011 2010-2011 Difference 2010-2011 % Change 2004-2011 Difference 2004-2011 % Change Mexico Total Truck Exports $35,339,349,332 $51,867,182,618 $57,165,237,309 $5,298,054,691 10.2% $21,825,887,977 61.8% Imports $31,742,554,165 $49,818,987,283 $54,959,944,634 $5,140,957,351 10.3% $23,217,390,469 73.1% Total Truck Trade with Mexico $67,081,903,497 $101,686,169,901 $112,125,181,943 $10,439,012,042 10.3% $45,043,278,446 67.1% #DIV/0! Rail Exports $5,345,839,012 $5,846,849,373 $7,159,117,063 $1,312,267,690 22.4% $1,813,278,051 33.9% Imports $1,495,624,651 $3,969,646,721 $5,244,696,290 $1,275,049,569 32.1% $3,749,071,639 250.7% Total Rail Trade with Mexico $6,841,463,663 $9,816,496,094 $12,403,813,353 $2,587,317,259 26.4% $5,562,349,690 81.3% #DIV/0! TOTAL Exports $40,685,188,344 $57,714,031,991 $64,324,354,372 $6,610,322,381 11.5% $23,639,166,028 58.1% Imports $33,238,178,816 $53,788,634,004 $60,204,640,924 $6,416,006,920 11.9% $26,966,462,108 81.1% Total Trade with Mexico $73,923,367,160 $111,502,665,995 $124,528,995,296 $13,026,329,301 11.7% $50,605,628,136 68.5% Laredo, TX Truck Exports $7,754,720,626 $16,106,972,356 $19,031,032,362 $2,924,060,006 18.2% $11,276,311,736 145.4% % of Total Exports to Mexico 21.9% 31.1% 33.3% 2.2% 11.3% Imports $7,849,455,339 $13,129,317,362 $14,671,364,239 $1,542,046,877 11.7% $6,821,908,900 86.9% % of Total Imports to Mexico 24.7% 26.4% 26.7% 0.3% 2.0% Total Truck Trade Thru Laredo $15,604,175,965 $29,236,289,718 $33,702,396,601 $4,466,106,883 15.3% $18,098,220,636 116.0% % Total Trade with Mexico 23.3% 28.8% 30.1% 1.3% 6.8% Rail Exports $4,115,623,152 $4,113,813,500 $4,805,455,420 $691,641,920 16.8% $689,832,268 16.8% % of Total Exports to Mexico 77.0% 70.4% 67.1% -3.2% -9.9% Imports $1,321,933,932 $2,483,809,295 $3,182,973,751 $699,164,456 28.1% $1,861,039,819 140.8% % of Total Imports to Mexico 88.4% 62.6% 60.7% -1.9% -27.7% Total Rail Trade Thru Laredo $5,437,557,084 $6,597,622,795 $7,988,429,171 $1,390,806,376 21.1% $2,550,872,087 46.9% % Total Trade with Mexico 79.5% 67.2% 64.4% -2.8% -15.1% TOTAL Exports $11,870,343,778 $20,220,785,856 $23,836,487,782 $3,615,701,926 17.9% $11,966,144,004 100.8% % of Total Exports to Mexico 29.2% 35.0% 37.1% 2.0% 7.9% Imports $9,171,389,271 $15,613,126,657 $17,854,337,990 $2,241,211,333 14.4% $8,682,948,719 94.7% % of Total Imports to Mexico 27.6% 29.0% 29.7% 0.6% 2.1% Total Trade Thru Laredo $21,041,733,049 $35,833,912,513 $41,690,825,772 $5,856,913,259 16.3% $20,649,092,723 98.1% % Total Trade with Mexico 28.5% 32.1% 33.5% 1.3% 5.0% Texas -- Page 1

Texas Trade Relationships 2004 - 2011
Jul 13, 2015
Welcome message from author
This document is posted to help you gain knowledge. Please leave a comment to let me know what you think about it! Share it to your friends and learn new things together.
Transcript

Texas's International and Domestic Ports-to-Plains Region Trading Relationships
2004 2010 20112010-2011 Difference
2010-2011 % Change
2004-2011 Difference
2004-2011 % Change
Mexico TotalTruck Exports $35,339,349,332 $51,867,182,618 $57,165,237,309 $5,298,054,691 10.2% $21,825,887,977 61.8%
Imports $31,742,554,165 $49,818,987,283 $54,959,944,634 $5,140,957,351 10.3% $23,217,390,469 73.1%Total Truck Trade with Mexico $67,081,903,497 $101,686,169,901 $112,125,181,943 $10,439,012,042 10.3% $45,043,278,446 67.1%
#DIV/0!Rail Exports $5,345,839,012 $5,846,849,373 $7,159,117,063 $1,312,267,690 22.4% $1,813,278,051 33.9%
Imports $1,495,624,651 $3,969,646,721 $5,244,696,290 $1,275,049,569 32.1% $3,749,071,639 250.7%Total Rail Trade with Mexico $6,841,463,663 $9,816,496,094 $12,403,813,353 $2,587,317,259 26.4% $5,562,349,690 81.3%
#DIV/0!TOTAL Exports $40,685,188,344 $57,714,031,991 $64,324,354,372 $6,610,322,381 11.5% $23,639,166,028 58.1%
Imports $33,238,178,816 $53,788,634,004 $60,204,640,924 $6,416,006,920 11.9% $26,966,462,108 81.1%Total Trade with Mexico $73,923,367,160 $111,502,665,995 $124,528,995,296 $13,026,329,301 11.7% $50,605,628,136 68.5%
Laredo, TX
Truck Exports $7,754,720,626 $16,106,972,356 $19,031,032,362 $2,924,060,006 18.2% $11,276,311,736 145.4%% of Total Exports to Mexico 21.9% 31.1% 33.3% 2.2% 11.3%
Imports $7,849,455,339 $13,129,317,362 $14,671,364,239 $1,542,046,877 11.7% $6,821,908,900 86.9%% of Total Imports to Mexico 24.7% 26.4% 26.7% 0.3% 2.0%
Total Truck Trade Thru Laredo $15,604,175,965 $29,236,289,718 $33,702,396,601 $4,466,106,883 15.3% $18,098,220,636 116.0%% Total Trade with Mexico 23.3% 28.8% 30.1% 1.3% 6.8%
Rail Exports $4,115,623,152 $4,113,813,500 $4,805,455,420 $691,641,920 16.8% $689,832,268 16.8%% of Total Exports to Mexico 77.0% 70.4% 67.1% -3.2% -9.9%
Imports $1,321,933,932 $2,483,809,295 $3,182,973,751 $699,164,456 28.1% $1,861,039,819 140.8%% of Total Imports to Mexico 88.4% 62.6% 60.7% -1.9% -27.7%
Total Rail Trade Thru Laredo $5,437,557,084 $6,597,622,795 $7,988,429,171 $1,390,806,376 21.1% $2,550,872,087 46.9%% Total Trade with Mexico 79.5% 67.2% 64.4% -2.8% -15.1%
TOTALExports $11,870,343,778 $20,220,785,856 $23,836,487,782 $3,615,701,926 17.9% $11,966,144,004 100.8%
% of Total Exports to Mexico 29.2% 35.0% 37.1% 2.0% 7.9%Imports $9,171,389,271 $15,613,126,657 $17,854,337,990 $2,241,211,333 14.4% $8,682,948,719 94.7%
% of Total Imports to Mexico 27.6% 29.0% 29.7% 0.6% 2.1%Total Trade Thru Laredo $21,041,733,049 $35,833,912,513 $41,690,825,772 $5,856,913,259 16.3% $20,649,092,723 98.1%
% Total Trade with Mexico 28.5% 32.1% 33.5% 1.3% 5.0%
Texas -- Page 1

Texas's International and Domestic Ports-to-Plains Region Trading Relationships
2004 2010 20112010-2011 Difference
2010-2011 % Change
2004-2011 Difference
2004-2011 % Change
Eagle Pass, TX
Truck Exports $1,018,448,038 $1,512,432,441 $1,980,465,136 $468,032,695 30.9% $962,017,098 94.5%% of Total Exports to Mexico 2.9% 2.9% 3.5% 0.5% 0.6%
Imports $750,224,391 $1,426,428,960 $1,527,550,523 $101,121,563 7.1% $777,326,132 103.6%% of Total Imports to Mexico 2.4% 2.9% 2.8% -0.1% 0.4%
Total Truck Trade Thru Eagle Pass $1,768,672,429 $2,938,861,401 $3,508,015,659 $569,154,258 19.4% $1,739,343,230 98.3%% Total Trade with Mexico 2.6% 2.9% 3.1% 0.2% 0.5%
Rail Exports $639,784,487 $894,826,764 $1,244,517,353 $349,690,589 39.1% $604,732,866 94.5%% of Total Exports to Mexico 12.0% 15.3% 17.4% 2.1% 5.4%
Imports $88,159,218 $699,757,313 $1,197,094,928 $497,337,615 71.1% $1,108,935,710 1257.9%% of Total Imports to Mexico 0.0% 17.6% 22.8% 5.2% 22.8%
Total Rail Trade Thru Eagle Pass $727,943,705 $1,594,584,077 $2,441,612,281 $847,028,204 53.1% $1,713,668,576 235.4%% Total Trade with Mexico 10.6% 16.2% 19.7% 3.4% 9.0%
TOTALExports $1,658,232,525 $2,407,259,205 $3,224,982,489 $817,723,284 34.0% $1,566,749,964 94.5%
% of Total Exports to Mexico 4.1% 4.2% 5.0% 0.8% 0.9%Imports $838,383,609 $2,126,186,273 $2,724,645,451 $598,459,178 104.1% $1,886,261,842 225.0%
% of Total Imports to Eagle Pass 2.5% 4.0% 4.5% 0.6% 2.0%Total Trade Thru Laredo $2,496,616,134 $4,533,445,478 $5,949,627,940 $1,416,182,462 31.2% $3,453,011,806 138.3%
% Total Trade with Mexico 3.4% 4.1% 4.8% 0.7% 1.4%
Texas -- Page 2

Texas's International and Domestic Ports-to-Plains Region Trading Relationships
2004 2010 20112010-2011 Difference
2010-2011 % Change
2004-2011 Difference
2004-2011 % Change
Del Rio, TX
Truck Exports $1,203,604,069 $1,276,809,320 $1,463,989,926 $187,180,606 14.7% $260,385,857 21.6%% of Total Exports to Mexico 3.4% 2.5% 2.6% 0.1% -0.8%
Imports $1,222,959,383 $1,188,557,446 $1,381,494,754 $192,937,308 16.2% $158,535,371 13.0%% of Total Imports to Mexico 3.9% 2.4% 2.5% 0.1% -1.3%
Total Truck Trade Thru Del Rio $2,426,563,452 $2,465,366,766 $2,845,484,680 $380,117,914 15.4% $418,921,228 17.3%% Total Trade with Mexico 3.6% 2.4% 2.5% 0.1% -1.1%
Rail Exports $0 #DIV/0!% of Total Exports to Mexico 0.0% #DIV/0! #DIV/0! #DIV/0!
Imports $0 #DIV/0!% of Total Imports to Mexico 0.0% #DIV/0! #DIV/0! #DIV/0!
Total Rail Trade Thru Del Rio $0 #DIV/0!% Total Trade with Mexico 0.0% 0.0% 0.0% 0.0%
TOTALExports $1,203,604,069 $1,276,809,320 $1,463,989,926 $187,180,606 14.7% $260,385,857 21.6%
% of Total Exports to Mexico 3.0% 2.2% 2.3% 0.1% -0.7%Imports $1,222,959,383 $1,188,557,446 $1,381,494,754 $192,937,308 16.2% $158,535,371 13.0%
% of Total Imports to Mexico 3.7% 2.2% 2.3% 0.1% -1.4%Total Trade Thru Del Rio $2,426,563,452 $2,465,366,766 $2,845,484,680 $380,117,914 15.4% $418,921,228 17.3%
% Total Trade with Mexico 3.3% 2.2% 2.3% 0.1% -1.0%
Texas -- Page 3

Texas's International and Domestic Ports-to-Plains Region Trading Relationships
2004 2010 20112010-2011 Difference
2010-2011 % Change
2004-2011 Difference
2004-2011 % Change
PTP
Truck Exports $9,976,772,733 $18,896,214,117 $22,475,487,424 $3,579,273,307 18.9% $12,498,714,691 125.3%% of Total Exports to Mexico 28.2% 36.4% 39.3% 2.9% 11.1%
Imports $9,822,639,113 $15,744,303,768 $17,580,409,516 $1,836,105,748 11.7% $7,757,770,403 79.0%% of Total Imports to Mexico 30.9% 31.6% 32.0% 0.4% 1.0%
Total Truck Trade Thru PTP $19,799,411,846 $34,640,517,885 $40,055,896,940 $5,415,379,055 15.6% $20,256,485,094 102.3%% Total Trade with Mexico 29.5% 34.1% 35.7% 1.7% 6.2%
Rail Exports $4,755,407,639 $5,008,640,264 $6,049,972,773 $1,041,332,509 20.8% $1,294,565,134 27.2%% of Total Exports to Mexico 89.0% 85.7% 84.5% -1.2% -4.4%
Imports $1,410,093,150 $3,183,566,608 $4,380,068,679 $1,196,502,071 37.6% $2,969,975,529 210.6%% of Total Imports to Mexico 94.3% 80.2% 83.5% 3.3% -10.8%
Total Rail Trade Thru PTP $6,165,500,789 $8,192,206,872 $10,430,041,452 $2,237,834,580 27.3% $4,264,540,663 69.2%% Total Trade with Mexico 90.1% 83.5% 84.1% 0.6% -6.0%
TOTALExports $14,732,180,372 $23,904,854,381 $28,525,460,197 $4,620,605,816 19.3% $13,793,279,825 93.6%
% of Total Exports to Mexico 36.2% 41.4% 44.3% 2.9% 8.1%Imports $11,232,732,263 $18,927,870,376 $21,960,478,195 $3,032,607,819 16.0% $10,727,745,932 95.5%
% of Total Imports to Mexico 33.8% 35.2% 36.5% 1.3% 2.7%Total Trade Thru PTP $25,964,912,635 $42,832,724,757 $50,485,938,392 $7,653,213,635 17.9% $24,521,025,757 94.4%
% Total Trade with Mexico 35.1% 38.4% 40.5% 2.1% 5.4%
Texas -- Page 4
Texas's International and Domestic Ports-to-Plains Region Trading Relationships
2011 Leading Exports from Texas to Mexico (Surface Transportation) 2011Rank Export
1 85 Electrical Machinery; Equipment and Parts $16,983,076,0042 84 Computer-Related Machinery and Parts $12,832,254,5213 87 Vehicles Other than Railway $7,933,715,0304 27 Mineral Fuels; Oils and Waxes $4,919,959,6705 39 Plastics and Articles $4,789,248,5596 90 Measuring and Testing Instruments $2,003,075,4717 73 Articles of Iron and Steel $1,489,277,2398 72 Iron and Steel $1,313,363,0659 2 Meat and Edible Offal $1,177,574,001
10 48 Paper and Paperboard $1,165,224,179
2011 Leading Imports to Texas from Mexico (Surface Transportation) 2011Import
1 85 Electrical Machinery; Equipment and Parts $17,856,647,1882 84 Computer-Related Machinery and Parts $16,841,887,4213 87 Vehicles Other than Railway $8,353,821,1464 90 Measuring and Testing Instruments $2,089,003,1855 94 Furniture; Lamps and Prefabricated Buildings $1,349,333,1246 72 Iron and Steel $1,230,563,8197 98 Special Classification Provisions $1,118,071,7038 73 Articles of Iron and Steel $1,094,795,0659 27 Mineral Fuels; Oils and Waxes $1,023,430,702
10 8 Edible Fruit and Nuts $966,425,017
Texas -- Page 5

Texas's International and Domestic Ports-to-Plains Region Trading Relationships
2011 Leading Exports from Texas to Mexico (Surface Transportation) 2011Rank Coahuila Export
1 84 Computer-Related Machinery and Parts $1,331,070,8962 85 Electrical Machinery; Equipment and Parts $789,436,2743 87 Vehicles Other than Railway $747,327,6044 39 Plastics and Articles $265,670,8435 74 Copper and Articles $253,957,0086 86 Locomotives and Traffic Signals $253,585,4367 72 Iron and Steel $243,551,0978 73 Articles of Iron and Steel $162,593,3599 52 Cotton $116,618,144
10 94 Furniture; Lamps and Prefabricated Buildings $114,237,589
2011 Nuevo Leon 2011Rank Leading Exports from Texas to Mexico (Surface Transportation) Export
1 84 Nuclear reactors; boilers; machinery and mechanical appliances; parts thereof $483,619,7922 72 Iron and steel $468,071,0723 85 Electrical machinery and equipment and parts thereof; Sound recorders and reproducers $416,052,2274 74 Copper and articles thereof $367,531,2725 2 Meat and edible meat offal $290,668,3666 39 Plastics and articles thereof $257,160,8667 76 Aluminum and articles thereof $255,176,4398 87 Vehicles; other than railway or tramway rolling stock; and parts and accessories thereof $189,065,3639 27 Mineral fuels; mineral oils and products of their distillation; Bituminous substances; Mineral waxes $182,911,431
10 48 Paper and paperboard; Articles of paper pulp; of paper or of paperboard $129,135,293
Texas -- Page 6

Texas's International and Domestic Ports-to-Plains Region Trading Relationships
2011 Leading Exports from Texas to Mexico (Surface Transportation) 20112011 Leading Exports from Texas to Mexico (Surface Transportation) 2011Rank Tamaulipas Export
1 85 Electrical machinery and equipment and parts thereof; Sound recorders and reproducers $3,765,604,3572 84 Nuclear reactors; boilers; machinery and mechanical appliances; parts thereof $1,254,222,3473 39 Plastics and articles thereof $489,639,8284 87 Vehicles; other than railway or tramway rolling stock; and parts and accessories thereof $387,761,1865 90 Optical; photographic; cinematographic; measuring; checking; precision; medical instruments $340,259,8746 73 Articles of iron or steel $323,754,6147 2 Meat and edible meat offal $218,666,0738 48 Paper and paperboard; Articles of paper pulp; of paper or of paperboard $202,607,2169 10 Cereals $165,719,647
10 76 Aluminum and articles thereof $155,511,582
Texas -- Page 7

Texas's International and Domestic Ports-to-Plains Region Trading Relationships
2004 2010 20112010-2011 Difference
2010-2011 % Change
2004-2011 Difference
2004-2011 % Change
CanadaTruck Exports $7,865,361,202.00 $11,335,498,833 $13,363,835,387 $2,028,336,554 17.9% $5,498,474,185 69.9%
Imports $4,678,295,070.00 $6,317,904,358 $7,318,867,430 $1,000,963,072 15.8% $2,640,572,360 56.4%Total Truck Trade with Canada $12,543,656,272.00 $17,653,403,191 $20,682,702,817 $3,029,299,626 17.2% $8,139,046,545 64.9%
#DIV/0!Rail Exports $1,748,481,852.00 $3,256,534,768 $3,673,465,236 $416,930,468 12.8% $1,924,983,384 110.1%
Imports $1,720,111,026.00 $3,193,923,369 $4,092,667,496 $898,744,127 28.1% $2,372,556,470 137.9%Total Rail Trade with Canada $3,468,592,878.00 $6,450,458,137 $7,766,132,732 $1,315,674,595 20.4% $4,297,539,854 123.9%
$0 #DIV/0!TOTAL Exports $9,613,843,054.00 $14,592,033,601 $17,037,300,623 $2,445,267,022 16.8% $7,423,457,569 77.2%
Imports $6,398,406,096.00 $9,511,827,727 $11,411,534,926 $1,899,707,199 20.0% $5,013,128,830 78.3%Total Trade with Canada $16,012,249,150.00 $24,103,861,328 $28,448,835,549 $4,344,974,221 18.0% $12,436,586,399 77.7%
Texas -- Page 8

Texas's International and Domestic Ports-to-Plains Region Trading Relationships
2004 2010 20112010-2011 Difference
2010-2011 % Change
2004-2011 Difference
2004-2011 % Change
Raymond, MT
Truck Exports $2,405,503 $10,468,884 $34,503,305 $24,034,421 229.6% $32,097,802 1334.3%% of Total Exports to Canada 0.0% 0.1% 0.3% 0.2% 0.2%
Imports $1,817,963 $9,778,327 $23,374,664 $13,596,337 139.0% $21,556,701 1185.8%% of Total Imports to Canada 0.0% 0.2% 0.3% 0.2% 0.3%
Total Truck Trade Thru Raymond $4,223,466 $20,247,211 $57,877,969 $37,630,758 185.9% $53,654,503 1270.4%% Total Trade with Canada 0.0% 0.1% 0.3% 0.2% 0.2%
Rail Exports $0% of Total Exports to Canada 0.0% 0.0%
Imports $0% of Total Imports to Canada 0.0% 0.0%
Total Truck Trade Thru Raymond $0 $0% Total Trade with Canada 0.0% 0.0%
TOTALExports $2,405,503 $10,468,884 $34,503,305 $24,034,421 229.6% $32,097,802 1334.3%
% of Total Exports to Canada 0.0% 0.1% 0.2% 0.1% 0.2%Imports $1,817,963 $9,778,327 $23,374,664 $13,596,337 139.0% $21,556,701 1185.8%
% of Total Imports to Canada 0.0% 0.1% 0.2% 0.1% 0.2%Total Trade Thru Raymond $4,223,466 $20,247,211 $57,877,969 $37,630,758 185.9% $53,654,503 1270.4%
% Total Trade with Canada 0.0% 0.1% 0.2% 0.1% 0.2%
Texas -- Page 9
Texas's International and Domestic Ports-to-Plains Region Trading Relationships
2004 2010 20112010-2011 Difference
2010-2011 % Change
2004-2011 Difference
2004-2011 % Change
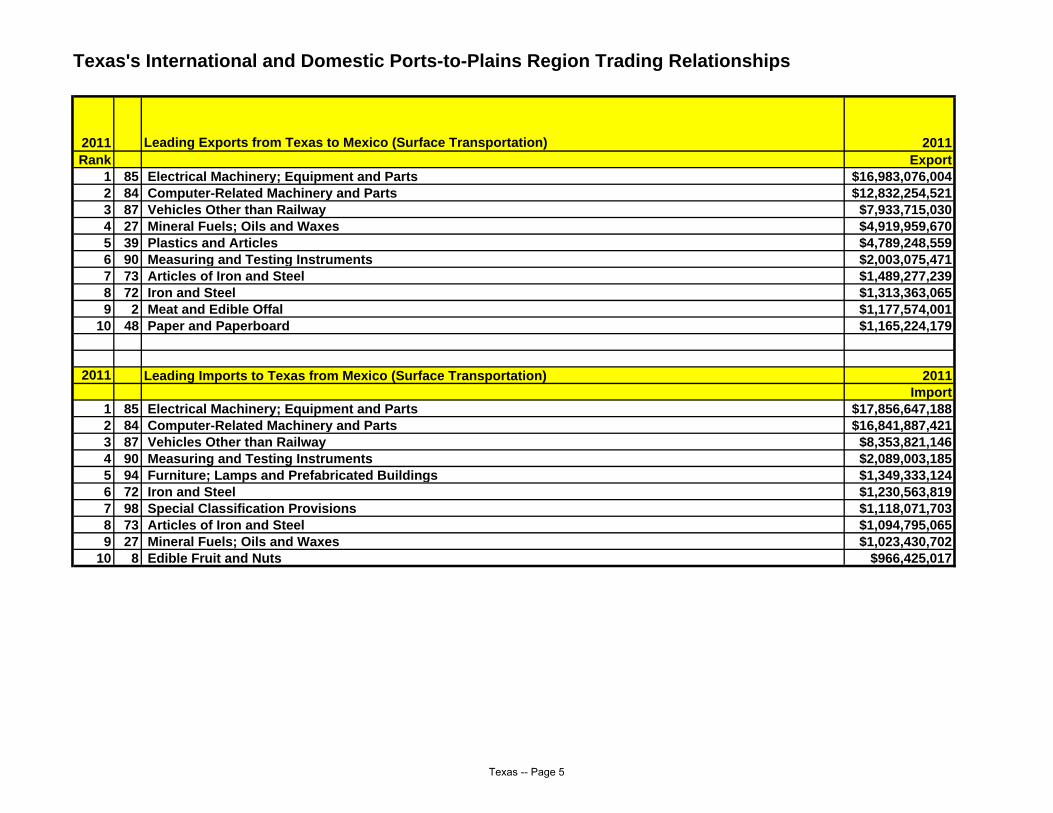
Sweet Grass, MT
Truck Exports $1,004,047,209 $1,868,089,134 $2,567,153,272 $699,064,138 37.4% $1,563,106,063 155.7%% of Total Exports to Canada 12.8% 16.5% 19.2% 2.7% 6.4%
Imports $491,347,144 $919,830,902 $1,498,980,022 $579,149,120 63.0% $1,007,632,878 205.1%% of Total Exports to Canada 10.5% 14.6% 20.5% 5.9% 10.0%
Total Truck Trade Thru Sweetgrass 1,495,394,353 $2,787,920,036 $4,066,133,294 $1,278,213,258 45.8% $2,570,738,941 171.9%% Total Trade with Canada 11.9% 15.8% 19.7% 3.9% 7.7%
Rail Exports $48,041,309 $109,190,373 $81,588,932 -$27,601,441 -25.3% $33,547,623 69.8%% of Total Exports to Canada 2.7% 3.4% 2.2% -1.1% -0.5%
Imports $39,716,412 $11,091,165 $19,669,840 $8,578,675 77.3% -$20,046,572 -50.5%% of Total Exports to Canada 2.3% 0.3% 0.5% 0.1% -1.8%
Total Rail Trade Thru Sweet Grass $87,757,721 $120,281,538 $101,258,772 -$19,022,766 -15.8% $13,501,051 15.4%% Total Trade with Canada 2.5% 1.9% 1.3% -0.6% -1.2%
TOTALExports $1,052,088,518 $1,977,279,507 $2,648,742,204 $671,462,697 34.0% $1,596,653,686 151.8%
% of Total Exports to Canada 10.9% 13.6% 15.5% 2.0% 4.6%Imports $531,063,556 $930,922,067 $1,518,649,862 $587,727,795 63.1% $987,586,306 186.0%
% of Total Imports to Canada 8.3% 9.8% 13.3% 3.5% 5.0%Total Trade Thru Sweet Grass $1,583,152,074 $2,908,201,574 $4,167,392,066 $1,259,190,492 43.3% $2,584,239,992 163.2%
% Total Trade with Canada 9.9% 12.1% 14.6% 2.6% 4.8%
Texas -- Page 10
Texas's International and Domestic Ports-to-Plains Region Trading Relationships
2004 2010 20112010-2011 Difference
2010-2011 % Change
2004-2011 Difference
2004-2011 % Change
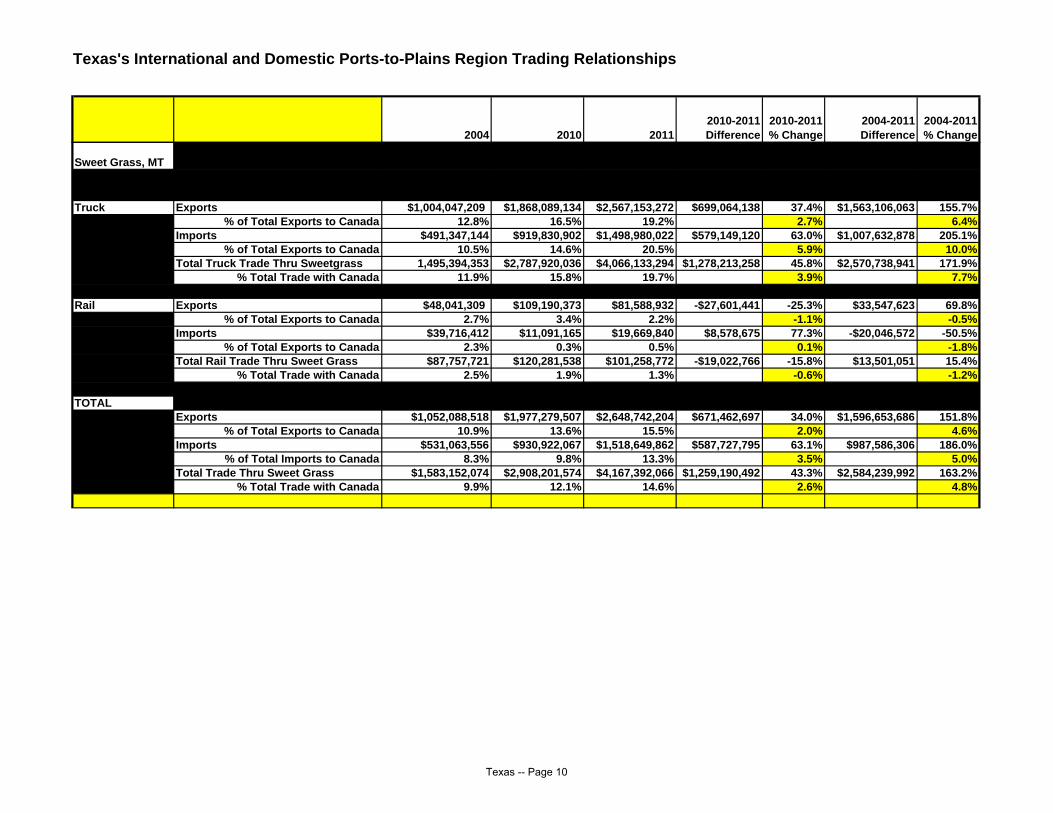
Portal, ND
Truck Exports $271,515,784 $735,765,270 $893,655,320 $157,890,050 21.5% $622,139,536 229.1%% of Total Exports to Canada 3.5% 6.5% 6.7% 0.2% 3.2%
Imports $79,247,036 $198,876,790 $220,626,300 $21,749,510 10.9% $141,379,264 178.4%% of Total Imports to Canada 1.7% 3.1% 3.0% -0.1% 1.3%
Total Truck Trade Thru Portal $350,762,820 $934,642,060 $1,114,281,620 $179,639,560 19.2% $763,518,800 217.7%% Total Trade with Canada 2.8% 5.3% 5.4% 0.1% 2.6%
Rail Exports $125,913,077 $366,800,582 $366,120,547 -$680,035 -0.2% $240,207,470 190.8%% of Total Exports to Canada 7.2% 11.3% 10.0% -1.3% 2.8%
Imports $334,144,869 $654,821,772 $557,638,620 -$97,183,152 -14.8% $223,493,751 66.9%% of Total Imports to Canada 19.4% 20.5% 13.6% -6.9% -5.8%
Total Rail Trade Thru Portal $460,057,946 $1,060,593,353 $923,759,167 -$136,834,186 -12.9% $463,701,221 100.8%% Total Trade with Canada 13.3% 16.4% 11.9% -4.5% -1.4%
TOTALExports $397,428,861 $735,765,270 $893,655,320 $157,890,050 21.5% $862,347,006 124.9%
% of Total Exports to Canada 4.1% 5.0% 5.2% 0.2% 1.1%Imports $413,391,905 $853,698,562 $778,264,920 -$75,433,642 -8.8% $364,873,015 88.3%
% of Total Imports to Canada 6.5% 9.0% 6.8% -2.2% 0.4%Total Trade Thru Portal $810,820,766 $1,589,463,832 $1,671,920,240 $82,456,408 5.2% $1,227,220,021 106.2%
% Total Trade with Canada 5.1% 6.6% 5.9% -0.7% 0.8%
Texas -- Page 11

Texas's International and Domestic Ports-to-Plains Region Trading Relationships
2004 2010 20112010-2011 Difference
2010-2011 % Change
2004-2011 Difference
2004-2011 % Change
Wild Horse0
Truck Exports $0 $0 $0 $0 #DIV/0! $0 #DIV/0!% of Total Exports to Canada 0.0% 0.0% 0.0% 0.0% 0.0%
Imports $0 $32,115 $23,991 -$8,124 -25.3% $23,991 #DIV/0!% of Total Imports to Canada 0.0% 0.0% 0.0% 0.0% 0.0%
Total Truck Trade Thru Wild Horse $0 $950,293 $23,991 -$926,302 -97.5% $23,991 #DIV/0!% Total Trade with Canada 0.0% 0.0% 0.0% 0.0% 0.0%
Rail
TOTALExports $0 $0 $0 $0 #DIV/0! $0 #DIV/0!
% of Total Exports to Canada 0.0% 0.0% 0.0% 0.0% 0.0%Imports $0 $32,115 $23,991 -$8,124 -25.3% $23,991 #DIV/0!
% of Total Imports to Canada 0.0% 0.0% 0.0% 0.0% 0.0%Total Trade Thru Wild Horse $0 $32,115 $23,991 -$8,124 -25.3% $23,991 #DIV/0!
% Total Trade with Canada 0.0% 0.0% 0.0% 0.0% 0.0%
Texas -- Page 12

Texas's International and Domestic Ports-to-Plains Region Trading Relationships
2004 2010 20112010-2011 Difference
2010-2011 % Change
2004-2011 Difference
2004-2011 % Change
PTP#DIV/0!
Truck Exports $1,277,968,496 $2,614,323,288 $3,495,311,897 $880,988,609 33.7% $2,217,343,401 173.5%% of Total Exports to Canada 16.2% 23.1% 26.2% 3.1% 9.9%
Imports $572,999,683 $1,129,208,691 $1,754,133,618 $624,924,927 55.3% $1,181,133,935 206.1%% of Total Imports to Canada 12.2% 17.9% 24.0% 6.1% 11.7%
Total Truck Trade Thru PTP $1,850,968,179 $3,743,531,979 $5,249,445,515 $1,505,913,536 40.2% $3,398,477,336 183.6%% Total Trade with Canada 14.8% 21.2% 25.4% 4.2% 10.6%
Rail Exports $173,954,386 $475,990,955 $447,709,479 -$28,281,476 -5.9% $273,755,093 157.4%% of Total Exports to Canada 2.2% 4.2% 3.4% -0.8% 1.1%
Imports $373,861,281 $665,912,937 $577,308,460 -$88,604,477 -13.3% $203,447,179 54.4%% of Total Imports to Canada 8.0% 10.5% 7.9% -2.7% -0.1%
Total Rail Trade Thru PTP $547,815,667 $1,141,903,892 $1,025,017,939 -$116,885,953 -10.2% $477,202,272 87.1%% Total Trade with Canada 4.4% 6.5% 5.0% -1.5% 0.6%
TOTALExports $1,451,922,882 $3,090,314,243 $3,943,021,376 $852,707,133 27.6% $2,491,098,494 171.6%
% of Total Exports to Canada 15.1% 21.2% 23.1% 2.0% 8.0%Imports $946,860,964 $1,795,121,628 $2,331,442,078 $536,320,450 29.9% $1,384,581,114 146.2%
% of Total Imports to Canada 14.8% 18.9% 20.4% 1.6% 5.6%Total Trade Thru PTP $2,398,783,846 $4,885,435,871 $6,274,463,454 $1,389,027,583 28.4% $3,875,679,608 161.6%
% Total Trade with Canada 15.0% 20.3% 22.1% 1.8% 7.1%
Texas -- Page 13
Texas's International and Domestic Ports-to-Plains Region Trading Relationships
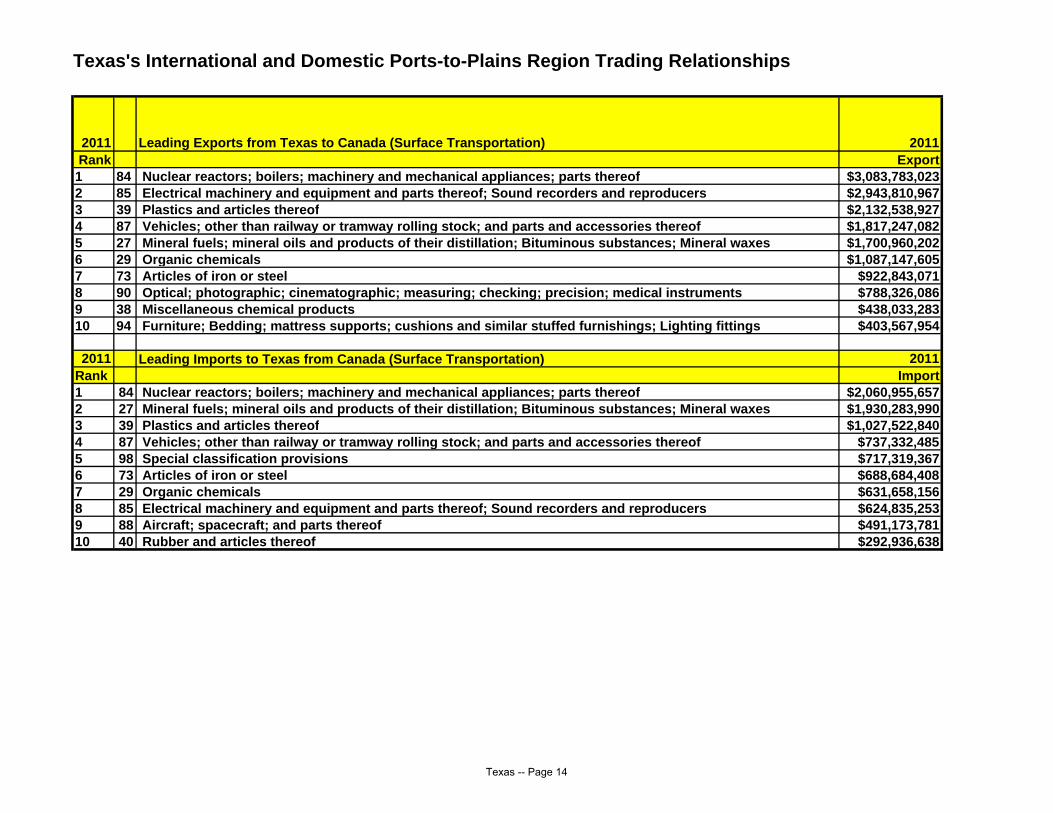
2011 Leading Exports from Texas to Canada (Surface Transportation) 2011Rank Export1 84 Nuclear reactors; boilers; machinery and mechanical appliances; parts thereof $3,083,783,0232 85 Electrical machinery and equipment and parts thereof; Sound recorders and reproducers $2,943,810,9673 39 Plastics and articles thereof $2,132,538,9274 87 Vehicles; other than railway or tramway rolling stock; and parts and accessories thereof $1,817,247,0825 27 Mineral fuels; mineral oils and products of their distillation; Bituminous substances; Mineral waxes $1,700,960,2026 29 Organic chemicals $1,087,147,6057 73 Articles of iron or steel $922,843,0718 90 Optical; photographic; cinematographic; measuring; checking; precision; medical instruments $788,326,0869 38 Miscellaneous chemical products $438,033,28310 94 Furniture; Bedding; mattress supports; cushions and similar stuffed furnishings; Lighting fittings $403,567,954
2011 Leading Imports to Texas from Canada (Surface Transportation) 2011Rank Import1 84 Nuclear reactors; boilers; machinery and mechanical appliances; parts thereof $2,060,955,6572 27 Mineral fuels; mineral oils and products of their distillation; Bituminous substances; Mineral waxes $1,930,283,9903 39 Plastics and articles thereof $1,027,522,8404 87 Vehicles; other than railway or tramway rolling stock; and parts and accessories thereof $737,332,4855 98 Special classification provisions $717,319,3676 73 Articles of iron or steel $688,684,4087 29 Organic chemicals $631,658,1568 85 Electrical machinery and equipment and parts thereof; Sound recorders and reproducers $624,835,2539 88 Aircraft; spacecraft; and parts thereof $491,173,78110 40 Rubber and articles thereof $292,936,638
Texas -- Page 14

Texas's International and Domestic Ports-to-Plains Region Trading Relationships
2011 Leading Exports from Texas to Canada (Surface Transportation) 2011Rank Alberta Export
1 84 Nuclear reactors; boilers; machinery and mechanical appliances; parts thereof $1,030,657,4202 73 Articles of iron or steel $431,333,4543 29 Organic chemicals $289,784,4184 85 Electrical machinery and equipment and parts thereof; Sound recorders and reproducers $272,150,1695 87 Vehicles; other than railway or tramway rolling stock; and parts and accessories thereof $269,332,0476 90 Optical; photographic; cinematographic; measuring; checking; precision; medical instruments $199,736,5787 39 Plastics and articles thereof $194,552,3398 27 Mineral fuels; mineral oils and products of their distillation; Bituminous substances; Mineral waxes $153,845,5109 38 Miscellaneous chemical products $106,646,437
10 82 Tools; implements; cutlery; spoons and forks; of base metal; Parts thereof of base metal $93,777,132
2011 Leading Exports from Texas to Canada (Surface Transportation) 2011Rank British Colombia Export
1 84 Nuclear reactors; boilers; machinery and mechanical appliances; parts thereof $168,623,2272 87 Vehicles; other than railway or tramway rolling stock; and parts and accessories thereof $114,704,1603 85 Electrical machinery and equipment and parts thereof; Sound recorders and reproducers $80,510,2034 39 Plastics and articles thereof $76,521,5135 27 Mineral fuels; mineral oils and products of their distillation; Bituminous substances; Mineral waxes $62,726,6986 73 Articles of iron or steel $61,790,0657 38 Miscellaneous chemical products $47,075,8348 29 Organic chemicals $17,095,1409 20 Preparations of vegetables; fruit; nuts; or other parts of plants $13,892,988
10 48 Paper and paperboard; Articles of paper pulp; of paper or of paperboard $13,143,151
Texas -- Page 15
Texas's International and Domestic Ports-to-Plains Region Trading Relationships
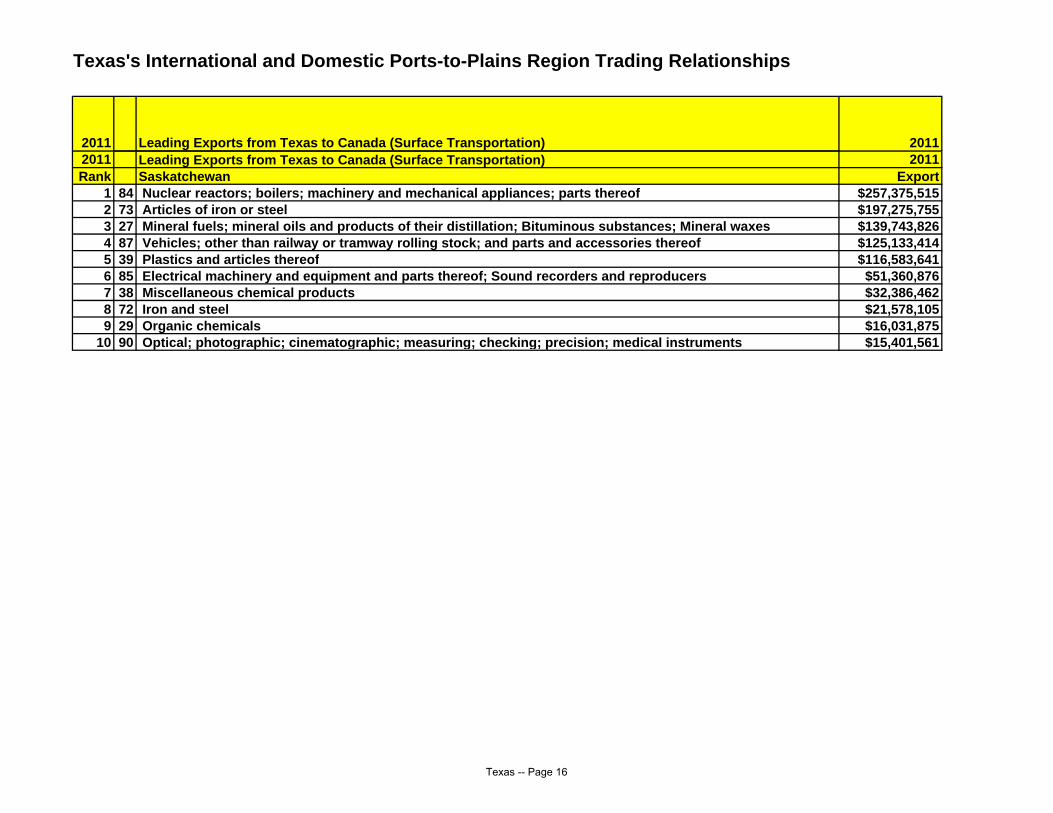
2011 Leading Exports from Texas to Canada (Surface Transportation) 20112011 Leading Exports from Texas to Canada (Surface Transportation) 2011Rank Saskatchewan Export
1 84 Nuclear reactors; boilers; machinery and mechanical appliances; parts thereof $257,375,5152 73 Articles of iron or steel $197,275,7553 27 Mineral fuels; mineral oils and products of their distillation; Bituminous substances; Mineral waxes $139,743,8264 87 Vehicles; other than railway or tramway rolling stock; and parts and accessories thereof $125,133,4145 39 Plastics and articles thereof $116,583,6416 85 Electrical machinery and equipment and parts thereof; Sound recorders and reproducers $51,360,8767 38 Miscellaneous chemical products $32,386,4628 72 Iron and steel $21,578,1059 29 Organic chemicals $16,031,875
10 90 Optical; photographic; cinematographic; measuring; checking; precision; medical instruments $15,401,561
Texas -- Page 16

Texas's International and Domestic Ports-to-Plains Region Trading Relationships
2002 Domestic -- 2007Rail
ChangeTruck
ChangeDomestic --
2015
Rail Change
2002-2015
Truck Change
2002-2015Exports Rail Truck Exports Rail Truck Exports Rail TruckColorado 167 2,653 15% Colorado 84 5,488 19% -50% 107% Colorado 95 6,164 19% -43% 132%Montana 43 677 4% Montana 1,367 5% -100% 102% Montana 19 275 1% -56% -59%Nebraska 0 0 0% Nebraska 201 1,188 5% Nebraska 251 1,481 5%New Mexico 57 4,992 27% New Mexico 4,544 16% -100% -9% New Mexico 45 4,664 14% -21% -7%North Dakota 0 280 2% North Dakota 788 3% 181% North Dakota 35 879 3% 214%Oklahoma 290 9,209 51% Oklahoma 14,122 49% -100% 53% Oklahoma 416 16,688 51% 43% 81%South Dakota 0 106 1% South Dakota 0% -100% South Dakota 116 970 3% 815%Texas Texas TexasWyoming 0 0 0% Wyoming 29 1,192 4% Wyoming 37 1,451 4%Total ($m) $557 $17,917 Total ($m) 314 28,689 100% -44% 60% Total ($m) 1,013 32,573 100% 82% 82%
$18,474 29,003 57% 33,585 82%Millions
Imports Rail Truck Imports Rail Truck Imports Rail TruckColorado 338 2,264 17% Colorado 275 3,304 12% -19% 46% Colorado 162 3,129 0.09543 -52% 38%Montana 206 0 1% Montana 456 44 2% 121% #DIV/0! Montana 377 64 1% 83%Nebraska 393 1,839 15% Nebraska 1,629 3,203 16% 315% 74% Nebraska 1,092 3,296 13% 178% 79%New Mexico 257 1,142 9% New Mexico 50 2,289 8% -81% 100% New Mexico 26 3,748 11% -90% 228%North Dakota 47 137 1% North Dakota 285 1% -100% 108% North Dakota 904 332 4% 1823% 142%Oklahoma 489 7,137 50% Oklahoma 17,461 57% -100% 145% Oklahoma 1,034 18,505 57% 111% 159%South Dakota 0 452 3% South Dakota 476 2% 5% South Dakota 155 495 2% 9%Texas Texas Texas 0Wyoming 432 63 3% Wyoming 1,015 133 4% 135% 111% Wyoming 1,016 150 3% 135% 139%Total ($m) $2,162 $13,034 Total ($m) 3,425 27,195 58% 109% Total ($m) 4,766 29,718 100% 120% 128%
$15,196 30,620 102% 34,485 127%Millions
TOTALS Rail Truck TOTALS Rail Truck TOTALS Rail TruckColorado 505 4,917 16% Colorado 359 8,792 15% -29% 79% Colorado 9,293 14% -100% 89%Montana 249 677 3% Montana 456 1,411 3% 83% 108% Montana 397 339 1% 59% -50%Nebraska 393 1,839 7% Nebraska 1,830 4,391 10% 366% 139% Nebraska 4,777 7% -100% 160%New Mexico 314 6,134 19% New Mexico 50 6,833 12% -84% 11% New Mexico 8,412 13% -100% 37%North Dakota 47 417 1% North Dakota 0 1,073 2% -100% 157% North Dakota 938 1,211 3% 1896% 190%Oklahoma 779 16,346 51% Oklahoma 0 31,583 53% -100% 93% Oklahoma 35,193 54% -100% 115%South Dakota 0 558 2% South Dakota 0 476 1% -15% South Dakota 271 1,465 3% 163%Texas Texas TexasWyoming 432 63 1% Wyoming 1,044 1,325 4% 142% 2003% Wyoming 1,054 1,601 4% 144% 2442%Total ($m) $2,719 $30,951 Total ($m) 3,739 55,884 100% 38% 81% Total ($m) 2,659 62,291 100% -2% 101%
$33,670 59,623 77% 64,950 93%
Texas -- Page 17
Related Documents