19th Annual Western Hemispheric Trade Conference April 15-17, 2015 | Laredo, TX, USA Conference Proceedings Texas A&M International University A.R. Sanchez, Jr. School of Business Center for the Study of Western Hemispheric Trade In partnership with Universidad Autónoma de Tamaulipas Facultad de Comercio, Administración y Ciencias Sociales

Welcome message from author
This document is posted to help you gain knowledge. Please leave a comment to let me know what you think about it! Share it to your friends and learn new things together.
Transcript

19th Annual
Western Hemispheric Trade Conference
April 15-17, 2015 | Laredo, TX, USA
Conference Proceedings
Texas A&M International University A.R. Sanchez, Jr. School of Business
Center for the Study of Western Hemispheric Trade
In partnership with
Universidad Autónoma de Tamaulipas Facultad de Comercio, Administración y Ciencias Sociales
CENTER FOR THE STUDY OF WESTERN HEMISPHERIC TRADE
The Center for the Study of Western Hemispheric Trade at Texas A&M International University is a public service institute founded to study globalization with special emphasis on the Western Hemisphere. The Center is a part of the A.R. Sanchez, Jr. School of Business, and it supports the college as well as the entire Texas A&M International University community with its various programs. The Center seeks to increase awareness and knowledge about the Western Hemispheric countries and their economical, political and social interactions. The Center highlights Texas A&M International University and the City of Laredo and promotes education.
History Since its inception in 1993, the Center has become a valuable resource for joint research and faculty and student exchanges. The Center is a key location for educational entities, businesses and governments to turn to for up to date and relevant information on the Western Hemisphere. The Center provides a forum for international discussion and debate for representatives from countries in the Western Hemisphere regarding issues that affect trade and other economic relations within the Hemisphere. Through its alliance with educational entities, businesses and governments throughout the Hemisphere, the Center offers practical and targeted lectures imparted by visiting faculty, professionals, society leaders and scholars. Focus The Center's research focuses on subjects that affect Western Hemispheric Trade, including trade agreements, tariffs, customs, regional and national economies, politics, business development, finance, the environment and culture. The Center's publication, The International Trade Journal (ITJ), is now under the auspices of the International Trade Institute and is a refereed interdisciplinary journal published for the enhancement of research in international trade. Its editorial objective is to provide a forum for the scholarly exchange of research findings in, and significant empirical, conceptual, or theoretical contributions to the field.
Mission Consistent with the mission of Texas A&M International University and its A. R. Sanchez, Jr. School of Business, the Center for the Study of Western Hemispheric Trade will conduct and promote research on globalization and related topics, with special emphasis on Western Hemisphere, increase awareness and knowledge about the Western Hemispheric countries and their economic, political, cultural and social institutions and development dynamics, and spotlight Texas A&M International University as a key resource of information, research, training and conferences focusing on the Western Hemisphere.

CONTENTS Welcome ...........................................................................................................................................................1 R. Stephen Sears
Conference Agenda ..................................................................................................................................................3-4
Speaker Biographies (in alphabetical order) ................................................................................................... 5-10 SESSION 1: ISSUES IN MANAGEMENT
Comparative Analysis of the Communicational Differences between Hispanic and Non-Hispanic Subordinates when using Motivating Language from the Perspective of Media Naturalness Theory: A Qualitative Approach ........................................................................... 11 James O. Cox
Leadership Training: The Effects of Leadership Programs on Consideration of Future Consequences ......................................................................................................................................................... 12 Theresa Sadler, Shonda Gibson, and Stephen Reysen
The Mediating Effect of Trust on Workplace Spirituality and Job Performance .............................. 13 Ruth Chatelain-Jardon, Jose Luis Daniel, and Josue Amador
SESSION 2: INTERNATIONAL ISSUES IN BUSINESS AND ECONOMICS
Descriptive Measurement of the Factors of Success of Indian Industry ................................................. 14 Ilya Maria Soto Espitia, Monica Blanco Jimenez, and Juan Rositas Martinez
Modelling the Causes of the Bullwhip Effect and its Implications to Theory of Organizational Coordination .............................................................................................................................. 32 Yohannes Yebabe Tesfay
NEEC & C-TPAT (Benefits and Realities for the Synergy of International Trade) / NEEC & C-TPAT (Beneficios y realidades por la sinergia del comercio Internacional) ............................. 33 Gabriel Mayagoitia SESSION 3: INTERNATIONAL TRADE AND DEVELOPMENT
New Economic Development Opportunities in China: Free Trade Zones and Cross-Border E-Commerce ............................................................................................................................................ 44 Haibo Wang
Firm Registration and Bribes: Results from a Microenterprise Survey in Africa ............................... 45 George R.G. Clarke
Telecommunications Reform in Mexico: Competition, Market Efficiency, Infrastructure Development and Digital Inclusion ..................................................................................................... 64 Cristina Casnueva-Reguart and Erik Bacilio-Avila SESSION 4: TEMAS CONTABLES Y EDUCATIVOS
Impacto que tiene la Inversion en Educacion Superior en el Desarrollo Economico: Factor Crítico de Progreso Economico ............................................................................................... 86 José Barragán-Codina and Felipe Pale-Cervantes
Impacto de las NIF’s en su Aplicación por los Contadores Públicos en el Edo. de Tlaxcala, México ...................................................................................................................................... 97 Sofía Mitre Camacho, Gloria Ramírez Elías, Doroteo Nava, Hector Rosas Lezama and Silvia Patricia Muñoz Castellanos
Elección Universitaria: Desarrollo de Multi-Escalas de Medición para categorizar el Conocimiento y Percepción en la Elección de una Universidad .................................................... 121 Francisco López Vázquez and Miguel Ángel Sahagún SESSION 5: SUSTENTABILIDAD Y USO EFICIENTE DE RECURSOS
Planta de Reciclaje de Papel, PET y Vidrio............................................................................................ 122 Sanjuanita Dalila García Ramos
Logística a la inversa. Aprovechamiento de sobrantes, disminución de costos, Reducción impacto ambiental. ................................................................................................................................. 123 Eduardo Reyes Alcántara and Sebastián Ramos Guzmán
Implementación de la Convención Ramsar en México: ¿Sustentabilidad a las ANPs? ................... 137 Juan Antonio Herrera Izaguirre, Mayra García Govea, Luis Hernán Lope Díaz, and Violeta Mangin SESSION 6: PhD STUDENT PRESENTATIONS I
Revisiting the Day of the Week Anomaly in Financial Markets using Style Indices ....................... 138 Zubair Ali Raja, Renée Oyotode, and William Procasky
The Next Frontier of Mobile Money Usage-Firms-Evidence from Sub-Saharan Africa ............... 139 Aparna Gosavi
Efficiency of Capital Markets: Is the Value Premium Dead? .............................................................. 165 William Procasky
Why Banks Choose to Play Different Roles in the Syndicated Loan? ............................................... 166 Bolortuya Enkhtaivan
SESSION 7: ISSUES IN EDUCATION
Incorporating Ethics and Social Responsibility in International Business Curricula ....................... 167 Arturo Z. Vasquez-Parraga
“Minority STEM Improvement” Project – A Peer Interactive Learning Environment ................. 168 Rohitha Goonatilake, Runchang Lin, Qingwen Ni, and Teresa N. Nguyen
Facebook Assimilation and Relationship Management: Differences among HBCU and HSI Accounting Students ............................................................................................................. 169 George E. Heilman, Sathasivam Mathiyalakan, and Jorge O. Brusa
The Importance of the University Entrepreneurship in Mexico ........................................................ 181 José Nicolás Barragán Codina, Rubén Hernán Leal López, and Felipe Palé Cervantes SESSION 8: PLS APPLICATIONS SYMPOSIUM I
Conducting a Factor-Based PLS-SEM Analysis with WarpPLS ............................................................... 191 Ned Kock
What Drives Profits, Revenue or Assets? .............................................................................................. 192 J.A. (Jim) Connell
A PLS Modeling Approach for Analysis of Survey Data Examining Adoption of Agile Software Engineering ............................................................................................................................ 193 Tom Gradel and John T. Nosek
Cultural Intelligence and Job Performance in International Transportation Business Settings: A PLS-based Structural Equation Modeling Study .......................................................... 195 Shaun Sexton and Ned Kock SESSION 9: TEMAS DE LOGÍSTICA Y COMERCIO INTERNACIONAL
Los INCOTERMS y su Importancia para los Contratos Internacionales ....................................... 196 José Ángel Adame Barco, Jesús Eduardo Sánchez Gámez, and Fernando Hernández Contreras
Infraestructura logística como apalancamiento para aumentar la competitividad y reducir el costo país: Revisión de cuatro estudios con ecuaciones estructurales. ........................ 211 José Fernando Díaz Zamora
Estudio de Factibilidad de Operaciones en Aeropuerto de Carga de Nuevo Laredo ..................... 221 Felipe Alejandro Castillo Loera, Mario Alberto Villarreal Álvarez, and Alan Guadalupe Vázquez Alfaro
PYMEs: Factores que Influyen en la Apertura, Desarrollo y Éxito de la Micro Empresa en México ............................................................................................................................................... 222 Mario Alberto Villarreal Álvarez, Fernando Hernández Contreras, and José Luis Díaz Roldan
SESSION 10: NEGOCIOS Y TECNOLOGÍAS NUEVAS
Informática Forense .................................................................................................................................. 223 Jorge Eduardo Garza Sánchez and Juan José Hernández Vidales

Comparación empírica entre el proceso unificado y el desarrollo de software por prototipos ............................................................................................................................................... 235 Ramón Ventura Roque Hernández, Juan Manuel Salinas Escandón, Caleb Alfredo Álamos Acosta, and Roberto Arreola Rivera
Los principios ágiles del desarrollo de software: Un estudio sobre percepción. .............................. 245 Ramón Ventura Roque Hernández, Adán López Mendoza, Daniel Barria Cabrera, and Marlene Arriaga Huerta
Comercio Electrónico ............................................................................................................................... 255 Francisco Javier Estrada Reyes, Karla Paola Bermudez, David Alejandro Contreras, and Luis David Romero Martinez
SESSION 11: POLITICAL ECONOMY OF TRADE
Province-Level Impacts of Canada’s Trade Agreements: Ontario and the Canada-Korea FTA ......................................................................................................................................................... 256 Dan Ciuriak, Dmitry Lysenko, and Jingliang Xiao
The Evolutionary Effects of Democracy: In the Long Run, We Are All Trading? ......................... 287 Christopher J. Boudreaux
Does Transition Towards Democracy Led to Trade Openness? The Case of Sub-Saharan Africa ....................................................................................................................................................... 308 John Kagochi and Nazif Durmaz
SESSION 12: ECONOMIC ISSUES IN EMERGING MARKETS
Emerging Markets and Value-at-Risk: A Reflection for Multinational Enterprises ........................ 309 Kashi Khazeh, Leonard Arvi, and Eugene Hahn
Price Transmission and Volatility Spillovers in Asian Rice Markets: Evidence from a Panel GARCH Model ........................................................................................................................... 310 Jim Lee and Harold Glenn A. Valera
Benford’s Law and the Effects of the Korean Financial Reforms on Cosmetic Earnings Management ........................................................................................................................................... 328 Micheal Lacina, B. Brian Lee, and Dong Wuk Kim
SESSION 13: PLS APPLICATIONS SYMPOSIUM II
The Effect of Information and Communications Technology Diffusion on Corruption and Transparency: A Global Study Employing Robust Path Analysis ................................................. 351 Leebrian Gaskins and Ned Kock
The Moderating Effect of Industry Concentration on the Relationship between Corporate Social Responsibility and Firm Performance ..................................................................................... 352 Cau N. Nguyen, Albi Alikaj, and Efrain Medina
Effects of Corruption and Regulation on Firm: A Multiple-Country Study ..................................... 353 Wei Ning, Cassandra Wheeler, and Prity Patel,
Does Internet and National Culture Influence a Country's Perception of Corruption? ................. 354 Cassandra Wheeler and Efrain Medina
SESSION 14: FOREIGN DIRECT INVESTMENT
The New Determinant Creation Theory: The Case of Mexico .......................................................... 355 Juan Carlos Botello and Martín Dávila
Foreign Direct Investment and Politics .................................................................................................. 376 Vahdet Kaya and Ashraf El-Houbi
Chinese FDI Outflow and Life Satisfaction of Destination Countries: A Research of Key Locations in Complex Network based on Chinese FDI Outflow, Life Satisfaction of OECD Destination Countries, and Cultural Distances .............................................................. 377 Da Huo and Ken Hung
SESSION 15: INDUSTRIA Y ECONOMÍA
Sistema de Costeo ABC Implicación en el Proceso Productivo ......................................................... 378 José Luis Díaz Roldán, Mario Villarreal Álvarez, and Fernando Hernández Contreras
La modificación controlada de los factores que influencian los procesos creativos como herramientas de diferenciación en las compañías manufactureras ................................................. 380 Alfonso Galvan
Estructura y Evolución Reciente de las Ventajas Comparativas de México y de sus Estados .............................................................................................................................................. 381 José de Jesús Salazar Cantú and Raymundo Cruz Rodríguez Guajardo Shale Rush: Impacto Económico en Tamaulipas.................................................................................. 382 Jesús Angel Chapa Barrera SESSION 16: STRATEGIES TO CREATE COMPETITIVE ADVANTAGE
Process Design for Cost-Efficient International Just-In-Time Delivery of Perishable Goods on Dynamically Changing Routes.......................................................................................... 383 Didimo A. Dewar V. and Fabian Voith
Knowledge Management as Strategy to Achieve Competitive Advantage. Case Study: Mexican Customs Brokers from Nuevo Laredo .............................................................................................. 384 Francisco José Burgoa Ramírez
Methodological Proposal for the Study of the Impact of Globalization on Business Strategy of Mexican International Enterprises ................................................................................................. 385 José G. Vargas-Hernández and César Francisco Cárdenas Dávila

Econometric Modelling of the Variations and Structural Changes of Norway’s Import Trade across Continents and Over Time ........................................................................................... 404 Yohannes Yebabe Tesfay and Per Bjarte Solibakke
SESSION 17: GLOBALIZATION AND TRADE
Sanitary and Phitosanitary Measures in Latin America: Evidence and Effects on Agricultural Trade ................................................................................................................................. 405 Orlando Monteiro da Silva and Marcela Olegário Santos
Effect of Information and Communication Technologies on International Trade and Development .......................................................................................................................................... 419 Joseph S. Mollick
Analysis of US Imports from China vs. US Imports from Mexico over the Past Decade ............. 420 Balaji Janamanchi
Competitive and Comparative Advantage: Towards a Unified Theory of International Trade ....................................................................................................................................................... 421 Bernard C. Beaudreau
SESSION 18: LEYES E INVERSIONES INTERNACIONALES
Derecho Internacional y Comparado, Legislación y Tratados en Torno a la Migración Infantil ..................................................................................................................................................... 422 Gabriela Ortega Cervantes, Silvia Patricia Muñoz Castellanos, and Jesús Cerda Cruz
Administración de Recursos Humanos: Desde de una perspectiva emocional ................................ 433 Pedro Bautista Santiago, Lionel Antonio Olea Ontiveros, Miguel Ángel Serrato García, and Hermenegildo Moreno Morales
Inversion Extranjera en México .............................................................................................................. 439 Alejandra Palencia Méndez and Ana María Medina Tiznado
SESSION 19: NEGOCIOS INTERNACIONALES I
Operaciones de Exportación e Importación: Una Oportunidad de Crecimiento para México ..................................................................................................................................................... 440 Deissy Edith Nava Palomo, Ilse Guadalupe Reyes Esparza, and Carlos Alberto Nishiyama Diaz
Servicio de Carga Terrestre Internacional .............................................................................................. 441 Héctor Alberto García González and Jorge Carlos Pacheco Moreno
Importancia de las Certificaciones C-TPAT y NEEC ......................................................................... 442 Mónica Nohemí Moreno Ortiz, Tanya Ossmara Reyes Vázquez, and Ángel Emmanuel Rayo Martínez
SESSION 20: PhD STUDENT PRESENTATIONS II
An Integrated-Dynamic Mode of Entry Model: An Extended Approach ........................................ 443 Bolortuya Enkhtaivan and Zagdbazar Davaadorj
How Perceived China’s Market Oriented Economic Reform by Chinese Employees May Affect their Turnover Intention: The Role of Quality of Human Resource Practices ................ 444 Wei Ning
Corporate Social Responsibility, Gender Diversity on the Board of Directors and Earnings Quality: Does Gender Diversity Really Matter? ................................................................................. 445 James O. Cox
SESSION 21: CORPORATE SOCIAL RESPONSIBILITY
The Influence of Marketing Corporate Social Responsibility via Social Media on Stakeholders’ Perceptions .............................................................................................................................................. 446 Andrée Marie López-Fernández and Rajagopal
Disentangling the Real Effects of Corporate Social Responsibility Measures .................................. 461 Siddharth Shankar
SESSION 22: MARKETING AND CONSUMERS
Five-Stage Acculturation Process of Hispanic Consumers: Theory and Findings ........................... 462 Arturo Z. Vasquez-Parraga and Humberto Valencia
From Market Orientation to New Product Performance: The Moderating Role of Team-Based versus Individual-Based Reward in China ................................................................... 463 Jianfei Lu and Yinghong Susan Wei
Explaining Purchase Intention for Imported Products by Way of the Adoption Process Followed by Consumers ........................................................................................................................ 464 Miguel Angel Sahagun and Arturo Z. Vasquez-Parraga
SESSION 23: ISSUES IN FINANCE AND ACCOUNTING
Family Firms and Earnings Management in Taiwan: Influence of Board Independence .............. 465 Ken Hung
The Impact of SOX Regulatory Provisions and SEC’s Enforcement Actions on Forced CEO/CFO Turnover in Response to Financial Misrepresentation .............................................. 466 Jui-Chin Chang
Differentiating between Reorganizable and Failed Bankruptcy Firms using CAPM and Non-Financial Performance Measures ............................................................................................... 467 Cynthia Lloyd
SESSION 24: NEGOCIOS INTERNACIONALES II
Importación de Vehículos ........................................................................................................................ 468 Ana Gabriela Garcia Benavidez
El TLCAN y los Beneficios a la Exportación ....................................................................................... 469 Lilian Michelle Flores Castellanos and Kevin Alejandro Zavala Padilla
La Importancia de la Clasificación Arancelaria en los Negocios Internacionales ............................ 470 Melissa Márquez, Raquel Muñoz, and Francisco J. Burgoa
Modelo de Gestion de Operaciones y Suministro: Factores Criticos de Éxito en Empresas Maquiladoras en la Frontera Noreste de México ............................................................................... 471 Abiu Gonzalez Ixba

WELCOME
Dear Conference Participant: Texas A&M International University’s (TAMIU) A.R. Sanchez, Jr. School of Business (ARSSB) takes pride in welcoming you to its 19th Annual Western Hemispheric Trade Conference. The conference is co-sponsored by the Center for the Study of Western Hemispheric Trade in partnership with the Universidad Autónoma de Tamaulipas Facultad de Comercio, Administración y Ciencias Sociales. The conference will take place on April 15-17, 2015 on the campus of TAMIU in Laredo, Texas, USA. Join us as we welcome three outstanding keynote speakers: Dr. Diana V. Negroponte, Public Policy Scholar at the Woodrow Wilson International Center for Scholars in Washington, D.C.; Dr. Stephen Haber, The Peter and Helen Bing Senior Fellow at Stanford University’s Hoover Institution; and Dr. James Barth, Lowder Eminent Scholar in Finance at Auburn University. Our panel presentation, “Finance, Central Banking, and International Capital Flows: México and the United States,” features Dr. Mark Wynne, Vice President, Associate Director of Research, and Director of the Globalization and Monetary Policy Institute at the Federal Reserve Bank of Dallas; and Dr. Daniel Chiquiar, Director of Macro-Financial Risk Analysis at the Central Bank of México. Dr. William Gruben will serve as moderator. A total of 82 papers will be presented throughout 24 academic sessions, including special sessions for graduate students. Participants of this year’s Partial Least Squares (PLS) Applications Symposium will be included in the academic sessions. The PLS Applications Symposium is chaired by Dr. Ned Kock, Killam Distinguished Professor and Chair of the ARSSB’s Division of International Business & Technology Studies. We thank our corporate sponsors for their support: BBVA Compass; Daniel B. Hastings, Inc.; Falcon Bank; International Bank of Commerce; Killam Development, Ltd.; Routledge, Taylor & Francis Group; and Texas Community Bank. We are pleased to receive you as our guest and participant in this year’s conference and hope that you have a most pleasant and productive stay with us during your visit to Laredo, Texas. The electronic proceedings for the conference are available on our web site: http://freetrade.tamiu.edu/ Sincerely, R. Stephen Sears Dean and Radcliffe Killam Distinguished Professor of Finance A.R. Sanchez, Jr. School of Business Texas A&M International University
1

THIS PAGE INTENTIONALLY LEFT BLANK
2

Conference Agenda
Wednesday, April 15, 2015
7-7:30 p.m. Welcoming Reception ..................................................................................... SC Rotunda, 2nd Floor Sponsored by International Bank of Commerce
7:30-9 p.m. IBC Bank Keynote Speaker Series .................................................................................. SC Ballroom
Opportunities and Challenges for México Today Dr. Diana Villiers Negroponte, Public Policy Scholar, Woodrow Wilson International Center for Scholars Thursday, April 16, 2015
7:30 a.m. Registration Begins .......................................................................................... SC Rotunda, 2nd Floor
7:30-8 a.m. Continental Breakfast ...................................................................................... SC Rotunda, 2nd Floor Sponsored by Daniel B. Hastings, Inc.
8-9:30 a.m. Concurrent Academic Sessions Session 1: Issues in Management ................................................................................................... SC 236 Session 2: International Issues in Business and Economics ...................................................... SC 231 Session 3: International Trade and Development ....................................................................... SC 230 Session 4: Temas Contables y Educativos .................................................................................... SC 225 Session 5: Sustentabilidad y Uso Eficiente de Recursos ............................................................. SC 120
9:30-9:45 a.m. Break & Refreshments .................................................................................... SC Rotunda, 2nd Floor Sponsored by Routledge, Taylor & Francis
9:45-11:45 a.m. Concurrent Academic Sessions Session 6: Ph.D. Student Presentations I ..................................................................................... SC 236 Session 7: Issues in Education ........................................................................................................ SC 231 Session 8: PLS Applications Symposium I ................................................................................... SC 230 Session 9: Temas de Logística y Comercio Internacional ........................................................... SC 225 Session 10: Negocios y Tecnologías Nuevas ................................................................................ SC 120
11:45-12 noon Break
12-1:45 p.m. Luncheon Keynote Address .............................................................................................. SC Ballroom Sponsored by Texas Community Bank
The Causes and Consequences of Foreign Bank Entry in México Dr. Stephen Haber, The Peter and Helen Bing Senior Fellow, Hoover Institution, Stanford University
1:45-2 p.m. Break
2-3:30 p.m. Finance, Central Banking, and International Capital Flows: México and the United States ................................................................................................... SC 236 Dr. Daniel Chiquiar, Central Bank of México Dr. Mark A. Wynne, Federal Reserve Bank of Dallas Moderator: Dr. William C. Gruben, Texas A&M International University (Retired)
Texas A&M International University 19th Annual Western Hemispheric Trade Conference
April 15-17, 2015 | Laredo, Texas, USA
3

Conference Agenda (Cont.)
Thursday, April 16, 2015 (cont.)
3:30-3:45 p.m. Break & Refreshments .................................................................................... SC Rotunda, 2nd Floor
3:45-5:15 p.m. Concurrent Academic Sessions Session 11: Political Economy of Trade ........................................................................................ SC 236 Session 12: Economic Issues in Emerging Markets ................................................................... SC 231 Session 13: PLS Applications Symposium II ................................................................................ SC 230 Session 14: Foreign Direct Investment ......................................................................................... SC 225 Session 15: Industria y Economía .................................................................................................. SC 120
6:30-9 p.m. Reception & Dinner .................................................................................... Falcon Bank's Lake House Sponsored by Falcon Bank
Friday, April 17, 2015
7:30 a.m. Registration Continues ................................................................................... SC Rotunda, 2nd Floor
7:30-8 a.m. Continental Breakfast ..................................................................................... SC Rotunda, 2nd Floor Sponsored by Killam Development, Ltd.
8-9:30 a.m. Concurrent Academic Sessions Session 16: Strategies to Create Competitive Advantage ............................................................ SC 236 Session 17: Globalization and Trade ............................................................................................. SC 231 Session 18: Leyes e Inversiones Internacionales .......................................................................... SC 230 Session 19: Negocios Internacionales I ......................................................................................... SC 225
9:30-9:45 a.m. Break & Refreshments .................................................................................... SC Rotunda, 2nd Floor
9:45-11:15 a.m. Concurrent Academic Sessions Session 20: Ph.D. Student Presentations II .................................................................................. SC 236 Session 21: Corporate Social Responsibility ................................................................................. SC 231 Session 22: Marketing and Consumers .......................................................................................... SC 230 Session 23: Issues in Finance and Accounting ............................................................................. SC 225 Session 24: Negocios Internacionales II ....................................................................................... SC 120
11:15-11:30 a.m. Break & Refreshments .................................................................................... SC Rotunda, 2nd Floor Sponsored by BBVA Compass Bank
11:30-12:15 p.m. BBVA Compass Bank Chair Presentation .............................................................................. SC 236
Corruption and Development Dr. George R.G. Clarke, Distinguished Associate Professor, BBVA Compass Bank Group Chair, Texas A&M International University
12:15-12:30 p.m. Break
12:30-2:30 p.m. Luncheon Keynote Address .............................................................................................. SC Ballroom
U.S. Financial Crises: Regulatory Failures and Inappropriate Reforms Dr. James R. Barth, Lowder Eminent Scholar in Finance, Auburn University
Concluding Ceremonies & Announcement of Student Paper Competition Results
Thank you to our sponsors!
International Bank of Commerce | Falcon Bank | Texas Community Bank | BBVA Compass Bank Daniel B. Hastings, Inc. | Killam Development, Ltd. | Routledge, Taylor & Francis
4

19th Annual Western Hemispheric Trade Conference
April 15-17, 2015 | Laredo, TX, USA
James R. Barth is the Lowder Eminent Scholar in Finance at Auburn University, a Senior Fellow at the Milken Institute, and a Fellow at the Wharton Financial Institution Center. His research focuses on financial institutions and capital markets, both domestic and global, with special emphasis on regulatory issues. He served as leader of an international team advising the People's Bank of China on banking reform. Barth also participated in the U.S. Speaker and Specialist Program of the U.S. Department of State in China in 2007, India in 2008, Russia in 2009, and Egypt in 2010. Also in 2008, Barth spoke on "Competition in the Financial Sector: Challenges for Regulation" at the G-20 Workshop on Competition in the Financial Sector, Bali, Indonesia.
Barth was an appointee of Presidents Ronald Reagan and George H. W. Bush as chief economist of the Office of Thrift Supervision and previously the Federal Home Loan Bank Board. He has also held the positions of professor of economics at George Washington University, associate director of the economics program at the National Science Foundation, and Shaw Foundation Professor of Banking and Finance at Nanyang Technological University. He has been a visiting scholar at the U.S. Congressional Budget Office, Federal Reserve Bank of Atlanta, Office of the Comptroller of the Currency, and the World Bank.
Barth has testified before several U.S. Congressional Committees. He has authored more than 300 articles in professional journals and has co-authored and co-edited several books, including The Great Savings and Loan Debacle (American Enterprise Institute Press), The Reform of Federal Deposit Insurance (Harper Business), Rethinking Bank Regulation: Till Angels Govern (Cambridge University Press) in 2006, Financial Restructuring and Reform in Post-WTO China (Kluwer Law International) in 2007, The Rise and Fall of the U.S. Mortgage and Credit Markets: A Comprehensive Analysis of the Meltdown (John Wiley & Sons) in 2009, and China's Emerging Financial Markets: Challenges and Opportunities (Springer) in 2009.
His most recent books are Guardians of Finance: Making Regulators Work for Us, with Gerard Caprio and Ross Levine (MIT Press) in 2012, Fixing the Housing Market: Financial Innovations for the Future, with Franklin Allen and Glenn Yago (Wharton School Publishing-Pearson) in 2012, and Research Handbook on International Banking and Governance (Edward Elgar Publishing) in 2012. Barth is the co-editor of a forthcoming book with George Kaufman titled The First Great Financial Crisis of the 21st Century: A Retrospective. He has been quoted in publications ranging from The New York Times and Wall Street Journal to Barron's and Newsweek, and has appeared on various broadcast programs such as CCTV and National Public Radio. Barth is the co-editor of the Journal of Financial Economics, overseas associate editor of the Chinese Banker and included in Who's Who in Economics: A Biographical Dictionary of Major Economists, 1700 to 1995.
Texas A&M International University A. R. Sanchez, Jr. School of Business
Center for the Study of Western Hemispheric Trade
James R. Barth, Ph.D. “U.S. Financial Crises: Regulatory Failures and Inappropriate Reforms” Friday, April 17, 2015 | Luncheon Keynote Address | 12:30 p.m.
5

19th Annual Western Hemispheric Trade Conference
April 15-17, 2015 | Laredo, TX, USA
Texas A&M International University A. R. Sanchez, Jr. School of Business
Center for the Study of Western Hemispheric Trade
Daniel Chiquiar, Ph.D. “Finance, Central Banking, and International Capital Flows: México and the United States” Thursday, April 16, 2015 | Panel Presentation | 2 p.m.
Daniel Chiquiar earned his Ph.D. in economics at the University of California San Diego. He is currently Director of Macro-Financial Risk Analysis at México’s Central Bank. During his career, he has worked on economic research concerning the Mexican economy, both in the private and public sectors. He has held policy-related positions in México, such as Director of Economic Policy in the Finance Ministry from 1997-1999. He has also taught at several Mexican universities at the undergraduate and graduate levels, and has published several papers in top economics academic journals.
A. R. Sanchez, Jr.
School of Business
6
19th Annual Western Hemispheric Trade Conference
April 15-17, 2015 | Laredo, TX, USA
Texas A&M International University A. R. Sanchez, Jr. School of Business
Center for the Study of Western Hemispheric Trade
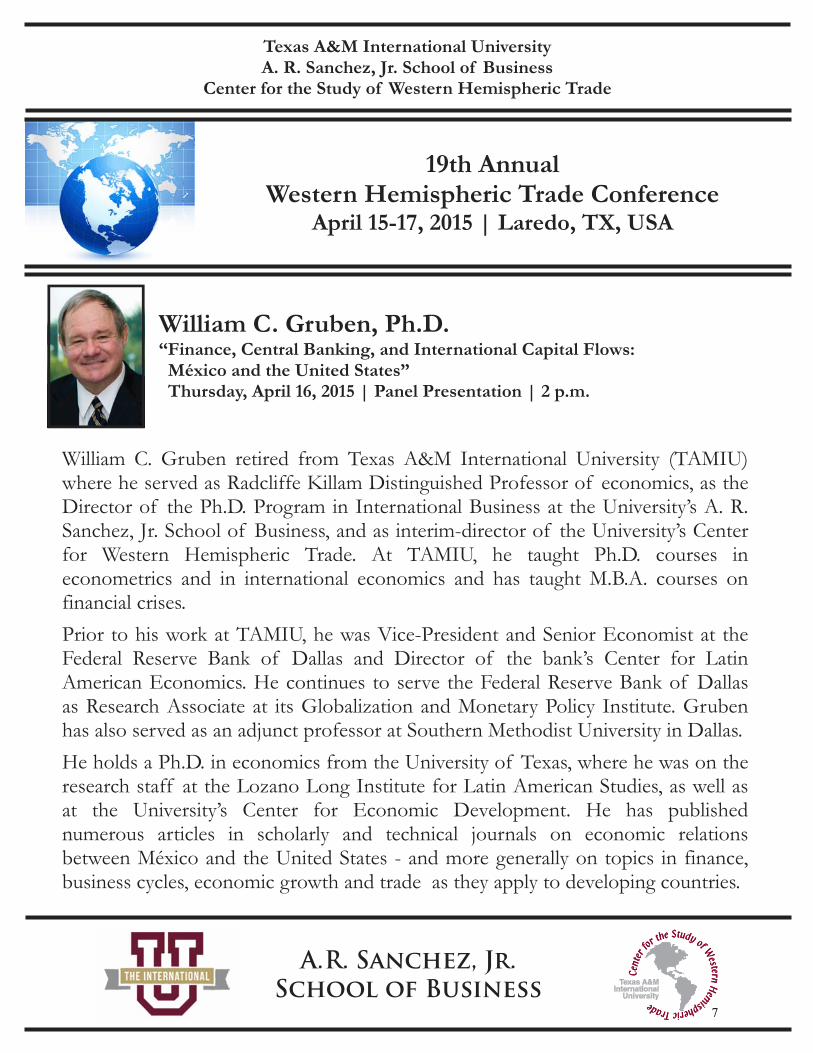
William C. Gruben, Ph.D. “Finance, Central Banking, and International Capital Flows: México and the United States” Thursday, April 16, 2015 | Panel Presentation | 2 p.m.
William C. Gruben retired from Texas A&M International University (TAMIU) where he served as Radcliffe Killam Distinguished Professor of economics, as the Director of the Ph.D. Program in International Business at the University’s A. R. Sanchez, Jr. School of Business, and as interim-director of the University’s Center for Western Hemispheric Trade. At TAMIU, he taught Ph.D. courses in econometrics and in international economics and has taught M.B.A. courses on financial crises.
Prior to his work at TAMIU, he was Vice-President and Senior Economist at the Federal Reserve Bank of Dallas and Director of the bank’s Center for Latin American Economics. He continues to serve the Federal Reserve Bank of Dallas as Research Associate at its Globalization and Monetary Policy Institute. Gruben has also served as an adjunct professor at Southern Methodist University in Dallas.
He holds a Ph.D. in economics from the University of Texas, where he was on the research staff at the Lozano Long Institute for Latin American Studies, as well as at the University’s Center for Economic Development. He has published numerous articles in scholarly and technical journals on economic relations between México and the United States - and more generally on topics in finance, business cycles, economic growth and trade as they apply to developing countries.
A. R. Sanchez, Jr.
School of Business
7

19th Annual Western Hemispheric Trade Conference
April 15-17, 2015 | Laredo, TX, USA
Stephen Haber is the A. A. and Jeanne Welch Milligan Professor in the School of Humanities and Sciences and the Peter and Helen Bing Senior Fellow at the Hoover Institution. In addition, he is a Professor of Political Science, Professor of History, and Professor of Economics (by courtesy), as well as a Senior Fellow of both the Stanford Institute for Economic Policy Research and the Stanford Center for International Development. He is among Stanford’s most distinguished teachers, having been awarded every teaching prize Stanford has to offer.
Haber has spent his academic life investigating the question of why some societies are characterized by innovation, high standards of living, and democratic governance, while other societies are characterized by poverty and autocracy. He is the author or coauthor of five books, and the editor of five more. Haber has also published numerous scholarly articles in a wide variety of fields, including economics, political science, history, and law.
Haber received his B.A. from George Washington University in 1979, and his Ph.D. from UCLA in 1985.
Texas A&M International University A. R. Sanchez, Jr. School of Business
Center for the Study of Western Hemispheric Trade
Stephen Haber, Ph.D. “The Causes and Consequences of Foreign Bank Entry in México” Thursday, April 16, 2015 | Luncheon Keynote Speaker | 12 noon
Sponsored by: Texas Community Bank
A. R. Sanchez, Jr.
School of Business
8

19th Annual Western Hemispheric Trade Conference
April 15-17, 2015 | Laredo, TX, USA
Diana Negroponte is a Public Policy Scholar at the Woodrow Wilson International Center for Scholars in Washington, D.C. She was a Senior Fellow at the Brookings Institution for eight years. As a lawyer and international trade expert, she writes and lectures on rule of law, institution building and energy in Latin America with particular focus on México and Central America. Recent articles have also looked to Venezuela and Brazil. She wrote “Central America Confronts Violence and Public Insecurity” Brookings Working Paper (2010), “The Struggle to Make Peace in El Salvador: Conflict Resolution at the End of the Cold War” (2012), and edited “The End of Nostalgia: México Confronts the Challenges of Global Competition” (2013). Her multiple articles are to be found on the Brookings website, Newsweek, the Financial Times, and on the Freedom House blog.
Dr. Negroponte is also committed to economic development, having served with VSO (the British Peace Corps) in Uganda and with International Voluntary Service in the former Yugoslavia. She builds simple houses with Habitat for Humanity International in the USA, Latin America and the Philippines. She is active in micro-finance programs through Opportunity International, having served as a trustee of both philanthropic organizations. Currently, she is a trustee of Freedom House (dedicated to the promotion of democracy and human rights), the Women’s Foreign Policy Group (promotion of women leaders in foreign policy), the Social Justice committee of Holy Trinity Church and member of the University of California, San Diego’s Institute for International Relations and Pacific Studies’ advisory board.
Educated at the London School of Economics & Political Science, Institute Catholique in Paris and the Ibero Americana in Mexico City, she received a Juris Doctor from American University and Ph.D. from Georgetown University. She has taught at Georgetown University and Fordham University in New York City.
She is the mother of five children and lives with her husband, John Negroponte, in Washington, D.C.
Texas A&M International University A. R. Sanchez, Jr. School of Business
Center for the Study of Western Hemispheric Trade
Diana Villiers Negroponte, Ph.D. “Opportunities and Challenges for México Today” Wednesday, April 15, 2015 | Keynote Speaker Series | 7:30 p.m.
Sponsored by: International Bank of Commerce
A. R. Sanchez, Jr.
School of Business
9
19th Annual Western Hemispheric Trade Conference
April 15-17, 2015 | Laredo, TX, USA
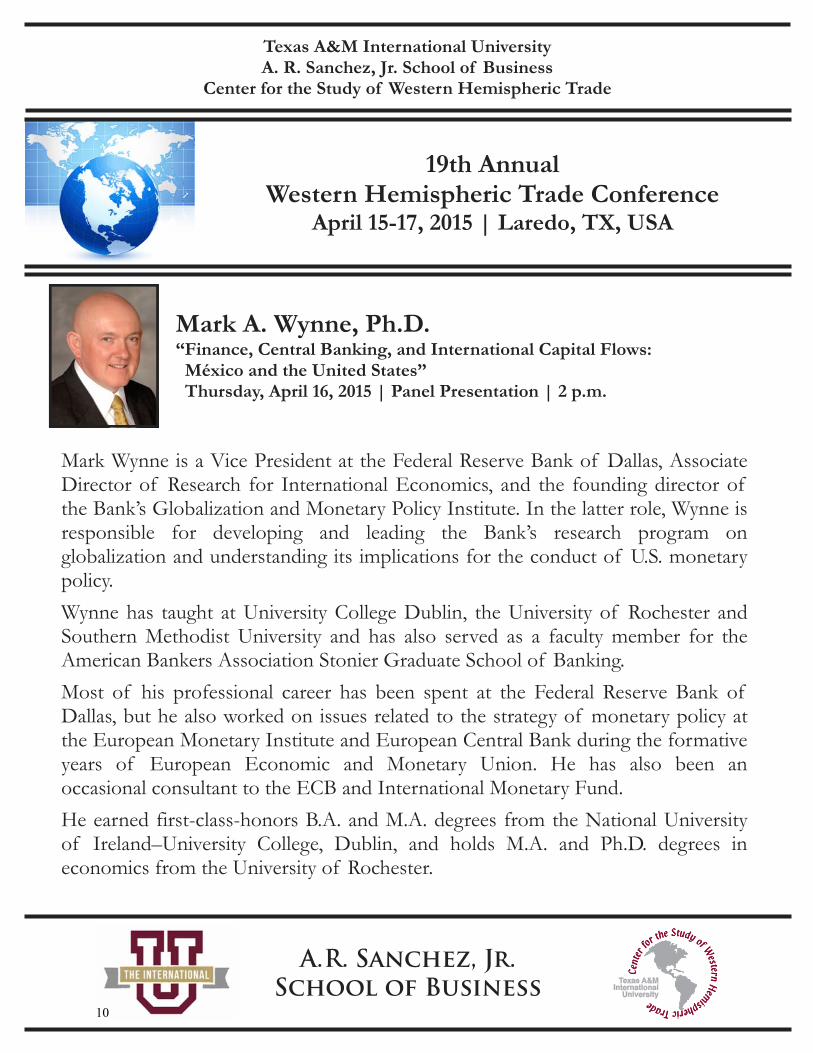
Mark Wynne is a Vice President at the Federal Reserve Bank of Dallas, Associate Director of Research for International Economics, and the founding director of the Bank’s Globalization and Monetary Policy Institute. In the latter role, Wynne is responsible for developing and leading the Bank’s research program on globalization and understanding its implications for the conduct of U.S. monetary policy.
Wynne has taught at University College Dublin, the University of Rochester and Southern Methodist University and has also served as a faculty member for the American Bankers Association Stonier Graduate School of Banking.
Most of his professional career has been spent at the Federal Reserve Bank of Dallas, but he also worked on issues related to the strategy of monetary policy at the European Monetary Institute and European Central Bank during the formative years of European Economic and Monetary Union. He has also been an occasional consultant to the ECB and International Monetary Fund.
He earned first-class-honors B.A. and M.A. degrees from the National University of Ireland–University College, Dublin, and holds M.A. and Ph.D. degrees in economics from the University of Rochester.
Texas A&M International University A. R. Sanchez, Jr. School of Business
Center for the Study of Western Hemispheric Trade
Mark A. Wynne, Ph.D. “Finance, Central Banking, and International Capital Flows: México and the United States” Thursday, April 16, 2015 | Panel Presentation | 2 p.m.
A. R. Sanchez, Jr.
School of Business
10
Comparative Analysis of the Communicational Differences between Hispanic and Non-Hispanic Subordinates when
using Motivating Language from the Perspective of Media Naturalness Theory:
A Qualitative Approach.
JAMES COX1,
Doctoral Student, A. R. Sanchez, Jr. School of Business, Texas A&M International University, Laredo, Texas, USA
The purpose of the present study is to contrast the different ways in which Hispanic and non-Hispanic individuals may best benefit from their boss’s Motivating Language (Mayfield, Mayfield & Kopf, 1998). I have only one priori supposition: Hispanics will rely more on social context to interpret their boss’s meaning (Hofstede, 1980) (Hofstede, 1984). When these differences are analyzed in the context of Media Naturalness Theory (Kock 2003) (Kock, 2005), this means that they will have an increased preference for face-to-face communications. Although I expect to find other differences, I will analyze and compare these as they arise according to Grounded Theory principles.
1 Address correspondence to James Cox, Doctoral Student, A.R. Sanchez Jr, School of Business, Laredo, Texas, USA. E-mail: [email protected]
11
Leadership Training: The Effects of Leadership Programs on Consideration of Future Consequences
THERESA SADLER1
Instructor of Applied Science, Texas A&M University-Commerce, Commerce, Texas, USA
SHONDA GIBSON, PHD
Executive Director of Global Learning and Quality Enhancement Plan, Texas A&M University-Commerce, Commerce, Texas, USA
STEPHEN REYSEN, PHD
Assistant Professor of Psychology, Texas A&M University-Commerce, Commerce, Texas, USA
The effects of leadership training on individuals' consideration of future consequences were examined. The consideration of future consequences scale was administered to undergraduate students participating for course credit in a leadership class. Participants were then randomly selected to participate in a seven week leadership training program. Midway through the semester participants completed the measure of consideration of future consequences again. Participation in the leadership training program significantly increased concern for future consequences but had no effect on concern for immediate consequences.
1 Address correspondence to Theresa Sadler, Instructor of Applied Science, Texas A&M University-Commerce, Commerce, Texas, USA. E-mail: [email protected]
12
The Mediating Effect of Trust on Workplace Spirituality and Job Performance
RUTH CHATELAIN-JARDON Texas A&M University – Kingsville, Kingsville, Texas, USA
JOSE LUIS DANIEL
1 Saint Xavier University, Chicago, Illinois, USA
JOSUE AMADOR
Texas A&M University – Kingsville, Kingsville, Texas, USA
The purpose of this paper is to study the mediating effect of trust in the relationship between three determinants of workplace spirituality (inner life, sense of community and meaningful work) and job performance. Data from Mexico and the US will be collected and analyzed using structural equation modeling. It is hypothesized that for both countries the determinants of workplace spirituality will have a positive and significant relationship with job performance and trust. In addition, it is expected a positive and significant relationship between trust and job performance and that trust mediates the relationship between workplace spirituality and employee performance.
1 Address correspondence to Jose Luis Daniel, Saint Xavier University, Chicago, Illinois, USA. E-mail: [email protected]
13
Descriptive Measurement of the Factors of Success of Indian Industry
ILYA MARIA SOTO ESPITIA, PHD1 Professor and Researcher, Public Accountability and Management Faculty,
Universidad Autonoma de Nuevo Leon, San Nicolas de Los Garza, Nuevo Leon, Mexico
MONICA BLANCO JIMENEZ, PHD Professor and Researcher, Public Accountability and Management Faculty,
Universidad Autonoma de Nuevo Leon, San Nicolas de Los Garza, Nuevo Leon, Mexico
JUAN ROSITAS MARTINEZ, PHD Professor and Researcher, Public Accountability and Management Faculty,
Universidad Autonoma de Nuevo Leon, San Nicolas de Los Garza, Nuevo Leon, Mexico The purpose of this paper is to analyze through descriptive statistics the factors that have influenced the capacity and productivity of the industry. India has been recognized worldwide as a brand for software, and this service industry has contributed significantly to the economic transformation of India. The industry has registered a compound annual growth rate of about 49% over the past three decades. Factors that have contributed to the maintenance and growth of the industry, such as: the development of talent in the company, promoting professional education, triple helix, increasing technology parks and protection of intellectual property.
KEYWORDS Tech management, key success factors, software, India
1 Address correspondence to Ilya Maria Soto Expitia, PhD, Public Accountability and Management Faculty, Universidad Autonoma de Nuevo Leon, San Nicolas de Los Garza, Nuevo Leon, Mexico. E-mail: [email protected]
14

INTRODUCTION Globalization has promoted technological progress and competition between companies, which seek greater penetration in domestic and international markets. These conditions promote the design of new strategies to increase value to your product and increase sales. In 2003 the main customers of Indian IT Information Technology were America with 69% and the European Union with 22.25% (Bajpai, et al, 2004). This research seeks to find factors that have been important to the growth of the software industry from the point of view of the actors. Globalization of enterprises’ operations, and an increased level of an enterprise’s engagement is a trend and the software industry is no exception. The software industry tries to adapt to market needs. The main resource of this industry is capital knowledge focusing on experience and expertise.
The English language has been a key element in this process (Yamao & Sekiguchi, 2014). The language has been an important competitive advantage in India compared to other developing countries.
The software industry is distinguished from other industries by rapid change in
technology; customers are national and multinational companies that demand high quality; it is an industry where there is strong international competition due to rapid obsolescence. There is no industry and institution that can operate without software impacting competitiveness, technological progress, the degree of sophistication, cost reductions and other benefits. Software permeates most industries; this strategy has been used in India. One of its main tools is the outsourcing of business processes, focuses on cost savings, business growth, satisfying the requirements of customers with a functionally oriented problem solving model (Zao & Watanabe, 2008).
The National Association of Software and Services Companies (NASSCOM) has made a
significant contribution to the development of the software industry in India because it acts as a bridge that promotes link aging, research and development. Table 1 shows part of its trajectory.
15
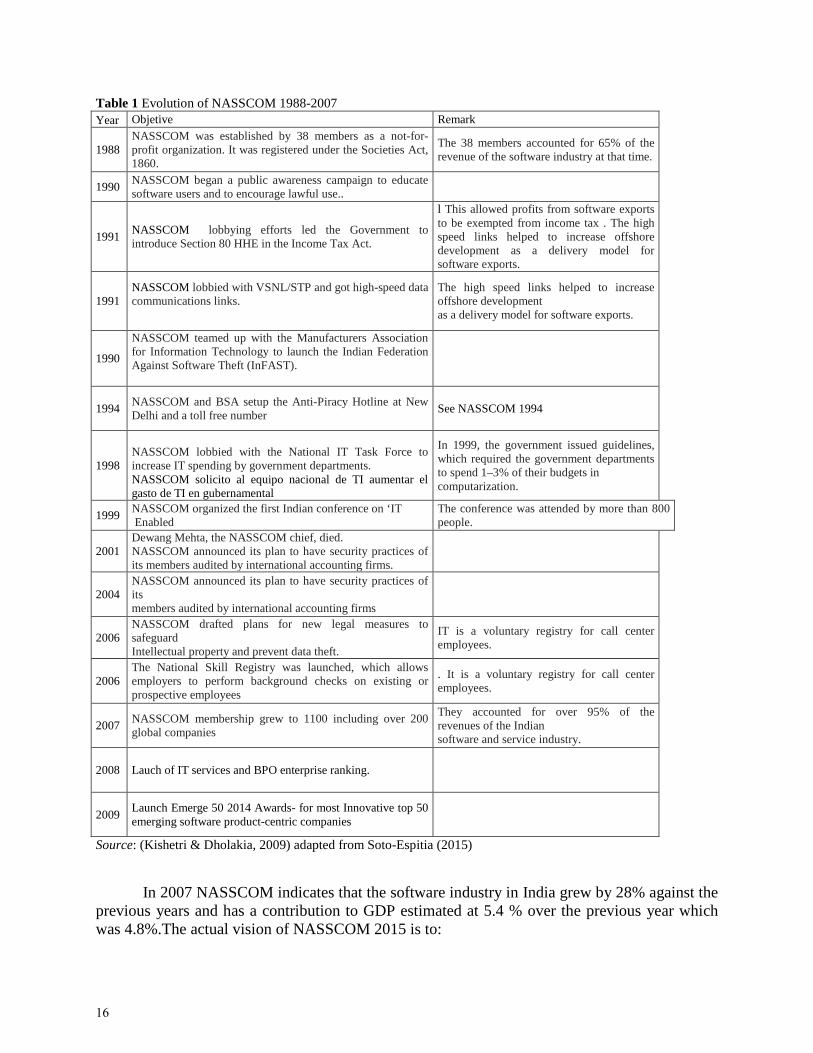
Table 1 Evolution of NASSCOM 1988-2007 Year Objetive Remark
1988 NASSCOM was established by 38 members as a not-for-profit organization. It was registered under the Societies Act, 1860.
The 38 members accounted for 65% of the revenue of the software industry at that time.
1990 NASSCOM began a public awareness campaign to educate software users and to encourage lawful use..
1991 NASSCOM lobbying efforts led the Government to introduce Section 80 HHE in the Income Tax Act.
l This allowed profits from software exports to be exempted from income tax . The high speed links helped to increase offshore development as a delivery model for software exports.
1991 NASSCOM lobbied with VSNL/STP and got high-speed data communications links.
The high speed links helped to increase offshore development as a delivery model for software exports.
1990
NASSCOM teamed up with the Manufacturers Association for Information Technology to launch the Indian Federation Against Software Theft (InFAST).
1994 NASSCOM and BSA setup the Anti-Piracy Hotline at New Delhi and a toll free number
See NASSCOM 1994
1998
NASSCOM lobbied with the National IT Task Force to increase IT spending by government departments. NASSCOM solicito al equipo nacional de TI aumentar el gasto de TI en gubernamental
In 1999, the government issued guidelines, which required the government departments to spend 1–3% of their budgets in computarization.
1999 NASSCOM organized the first Indian conference on ‘IT Enabled
The conference was attended by more than 800 people.
2001 Dewang Mehta, the NASSCOM chief, died. NASSCOM announced its plan to have security practices of its members audited by international accounting firms.
2004 NASSCOM announced its plan to have security practices of its members audited by international accounting firms
2006 NASSCOM drafted plans for new legal measures to safeguard Intellectual property and prevent data theft.
IT is a voluntary registry for call center employees.
2006 The National Skill Registry was launched, which allows employers to perform background checks on existing or prospective employees
. It is a voluntary registry for call center employees.
2007 NASSCOM membership grew to 1100 including over 200 global companies
They accounted for over 95% of the revenues of the Indian software and service industry.
2008 Lauch of IT services and BPO enterprise ranking.
2009 Launch Emerge 50 2014 Awards- for most Innovative top 50 emerging software product-centric companies
Source: (Kishetri & Dholakia, 2009) adapted from Soto-Espitia (2015)
In 2007 NASSCOM indicates that the software industry in India grew by 28% against the previous years and has a contribution to GDP estimated at 5.4 % over the previous year which was 4.8%.The actual vision of NASSCOM 2015 is to:
16
• Set strategic direction for industry • Policy advocacy for industry growth • Best practices, sharing & collaboration • International partnerships & affiliation • Workforce development • Sustainability.
In the face of volatility in the economic environment and currency, in 2011 in the IT services related sector, worldwide spending exceeded USD 1.7 trillion, a growth of 5.4 % over 2010. Some highlights of the software industry in India
NASSCOM (2009) project that the sales of software and technology services will reach 4.4 billion dollars in 2015 globally. In 2013, the government is also planning to set up Incubation Centers (National Centers of Excellence – CosE) under the PPP mode, with NASSCOM and other industry associations for supporting the Internet of Things (IoT) industry. The IoT is expected to emerge as a huge business opportunity for the Indian IT industry in the years ahead. According to the Gartner Report, the global IoT industry would be worth 300 billion dollars by 2020, with connected devices increasing to 2.7 billion by that year. Some of the objectives of the Government of India in IoT are to create an industry of USD 15 billion by 2020.
The total revenue of Big Data in 2014 was approximately 1 billion dollars; and is
anticipated to grow more than 200% and reach 2.3 billion dollars by 2018. The expectation for the domestic market is to increase by 200% reaching 375 million dollars in 2018.The number of analytics employees is projected to be 29,000 in 2020.
Business process management plan to reach $50 billion dollars in 2020 which is a very
fast evolving major industry growing at 12% annually (NASSCOM, 2013) Data value propositions of Indian software industry (NASSCOM, 2014): • Domestic IT-BPM market value estimated at 1,910 billion rupee. Growth projected for 2014,
9.7%. Number of consumers connected is 900 million, with higher adoption by retail, education and healthcare.
• Outsourcing increased in 2014: outsourcing service (IS Outsourcing) increased 18.5%, outsourcing project oriented (Custom app development & maintenance) growth 13.4%, outsourcing IT consulting (data center transformation, vertical specific expertise) 14.5% and, outsourcing (software testing) increased 18%.
• In 2014 Indian ER&D exports made up 15% of the total IT-BPM market and increased 11.1% compared to 2013. Share of ER&D by industry: 29% telecom, 19% semiconductor, 13% auto, 7% aero, 5% electronic consumer, 5% energy, 4% medical services, 19% others.
• BMP exports in 2014 are USD20 billion, growth vs. last year 11.4%. The business is focused on disruptive innovation oriented to client expectation (flexibility and offering), provider objective (platform multi tenancy, same sources in multiple clients), operating model (hybrid
17
model and governance center in process delivered), and Industry and offerings (standards process and platforms).
NASSCOM 2014 Value propositions:
i. Cost effective – optimal and flexible ii. International – scalability, security, and leadership, Number 1° NCSAT across services.
iii. Human capital – largest employable pool and diverse background. On-demand, ramp up or ramp down
iv. Ecosystem leaderships – Tiers II and III and competitive infrastructure. Lower operation costs by 10-20%
v. Customer focused leadership – end-to-end services, niche and domain capabilities. Client productivity 20-40% and multiple delivery models
vi. Maturity leadership – 100% customer benefit for productivity improvements, co-innovate, faster service than other vendors.
To increase software development, India has supported reforms that implemented growth.
In the domestic and international market, creating more competitive products and services has been encouraged. Regarding the formal sector, in employment India has undertaken reforms in the labor market; the banking sector was deregulated; India is implementing more efficient public finances; India had a more ambitious fiscal consolidation; subsidies and special tax rates that did not target specific resources were reduced; infrastructure was created to facilitate development; emphasis was placed on the participation of private investment and education as India upgraded to the current reforms (OECD, 2007).
The objective of this research is to understand the perspective of managers and middle
managers on the success factors at the macro-economic level that have led India to a position of world leadership in the field of the software industry in order to contribute to countries wishing to increase their competitiveness and sales in this industry. The factors to be measured are: Talent Development (TD), Promotion of Professional Education (PEP), the Triple Helix (3H), Increase of Technology Parks (ITP) and Protection of Intellectual Property (IPP) that contribute to growth generating sales competitiveness in the software industry.
LITERATURE REVIEW Competitive Advantage and Sales The focus of competitiveness nowadays is a macroeconomic, regional, urban and local vision (Kitson, Martin, & Tyler, 2004). Michael Storpers (1997) defined a place of competitiveness as: “the ability of an urban economy to attract and maintain firms with a stable or rising market share in an activity while maintaining or increase standards of those who participate in it”.
Michel Porter’s (1992) model of the Competitive Advantage of Nations suggested that there are four determinants of competitive advantage of a nation. The analysis of these factors (rivalry between companies, demand, supporting industries, resources), which reinforce each
18

other, serves to make rational decisions on why, how and where to internationalize business operations. Domestic rivalry, like any rivalry, creates pressure on companies to improve and innovate.
The explanation of regional competitive advantage needs to reach well beyond concern
with “hard” productivity to consider several other – and softer – dimensions of the regional or urban socio-economy. Figure 1 shows a map of the key elements that influence competitiveness: quality and skill, social networks and institutional norms, range and quality of culture, innovation and public structure (Kitson, Martin, & Tyler, 2004).
Figure 1 Bases of Regional Competitive Advantage. (Kitson, Martin & Tyler, 2004)
A representation of competitiveness is exports and internationalization, (Root, 1994). Rialp (1999) states “Internationalization is the set of operations that facilitate the establishment of more or less stable links between business and international markets, along a process of increasing involvement and international projection.” Talent Development (TD) Companies constantly seek new ways to create value. The environment for most organizations is global, complex, dynamic, highly competitive and volatile. “Human talent – the combined capacity and will of people to achieve an organization’s goal is a productive resource like no other” (Sharma, 2015).
The organization can use several ways to add talent to their employees, using modern technology to make information available to all levels of employees. The learning organization outfitted with information, knowledge and certifications will be able to move from being reactive to proactive and to interactive, thus encouraging employees to perform optimally (Dayanath Dhanraj, 2014)
Some organizations face global challenges such as staff turnover and leadership
development and succession planning processes (Conger, 2003). One solution to address these challenges in organizations is to have a system of human capital management to maintain competitiveness. Employees are attracted to companies that integrate them into its core mission,
19
not just superficially. Employees expect to stay in an authentic culture that fosters connection; looking for a job that is challenging, rapid promotion, long-term prospects and continuous training; where in addition they have skill diversity, task identity and significance, autonomy and feedback (Hackman, 1976). We also wish to represent a brand recognized for its excellence and international leadership (Ready, Hill, & Conger, 2008). Professional Education Promotion (PEP) In 1980 India started widespread professional and technical education to provide to the software and IT industry the intellectual capital to serve the global market. Capital Based Knowledge (CBK) is driving economic growth in the global market today. In the case of global value chains, much of the value of a good or service is usually created in product design, research, development and production of major components, marketing activities and branding. The creation and application of knowledge is especially critical to increase the ability of companies and organizations to develop a competitive global economy and create jobs paying wages (OECD, 2014). Measures such as the Capability Maturity Model (CMM), SPICE and the ISO26262 process model aim to provide to IT and the software sector the infrastructure to meet the requirements of the industry itself.
Software organizations need to focus on the workforce as much as the process. The relevance of education based on working process is not strong that caused the students leave the courses. Combined with the actual situation of the development of the curriculum system, that is work process oriented, based on analysis of the software industry, to describe the learning field, to develop complete learning tasks in software design and development of typical tasks for a teaching and learning situation (Zuo & Wang, 2014) Triple Helix (3H) NASSCOM leadership has been supported by interaction with the government and companies that are members of NASSCOM, and through this decentralization (Campbell, 2004) (Scott et al., 2004), there is room to thrive and other associations jointly hold more power exchange (Frankel, 2006) and rapprochement with the government. Compared to NASSCOM, the CSIA (China Software Industry Association) has a relatively minor role in the structure and practices of Chinese enterprises (Shen, 2005). Linking the theory of knowledge management and administrative strategy proposes the research collaboration involving government, universities and industry. The collaboration facilitates the exchange of knowledge and promotion of trust relationships. The goal of this collaboration is to facilitate exchange of knowledge and knowledge transfer.
Today hardly any organization has been around long enough to cover all disciplines that contribute to the generation and competitiveness of a product or service talent. Thus organizations are required to justify research and development through collaboration capacity (Chesbrough, 2003).
NASSCOM has played an important role in the field of Indian offshore services. In most
developing countries, politicians are not interested in the development of a modern economic
20
sector (e.g. offshore), the delay of competition in these economic sectors is the result(Frankel, 2006).
NASSCOM has created relationships with various levels of government agencies and
both have benefited. The former director of NASSCOM helped 19 state governments to elaborate IT policies and partnered with the Ministry of Information Technology to draft the law on data protection and privacy, to respond to the concerns of their foreign customers (Hazelwood, 2005). The goal is to bring Indian data protection laws to the same level as European and US standards (India Abroad, 2004). Increase of Technology Parks (ITP)
Economic development is focusing on planning local and regional agglomerations with special concentrations, often of the high-tech sector, because this gathering offers greater potential. Some software services are outsourced to regions like Bangalore in India (Boroughs, 2014). The increase of technology parks is a way to shorten the cycle of technological innovation processes and different areas of research and research centers can be analyzed. Activities and interactions within innovation systems affect, supply and disseminate new technologies (Freeman, 1987).
All economic, social, political, organizational and institutional aspects and other important factors influence development, diffusion and innovation (Edquist & Hommen, 2006). Each system has a limited extent. The system boundaries can be spatial, sectorial or technological. Oinas and Malecki (1999) introduced the concept of "space systems innovation," which is defined as: overlapping and national, regional and sectorial interrelation of innovation systems that manifest themselves in different configurations through space i.e. technology parks. Lawton-Smith and Ho (2006) stated that the coexistence of interdependent factors operating at a given time improves the geography of innovation and problem solving (Zao & Watanabe, 2008). Establishment of software technology parks, regulatory reforms by the Indian government, the growing Indian market and availability of a skilled work force have been important factors in boosting foreign direct investment (Rajeswari & Akilandeswari, 2015).
Providing analysis at firm level rather than by industry, this article identifies the windows
of opportunity open to Indian firms in Lithuania, with the following findings: (i) the catching-up process by Indian IT firms in Lithuania can be classified as a three-stage “body shopping – offshoring globalizing – delivery model”, comparable with the three steps in original equipment, own-design and own-brand manufacturing; (ii) the window of opportunity for Indian firms in Lithuania was primarily the techno-economic paradigm shift, and secondarily the government's regulation and support of the industry; and (iii) Indian firms in Lithuania INITIALLY partially re-invented their own path created by offshoring and globalizing their own delivery model, gradually moving to higher value-added services. Intellectual Property Protection (IPP) The protection of intellectual property has generated disputes globally about the advantages and disadvantages, future generation and transmission. Dissemination of knowledge is a phenomenon that tends to increase economic and social impact. One of the features of the global economy is
21
knowledge and intangibles (Archibugi & Filippertti, 2013). Companies are concerned about investing in research and development.
There are other currents moving against excessive regulation for the protection of intellectual property, and who argue that it involves increased costs (Shiva, 2001). The definition of intellectual property is a legal instrument designed to provide an exclusive right for certain creative activities. Patents, copyrights, trademarks, utility models, appellations of origin, among others (Archibugi & Filippertti, 2013) are included. The intellectual property legislation is national in scope. There are treaties to try to unify concepts, rights and obligations, however there are countries where the penalties or laws may be ambiguous or easy to violate. The intention to unify the 1983 Paris Convention and the Berne Convention of 1986 are the most notable efforts to harmonize certain aspects of intellectual property.
The legal systems in developing countries are far from being effective and fail to promote
an ethical organizational culture; even laws that are formulated are confusing and do not promote order in this regard (Edelman, 1997). The most important actor is the government through the creation of laws that protect intellectual property and clear penalties for offenders (Bresser, 2003).
Kshetri & Dholakia (2009) comment that professional associations (like NASSCOM)
contribute to improving the business rules on issues regarding intellectual property and the technology market because they generate institutional changes.
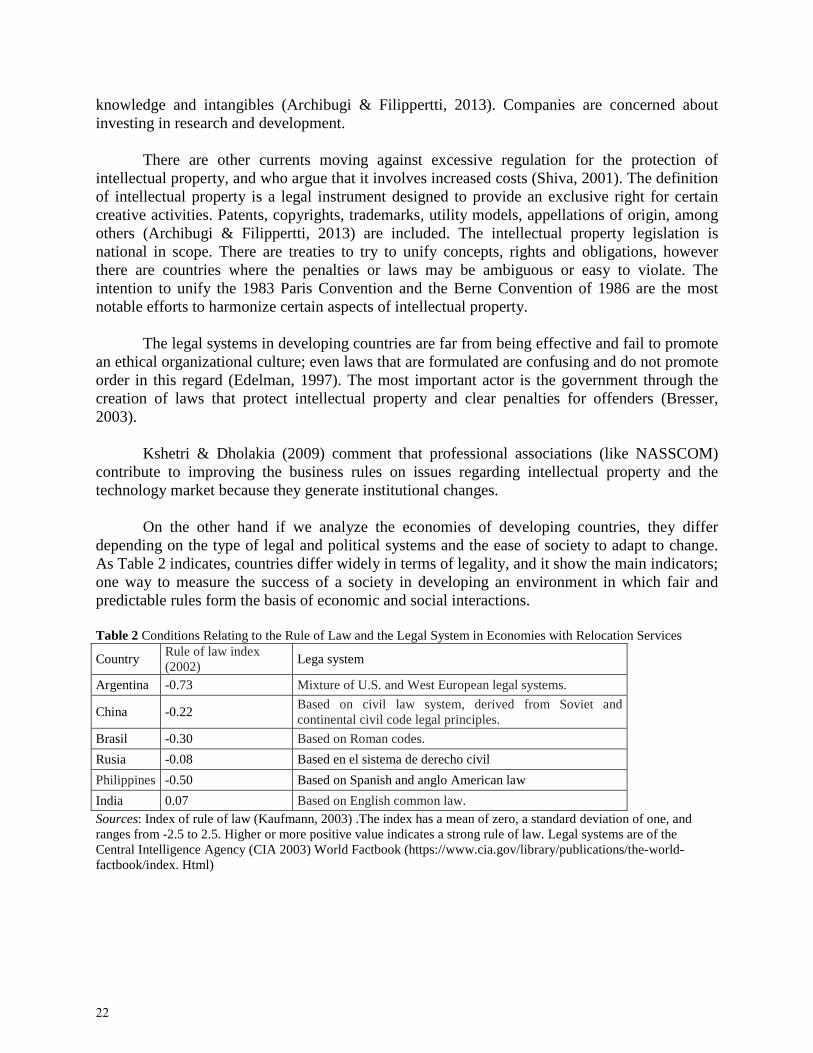
On the other hand if we analyze the economies of developing countries, they differ depending on the type of legal and political systems and the ease of society to adapt to change. As Table 2 indicates, countries differ widely in terms of legality, and it show the main indicators; one way to measure the success of a society in developing an environment in which fair and predictable rules form the basis of economic and social interactions. Table 2 Conditions Relating to the Rule of Law and the Legal System in Economies with Relocation Services
Country Rule of law index (2002)
Lega system
Argentina -0.73 Mixture of U.S. and West European legal systems.
China -0.22 Based on civil law system, derived from Soviet and continental civil code legal principles.
Brasil -0.30 Based on Roman codes.
Rusia -0.08 Based en el sistema de derecho civil
Philippines -0.50 Based on Spanish and anglo American law
India 0.07 Based on English common law. Sources: Index of rule of law (Kaufmann, 2003) .The index has a mean of zero, a standard deviation of one, and ranges from -2.5 to 2.5. Higher or more positive value indicates a strong rule of law. Legal systems are of the Central Intelligence Agency (CIA 2003) World Factbook (https://www.cia.gov/library/publications/the-world-factbook/index. Html)
22

METHODOLOGY The 6 variables considered to have a positive effect on the development of the software industry are: 1) Talent Development (TD) 2) Promotion of professional education (PEP) 3) Linking the triple helix (3H) 4) Increased technology parks (ITP) 5) Intellectual Property Protection (IPP) 6) Competitive advantage and Sales (VC)
The survey was designed in order to answer the research question, considering a sample of subjects who responded to the survey and actively participate in industry analysis. The instrument has been designed using the Likert scale values which are: the value of 1 represents strongly disagree, 2 disagree, 3 neutral, 4 agree and 5 strongly agree. The answers to the Likert scale are ordinal data. Using the Likert scale on the instrument should be applied to at least 30 cases (Nadelsticher, 1983).
The instrument was conducted in the English language with 46 respondents. It was based
on the literature review, expert advice on the software industry in Mexico and on scientific research, then 2 pilot tests in which the statistical analysis was performed using Chronbach’s alpha and the Pearson correlation. An evaluation of each item was made based on the analysis of two pilot tests which concluded that the final measurement instrument would have 46 items. The instrument consists of: 4 items to classify the profile of the respondent, 13 to classify the company profile, 5 for measuring the TD variable, 5 for measuring the PEP variable, 7 for measuring the variable 3H, 5 to measure the ITP variable, 6 to measure the IPP variable and one item to measure sales growth. 58 surveys were conducted during 2013 and 2014 to directors and managers of software companies located in Bangalore.
In 2004 in Bangalore 20 of the 52 companies were in possession of SEI-CMM Level 5. In
late 2004, in Bangalore over 240,000 employees were working in the software industry and services; in the same year Silicon Valley employed 175,000. In 2005, Bangalore produced more than 25% of total Indian software and IT services (Fundacion Auna, 2005).The universe selected was large and medium-sized software companies located in the city of Bangalore.
RESULTS We conducted 60 surveys in the software industry, which are illustrated in Figure 2, where the industry segmentation is presented. The largest sector of 48% is software development, the second most represented segment is consulting IT with 15 %, and the third segment is the area of networking and communications with 12%. Currently, Bangalore equates to major clusters of global technological development. The population of these companies (2013) is 187 according to http://freshersplane.com/ source. Table 3 shows the segmentation of the industry.
23
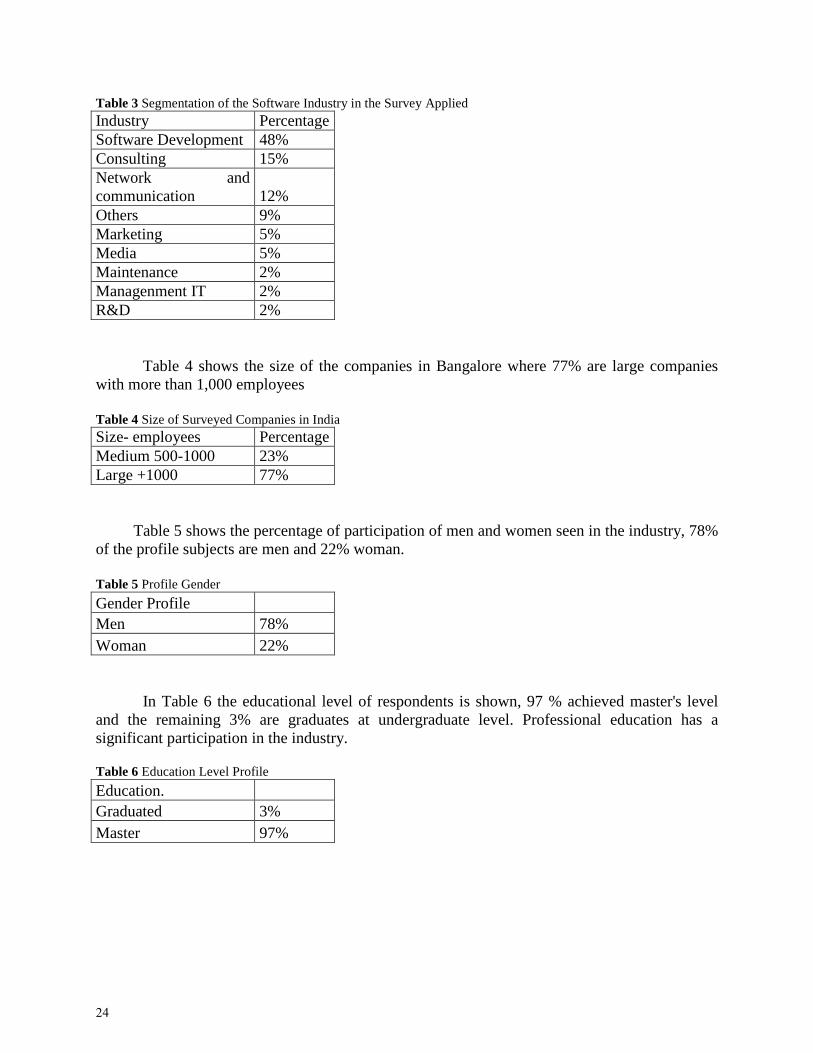
Table 3 Segmentation of the Software Industry in the Survey Applied
Industry Percentage Software Development 48% Consulting 15% Network and communication 12% Others 9% Marketing 5% Media 5% Maintenance 2% Managenment IT 2% R&D 2% Table 4 shows the size of the companies in Bangalore where 77% are large companies with more than 1,000 employees Table 4 Size of Surveyed Companies in India Size- employees Percentage Medium 500-1000 23% Large +1000 77%
Table 5 shows the percentage of participation of men and women seen in the industry, 78%
of the profile subjects are men and 22% woman.
Table 5 Profile Gender
Gender Profile Men 78% Woman 22%
In Table 6 the educational level of respondents is shown, 97 % achieved master's level and the remaining 3% are graduates at undergraduate level. Professional education has a significant participation in the industry. Table 6 Education Level Profile
Education. Graduated 3% Master 97%
24
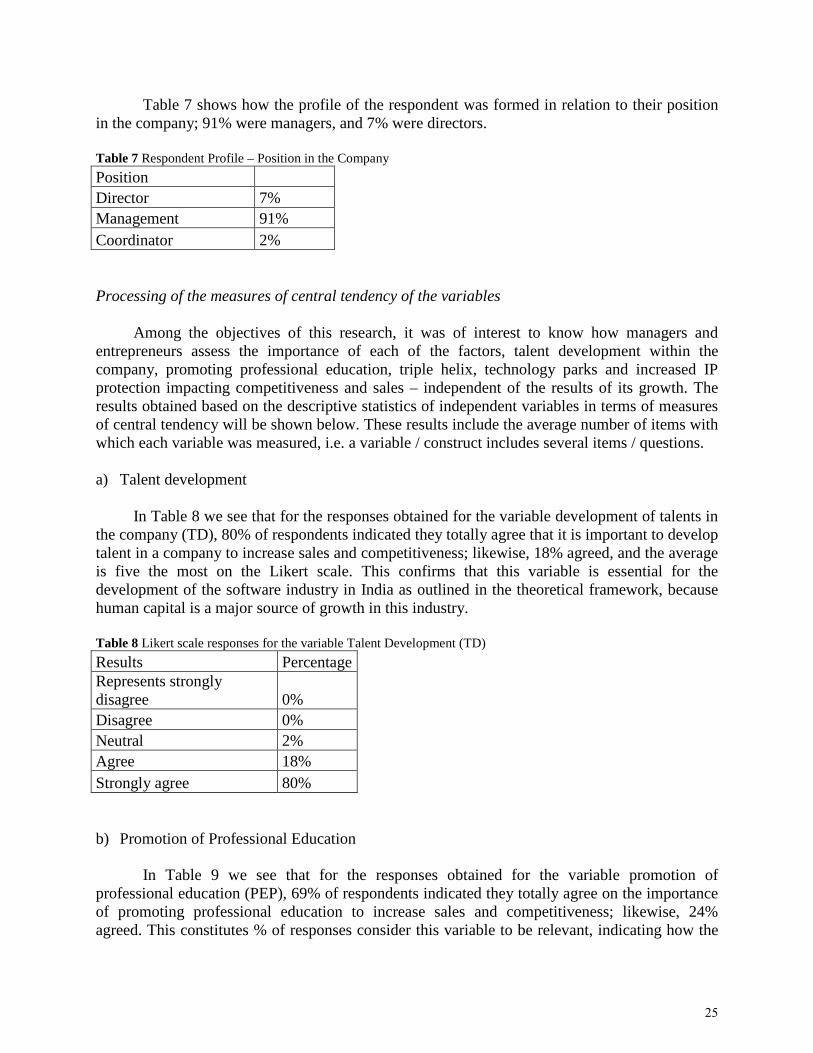
Table 7 shows how the profile of the respondent was formed in relation to their position in the company; 91% were managers, and 7% were directors. Table 7 Respondent Profile – Position in the Company
Position Director 7% Management 91% Coordinator 2% Processing of the measures of central tendency of the variables
Among the objectives of this research, it was of interest to know how managers and entrepreneurs assess the importance of each of the factors, talent development within the company, promoting professional education, triple helix, technology parks and increased IP protection impacting competitiveness and sales – independent of the results of its growth. The results obtained based on the descriptive statistics of independent variables in terms of measures of central tendency will be shown below. These results include the average number of items with which each variable was measured, i.e. a variable / construct includes several items / questions.
a) Talent development
In Table 8 we see that for the responses obtained for the variable development of talents in
the company (TD), 80% of respondents indicated they totally agree that it is important to develop talent in a company to increase sales and competitiveness; likewise, 18% agreed, and the average is five the most on the Likert scale. This confirms that this variable is essential for the development of the software industry in India as outlined in the theoretical framework, because human capital is a major source of growth in this industry. Table 8 Likert scale responses for the variable Talent Development (TD)
Results Percentage Represents strongly disagree 0% Disagree 0% Neutral 2% Agree 18% Strongly agree 80% b) Promotion of Professional Education
In Table 9 we see that for the responses obtained for the variable promotion of professional education (PEP), 69% of respondents indicated they totally agree on the importance of promoting professional education to increase sales and competitiveness; likewise, 24% agreed. This constitutes % of responses consider this variable to be relevant, indicating how the
25
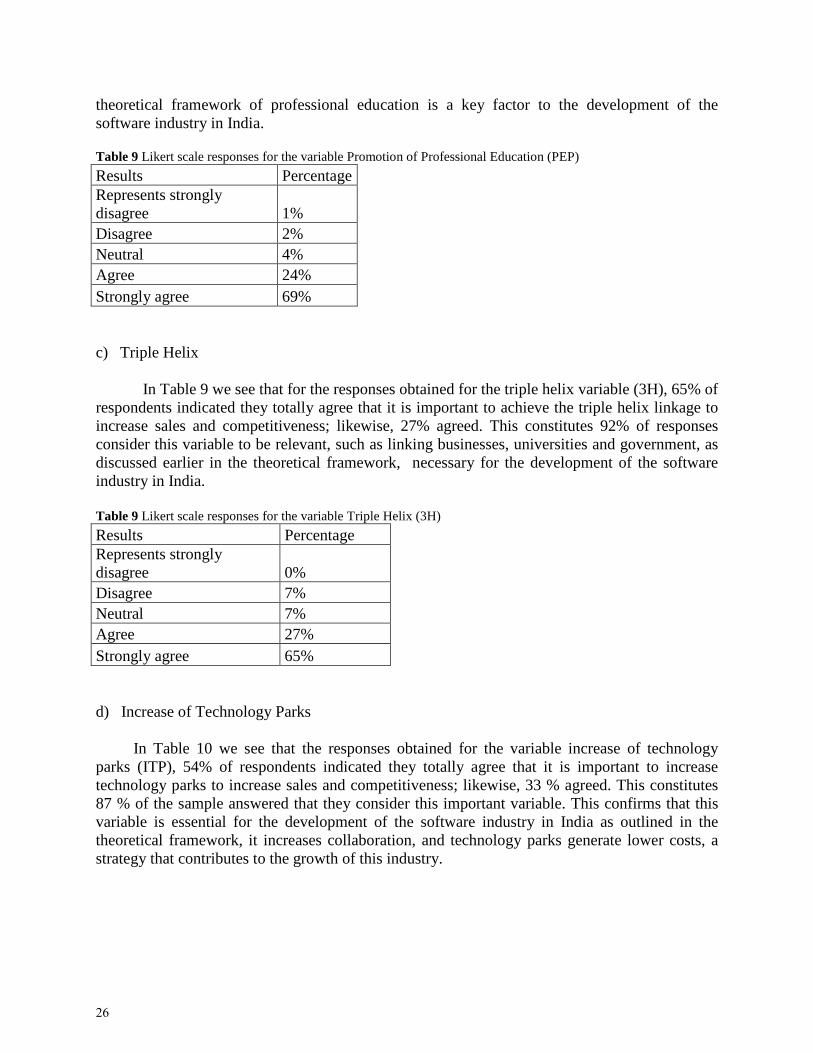
theoretical framework of professional education is a key factor to the development of the software industry in India. Table 9 Likert scale responses for the variable Promotion of Professional Education (PEP)
Results Percentage Represents strongly disagree 1% Disagree 2% Neutral 4% Agree 24% Strongly agree 69% c) Triple Helix In Table 9 we see that for the responses obtained for the triple helix variable (3H), 65% of respondents indicated they totally agree that it is important to achieve the triple helix linkage to increase sales and competitiveness; likewise, 27% agreed. This constitutes 92% of responses consider this variable to be relevant, such as linking businesses, universities and government, as discussed earlier in the theoretical framework, necessary for the development of the software industry in India. Table 9 Likert scale responses for the variable Triple Helix (3H)
Results Percentage Represents strongly disagree 0% Disagree 7% Neutral 7% Agree 27% Strongly agree 65% d) Increase of Technology Parks
In Table 10 we see that the responses obtained for the variable increase of technology
parks (ITP), 54% of respondents indicated they totally agree that it is important to increase technology parks to increase sales and competitiveness; likewise, 33 % agreed. This constitutes 87 % of the sample answered that they consider this important variable. This confirms that this variable is essential for the development of the software industry in India as outlined in the theoretical framework, it increases collaboration, and technology parks generate lower costs, a strategy that contributes to the growth of this industry.
26
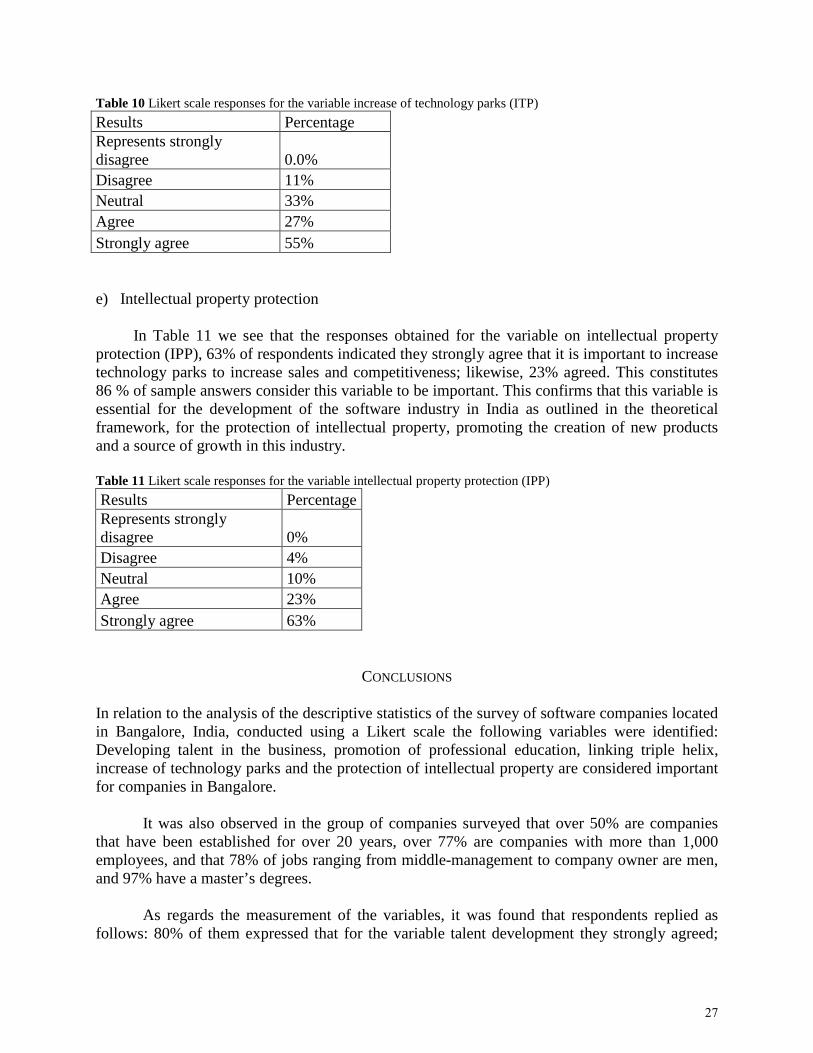
Table 10 Likert scale responses for the variable increase of technology parks (ITP)
Results Percentage Represents strongly disagree 0.0% Disagree 11% Neutral 33% Agree 27% Strongly agree 55% e) Intellectual property protection
In Table 11 we see that the responses obtained for the variable on intellectual property protection (IPP), 63% of respondents indicated they strongly agree that it is important to increase technology parks to increase sales and competitiveness; likewise, 23% agreed. This constitutes 86 % of sample answers consider this variable to be important. This confirms that this variable is essential for the development of the software industry in India as outlined in the theoretical framework, for the protection of intellectual property, promoting the creation of new products and a source of growth in this industry. Table 11 Likert scale responses for the variable intellectual property protection (IPP) Results Percentage Represents strongly disagree 0% Disagree 4% Neutral 10% Agree 23% Strongly agree 63%
CONCLUSIONS In relation to the analysis of the descriptive statistics of the survey of software companies located in Bangalore, India, conducted using a Likert scale the following variables were identified: Developing talent in the business, promotion of professional education, linking triple helix, increase of technology parks and the protection of intellectual property are considered important for companies in Bangalore.
It was also observed in the group of companies surveyed that over 50% are companies that have been established for over 20 years, over 77% are companies with more than 1,000 employees, and that 78% of jobs ranging from middle-management to company owner are men, and 97% have a master’s degrees.
As regards the measurement of the variables, it was found that respondents replied as
follows: 80% of them expressed that for the variable talent development they strongly agreed;
27

69% of respondents were entirely in agreement with the variable promotion to education, 65% of respondents strongly agreed regarding the variable triple helix, 55% of respondents strongly agreed on the variable increase of technology parks; and finally for the variable intellectual property protection 63% fully agreed in influencing competitiveness and increasing sales.
Associations can support competitiveness as in the case of NASSCOM that has provided
powerful and tangible support in venture capital, infrastructure and development of talent in this industry.
.
28
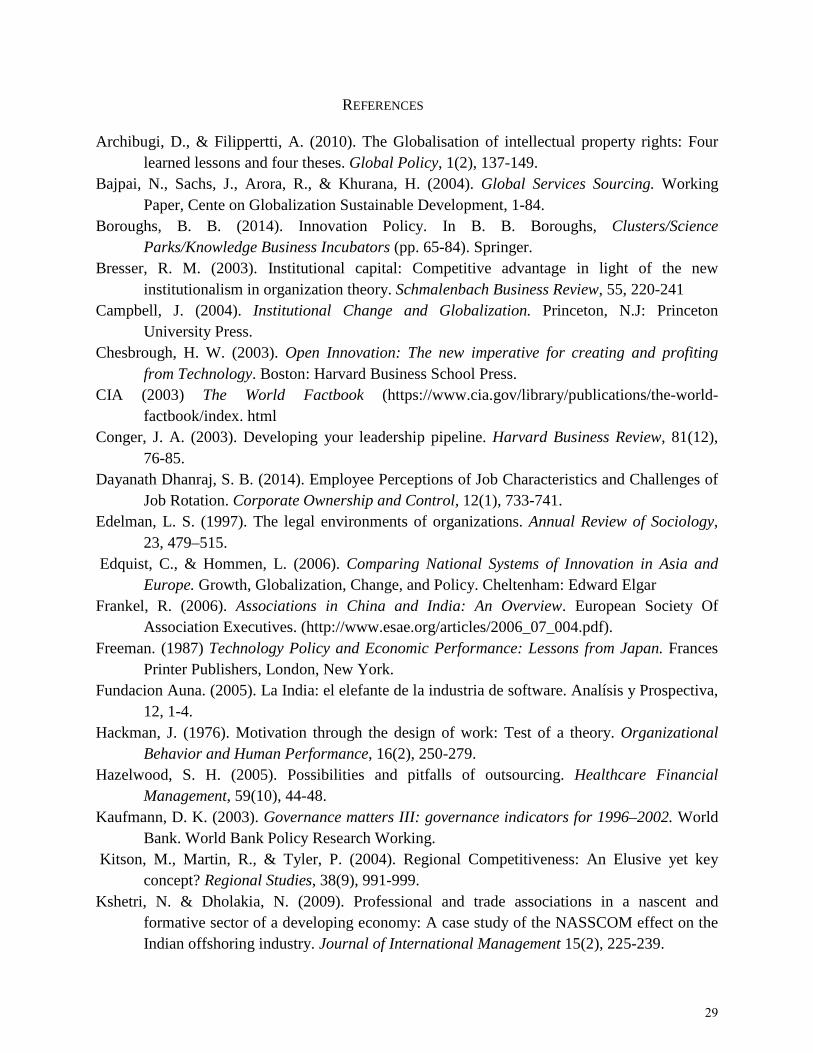
REFERENCES
Archibugi, D., & Filippertti, A. (2010). The Globalisation of intellectual property rights: Four learned lessons and four theses. Global Policy, 1(2), 137-149.
Bajpai, N., Sachs, J., Arora, R., & Khurana, H. (2004). Global Services Sourcing. Working Paper, Cente on Globalization Sustainable Development, 1-84.
Boroughs, B. B. (2014). Innovation Policy. In B. B. Boroughs, Clusters/Science Parks/Knowledge Business Incubators (pp. 65-84). Springer.
Bresser, R. M. (2003). Institutional capital: Competitive advantage in light of the new institutionalism in organization theory. Schmalenbach Business Review, 55, 220-241
Campbell, J. (2004). Institutional Change and Globalization. Princeton, N.J: Princeton University Press.
Chesbrough, H. W. (2003). Open Innovation: The new imperative for creating and profiting from Technology. Boston: Harvard Business School Press.
CIA (2003) The World Factbook (https://www.cia.gov/library/publications/the-world-factbook/index. html
Conger, J. A. (2003). Developing your leadership pipeline. Harvard Business Review, 81(12), 76-85.
Dayanath Dhanraj, S. B. (2014). Employee Perceptions of Job Characteristics and Challenges of Job Rotation. Corporate Ownership and Control, 12(1), 733-741.
Edelman, L. S. (1997). The legal environments of organizations. Annual Review of Sociology, 23, 479–515.
Edquist, C., & Hommen, L. (2006). Comparing National Systems of Innovation in Asia and Europe. Growth, Globalization, Change, and Policy. Cheltenham: Edward Elgar
Frankel, R. (2006). Associations in China and India: An Overview. European Society Of Association Executives. (http://www.esae.org/articles/2006_07_004.pdf).
Freeman. (1987) Technology Policy and Economic Performance: Lessons from Japan. Frances Printer Publishers, London, New York.
Fundacion Auna. (2005). La India: el elefante de la industria de software. Analísis y Prospectiva, 12, 1-4.
Hackman, J. (1976). Motivation through the design of work: Test of a theory. Organizational Behavior and Human Performance, 16(2), 250-279.
Hazelwood, S. H. (2005). Possibilities and pitfalls of outsourcing. Healthcare Financial Management, 59(10), 44-48.
Kaufmann, D. K. (2003). Governance matters III: governance indicators for 1996–2002. World Bank. World Bank Policy Research Working.
Kitson, M., Martin, R., & Tyler, P. (2004). Regional Competitiveness: An Elusive yet key concept? Regional Studies, 38(9), 991-999.
Kshetri, N. & Dholakia, N. (2009). Professional and trade associations in a nascent and formative sector of a developing economy: A case study of the NASSCOM effect on the Indian offshoring industry. Journal of International Management 15(2), 225-239.
29
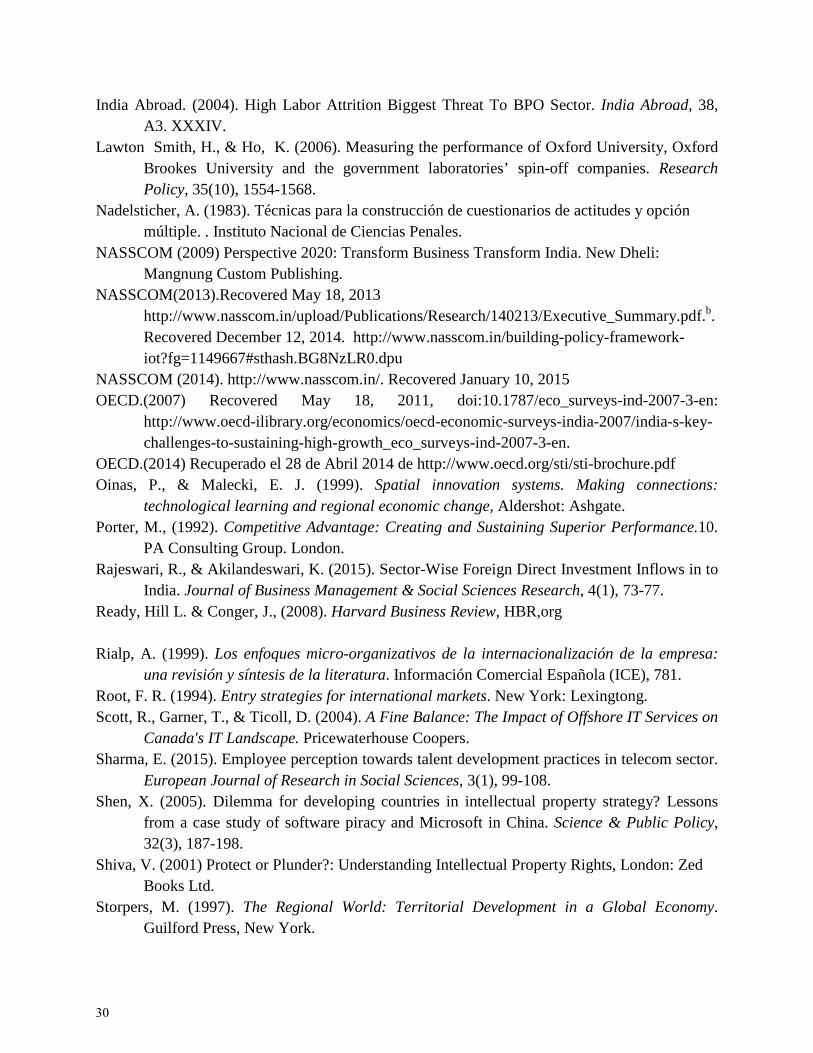
India Abroad. (2004). High Labor Attrition Biggest Threat To BPO Sector. India Abroad, 38, A3. XXXIV.
Lawton Smith, H., & Ho, K. (2006). Measuring the performance of Oxford University, Oxford Brookes University and the government laboratories’ spin-off companies. Research Policy, 35(10), 1554-1568.
Nadelsticher, A. (1983). Técnicas para la construcción de cuestionarios de actitudes y opción múltiple. . Instituto Nacional de Ciencias Penales.
NASSCOM (2009) Perspective 2020: Transform Business Transform India. New Dheli: Mangnung Custom Publishing.
NASSCOM(2013).Recovered May 18, 2013 http://www.nasscom.in/upload/Publications/Research/140213/Executive_Summary.pdf.b.Recovered December 12, 2014. http://www.nasscom.in/building-policy-framework-iot?fg=1149667#sthash.BG8NzLR0.dpu
NASSCOM (2014). http://www.nasscom.in/. Recovered January 10, 2015 OECD.(2007) Recovered May 18, 2011, doi:10.1787/eco_surveys-ind-2007-3-en:
http://www.oecd-ilibrary.org/economics/oecd-economic-surveys-india-2007/india-s-key-challenges-to-sustaining-high-growth_eco_surveys-ind-2007-3-en.
OECD.(2014) Recuperado el 28 de Abril 2014 de http://www.oecd.org/sti/sti-brochure.pdf Oinas, P., & Malecki, E. J. (1999). Spatial innovation systems. Making connections:
technological learning and regional economic change, Aldershot: Ashgate. Porter, M., (1992). Competitive Advantage: Creating and Sustaining Superior Performance.10.
PA Consulting Group. London. Rajeswari, R., & Akilandeswari, K. (2015). Sector-Wise Foreign Direct Investment Inflows in to
India. Journal of Business Management & Social Sciences Research, 4(1), 73-77. Ready, Hill L. & Conger, J., (2008). Harvard Business Review, HBR,org Rialp, A. (1999). Los enfoques micro-organizativos de la internacionalización de la empresa:
una revisión y síntesis de la literatura. Información Comercial Española (ICE), 781. Root, F. R. (1994). Entry strategies for international markets. New York: Lexingtong. Scott, R., Garner, T., & Ticoll, D. (2004). A Fine Balance: The Impact of Offshore IT Services on
Canada's IT Landscape. Pricewaterhouse Coopers. Sharma, E. (2015). Employee perception towards talent development practices in telecom sector.
European Journal of Research in Social Sciences, 3(1), 99-108. Shen, X. (2005). Dilemma for developing countries in intellectual property strategy? Lessons
from a case study of software piracy and Microsoft in China. Science & Public Policy, 32(3), 187-198.
Shiva, V. (2001) Protect or Plunder?: Understanding Intellectual Property Rights, London: Zed Books Ltd.
Storpers, M. (1997). The Regional World: Territorial Development in a Global Economy. Guilford Press, New York.
30

Yamao, S., & Sekiguchi, T. (2014). Employee commitment to corporate globalization: The role of English language proficiency and human resource practices. Journal of World Business, 50, 168-179.
Zao, W., & Watanabe, C. (2008). A comparison of institutional system affecting software advancement in China and India: The role of outsourcing from Japan and United States. Technology in Society, 30(3), 429-436.
Zuo, G.-C., & Wang, L. (2014). Research on Development Strategy of Professional Courses of Vocational Software Technology based on Working Process. International Conference on Management Science and Management Innovation. Xiangtan Hunan, China: Published by Atlantis Press.
31
Modelling the Causes of the Bullwhip Effect and its Implications to Theory of Organizational Coordination
YOHANNES YEBABE TESFAY1
Faculty of Economics, Informatics and Social Change, Molde University College,
Britveien 2, Kvam, 6402 Molde, Norway This paper proposes to analyse the potential cause of the Bullwhip effects and its implications of organizational coordination. The paper applied the panel data regression models and seemingly unrelated regression models on the experimentally simulated data from Beer distribution game. The Cochrane- Orcutt autoregression recursive estimation result of the seemingly unrelated regression models prevails that the Bullwhip effects can be caused by both intra-organizational and inter-organizational coordination of the business partners in the supply chain. The effects of the intra-organizational coordination on the Bullwhip effects showed the drawback of the existing theory of organizational coordination. The analysis showed that in order to make the supply chain more efficient and effective a new coordination type which was not discovered by the transaction cost analysis has to bring together and practiced by practitioners. We named the new coordination type the named hyper-hybrid coordination. The hyper-hybrid coordination helps us to modify the Kraljic portfolio model. Finally, we have shown some the applications of the hyper-hybrid coordination in the supply chain of agricultural products, the airline industry and the global supply chain. KEY WORDS Beer distribution game, Bullwhip effects, theories of organizational coordination, stochastic models and Supply chain management, Kraljic-Tesfay portfolio model.
1 Address correspondence to Yohannes Yebabe Tesfay, Faculty of Economics, Informatics and Social Change, Molde University College, Britveien 2, Kvam, 6402 Molde, Norway. E-mail: [email protected]
32

NEEC & C-TPAT (Benefits and Realities for the Synergy of International Trade)
NEEC & C-TPAT (Beneficios y realidades por la sinergia
del comercio Internacional)
GABRIEL MAYAGOITIA1
Universidad Autónoma de Nuevo León, FACPYA, Cd. Universitaria, San Nicolás, Nuevo León, México
In November 2001, the United States government launched the Customs-Trade Partnership Against Terrorism (C-TPAT) program. Since that day, more than 10,000 certified partners have been accepted into the program. (From U.S. Mexico & Canadian) Highway carriers; rail and sea Customs brokers; freight consolidators; manufacturers; Etc. The Mexican government complements this scheme with the NEEC: Nuevo Esquema de Empresa Certificada. (New scheme of certified company), and in 2015, the customs certification programs will be mutually recognized. We will review the benefits and the realities of this synergy in the international trade. KEYWORDS public-private partnership; supply chain, security; C-TPAT; NEEC; international trade Desde Noviembre del 2001 el Gobierno de los Estados Unidos de Norteamerica lanzó el programa “Customs-Trade Partnership Against Terrorism” (C-TPAT), a partir de esa fecha más de 10,000 asociados certificados han sido aceptados en el programa. (De Estados Unidos, México y Canadá) Transportistas, Despachos de Aduana Terrestres y Marítimos, Consolidadores de Carga, Fabricantes; Etc. El Gobierno Mexicano complementa dicho esquema con el NEEC: Nuevo Esquema de Empresa Certificada, en este año 2015, será el año del reconocimiento mutuo entre los programas de certificación, vamos a revisar los beneficios y las realidades de esta sinergia en el comercio internacional.
1 Address correspondence to Gabriel Mayagoitia, Universidad Autónoma de Nuevo León, FACPYA, Cd. Universitaria, San Nicolás, Nuevo León, México. E-mail: [email protected]
33
INTRODUCTION Following the attacks of September 11th, public and private entities recognized a need to protect the global supply chain from terrorist intrusion. Beyond the loss of human life, supply chain disruptions can have other negative impacts. These include decreased revenue and customer satisfaction resulting from delayed deliveries as well as decreased brand equity if customer perceptions of the firm are altered. Hendricks & Singhal (2005). Demonstrate these impacts can significantly devalue the affected firms’ stock price. Efforts to control supply chain security are hampered by the complexity, size, and interdependency of the network (Speier et al. 2011).
For that reason the United States develop a hybrid governance mechanism based upon public–private partnership (PPP) between the USG and private firms was necessary. The formalization of this PPP strategy was embodied in the Customs-Trade Partnership Against Terrorism (C-TPAT) (Kleindorfer and Saad 2005).
C-TPAT is administered through U.S. Customs and Border Protection (CBP), a division of the U.S. Department of Homeland Security (DHS). CBP describes C-TPAT as a, “voluntary government/private sector partnership program…for securing global supply chains and facilitating legitimate cargo and conveyances” (U.S. Customs and Border Protection 2004, 11–12). CTPAT seeks to create a critical mass of supply chain security.
This is accomplished by ensuring certified firms employ proper security measures and requiring their supply chain partners to increase security as well. In this way, C-TPAT is able to reach beyond certified firms to more widely implement security best practices in nonparticipating companies on a global basis.
PPPs have been applied in many contexts outside of security including transportation, education, construction, and financial management (Wettenhall 2003; Stewart et al. 2009). Their continued application is a function of past PPP success. One measure of C-TPAT’s success is the growth of certified firms.
C-TPAT was proposed in November 2001 and implemented in April 2002 (Sheu et al. 2006). By November 2004, its membership had grown to 7,400 partners (U.S. Customs and Border Protection 2004). This number increased to 10,572 by July 2013, 41% of whom were domestic importers, 29% carriers (motor, rail, sea, and air), 12% foreign manufacturers, 9% third-party logistics, 8% customs brokers, and 0.6% marine port authorities and terminal operators (U.S. Customs and Border Protection 2013).
With the passage of time, more reinforcement to extend this need to include the variable SECURITY to the critical factors of the value chain that impact on international trade; the United Stated supports its main international partners, and they have responded with a series of programs, taking as a basis the C-TPAT, in order to significantly reduce the impact on their economies to become a certified partner, and increment the synergy.
More than ever before, protecting every country national security depends on dynamic and innovative trade legislation and it s controls. An effective export/ import control policy
34
would recognize the reality that the national security is improved by enabling industries to thrive. U.S. national security and should be based on maintaining technological edge through innovation, not on a doomed effort to hoard as much technology as possible. (Barragan, J. & Mayagoitia, G. 2006)
CUSTOMS-TRADE PARTNERSHIP AGAINST TERRORISM MUTUAL RECOGNITION Mutual Recognition refers to those activities associated with the signing of a document between U.S. Customs and Border Protection (CBP) and a foreign Customs Administration that provides for the exchange of information. The document, referred to as an “arrangement”, indicates that the security requirements or standards of the foreign industry partnership program, as well as its validation or audit procedures, are the same or similar with those of the Customs-Trade Partnership Against Terrorism (C-TPAT) program.
The essential concept of MR is that C-TPAT and the foreign program are compatible in both theory and practice so that one program may recognize the validation findings of the other program. Mutual Recognition as a concept is reflected in the World Customs Organization’s Framework of Standards to Secure and Facilitate Global Trade, a strategy designed with the support of the United States which enables Customs Administrations to work together to improve their capability in detecting high-risk consignments and expediting the movement of legitimate cargo.
Through Mutual Recognition, international industry partnership programs are linked so that together they create a unified and sustainable security posture that can assist in securing and facilitating global cargo trade. Mutual Recognition promotes end to end supply chain security based on program membership.
CURRENT STATUS As of December 2014, CBP has signed ten MRA’s:
35
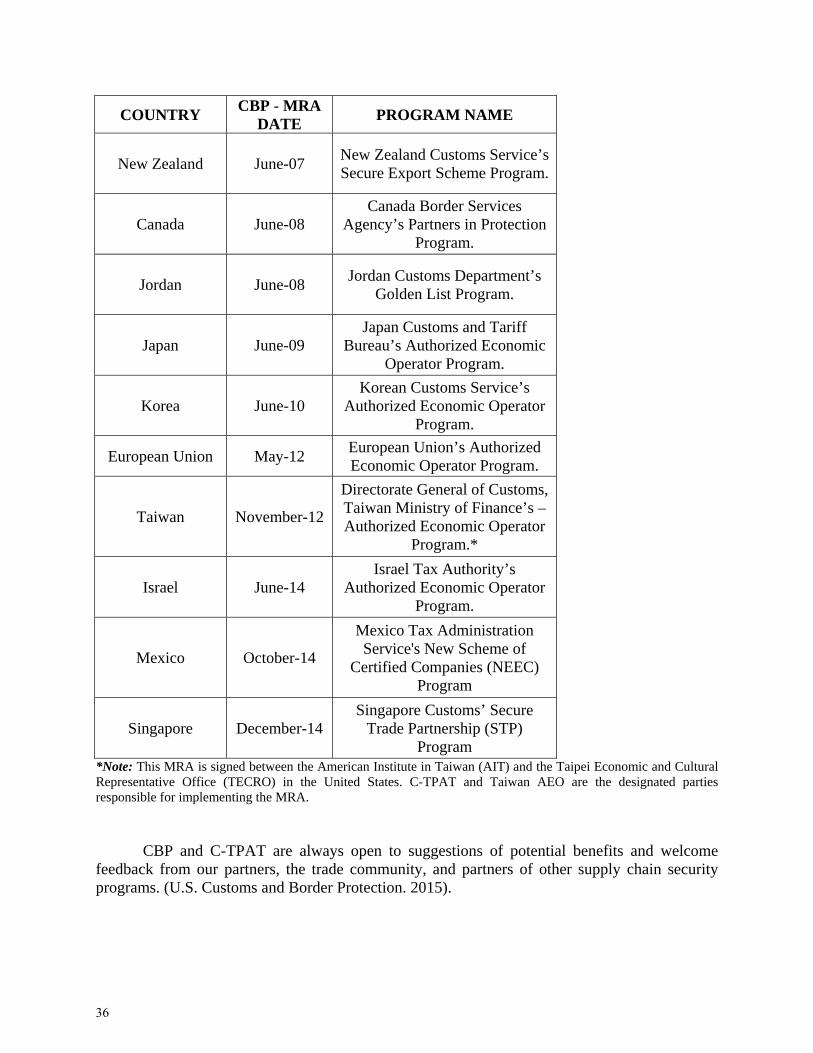
COUNTRY CBP - MRA
DATE PROGRAM NAME
New Zealand June-07 New Zealand Customs Service’s Secure Export Scheme Program.
Canada June-08 Canada Border Services
Agency’s Partners in Protection Program.
Jordan June-08 Jordan Customs Department’s
Golden List Program.
Japan June-09 Japan Customs and Tariff
Bureau’s Authorized Economic Operator Program.
Korea June-10 Korean Customs Service’s
Authorized Economic Operator Program.
European Union May-12 European Union’s Authorized Economic Operator Program.
Taiwan November-12
Directorate General of Customs, Taiwan Ministry of Finance’s – Authorized Economic Operator
Program.*
Israel June-14 Israel Tax Authority’s
Authorized Economic Operator Program.
Mexico October-14
Mexico Tax Administration Service's New Scheme of
Certified Companies (NEEC) Program
Singapore December-14 Singapore Customs’ Secure
Trade Partnership (STP) Program
*Note: This MRA is signed between the American Institute in Taiwan (AIT) and the Taipei Economic and Cultural Representative Office (TECRO) in the United States. C-TPAT and Taiwan AEO are the designated parties responsible for implementing the MRA.
CBP and C-TPAT are always open to suggestions of potential benefits and welcome feedback from our partners, the trade community, and partners of other supply chain security programs. (U.S. Customs and Border Protection. 2015).
36
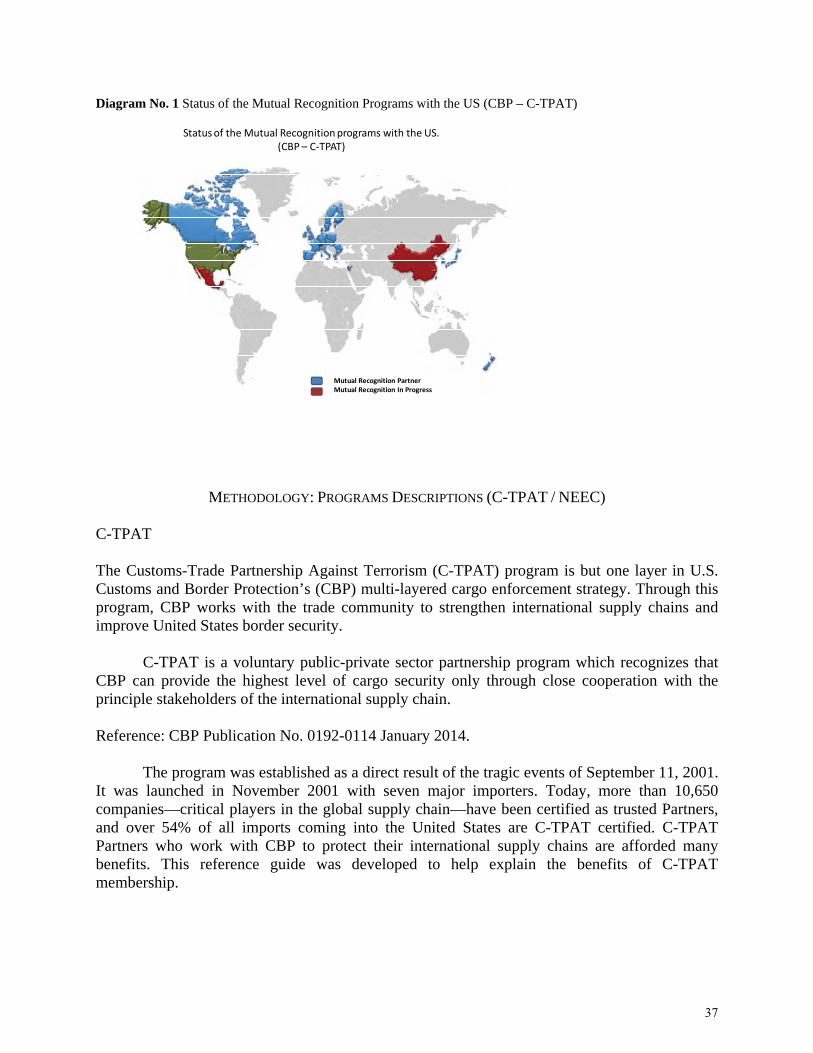
Diagram No. 1 Status of the Mutual Recognition Programs with the US (CBP – C-TPAT)
Mutual Recognition Partner Mutual Recognition In Progress
Status of the Mutual Recognition programs with the US. (CBP – C‐TPAT)
METHODOLOGY: PROGRAMS DESCRIPTIONS (C-TPAT / NEEC) C-TPAT The Customs-Trade Partnership Against Terrorism (C-TPAT) program is but one layer in U.S. Customs and Border Protection’s (CBP) multi-layered cargo enforcement strategy. Through this program, CBP works with the trade community to strengthen international supply chains and improve United States border security.
C-TPAT is a voluntary public-private sector partnership program which recognizes that CBP can provide the highest level of cargo security only through close cooperation with the principle stakeholders of the international supply chain. Reference: CBP Publication No. 0192-0114 January 2014.
The program was established as a direct result of the tragic events of September 11, 2001. It was launched in November 2001 with seven major importers. Today, more than 10,650 companies—critical players in the global supply chain—have been certified as trusted Partners, and over 54% of all imports coming into the United States are C-TPAT certified. C-TPAT Partners who work with CBP to protect their international supply chains are afforded many benefits. This reference guide was developed to help explain the benefits of C-TPAT membership.
37
C-TPAT PARTNER BENEFITS Reduced Examination Rates for C-TPAT Importers. Access to the Free and Secure Trade (FAST) Lanes. Stratified Exam Benefit for importer Partners. Front of the Line Processing. Business Resumption. Expedited Trade Processing. Access to a C-TPAT Supply Chain Security Specialist (SCSS). Access to the C-TPAT Portal System. Eligibility to Attend C-TPAT’s Annual Conference. Eligibility to Participate in the Importer Self-Assessment (ISA) Program. Penalty Mitigation. Eligibility to Other Programs. NEEC The new scheme of companies certifies (NEEC) is a program that seeks to strengthen the security of the supply chain of the foreign trade. To do this, what is does is make implementing internationally recognized minimum standards of security in coordination with the private sector and which grant benefits to the participating companies.
In any case, companies wishing to belong to the NEEC must fulfill certain requirements, which may include on three principles of compliance: Attorney Customs Security
On the other hand, you have to know that you it’s a scheme focused on export and first stage is aimed at manufacturing and marketing companies. BENEFITS: Personal attention Exclusive lanes Facilitation in customs clearance Simplification and administrative facilities Special services Requirement to get the Certification: Having carried out operations of foreign trade, at least, three years prior to the date of
application.
38
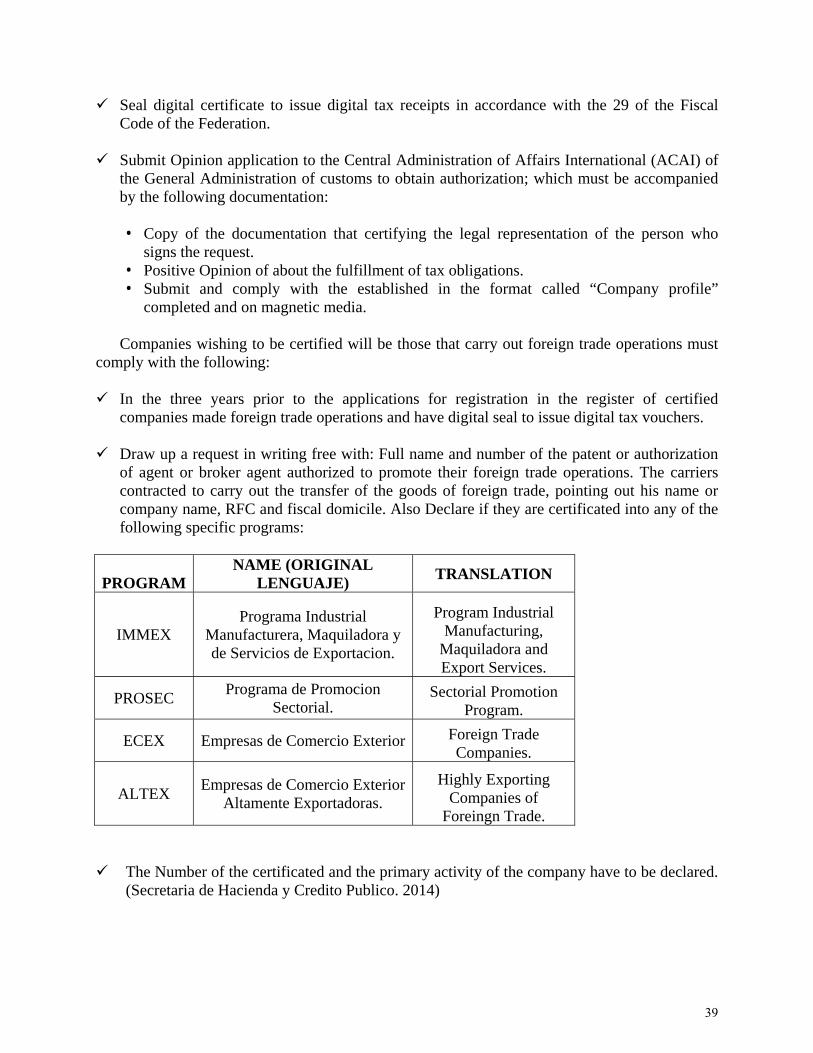
Seal digital certificate to issue digital tax receipts in accordance with the 29 of the Fiscal Code of the Federation.
Submit Opinion application to the Central Administration of Affairs International (ACAI) of
the General Administration of customs to obtain authorization; which must be accompanied by the following documentation:
• Copy of the documentation that certifying the legal representation of the person who
signs the request. • Positive Opinion of about the fulfillment of tax obligations. • Submit and comply with the established in the format called “Company profile”
completed and on magnetic media.
Companies wishing to be certified will be those that carry out foreign trade operations must comply with the following: In the three years prior to the applications for registration in the register of certified
companies made foreign trade operations and have digital seal to issue digital tax vouchers.
Draw up a request in writing free with: Full name and number of the patent or authorization of agent or broker agent authorized to promote their foreign trade operations. The carriers contracted to carry out the transfer of the goods of foreign trade, pointing out his name or company name, RFC and fiscal domicile. Also Declare if they are certificated into any of the following specific programs:
PROGRAM NAME (ORIGINAL
LENGUAJE) TRANSLATION
IMMEX Programa Industrial
Manufacturera, Maquiladora y de Servicios de Exportacion.
Program Industrial Manufacturing,
Maquiladora and Export Services.
PROSEC Programa de Promocion
Sectorial. Sectorial Promotion
Program.
ECEX Empresas de Comercio Exterior Foreign Trade Companies.
ALTEX Empresas de Comercio Exterior
Altamente Exportadoras.
Highly Exporting Companies of
Foreingn Trade.
The Number of the certificated and the primary activity of the company have to be declared. (Secretaria de Hacienda y Credito Publico. 2014)
39
NEEC CHECK LIST The following topics are included into the NEEC Check List.
1. Security in Supply Chain Planning 2. Physical Security. 3. Physical Access Controls. 4. Business Partners. 5. Process warranty. (Safety) 6. Customs Management. 7. Safety of the vehicles, containers, railway cars, trailers or semi trailers. 8. Safety of Personnel. 9. Security of Information and Documentation. 10. Training in Safety and Awareness. 11. Management and Investigation of Incidents.
MUTUAL RECOGNITION The Secretaria de Hacienda y Credito Publico. (SHCP) provides that for the year 2015, Mexico and United States achieve mutual recognition between custom certification programs, NEEC and C-TPAT.
With this recognition benefits are granted to expedite the bilateral trade registered companies.
The Governments o both countries carry out several stages to ensure that the foreign trade companies made a single certification which is endorsed by the opposing party, whether the NEEC or C-TPAT. This would involve logistical and economic benefits as well as reliability in NEEC 300 enterprises and around 10,000 C-TPAT supply chain.
According to SHCP, companies NEEC is audited them less than 1% in exports or imports, while audits to the rest of the companies soar to 17 percent. The NEEC provides also facilities administrative and operational use of fast and express lanes at the border, rectifications of motions, greater permanency of temporary imports, simplifying the processes of “nationalization” of materials and reductions of fines.
BENEFITS OF THE MUTUAL RECOGNITION Mutual Recognition arrangements result in benefits to both the public and private sectors. Some of the benefits to the trade community include: Lower Risk Score — Partners covered by a MRA are considered trusted members of the trade community by both Customs Administrations since their security standards have been validated by either CBP or the Foreign Customs Administration. As such, C-TPAT importer Partners that also conduct export operations and Partners of the foreign Customs Administration programs –
40
manufacturers and exporters of record—are given a reduction in their overall cargo risk score; this reduction in turn translates into fewer examinations at the ports of importation and exportation. Less Redundancy/Duplication of Efforts — Foreign companies do not have to go through two separate government validation visits or audits. The validation conducted by the foreign Customs Administration when the company is initially certified by its partnership program is recognized by C-TPAT if an MRA is in place. That is, CBP recognizes the status of that Partner in the foreign partnership program and, therefore, a C-TPAT validation of that overseas Partner is not warranted. Common Standard/Trade Facilitation — Companies aligned by Mutual Recognition only have to adhere to a common set of security requirements. Avoiding multiple sets of requirements from one partnership program to the next facilitates international trade as shipments move through different countries in the supply chain. Transparency — Closer collaboration among and between Customs Administrations and their partnership program companies leads to more transparency in international commerce. Information exchanged between these partners expedites and facilitates the movement of commerce across Mutual Recognition Partner nations. (U.S. Customs and Border Protection Office of Field Operations C-TPAT, 2014)
FINAL REMARKS
International trade is the exchange of goods and services between countries. This type of trade gives rise to a world economy, in which prices, or supply and demand, affect and are affected by global events. Political change in Asia, for example, could result in an increase in the cost of labor, thereby increasing the manufacturing costs for an American sneaker company based in Malaysia, which would then result in an increase in the price that you have to pay to buy the tennis shoes at your local mall. A decrease in the cost of labor, on the other hand, would result in you having to pay less for your new shoes.
Trading globally gives consumers and countries the opportunity to be exposed to goods and services not available in their own countries. Almost every kind of product can be found on the international market: food, clothes, spare parts, oil, jewelry, wine, stocks, currencies and water. Services are also traded: tourism, banking, consulting and transportation. A product that is sold to the global market is an export, and a product that is bought from the global market is an import. Imports and exports are accounted for in a country's current account in the balance of payments. Garcia Sordo (2001)
But since 2001 we required to recognized a need to protect the global chain from terrorism, programs like C-TPAT & NEEC are required and the companies will take in consideration the cost of this implementation, or consider it as an investment for the potential to be certified.
41
The Security is the new concept in SCM and this mutual recognition is part of it.
Programs like NEEC & C-TPAT helps firms prepare for security issues and certificated firms are more readily prepared to respond to security incidents. A main component of this mutual recognition is encouraging the creation and maintenance of contingency plans from each side of the frontier.
NEEC & C-TPAT certifications exhibit higher levels of performance, this information can be used as factor to determinate potential vendors from other countries.
42
REFERENCES Barragan, J. & Mayagoitia, G. 2006 "Mexico into the globallization: Nuevo Leon, the safe
border for international trade program." Innovaciones de Negocios 3(2): 175-184 Douglas Voss, M., and Williams, Z. 2013. “Public–Private Partnerships and Supply Chain
Security: C-TPAT as an Indicator of Relational Security.” Journal of Business Logistics, 2013, 34(4): 320–334
Garcia Sordo, J. 2001 "Marketing International". Mc Graw Hill. P 176 Hendricks, K.B., and Singhal, V.R. 2005. “An Empirical Analysis of the Effect of Supply Chain
Disruptions on Long - Run Stock Price Performance and Equity Risk of the Firm.”Production and Operations Management 14(1):35–52.
Kleindorfer, P.R., and Saad, G.H. 2005. “Managing Disruption Risks in Supply Chains.” Production and Operations Management 14(1):53–68.
Secretaria de Hacienda y Credito Publico. 2014 "Nuevo Esquema de Empresa Certificada". http://www.sat.gob.mx/aduanas/neec/Paginas/apartado_L.aspx
Sheu, C., Lee, L., and Niehoff, B. 2006. “A Voluntary Logistics Security Program and International Supply Chain Partnership.” Supply Chain Management: An International Journal 11(4):363–74.
Speier, C., Whipple, J.M., Closs, D.J., and Voss, M.D. 2011. “Global Supply Chain Design Considerations: Mitigating Product Safety and Security Risks.” Journal of Operations Management 29(7/8):721–36.
U.S. Customs and Border Protection. 2004. “Securing the Global Supply Chain: Customs-Trade Partnership Against Terrorism Strategic Plan.” www.cbp.gov, 1–38.
U.S. Customs and Border Protection. 2013. “C-TPAT Program Achievements.” http://www.cbp.gov/xp/cgov/trade/cargo_security/ctpat/ctpat_news_reports/
U.S. Customs and Border Protection Office of Field Operations C-TPAT. CBP Publication No. 0192-0114 January 2014. www.cbp.gov/ctpat
U.S. Customs and Border Protection. 2015. “Mutual Recognition” http://www.cbp.gov/border-security/ports-entry/cargo-security/c-tpat-customs-trade-partnership-against-terrorism/mutual-recognition
Wettenhall, R. 2003. “The Rhetoric and Reality of Public-Private Partnerships.” Public Organization Review 3(1):77–107.
43
New Economic Development Opportunities in China: Free Trade Zones and Cross-Border E-Commerce
HAIBO WANG1
Texas A&M International University Laredo, Texas, USA
The economic slowdown and the urgency of restructure of its traditional industry, Chinese government leaders consider the new established free trade zones and cross-border e-commerce as the new economic development opportunities to maintain its 7% GDP growth rate. We will discuss the impact of this national strategy on international trade and the opportunity for the business in the states to win over China’s e-commerce. Interactive discussion will be the form of this presentation.
1 Address correspondence to Haibo Wang, Texas A&M International University, Laredo, Texas, USA. E-mail: [email protected]
44
Firm Registration and Bribes: Results from a Microenterprise Survey in Africa
GEORGE R.G. CLARKE
Associate Professor, Division of International Banking and Finance Studies,
A.R. Sanchez, Jr. School of Business, Texas A&M International University,
Laredo, Texas, USA
If corrupt bureaucrats target registered firms, then corruption may discourage registration. Using data from a survey of 4,801 microenterprises in Zambia, this paper looks at whether corruption is a more or less serious problem for registered firms. The results suggest that registered firms are more concerned about corruption than unregistered firms. This is consistent with the cross-country evidence that informality is more common in countries were corruption is high because it suggests that remaining informal and out-of-sight might allow firms to avoid the demands for bribes. The paper also looks at two possible reasons why registered firms might be more concerned about corruption: (i) registered firms might be involved in more transactions with government officials allowing for more opportunities for bribes; and (ii) corrupt officials might target registered firms during specific transactions, perhaps because registered firms appear to be more profitable. The evidence supports the first, but not second, explanation. Registered firms were more likely to be involved in transactions with government or parastatal officials that could involve bribes but were no more likely to pay bribes during any specific transaction. KEYWORDS Zambia; Africa; Corruption; Informality; Bribes. JEL CODES K42; D73; O17; E26.
Address correspondence to George R.G. Clarke, Associate Professor, Division of International Banking and Finance Studies, A.R. Sanchez, Jr. School of Business, Texas A&M International University, Laredo, Texas, USA. E-mail: [email protected]. The data used in this paper are from the Zambia Business Survey, which was collected for the World Bank, FinMark Trust—Zambia, and Zambia Business Forum. I would like to thank W. Marie Sheppard, Manju Shah and participants at the Public Choice Society meetings and a seminar at Texas A&M International University for helpful comments. Responsibility for all errors, omissions, and opinions rests solely with the author.
45

I. INTRODUCTION Informality is a serious problem in many developing countries.1 It undermines government’s ability to meet social goals through spending and regulation. It also poses a problem for firms that pay their taxes and comply with government regulations—informal firms that avoid these have a cost advantage over them.
One of the many concerns about petty corruption is that it might encourage informality. Firms might remain informal—and out-of-sight—to hide from corrupt officials. The cross-country evidence is consistent with this—informality is more common in developing countries with greater corruption (Buehn and Schneider, forthcoming; Dreher and Schneider, 2010; Friedman and others, 2000; May and others, 2002).
Petty corruption might discourage firms from becoming formal in several ways. The
most direct is by making registration slower and more costly. But petty corruption might also indirectly discourage firms from registering. If becoming formal makes firms more visible to the authorities, then it could expose them to bribe demands from bureaucrats not involved in registration. Remaining out-of-sight might protect against ‘predatory behavior by government officials seeking bribes from anyone with officially registered economic behavior’ (Johnson and others, 2000, p. 496).
In other ways, however, petty corruption might encourage firms to formalize. Firms that
are not registered or that do not comply with tax and regulatory requirements might have to pay bribes if caught. Moreover, managers of unregistered firms might be less willing to report corrupt officials or seek legal protection against bribe demands if they are concerned that getting involved with the authorities might lead to problems because they are unregistered. Because of this, corrupt officials might be more willing to target informal firms.
Rather than using macroeconomic data, this paper uses data from a survey of micro and
small enterprises (MSEs) in Zambia to look at the interaction between informality and corruption. Firm-level data allows us to more easily assess how formalization affects the degree to which firms within a particular institutional environment are affected by petty corruption and to identify possible reasons for this. We classify MSEs as informal if they are not registered with government agencies—probably the most natural way to identify informal firms with firm-level data. Given than less than one in twenty MSEs in Zambia are registered with any government agency, this should capture much informality.
We find that registered firms are more concerned about corruption than unregistered
firms. In part, this might be because registered MSEs are more visible—larger, more capital intensive, and more urban. After controlling for differences along these dimensions, the gap in views between formal and informal firms about corruption become smaller.
But differences in observable characteristics do not fully explain the difference in
perceptions. Even after controlling for these differences, firms that are registered for taxes
1 See Schneider and Enste (2000) for a survey of the causes and consequences of informality.
46
appear to be more concerned about corruption than other firms. We look at two possible explanations for this: (i) whether corrupt officials target registered firms for bribes during some specific transactions that were asked about on the survey—perhaps because they are better performing; and (ii) whether registered firms are more likely to be involved in transactions with corrupt officials.
The empirical results support the second, but not the first, explanation. Registered
enterprises are no more likely to have bribes requested during their transactions with government officials than unregistered firms. But they are more likely to engage in these transactions. This suggests that firms that are registered for taxes might be more concerned about corruption because they interact more with government officials rather than because government officials are more likely to demand bribes from registered enterprises during specific transactions.
II. CORRUPTION AND FIRM REGISTRATION IN LOW-INCOME COUNTRIES This section discusses ways that corruption might affect registered and unregistered firms and the empirical evidence from earlier country-level and microeconomic studies. Relationship between petty corruption and firm registration
When thinking about how petty corruption affects firm registration, it is useful to distinguish between permit costs (bribery) and ticket costs (extortion)—a distinction proposed by Mendez and Sepulveda (2007). Permit costs are the costs associated with getting permission to legally operate. De Soto (1988), for example, notes that when his team of researchers tried to set up a garment factory in Peru, officials requested bribes ten times during the registration process.
In some cases, bribes might be needed to get permits even when firms have met all legal
requirements. Government bureaucrats might invent fictitious requirements, might ‘lose’ needed paperwork, or might simply refuse to process documents. In the absence of a non-corrupt appeals body (for example, a non-corrupt judiciary or non-corrupt management), firm owners might have to pay requested bribes. Although the original goal of De Soto’s (1988) research was to setup the factory without paying any bribes, his team had to pay bribes in two of ten occasions where bribes were requested even though they had met all legal requirements. By not registering, informal firms avoid these costs.
In other cases, bribes might be paid to getting needed permits more quickly (‘speed
money’) or to get them without complying with all rules and regulations. Although bribes paid to speed up the process or avoid burdensome regulations might improve efficiency—and are presumably less than the cost of delay or formal compliance—they only fall on firms that get the permits. Informal firms that do not get the permits do not have to pay bribes to get them.
As well as avoiding bribes directly associated with getting permission to operate,
unregistered firms might be able to avoid bribes outside the registration process. Registering with the government makes firms more visible to government officials and so might result in bribe demands. For example, informal firms that do not register with the tax authorities avoid
47
routine tax inspections and any bribes associated with them. Even when formal firms are complying with tax requirements, it might be easier to pay bribes to inspectors that invent fictitious requirements rather than bear the costs and uncertainty of trying to appeal.2
This is not to say that informal firms avoid all permit costs. Even informal firms (i.e.,
that have not met all registration requirements) need some government services. For example, many informal firms would benefit from public utility connections and bribes are often needed to get these.3
Ticket costs, in contrast, are the costs of paying bribes to government officials if the firm
is caught not complying with regulations or other government rules. For example, if a police officer catches a street trader operating illegally, the trader might offer a bribe to avoid being arrested or having goods confiscated.
Although ticket costs might fall mainly on informal firms, this does not mean that
registered firms have no ticket costs. Sometimes even registered firms fail to comply with all regulatory requirements. In the World Bank’s 2003 Enterprise Survey for Zambia, for example, less than half of registered firms reported that they believed that ‘firms like theirs’ reported all revenues to the tax authorities.4 Moreover even complying with all regulations does not ensure that corrupt officials will not demand bribes for fictitious or minor violations.5
Although unregistered firms might be more vulnerable to bribe demands when caught,
they are often less visible than registered firms. Bureaucrats wanting bribes will probably find it easier to find registered firms and might demand higher payments from them if they believe that registered firms have greater ability to pay. If registering increases either visibility or perceptions about ability to pay, registration might raise tickets costs.
In summary, it is not clear whether corruption will encourage or discourage registration.
On the one hand, permit costs are likely to be higher for registered firms. On the other, ticket costs might be higher for unregistered firms. Because corruption is only one of the many things that affect registration decisions, observing registration decisions does not tell us whether corruption encourages or discourages registration.
Empirical Evidence Previous studies have linked informality with corruption using country-level data. Using data from Latin America, the OECD, and Europe and Central Asia, Friedman and others (2000) find that countries that scored one point worse on Political Risk Services corruption index—roughly
2 The 2004 Investment Climate Assessment for Zambia noted that firms reported that the Zambia Revenue Authority’s behavior was ‘arbitrary and punitive’ (Regional Program on Enterprise Development, 2004). It also noted that the burden of proof regarding appeals and penalties was on the firm 3 See, for example, Clarke and Xu (2004) or Gonzalez and others (2007). 4 Authors’ calculations using data from the 2003 World Bank Enterprise Survey. The sample only included firms registered with the Zambia Revenue Authority (Regional Program on Enterprise Development, 2004). 5 For example, Easterly (2002) describes being pulled over by a police officer in Mexico City and being accused of the crime of ‘transporting books without a license’. He avoided being arrested by paying a ‘fine’ on the spot.
48

the difference between Zambia and Ghana—had informal sectors that were about 10 percentage points larger than similar countries that scored one point better. Similarly, May and others (2002) show that corruption is correlated with unofficial activity in both transition and non-transition economies. Buehn and Schneider (forthcoming) find similar results using a structural model. And Dreher and Schneider (2010) find a positive association between corruption and informality in low-income, but not high-income, countries.
Several microeconomic studies have also looked at the relationship between corruption
and informality. By focusing on unregistered firms, this study differs from most previous microeconomic studies, which have focused on firms that are partly or mostly formal. In an important study, Johnson and others (2000) use a measure of informality related to tax evasion—the percent of sales that the registered firms hide from the tax authorities.6 They find that registered firms that report paying bribes report less of their sales to the authorities. They interpret this result to suggest that either “firms hide more to avoid corruption” or “firms that hide more have to make illegal payments” (p. 515). Similarly, Svensson (2003) uses principal component analysis to show that firms in Uganda that report paying their taxes, have utility connections, and trade across borders are more likely to report paying bribes than other firms.
III. DATA The data used in this paper comes from the Zambia Business Survey. The survey covered 4,801 micro and small enterprises (MSEs), which are defined as businesses with 50 or fewer employees, in urban and rural areas. The sample was selected through rigorous area sampling, with the 2000 population census used as the sampling frame.7 This methodology ensures that the sample include both registered and unregistered firms.
The firms in the survey are small. Including owners, the average firm had less than five workers (see
Table 1). About one-third of the firms had no employees other than the owner and only about 10 percent of firms had over 10 employees. About four-fifths of the sample was located in rural areas. Most were either farms (about 70 percent) or traders (about 22 percent). There were a small number of manufacturing firms (about 3 percent of the sample) and other service firms such as hotels and restaurants and repair shops (about 4 percent). Firm Registration Studies of informality usually define informality as economic activities that are not measured or visible to the Government. For example, Schneider (2005) defines informality as:
[All] market-based legal production of goods and services that are deliberately concealed from public authorities for the following reasons:
(1) to avoid payment of income, value added or other taxes, (2) to avoid payment of social security contributions,
6 Johnson and others (2000) note that their sample excludes unregistered enterprises. 7 See Clarke and others (2010) for a detailed description of the survey.
49

(3) to avoid having to meet certain legal labor market standards, such as minimum wages, maximum working hours, safety standards, etc., and
(4) to avoid complying with certain administrative procedures, such as completing statistical questionnaires or other administrative forms.
This definition focuses on activities, rather than firms. For example, goods produced by
unregistered temporary workers that a firm pays under the table to avoid paying social security taxes would be classified as ‘informal’ even if the firm was registered with the business registrar, paid corporate income taxes on all or most of its income and complied with labor regulations for its permanent workforce.8
Although definitions based on activities are useful when thinking about informality at the
macroeconomic level, a more natural way to think about informality when using firm-level data is to define it based on firm registration. This seems appropriate in the context of Zambia given that most micro and small enterprises (MSEs) in Zambia are not registered with any government agency. Although they might comply with some regulations or pay some required fees or local taxes, these unregistered firms are not complying with all requirements and, in practice, will mostly operate underneath the official purview of the authorities.
This is done by focusing on three question about company registration: (i) whether the
firm is registered with the Patents and Company Registrar (PACRO) or other government institution responsible for commercial registration; (ii) whether the firm has an operating, trade or other business license with any local government institution; and (iii) whether the firm has a taxpayer identification number (TPIN) from the Zambia Revenue Authority (ZRA). Throughout the paper, these questions are used to identify ‘registered’ or ‘formal’ enterprises.
Sole proprietorships, partnerships, or limited liability companies are required to register
with PACRO unless they are sole proprietorships operating under the personal name of their owner. Sole proprietorships that are operating under a trade name are required to register as a business name under Section 3 of the Registration of Business Act Cap 389, while limited liability companies are required to register as companies under the Companies Act Cap 388 (Patent and Companies Registration Office, 2009a; 2009b). Because firms can operate under the personal name of their owner, however, firms could operate legally without registering with PACRO.
Firms also have to get operating or trading licenses from—and pay license fees to—
municipal or local governments. Requirements and fees depend on sector of operations, size of the firm, and locality.9 Some types of firms need to pay multiple fees and obtain multiple licenses (Economics Association of Zambia, 2009).
As well as registering with PACRO, businesses are required to get a TPIN from the
Zambia Revenue Authority. This applies to companies registered with PACRO under the
8 Others definitions focus on workers rather than activities. See, for example, Perry and others (2006). 9 For example, United Nations Conference on Trade and Development (2003) and Zambia Development Agency (2009) discuss licenses required by firms in the manufacturing, retail trade, and tourism sectors. See also Times of Zambia (2008) and ACT Watch (2009).
50
Registration of Businesses Act and the Companies Act and to individuals operating businesses that are not registered as firms (Zambia Revenue Authority, 2009a). After getting a TPIN, most sample firms (over 99 percent) are not large enough to register for either the value-added or income tax, both of which apply only to firms with turnover of more than K200 million (about $53,000 at the average exchange rate for 2008). These firms are, however, required to register for a presumptive three percent tax on turnover.10
Only about one in 20 of the firms in the sample reported that they were registered with
any of the three agencies. They were most likely to report that they had an operating or trading license from a local or municipal government (about 1 in 20 MSEs). Fewer reported that they were registered with PACRO (only about 1 in 30) or had a TPIN from the Zambia Revenue Authority (only about 1 in 50).
Corruption The survey asks several questions about corruption. One important question is “Do you think that [corruption] presents no obstacle, a minor obstacle, a moderate obstacle, a major obstacle, or a very severe obstacle to the current operations of the business.” Corruption is one of 15 constraints that the survey asks about. Others include tax rates, access to finance, the macroeconomic environment and crime.
A second set of questions relate to whether bribes were requested during certain
transactions. The questions read: “Was a gift or informal payment asked for or expected to obtain [a landline telephone, electrical connection or water connection]. An additional question was asked about bribe requests during tax inspections—“In any of these [tax inspections or meetings with tax officials] was a gift or informal payment expected/requested”. Characteristics of registered and unregistered firms Registered firms were slightly larger than unregistered firms (about 5.3 employees on average for registered firms compared with about 4.5 employees for unregistered firms). They were also more likely to be growing (32 percent compared with 26 percent) and were far more likely to be located in urban areas (about 61 percent of registered firms compared with 16 percent of unregistered firms). Agricultural firms made up a smaller share of registered firms (about 30 percent compared with about 73 percent of unregistered firms), while other sectors made up correspondingly larger shares. Overall, this suggests that registered firms are more visible than unregistered firms. They are larger, are more likely to be in urban areas, and are more likely to be expanding than unregistered firms are.
10 The turnover tax was introduced for MSMEs in 2004 (Zambia Revenue Authority, 2004). Firms with paid employees should also register for PAYE (Zambia Revenue Authority, 2009b)
51

IV. ECONOMETRIC RESULTS The first question that we look at is whether managers of registered firms see corruption as a greater or lesser problem than managers of unregistered firms. If corruption is a greater problem for registered firms, it might discourage firms from registration. After looking at whether the perceptions of managers or registered and unregistered firms differ, we try to assess reasons for the difference in perceptions. One possibility is that bureaucrats might target registered firms for bribes during specific transactions—perhaps because registered firms are better performing than unregistered firms. To see whether this is the case, we look at whether registered firms are more or less likely to report that bribes were demanded during specific transactions (getting a water connection, getting a power connection and during tax inspections). A second possibility is that registered firms might more frequently engage in transactions with government officials We therefore look at whether registered firm engage in the specific transactions listed above.
Methodology: Impact of firm characteristics on views about corruption. The question of how registration affects firm’s perceptions about corruption is examined by estimating different versions of the equation below:
The dependent variable is an index variable ranking how great an obstacle the firm manager says corruption is. The firm characteristics are: (i) firm size (number of workers, linear and quadratic terms); (ii) age of the firm; (iii) a dummy variable indicating that the firm is growing; (iv) a dummy variable indicating that the firm is located in an urban area; (iv) an index variable indicating how capital intensive the firm is and (v) a series of sector dummies (agriculture, manufacturing, retail trade, and other services). These variables have been related to corruption in previous studies.11 The error term is assumed to be normally distributed. Because the dependent variable is an ordered index variable, the model is estimated using standard maximum likelihood estimation (i.e., ordered probit). Results from the regressions are shown in
Table 2.
Empirical Results Registration. As a first exercise, a dummy variable indicating whether the firm has registered with PACRO, obtained a TPIN, or obtained an operating license from local government institutions is included by itself in the ordered probit regression (see column 1 of
Table 2). Based on the point estimate of the coefficients, firms that are registered are about 7 percentage points more likely to say the corruption is a major or very severe obstacle than firms
11 Gaviria (2002) finds a negative relationship between firms that report paying bribes and firms size for firms in Latin America. In contrast, Svensson (2003) and Safavian and others (2001) find positive, but statistically insignificant relationships between firm size and probability of making bribe payments and perceptions about corruption respectively. For firm growth, Safavian and others (2001) find that firms in Russia that were growing more quickly are more likely to say that corruption is a problem than slower growing firms. Clarke and Xu (2004), however, do not find a statistically significant relationship between sales growth and bribe payments for Eastern Europe and Central Asia. Svensson (2003) finds that capital intensive firms pay more in bribes than other firms.
52

that are not registered.12 When the three separate dummy variables indicating registration with each agency are included one at a time, the coefficient on each variable is statistically significant at conventional significance levels.
When the three separate dummy variables are included at the same time, the only
coefficient that is statistically significant at conventional significance levels is the coefficient on the variable indicating that the firm has a TPIN. Firms that have a TPIN were about 16 percentage points more likely to say that corruption was a major or very severe obstacle than firms that did not. The coefficients on the variables indicating that the firm has registered with PACRO and that it has an operating license are small and statistically insignificant.
Other firm characteristics. As discussed previously, registered firms tend to be larger,
more capital intensive, more likely to be located in urban areas, and faster growing. Because of this, registered firms are more visible. Because these factors might affect bribes independently of registration status, Columns 3-4 include these additional control variables.
The results suggest that larger, more visible firms are more likely to say that corruption is a serious problem than other firms. Large firms and firms in urban areas are more likely to say that corruption is a serious problem (see columns 3-4 in
Table 2). In addition, more capital intensive firms are more likely to say that corruption
is a problem. These firms will presumably find it harder to hide from the authorities and to switch or shut down operations when facing excessive bribe demands (i.e., they have fewer sunk costs). This is consistent with results in Svensson (2003).
Including these variables makes the coefficient on the dummy variable indicating that the
firm is registered with any of the three agencies smaller and statistically insignificant. When the three dummy variables indicating that the firm is registered with each agency are included at the same time, the inclusion of these control variables reduces the size of marginal effect on the dummy variable indicating that the firm has a TPIN, although it remains statistically significant. The point estimate suggests that firms that have a TPIN are about 10 percentage points more likely to say that corruption is a serious problem than other firms are. The coefficients on the other two registration variables remain statistically insignificant. Methodology: Impact of firm characteristics on bribes during specific transactions. The previous sub-section looked at how firm characteristics affected firm perceptions about corruption. Firms that had TPINs were more likely to say corruption was a problem than other firms. This section looks at one possible reason for this. It is possible that corrupt officials in areas unrelated to registration target registered firms during transactions—perhaps because being registered indicates that the firms are more sophisticated or better performing.
To see whether this is the case, we look at whether registered firms were more likely to
have bribes requested during transactions with officials. The survey does not provide an
12 Marginal effects are calculated by working out the marginal effect of switching the dummy variable from zero to one at the average value of all other variables.
53
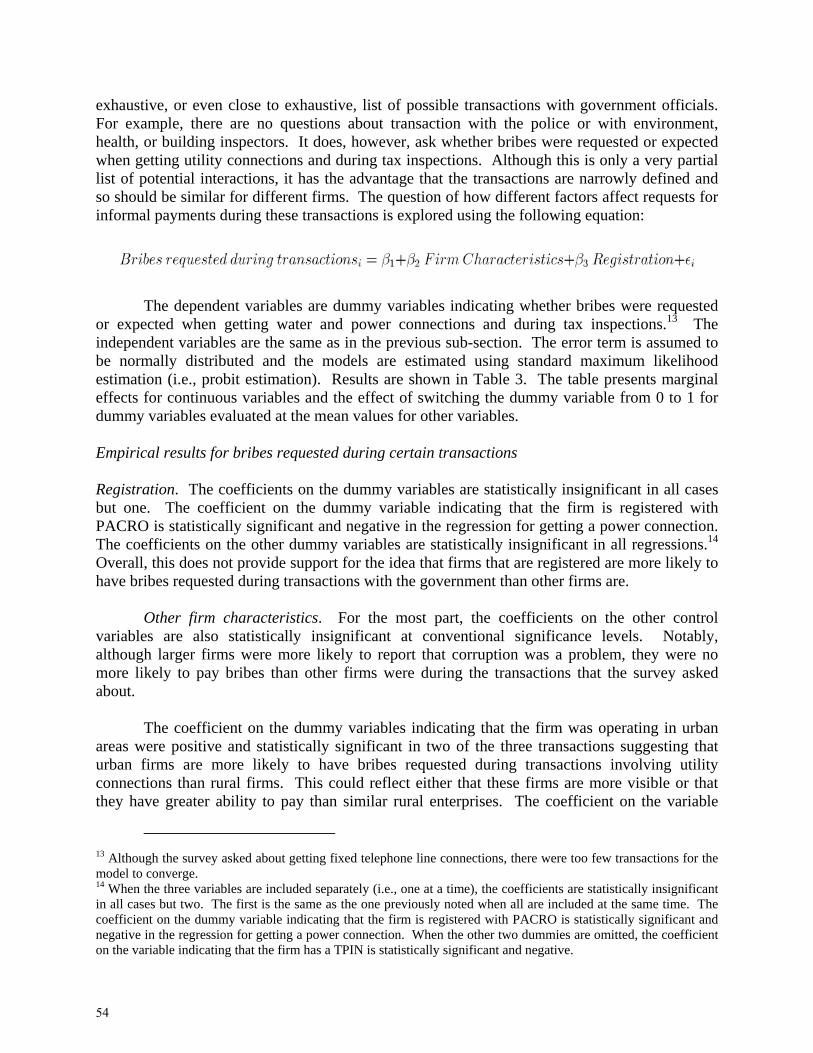
exhaustive, or even close to exhaustive, list of possible transactions with government officials. For example, there are no questions about transaction with the police or with environment, health, or building inspectors. It does, however, ask whether bribes were requested or expected when getting utility connections and during tax inspections. Although this is only a very partial list of potential interactions, it has the advantage that the transactions are narrowly defined and so should be similar for different firms. The question of how different factors affect requests for informal payments during these transactions is explored using the following equation:
The dependent variables are dummy variables indicating whether bribes were requested
or expected when getting water and power connections and during tax inspections.13 The independent variables are the same as in the previous sub-section. The error term is assumed to be normally distributed and the models are estimated using standard maximum likelihood estimation (i.e., probit estimation). Results are shown in Table 3. The table presents marginal effects for continuous variables and the effect of switching the dummy variable from 0 to 1 for dummy variables evaluated at the mean values for other variables.
Empirical results for bribes requested during certain transactions Registration. The coefficients on the dummy variables are statistically insignificant in all cases but one. The coefficient on the dummy variable indicating that the firm is registered with PACRO is statistically significant and negative in the regression for getting a power connection. The coefficients on the other dummy variables are statistically insignificant in all regressions.14 Overall, this does not provide support for the idea that firms that are registered are more likely to have bribes requested during transactions with the government than other firms are.
Other firm characteristics. For the most part, the coefficients on the other control
variables are also statistically insignificant at conventional significance levels. Notably, although larger firms were more likely to report that corruption was a problem, they were no more likely to pay bribes than other firms were during the transactions that the survey asked about.
The coefficient on the dummy variables indicating that the firm was operating in urban
areas were positive and statistically significant in two of the three transactions suggesting that urban firms are more likely to have bribes requested during transactions involving utility connections than rural firms. This could reflect either that these firms are more visible or that they have greater ability to pay than similar rural enterprises. The coefficient on the variable
13 Although the survey asked about getting fixed telephone line connections, there were too few transactions for the model to converge. 14 When the three variables are included separately (i.e., one at a time), the coefficients are statistically insignificant in all cases but two. The first is the same as the one previously noted when all are included at the same time. The coefficient on the dummy variable indicating that the firm is registered with PACRO is statistically significant and negative in the regression for getting a power connection. When the other two dummies are omitted, the coefficient on the variable indicating that the firm has a TPIN is statistically significant and negative.
54
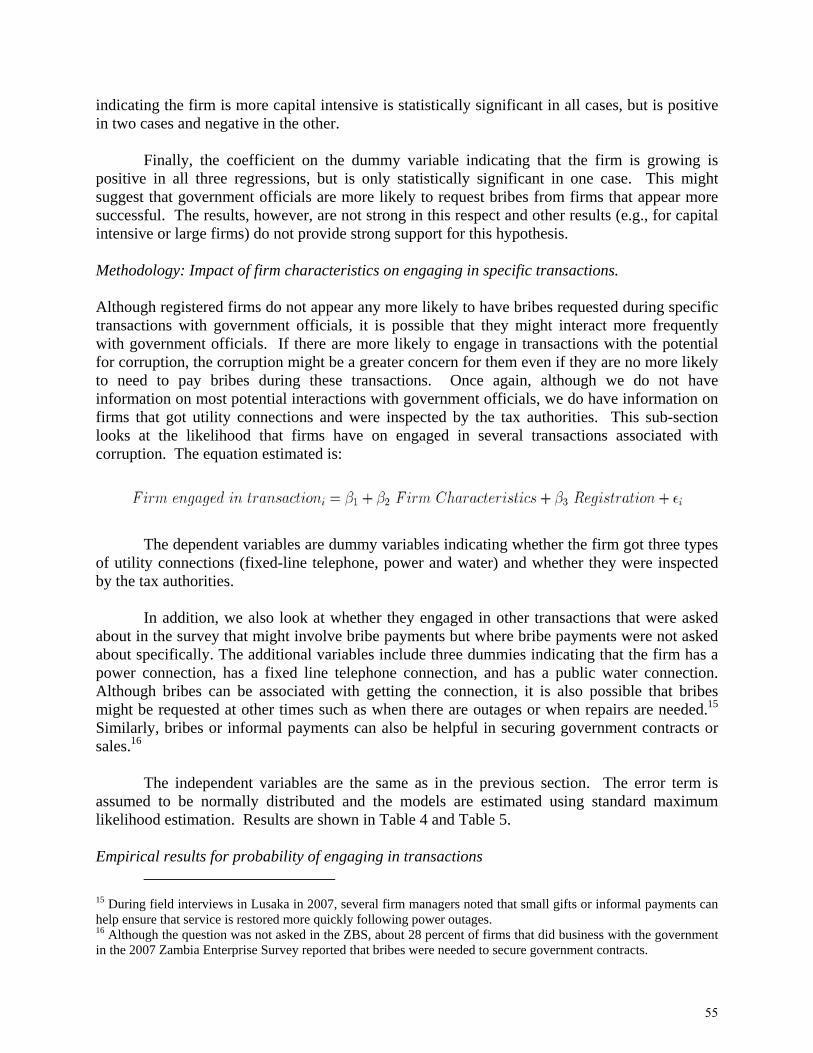
indicating the firm is more capital intensive is statistically significant in all cases, but is positive in two cases and negative in the other.
Finally, the coefficient on the dummy variable indicating that the firm is growing is
positive in all three regressions, but is only statistically significant in one case. This might suggest that government officials are more likely to request bribes from firms that appear more successful. The results, however, are not strong in this respect and other results (e.g., for capital intensive or large firms) do not provide strong support for this hypothesis.
Methodology: Impact of firm characteristics on engaging in specific transactions. Although registered firms do not appear any more likely to have bribes requested during specific transactions with government officials, it is possible that they might interact more frequently with government officials. If there are more likely to engage in transactions with the potential for corruption, the corruption might be a greater concern for them even if they are no more likely to need to pay bribes during these transactions. Once again, although we do not have information on most potential interactions with government officials, we do have information on firms that got utility connections and were inspected by the tax authorities. This sub-section looks at the likelihood that firms have on engaged in several transactions associated with corruption. The equation estimated is:
The dependent variables are dummy variables indicating whether the firm got three types
of utility connections (fixed-line telephone, power and water) and whether they were inspected by the tax authorities.
In addition, we also look at whether they engaged in other transactions that were asked
about in the survey that might involve bribe payments but where bribe payments were not asked about specifically. The additional variables include three dummies indicating that the firm has a power connection, has a fixed line telephone connection, and has a public water connection. Although bribes can be associated with getting the connection, it is also possible that bribes might be requested at other times such as when there are outages or when repairs are needed.15 Similarly, bribes or informal payments can also be helpful in securing government contracts or sales.16
The independent variables are the same as in the previous section. The error term is
assumed to be normally distributed and the models are estimated using standard maximum likelihood estimation. Results are shown in Table 4 and Table 5.
Empirical results for probability of engaging in transactions
15 During field interviews in Lusaka in 2007, several firm managers noted that small gifts or informal payments can help ensure that service is restored more quickly following power outages. 16 Although the question was not asked in the ZBS, about 28 percent of firms that did business with the government in the 2007 Zambia Enterprise Survey reported that bribes were needed to secure government contracts.
55
Registration. Even after controlling for other factors that might affect whether they have utility connections, apply for new connections, are inspected by the tax authorities, or sell to the government, firms that have operating licenses and TPINs than other firms are more likely to engage in transactions with the government than others are. The differences can be large. Firms that have TPINs were about 2 percentage points more likely to have applied for a fixed line phone, 6 percentage points more likely to have applied for a power connection, 5 percentage points more likely to apply for a water connection and were 1 percentage point more likely to have been inspected. Given that so few firms were involved with any of these transactions, these differences are large (see Table 6). Similar results hold for firms that were registered with local government. In contrast, there was no evidence that firms registered with PACRO were more likely to be involved in these transactions than other firms were after controlling for other things. One plausible explanation for why registered firms are more likely to engage in these transactions is that these firms are more sophisticated than other firms even after controlling for other things.
Other Firm Characteristics. The other variables are mostly consistent with the idea that
larger, more sophisticated firms are more likely to engage in transactions with the government. Large firms are more likely to have power and water connections, to have applied for a power connection within the past two years, and to have been inspected by the tax authorities. Similarly, capital intensive firms are more likely to have engaged in all transactions, including selling to the government, and to have utility connections. Urban firms are generally more likely to have applied for utility connections and to have such connections. Faster-growing firms are also more likely to have applied for a water connection, more likely to have a power connection, and are more likely to have sold to the government. Finally, older firms are less likely to have utility connections and are less likely to have applied for them. They are, however, more likely to sell to the government.
V. CONCLUSIONS This paper looks at whether registered microenterprises in Zambia are more affected by corruption than unregistered enterprises. Before controlling for other factors that affect how visible firms are to government officials such as size, capital intensity and location, firms that are registered are more likely to say that corruption is a serious problem than other firms. After controlling for these factors, however, firms that are registered with PACRO and that have operating licenses from the local authorities are no more likely to say that corruption is a problem than other firms are. This is not true for firms registered with the Zambia Revenue Authority—they are more likely to say that corruption is a problem even after controlling for other things that affect visibility.
The paper explores two possible reasons for why these firms might be more concerned
about corruption than unregistered firms. One possibility is that corrupt bureaucrats involved in transactions unrelated to registration request bribes from registered firms more frequently during transaction than they do for unregistered firms. They might do this, for example, if they believe that registered firms are more profitable or more able to pay bribes than other firms. There is
56
little evidence that this is the case. After controlling for other things that might affect bribe demands, registered firms were no more likely to pay bribes during specific transactions than similar unregistered firms.
Although registered firms are no more likely to pay bribes during specific transactions,
corruption might still be a greater concern for these firms if they are more likely to engage in transactions with the government. That is, the burden of corruption might be greater for registered firms not because they registered but because they are more likely to be involved in other transactions with the government. The results support this idea—registered firms are more likely to be involved in these transactions than unregistered firms. Since some of these transactions are voluntary and unrelated to registration, it is possible that corruption might not greatly discourage registration.
57

VI. REFERENCES ACT Watch. 2009. "Outlet Survey Report (Baseline). Republic of Zambia." ACT Watch:
Lusaka, Zambia. Buehn, Andreas, and Fredrich Schneider. Forthcoming. "Corruption and the Shadow Economy:
Like Oil and Vinegar, like Water and Fire." International Tax and Public Finance. Clarke, George R. G., Manju Kedia Shah, Marie Sheppard, Julliet Munro, and Roland Pearson.
2010. "The Profile and Productivity of Zambian Businesses." World Bank: Lusaka, Zambia.
Clarke, George R. G., and Lixin Colin Xu. 2004. "Privatization, Competition and Corruption: How Characteristics of Bribe Takers and Payers Affect Bribes To Utilities." Journal of Public Economics 88(9-10):2067–97.
de Soto, Hernando. 1988. The Other Path. New York: Basic Books. Dreher, Axel, and Fredrich Schneider. 2010. "Corruption and the Shadow Economy: An
Empirical Analysis." Public Choice 144(1-2):215–238. Easterly, William. 2002. The Elusive Quest for Growth. Cambridge, MA: MIT Press. Economics Association of Zambia. 2009. "Business Unusual: The Policy Implications for
Zambia of the Global Economic Crisis." Economics Association of Zambia: Lusaka, Zambia.
Friedman, Eric, Simon Johnson, Daniel Kaufmann, and Pablo Zoido-Lobaton. 2000. "Dodging the Grabbing Hand: The Determinants of Unofficial Activity in 69 Countries." Journal of Public Economics 76(3):459–493.
Gaviria, Alejandro. 2002. "Assessing the Effects of Corruption and Crime on Firm Performance: Evidence From Latin America." Emerging Markets Review 3(4):245–268.
Gonzalez, Alvaro, J. Ernesto Lopez-Cordova, and Elio E. Valladares. 2007. "The Incidence of Graft on Developing Country Firms." Policy Research Working Paper 4394. World Bank, Washington DC.
Johnson, Simon, Daniel Kaufmann, John McMillan, and Christopher Woodruff. 2000. "Why Do Firms Hide? Bribes and Unofficial Activity After Communism." Journal of Public Economics 76(3):495–520.
May, J. W., W. Pyle, and P. M. Sommers. 2002. "Does Governance Explain Unofficial Activity?" Applied Economics Letters 9(8):537–539.
Melzer, Idina, Reut Agasi, and Harry Botha. 2009. "Demand Side Analysis of Access to Financial Services for Businesses in Zambia." Finmark Trust: Lusaka, Zambia.
Mendez, Fabio, and Facundo Sepulveda. 2007. "Corruption, Regulation Compliance and the Shadow Economy." University of Arkansas: Fayetteville, AR.
Patent and Companies Registration Office, 2009a. Frequently Asked Questions on Business Names. Retrieved 5-14-2009a, from Patent and Companies Registration Office web site: http://www.pacro.org.zm/index.php?option=com_content&task=view&id=38&Itemid=.
58

Patent and Companies Registration Office, 2009b. Frequently Asked Questions on Companies. Retrieved 5-14-2009b, from Patent and Companies Registration Office web site: http://www.pacro.org.zm/index.php?option=com_content&task=view&id=37&Itemid=.
Perry, Guillermo E., William F. Maloney, Omar S. Arias, Pablo Fajnzylber, Andrew D. Mason, and Jaime Saavedra-Chanduvi. 2006. Informality: Exit and Exclusion. Washington DC: World Bank.
Regional Program on Enterprise Development, Africa Private Sector Group. 2004. "An Assessment of the Investment Climate in Zambia." Regional Program for Enterprise Development, World Bank: Washington DC.
Safavian, Mehnaz S., Douglas H. Graham, and Claudio Gonzalez-Vega. 2001. "Corruption and Microenterprises in Russia." World Development 29(7):1215–24.
Schneider, Fredrich, and Dominik Enste. 2000. "Shadow Economies: Size, Causes and Consequences." Journal of Economic Literature 38(1):77–114.
Schneider, Friedrich. 2005. "Shadow Economies Around the World: What Do We Really Know?" European Journal of Political Economy 21(3):598–642.
Svensson, Jakob. 2003. "Who Must Pay Bribes and How Much? Evidence From a Cross Section of Firms." Quarterly Journal of Economics 118(1):207–230.
Times of Zambia. 2008. "Zambia: License Fees Still Low -- Mutati." Times of Zambia, August 4. United Nations Conference on Trade and Development. 2003. "Investment Policy Review--
Zambia." United Nations: New York, NY. Zambia Development Agency. 2009. "Procedures and Guidelines for Obtaining Investment
Licence." Zambia Development Agency: Lusaka, Zambia. Zambia Revenue Authority. 2004. "Income Tax (Amendment) Act 2004." Zambia Revenue
Authority: Lusaka, Zambia. --------. 2009a. "A Guide to TPIN Registration." Leaflet 12. Lusaka, Zambia. Zambia Revenue Authority, 2009b. Getting Started in Business. Retrieved 5-18-2009b, from
Zambia Revenue Authority web site: http://www.zra.org.za/starting_business.php.
59
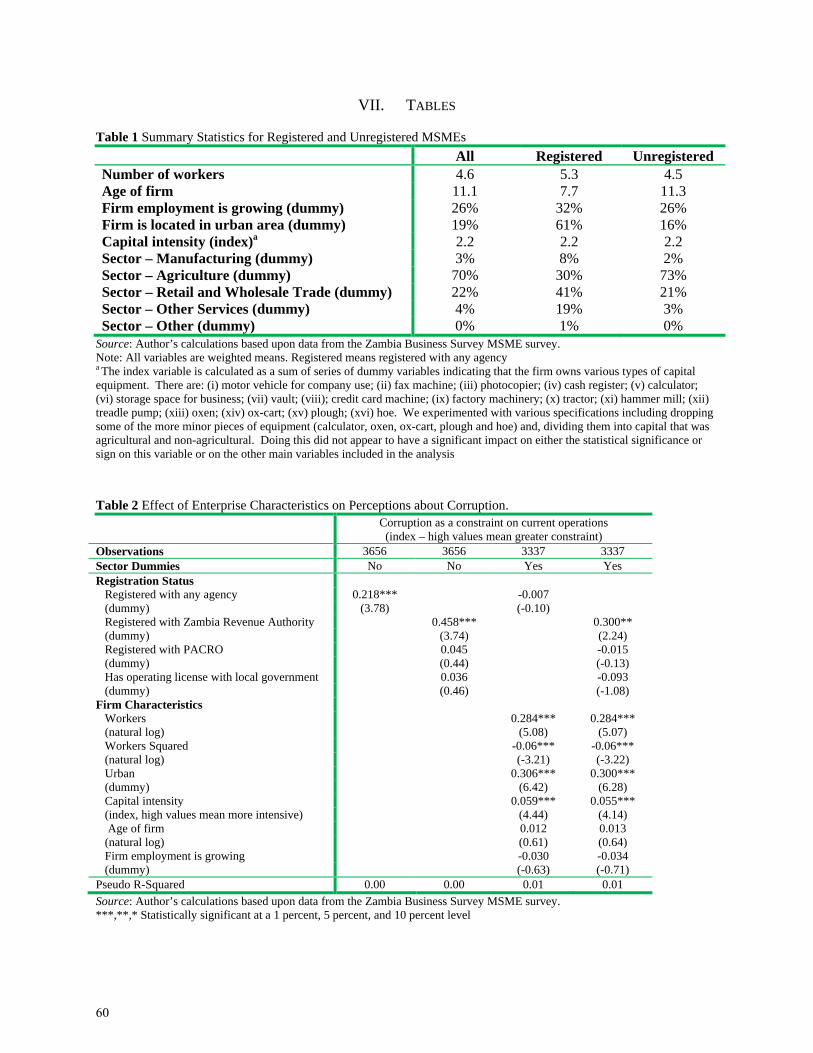
VII. TABLES Table 1 Summary Statistics for Registered and Unregistered MSMEs
All Registered Unregistered Number of workers 4.6 5.3 4.5 Age of firm 11.1 7.7 11.3 Firm employment is growing (dummy) 26% 32% 26% Firm is located in urban area (dummy) 19% 61% 16% Capital intensity (index)a 2.2 2.2 2.2 Sector – Manufacturing (dummy) 3% 8% 2% Sector – Agriculture (dummy) 70% 30% 73% Sector – Retail and Wholesale Trade (dummy) 22% 41% 21% Sector – Other Services (dummy) 4% 19% 3% Sector – Other (dummy) 0% 1% 0%
Source: Author’s calculations based upon data from the Zambia Business Survey MSME survey. Note: All variables are weighted means. Registered means registered with any agency a The index variable is calculated as a sum of series of dummy variables indicating that the firm owns various types of capital equipment. There are: (i) motor vehicle for company use; (ii) fax machine; (iii) photocopier; (iv) cash register; (v) calculator; (vi) storage space for business; (vii) vault; (viii); credit card machine; (ix) factory machinery; (x) tractor; (xi) hammer mill; (xii) treadle pump; (xiii) oxen; (xiv) ox-cart; (xv) plough; (xvi) hoe. We experimented with various specifications including dropping some of the more minor pieces of equipment (calculator, oxen, ox-cart, plough and hoe) and, dividing them into capital that was agricultural and non-agricultural. Doing this did not appear to have a significant impact on either the statistical significance or sign on this variable or on the other main variables included in the analysis
Table 2 Effect of Enterprise Characteristics on Perceptions about Corruption. Corruption as a constraint on current operations (index – high values mean greater constraint)
Observations 3656 3656 3337 3337 Sector Dummies No No Yes Yes Registration Status Registered with any agency 0.218*** -0.007 (dummy) (3.78) (-0.10) Registered with Zambia Revenue Authority 0.458*** 0.300** (dummy) (3.74) (2.24) Registered with PACRO 0.045 -0.015 (dummy) (0.44) (-0.13) Has operating license with local government 0.036 -0.093 (dummy) (0.46) (-1.08) Firm Characteristics Workers 0.284*** 0.284*** (natural log) (5.08) (5.07) Workers Squared -0.06*** -0.06*** (natural log) (-3.21) (-3.22) Urban 0.306*** 0.300*** (dummy) (6.42) (6.28) Capital intensity 0.059*** 0.055*** (index, high values mean more intensive) (4.44) (4.14) Age of firm 0.012 0.013 (natural log) (0.61) (0.64) Firm employment is growing -0.030 -0.034 (dummy) (-0.63) (-0.71) Pseudo R-Squared 0.00 0.00 0.01 0.01
Source: Author’s calculations based upon data from the Zambia Business Survey MSME survey. ***,**,* Statistically significant at a 1 percent, 5 percent, and 10 percent level
60

Table 3 Probability that Firm Paid Bribes During Requests for Connections and Tax Inspections Bribe requested
to get power connection
Bribe requested to get water connection
Bribe requested during tax inspection
Observations 134 153 109 Sector Dummies Yes Yes Yes Registration Registered with Zambia Revenue Authority -0.079 0.115 -0.071 (dummy) (-1.11) (0.81) (-1.10) Registered with PACRO -0.163*** -0.098 0.062 (dummy) (-2.68) (-1.43) (0.99) Has operating or trade license with local government 0.033 -0.113 -0.025 (dummy) (0.48) (-1.25) (-0.47) Firm Characteristics Workers 0.126 -0.025 -0.094 (natural log) (1.35) (-0.33) (-1.26) Workers Squared -0.034 0.000 0.048 (natural log) (-1.10) (0.02) (1.62) Age of firm 0.057 0.037 -0.036 (natural log) (1.50) (0.98) (-1.24) Firm employment is growing 0.106 0.017 0.144** (dummy) (1.57) (0.27) (2.21) Urban 0.190*** 0.148* -0.010 (dummy) (3.16) (1.93) (-0.21) Capital intensity 0.042** 0.080*** -0.043** (index, high values mean more capital intensive) (2.46) (5.44) (-2.27) Pseudo R-Squared 0.29 0.39 0.18
Source: Author’s calculations based upon data from the Zambia Business Survey MSME survey. Note: The table presents marginal effects for continuous variables and the effect of switching the dummy variable from 0 to 1 for dummy variables evaluated at the mean values for other variables. ***,**,* Statistically significant at a 1 percent, 5 percent, and 10 percent level
61
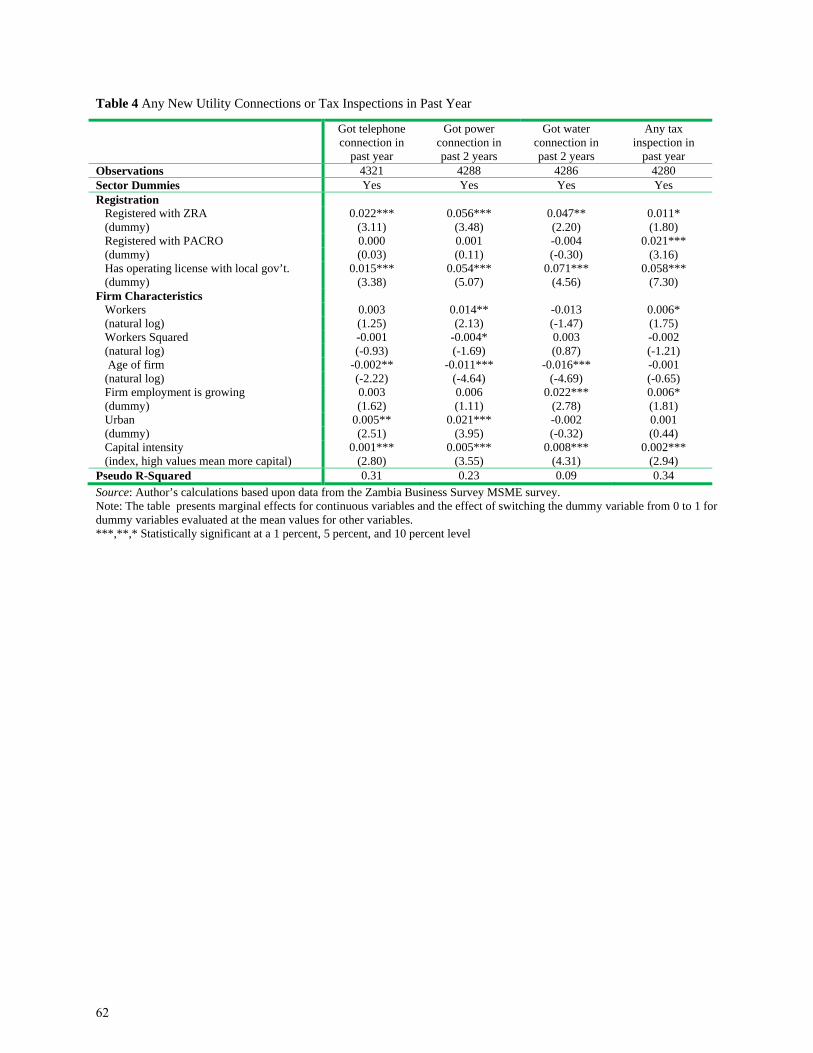
Table 4 Any New Utility Connections or Tax Inspections in Past Year
Got telephone connection in
past year
Got power connection in past 2 years
Got water connection in past 2 years
Any tax inspection in
past year Observations 4321 4288 4286 4280 Sector Dummies Yes Yes Yes Yes Registration Registered with ZRA 0.022*** 0.056*** 0.047** 0.011* (dummy) (3.11) (3.48) (2.20) (1.80) Registered with PACRO 0.000 0.001 -0.004 0.021*** (dummy) (0.03) (0.11) (-0.30) (3.16) Has operating license with local gov’t. 0.015*** 0.054*** 0.071*** 0.058*** (dummy) (3.38) (5.07) (4.56) (7.30) Firm Characteristics Workers 0.003 0.014** -0.013 0.006* (natural log) (1.25) (2.13) (-1.47) (1.75) Workers Squared -0.001 -0.004* 0.003 -0.002 (natural log) (-0.93) (-1.69) (0.87) (-1.21) Age of firm -0.002** -0.011*** -0.016*** -0.001 (natural log) (-2.22) (-4.64) (-4.69) (-0.65) Firm employment is growing 0.003 0.006 0.022*** 0.006* (dummy) (1.62) (1.11) (2.78) (1.81) Urban 0.005** 0.021*** -0.002 0.001 (dummy) (2.51) (3.95) (-0.32) (0.44) Capital intensity 0.001*** 0.005*** 0.008*** 0.002*** (index, high values mean more capital) (2.80) (3.55) (4.31) (2.94) Pseudo R-Squared 0.31 0.23 0.09 0.34
Source: Author’s calculations based upon data from the Zambia Business Survey MSME survey. Note: The table presents marginal effects for continuous variables and the effect of switching the dummy variable from 0 to 1 for dummy variables evaluated at the mean values for other variables. ***,**,* Statistically significant at a 1 percent, 5 percent, and 10 percent level
62
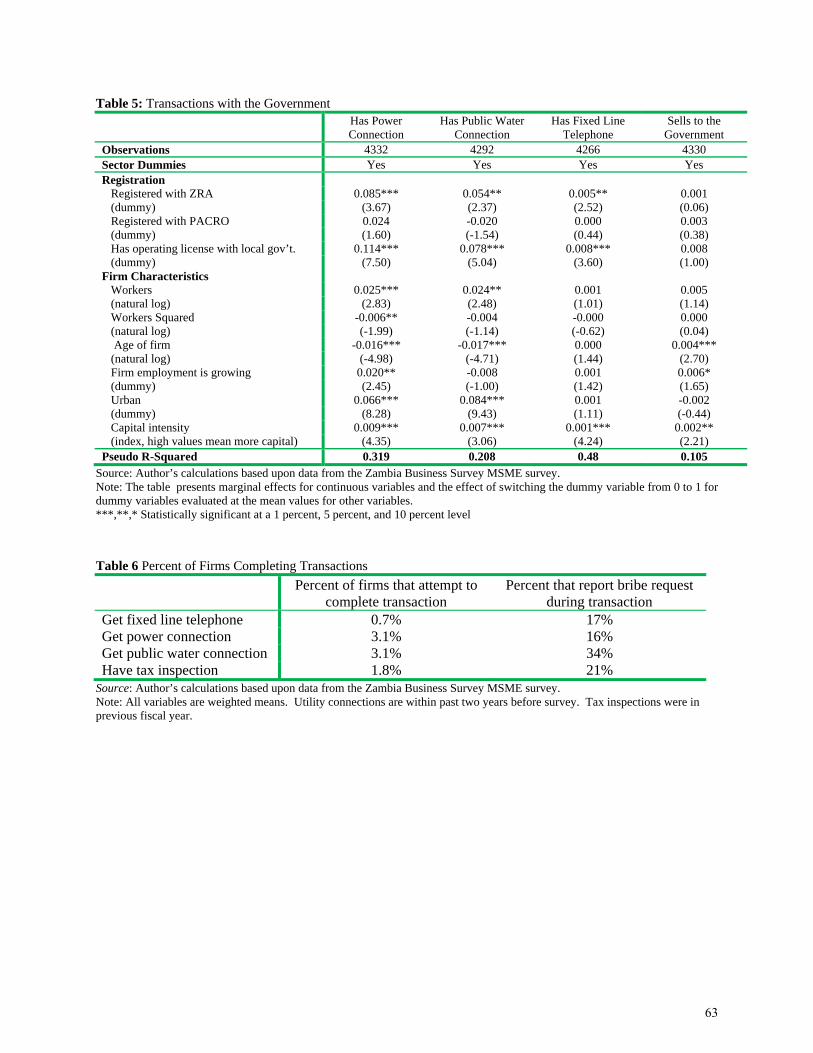
Table 5: Transactions with the Government
Has Power Connection
Has Public Water Connection
Has Fixed Line Telephone
Sells to the Government
Observations 4332 4292 4266 4330 Sector Dummies Yes Yes Yes Yes Registration Registered with ZRA 0.085*** 0.054** 0.005** 0.001 (dummy) (3.67) (2.37) (2.52) (0.06) Registered with PACRO 0.024 -0.020 0.000 0.003 (dummy) (1.60) (-1.54) (0.44) (0.38) Has operating license with local gov’t. 0.114*** 0.078*** 0.008*** 0.008 (dummy) (7.50) (5.04) (3.60) (1.00) Firm Characteristics Workers 0.025*** 0.024** 0.001 0.005 (natural log) (2.83) (2.48) (1.01) (1.14) Workers Squared -0.006** -0.004 -0.000 0.000 (natural log) (-1.99) (-1.14) (-0.62) (0.04) Age of firm -0.016*** -0.017*** 0.000 0.004*** (natural log) (-4.98) (-4.71) (1.44) (2.70) Firm employment is growing 0.020** -0.008 0.001 0.006* (dummy) (2.45) (-1.00) (1.42) (1.65) Urban 0.066*** 0.084*** 0.001 -0.002 (dummy) (8.28) (9.43) (1.11) (-0.44) Capital intensity 0.009*** 0.007*** 0.001*** 0.002** (index, high values mean more capital) (4.35) (3.06) (4.24) (2.21) Pseudo R-Squared 0.319 0.208 0.48 0.105
Source: Author’s calculations based upon data from the Zambia Business Survey MSME survey. Note: The table presents marginal effects for continuous variables and the effect of switching the dummy variable from 0 to 1 for dummy variables evaluated at the mean values for other variables. ***,**,* Statistically significant at a 1 percent, 5 percent, and 10 percent level
Table 6 Percent of Firms Completing Transactions
Percent of firms that attempt to complete transaction
Percent that report bribe request during transaction
Get fixed line telephone 0.7% 17% Get power connection 3.1% 16% Get public water connection 3.1% 34% Have tax inspection 1.8% 21%
Source: Author’s calculations based upon data from the Zambia Business Survey MSME survey. Note: All variables are weighted means. Utility connections are within past two years before survey. Tax inspections were in previous fiscal year.
63

Telecommunications Reform in Mexico: Competition, Market Efficiency, Infrastructure Development and Digital Inclusion
CRISTINA CASANUEVA-REGUART1
Universidad Iberoamericana, Mexico City
ERIK BACILIO-AVILA Universidad Iberoamericana, Mexico City
The study explores the effects on social coverage of services that will potentially be brought about as a result of Mexico's recent Telecommunications Reform. Specifically, the Reform (a) aims to introduce regulation to boost competition, and thereby bridge the market efficiency gap; (b) propose a significant shift in policy on digital inclusion, with the aim of bridging the access gap. It thus represents the most significant shake-up of the telecommunications industry in the last 20 years, ever since the privatization of public telecommunications firm Telmex (1990) and the introduction of the Federal Telecommunications Act (1995). In relation to the first of these, boosting competition, an assessment of the situation as of 2015 reveals that the Reform and its institutional embodiment in the form of a new regulatory body, the Federal Telecommunications Institute, has begun to bear fruit by way of declarations of dominant economic agents in both the telecommunications and broadcasting sectors, and the proposal of specific asymmetric regulation measures to be imposed on these economic agents. In addition, investigations are underway into illegal market concentrations in relation to the provision of pay TV services, with a view to issuing a declaration of significant market power in relation to the provider in question in the very near future. The telecommunication service markets in Mexico have seen a rise in their contestability, attributable to the institutional strength of the new regulatory framework. The broadcasting service markets are contestable too as a result of the Reform; the announcement that two new TV channels would enter the market, along with the “must carry, must offer” requirement, levels the playing field and ensures greater competition for the future. Unlike the previous case, which is essentially regulatory, the digital inclusion case lies in investment in construction, in the expansion of infrastructure and in the human capital needed to operate this infrastructure and guarantee the benefits of digital inclusion. With regard to the “Mexico Connected” program, an increase of approximately 500% is reported in the number of public Internet access points in public places, but there is a lack of information on the extent to which these access points are equipped with the necessary infrastructure for developing digital skills that would foster the adoption of such technologies and trigger a process of economic development. KEYWORDS Institutions, market efficiency gap, access gap, asymmetrical regulation, wholesale transport networks, universal service
1 Address correspondence to Cristina Casanueva-Reguart, Universidad Iberoamericana, Mexico City. E-mail: [email protected]
64

INTRODUCTION The Telecommunications and Broadcasting Reform (2013),2 aims to introduce regulation to boost competition, and thereby bridge the market efficiency gap, and proposes a significant shift in policy on digital inclusion, with the aim of bridging the access gap. It thus represents the most significant restructuring of regulation and policies for the telecommunications and broadcasting industries in the last 20 years, ever since the privatization of public telecommunications firm Telmex (1990). The pivotal goals of the Reform are: to encourage competition; to strengthen institutions to that end; and to provide universal access to broadband Internet.
The Reform includes measures to encourage competition in the telecommunications sector by way of a new institutional framework in which regulatory institutions are strengthened and a new Federal Telecommunications Institute (IFT) is set up, with the power and autonomy to regulate competition in these marketplaces, in addition to the creation of specialist tribunals and an amendment to the amparo law to prevent any immediate injunction over the regulator’s rulings. This is in addition to encouraging foreign investment by allowing 100% investment in the telecoms sector and an opening up of the broadcasting sector, allowing for up to 49% foreign capital, subject to a reciprocal investment deal in the corresponding country of origin.
To foster digital inclusion, the Reform includes provision for the deployment of two new state-administered wholesale networks, with the aim of boosting competition in the interconnection service marketplace and making it easier for relatively small local operators to access enhanced 700MHz-band wireless network and a fiber-optic transport backbone.
Regarding policies on market competition, we aim to examine the results of the new competition policy figure “preponderante” (market dominant agent) implemented by the Reform, which grant the new regulator immediate entitlement to impose pro-competition obligations, to any economic agent with more than 50% of the national sector share, by imposing asymmetric regulation on interconnection, local loop unbundling, passive infrastructure sharing, roaming, and potentially calling for the divestment of assets, to prevent anti-competitive behavior, in order to remove barriers to competition, and potentially calling for the divestment of assets to prevent anti-competitive behavior.
On the subject of digital inclusion, we assess the progress of processes underway for the deployment of both transport networks. In particular, we assess the extent to which this policy actually reaches areas lacking provision.
The proposed methodology for examining and assessing the state of the Reform's implementation is based on an analysis of official information published by government offices, in addition to in-depth interviews with IFT officials and experts involved in drawing up the Reform, along with representatives from the major telecommunication and broadcasting companies.
2 Henceforth referred to as the Constitutional Reform of Telecommunications and Broadcasting or simply “the Reform”. As explained below, its implementing legislation is referred to as the Federal Telecommunications and Broadcasting Act or simply “the Act”.
65
CONCEPTUAL FRAMEWORK The literature on the adoption of telecommunications services makes a distinction between the concepts of market efficiency gap and an actual access gap. In relation to the former, well-functioning competitive markets complement universal and social coverage policies in order to maximize social wellbeing (Muente-Kunigami & Navas-Sabater, 2009). Access gap refers to cases where private operators cannot provide service on a commercially sustainable basis without some form of financial incentive from a government universal service subsidy (Stern, Townsend & Stephens, 2006).
The unequal distribution of access to telecommunications services significantly inhibits the ability to alleviate poverty among those most vulnerable groups living and working in isolated regions, often defined as high-cost areas for telecommunications and broadcast service providers. Hence the need for a universal service policy in order to close this access gap.
On the subject of the market efficiency gap, in the case of Mexico, a recent study found that the lack of competition among telecommunications providers in the country has brought significant costs to the Mexican economy and burdened the welfare of the country’s population. It has resulted in low market penetration rates and poor infrastructure development. The loss of welfare attributed to the dysfunctional Mexican telecommunications sector is put at USD 129.2 billion during the period from 2005 to 2009 or 1.8% GDP per annum (OECD, 2012). On this point, existing research substantiates the significant role of telecommunications, and competition regulators must ensure that competition is sufficiently intense to enable the desired economic and societal development in order to bridge the market efficiency gap.
The Telecommunications and Broadcasting Reform, and the corresponding legislation3 passed, consists of a set of public policies intended to encourage competition and thereby increase the market efficiency of the sectors in question. It also intends to offer alternatives for improving digital inclusion in order to reach the targets for universal broadband access set out in the Reform.
The paper is organized into two main sections, the first section presents the institutional and regulatory advances made, including the aforementioned legislation designed to close the market efficiency gap by encouraging competition in the telecommunications and broadcasting service markets. The second section outlines the policies put forward to promote digital inclusion.
In the first section, also describes the progress in the implementation of these measures that has taken place between 2013 and 2014; and the market response to the implementation of these measures over the course of 2015.
3 This legislation, the Ley Federal de Telecomunicaciones y Radiodifusión (LFTyR, 2014) will henceforth be referred to as the Federal Telecommunications and Broadcasting Act.
66
In the second section, which focuses on digital inclusion, the main agents involved in these policies are identified, along with the progress observed in the implementation of public policies intended to bridge the digital divide.
REGULATION TO BOOST COMPETITION AND BRIDGE THE MARKET EFFICIENCY GAP The Federal Telecommunications and Broadcasting Act The announcement of a Reform to telecommunications and broadcasting in March 2013 marked a change to the respective legal regulations and was designed to take a more consistent approach to the regulation of these two sectors, and set into legislation various new concepts and provisions set out in the Reform.
The Constitutional Reform (June 2013) served as a framework for a set of regulatory initiatives such as the establishment of the Federal Telecommunications Institute (IFT), the appointment of commissioners and for parties to be declared preponderant economic agents (“agentes preponderantes”) in the telecommunications and broadcasting sectors. These regulatory actions, set out in the Reform (June 2013), were ratified when the Act implementing the Reform was brought in (July 2014).
In the following section, we highlight the main points that this Act stipulates for the telecommunications and broadcasting sectors. For each subject covered by the Act, we include information on prior regulatory action which was subsequently ratified when the Act was brought in. “Preponderancia” or significant market power In order to boost competition, market efficiency and the respective benefits to consumers in terms of price, quality and diversity of services offered, the Federal Telecommunications and Broadcasting Act regulates concentrations of market power via two legal mechanisms: the first of these is sector-based, while the second is service-based. The sector-based mechanism consists of the ability to rule that a given party is “preponderante” (dominant economic agent), defined on a national level as any party with a 50% market concentration based on the number of users, subscribers, audience and traffic or network capacity derived from data made available to the IFT.
Service-based regulation, in the form of a ruling of “poder sustancial en el mercado” (substantial market power), regulates concentrations in the market for a given service or set of services in the telecommunications and broadcasting sectors, that inhibit competition either nationally or in a specific region or geographic area. Service-based regulation under Article 279 of the Act, the IFT has the power to determine the existence of parties with market power in any market relating to the broadcasting and telecommunications sectors, as defined under Article 59 of the Economic Competition Act (Antitrust Act)4. 4 The Act: Articles 3, II. & 59 of the Federal Competition Act.
67
In order to issue a ruling of substantial market power, the Competition Act sets as metrics or indicators: sales, the number of customers, production capacity, along with any other factors that may be deemed relevant. The strength and virtue of the Federal Telecommunications and Broadcasting Act lies in its ability to regulate market power on a sector-by-sector or service-by-service basis.
Before the Federal Telecommunications and Broadcasting Act (2014) was brought in, the IFT deemed companies belonging to the América Movil group—Telmex, Telcel and Telnor—to constitute a dominant (“preponderante”) economic agent on March 6, 2014 (IFT, 2014). On the same day, the Institute declared that companies belonging to the Televisa group and associated corporations also constituted a dominant economic agent (IFT, 2014). These rulings are grounds for the implementation of asymmetric regulation, and the main details of the asymmetric regulation implemented are set out in the following sections.
The “dominant economic agent” ruling against Grupo América Móvil The ruling declaring that América Móvil group (AMX) as a preponderant economic agent was based on the number of subscribers per service in the sector, and the number of minutes of traffic consumed in the main services contracted by end users, leading to the conclusion that the América Móvil group had a 61.8% share of the telecommunications sector nationally.
This declaration is the trigger for the implementation of asymmetric regulation. The most significant measures of which are: interconnection charges, sharing of infrastructure, local loop unbundling (LLU), leasing of dedicated links, regulation pertaining to roaming services, virtual mobile operators, requirements in relation to marketing of services, audiovisual content, and information and service quality obligations. The Act included various additional measures such as elimination of long distance charges. These measures are detailed below. a). Interconnection and local loop unbundling The Federal Telecommunications and Broadcasting Act (2014) make provision for imposing asymmetric regulation on the dominant party with respect to interconnection charges. The Act (2014) therefore went beyond what was set out in the Reform (2013) in both the latter respect and in mandating that the preponderant carrier not to charge anything for termination of traffic on its networks. This new zero interconnection and mobile termination rate has been a major blow for AMX (Pin, 2015). In addition the requirement on the part of the dominant operator to unbundle Telmex’s fixed local loop. b). Passive infrastructure sharing Ahead of the approval of the Federal Telecommunications and Broadcasting Bill5, the IFT (March, 2014) set out a requirement for the predominant operator to share what is termed the “passive infrastructure” or non-electronic infrastructure, which includes rights of way, masts, ditches, towers, posts, hardware facilities and associated power supplies, security, ancillary 5 The Act (2014) Chapter IV, on infrastructure sharing, Art. 139.
68

equipment, land, physical spaces, ducts, routing, power sources and air conditioning systems, including unbundled access to network elements, other than the local loop (IFT, 2014)6.
The conditions for infrastructure sharing are to be negotiated between the dominant
economic agent and the remaining operators based on the Proposal to Supply Shared Access and Use of Passive Infrastructure announced by the dominant economic agent on 30 June 2014.
The regulations provide that the parties concerned must first attempt to negotiate interconnection terms. The concessionaires have a period of 60 calendar days from the date one party requests interconnection to the other party to reach an interconnection agreement. IFT is entitled to intervene if the parties do not reach an agreement after the 60 days or if both parties request it. In the case of IFT intervention, the regulatory body has 60 calendar days to take a decision regarding those issues on which the parties have failed to reach agreement. Pricing Regulation on Infrastructure sharing should be based on cost-based prices while allowing operators to recoup investments and maintain their growth strategy. Regulators should work with operators to determine prices using known cost-based calculation methods, i.e., long-run incremental cost (LRIC).
In relation to the unbundling of the dominant operator’s local network, the IFT set out information and administration requirements. The IFT ruled that the dominant operator must implement electronic administration systems via which both the Institute and any potential contractors and virtual mobile operators may, remotely, view up-to-date information on the public telecommunications network and perform operations associated with wholesale mobile and landline services.
Regarding the leasing of dedicated links, on 13 December 2013 the IFT upheld the ruling previously issued by the now defunct Federal Competition Commission in which it was established that Teléfonos de México (Telmex) and Teléfonos del Noreste (Telnor) had significant market power (IFT, 20 January 2014). The IFT’s decision to uphold this ruling annuls the injunction previously sought by Telmex and Telnor.
The tariffs implemented for the leasing of dedicated interconnection links, whether local, long distance or international, are to be freely negotiated between the parties and, where they are unable to reach an agreement, will be determined by the IFT based on a “retail-minus” pricing model.
c) Roaming Among the measures imposed on the dominant economic agent, Telcel will cease to charge for roaming when users use their own network, irrespectively of whether they are located outside of the area of local service or region in which the service was contracted (IFT, April 8, 2014). Furthermore, wholesale tariffs for roaming services will be negotiated freely between operators. Where an agreement cannot be reached, tariffs for these services will be determined by the IFT based on a “retail-minus” pricing model. 6 IFT (March 25, 2014).
69

d) Abolition of long distance charges On the subject of long distance call charges, the Act requires the abolition of national long distance charges to users for calls made to destinations anywhere in the country (Art. 118, V) as of 1 January 2015 (IFT, 2014). In imposing this regulation, the Act has gone beyond the provisions set out by the IFT prior to this Act being brought in. e) Prohibition of tie-in by the dominant party In addition, it was ruled that the dominant economic agent must offer services that can be cancelled under the same terms under which they were contracted (IFT, April 8, 2014).
As well as upholding net neutrality, the Act sets out means of collaboration with legal
institutions. The introduction of these measures sets a level playing field, setting the conditions for greater market competition. f) Period of asymmetric regulation Under the Act, the requirements placed on the dominant economic agent will cease to apply upon a declaration from the Institute once, in accordance with the Act, conditions exist for effective competition in the market in question (Federal Telecommunications and Broadcasting Act: Article 262). Broadcasting, the ruling of market dominance with respect to Grupo Televisa and asymmetric regulation In relation to broadcasting services, the asymmetric regulation put in place as a result of Televisa Group being deemed to be a dominant economic agent center around the following points: a) Infrastructure sharing With regard to infrastructure, Televisa will be required to share passive infrastructure (non-electronic items such as towers, posts, land and other facilities) with its competitors. This measure boosts competition and facilitates the swift entry of new broadcasters into the market. b) Information requirements and pricing regulation The asymmetric regulation put in place requires Televisa to offer technical and security-related information to assist other operators with accessing Televisa’s infrastructure under fair conditions and to a high standard.
When it comes to setting rates for the use of this infrastructure, no specific guidelines are set. The regulation states that tariffs will be set on an unbundled, service-by-service basis, and makes provision for the IFT to intervene in the event of any dispute between Televisa and any operator requesting access to the infrastructure.
70
c) “Must carry, must offer” A central issue in the ruling declaring Televisa to be a dominant economic agent has been the requirement that the company must offer its TV broadcast signals to pay TV operators, whether terrestrial or satellite, operating within the same geographic region; these operators must then retransmit those signals free of charge. d) Regulation on advertising
On the question of advertising, the company is required to publish the terms and conditions of its advertisment broadcasting services and its corresponding pricing structures. Televisa is expressly forbidden to engage in practices that amount to a refusal to do business. The company will not be allowed to favor or discriminate when it comes to advertising spaces offered across its various platforms. When it comes to bundle advertising services, it must also offer these in an unbundled form.
e) Non-exclusivity of broadcasting rights to major events In relation to broadcasting rights, Televisa is required, as a dominant agent; to refrain from purchasing exclusive rights to events deemed to be major audiovisual content for any given location in the country.
For the purposes of defining major audiovisual content, Televisa will be required to present the IFT with any exclusivity agreements already signed for audiovisual content. The IFT will publish a list of major events every two years. To produce this list, they will take audience levels as a measurement, allowing them to identify content that attracts the greatest interest among a segment of the population within a given period of time and which has high audience levels (IFT, May 29, 2014).7
f) Ban on deals between two or more economic agents when purchasing content Televisa is required to refrain from joining “purchasing consortia” without prior permission from the regulator. A purchasing consortium is defined as any deal between two or more economic agents to purchase broadcasting rights jointly in order to acquire those rights on better terms.
7 The first of these lists was published on 30 May 2014 and identifies as major events: Mexican football selection matches; the opening and closing ceremonies of the Summer Olympics; the opening and closing ceremonies and opening matches, quarter finals, semifinal and final of the FIFA World Cup, held every four years and commonly known as the World Cup; final matches of the first division league tournament, held by the Mexican Football Federation and commonly known as “Liga MX”.
71
g) Independence of boards of directors of telecommunications and broadcasting services companies Televisa will not be permitted to participate either directly or indirectly in the capital of, or influence in any manner whatsoever, the administration or control of the dominant economic agent in the telecommunications sector. In addition, the company is bound to ensure that members of the boards of directors of its constituent entities refrain from being members of boards of, or from undertaking administrative roles for, the dominant economic agent in the telecommunications sector. e) Rules of tender for two new free-to-air television channels with national coverage In addition to asymmetric regulation, the Reform includes a plan for the inauguration of two television channels in order to boost competition. Under the “Rules of tender for new free-to-air television channels with national coverage to ensure that broadcasting services are provided under competitive conditions”, the IFT must put out an invitation to tender within 180 days of its incorporation. Televisa and TVAzteca and other licensees with 12 MHz or more may not participate. Market efficiency and the right to information and social service are key principles of the bidding process. In addition, the Reform mandates the creation of a nationwide state-owned TV broadcaster.
Most of these regulatory measures imposed on economic agents deemed to be dominant are in line with successful international practices, meaning that there is hope that by enforcing them—the task of the IFT—there will be greater competition in the sector, leading to improved penetration of telecommunications services and a reduction in the cost of such services as a result of improved market efficiency, which would then actually allow the market efficiency gap to be closed.
2. Declaration of service based market power As mentioned before, service-based regulation, in the form of a ruling of market dominance, regulates concentrations in the market for a given service or set of services in the telecommunications and broadcasting sectors, that inhibit competition either nationally or in a specific region or geographic area, as defined under Article 59 of the Economic Competition Act (Antitrust Act). Investigations are underway into illegal market concentrations in relation to the provision of pay TV in which Televisa concentrates 64% of this market. 3. Response from those economic agents deemed to have market dominance: América Móvil and Grupo Televisa The reactions of economic agents deemed to be dominant in telecommunications and broadcasting services were expressed immediately in the form of legal action (injunctions through the Mexican legal process of amparo) against the regulator’s rulings and in the case of América Móvil (AMX), the announcement of a divestment of the company’s assets in order to reduce its market share and hence no longer make it a dominant agent in the sector. We take a look at these responses below.
72
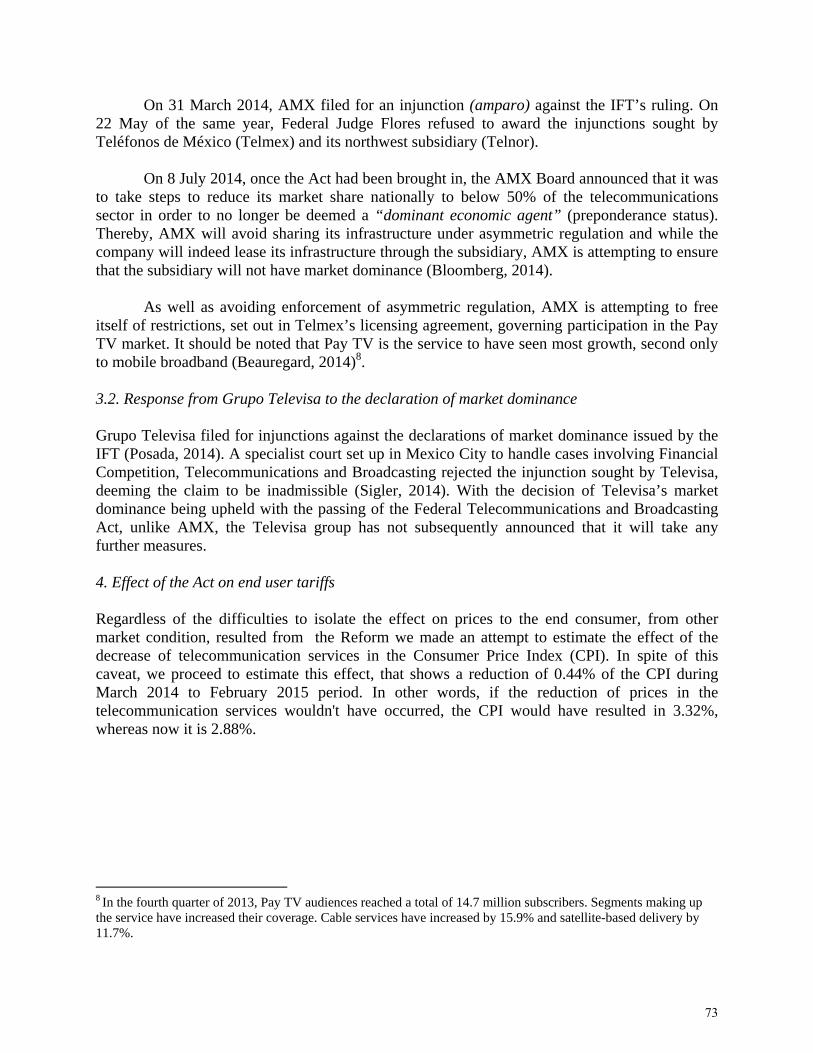
On 31 March 2014, AMX filed for an injunction (amparo) against the IFT’s ruling. On 22 May of the same year, Federal Judge Flores refused to award the injunctions sought by Teléfonos de México (Telmex) and its northwest subsidiary (Telnor).
On 8 July 2014, once the Act had been brought in, the AMX Board announced that it was to take steps to reduce its market share nationally to below 50% of the telecommunications sector in order to no longer be deemed a “dominant economic agent” (preponderance status). Thereby, AMX will avoid sharing its infrastructure under asymmetric regulation and while the company will indeed lease its infrastructure through the subsidiary, AMX is attempting to ensure that the subsidiary will not have market dominance (Bloomberg, 2014).
As well as avoiding enforcement of asymmetric regulation, AMX is attempting to free itself of restrictions, set out in Telmex’s licensing agreement, governing participation in the Pay TV market. It should be noted that Pay TV is the service to have seen most growth, second only to mobile broadband (Beauregard, 2014)8. 3.2. Response from Grupo Televisa to the declaration of market dominance Grupo Televisa filed for injunctions against the declarations of market dominance issued by the IFT (Posada, 2014). A specialist court set up in Mexico City to handle cases involving Financial Competition, Telecommunications and Broadcasting rejected the injunction sought by Televisa, deeming the claim to be inadmissible (Sigler, 2014). With the decision of Televisa’s market dominance being upheld with the passing of the Federal Telecommunications and Broadcasting Act, unlike AMX, the Televisa group has not subsequently announced that it will take any further measures. 4. Effect of the Act on end user tariffs Regardless of the difficulties to isolate the effect on prices to the end consumer, from other market condition, resulted from the Reform we made an attempt to estimate the effect of the decrease of telecommunication services in the Consumer Price Index (CPI). In spite of this caveat, we proceed to estimate this effect, that shows a reduction of 0.44% of the CPI during March 2014 to February 2015 period. In other words, if the reduction of prices in the telecommunication services wouldn't have occurred, the CPI would have resulted in 3.32%, whereas now it is 2.88%.
8 In the fourth quarter of 2013, Pay TV audiences reached a total of 14.7 million subscribers. Segments making up the service have increased their coverage. Cable services have increased by 15.9% and satellite-based delivery by 11.7%.
73
The Refohence thtelecomm
Tpolicy, bcommunParticuladivide bsocioeconcommun
In Mdeploymof the diits Informproject ar
Anp
9 Political C10 Constitu11 Comisió
orm elevateshe Reform munications
The Federal ringing togeications tech
ar emphasis between innomic levelications tech
May 2013, Ment of a natigital inclusimation and re:
An expandedetwork usinartnership (C
Constitution of
ution, Art. 6o. ón Federal de T
s citizens’ aalso guar
services, inc
Telecommuether programhnologies, iis placed on
ndividuals, s when it co
hnologies (F
Mexico’s Fedional transpoon projects Knowledge
d national fing the 700 MCOFETEL, 2
f the United St
Telecomunicaci
DIGIT
access to conrantees the cluding broa
unications anms and stratincluding brn more vulnhomes, bu
omes to oppederal Telec
deral Telecomort network by the Com
e Society C
fiber‐optic bMHz freque2013a)11.
tates of Mexico
iones (COFET
AL INCLUSIO
nnectivity toright to
dband and th
nd Broadcastegies designroadband Innerable grouusinesses aportunities fcommunicati
mmunication(COFETEL
mmunicationsCoordination
ackbone anncy band, t
o, as amended,
TEL) (2013a).
ON
o the status access infohe Internet.1
sting Act sened to provinternet accesups, with theand geografor accessingions and Bro
ns CommissL, 2013), whs and Transp
program. T
nd a shared to be deploy
art. 6º (VI), 7o
of a fundamormation, b
0
ets out a unde access toss for the ee aim of briaphical areag and using oadcasting A
sion publishhich had beeport SecretaThe main in
(wholesale)yed through
o.
mental right,broadcasting
niversal incluo informationentire populaidging the das of diffinformation
Act, Article 3
ed a plan fon adopted a
ariat (SCT) unitiatives of
) wireless ah a public‐pr
9 and and
usion n and ation.
digital ferent n and 3).
or the as one under f this
access rivate
74
“México Conectado” (“Mexico Connected”), a nationwide program with a target of installing 250,000 Internet public access points in government facilities across the country by 2019 (SCT, 2014a)12 Secretaría de Comunicaciones y Transportes. (SCT, 2014a).
1. A new state-operated backbone network TELECOMM, a state-managed company devolved from the Secretariat for Communications and Transport,13 will be operating an optic fiber transport network, in which 35,000 km of optic fiber will be added to the existing government-operated 25,000 km.
To the existing 112 points of presence an additional 972 access points will be added (“hoteles” and “minihoteles”). Under the Plan, only 26.9% of the population will be within 40 km of a backbone point of presence. Access to the latter will be provided via microwave links. This would provide coverage to 97.7% of the population. The purpose of the network backbone is to provide mobile and cable TV service operators, who have a data carrier network distributed throughout the country with the capability to link in with other networks abroad. All communities in the center and most of those in the south would be covered by points of access to the national carrier network. In the northern area of the country, smaller towns would be excluded. However, 85% of these towns (21,540) are places with 100 inhabitants or less, and of these, 13,237 have ten inhabitants or less (52%).
The Reform stipulates that the installation of the shared public telecommunications network will begin before the end of 2014 and that the network will be operating by the end of 2018. To date, information is not available on the proposed expansion of this network (35,000 km, in addition to the existing 25,000 km). Nor was information available on the fitting of 972 further points of presence in addition to the existing 112. 2. Wholesale mobile services and local cable TV operator network There are 1,500 cable companies distributed throughout the country. Most of these offer unidirectional pay TV services only, due to the high cost of access to—or lack of coverage of—the existing backbone. The new backbone will encourage mobile and cable TV operators, who until now have not had access to the necessary data transport infrastructure, to provide “triple play” services. These operators will have an incentive to provide broadband access within a triple play scheme. It is hoped that around 10 million homes (50 million citizens) will have increased broadband and telephony options. 3. The “Mexico Connected” Program A proposal was set out to turn public places into network access points with links to the optic fiber network, thus promoting universal access to broadband: schools, universities, clinics, hospitals, government buildings, public open spaces, and any place providing public services.
12 Secretaría de Comunicaciones y Transportes. (Secretariat for Communications and Transport,SCT: 2014a). 13 A decentralized body devolved from the Secretariat for Communications and Transport.
75
There are approximately 250,000 such public places in the country, with 44.6% located in rural localities of fewer than 500 inhabitants, home to just 9% of the population. The public access points, in addition to offering broadband connectivity, will aid the provision of government (e-Government), education, health and other services.
A precursor to this program consisted of Digital Community Centers (or CCDs with their Spanish acronym), part of the Communications Secretariat’s Information and Knowledge Society Coordination program, which started up in 2002 with the aim of providing public access to the Internet and to information technology, and thus helping to bridge the digital divide. The connectivity strategy consisted of setting up CCDs providing public Internet access as well as access to computing and printing facilities and training in the use of such technologies.
Moreover, these CCDs or telecenters were the result of collaboration and joint responsibility agreements between the Secretariat’s Information and Knowledge Society Coordination program and various Government offices tasked with developing content in the areas of education and training, health, social development and distance government administrative procedures.
Over the first decade or so after the CCD scheme was set up (2002-2009), the number of CCDs saw an average annual increase of 19.3%, rising from 1,838 CCDs in 2002 to 8,971 in 2009. For 2011 (SCT, 2012), it is reported that only 6,788 CCDs were operational, representing an annual drop of 13.0% between 2009 and 2011 (see also “National Digital Agenda", SCT, 2012).
As a result of the Mexico Connected policy, during 2014 there were 39,167 public Internet access points in operation. The number of Internet access points has seen a 500% increase in just three years. However, this scheme does not involve CCD-type facilities but rather locations offering Internet access only.
The Mexico Connected project makes provision for a “digital promoter” to be present, along with services appropriate to the public place in question. For example, administrative applications if the center is located in a government building, or education if it is located in an educational institution; similarly, for health services if the access point is located in a clinic.
Out of the 39,167 Internet access points, the Secretariat states that approximately 13% of these have a digital promoter. According to the document “Mexico Connected” (SCT, 2014a), the latter is responsible for “administering and promoting” digital services within the center (SCT, 2014b). It remains to be determined who might be responsible for providing digital skills and administration for the remaining 87% of these broadband network access points.
From the SCT’s report and that of the Information and Knowledge Society Coordination program on the subject of these broadband Internet access points, it is unclear whether they are simply such, or whether they are actually CCDs. While it is suggested in the documentation that these places represent more than simply an Internet connectivity service, with means of accessing training programs and content relevant to learning and development of the local economy (Type 1 CCDs), the information available is not conclusive in terms of what progress
76

has beenmentioneinstitutiomade to t
Tnumber oon the 39likely thastarting pservices i
Testablishm
Dcontrastinwith the the greatgiven in
n made in thed, referringns (Type 3)the content o
This lack of iof digital pro9,167 Internat most are point for thein the areas
The distributiments and h
Despite the ng potential actual numb
test proportiTable 1.
his regard asg to Internet), governmenor roles that
information omotores (on
net access posimply broa
e future deveof education
ion of thesehealth institut
huge advandemand (de
ber of these on of citizen
s of Augustt access point offices (Tthese other t
suggests thanly 13% of
oints does noadband Interelopment of n, health and
e access pointions, as sho
nce in the efined as the
access poinns living in
t 2014. Morints in educType 4) and types of CCD
at Type 1 CCCCDs have ot necessarilrnet access pspaces for d
d e-Governm
nts in Mexicown in Figur
number of e number of nts available
poverty (C
reover, whilecational esta
public spacDs will actu
CDs are in thone of thes
ly imply thapoints. Suchdigital literac
ment.
co is largelyre 1. (SCT, 2
broadband citizens betw. Taking as ONEVAL, 2
e further typablishments ces (Type 5)ually serve.
he minority, e staff mem
at these are Ch facilities arcy and acces
y biased tow2014)
access poiween 12 andour sample 2014), such
pes of CCD(Type 2), h), no referen
equivalent tmbers). The r
CCDs; it is re undoubtess to value a
wards educat
ints, it is wd 54 years ofthose states
h a comparis
Ds are health nce is
to the report more
edly a added
tional
worth f age) s with son is
77
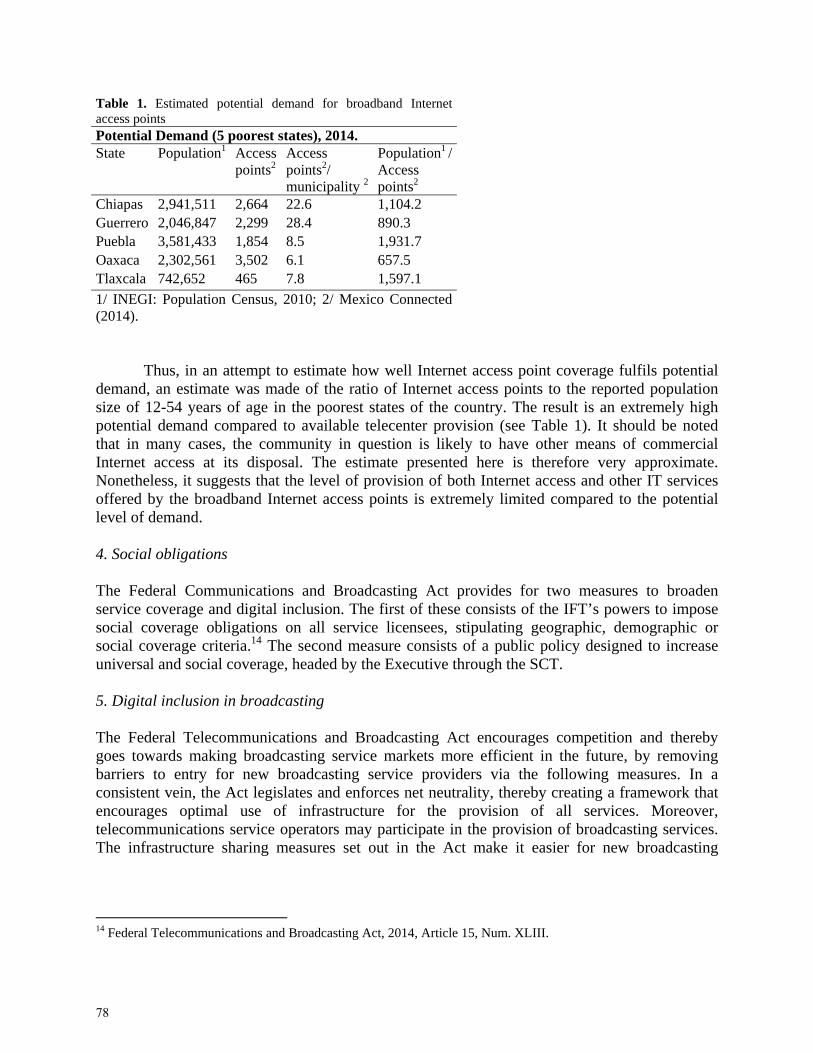
Table 1. Estimated potential demand for broadband Internet access points Potential Demand (5 poorest states), 2014.State Population1 Access
points2 Access points2/ municipality 2
Population1 / Access points2
Chiapas 2,941,511 2,664 22.6 1,104.2 Guerrero 2,046,847 2,299 28.4 890.3 Puebla 3,581,433 1,854 8.5 1,931.7 Oaxaca 2,302,561 3,502 6.1 657.5 Tlaxcala 742,652 465 7.8 1,597.1
1/ INEGI: Population Census, 2010; 2/ Mexico Connected (2014).
Thus, in an attempt to estimate how well Internet access point coverage fulfils potential demand, an estimate was made of the ratio of Internet access points to the reported population size of 12-54 years of age in the poorest states of the country. The result is an extremely high potential demand compared to available telecenter provision (see Table 1). It should be noted that in many cases, the community in question is likely to have other means of commercial Internet access at its disposal. The estimate presented here is therefore very approximate. Nonetheless, it suggests that the level of provision of both Internet access and other IT services offered by the broadband Internet access points is extremely limited compared to the potential level of demand. 4. Social obligations The Federal Communications and Broadcasting Act provides for two measures to broaden service coverage and digital inclusion. The first of these consists of the IFT’s powers to impose social coverage obligations on all service licensees, stipulating geographic, demographic or social coverage criteria.14 The second measure consists of a public policy designed to increase universal and social coverage, headed by the Executive through the SCT. 5. Digital inclusion in broadcasting The Federal Telecommunications and Broadcasting Act encourages competition and thereby goes towards making broadcasting service markets more efficient in the future, by removing barriers to entry for new broadcasting service providers via the following measures. In a consistent vein, the Act legislates and enforces net neutrality, thereby creating a framework that encourages optimal use of infrastructure for the provision of all services. Moreover, telecommunications service operators may participate in the provision of broadcasting services. The infrastructure sharing measures set out in the Act make it easier for new broadcasting
14 Federal Telecommunications and Broadcasting Act, 2014, Article 15, Num. XLIII.
78
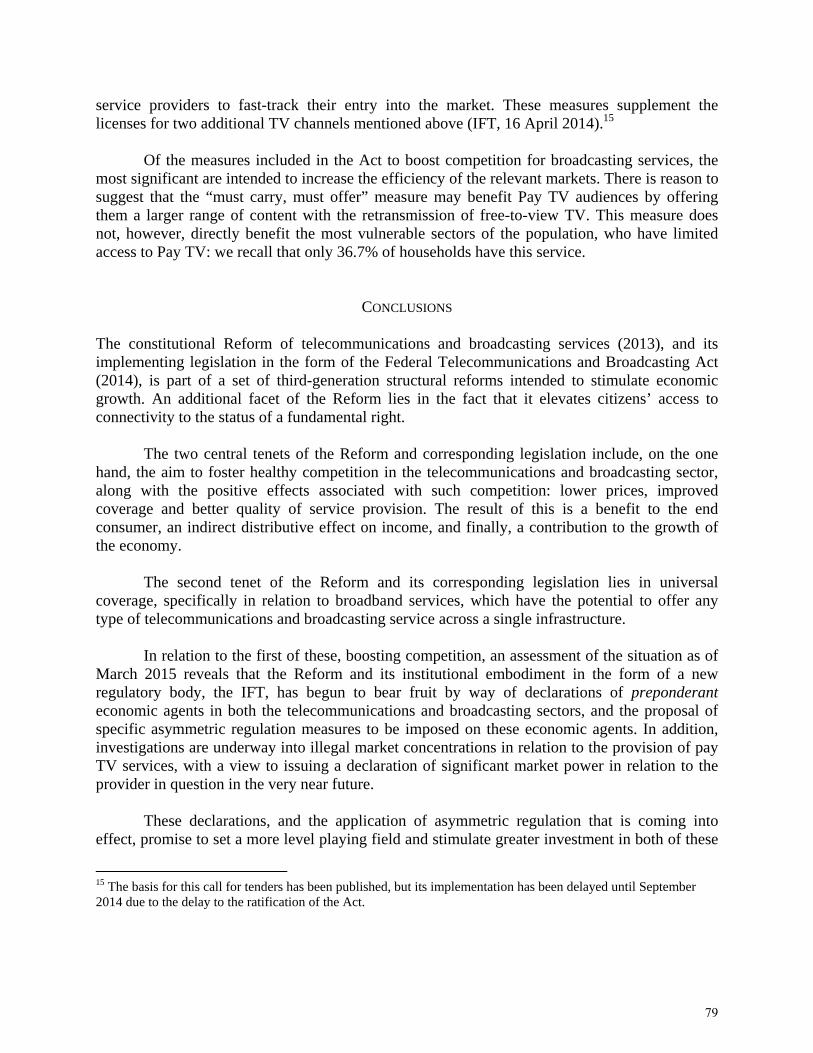
service providers to fast-track their entry into the market. These measures supplement the licenses for two additional TV channels mentioned above (IFT, 16 April 2014).15
Of the measures included in the Act to boost competition for broadcasting services, the most significant are intended to increase the efficiency of the relevant markets. There is reason to suggest that the “must carry, must offer” measure may benefit Pay TV audiences by offering them a larger range of content with the retransmission of free-to-view TV. This measure does not, however, directly benefit the most vulnerable sectors of the population, who have limited access to Pay TV: we recall that only 36.7% of households have this service.
CONCLUSIONS The constitutional Reform of telecommunications and broadcasting services (2013), and its implementing legislation in the form of the Federal Telecommunications and Broadcasting Act (2014), is part of a set of third-generation structural reforms intended to stimulate economic growth. An additional facet of the Reform lies in the fact that it elevates citizens’ access to connectivity to the status of a fundamental right.
The two central tenets of the Reform and corresponding legislation include, on the one hand, the aim to foster healthy competition in the telecommunications and broadcasting sector, along with the positive effects associated with such competition: lower prices, improved coverage and better quality of service provision. The result of this is a benefit to the end consumer, an indirect distributive effect on income, and finally, a contribution to the growth of the economy.
The second tenet of the Reform and its corresponding legislation lies in universal coverage, specifically in relation to broadband services, which have the potential to offer any type of telecommunications and broadcasting service across a single infrastructure.
In relation to the first of these, boosting competition, an assessment of the situation as of March 2015 reveals that the Reform and its institutional embodiment in the form of a new regulatory body, the IFT, has begun to bear fruit by way of declarations of preponderant economic agents in both the telecommunications and broadcasting sectors, and the proposal of specific asymmetric regulation measures to be imposed on these economic agents. In addition, investigations are underway into illegal market concentrations in relation to the provision of pay TV services, with a view to issuing a declaration of significant market power in relation to the provider in question in the very near future.
These declarations, and the application of asymmetric regulation that is coming into effect, promise to set a more level playing field and stimulate greater investment in both of these
15 The basis for this call for tenders has been published, but its implementation has been delayed until September 2014 due to the delay to the ratification of the Act.
79
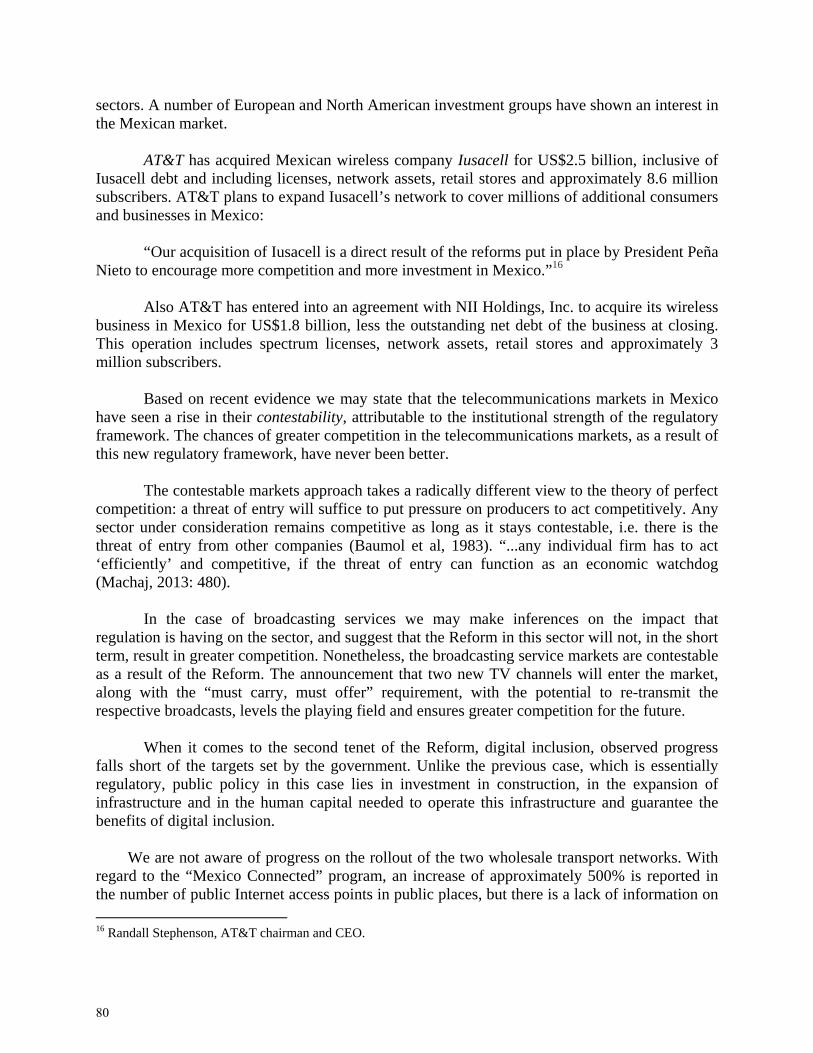
sectors. A number of European and North American investment groups have shown an interest in the Mexican market.
AT&T has acquired Mexican wireless company Iusacell for US$2.5 billion, inclusive of Iusacell debt and including licenses, network assets, retail stores and approximately 8.6 million subscribers. AT&T plans to expand Iusacell’s network to cover millions of additional consumers and businesses in Mexico:
“Our acquisition of Iusacell is a direct result of the reforms put in place by President Peña Nieto to encourage more competition and more investment in Mexico.”16
Also AT&T has entered into an agreement with NII Holdings, Inc. to acquire its wireless business in Mexico for US$1.8 billion, less the outstanding net debt of the business at closing. This operation includes spectrum licenses, network assets, retail stores and approximately 3 million subscribers.
Based on recent evidence we may state that the telecommunications markets in Mexico have seen a rise in their contestability, attributable to the institutional strength of the regulatory framework. The chances of greater competition in the telecommunications markets, as a result of this new regulatory framework, have never been better.
The contestable markets approach takes a radically different view to the theory of perfect competition: a threat of entry will suffice to put pressure on producers to act competitively. Any sector under consideration remains competitive as long as it stays contestable, i.e. there is the threat of entry from other companies (Baumol et al, 1983). “...any individual firm has to act ‘efficiently’ and competitive, if the threat of entry can function as an economic watchdog (Machaj, 2013: 480).
In the case of broadcasting services we may make inferences on the impact that regulation is having on the sector, and suggest that the Reform in this sector will not, in the short term, result in greater competition. Nonetheless, the broadcasting service markets are contestable as a result of the Reform. The announcement that two new TV channels will enter the market, along with the “must carry, must offer” requirement, with the potential to re-transmit the respective broadcasts, levels the playing field and ensures greater competition for the future.
When it comes to the second tenet of the Reform, digital inclusion, observed progress falls short of the targets set by the government. Unlike the previous case, which is essentially regulatory, public policy in this case lies in investment in construction, in the expansion of infrastructure and in the human capital needed to operate this infrastructure and guarantee the benefits of digital inclusion.
We are not aware of progress on the rollout of the two wholesale transport networks. With regard to the “Mexico Connected” program, an increase of approximately 500% is reported in the number of public Internet access points in public places, but there is a lack of information on 16 Randall Stephenson, AT&T chairman and CEO.
80

the extent to which these access points are equipped with the necessary infrastructure for developing digital skills that would foster the adoption of such technologies and trigger a process of economic development.
81
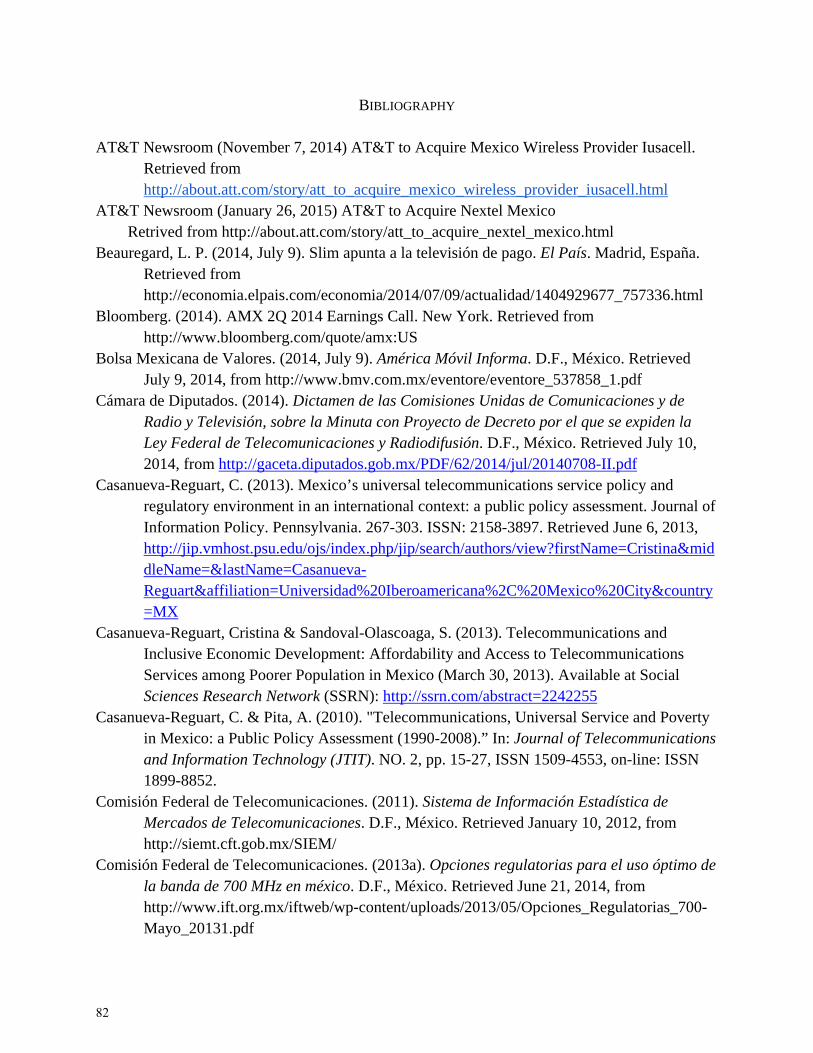
BIBLIOGRAPHY
AT&T Newsroom (November 7, 2014) AT&T to Acquire Mexico Wireless Provider Iusacell. Retrieved from http://about.att.com/story/att_to_acquire_mexico_wireless_provider_iusacell.html
AT&T Newsroom (January 26, 2015) AT&T to Acquire Nextel Mexico Retrived from http://about.att.com/story/att_to_acquire_nextel_mexico.html Beauregard, L. P. (2014, July 9). Slim apunta a la televisión de pago. El País. Madrid, España.
Retrieved from http://economia.elpais.com/economia/2014/07/09/actualidad/1404929677_757336.html
Bloomberg. (2014). AMX 2Q 2014 Earnings Call. New York. Retrieved from http://www.bloomberg.com/quote/amx:US
Bolsa Mexicana de Valores. (2014, July 9). América Móvil Informa. D.F., México. Retrieved July 9, 2014, from http://www.bmv.com.mx/eventore/eventore_537858_1.pdf
Cámara de Diputados. (2014). Dictamen de las Comisiones Unidas de Comunicaciones y de Radio y Televisión, sobre la Minuta con Proyecto de Decreto por el que se expiden la Ley Federal de Telecomunicaciones y Radiodifusión. D.F., México. Retrieved July 10, 2014, from http://gaceta.diputados.gob.mx/PDF/62/2014/jul/20140708-II.pdf
Casanueva-Reguart, C. (2013). Mexico’s universal telecommunications service policy and regulatory environment in an international context: a public policy assessment. Journal of Information Policy. Pennsylvania. 267-303. ISSN: 2158-3897. Retrieved June 6, 2013, http://jip.vmhost.psu.edu/ojs/index.php/jip/search/authors/view?firstName=Cristina&middleName=&lastName=Casanueva-Reguart&affiliation=Universidad%20Iberoamericana%2C%20Mexico%20City&country=MX
Casanueva-Reguart, Cristina & Sandoval-Olascoaga, S. (2013). Telecommunications and Inclusive Economic Development: Affordability and Access to Telecommunications Services among Poorer Population in Mexico (March 30, 2013). Available at Social Sciences Research Network (SSRN): http://ssrn.com/abstract=2242255
Casanueva-Reguart, C. & Pita, A. (2010). "Telecommunications, Universal Service and Poverty in Mexico: a Public Policy Assessment (1990-2008).” In: Journal of Telecommunications and Information Technology (JTIT). NO. 2, pp. 15-27, ISSN 1509-4553, on-line: ISSN 1899-8852.
Comisión Federal de Telecomunicaciones. (2011). Sistema de Información Estadística de Mercados de Telecomunicaciones. D.F., México. Retrieved January 10, 2012, from http://siemt.cft.gob.mx/SIEM/
Comisión Federal de Telecomunicaciones. (2013a). Opciones regulatorias para el uso óptimo de la banda de 700 MHz en méxico. D.F., México. Retrieved June 21, 2014, from http://www.ift.org.mx/iftweb/wp-content/uploads/2013/05/Opciones_Regulatorias_700-Mayo_20131.pdf
82
Comisión Federal de Telecomunicaciones. (2013b). Red Nacional de Transporte. Estudio de Demanda de Capacidad de Transmisión del Servicio de Larga Distancia. D.F., México. Retrieved from http://www.ift.org.mx/iftweb/wp-content/uploads/2013/05/Red_Nacional_de_Transporte1.pdf
Consejo Nacional de Evaluación la Política de Desarrollo Social. (2013). Anexo estadístico de pobreza en México. D.F., México. Retrieved January 20, 2014, from http://www.coneval.gob.mx/Medicion/Paginas/Medici%C3%B3n/Pobreza 2012/Anexo-estad%C3%ADstico-pobreza-2012.aspx
Diario Oficial de la Federación. (2011). Resolución mediante la cual el Pleno de la Comisión Federal de Telecomunicaciones emite los lineamientos para desarrollar los modelos de costos que aplicará para resolver, en términos del artículo 42 de la Ley Federal de Telecomunicaciones, desacuerdos en materia de tarifas aplicables a la prestación de los servicios de interconexión entre concesionarios de redes públicas de telecomunicaciones. D.F., México. Retrieved April 15, 2011, from http://www.dof.gob.mx/nota_detalle.php?codigo=5185551&fecha=12/04/2011
Diario Oficial de la Federación. (2013). DECRETO por el que se reforman y adiciones diversas disposiciones de los artículos 6o, 7o, 27, 28, 73, 78, 94 y 105 de la Constitución Política de los Estados Unidos Mexicanos , en materia de telecomunicaciones. D.F., México. Retrieved June 15, 2013, from http://www.dof.gob.mx/nota_detalle.php?codigo=5301941&fecha=11/06/2013
Diario Oficial de la Federación. (2014a). ACUERDO mediante el cual el Pleno del Instituto Federal de Telecomunicaciones emite los Lineamientos generales en relación con lo dispuesto por la fracción I del artículo octavo transitorio del Decreto por el que se reforman y adicionan diversas disposiciones de los artículos 6o., 7o., 27, 28, 73, 78, 94 y 105 de la Constitución Política de los Estados Unidos Mexicanos, en Materia de Telecomunicaciones. D.F., México. Retrieved March 11, 2014, from http://www.dof.gob.mx/nota_detalle.php?codigo=5334106&fecha=27/02/2014
Diario Oficial de la Federación. (2014b). DECRETO por el que se expide la Ley Federal de Competencia Económica y se reforman y adicionan diversos artículos del Código Penal Federal. D.F., México. Retrieved July 10, 2014, from http://www.dof.gob.mx/nota_detalle.php?codigo=5345958&fecha=23/05/2014
Instituto Federal de Telecomunicaciones. (2014a). Acuerdo por el que el pleno del Instituto Federal de Telecomunicaciones identifica los contenidos audiovisuales relevantes. D.F., México. Retrieved July 06, 2014, from http://www.ift.org.mx/iftweb/wp-content/uploads/2014/05/P_IFT_EXT_290514_105.pdf
Instituto Federal de Telecomunicaciones. (2014b). El pleno del IFT aprueba el valor mínimo de referencia para licitar frecuencias de televisión radiodifundida digital, para formar dos cadenas con cobertura nacional. D.F., México. Retrieved June 29, 2014, from http://www.ift.org.mx/iftweb/wp-content/uploads/2014/04/COMUNICADO-17-IFT-16-04-2014.pdf
83

Instituto Federal de Telecomunicaciones. (2014c). El pleno del IFT establece los comités técnicos de los sistemas electrónicos de gestión y de desagregación de la red local. D.F., México. Retrieved July 15, 2014, from http://www.ift.org.mx/iftweb/wp-content/uploads/2014/05/COMUNICADO-IFT-24-280514.pdf
Instituto Federal de Telecomunicaciones. (2014 d). Mayores beneficios para los usuarios de servicios de telecomunicaciones. D.F., México. Retrieved April 15, 2014, from http://www.ift.org.mx/iftweb/wp-content/uploads/2014/04/COMUNICADO-IFT-15-08-04-14.pdf
Instituto Federal de Telecomunicaciones. (2014e). Reglas de operación del comité técnico del sistema electrónico de gestión para la red del fija del agente económico preponderante. D.F., México. Retrieved July 15, 2014, from http://www.ift.org.mx/iftweb/wp-content/uploads/2014/03/ANEXO_DOS.pdf
Instituto Federal de Telecomunicaciones. (2014f). Resolución mediante la cual el pleno del instituto federal de telecomunicaciones en cumplimiento a la ejecutoria dictada por el pleno de la suprema corte de justicia de la nación al resolver el amparo en revisión 318/2011, deja insubsistente en una parte. D.F., México. Retrieved June 24, 2014, from http://apps.ift.org.mx/publicdata/P_IFT_EXT_240114_2.pdf
Instituto Federal de Telecomunicaciones. (2014g). Versión pública del acuerdo p/ift/ext/060314/76 de la sesión del pleno del instituto federal de telecomunicaciones en su v sesión extraordinaria del 2014, celebrada el 6 de marzo de 2014. D.F., México. Retrieved March 10, 2014, from http://apps.ift.org.mx/publicdata/P_IFT_EXT_060314_76_Version_Publica_Hoja.pdf
Instituto Federal de Telecomunicaciones. (2014h). Versión pública del acuerdo p/ift/ext/060314/77 de la sesión del pleno del instituto federal de telecomunicaciones en su v sesión extraordinaria del 2014, celebrada el 6 de marzo de 2014. D.F., México. Retrieved April 15, 2014, from http://apps.ift.org.mx/publicdata/P_IFT_EXT_060314_77.pdf
Instituto Nacional de Estadística, Geografía e Informática. (2011). Censo de Población y Vivienda 2010. Retrieved January 12, 2012, from http://www.censo2010.org.mx/
Instituto Nacional de Estadística, Geografía e Informática. (2013). Módulo sobre Disponibilidad y Uso de Tecnologías de la Información en los Hogares. Retrieved June 06, 2014, from http://www3.inegi.org.mx/sistemas/microdatos/encuestas.aspx?c=34504&s=est
Machaj, M. (2013). Sunk Costs and Contestable Markets. The Quarterly Journal of Austrian Economics, 16(4), 479–502.
Muente-Kunigami, A., & Navas-Sabater, J. (2009). Options to Increase Access to Telecommunications Services in Rural and Low-income Areas (The World Bank Working Paper No. 178). Washington, D.C. Retrieved from http://siteresources.worldbank.org/EXTINFORMATIONANDCOMMUNICATIONANDTECHNOLOGIES/Resources/282822-
84
1208273252769/Options_to_Increase_Access_to_Telecommunications_Services_in_rural_and_Low-Income_Areas.pdf
OECD. (2012). OECD Review of Telecommunication Policy and Regulation in Mexico. Retrieved from http://www.oecd.org/sti/broadband/50550219.pdf
Periódico 24 Horas. (2014, May 22). Juez niega a Telmex amparo contra preponderancia. D.F., México. Retrieved from http://www.24-horas.mx/juez-niega-a-telmex-amparo-contra-preponderancia/
Pin, U.R. (2015). Mexico’s New Telecommunications Law — A Step in the Right Direction. Boston: Bingham McCutchen LLP. Recuperado el 7 de marzo, 2015 de: http://www.bingham.com/News/2014/07/Mexicos-New-Telecommunications-Law-A-Step-in-the-Right-Direction
Posada, M. (2014, March 31). Televisa se ampara contra declaratoria de preponderancia de Ifetel. D.F., México. La Jornada. Retrieved from http://www.jornada.unam.mx/ultimas/2014/03/31/televisa-interpuso-amparo-contra-declaratoria-de-preponderancia-de-ifetel-7198.html
Secretaría de Comunicaciones y Transportes. (2012). Agenda Digital.mx. D.F., México. Retrieved May 14, 2014, from http://www.sct.gob.mx/uploads/media/AgendaDigital_mx.pdf
Secretaría de Comunicaciones y Transportes. (2014a). Acciones México Conectado. D.F., México. Retrieved July 02, 2014, from http://www.mexicoconectado.gob.mx/images/archivos/Mexico_Conectado_acciones_de_conectividad_Brochure_Final_cambios_finales_v9.pdf
Secretaría de Comunicaciones y Transportes. (2014b). México Conectado. D.F., México. Retrieved July 29, 2014, from http://www.mexicoconectado.gob.mx/index.php/sobre-mexico-conectado
Secretaría de Comunicaciones y Transportes. (2014c). Promotores Digitales. D.F., México. Retrieved July 24, 2014, from http://www.promotoresdigitales.mx/quienes-somos
Sigler, E. (2014, April 8). Televisa pierde amparo vs preponderancia. CNN Expansión. D.F., México. Retrieved July 26, 2014, from http://www.cnnexpansion.com/negocios/2014/04/08/televisa-pierde-amparo-vs-ley-telecom
Stern, P., Townsend, D., & Stephens, R. (2006). New Models for Universal Access in Latin America. Washington, D.C. Retrieved from http://www.ictregulationtoolkit.org/Documents/Document/Document/3511&sa=U&ei=SWjqU-OtNMjd8AHWtYGIBA&ved=0CAcQFjAB&client=internal-uds-cse&usg=AFQjCNHIN4IMGJklN8QA199ykcBe1dajnQ
85
Impacto que tiene la Inversion en Educacion Superior en el Desarrollo Economico: Factor Crítico de Progreso Economico
DR. JOSÉ BARRAGÁN-CODINA1
Escuela de Negocios, Universidad Autónoma de Nuevo León
M.A. FELIPE PALE-CERVANTES
Escuela de Negocios, Universidad Autónoma de Nuevo León
¿Cuál podría ser considerado como el principal aporte de un egresado universitario a la comunidad empresarial? Son muchas las expectativas, pero en tiempos de crisis, la contratación de egresados universitarios por parte de las empresas, se reduce contundentemente al incremento en las utilidades o su participación rentable en el mercado. Esta investigación pretende ofrecer un panorama en sus referencias cuantitativas y cualitativas sobre la efectiva aportación que hacen los egresados universitarios al desarrollo económico de una región y particularmente a la de una nación, en tiempos de altos índices de desempleo. PALABRAS CLAVE Egresados, comunidad empresarial, desarrollo económico, utilidades What would be considered the main contribution of university graduate to enterprises? There are many expectations, but at times of crisis, the hiring of college graduates is strongly reduced to increase their profits or their share of their market. This research aims to offer a quantitative and qualitative perspective of the contribution of graduates to economic development of a region and particularly of a nation, in times of high unemployment. KEYWORDS Graduate, enterprise community, economic development, profits
1 Address correspondence to Dr. Jose Barragan-Codina, Escuela de Negocios, Universidad Autónoma de Nuevo León. E-mail: [email protected]
86
INTRODUCCIÓN Si efectuamos un análisis de los factores considerados como críticos para el éxito del desarrollo económico de una entidad, seguramente la educación se sitúa en los primeros lugares sobre las prioridades de manejo que el gobierno debe mantener dentro de su administración, ya que la inversión en educación, se traduce posteriormente, en impactos económicos de alto beneficio, tales como generación de nuevas tecnologías y sistemas de producción y aprovechamiento de recursos, apoyos en la creación de empresas con mayor rentabilidad y competitividad en su operación, incremento en fuentes de empleo, y un considerable incremento en el ingreso personal de los egresados universitarios. La inversión en educación debe ser considerada como el centro neurálgico de una estrategia de desarrollo económico en una entidad, ya que es al educación quien finalmente se da a la tarea de formar a las siguientes generaciones de profesionistas que prácticamente serán los responsables de los destinos económicos de su comunidad.
El Estado deberá comprometerse e involucrase directamente en programas de apoyo a la inversión en educación como parte de los enfoques estratégicos para el desarrollo económico que pretende llevar a la comunidad.
LA ECONOMÍA QUE EMERGE La economía que resulta en nuestro aquí y ahora, es conocida como economía del conocimiento, también se le llama economía basada en la información, o en el aprendizaje, y finalmente concluimos después de interminables rondas de trabajo entre intelectuales, empresarios, económicos, políticos y académicos, que el conocimiento forjado en las universidades adquiere un rol central en el proceso productivo y competitivo de la economía, debido no solo por la adquisición del conocimiento permanente, sino por la generación y aplicación de nuevas tecnologías traducidas en una habilidad más competitiva: aprender con inteligencia y desarrollar progreso accesible a toda la comunidad, como es declarado en la OECD.
LOS POSTULADOS DE LA OECD ANTE LA INVERSIÓN EN EDUCACIÓN La mayoría de los países de América Latina han reconocido la necesidad de una inversión masiva a nivel de la educación secundaria. Durante las reuniones organizadas por el Gobierno del Estado de Nuevo León, llamada “El Futuro de las Américas” en Enero del 2004, se confirmó la intención de lograr una transformación de “mano-factura” a “mente-factura” y esto es obviamente mucho mas factible a través de la educación universitaria en conjunto con la planta productiva del Estado.
Para tener una fuerza de trabajo calificada y adaptada a las necesidades de una economía abierta y responder a una fuerte demanda social, países como Chile y Argentina han iniciado una profunda reforma curricular con el propósito de elevar la calidad de la educación universitaria. Estas reformas los han llevado a cuestionar el funcionamiento actual del sector de la educación técnico-profesional y cuáles son los cambios necesarios para un mejor desempeño económico. Entre las consideraciones más importantes están, primordialmente la adecuada
87
selección de las disciplinas a enseñar y cómo enseñarlas, el volumen de inversión en educación universitaria, el papel que debería jugar el financiamiento público con relación a la inversión en educación universitaria, los mejores incentivos requeridos para promover la vinculación con las empresas, las reformas institucionales para adaptar las escuelas técnicas a los “clúster” estratégicos existentes, y el papel de los programas de empleo para los egresados universitarios, que dicho sea de paso, debe ser considerado como estratégico. En referencia a las economías emergentes, como México, y pertenecientes a la OCDE ofrece algunos tópicos de reflexión.
Los países de la OCDE a pesar de una disminución de la par relativa del grupo de edad de
15 a 24 años en la población, del alto nivel de escolarización de estos jóvenes y de los múltiples programas dedicados al empleo, siguen enfrentando los problemas de la transición de los jóvenes al empleo. En febrero de 1999 tuvo lugar en Washington la conferencia “La formación de los jóvenes para el siglo 21: Las lecciones de política de las últimas dos décadas” para examinar los primeros resultados de algunos estudios realizados en 14 países de la OCDE. Estos estudios trataron de responder a las siguientes tres preguntas:
1. cómo asegurar que las políticas de educación, sociales y de empleo sean más coherentes para
así permitir a los jóvenes un mejor inicio de su vida; 2. cómo desarrollar políticas más eficientes para tratar los problemas específicos de los jóvenes
desfavorecidos, y ; 3. cómo ayudar los jóvenes a tener mejores carreras profesionales.
Este documento pretende justificar en su más amplia forma, que la inversión
gubernamental en educación suprior, llega a traducirse en factor relevante para el desarrollo económico del estado, tomando en cuenta escenarios similares en países latinoamericanos pertenecientes a la OECD.
NO DEBE CONSIDERASE QUE TODA POLÍTICA EDUCATIVA CONTRIBUYE EN DESARROLLO
ECONÓMICO Según un estudio de López, Thomas y Wang (2009) sobre reportes del Banco Mundial, mantienen que un gran número de países que han logrado un fuerte desarrollo económico lo han acompañado de una inversión substancial en capital humano. Las principales teorías económicas confirman esta relación causal entre la educación y el crecimiento, y muchos estudios demuestran la rentabilidad de una inversión en educación. En cuanto a la medición de la contribución de la educación al desarrollo económico es realmente difícil de someterse a mesura miento, y por tanto la evidencia empírica demuestra que la educación por sí misma no garantiza en todo caso un desarrollo exitoso y sostenible. Debe formar parte de un plan estratégico, integral y firmemente condensado y aceptado formalmente como compromiso entre gobierno, universidades y organizaciones empresariales, para que se considere que realmente como política educativa, tiene impacto en el desarrollo económico.
Los autores de este estudio, R. López, V. Thomas y Y. Wang, ponen en evidencia que la educación para ser eficiente debe acompañarse de una serie de reformas económicas que mejoran su impacto, tal como la apertura al comercio internacional y un mercado de trabajo competitivo y
88
flexible para el uso de las competencias. A su vez, prueban la hipótesis de una relación virtuosa en la cual la apertura económica crea una demanda para la educación y el conocimiento incrementa el valor de las exportaciones y la competitividad del país. Por ejemplo, en un contexto de mercado competitivo y abierto, un crecimiento de 5% del nivel de educación de la fuerza de trabajo puede acelerar el crecimiento económico en 0.85%.
Adicionalmente, muestran que las políticas educativas no son equivalentes y que la
distribución de la inversión en educación es importante: una mayor inequidad en la distribución de la educación tiene un impacto negativo sobre el crecimiento económico. En el siguiente gráfico se presenta la evolución durante el periodo 1970-95 del coeficiente de Gini de inequidad educativa para una selección de países que muestran situaciones contrastadas. Mientras más alto sea el coeficiente, mayor es la inequidad. Con la democratización del acceso a la educación se observa una tendencia general a la reducción de la inequidad. Los casos más notables son Corea y México. Se puede verificar una excepción con Venezuela donde recién empeoró la inequidad educativa a pesar de tener una de las más largas democracias de América Latina. Esta inequidad es el resultado de la gratuidad en la educación superior que favorece una minoría. El excesivo gasto público a este nivel genera una carencia de recursos para mejorar el acceso a la educación básica. En Chile, durante la década 85-95 el nivel de inequidad se mantuvo estable, mientras que en Argentina se produjo una reducción significativa de la inequidad.
EL RETORNO DE LA INVERSIÓN EN EDUCACIÓN PARA LOS ESTUDIANTES Una interesante perspectiva sobre el tema de la inversión en educación, es el observar a través de las estadísticas, en el caso particular de México, como se puede advertir la recuperación de la inversión que los estudiantes llevan a cabo en su propia educación.
Según la información de la Encuesta Nacional de Ingresos y Gastos de los Hogares (ENIGH) que levantó el INEGI en el 2000, encontramos algunos resultados interesantes. Los $ 21.42 pesos por hora que en promedio percibieron los 26.3 millones de personas con remuneraciones por trabajo durante el periodo de referencia de la encuesta, se distribuyeron de manera claramente diferenciada según logros educativos de los egresados
De esta manera, los perceptores ocupados sin instrucción, percibieron sólo $ 8.02 pesos por hora, en tanto que aquellos con primaria incompleta obtuvieron $10.20 pesos por hora, indicando que unos cuantos años de escolaridad básica pueden tener efectos importantes en los ingresos de las personas (+ 27% por hora).
A su vez, terminar la primaria también resulta redituable al ofrecer un ingreso laboral esperado de $14.27 pesos por hora, lo que significa una diferencia de 40% respecto de quienes tienen primaria incompleta y de 78% por encima de lo que reciben quienes no tienen ninguna instrucción.
Los datos de la ENIGH 2000 reflejan, además, que quienes iniciaron la secundaria pero no la terminaron, reciben en promedio $ 13.51 pesos por hora, lo que si se toma tal cual (es decir,
89

suponiendemasiaddos años inconclusestudios
Seconómicun promrespecto
Atruncos dcircunstaventaja d Veamos el
PER
TOTA
FUENTE
ndo que el edo grande) su
adicionalessa implica ude secundar
in embargocamente red
medio de $17de quienes s
A diferencia de preparatoancia percibede 13.4% con
cuadro No. 1
RCEPTORE
AL = 26.3
E: INEGI, EN
INSTITU
error promedugiere que u en el siguie
un ingreso 5%ia.
o, las cifrasdituable ya qu7.27 pesos psólo tienen p
de lo que oria resulta een ingresos n respecto de
ES OCUPAD
NIGH
UTO NACIO
dio de la estuna vez que sente nivel si % inferior al
indican quue quienes tepor hora, loprimaria com
ocurre en eeconómicamlaborales de
e quienes só
1.
1.
1.
1
DOS CON ID
ONAL DE EINFORM
timación pase terminó laéste no se t
l que se tend
ue la perseverminan la s que signifi
mpleta.
el caso de lmente reditua
e $19.58 pelo tienen sec
3.
2.
1.
3.
INGRESO LDE
ESTADÌSTIMATICA
ara este segma primaria noermina. De
dría sólo con
verancia sesecundaria reica una dife
la educaciónable, debidoesos por horcundaria term
5.
LABORAL
ICA, GEOG
mento de la o es redituabesta manera
n la primaria
presenta ceciben a camerencia posit
n secundario a que quiera, lo que seminada.
6.
L SEGÚN NI
GRAFÌA E
población nble estudiar ua tener secun
incompleta
como una vmbio de su trtiva de 21%
a, tener estuenes están ee traduce en
IVEL
no es uno o
ndaria y sin
virtud rabajo % con
udios n esa n una
90
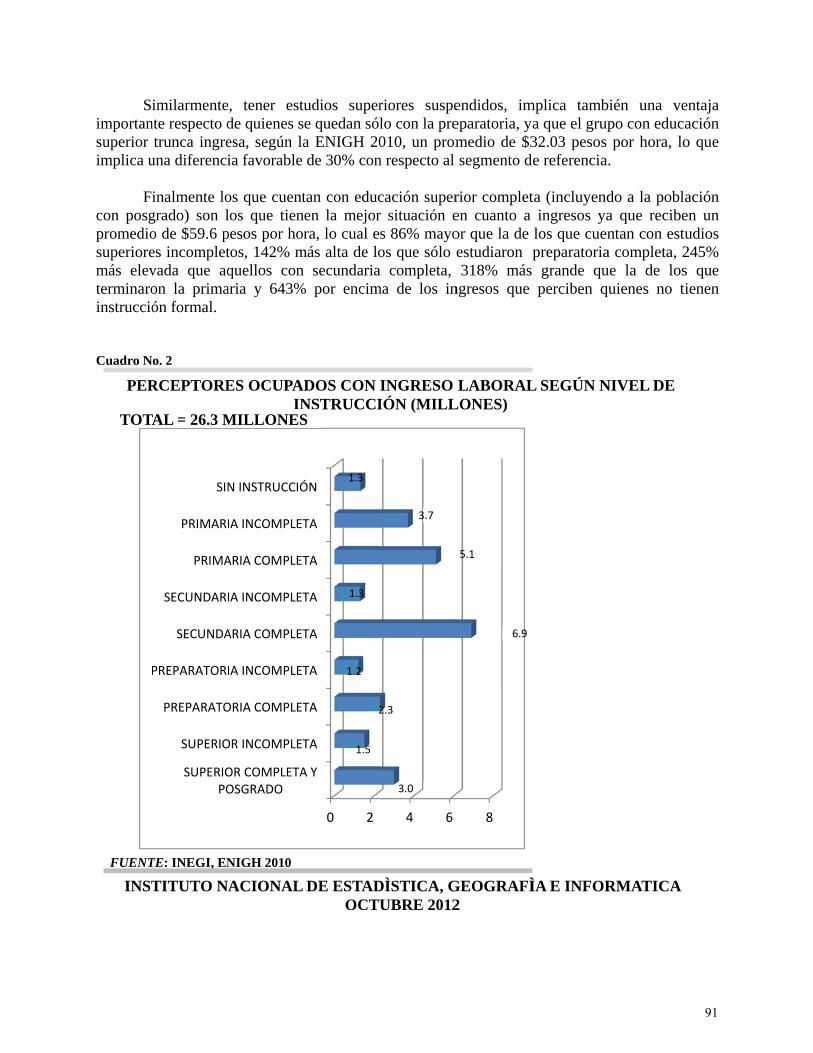
Simportansuperior implica u
Fcon posgpromediosuperioremás elevterminaroinstrucció Cuadro N
P
PER
TOTA
FUENT
INST
imilarmentente respecto d
trunca ingreuna diferenci
inalmente logrado) son lo de $59.6 pes incompletvada que aqon la primaón formal.
o. 2
SUPERIOPO
SUPERIO
PREPARATO
PREPARATORI
SECUNDA
SECUNDARI
PRIMA
PRIMARI
SIN
RCEPTORE
TAL = 26.3 M
TE: INEGI, EN
TITUTO N
e, tener estude quienes sesa, según laia favorable
os que cuentlos que tienpesos por hortos, 142% mquellos con aria y 643%
OR COMPLETAOSGRADO
OR INCOMPLET
ORIA COMPLET
IA INCOMPLET
ARIA COMPLET
IA INCOMPLET
ARIA COMPLET
IA INCOMPLET
N INSTRUCCIÓ
ES OCUPADIN
MILLONES
NIGH 2010
ACIONAL
udios supere quedan sóla ENIGH 20de 30% con
tan con educen la mejorra, lo cual e
más alta de losecundaria
% por encim
0 2
A Y
TA
TA
TA
TA
TA
TA
TA
ÓN1.3
1.3
1.2
2
1.5
DOS CON INSTRUCCIS
DE ESTADOCTU
riores suspelo con la pre010, un prom
n respecto al
cación superr situación es 86% mayoos que sólo e
a completa, ma de los in
4 6
3.7
2.3
3.0
INGRESO IÓN (MILL
DÌSTICA, GUBRE 2012
endidos, imeparatoria, ymedio de $3segmento d
rior completen cuanto a or que la de estudiaron p318% más
ngresos que
8
5.1
6.9
LABORALLONES)
GEOGRAFÌ2
mplica tamba que el grup32.03 pesos
de referencia
ta (incluyendingresos yalos que cuenpreparatoria grande quperciben qu
L SEGÚN N
ÌA E INFOR
ién una vepo con educpor hora, lo
.
do a la pobla que recibentan con est
a completa, 2ue la de losuienes no t
NIVEL DE
RMATICA
entaja ación o que
ación en un tudios 245% s que tienen
91

En síntesis, la información estadística de la ENIGH 2010, representativa a nivel nacional, refleja que, efectivamente, en la mayoría de los casos la educación adicional implica ingreso adicional. Además podemos observar que al progresar en los niveles de escolaridad el ingreso aumenta en proporciones diferentes según el nivel de que se trate y, finalmente, muestra que en general terminar una carrera representa muy alta probabilidad de obtener ingresos claramente superiores de los del caso contrario.
La importancia de estos datos se hace mucho más evidente cuando reconocemos que sólo el 11% de los perceptores ocupados con remuneraciones al trabajo, cuenta con estudios terminados de educación superior.
Bajo esta perspectiva, recordamos que nuestros padres nos decían: “tienes que estudiar más, si quieres ganar más”, y de conformidad a las cifras del INEGI, esta consejo – advertencia sigue teniendo validez en nuestros días, aplicable a nuestros hijos y a futuras generaciones. Al parecer, estudiar y sobre todo terminar una carrera profesional nos lleva a considerar que si hay un retorno sobre la inversión para el graduado.
INVERTIR EN EDUCACIÓN INICIAL, ES HACERLO EN ENA NUEVA CIUDADANÍA: UNICEF Invertir en educación inicial es "invertir en la construcción de la ciudadanía", pues de esta forma se estimula el desarrollo físico, social y cognitivo, que comienza a formarse en los primeros meses de vida en los niños, según el Fondo de Naciones Unidas para la Infancia (Unicef).
Por su parte, la Organización de Naciones Unidas para la Educación, la Ciencia y la Cultura (UNESCO) asegura que el aprendizaje en la primera infancia facilita el "ulterior aprovechamiento escolar", además de favorecer la permanencia en la escuela.
No obstante, asegura que en los países en desarrollo este tipo de educación es aún focalizada, aunque ha habido avances en la matrícula de educación preprimaria, que en la región ha crecido más de 60 por ciento en el último decenio.
Para contribuir a ampliar la cobertura a escala global y elaborar un documento técnico que sirva de guía a las naciones para establecer estrategias educativas, tanto en educación inicial como en prescolar, se llevó a cabo en Morelia, Michoacán, el quinto Congreso Mundial de Educación Infantil, organizado por la Asociación Mundial de Educadores Infantiles (AMEI), en coordinación con la Unesco, la Secretaría de Educación de Michoacán y la Universidad Pedagógica Nacional, en donde quedo en manifiesto la importancia de esta postulación.
Por lo anterior, podemos establecer que la inversión en educación, busca formar también una ciudadanía que no solo se preocupe de la creación y aseguramiento de sus fuentes de trabajo, sino que establezcan acciones concretas en materia de Responsabilidad Social Empresaria para de esta manera, contribuir al desarrollo sustentable de su región, y en final instancia, ese desarrollo sostenible del modelo económico en el cual se han integrado.
92

En pocas palabras: se invierte en educación, para formar ciudadanos con valores y para desarrollar la economía sostenible
EL IMPACTO DE LA EDUCACIÓN SOBRE EL EMPLEO La combinación entre las características del sistema educativo y las características del mercado de empleo hace difícil llegar a establecer la relación directa entre la inversión en educación y el desarrollo económico, pues se considera que el primero acceso de los egresados de educación superior es precisamente al mercado laboral, en donde comienza su verdadera aplicación de conocimiento adquiridos en las aulas y esperan que los frutos se conviertan en formulas transformadoras en el mejoramiento de una modelo económico, que a la larga sea tierra fértil para la creación de empleos bien remunerados y que permitan el innovación y modernidad.
Ahora, sobre el desempleo. En el siguiente cuadro 3, Francia aparece en una situación
mucho más favorable que Inglaterra y los Estados Unidos como un país que tiene menos jóvenes “en la calle”. Se puede decir que Francia tiene una política muy activa para aumentar las competencias de los jóvenes, reducir la deserción y limitar los problemas sociales de los jóvenes desocupados mediante sus programas universitarios. Es decir, justifican una política educativa por sus externalidades, tales como la reducción de los fenómenos de violencia o de droga. También se puede interpretar como un país que por falta de tener un mercado de trabajo suficientemente abierto y flexible que facilite la entrada de los jóvenes, debe invertir muchos recursos públicos para mantenerlos en el sistema educativo y limitar el desempleo de los mismos.
Cuadro 3 Jóvenes de 15 a 19 Años que no están en Formación y no tienen Empleo como % de la Población (2006)
Francia 3
Alemania 4
Austria 7
Estados Unidos 8
Australia 9
Inglaterra 12
España 14
Fuente: OCDE Examen Thematique sur la transition de la formation initiale a la vie active; Nov. 2008
93

La transición de los jóvenes egresados al mercado de empleo se debe también observar en el contexto más largo de la capacidad de formación a lo largo de la vida y la equidad. Así, por ejemplo los Estados Unidos tiene un desempleo de jóvenes muy bajo, inclusive para los jóvenes que salen del sistema de educación temprano con un bajo nivel de calificación. Esto es el resultado de un mercado de empleo muy abierto y flexible. Por lo tanto, los estudios demuestran que son una minoría los jóvenes que a lo largo de su carrera profesional tendrán la posibilidad de capacitarse y modificar sustancialmente su situación de ingreso. Los Estados Unidos se caracterizan por tener la más alta proporción de jóvenes con trabajos de bajo salario y la más larga duración en esta situación.
CONCLUSIÓN La observación de estas diferencias en los países de la OCDE puede dar la impresión de que es difícil obtener recomendaciones que sean útiles para países que buscan el desarrollo de la educación y de su modelo económico. Pero no es así, las experiencias de los países de la OCDE muestran que cada país trata de salir de su modelo económico tradicional, tomando de otros las fórmulas exitosas para llegar a una oferta educativa mucho más diversificada que pueda integrarse exitosamente con sus “clúster’s ” estratégicos de desarrollo económico. Para mejorar la empleabilidad de los jóvenes egresados de la educación superior y facilitar la transición al empleo, las políticas en marcha en los países de la OCDE tienen los siguientes puntos de convergencia: Elevar el nivel de formación inicial de todos los jóvenes para darles posibilidades de
educación continua. Definir de manera clara la oferta de capacitación diversificada y consistente, incluyendo la
posibilidad de transición a nivel superior que les permita elegir y progresar. Multiplicar las relaciones con los profesionales para abrir grandes posibilidades de formación
en alternancia, de aprendizaje y de aplicación de conocimientos. Mediante programas de vinculación efectiva, fomentar mercados de trabajo más accesibles a
los egresados. Organizar un currículum integrando la educación general y la formación profesional de
manera que se permita la movilidad entre carreras. Implementar programas específicos de capacitación para jóvenes en riesgo de ser excluidos. Contar con sistemas de orientación para jóvenes y sistemas de información sobre el empleo. Desarrollar instrumentos de monitoreo e indicadores que destaquen la relación entre
educación y empleo y permitan a múltiples actores interactuar para orientar los sistemas. Aun y cuando la educación es mucho más que su dimensión económica. Es la razón por
la cual la relación educación / impacto económico es compleja. Siempre hay estudiantes que eligen un camino de vida diferente para el cual fueron formados. Pero la clave esta en la atención que el gobierno dedique a la inversión en educación superior, como el factor crítico para su desarrollo económico, ya podemos estar seguros que un egresado con una formación en investigación, manejo de laboratorios y plenamente convencido de aplicar las mejores prácticas de negocios, seguramente tendrá mucho que aportar para el crecimiento y modernización de su modelo económico, capaz de transformar la referencia tradicional de ser simplemente un
94

seguidor de modelos económicos, a un verdadero innovador en tecnología y transferencia de la misma, contribuyendo directamente al fortalecimiento económico de nuestro país.
95
BIBLIOGRAFÍA
Aragón Núñez E. ¿Qué sucede entre la escuela y la familia? Aproximación a una caracterización de la relación de las instituciones educacionales y la familia.: EN CD Didáctica. ISP Enrique José Varona. 2011
Document de Synthese, Preparer les Jeunes au 21eme Siecle: Les Leçons a Tirer des Deux dernieres Decennies, Conference organisée para l’OCDE, le Department of Labor et le Department of Education des Etats-Unis, Washington, DC, 23-24 février 2009.
Examen Thematique sur la Transition de la Formation Initiale a la Vie Active, Rapport Comparatif a l’Issue de la Premiere Phase, OECD, Oct. 30, 2008.
INEGI, ENIGH 2000 Instituto Nacional de Estatística, Geografia e Informática Octubre, 2012. López, Thomas y Wang. 2009. Addressing the Education Puzzle: The distribution of education
and economic reforms, World Bank draft paper. Pathways and Participation in Vocational and Technical Education and Training, OECD 2010.
96
Impacto de las NIF´s en su Aplicación por los Contadores Públicos en el Edo. De Tlaxcala, México
M.A.T. SOFÍA MITRE CAMACHO1
Universidad Autónoma de Tlaxcala
DRA. GLORIA RAMÍREZ ELÍAS Universidad Autónoma de Tlaxcala
MTRO. DOROTEO NAVA
Universidad Autónoma de Tlaxcala
DR. HECTOR ROSAS LEZAMA Universidad Autónoma de Tlaxcala
M.B.A SILVIA PATRICIA MUÑOZ CASTELLANOS
Universidad Autónoma de Tamaulipas Campus Nuevo Laredo Este ponencia es derivada de una investigación sobre las NIF´s, tiene como objetivo la utilización de las NIF´s en los Estados Financieros aplicada por los Contadores Públicos, que Estados Financieros básicos estructuran más para proporcionar informes financieros, se utilizó una metodología mixta, trasversal y de campo. Realizándose una encuesta, valorada, con una base de datos extraídos de los agremiados al Colegio de Contadores Públicos del Estado de Tlaxcala. Demostrando la hipótesis de investigación, al conocer los resultados de encuesta.
1 Address correspondence to M.A.T. Sofía Mitre Camacho, Tlaxcala de Xicoténcatl, Tlaxcala, México E-mail: [email protected]
97

INTRODUCCIÓN En la investigación se realizó un estudio sobre las NIF´s, donde se encontraron investigaciones documentales, antecedentes de las normas contables, la indagación el conocimiento y el surgimiento de las Normas de Información Financiera NIF´s, las organizaciones nacionales e internacionales que tienen como función su auscultación, investigación, homologación, para la presentación de informes financieros, con características que requieren los usuarios de la información.
Se reconoce la labor del organismo CINIF, para la función que ha desarrollado en busca del sustento normativo para la creación de información financiera, sin embargo, se realizan propuestas correlacionadas con el objetivo que persigue, mismos que tienen las Instituciones de Educación Superior “IES”, en la búsqueda, indagación, investigación y propuestas de investigadores que se desarrollan en estas.
PLANTEAMIENTO DEL PROBLEMA
La aplicación de Las Normas de Información Financiera en los Estados Financieros NIF´s, por los diseñadores, profesionistas, especialistas en la conformación de la Información Financiera, es el tema de esta Investigación, que tiene como pregunta, ¿Los Profesionistas Contadores Públicos aplican las NIF´s, en su Información Financiera, de manera actualizada? Dentro de la historia de la Contabilidad, han existido una serie de normatividad que a lo largo de trascendencia ha ido cambiando de acuerdo a las necesidades de los usuarios de la información, hoy, por hoy, existen diversos factores (Tic´s, globalización, entornos educativos, etc.) los cuales han sido preponderantes en la transformación y establecimiento de una normatividad las NIF´s, que coadyuve a diversos usuarios de esta. México no es la excepción, los cambios es de manera globalizada, las estadísticas, parámetros, índices, certificaciones, etc. Van entorno a las interdisciplinarias y transdisciplinarias de los profesionistas “Contadores Públicos”, día a día el Contador Público realiza una función pública reflejada en la Información Financiera que emite, ya no existe información secreta, privada, hoy, los comparativos, entre un periodo a otro, son obligatorios, remitir cada vez más a las NIF´s , es imperioso, observar un Estado Financiero, de inmediato el Contador Público actualizado, se dará cuenta si él que lo realizó esta actualizado, o no, si es confiable la información. Las NIF´s, desde 2006, han ido cambiando de acuerdo a la auscultación que se tiene para ello de acuerdo al organismo encargado CINIF, esto hace que el profesionista de hoy, esté al tanto de los cambios surgidos en las normas.
El Contador Público es un profesionista encargado de emitir información contable, financiera, fiscal, y demás información entorno a las operaciones de una entidad, por un periodo contable, pero deberá estar informado de como presentarla, de acuerdo a las NIF´s, existen normas de valuación, presentación, revelación, en los Estados Financieros Básicos.
La problemática de la investigación se centra en que el organismo CINIF, cumple con su
objetivo de emanar normatividad para la realización de información financiera, la cual es importante que a través de esta etapa que surgió a la luz (2006) a la fecha, en forma constante, se
98
relaciona que se cumpla con su aplicabilidad por parte de los Contadores Públicos, la congruencia de la normatividad vigente.
Existen diversos organismos e instituciones que agrupan, regulan, norman al profesionista
“Contador Público”, desde su instrucción universitaria, pertinente para proporcionarle al estudiante que pronto será un profesionista, información veraz, actualizada, confiable, para su desenvolvimiento como profesionista, que son las universidades, llamadas Institutos de Educación Superior, “IES”, las IES, ya sean privadas o públicas deberán estar en la vanguardia de lo que requiere un profesionistas para ejercer con una preparación digna que haga honor de la Institución que lo preparo,.
Agrupaciones de profesionistas, interesadas porque sus socios, miembros, estén
preparados para ejercer la profesión de Contador Público.
JUSTIFICACIÓN
El hombre siempre ha estado impelido de precisar como suceden los fenómenos y hechos que tienen una relación directa con sus intereses económicos y en qué cuantía lo afectan o benefician. En este sentido, desde la creación de la partida doble por el Fray Lucas Pacioli. La contabilidad ha ido evolucionando y perfeccionándose cada vez más ante el hecho contable para un buen funcionamiento de la economía en general. El conocimiento identificación y la interpretación de la contabilidad obligan a admitir que no existe un esquema de contabilidad único ni ajeno a la teoría económica.
Esta argumentación pone frente a los investigadores de las ciencias económicas y en
particular las contables de que es necesario evaluar el contexto actual mediante un análisis e interpretación crítica de la realidad que expone el sistema económico que tal como lo expresa el doctor Quan Kiu (2004) “El sistema económico es el conjunto de unidades y procesos que permiten explicar de forma sencilla las interrelaciones complejas y el funcionamiento de los sistemas de producción” Con las globalización y el desarrollo tecnológico se ha incrementado de manera radical el nivel de incertidumbre asociado a la dinámica del entorno donde opera la empresa, o sea, cada día se acrecienta la velocidad en la modificación de las expectativas y demandas de los clientes, surgen nuevas organizaciones, desaparecen muchas empresas de las que comenzaron a operar en un sector, se establecen alianzas estratégicas y se complejizan las relaciones inter empresariales, influidas por el altísimo nivel de competencia lo que propicia el surgimientos de nuevas formas de gestión contable y administrativas con sus características propias de acuerdo a sus necesidades. Ello provoca que la gestión contable con todo sus mecanismos de registro de los hechos económicos, clasificación, ordenamiento y control, amparados en tecnologías informáticas asociadas a la búsqueda efectiva de la calidad y como inductoras del proceso de toma de decisiones se desplace incluso más allá del límite teórico del mismo (la incertidumbre) y se coloque en el campo de la excelencia del proceso directivo.
99

En la medida en que los países y las empresas se desarrollan pues también van desarrollándose nuevas necesidades. No son las mismas necesidades las de una comunidad rural que las de una comunidad en el centro de la una urbe capitalina; todo adquiere una nueva dimensión y exigencia en cada contexto. De igual forma una empresa cuando se desarrolla requiere de más y mejores bienes ya sean insumos, tecnología, conocimiento de parte del personal que labora, financiamiento para nuevas inversiones, transporte, etc. Todo esto tiene una connotación social que se concreta a través del incremento en la creación y distribución de bienes y servicios que satisfacen las necesidades sociales en lo material y en lo espiritual.
Los Contadores Públicos, profesionistas reconocidos para realizar, estructurar, diseñar
información financiera, deben estar actualizados en los cambios que surgen referentes al ejercicio de su profesión, para cumplir con ética profesional, y arrojar información con las características deseables como: clara, veraz, oportuna, relevante que ayuden a minimizar el grado de incertidumbre o error en la toma de decisiones.
Los usuarios de la información se clasifican en internos y externos, entre los internos se encuentran en orden de preponderancia o de interés de la entidad económica, los que aportaron el capital, o el patrimonio, los socios, acciones, o propietario, de ahí seguirían los empleados, por percibir una participación de utilidades, de la entidad donde laboran, etc. Los externos se clasifican en orden de interés; es el gobierno para el pago de los tributos, las instituciones crediticias, para préstamos bancarios y financiamientos diversos, etc.
Los usuarios de la información de las entidades económicas, buscaran diversos fines de
acuerdo al interés, de estos, pero al criterio capitalista, el primero en conocer dicha información es el propietario, el cual deberá tomar decisiones a corto, mediano o largo plazo, realizar comparativos, disminuir, aumentar ingresos, gastos, etc. En segundo término, de acuerdo al uso de la información es el gobierno para el pago de tributos, la información financiera se realizara con base a normas de Información Financiera NIF, para dar certeza, confiabilidad, relevancia a las características deseables de esta, si el gobierno requiere de otro tipo de información se derivara de esta, al igual para otras instituciones que requieran otro tipo de información lo que guardara el sistema contable, la consistencia, deseable de la entidad económica, si el gobierno decide cambiar de información dicha contabilidad no se alterara, y proporcionara la requerida en cualquier cambio.
PREGUNTA DE INVESTIGACIÓN
¿Los Contadores Públicos utilizan las NIF en los Estados Financieros en las PYMES, con las características deseables como: clara, veraz, oportuna, relevante que ayuden a minimizar el grado de incertidumbre o error en la toma de decisiones?
100
OBJETIVOS
Objetivo General Determinar el grado de utilización de las NIF en los Estados Financieros en las PYMES, por los Contadores Públicos en el estado de Tlaxcala.
OBJETIVOS ESPECÍFICOS 1.- Identificar la aplicación de las Normas de Información Financiera NIF´s en los Estados Financieros en las PYMES, de acuerdo al grado de impacto en su utilización. 2.- Analizar que Estados Financieros elaboran en las PYMES, para la toma de decisiones. 3.- Evaluar las razones de elaborar los Estados Financieros para las PYMES
APORTES
Aporte Teórico La fenomenología epistemológica de la contabilidad es sin duda, una necesidad para el hombre mismo que a través del tiempo han existido aportaciones para la realización de la Información Financiera, lo cual se ha acoplado al tiempo, a los sistemas, a los ámbitos, pero sin duda hoy por hoy, conlleva a la homologación, a la comparación, a las certificaciones, a las actualizaciones del profesionista contable, donde las Normas de Información Financiera, NIF´s, son obligatorias para la aplicación de estas en la Información Financiera, de tal manera debe existir congruencia entre la normatividad vigente a la aplicación de estas en los Estados Financieros. Aporte Práctico Las NIF´s, no deben quedar en letra muerta, en libros, como investigador, debe aplicarse y acoplarse a cada entidad económica, las Nif´S, son flexibles, de acuerdo a la CINIF, instituto que ausculta, difunde, las normas, dando pauta a cambios según se requieran, esto a través de Organismos, Instituciones que conforman a la CINIF, en esta investigación se encuentra un la aplicación a las NIF´s. Entendiendo de antemano que cada Entidad Económica, tiene sus propias características y necesidades. Ejes Epistemológicos de la Tesis Normas de Información Financiera NIF´s, Estados Financieros, Contador Público y aspectos legales.
101

HIPÓTESIS DE INVESTIGACIÓN
H1.- Una adecuada aplicación de las NIF´s en la elaboración de los Estados Financieros en las PYMES, por parte de los contadores, se estará en condiciones de tener una Información Financiera de utilidad, confiabilidad, pertinencia para los usuarios de la información financiera y reglas que establece la Secretaria de Hacienda y Crédito Público S.H.C.P. A través del Servicio de Administración Tributaria SAT y la toma de decisiones en los negocios.
VARIABLES DE ESTUDIO (INDEPENDIENTE, DEPENDIENTE) VARIABLES DEPENDIENTES VARIABLE INDEPENDIENTE ESTADOS FINANCIEROS NORMAS DE INFORMACIÓN
FINANCIERAS (NIF) PYMES
DESARROLLO
Instrumento de Valoración Con la finalidad de identificar la aplicación de las Normas de Información Financiera (NIF) en los sistemas contables de las PYMES en el Estado, solicitamos su valiosa colaboración para responder esta encuesta; la información proporcionada será tratada con fines académicos. Instrucciones: Marque con una “X” donde proceda y/o conteste lo que se le solicite. 1.- ¿Cuenta con un programa software de contabilidad por computadora? SI
NO
2.- si contesto si, ¿qué tipo de programa software de la lista utiliza? A COI B PROGRAMA PRIVADO DE LA EMPRESA C SAE D OTRO 3.- ¿Qué tan importante considera que es contar con un programa de contabilidad electrónico? a)MUY IMPORTANTE
b)IMPORTANTE c)IMPARCIAL d)POCO IMPORTANTE
e)SIN IMPORTANCIA
4.- ¿Cuenta con un catálogo de cuentas para el registro de sus operaciones, en todas las empresa(s) que les lleva su contabilidad? 0% 25% 50% 75% 100% 5.- ¿Qué tipo de sistema contable utiliza para el registro de sus inventarios? 1) ANALÍTICO 2) GENERAL 3) INVENTARIOS
PERPETUOS
102

6.- ¿En qué porcentaje diseña y estructura el Estado de Resultados, para las empresas que les lleva su contabilidad? 0% 25% 50% 75% 100% 7.- ¿En qué porcentaje diseña y estructura el Estado de Situación Financiera, para las empresas que les lleva su contabilidad? 0% 25% 50% 75% 100% 8.- ¿En qué porcentaje diseña y estructura el Estado de Flujo de Efectivo, para las empresas que les lleva su contabilidad? 0% 25% 50% 75% 100% 9.- ¿En qué porcentaje diseña y estructura el Estado de Cambios de Capital Contable, para las empresas que les lleva su contabilidad? 0% 25% 50% 75% 100% 10.- ¿Cuáles son las razones por lo que indico el porcentaje que ocupa los estados financieros? a) Por no tener obligaciones fiscales de presentarlos b) Tener obligación fiscal de presentarlos c) Por financiamientos bancarios d) Por dar información a los accionistas, socios, e) Otros (indique) 11.- ¿Tiene usted conocimiento de las NIF (Normas de Información Financiera, 2014) que se aplican en la elaboración del Estado de Financieros? SI NO 12.- ¿Qué grado de impacto ha causado la utilización de las NIF, 2014 en los Estados Financieros para la toma de decisiones? a)MUY IMPORTANTE
b)IMPORTANTE c)IMPARCIAL d)POCO IMPORTANTE
e)SIN IMPORTANCIA
AGRADECEMOS SU COLABORACIÓN
Nombre del Entrevistado (a): Lugar donde labora (especificar nombre):
103
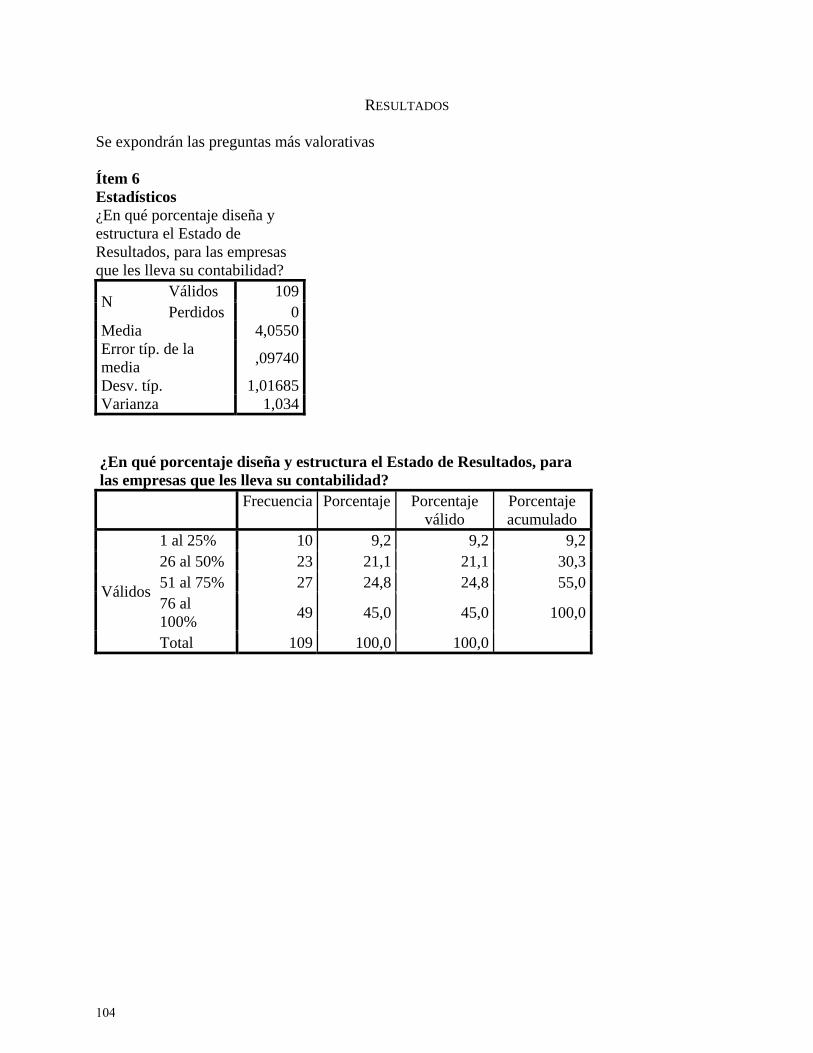
RESULTADOS Se expondrán las preguntas más valorativas Ítem 6 Estadísticos ¿En qué porcentaje diseña y estructura el Estado de Resultados, para las empresas que les lleva su contabilidad?
N Válidos 109 Perdidos 0
Media 4,0550 Error típ. de la media
,09740
Desv. típ. 1,01685 Varianza 1,034
¿En qué porcentaje diseña y estructura el Estado de Resultados, para las empresas que les lleva su contabilidad? Frecuencia Porcentaje Porcentaje
válido Porcentaje acumulado
Válidos
1 al 25% 10 9,2 9,2 9,2 26 al 50% 23 21,1 21,1 30,3 51 al 75% 27 24,8 24,8 55,0 76 al 100%
49 45,0 45,0 100,0
Total 109 100,0 100,0
104
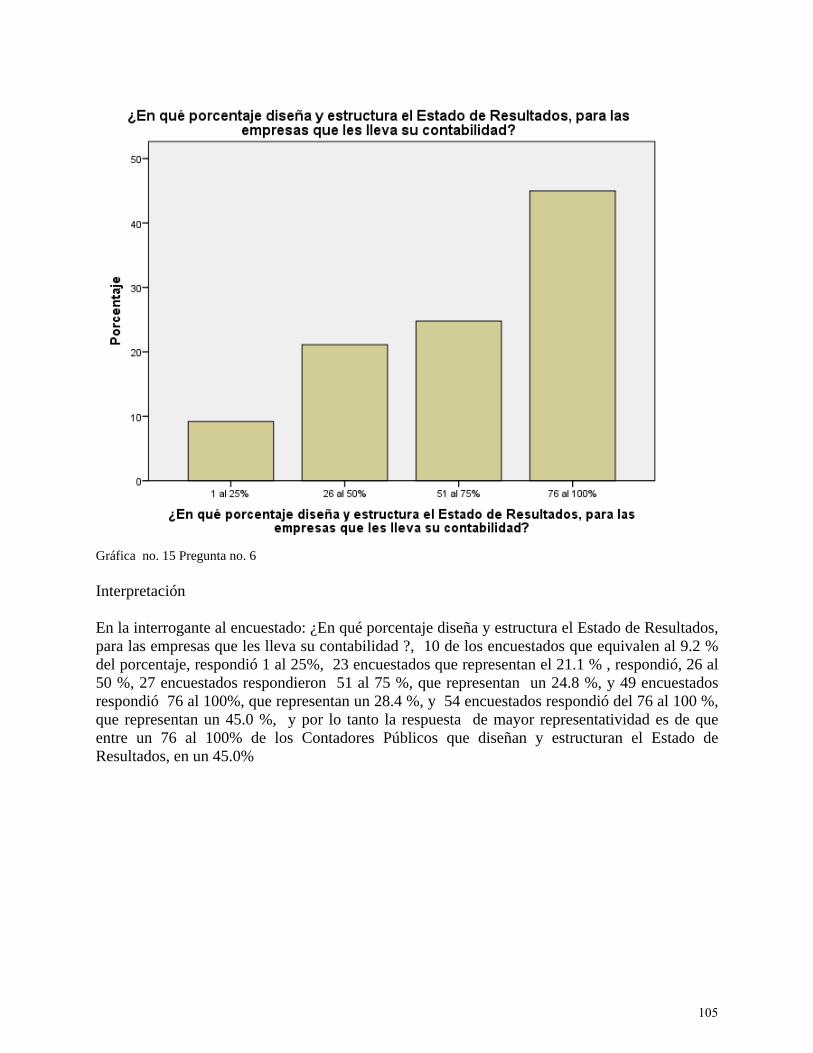
Gráfica no. 15 Pregunta no. 6 Interpretación En la interrogante al encuestado: ¿En qué porcentaje diseña y estructura el Estado de Resultados, para las empresas que les lleva su contabilidad ?, 10 de los encuestados que equivalen al 9.2 % del porcentaje, respondió 1 al 25%, 23 encuestados que representan el 21.1 % , respondió, 26 al 50 %, 27 encuestados respondieron 51 al 75 %, que representan un 24.8 %, y 49 encuestados respondió 76 al 100%, que representan un 28.4 %, y 54 encuestados respondió del 76 al 100 %, que representan un 45.0 %, y por lo tanto la respuesta de mayor representatividad es de que entre un 76 al 100% de los Contadores Públicos que diseñan y estructuran el Estado de Resultados, en un 45.0%
105

Ítem 7 Estadísticos ¿En qué porcentaje diseña y estructura el Estado de Situación Financiera, para las empresas que les lleva su contabilidad?
N Válidos 109 Perdidos 0
Media 3,9725 Error típ. de la media
,10863
Desv. típ. 1,13414 Varianza 1,286
¿En qué porcentaje diseña y estructura el Estado de Situación Financiera, para las empresas que les lleva su contabilidad? Frecuencia Porcentaje Porcentaje
válido Porcentaje acumulado
Válidos
0% 4 3,7 3,7 3,7 1 al 25% 8 7,3 7,3 11,0 26 al 50% 23 21,1 21,1 32,1 51 al 75% 26 23,9 23,9 56,0 76 al 100%
48 44,0 44,0 100,0
Total 109 100,0 100,0
106

Gráfica no. 16 Pregunta no. 7 Interpretación En la interrogante al encuestado: ¿En qué porcentaje diseña y estructura el Estado de Situación Financiera, para las empresas que les lleva su contabilidad?, 4 de los encuestados que equivalen al 3.7% , respondió 0%, 8 de los encuestados que equivalen al 7.3 % del porcentaje, respondió 1 al 25%, 23 encuestados que representan el 21.1 % , 26 encuestados respondieron 26 al 50%, que representan un 23.9 %, y 48 encuestados respondió 76 al 100%, que representan un 44.0%, y por lo tanto la respuesta de mayor representatividad es de que entre un 76 al 100% de los Contadores Públicos que diseñan y estructuran el Estado de Situación Financiera, en un 44.0%
107
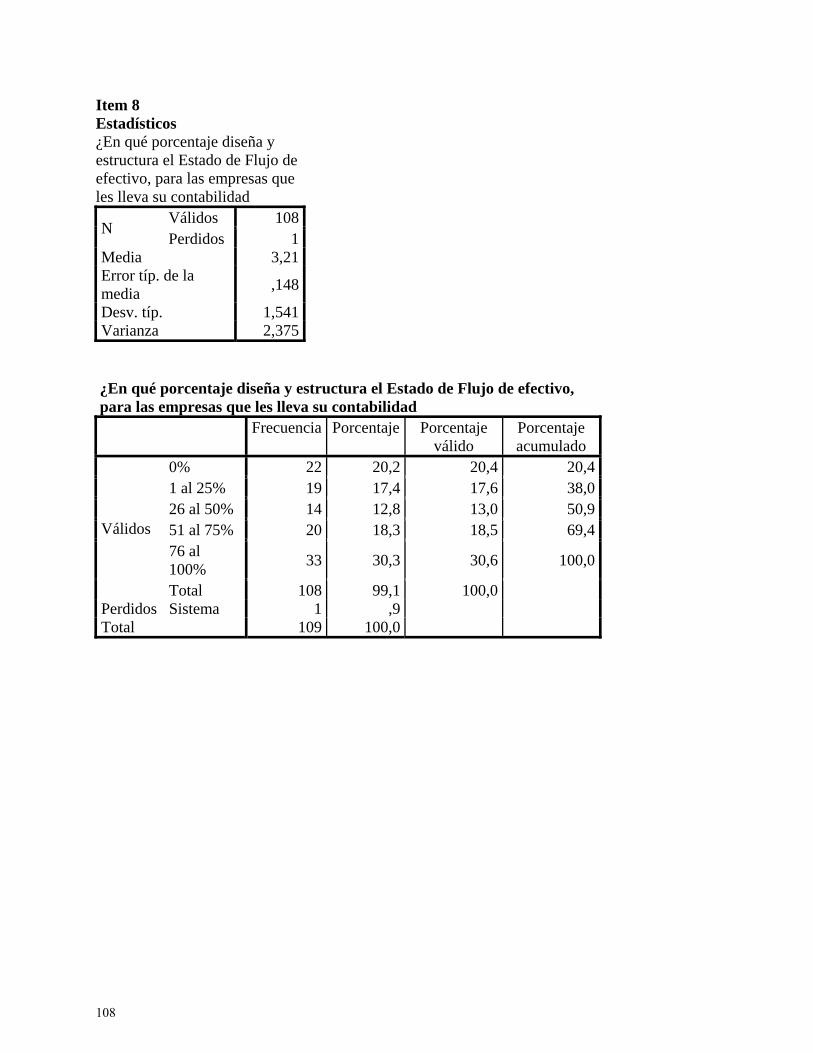
Item 8 Estadísticos ¿En qué porcentaje diseña y estructura el Estado de Flujo de efectivo, para las empresas que les lleva su contabilidad
N Válidos 108 Perdidos 1
Media 3,21 Error típ. de la media
,148
Desv. típ. 1,541 Varianza 2,375
¿En qué porcentaje diseña y estructura el Estado de Flujo de efectivo, para las empresas que les lleva su contabilidad Frecuencia Porcentaje Porcentaje
válido Porcentaje acumulado
Válidos
0% 22 20,2 20,4 20,4 1 al 25% 19 17,4 17,6 38,0 26 al 50% 14 12,8 13,0 50,9 51 al 75% 20 18,3 18,5 69,4 76 al 100%
33 30,3 30,6 100,0
Total 108 99,1 100,0 Perdidos Sistema 1 ,9 Total 109 100,0
108
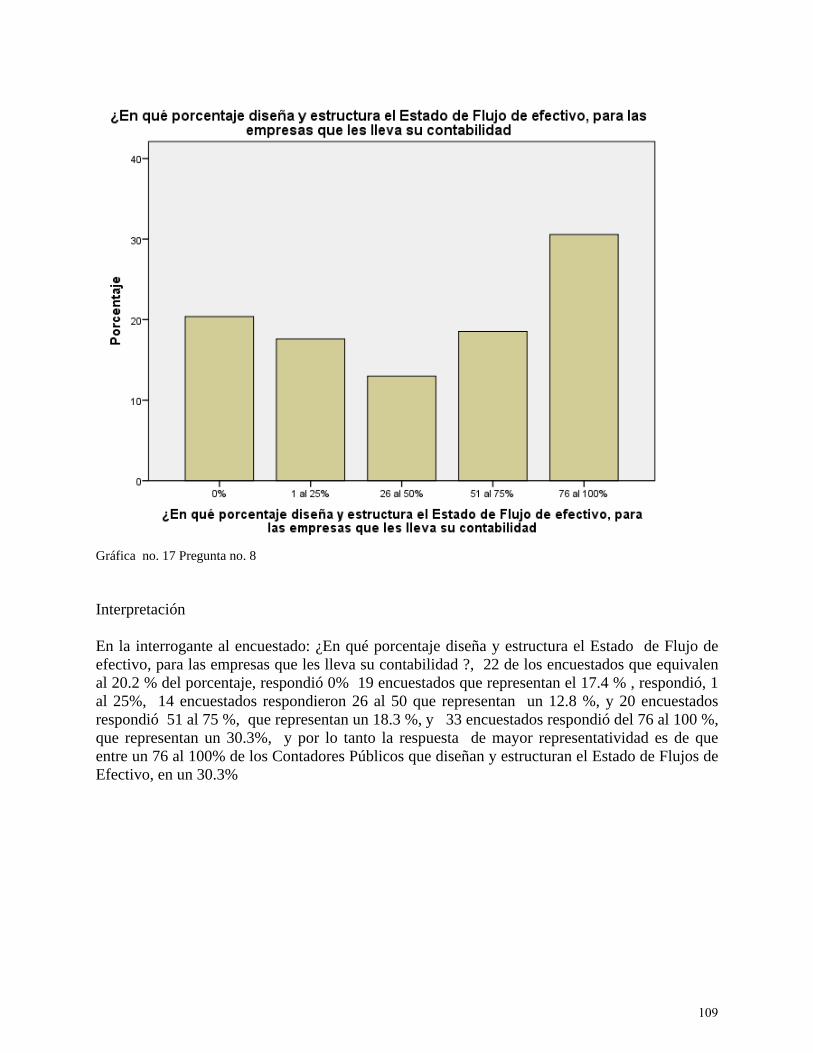
Gráfica no. 17 Pregunta no. 8 Interpretación En la interrogante al encuestado: ¿En qué porcentaje diseña y estructura el Estado de Flujo de efectivo, para las empresas que les lleva su contabilidad ?, 22 de los encuestados que equivalen al 20.2 % del porcentaje, respondió 0% 19 encuestados que representan el 17.4 % , respondió, 1 al 25%, 14 encuestados respondieron 26 al 50 que representan un 12.8 %, y 20 encuestados respondió 51 al 75 %, que representan un 18.3 %, y 33 encuestados respondió del 76 al 100 %, que representan un 30.3%, y por lo tanto la respuesta de mayor representatividad es de que entre un 76 al 100% de los Contadores Públicos que diseñan y estructuran el Estado de Flujos de Efectivo, en un 30.3%
109
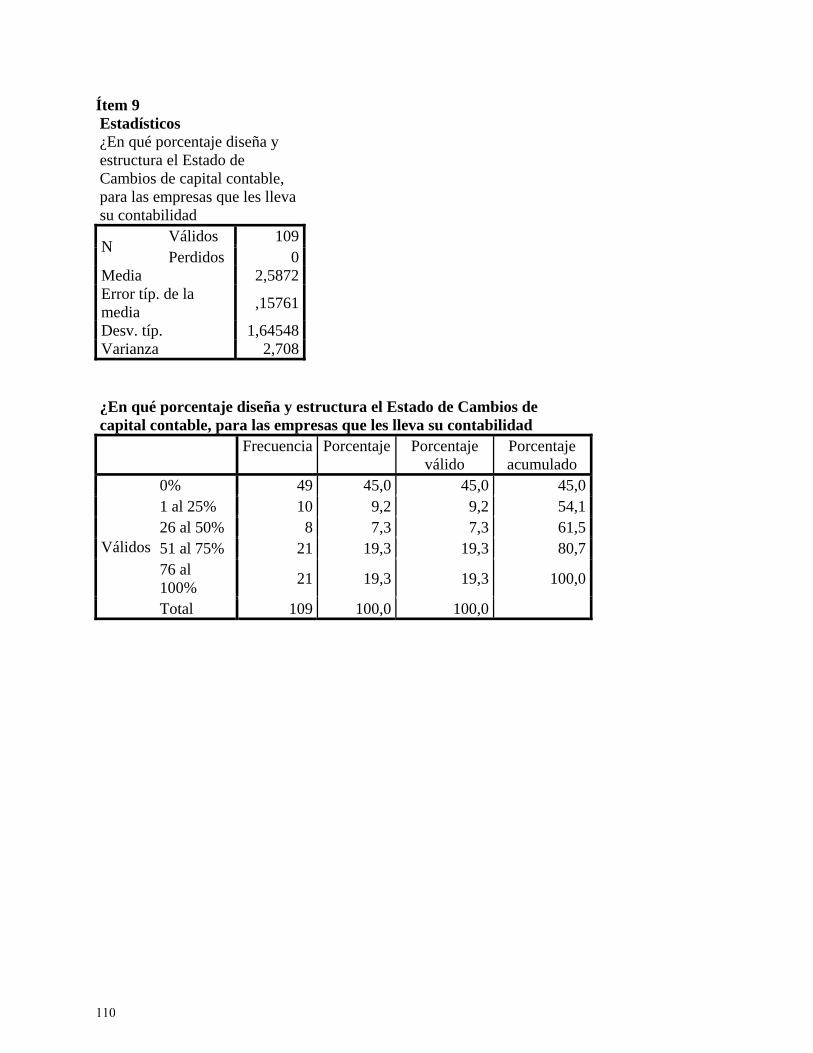
Ítem 9 Estadísticos ¿En qué porcentaje diseña y estructura el Estado de Cambios de capital contable, para las empresas que les lleva su contabilidad
N Válidos 109 Perdidos 0
Media 2,5872 Error típ. de la media
,15761
Desv. típ. 1,64548 Varianza 2,708
¿En qué porcentaje diseña y estructura el Estado de Cambios de capital contable, para las empresas que les lleva su contabilidad Frecuencia Porcentaje Porcentaje
válido Porcentaje acumulado
Válidos
0% 49 45,0 45,0 45,0 1 al 25% 10 9,2 9,2 54,1 26 al 50% 8 7,3 7,3 61,5 51 al 75% 21 19,3 19,3 80,7 76 al 100%
21 19,3 19,3 100,0
Total 109 100,0 100,0
110
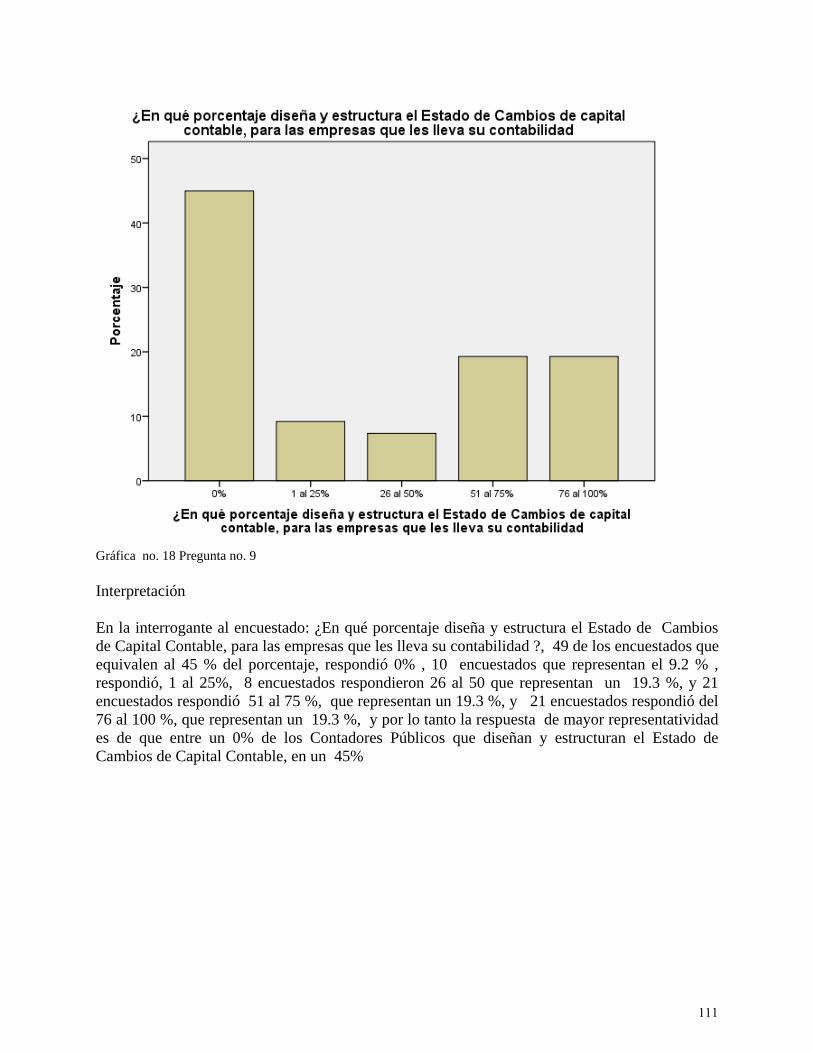
Gráfica no. 18 Pregunta no. 9 Interpretación En la interrogante al encuestado: ¿En qué porcentaje diseña y estructura el Estado de Cambios de Capital Contable, para las empresas que les lleva su contabilidad ?, 49 de los encuestados que equivalen al 45 % del porcentaje, respondió 0% , 10 encuestados que representan el 9.2 % , respondió, 1 al 25%, 8 encuestados respondieron 26 al 50 que representan un 19.3 %, y 21 encuestados respondió 51 al 75 %, que representan un 19.3 %, y 21 encuestados respondió del 76 al 100 %, que representan un 19.3 %, y por lo tanto la respuesta de mayor representatividad es de que entre un 0% de los Contadores Públicos que diseñan y estructuran el Estado de Cambios de Capital Contable, en un 45%
111

Ítem 10 Estadísticos ¿Cuáles son las razones por lo que indico el porcentaje que ocupa los Edos Financieros?
N Válidos 109 Perdidos 0
Media 2,7982 Error típ. de la media
,10328
Desv. típ. 1,07823 Varianza 1,163
¿Cuáles son las razones por lo que indico el porcentaje que ocupa los Edos Financieros? Frecuencia Porcentaje Porcentaje
válido Porcentaje acumulado
Válidos
Por no tener obligaciones fiscales de presentarlos
11 10,1 10,1 10,1
Tener Obligación fiscal de presentarlos
41 37,6 37,6 47,7
Por financiamientos bancarios
18 16,5 16,5 64,2
Por dar información a los accionistas, socios.
37 33,9 33,9 98,2
5,00 2 1,8 1,8 100,0Total 109 100,0 100,0
112
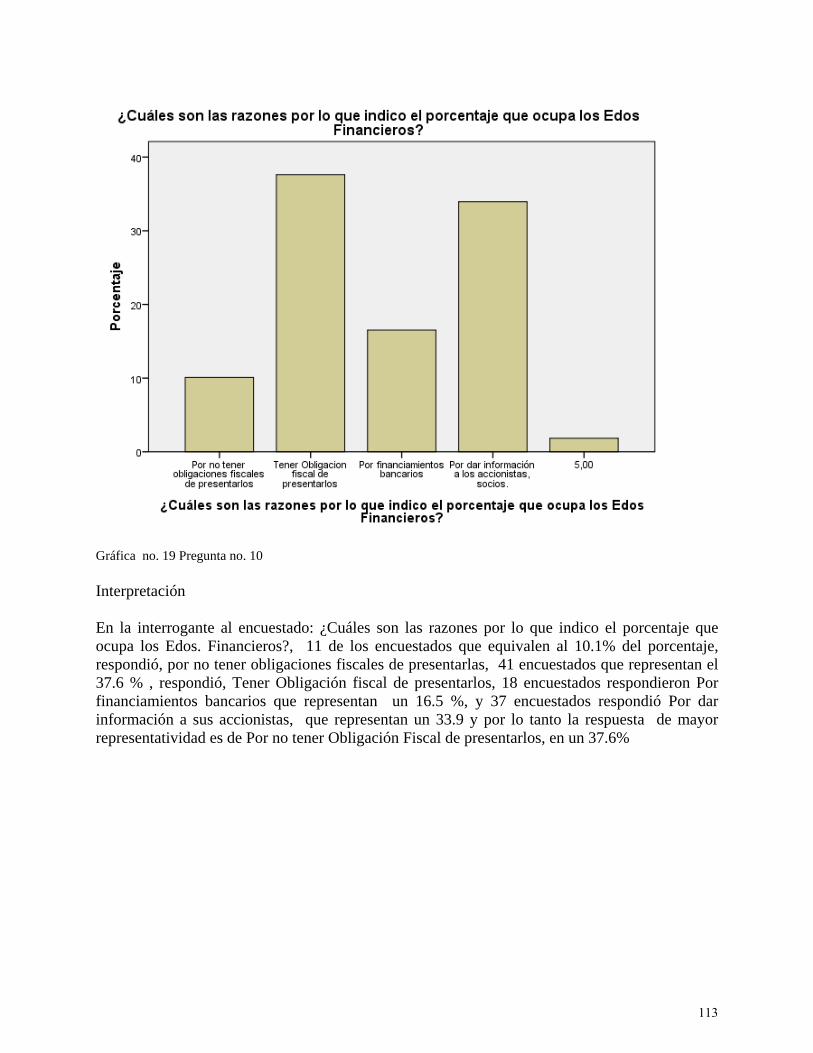
Gráfica no. 19 Pregunta no. 10 Interpretación En la interrogante al encuestado: ¿Cuáles son las razones por lo que indico el porcentaje que ocupa los Edos. Financieros?, 11 de los encuestados que equivalen al 10.1% del porcentaje, respondió, por no tener obligaciones fiscales de presentarlas, 41 encuestados que representan el 37.6 % , respondió, Tener Obligación fiscal de presentarlos, 18 encuestados respondieron Por financiamientos bancarios que representan un 16.5 %, y 37 encuestados respondió Por dar información a sus accionistas, que representan un 33.9 y por lo tanto la respuesta de mayor representatividad es de Por no tener Obligación Fiscal de presentarlos, en un 37.6%
113

Ítem 11 Estadísticos ¿Tiene usted conocimiento de las NIF que se aplican en la elaboración de Estados Financieros?
N Válidos 109 Perdidos 0
Media 1,0917 Error típ. de la media
,02778
Desv. típ. ,29000 Varianza ,084
¿Tiene usted conocimiento de las NIF que se aplican en la elaboración de Estados Financieros? Frecuencia Porcentaje Porcentaje
válido Porcentaje acumulado
Válidos Si 99 90,8 90,8 90,8No 10 9,2 9,2 100,0Total 109 100,0 100,0
114
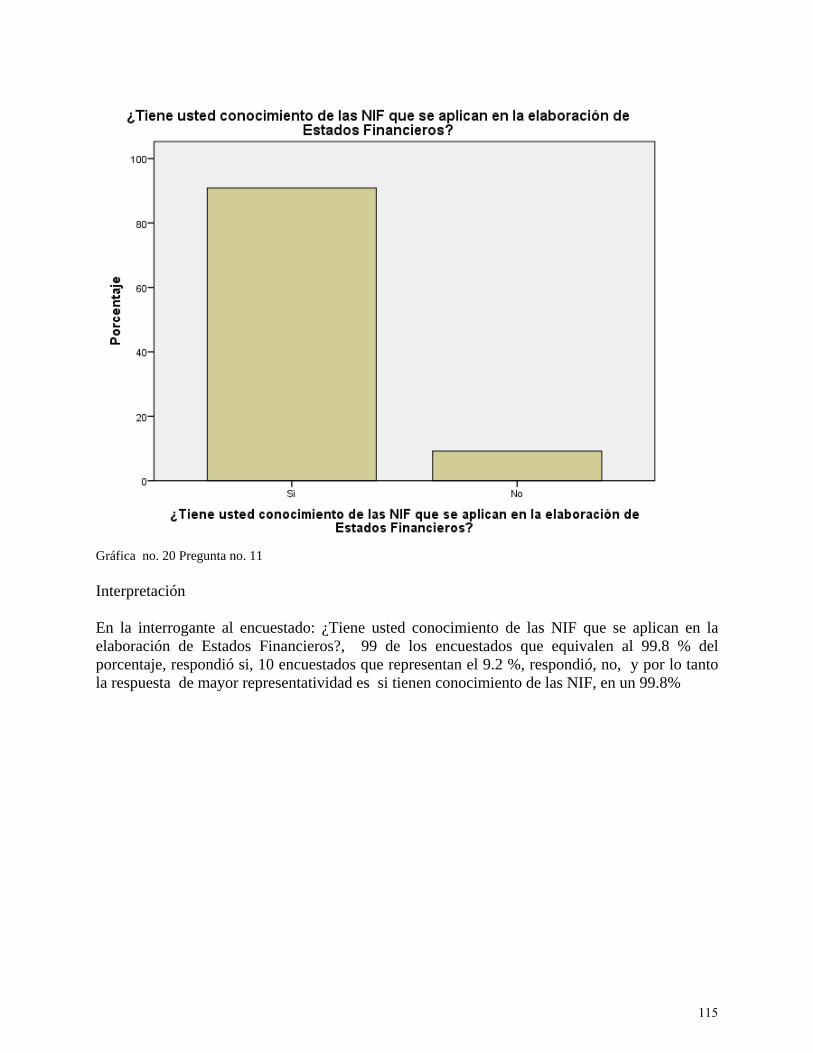
Gráfica no. 20 Pregunta no. 11 Interpretación En la interrogante al encuestado: ¿Tiene usted conocimiento de las NIF que se aplican en la elaboración de Estados Financieros?, 99 de los encuestados que equivalen al 99.8 % del porcentaje, respondió si, 10 encuestados que representan el 9.2 %, respondió, no, y por lo tanto la respuesta de mayor representatividad es si tienen conocimiento de las NIF, en un 99.8%
115
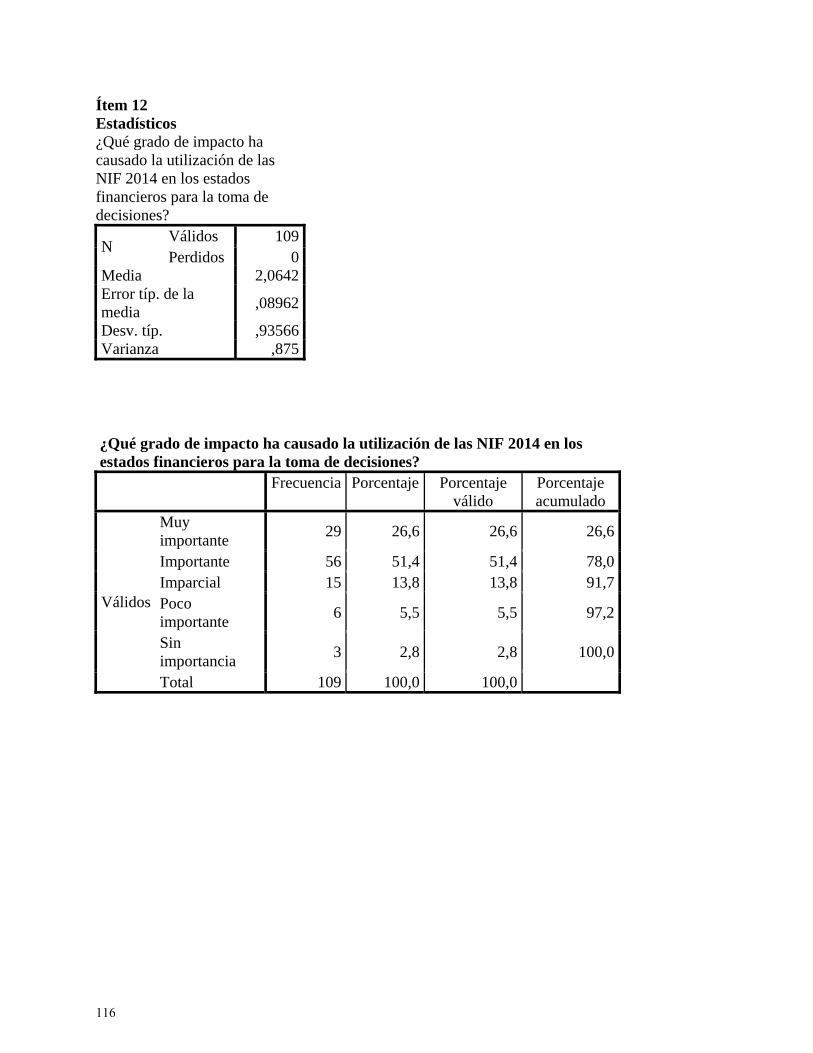
Ítem 12 Estadísticos ¿Qué grado de impacto ha causado la utilización de las NIF 2014 en los estados financieros para la toma de decisiones?
N Válidos 109 Perdidos 0
Media 2,0642 Error típ. de la media
,08962
Desv. típ. ,93566 Varianza ,875
¿Qué grado de impacto ha causado la utilización de las NIF 2014 en los estados financieros para la toma de decisiones? Frecuencia Porcentaje Porcentaje
válido Porcentaje acumulado
Válidos
Muy importante
29 26,6 26,6 26,6
Importante 56 51,4 51,4 78,0 Imparcial 15 13,8 13,8 91,7 Poco importante
6 5,5 5,5 97,2
Sin importancia
3 2,8 2,8 100,0
Total 109 100,0 100,0
116
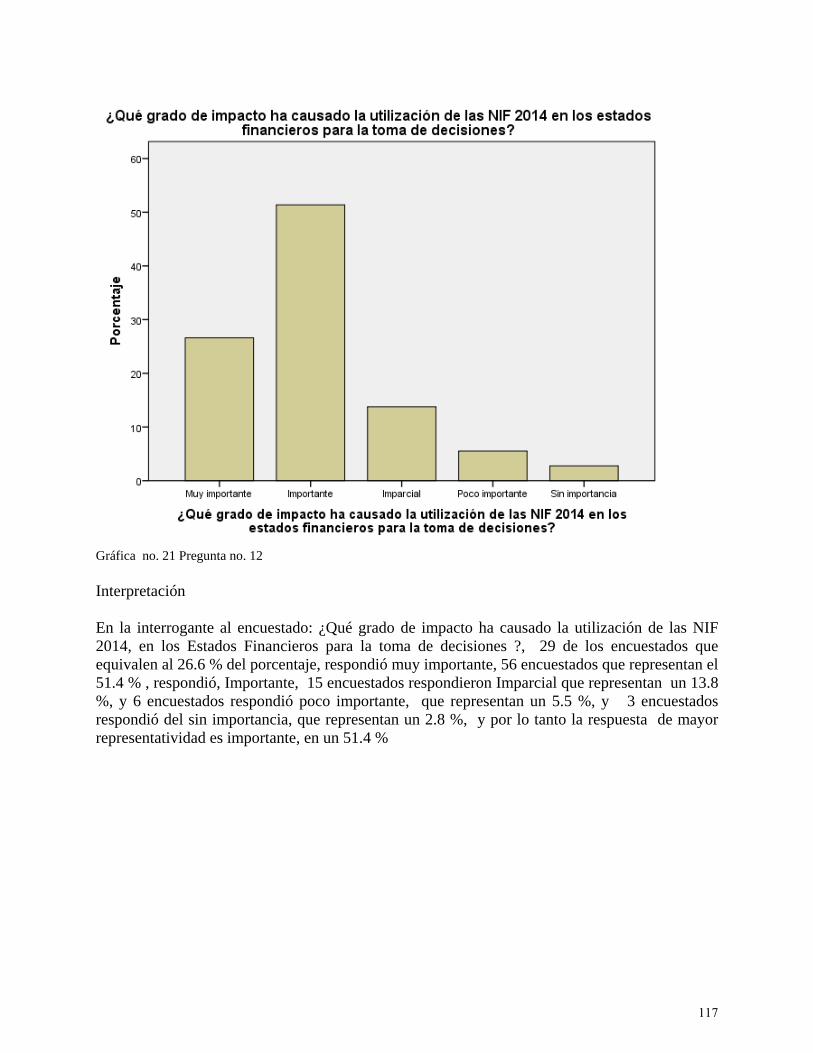
Gráfica no. 21 Pregunta no. 12 Interpretación En la interrogante al encuestado: ¿Qué grado de impacto ha causado la utilización de las NIF 2014, en los Estados Financieros para la toma de decisiones ?, 29 de los encuestados que equivalen al 26.6 % del porcentaje, respondió muy importante, 56 encuestados que representan el 51.4 % , respondió, Importante, 15 encuestados respondieron Imparcial que representan un 13.8 %, y 6 encuestados respondió poco importante, que representan un 5.5 %, y 3 encuestados respondió del sin importancia, que representan un 2.8 %, y por lo tanto la respuesta de mayor representatividad es importante, en un 51.4 %
117
CONCLUSIONES 1. Las Normas de Información Financiera NIF´s, se refiere al conjunto de pronunciamientos normativos, conceptuales y particulares, emitidos por el CINIF, que regulan la información contenida en los Estados Financieros y sus notas, en un lugar y fecha determinados, que son aceptados de manera amplia y generalizada por todos los usuarios de la información financiera. 2. Las NIF´s, deben someterse a un proceso formal de auscultación que permita su aceptación. Para ello, es necesario que este proceso esté abierto a la observación participación activo de los usuarios e involucrados en la información financiera. 3. La pregunta de Investigación: ¿Los Contadores Públicos utilizan las NIF en los Estados Financieros en las PYMES, con las características deseables como: clara, veraz, oportuna, relevante que ayuden a minimizar el grado de incertidumbre o error en la toma de decisiones?, como el objetivo general: Determinar el grado de utilización de las NIF en los Estados Financieros en las PYMES, por los Contadores Públicos en el estado de Tlaxcala. Se dan respuesta con la Pregunta no. 11, Los Contadores Públicos contestaron que si tienen conocimiento de las NIF´s que se aplican en la elaboración de Estados Financieros, en un 90.8%, por lo tanto, emiten información financiera con las características fundamentadas por las CINIF. 4. El primer objetivo específico: Identificar la aplicación de las Normas de Información Financiera NIF´s en los Estados Financieros en las PYMES, de acuerdo al grado de impacto en su utilización. Se tiene como respuesta en la pregunta no. 12, Los Contadores Públicos contestaron que tiene importancia el grado de impacto en la utilización de las NIF 2014. En un 51.4% 5. El segundo objetivo específico: Analizar que Estados Financieros elaboran en las PYMES, para la toma de decisiones. Se tiene como respuesta en las preguntas no.6,7 y 8 quedando en primer lugar el Estado de Resultados, en segundo el Estado de Situación Financiera, en tercer lugar el Estado de Flujo de Efectivo, y el Estado que menos realizan es el Estado de Variación del Capital Contable. 6. Evaluar las razones de elaborar los Estados Financieros para las PYMES. Se tiene como respuesta en la pregunta no. 10, que contestaron que no realizan los Estados Financieros por no tener obligación fiscal de presentarlos, en un 37.6%. 7. se confirma la Hipótesis de Investigación al confirmar que los Contadores Públicos si aplican los Normas de Información Financiera NIF´s, en los Estados Financieros en las PYMES.
118

BIBLIOGRAFÍA
A.C., I. M. d. C. P., 2015. http://wwwIMCP.org.mx. [En línea]. Angel, R., 1999. Un ensayo sobre las posibilidades y los imposibles Crear y recrear, Puebla:
Diplomado en gerencia. Biondi, M., 1999. Evolución Histórica de la contabilidad. s.l.:Macchi. Bonilla Sebá, E., 2006. Fundamentos de Contabilidad. Colombia: Universidad. Burbano, J., 2004. Historia y Doctrina de Contabilidad. s.l.:Universidad del Valle. Caballero, A., 2000. Entre el gran pavor del año 1000 y e gran terror del año. Bogota: Ancora. Cerez Manero, F., 1997. Origen y evolución de la Contabilidad. Mexico: Trillas. Chiquiar, W., 2008. La contabilidad en la prehistoria. Alicante: Cantaras. CINIF Consejo Mexicano de Normas de Información Financiera, 2014. Normas de Informació
Financiera. Mexico: CINIF. Consejo de Acreditación en Ciencias Sociales, C. y. A. e. l. E. S. d. L., 2015.
http://wwwCACSLA.ORG.MX. [En línea]. Consejo Mexicano de Normas de Informacion Financiera, 2014. Normas de información
Financiera NIF. México: CINIF. cumex, 2005. cumex.org.mx. [En línea]
[Último acceso: 23 noviembre 2014]. DICCIONARIO DE LA LENGUA ESPAÑOLA, 2001. DICCIONARIO DE LA LENGUA
ESPAÑOLA. s.l.:ESPASA CALPE. Diccionario, 2013. DICCIONARIO ENCICLOPEDICO ILUSTRADO. Mexico: Grijalbo. Espinoza, G., 2006. Fundamentos de Contabilidad. Mexico: Curso de Economia. Fernandez Pirla, J., 1977. Teoria Económica de la Contabilidad. España: ICE. Formos, M., 2003. Generalidades de Contabilidad. s.l.:Antares. Granados, R. S. P., 2001. Contabilidad Intermedia. Mexico: Thomson Learning. Hernandez Esteve, E., 2002. La historia de la contabilidad. España: s.n. Hernandez Sampieri Roberto, F. C. C. B. L. P., 8va. Edición. Metodología de la Investigación.
En: Metodología de la Investigación. México: Mc. Graw- Hill, p. 850. IMCP, 2008. Normas de información Financiera. México: Instituto Mexicano de contadores
Publicos AC. ISEF, 2014. CODIGO FISCAL DE LA FEDERACIÓN. En: ISEF, ed. FISCO AGENDA.
México: ISEF, p. 118. Jimenez Morriones, M., 2006. Fundamentos de Contabilidad. Mexico: Antigua. Jottac, 2011. Contabilidad en la Edad Media. s.l.:s.n. Justia, M., 2014. http://mexico.justia.com/federales/leyes/ley-del-impuesto-sobre-la-renta/titulo-
ii/capitulo-viii/. [En línea] Available at: http://mexico.justia.com/federales/leyes/ley-del-impuesto-sobre-la-renta/titulo-ii/capitulo-viii/ [Último acceso: 19 01 2015].
119

Kaiser, J. G., 2013. IFRS and US GAAP: similarities and differences. EU: PWC. Larousse, 2013. Diccionario Enciclopedico Larousse. Mexico: Larousse. López Hernández, F., s.f.. Historia de la contabilidad. Bogota: s.n. Lopez, J. A. A., 2005. Contabilidad Intermedia. México: Mc Graw Hill. Marx, E., 1973. Obras Escogidas. Moscu: Progreso. Mate, P., 2008. Contabilidad, información y conrol en un contexto de actividades económicas
diversificadas en a edad Moderna. Puebla: s.n. Mitre Camacho, S. y otros, 2014. Administración y evaluación financiera de proyectos de
Inversión. México: Altres Costa-Amic Editores. Moreno Fernandez, J. A., 1994. Las Finanzas en la Empresa. México: Mc Graw Hill. NIIF, 2010. Material de formación sobre la NIIF. United Kingdom: IASC Foundat. Niño Galeano, K., 2006. Fundamentos de Contabilidad. s.l.:Talleres. Niño, R. A., 1980. Contabilidad Intermedia I. Mexico: Editorial Trillas. Ochoa Setzer Guadalupe A., S. d. A. R., 2012. Administración Financiera. segunda edición ed.
México: Mc. Graw Hill. Perdomo, A. M., 2000. Analisis e Interpretación de estados financieros. México: Thomson
Editores. Pérez Harris, A., 1985. Los Estados Financieros, su Analisis e Interpretación. México: ECASA. Rincon Peña, G., 1984. La contadauría Pública como profesión. s.l.:Armedia. Rodriguez, M., 2003. La contabilidad y el impacto de las tecnologías de la información y las
comunicaciones. Argentina: s.n. Romero, J. A. L., 2010. Principios de contabilidad. Mexico: Mc Graw Hill. Roover, R., 2011. Historia de la contabilidad. Alicante: s.n. Schmand, B. D., 1978. El primer antecedente de la escritura. España: s.n. SHCP, 2014, 29 de Abril.
http://www.shcp.gob.mx/LASHCP/MarcoJuridico/MarcoJuridicoGlobal/Leyes/251_lgsm.pdf. [En línea] Available at: http://www.shcp.gob.mx/LASHCP/MarcoJuridico/MarcoJuridicoGlobal/Leyes/251_lgsm.pdf [Último acceso: 19 01 2015].
Thompson Baldiezo, J., 2008. Historia de la contabilidad. s.l.:Maczr. Tua Pereda, J., 2012. La Dimensión Social de la Contabilidad. Antoquia: s.n. Uriol Gonzalez, F., 2013. Evolución Histórica de la Contabilidad. s.l.:Trujillo. Veritas, 2014. 65 años del Colegio. Veritas Colegio de contadores Publicos de México AC, p.
http://issuu.com/antonio.vivanco/docs/veritas_junio_2014?e=1936795/8089072. Vlaemminck, J., 1991. Historia y Doctrina de la Contabilidad. España: Index. Y., B., 1949. La Ciencia de la Contabilidad en el desarrollo del Capitalismo. Londres: Madrid-
España. Zans Arimana, W., 2012. Principios y fundamentos de la contabilidad. s.l.:San Marcos.
120
Elección Universitaria: Desarrollo de Multi-Escalas de Medición para categorizar el Conocimiento y Percepción
en la Elección de una Universidad
FRANCISCO LÓPEZ VÁZQUEZ Consultor y catedrático Universitario, LR Mercadotecnia,
Reynosa, Tamaulipas, México
MIGUEL ÁNGEL SAHAGÚN1
Candidato Doctoral, Universidad de Texas Pan-American, Edinburg, Texas, USA
Este estudio tiene como propósito encontrar los principales factores que definen grados de implicación de un estudiante de bachillerato con la elección de una Universidad. Estos factores son representados por multi-escalas de conocimiento y percepción. Un problema recurrente que enfrenta el personal administrativo de las instituciones de educación superior en México, es el garantizar la captación de alumnos. Para ello requieren tener el conocimiento de las expectativas del alumno de bachiller previo a que realice su elección universitaria. La contribución de este estudio es la creación de las escalas que permitirán medir dichas expectativas y así mediante el desarrollo de la estrategia correcta poder influir significativamente en su decisión final.
1 Address correspondence to Miguel Ángel Sahagún, Candidato Doctoral, Universidad de Texas Pan-American, Edinburg, Texas, USA. E-mail: [email protected]
121

Planta de Reciclaje de Papel, PET y Vidrio
SANJUANITA DALILA GARCÍA RAMOS, CPA
1 Facultad de Comercio, Administración y Ciencias Sociales,
División de Estudios de Posgrado, Universidad Autónoma de Tamaulipas El reciclaje de papel, PET y vidrio nos ayuda a reutilizar los materiales que desechamos en nuestros hogares, trabajos o cuando salimos: botellas, periódico, envases; una de las ventajas al reciclar estos artículos es ahorrar materia prima que en ocasiones se tiene que traer del extranjero, ahorro de energía, tiempo, inversión, apoyar al medio ambiente, de esta manera evitaremos que se generen residuos, lavándolos nuevamente se pueden incorporar al mercado, no se emitirán gases, se crearan empleos, se concientizara a los habitantes acerca de la importancia de reciclar, apoyando a la limpieza de la ciudad no arrojándolos a la calle.
1 Address correspondence to Sanjuanita Dalila Garcia Ramos, CPA., Facultad de Comercio, Administración y Ciencias Sociales, División de Estudios de Posgrado, Universidad Autónoma de Tamaulipas E-mail: [email protected]
122
Logística a la inversa. Aprovechamiento de sobrantes, disminución de costos, Reducción impacto ambiental.
EDUARDO REYES ALCÁNTARA1
Estudiante de la Carrera de Comercio Exterior, Universidad Autónoma de Tamaulipas, Nuevo Laredo, México
SEBASTIÁN RAMOS GUZMÁN
Estudiante de la Carrera de Comercio Exterior, Universidad Autónoma de Tamaulipas, Nuevo Laredo, México
1 Address correspondence to Eduardo Reyes Alcantara, Estudiante de la Carrera de Comercio Exterior, Universidad Autónoma de Tamaulipas, Nuevo Laredo, México. E-mail: [email protected]
123
1. INTRODUCCIÓN
La logística surge de las cuestiones militares, principalmente en Inglaterra en la década de los años 40. Durante la segunda guerra mundial fue una de las disciplinas más aplicables en este conflicto global. Así mismo se dice que la logística es el arte de planear y coordinar todas las actividades para que un producto o servicio llegue a un cliente.2 A la logística inversa se le conoce también como el arte de planear y controlar el flujo de los productos desde el punto de consumo hasta el punto de origen de una forma eficiente, su principal objetivo o propósito es recuperar su valor o el de la devolución. La logística inversa administra el retorno de las mercancías de la cadena de suministro, de la forma más económica posible; también se ocupa de la recuperación del reciclaje de envases, embalajes y residuos peligrosos. Es aplicable en los mecanismos de retorno de excesos de inventario, devoluciones de cliente, productos obsoletos, e inventarios estacionales. Se menciona que se ocupa de los productos cuando están en declive, y de la salida de mercados con mayor rotación. Esta actividad tiene un enorme potencial de crecimiento, también nace como un nuevo espacio para la reducción de costos en las empresas, además puede representar una fuente de oportunidades y alternativa, es importante que fabricantes y distribuidores participen más y se involucren en el proceso, ya que son los principales actores de esta actividad.3 Con respecto al aprovechamiento o utilización de material es parte integral de la logística inversa. Se parte de una base diferente de negocios, no tanto lo cotidiano de venta de productos o servicios. Más bien aplica como al servicio de la necesidad de que esta prestación consistía en retirar, transportar o reciclar un equipo electrónico o eléctrico ya fuera de uso, con su correspondiente financiamiento y que se tiene que organizar la operativa logística, de recogida desde los puntos habilitados para el propósito, por los municipios o los establecimientos comerciales, con lo que se puso en marcha una característica de la logística inversa: el aprovechamiento de los flujos de ideas para transportar el residuo a la vuelta, formando un circulo completo.4 Con relación a los costos, la logística inversa ofrece beneficios tanto sociales como económicos; en los primeros se encuentran inmersos en los intereses medioambientales, contribuyendo a la disminución del impacto ambiental, hay un gran desarrollo gracias a que en los últimos años ha aumentado su crecimiento en el mundo empresarial, convirtiéndose en unos de los negocios con mayor aprovechamiento, además ofrece los beneficios en la reducción de pérdidas de devolución y mejoramiento en la imagen de las empresas. Por ejemplo de esta manera los envases y empaques fuera de uso pueden entrar en el proceso de la logística inversa, con el fin de evitar el contacto directo con los animales.
En la actualidad las empresas y sus cadenas de suministro se están empezando a
preocupar de los flujos de productos e información generados desde sus proveedores hasta el cliente final para satisfacer sus necesidades, también atender y recuperar sus productos, después que sean utilizados y desechados por los clientes. Esta recuperación o logística inversa en algunas industrias o sectores se ha convertido en obligatoria al medioambiente y en otros es mirada como una oportunidad para la generación de valor y beneficios económicos. La consideración de la logística en cuanto al medioambiente, dentro de la cadena de suministro y la logística tradicional en los últimos diez años ha tomado mucha importancia el nombre
2 Carranza Octavio, Mejores prácticas logísticas en latino América, (Estados unidos de norte América: Astral, 2003), pág,1 3 Bastos Ana, Distribución logística y comercial (España: Ideas propias, 2007), pág. 24 4 Cabeza, domingo, Logística inversa en la gestión de la cadena de suministro,(España: Marge books, 2012), pág.12
124
administración de cadena de suministro verde o también conocido como green supply chain management y que básicamente se basa en el desarrollo de prácticas y estrategias verdes que permitan que desde la cadena contribuya al medioambiente, también debe llevar una operación económica accesible, debe estar muy de la mano con la producción y satisfacción del cliente5. La logística inversa ha tomado importancia en la cadena de suministro debido a los golpes en costo por su mala administración, el medioambiente y la generación de la ventaja competitiva, representa una forma adecuada para la recuperación de productos. Se puede decir que a la logística se le puede llamar inversa, debido que al flujo de producto, información y el dinero van en dirección contraria desde el punto de uso al de origen o reproceso.6 Esta investigación tiene como objetivo analizar la logística inversa y proponer medidas para el aprovechamiento sustentable de los materiales utilizados, se organiza de la siguiente manera, la sección 2. Analiza origen y utilidad, la sección 3.aprovechamiento de sobrantes, la sección 4. Se enfoca en los costos en la logística inversa ya que no son de tipo estándar. La sección 5. Trataremos la logística inversa y la disminución del impacto nocivo al medioambiente, por ultimó trataremos la sección 6. Conclusiones y propuestas
2. LOGÍSTICA INVERSA: ORIGEN Y UTILIDAD
La logística inversa es definida como las actividades que involucran la administración, procesamiento, reducción y disposición de residuos o productos desde producción de residuos del embalaje (tarimas, cajas, charolas) o bienes usados por el cliente hasta su punto de origen, reproceso o destrucción. Los objetivos de la logística inversa pueden ser: a. Hacer una buena planeación, ejecución y control de la corriente de los productos, información y dinero entre los diversos procesos establecidos dentro de la logística inversa que aporten a la generación de valor y reducción de costos en las actividades de la logística inversa. b. Establecer, realizar, aplicar y mejorar procesos que den resultados para los productos administrados en la logística inversa, que se puedan reparar para el rehúso recuperación, reciclaje o eliminación. Con una meta de minimizar los impactos ambientales y maximizar los beneficios económicos de la empresa. c. juntar la logística inversa con la tradicional y la cadena de suministro, agregando tecnologías de información y comunicación, así pueden comunicarse mejor todas las partes que lo conforman, evitando errores como la falta de documentos
5 Soret, Ignacio, Logistica comercial y empresarial, (España: Esic,2004), pág.34 6 Gómez, Rodrigo, Logística inversa un proceso de impacto ambiental y productividad, 2013.
125
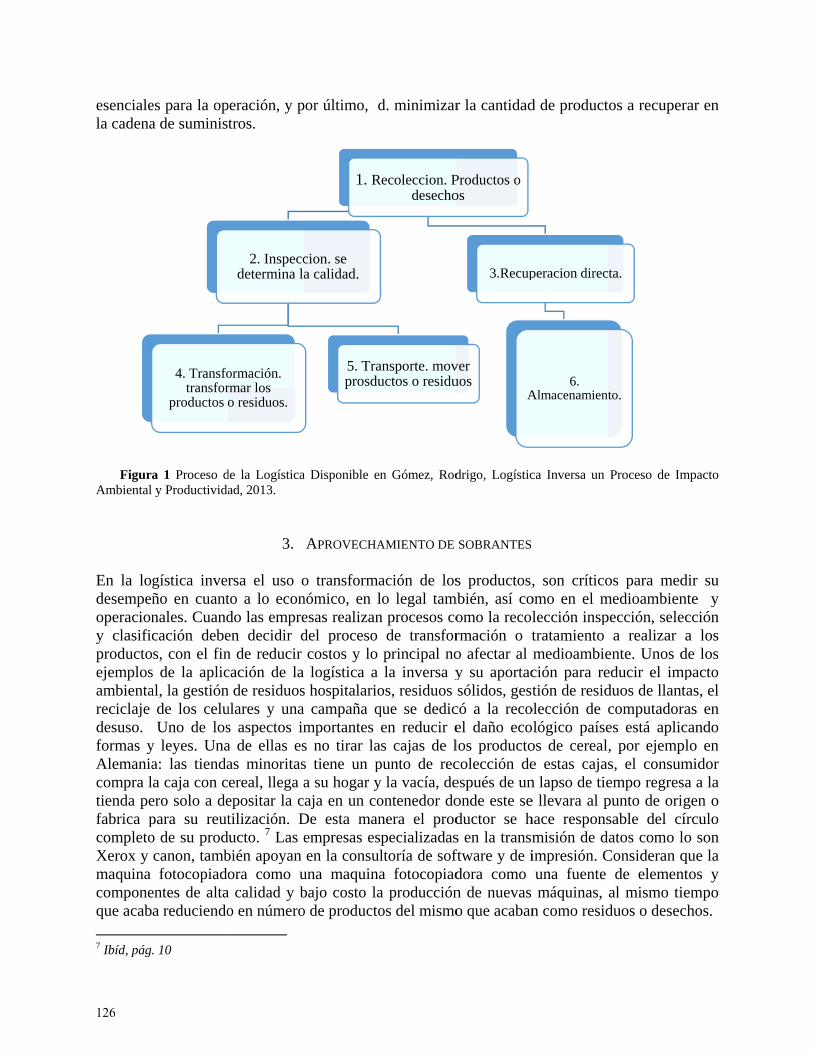
esencialela cadena
Figur
Ambiental
En la lodesempeñoperaciony clasificproductoejemplosambientareciclaje desuso. formas yAlemaniacompra ltienda pefabrica pcompletoXerox y maquina componeque acab
7 Ibíd, pág.
es para la opa de suminis
a 1 Proceso dy Productivida
gística inverño en cuantnales. Cuandcación debes, con el fin
s de la aplical, la gestión
de los celuUno de los
y leyes. Unaa: las tiendaa caja con c
ero solo a depara su reuto de su prodcanon, tambfotocopiado
entes de altaa reduciendo
. 10
4. Transfotransfor
productos o
peración, y ptros.
de la Logísticaad, 2013.
3.
rsa el uso oto a lo econdo las empreen decidir dn de reducir cación de la n de residuosulares y unas aspectos ima de ellas esas minoritasereal, llega aepositar la ctilización. D
ducto. 7 Las ebién apoyan ora como u
a calidad y bo en número
2. Inspeccdetermina la
ormación. rmar los o residuos.
por último, d
a Disponible en
APROVECHA
o transformanómico, en lesas realizandel proceso costos y lo logística a
s hospitalario campaña qmportantes s no tirar las tiene un pa su hogar yaja en un co
De esta manempresas esen la consul
una maquinabajo costo lao de producto
1. R
cion. se a calidad.
5. Traprosdu
d. minimizar
n Gómez, Rod
AMIENTO DE
ación de loslo legal tamn procesos co
de transforprincipal nola inversa y
os, residuos que se dedicen reducir e
as cajas de lpunto de recy la vacía, deontenedor donera el prodpecializadasltoría de sofa fotocopiada producciónos del mismo
Recoleccion. Pdesecho
ansporte. movuctos o residu
r la cantidad
drigo, Logístic
SOBRANTES
s productos,mbién, así co
omo la recolrmación o to afectar al y su aportacsólidos, gest
có a la recoel daño ecolos productocolección deespués de unonde este seductor se hs en la transmftware y de idora como n de nuevas o que acaban
Productos o os
ver uos
3.Recup
A
d de product
ca Inversa un
, son críticoomo en el mlección insptratamiento medioambieción para retión de resid
olección de clógico paíse
os de cereale estas cajasn lapso de tiee llevara al phace responsmisión de dimpresión. Cuna fuente máquinas,
n como resid
peracion direc
6. Almacenamient
tos a recuper
Proceso de Im
os para medmedioambienpección, sele
a realizar ente. Unos deducir el impduos de llantcomputadoraes está aplic, por ejemps, el consumempo regrespunto de origsable del cíatos como lo
Consideran qde element
al mismo tieduos o desec
ta.
to.
rar en
mpacto
dir su nte y cción a los
de los pacto tas, el as en cando lo en
midor a a la gen o írculo o son
que la tos y empo chos.
126

PAsí se creparacióempresa electrodolavar, pacasas y cservicio, manufactmedularere manuflogística
Figura 2 P
Asistema lse usan plos ahorrtransportde la etapdesechosrecolecci
T
para ser rconforma 8 Aranda, A
or eso se haconsiguen món de sus pro
fabricante omésticos enara no tener cobrarles por
la compañítura si es es entre ellosfactura. Primes necesario
Pasos para Log
A esto se le llogístico. Laprincipalmenros generadotado a lugar pa. Está incls o devueltosión incluyen
Tercero, el mreadmitido oa de todas
Alfonso, eco di
an estandarizmaquinas conoductos es u
de electron lugar de vel productor cada lava yía retira el necesario.8 s tenemos demero, se anao administrar
grar el Aprovec
llama fase da evaluación nte los costoos, el mejor a
de origen. Eluida la activs, y su trasla actividades
material que o no en la calas activida iseño y análisis
Renova
Reduccreemp
deprodu
zado materian un 97 % na de las línodomésticosventa de proo en su casaya sea por sproducto y Dentro del
esde la recolaliza la necer de una form
chamiento de R
de análisis depuede ser e
os asociados aprovechamEl transportevidad de recado a instala
de compra,
se recolecta adena logístides que det
s de ciclo de vi
Are
El
acion.
ción o plazo e ctos.
ales, se han de re manu
neas con máss, ha iniciaoductos. El . La compañ
semana mes lo traslada
l aprovechalección, análesidad de recma adecuada
Residuos (elabo
el problema conómica o con las acti
miento de los e de materialolección, es aciones dóndtransporte y
para saber ica. Incluye terminan sin
ida,(España: pr
Analisis de ecolección.
liminación
diseñado moufactura y cs ingresos acado campausuario queñía ofrece po año, cuana otro luga
amiento de lisis del prodcoger un pra la informac
oración propia)
y sus futurafinanciera. P
ividades log recursos. Seles debe ser i la acción, rde después sy almacenaje
cuál debe sela fase de Inn un produc
rensas universi
Proceso de traslado
Inspeccion-separacion.
odularmentecon un 96 %ctualmente. Eañas de vee requiera unponerles unando el clientar que lo resobrantes e
ducto, hasta roducto al fición.
).
as complicacPara la evalu
gísticas, su pegundo, el pideal para elrecoger los pserán tratadoe.
erá su destinnspección-Secto es reutil
itarias de Zarag
e para ensam% reciclableElectrolux e
enta e servna lavadora
a lavadora ete ya no quieequiera, y lestán seis psu reutilizacinal de la ca
ciones dentruación finanosible reduc
producto debl mejor desarproductos usos. En total e
no, como se eparación, qlizable y de
goza,2010) pág
mblar. e. La
es una vicios a para n sus ere el lo re-pasos
ción o adena
ro del nciera cción, be ser rrollo sados, en la
dice, que se e qué
g. 38
127

manera. De esta forma la inspección y la separación separan a los productos usados en función de sus posibilidades de uso (reutilización, restauración, eliminación). Cuarto, se crean las acciones de eliminación de los productos. Se pueden dar oportunidades de venta a otras empresas o reciclarlo. La fase de eliminación, es requerida por los materiales que no pueden reutilizarse por razones técnicas o económicas, La eliminación incluyen transporte y vertido o incineración, dependiendo del caso. Quinto, la elaboración de mejoras para la renovación de los productos. En esta parte sé regresara el producto al mercado, esto se realizara de forma directa o mediante un proceso de renovación total o parcial. Este reproceso lleva la transformación de los productos usados de nuevo en productos útiles. Esta transformación, se puede hacer de distintas formas (re-utilización, reparación, reciclado). En lo que se refiere a la distribución, que es la gestión y transporte de productos reutilizables a mercados potenciales y futuros usuarios. Van de la mano las actividades como la venta, el transporte y el almacenaje. Por último, la a lo que se le denomina y se le reconoce actualmente como la re-ingeniería en el proceso de analizar los cambios para que el sistema logístico funcione al máximo. La fase de reducción de materiales, es el reemplazo de ciertos materiales para trabajar o el rediseño del producto para una posterior re-utilización de sus componentes. En parte de re-uso de los materiales de empaque, se pueden dar algunos aspectos generales de cómo se puede hacer uso de ellos, lo más difícil de este re-uso de materiales de empaques es cómo calcular la cantidad de utilización real y como controlar la administración de las devoluciones, por eso es necesario recaudar cierta información del empaque de re-uso. La disminución de materiales en el diseño o en caso necesario su reemplazo por otros menos contaminantes a los procesos de reutilización o reciclaje, esto se realiza en dos categorías: la reutilización o la modificación de los materiales de empaque, embalaje y envase; el remplazo de cierto materiales para bajar los costos, siempre y cuando estos sean ambientalmente amigables o en dado caso rediseñando el producto para una posterior reutilización de sus componentes.9
4. COSTOS Y LOGÍSTICA INVERSA
Significativamente la logística inversa como una herramienta de ahorro de energía y también la eficiencia. De una buena parte la elaboración de productos biodegradables o reciclables ayudan en buena parte al ahorro de compra de materiales, esto basándonos al sector industria. Otra buena parte es la marca de los productos para su reconocimiento, ya que los plásticos son uno de los materiales más difíciles de identificar, por ello empresas, ya sea del ramo productos de consumo o no, deben etiquetar sus productos, ya que con eso sería menos trabajo pode separar los productos de retorno. Una de los grandes problemas es que los productos de envase o embalaje son desechados, por ello se debe tomar en cuenta lo siguiente, se están aplicando medidas de, diseñar para reciclar, ya no desechar el embalaje de los productos que compramos o que se utilizan para transportar otros productos con la misma situación, solo se retira la protección y se desecha. Este hábito debe cambiar conforme las maneras de producir los hacen, así nos ahorramos gran cantidad de materia prima, plásticos, cartones, en incluso combustible, quitando rutas de recolección de materias primas, ya sea desde el punto de extracción o venta hasta el punto de producción. 10
9 Serra Daniel, La logística empresarial en el nuevo milenio), pág. 34 10 Ibíd., pág. 36
128

Figura.3 P U
con el aclas granddesechadcontratantratamiende desectransformeléctricasgeneracióejemplo empresaspara la lomás impAún estáapreciadcontrol, aunque ede la Asaunque considersignificainvolucr
Pasos de Una E
Unos de los gceite de quemdes prensas
dos son un n a terceros ntos simplemcho puede
madores elécs, en especiaón de vaporpodemos ab
s, como punogística al igortantes dená en las últida por much
sin embargen algunos sociación Nesos result
rarla en suado, que es rados, en el
Eliminación de
grandes probmado que ges, pistones,
grave probpara que r
mente su verser usado
ctricos, al aal las geotérr para moverbordar el signto importangual que Nuentro de los dmas filas dhos o descogo, la logísectores pu
Nacional de tados sean us procesos
logística inl foro mun
sepa
tra
Costos Elabor
blemas de laeneran las glas maquin
blema porqurecojan los rtedero direc
por otras ceite quemarmicas utilizr las grandeguiente temante en la ciuevo Laredo,
dos países, ee las prácticonocida, tiestica inver
uede llegar Logística satisfactori
s. En grannversa y sigdial de las
aracion
aslado
ración Propia
as empresas randes maqu
nas que utiue no sabendesechos ento a la tierra
empresas ado actuandozan este tipos turbinas pa, Logística
udad de Lare en Tamauli
estados unidcas en las e
ene temor esa puede ghasta el 50%Inversa de ios, pese an cantidad gnifica una ciudades l
Ahorroen mate
prim
dedicadas auinarias quelizan engran qué hacern su planta a, por eso es
por ejempo como enf
o de desechopara la gener
inversa genedo, Texas. ipas México
dos y Méxicoempresas ene cuanto sugenerarles e%. El presiEstados Un
a ello, mucgerencias
a mayor fuelogísticas s
o de erias
mas
a la producce utilizan paranes, todos r con él, my los trasla
s necesario splo para lafriador de eos como comración de elenera ahorrosQue es un p
o. Son los puo, conforma
n nuestro pa aplicaciónentre 3 y 1idente, ademnidos, desta
chas compagenerales
ente de utise mencion
ión, es que hra producir cestos mater
muchas empaden a centrsaber que esea fabricaciónste. Las plmbustible paectricidad. Cs de hasta 1punto estratuntos estratéan una metróaís muy, es n en sistema15% de ahmás de fundaca que mu
añías siguendesconoce
lidades para este tema
hacer como riales
presas ro de e tipo n de lantas ara la Como 5% a égico
égicos ópoli. poco
as de horro, dador uchas n sin en el ra los a tan
129

agradable para unos y tan desconocido para otros, que comenzó en Laredo, Estados Unidos. En una gran cantidad de empresas no mencionan siquiera logística inversa, sino devoluciones. La gran importancia de la logística inversa lo puede mencionar la empresa grande de la industria como lo es Caterpillar. El gerente general de su división de Remanufactura en Estados Unidos sin mencionar otros países, se dice que los beneficios que genera esta parte del sector a la compañía, podemos mencionar que tiene con grandes plantas de remanufactura, una de ellas en Nuevo Laredo. En esas grandes plantas de la gran industria remanufacturan con productos que la empresa obtiene desde los puntos de distribución donde se comercializan una vez concluida cuando se termina su vida útil. Las piezas llevan una etiqueta para que el usuario la devuelva y lo hacen. De ahí las recolectan hasta la planta. una de las limites que enfrentan en esta área son las que los gobiernos imponen a la importación de productos usados. Los reglamentos de importación y exportación están apegados para proteger a la economía local y poner barreras al material usado. Tienen buenos argumentos, porque quieren evitar ser el tiradero de economías más desarrolladas, pero el sistema de logística inversa solo funciona con material usado. El intercambio de ideas entre las ciudades que van marcando el liderazgo en la planificación logística y los beneficios económicos y sociales que a partir de eso se han tenido en materia ambiental, tráfico, economía y simplificación de la cadena de suministro. La logística impacta todo. Pero en nuestro país este concepto todavía no es considerado dentro de la planificación de los municipios para mejorar la calidad de vida de los ciudadanos y disminuir el costo de la cadena de suministro.
Abastecer los restaurantes de productos, tiendas y hoteles de nuestros centros históricos es un menudo problema ante la falta de infraestructura que generalmente se tiene. Estas situaciones provocan embotellamientos y congestionamientos viales en las horas pico hacen más grandes los problemas, sin mencionas los que ya tienen estos espacios en las ciudades. En algunas ciudades como París, hay bahías de estacionamiento temporal que se guardan al municipio hasta por dos horas, para estacionar los vehículos de reparto. En varias ciudades de Estados Unidos, en su mayoría existen calles interiores que través de ellas lo mismo se hace el reparto y distribución a los comercios de las zonas céntricas como la recolección de basura, evitando que se junte el tráfico de la ciudad con el de distribución y reparto cuando éste tiene que permanecer estacionado en un lugar determinado. En nuestras ciudades no existe lo uno ni lo otro, puede ser de gran utilidad poder aprender en el Foro, cómo otras parecidas a estas lo están llevando a cabo. Y más allá de ello, cómo debemos aprovechar el crecimiento de nuestras ciudades tomando en cuenta los distintos factores logísticos o de inversión que impactan su vida. Aprender nos puede permitir contar con ciudades más relacionadas, pero también con menores costos logísticos que sean más competitivas para la inversión en el país, como se ha estado planeando queremos conseguir que nuestro país se convierta en una plataforma logística.11
11 Olivares, Arnulfo, Un programa de Logística Inversa, (México: Porrua, 2012), pág. 14
130

Figura.4 A
La sociedgeneramoalcanzarotendenciade recogiequipos eque se destrategiaconceptogestión dsociedad consideranuevos organizacdesarrollaspectos ciclo de vcontaminreversa. Lactividadtiene en desde el emisionepeligrosomedioamreutilizacutilizacióproductocomprom
Almacén, Elabo
dad actual eos. Actualmon en 2006 la al crecimieida selectivaeléctricos-el
dirigen a la as preventiv
o de ciclo de de residuos
del reciclaación del remercados qción entre oen nuevos ppreventivos
vida como; pnante asociaLa logísticades logísticascuenta los aproductor a
es al aire, la os y no pel
mbiental de ción de conteón de menoss. Por tanto
miso hacia la
oración propia
5. LO
está cobrandmente el 30%los ocho milento es tamba de residuoectrónicos ominimizacióas y que convida complse han de
ado, cuyo esiduo comoque demanotros aspectproductos y s de su impapotencial deda, uso adic
a inversa cos tradicionalaspectos medal consumidcongestión yligrosos. Enlas activid
enedores, recs materiales,, la aplicac
a protección
OGÍSTICA INV
do concienci% de los rellones de tonbién la actuas industriale
o residuos deón de los imnsideran el ceto toma unsarrollado nánimo es e
o materia pdan nuevastos. Esta nu
procesos qacto ambiente reutilizaciócional, fácil onsiste en lles que se lldioambienta
dor, es deciry el uso de cn definitiva,dades de lociclaje de lo, reducción ión de la Ldel medio a
VERSA Y SUS
a de la necesiduos sólid
neladas y en al. La logísties, vehículose la construcmpactos ambiclo de vida papel de renuevos concevitar la el
prima aproves normas dueva sociedque considertal consideraón, incorpora
desmontajela adopción levan a caboales en todas, consumo dcarreteras, el, trata de mgística trads materialesde energía y
Logística invambiente en
TENTABILIDA
esidad de redos urbanos
2007 aumenica inversa fs y neumáticcción. En losbientales hatotal de los levancia. Enceptos y mliminación echable. Estde calidad,ad del recicran desde laando el restoación de mej situación ade requeri
o entre provs las actividde recursos l ruido y la e
medir y reddicional, pers de embalajey contaminaversa tiene
n la empresa
Logísinve
AD
educir los reson envase
ntaron otro facilita la crecos fuera des últimos añan pasado dproductos y
n concreto, emercados con
descontrolata tendencia transparenclado ha foa temprana o de etapas joras que mi
actual de la imientos amveedores y cdades logístic
naturales noeliminación
ducir al mínrsiguiendo le, re diseño ación en el un impacto, así como e
stica ersa
siduos que tes y embala7% más (1).eación de cae uso, residuños las estratde ser reactivy procesos. Aen relación cnocidos comda así coma está generncia, apertuomentado quetapa del dposteriores inimicen la logística ve
mbientales enclientes. Es dcas tradiciono renovablefinal de res
nimo el implos objetivode los embatransporte d
o favorable en el rendim
todos ajes y . Esta anales uos de tegias vas a
Así, el con la mo la mo la rando
ura y ue se
diseño en su carga rde y n las decir, nales, s, las iduos pacto
os de alajes, de los en el
miento
131

operativoidentificadel produagua y acontenedconsumoimpacto a través interacciótienen imcarga (encarga. Ckilogramlogísticosmuchas cmás granexpuestomuchos pimpulsar de las mdesechos
Figura. 5 T
Lsistemas logística región dedel muncompromambientasolucionetotalmental propo
o de la misman en la Logucto con el fauditiva, en
dores de cargo de materiaambiental endel aire, el ón con el m
mpactos negn algunos paCuatro litrosmos de carbo
s que puedancompañías tindes a los q la capa de países. Esta un desarrol
materias prims, entre otros
Transporte, log
Los elementode las emprinversa se h
e América Ldo, transpor
mete diariamal, esa es unes sosteniblete digital y d
orcionar un
ma. De estagística Inversfin de reduc
n la fabricacga; Reciclarales tanto pn la disposicagua y la ti
medio se deativos, talesaíses el 85%s de petróleono a la atmn ser cada vienen que enque se ha en
ozono, quenueva tendelo de la econ
mas, almacens.
gística verde E
os más sobreresas y gobiha ido imple
Latina y el Crte exprés y
mente a propna de sus mees para sus cde impresiónsuministro
a forma, posa, Medir lo
cir dicho conción y transr empaques yara el produ
ción final de ierra, y en eenomina un s como la em
% del carboneo quemado
mósfera). Penvez más amignfrentar. Es cnfrentado elcomo cons
encia se basanomía crean
naje verde, tr
laboración Pro
esalientes deierno, dan orementando y
Caribe es Fedy servicios porcionar coetas para la clientes de lon bajo demade energía
demos señas niveles de
nsumo: Redusporte de loy balajes; Ructo final clos producto
ese proceso aspecto am
misión de gano emitido a os por un nsar en avangables con eclaro que la l planeta y pecuencia ha
a en usar de ndo una econransporte ec
opia
e la logísticarigen a las ty desarrollandEx, una deafines con
onexiones glempresa, meos cuales sonanda. En esto
limpia a u
LoMed
alar las activconsumo de
ucir la contaos productosRediseño delcomo para sos y embalajinteractúa c
mbiental. Alases a la atm
a la atmósfermotor prod
nces tecnolóel medio ambemisión de Cprueba de e
a generado umejor mane
nomía circulcológico, pro
a inversa, y ctres fuentes ndo. Lo que
e las compañmás trayec
lobales y reediante contn potencialeos días, esta un costo ec
ogistica y dioambiente
vidades y pe energía duaminación des terminadol producto psu embalajejes. La logíscon el medilgunos aspemósfera porra proviene ducen aproxógicos para biente, es elCO2 es uno ello es el daun gran camera los recurlar, concentrocesamiento
combinándode impulso
e podemos oñías de logísctoria en el educir al mítinuos esfues, manejandempresa en
conómicame
propósitos quurante el trasel aire, del s
os; Reutilizapara minimize y Minimizstica mueve ioambiente. ectos ambienr el transpordel transporximadamentrealizar pro
l reto que hode los probl
año al que mbio climáticrsos de logístrándose en e
o, reciclaje d
olos igual copor las cua
observar es stica más gra
planeta, quínimo el imperzos en busdo una platafnfrenta un deente rentabl
ue se sporte suelo, ar los zar el zar el carga Cada
ntales rte de rte de te 11 cesos
oy día lemas se ha co en tica e
el uso de los
on los les la en la andes ue se pacto ca de forma esafío e. El
132
compromiso y meta diaria de FedEx está en conectar al mundo de forma responsable e ingeniosa, al establecer metas que minimizan el impacto ambiental y permiten crear un camino hacia el mercado global sustentable, dadas las exigencias actuales de los gobiernos en el uso de tecnologías más limpias y productos más ecológicos para contribuir en los procesos ambientales sustentables para el beneficio de todos. Derivado de informes del último Foro Económico Mundial, se señaló a la industria logística como la responsable de causar aproximadamente el 6 por ciento de las emisiones de gases de efecto invernadero en todo el planeta, contribuyendo a la intoxicación del mundo entero. Esto se enfoca al transporte de mercancías de un país a otro e también dentro del mismo territorio. Hoy en día algunas empresas que aplican medidas logísticas amigables con el medio ambiente lo hacen por iniciativa propia, lo que demuestra una incipiente preocupación, si nos comparamos con lo que se hace en Europa, por ejemplo, donde la incorporación de los principios de reducir las emisiones dañinas son un requisito cuando de hacer negocios se trata. FedEx en sus metas declara propuestas y presentadas durante quinto informe anual, afirma que para el 2022 los contaminantes de aviones se reducirá en un 35 por ciento, la eficiencia energética de vehículos aumentará en un 18 por ciento, como en el 2030 la obtención del 30 por ciento de combustibles para aviones se realizará de fuentes alternativas y se buscará la expansión de la generación y adquisición de créditos de energía renovable. En resumidas cuentas, si se quiere tener una logística inversa, no sólo hay que preocuparse por el transporte si no por el diseño del producto, su producción, el suministro, la distribución y por supuesto, su retorno. La logística inversa se ha revelado como uno de los principales focos de actuación para la industria manufacturera, que han comenzado a considerar cuestiones tales como producción limpia, reducción de consumo de materias primas, medio ambiente, reutilización de productos, etcétera, con el objetivo de disminuir la cantidad final de los residuos generados durante su actividad y gestionar adecuadamente su eliminación. Otra función principal que regala la logística inversa es tratar con la reutilización de aquellos materiales, tales como las mermas o productos provenientes de desperfectos de producción, y permitiendo desde un punto reincorporación a la cadena de producción como materias primas de procesos productivos propios o externos. Proporcionando así una oportunidad de adquisición y mejora en la productividad, a un menor costo. Nunca ha sido más importante para las organizaciones controlar los costos, generar beneficios y operar de manera eficiente. La industria se encuentra bajo presión para reducir los desechos y residuos, y operar de una manera verdaderamente buena; especialmente en el sector manufacturero, donde la rentabilidad depende de la eficiencia. Una correcta gestión de la logística inversa dentro de la cadena de suministro, aplicada correctamente, es capaz de generar un impacto significativo sobre los resultados y beneficios económicos y productivos finales de este sector.
Supongamos que poseemos una empresa fabricante de latas, nuestra materia prima serían bobinas de metal, y en nuestro proceso productivo estas bobinas son procesadas y sufren diferentes transformaciones hasta convertirse en nuestro producto principal. Sin embargo, durante los procesos, existen desperfectos comunes, mermas y desperdicio estándar. Al aplicar logística inversa, nuestros analistas de producción pueden identificar los procesos que generan mayores costos o mayores retrocesos, para lo cual pueden implementar, en combinación con manufactura esbelta, estrategias que permitan reducir estos índices, y a su vez, los analistas de costos y ventas, pueden medir las mermas y desperdicios recuperables y gestionar la distribución o venta de los mismos, ya que al ser recuperables pueden funcionar como materia prima para la fabricación de otro producto (interno o externo). Entendiéndose como mermas y desperdicios
133
recuperabmismos. de la logoptimizanSe trata dno tienes
Figura. 6 L
Para concproductono genutilizaciólogística productoconsistía correspondesde locomerciaaprovechcirculo co 12 Cabeza,
bles, aquelloEsto es sólogística invendo sus procde imaginacis que hacer c
Los Biocombu
cluir este tems de consum
nerar pérdidón de materi
inversa Se s o servicioen retirar, tr
ndiente finaos puntos hales, con lohamiento de ompleto. En domingo, supr
os cuyo coso un ejemploersa y respocesos y a su ión, innovac
cosas extraor
ustibles para el
6
ma todos losmo o para la das, al contial es parte parte de unas. Más bienransportar o nciamiento abilitados p
o que se pulos flujos
n cuanto al ap
ra nota 3, pág.3
sto de recupo de cómo l
onder a los vez benefici
ción y un pocrdinarias. Ha
Transporte, El
6. CONCLUS
s beneficios pindustria, detrario obtenintegral de la base difern aplica comreciclar un ey que se tie
para el propuso en marde ideas paprovechamie
33-37
peración sealas organizac
desafíos quiándose de aco de astuciaaz cosas ordi
laboración Prop
SIONES Y PRO
para las empe esta últimaner ingresosla logística ente de neg
mo al serviciequipo electrene que orgapósito, por rcha una caara transportento de sobr
a menor al ciones puedue enfrenta algo que soloa, como diceinarias, extra
pia
OPUESTAS
presas que sea se pueden a. Con respinversa. En ocios, no tao de la nece
trónico o elécanizar la opelos municip
aracterística tar el residurantes Una d
Logisinver¿llegbio-comb
costo de diden aprovech
la industriao se considere hoy en díaaordinariame
e dedican a laprovechar l
pecto al aprcuanto a la
anto lo cotidesidad de quctrico ya fueerativa logíspios o los de la logí
uo a la vuelde ellas es no
stica rsa, aremos
bustibm
isposición dhar los benefa manufacturaba una pér
a. Para ser exente bien.12
la elaboraciólos desechosrovechamiena aplicación diano de venue esta prestera de uso, cstica, de recoestablecimi
ística inverslta, formando tirar las caj
al
me?
de los ficios urera, rdida. xitoso
ón de s para nto o de la
nta de ación on su ogida ientos sa: el do un jas de
134
los productos de cereal, por ejemplo en Alemania: las tiendas minoritas tiene un punto de recolección de estas cajas, el consumidor compra la caja con cereal, llega a su hogar y la vacía, después de un lapso de tiempo regresa a la tienda pero solo a depositar la caja en un contenedor donde este se llevara al punto de origen o fabrica para su reutilización. De esta manera el productor se hace responsable del círculo completo de su producto. En cuando a los costos, nos de los grandes problemas de las empresas dedicadas a la producción, es que hacer con el aceite de quemado que generan las grandes maquinarias que utilizan para producir como las grandes prensas, pistones, las maquinas que utilizan engranes, todos estos materiales desechados son un grave problema porque no saben qué hacer con él, muchas empresas contratan a terceros para que recojan los desechos en su planta y los trasladen a centro de tratamientos simplemente su vertedero directo a la tierra, por eso es necesario saber que ese tipo de desecho puede ser usado por otras empresas por ejemplo para la fabricación de transformadores eléctricos, al aceite quemado actuando como enfriador de este. Al vender el aceite la empresa genera ingresos y no pérdidas como es el contrato de transporte para la eliminación del aceite. En cuanto a La disminución del impacto al medioambiente logística inversa se ha revelado como uno de los principales focos de actuación para la industria manufacturera, que han comenzado a considerar cuestiones tales como producción limpia, reducción de consumo de materias primas, medio ambiente, reutilización de productos, etcétera, con el objetivo de disminuir la cantidad final de los residuos generados durante su actividad y gestionar adecuadamente su eliminación. Otro aspecto fundamental que nos brinda la logística inversa es lidiar con la reutilización de aquellos materiales, tales como las mermas o productos provenientes de fallas de producción, y permitiendo su reincorporación a la cadena productiva como materias primas de procesos productivos propios o externos. Es importante que las empresas apliquen la logística inversa primero para ahorrar materia prima, obtener beneficios en ingresos de capital con los desechos y reducción las emisiones y contaminantes.
135

BIBLIOGRAFÍAS
Carranza Octavio, Mejores prácticas logísticas en latino América, (Estados unidos de norte América: Astral, 2003)
Bastos Ana, Distribución logística y comercial (España: Ideas propias, 2007) Cabeza, domingo, Logística inversa en la gestión de la cadena de suministro,(España: Marge
books, 2012) Soret, Ignacio, Logistica comercial y empresarial, (España: Esic,2004) Gómez, Rodrigo, Logística inversa un proceso de impacto ambiental y productividad, 2013. Aranda, Alfonso, eco diseño y análisis de ciclo de vida,(España: prensas universitarias de
Zaragoza,2010) Serra Daniel, La logística empresarial en el nuevo milenio Olivares, Arnulfo, Un programa de Logística Inversa, (México: Porrua, 2012) Cabeza, domingo, supra nota 3,
136
Implementación de la Convención Ramsar en México: ¿Sustentabilidad a las ANPs?
DR. JUAN ANTONIO HERRERA IZAGUIRRE1
Universidad Autónoma de Tamaulipas, Nuevo Laredo, Tamaulipas, México
MTRA. MAYRA GARCÍA GOVEA
Universidad Autónoma de Tamaulipas, Nuevo Laredo, Tamaulipas, México
MTRO. LUIS HERNÁN LOPE DÍAZ
Universidad Autónoma de Tamaulipas, Nuevo Laredo, Tamaulipas, México
VIOLETA MANGIN
Universidad Autónoma de Tamaulipas, Nuevo Laredo, Tamaulipas, México
Esfuerzos internacionales, conscientes de la problemática alrededor de las Áreas Naturales Protegidas (ANPs) resultaron en la creación de la Convención Ramsar. Este Convenio designa áreas de conservación ambiental de importancia fundamental para la conservación de aves y especies. México, consiente de este compromiso internacional, ha creado una arquitectura institucional y legislativa para la protección de las citadas áreas. En ocasiones, los sitios Ramsar coindicen con la designación de ANPs. Este fenómeno lógicamente debería de acelerar la protección de flora y fauna en estos Sitios y ANPs. Este trabajo de investigación investiga la protección de aquellas especies de flora y fauna que están en ANPs y Sitios Ramsar. International efforts to address the problems around the Natural Protected Areas (NPAs) resulted in the creation of the Ramsar Convention. This Convention designates environmental conservation areas critical to the importance of the conservation of birds and species. Mexico, aware of this international commitment, has created an institutional and legislative framework for the protection of those areas. On some occasions, Ramsar sites coincide with the designation of NPAs. Logically, this phenomenon should accelerate the protection of flora and fauna in these sites and NPAs. This research investigates the protection of species of flora and fauna that are in NPAs and Ramsar sites.
1 Address correspondence to Dr. Juan Antonio Herrera Izaguirre, Universidad Autónoma de Tamaulipas, Nuevo Laredo, Tamaulipas, Mexico. E-mail: [email protected]
137
Revisiting the Day of the Week Anomaly in Financial Markets using Style Indices
ZUBAIR ALI RAJA1
A.R. Sanchez, Jr. School of Business, Texas A&M International University, Laredo, Texas, USA
RENEE OYOTODE
A.R. Sanchez, Jr. School of Business, Texas A&M International University, Laredo, Texas, USA
WILLIAM PROCASKY, CFA
A.R. Sanchez Jr, School of Business, Texas A&M International University, Laredo, Texas, USA
A great deal of research has been performed on the day of the week anomaly. However, extant literature in the area primarily assumes that investors are interested in investing in a composite market portfolio only and therefore, ignores the importance of style investing. This paper is the first of its kind as it explores the day of the week anomaly from an entirely different perspective. In this paper we have recognized the fact that individual and institutional investors may also actively engage in style investing. Therefore, instead of traditional benchmark indices, we have used daily return data on MSCI value and growth indices from 1997 to 2013 to determine the presence of a day of the week effect in 32 financial markets. Our findings suggest moderate to strong support for the existence of the day of the week effect in emerging markets; however, we do not find any evidence suggesting the presence of the anomaly in developed countries with the exception of Singapore, where a positive Wednesday effect exists. In emerging markets in which the anomaly exists, a positive Friday effect is the most frequent to occur. Our findings are supported by robustness checks utilizing each country’s composite benchmark equity index and different sub-periods of time. KEYWORDS International Financial Markets, Calendar Anomalies, Day of the Week Anomaly, Style Investing, Market Efficiency JEL G100, G110, G120, G140, G150
1 Address correspondence to Zubair Ali Raja, A.R. Sanchez Jr. School of Business, Texas A&M International University, Laredo, Texas, United States of America. Email: [email protected]
138
The Next Frontier of Mobile Money Usage-Firms-Evidence from Sub-Saharan Africa
APARNA GOSAVI1
A.R. Sanchez School of Business, Texas A&M International University, Laredo, Texas, USA
Mobile money has been widely used by individuals since its launch in the midst of the last decade. Nowadays, however, this service is also making its way through businesses that use mobile money for their financial transactions. The use of mobile money has transformed the way businesses in developing countries operate, particularly in Sub-Saharan Africa. Notably, firms in Kenya, Tanzania, Uganda, and Zambia are not only saving in time for financial transactions but also satisfying customers’ and suppliers’ requests to transact in mobile money and but also reducing costs of financial transactions. Currently, about 64 percent of firms receive payments from their customers in the form of mobile money. Additionally, more than 44 percent of businesses use the service to pay their suppliers. The author examines the characteristics of businesses that use the service by using the World Bank’s Enterprise Surveys Program data set for the year 2013, making the study current and applicable to the present. The results show that firms that are small in size and firms that have bank accounts are more likely to use the service. However, sectors to which the firms belong do not have any impact on the use of mobile money. Additionally, firms with export activities are not more or less likely to the service. Finally, firms in Kenya are more likely to use the service than firms in Tanzania, Uganda, and Zambia. KEYWORDS mobile money, service providers, firms, Kenya, Tanzania, Uganda, and Zambia.
1 Address correspondence to Aparna Gosavi, A.R. Sanchez School of Business, Texas A&M International University, Laredo, Texas, USA. E-mail: [email protected]
139
1. INTRODUCTION Mobile money is a financial tool that enables users to make and/or receive payments using their mobile devices. Generally, these financial transactions can be tied to their personal bank accounts. Four Sub-Saharan African countries — Kenya, Tanzania, Uganda, and Zambia — have been experiencing an exponential growth in the use of mobile money by individuals and businesses alike. This utility has been effective in transferring money far and wide, a peculiar characteristic of the service that has made it popular amongst users.
Mobile money has demonstrated an astounding potential to not only facilitate the transfer of money among largely impoverished individuals, but also carry out financial transactions with speed, safety, and reduced transaction costs. This tremendous potential was corroborated by the fact that in mid-May, 2008, the very first mobile money summit was held in Cairo, Egypt to assess the future growth of the service and to map out a role to be played by regulators.
The numbers for mobile money users, transactions, and monetary value of those
transactions are staggering. A Global Mobile Money Adoption Survey (2013) indicates that by June 2012, the service had 81.8 million users around the globe, of which 56.9 million originated from Sub Saharan-Africa, nearly twice the amount of Facebook users in the region. Moreover, in the month of June, 2012 alone, the service was used by 30 million individuals, resulting in 224.2 million transactions and totaling up to US$ 4.6 billion worth of transactions. This number exceeded 196.3 million transactions in the first quarter of June, 2012 on PayPal. In addition, the report notes that 72 countries have 150 mobile money system providers and that another 109 such systems are underway2.
Even the company that introduced this service, for the very first time in Kenya, was not
fully aware of its need and potential. When Safaricom, a mobile-phone provider of the UK based Vodafone, launched its mobile money service in Kenya in early 2007, 2.37 million people enrolled for the service in a little over one year (Jenkins, 2008). The Head of International Mobile Payment Solutions for Vodafone Group Dr. Nick Hughes said that “an uptake of the service has surprised us but shows the need in the market place for very simple, secure, and low-cost service.”3 In its primitive form, mobile money can be used for buying goods and services such as groceries, cab rides, bus tickets, as well as for financing services such as bill payments, payroll deposits, micro insurance, and domestic and international remittances. An independent survey of 500 plus individual users, belonging to low-income groups from Africa, indicates that they use the service because it is a cheap (70 percent), safe (69 percent), convenient (68 percent), and fast (68 percent) service (Ivatury & Pickens, 2006).
Because mobile phones are the basic platform for mobile money (Hughes & Lonie,
2007), it is worth mentioning the uptake of the same for both — individuals and businesses — in the Sub-Saharan African region. The region has some of the lowest levels of infrastructure development in the world (Aker & Mbiti, 2010; Jack & Suri, 2011). In Kenya and Tanzania around 14 percent of the roads are paved (numbers for Uganda and Zambia are not available) and
2 Global Mobile Money Adoption Survey (GSMA), Feb, 2013. 3 Hughes, Nick, Head of International Mobile Payments, Vodafone Group. May, 14, 2008. Presentation at GSMA Mobile Money Summit.
140

in all four of these Sub-Saharan African countries about one fifth of the population of has access to electricity4. Additionally, in these countries, merely 0.50 telephone landlines are available per 100 people5. Unlike developed countries that invested in landlines before adopting mobile phones, Africa experienced mobile phones leapfrogging landlines (Jack & Suri, 2011). This is due to the fact that a landline network can be costly, especially in countries that have poor infrastructure to support that network. However, this problem is addressed by mobile-phone providers in Sub Saharan-Africa who have implemented a network of specialized base stations covering about over 5-10 kilometers in radius. In addition, these base stations are equipped with diesel generators to overcome the unreliable power supply.
Starting from the twenty first century, the African region experienced the proliferation of
the mobile phone services. The growth of mobile phones in the region is due to underdeveloped telecommunication sector. The International Telecommunications Union notes that inadequate regional development, dearth of foreign exchange, scarcity of investments, meager private sector participation, and disorganized investments are prime reasons for the sorry state of telecommunications sector in Africa. Acknowledging these shortcomings and pushed by technological advances, a majority of African countries from the mid of 1990s, started reforming their monopoly-based government run telecommunication industry6.
As a result of reforms in the telecommunications sector in Africa, 17 countries had
private land-line operators, 36 countries had set up independent regulatory entities for the sector, and 45 had issued licenses to private mobile phone providers. Gebreab (2002) studies countries in North, South, and Sub-Saharan Africa from 1987 to 2000 to measure the impact of the reforms on the growth of mobile phones. He found that competitive markets grew faster than monopolistic markets (an increase of one mobile phone provider, increases the number of subscriptions by 57 percent), and privatization of incumbent land-line operators significantly stimulated mobile phone subscriptions.
However, it took a while for mobile phones to penetrate to the bottom of the pyramid.
The first mobile adopters were mainly young, wealthy, educated, urban, and male, as handsets and services were expensive. Aker and Mbiti (2010) claim that by 2009, a decrease in prices of both, handsets and services, mobile phone ownership extended to the more under- privileged, elderly, and rural population. They further claim that in Africa, mobile phones helped individuals in minimizing information asymmetry in several areas such as prices of commodities, potential buyers and sellers, job openings, natural calamities, and the well-being of loved ones. Based on an independent survey from Kenya, Demombynes and Thegeya (2012) discovered that overall, mobile phone usage rates were the same amongst men and women as well as between rural and urban areas. They have also found that 81 percent of the adults made or received calls at least once a day.
Over the past decade, the aforementioned countries have experienced rapid adoption of
mobile phones among individual users (Figure 1). Of these four countries, Kenya has experienced the highest growth, in terms of mobile phone subscribers; Zambia rose above Kenya
4 The World Bank Development Indicators, 2014 5 International Telecommunications Union (ITU), 2013 6 International Telecommunications Union (ITU), 1994
141
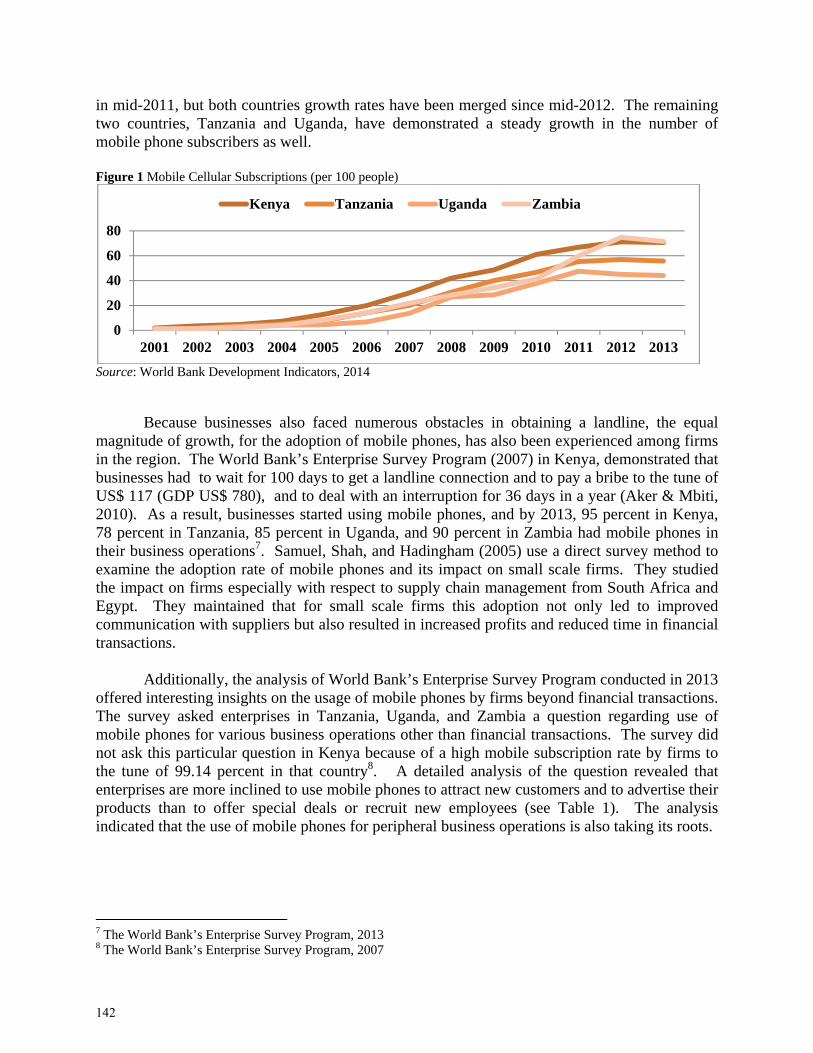
in mid-2011, but both countries growth rates have been merged since mid-2012. The remaining two countries, Tanzania and Uganda, have demonstrated a steady growth in the number of mobile phone subscribers as well.
Figure 1 Mobile Cellular Subscriptions (per 100 people)
Source: World Bank Development Indicators, 2014
Because businesses also faced numerous obstacles in obtaining a landline, the equal magnitude of growth, for the adoption of mobile phones, has also been experienced among firms in the region. The World Bank’s Enterprise Survey Program (2007) in Kenya, demonstrated that businesses had to wait for 100 days to get a landline connection and to pay a bribe to the tune of US$ 117 (GDP US$ 780), and to deal with an interruption for 36 days in a year (Aker & Mbiti, 2010). As a result, businesses started using mobile phones, and by 2013, 95 percent in Kenya, 78 percent in Tanzania, 85 percent in Uganda, and 90 percent in Zambia had mobile phones in their business operations7. Samuel, Shah, and Hadingham (2005) use a direct survey method to examine the adoption rate of mobile phones and its impact on small scale firms. They studied the impact on firms especially with respect to supply chain management from South Africa and Egypt. They maintained that for small scale firms this adoption not only led to improved communication with suppliers but also resulted in increased profits and reduced time in financial transactions.
Additionally, the analysis of World Bank’s Enterprise Survey Program conducted in 2013
offered interesting insights on the usage of mobile phones by firms beyond financial transactions. The survey asked enterprises in Tanzania, Uganda, and Zambia a question regarding use of mobile phones for various business operations other than financial transactions. The survey did not ask this particular question in Kenya because of a high mobile subscription rate by firms to the tune of 99.14 percent in that country8. A detailed analysis of the question revealed that enterprises are more inclined to use mobile phones to attract new customers and to advertise their products than to offer special deals or recruit new employees (see Table 1). The analysis indicated that the use of mobile phones for peripheral business operations is also taking its roots.
7 The World Bank’s Enterprise Survey Program, 2013 8 The World Bank’s Enterprise Survey Program, 2007
0
20
40
60
80
2001 2002 2003 2004 2005 2006 2007 2008 2009 2010 2011 2012 2013
Kenya Tanzania Uganda Zambia
142
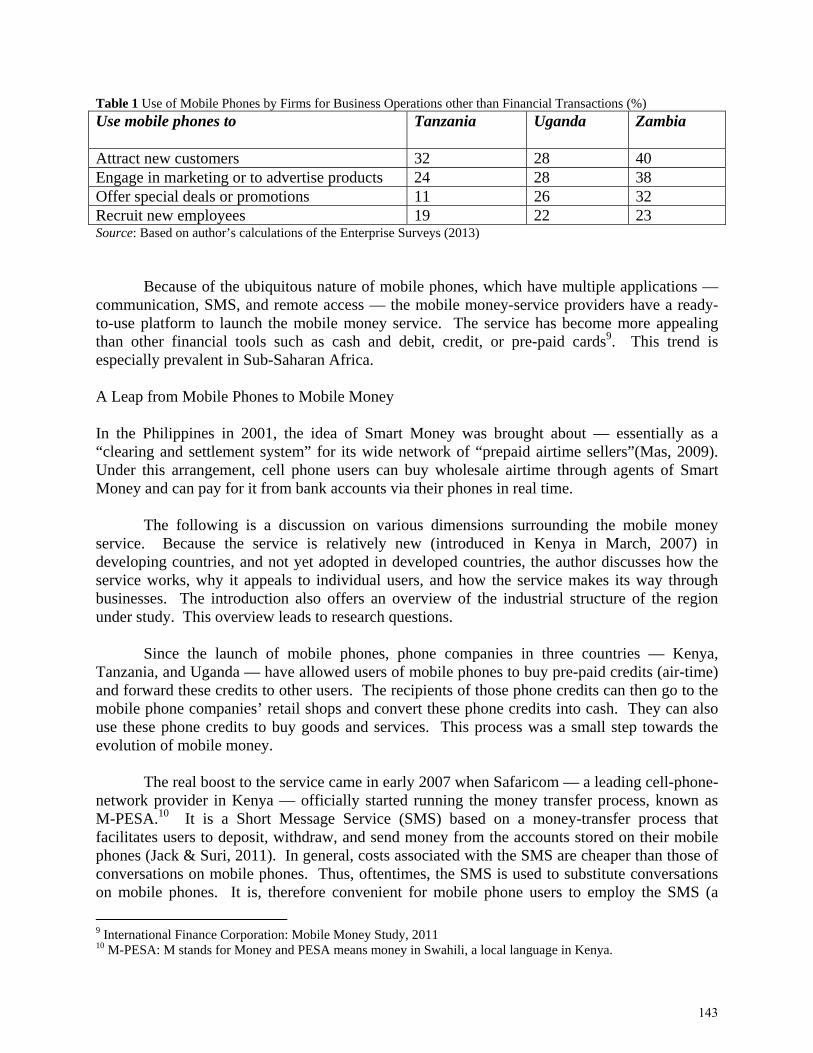
Table 1 Use of Mobile Phones by Firms for Business Operations other than Financial Transactions (%)
Use mobile phones to Tanzania Uganda Zambia
Attract new customers 32 28 40 Engage in marketing or to advertise products 24 28 38 Offer special deals or promotions 11 26 32 Recruit new employees 19 22 23 Source: Based on author’s calculations of the Enterprise Surveys (2013)
Because of the ubiquitous nature of mobile phones, which have multiple applications — communication, SMS, and remote access — the mobile money-service providers have a ready-to-use platform to launch the mobile money service. The service has become more appealing than other financial tools such as cash and debit, credit, or pre-paid cards9. This trend is especially prevalent in Sub-Saharan Africa. A Leap from Mobile Phones to Mobile Money In the Philippines in 2001, the idea of Smart Money was brought about — essentially as a “clearing and settlement system” for its wide network of “prepaid airtime sellers”(Mas, 2009). Under this arrangement, cell phone users can buy wholesale airtime through agents of Smart Money and can pay for it from bank accounts via their phones in real time.
The following is a discussion on various dimensions surrounding the mobile money service. Because the service is relatively new (introduced in Kenya in March, 2007) in developing countries, and not yet adopted in developed countries, the author discusses how the service works, why it appeals to individual users, and how the service makes its way through businesses. The introduction also offers an overview of the industrial structure of the region under study. This overview leads to research questions.
Since the launch of mobile phones, phone companies in three countries — Kenya,
Tanzania, and Uganda — have allowed users of mobile phones to buy pre-paid credits (air-time) and forward these credits to other users. The recipients of those phone credits can then go to the mobile phone companies’ retail shops and convert these phone credits into cash. They can also use these phone credits to buy goods and services. This process was a small step towards the evolution of mobile money.
The real boost to the service came in early 2007 when Safaricom — a leading cell-phone-
network provider in Kenya — officially started running the money transfer process, known as M-PESA.10 It is a Short Message Service (SMS) based on a money-transfer process that facilitates users to deposit, withdraw, and send money from the accounts stored on their mobile phones (Jack & Suri, 2011). In general, costs associated with the SMS are cheaper than those of conversations on mobile phones. Thus, oftentimes, the SMS is used to substitute conversations on mobile phones. It is, therefore convenient for mobile phone users to employ the SMS (a
9 International Finance Corporation: Mobile Money Study, 2011 10 M-PESA: M stands for Money and PESA means money in Swahili, a local language in Kenya.
143
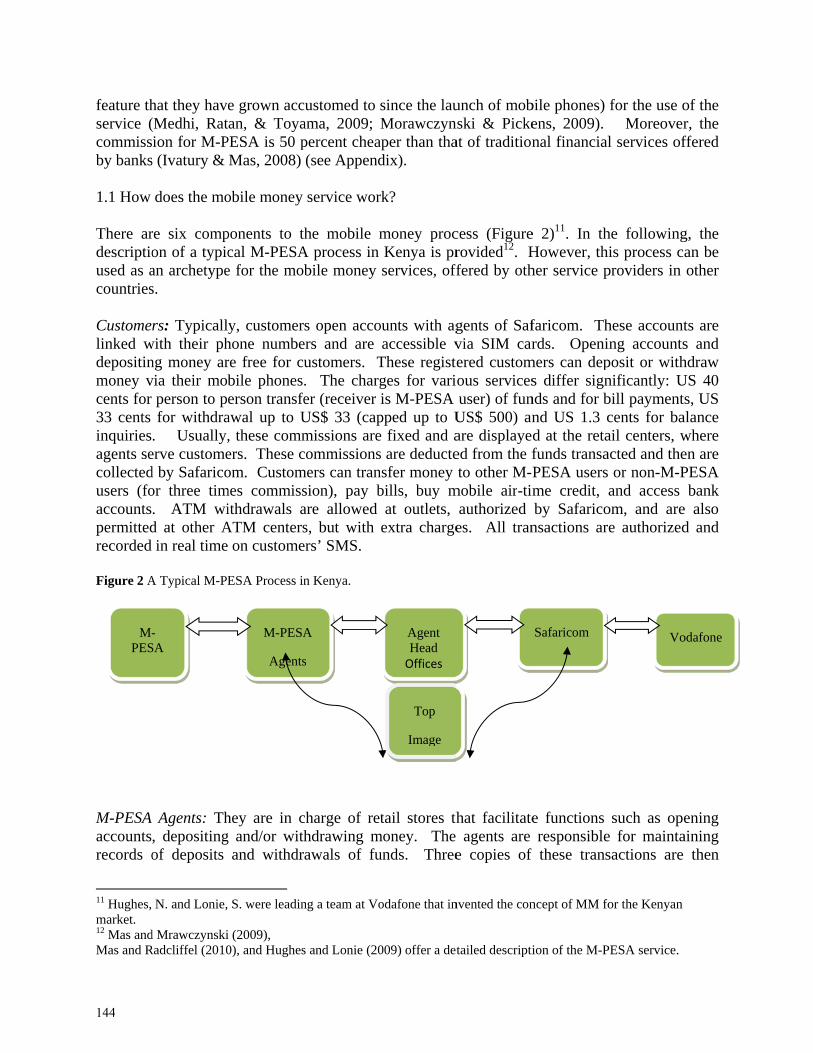
feature thservice (commissby banks 1.1 How There ardescriptioused as acountries Customelinked wdepositinmoney vcents for 33 cents inquiriesagents secollectedusers (foaccountspermittedrecorded Figure 2 A M-PESA accountsrecords o
11 Hughes, market. 12 Mas andMas and R
M-PES
hat they have(Medhi, Ration for M-P
s (Ivatury &
does the mo
re six compon of a typican archetypes.
rs: Typicallwith their phng money arvia their mob
person to pfor withdra
. Usually,erve customed by Safaricoor three tim. ATM wid at other Ain real time
A Typical M-PE
Agents: Th, depositingof deposits
N. and Lonie,
d MrawczynskiRadcliffel (2010
-SA
e grown accan, & Toya
PESA is 50 pMas, 2008)
obile money
ponents to thcal M-PESAe for the mob
y, customerhone numbere free for cubile phoneserson transfe
awal up to U, these commers. These com. Custom
mes commissithdrawals a
ATM centerson custome
ESA Process in
hey are in cg and/or with
and withdr
S. were leadin
i (2009), 0), and Hughes
M-PESA
Agents
customed to ama, 2009; percent chea(see Append
service wor
he mobile mA process in bile money
s open accoers and are ustomers. T. The charg
fer (receiver US$ 33 (capmissions arecommissions
mers can transion), pay bare allowed s, but with ers’ SMS.
n Kenya.
charge of rethdrawing mawals of fu
ng a team at Vo
s and Lonie (20
A
s
since the lauMorawczyn
aper than thadix).
rk?
money procKenya is prservices, off
ounts with agaccessible v
These registeges for variis M-PESA
pped up to Ue fixed and as are deductensfer money bills, buy m
at outlets, extra charge
tail stores thmoney. The unds. Three
odafone that in
009) offer a det
Agent Head Offices
Top
Image
unch of mobnski & Pickeat of tradition
cess (Figurerovided12. H
ffered by oth
gents of Safvia SIM carered customous servicesuser) of fun
US$ 500) anare displayeed from the fto other M-P
mobile air-timauthorized es. All tran
hat facilitate agents are e copies of
nvented the con
tailed descripti
bile phones) ens, 2009). nal financial
e 2)11. In thHowever, thher service p
faricom. Thrds. Openi
mers can deps differ sign
nds and for bnd US 1.3 cd at the retafunds transaPESA usersme credit, by Safarico
nsactions ar
e functions responsible
f these trans
ncept of MM fo
ion of the M-P
Safaricom
for the use o Moreoverl services of
he followingis process ca
providers in
hese accounting accountsposit or withnificantly: Ubill paymentcents for baail centers, wacted and the or non-M-Pand access
om, and aree authorized
such as opee for maintasactions are
for the Kenyan
PESA service.
Vo
of the r, the ffered
g, the an be other
ts are s and hdraw US 40 s, US
alance where en are PESA
bank e also d and
ening aining
then
odafone
144
recorded in a log book and signed by the respective customers. The first copy of that transaction stays with the agent; the second goes to the store’s master agent (the next person in the process), and the last copy goes to Safaricom. All this information, with the exception of the signature, is also sent via SMS to customers, and captured electronically by Safaricom. Agent Head Offices: These are head agents or master agents who provide liquidity to agents of retail shops. Their main responsibility is to buy and sell M-PESA balances from Safaricom, to make funds available to retail agents, thereby maintaining liquidity in the process. They also collect commission from Safaricom and distribute them amongst agents. Usually, out of these commissions, 30 percent is retained by these head agents and the remaining 70 percent is distributed among the retail agents. Safaricom: The Company has a twofold responsibility: 1. paying commission to agents for each deposit or withdrawals of funds, and 2. depositing money, equivalent to customer-accounts’ balances, in pooled accounts with three government-regulated banks. Because account balances of the service do not receive any interest, the interest accumulated on these pooled accounts is transferred to a not-for-profit trust that is controlled by the company. Vodafone: The parent company’s responsibility is to securely maintain the accounts of customers, on servers that are owned by Vodafone itself. Top Image: It is an outside agency, appointed by Safaricom to evaluate, train, and supervise agents of the retail shops. Usually, this agency visits retail agents, at least once a month to evaluate their liquidity positions and their overall functioning. 1.2 Why is mobile money appealing to individual users? Due to lack of employment opportunities in rural areas, most of the workers migrate to urban areas, leaving their families behind in villages. Before the launch of mobile money, oftentimes, these rural-urban migrant workers used to give money to family members and friends (who traveled back home), and requested that each pass the money onto immediate family. This method of sending money back home was convenient. However, this method had serious drawbacks. Stealing some of the money or possibly losing it along the way, created some serious drawbacks. These carriers also demanded commission and travelling expenses that usually amounted to more than commissions paid on mobile money (Morawczynski, 2009).
Additionally, money was transferred to villagers via buses and cab companies. Unfortunately, this method proved risky and often the money never reached its final destination. In Tanzania, bus companies charged 10 percent commission besides the risk of theft. For example, the cost of sending US$15 from Nairobi to the Western provinces by M-PESA in 2008 was two fifth the post office rate and one fifth the cost of sending by bus (Heyer & Mas, 2009). Post offices also offered money transfer services and had a considerable presence in rural areas. However, people complained about their inefficiency and illiquidity (Mas, 2009). Western Union was a formidable option for remittances and although, this method may be secure, it is expensive and has a fewer geographic footprints in rural areas (Aker & Mbiti, 2010).
145

Mobile money has therefore emerged as a viable option for a money-transfer service that is immensely useful to rural-urban migrants (Mas and Morawczynski (2009), Mas (2009), (Demombynes & Thegeya, 2012), and (Gupta, 2013)). Because these workers own land (1 to 5 acres) in villages which is, for the most part, used in cultivating crops for domestic consumption, the families of these workers live in villages to take care of the land. In addition, majority of these workers value their ancestral lands in villages and most of them would like to go back, after retirement and even make it their final resting place ((Mas and Morawczynski (2009) and Mas (2009)). Consequently, families of these migrant workers depend upon money remitted back home, ranging from 50-100 percent of the recipients’ incomes (Morawczynski, 2009).
Heyer and Mas (2009) maintain that people use the service because the pervasive nature of retail agents increases convenience and reduces opportunity costs (as in travel time to the retail agent and eliminates long lines), an important factor for the poor. Also, the electronic nature of transactions enhances safety and offers real-time transactions (Demombynes & Thegeya, 2012; Plyler, Haas, & Ngarajan, 2010). 1.3 The Mobile Money Service and Businesses The mobile money service is also making its way through businesses. The application of the service for businesses is mostly for receiving money from customers, and paying bills to suppliers. In Kenya, businesses in informal sectors use mobile money to pay salaries, in Tanzania, rural retail trades use mobile money to send money to urban wholesalers, and in Zambia, mobile money service is used to support payments among major wholesale and retail networks (Heyer & Mas, 2009).
Based on the analysis of the World Bank’s Enterprise Survey Program data set (2013), responses for the usage of the service by firms are indicated (Table 2). Kenya tops the list on two fronts: use of the service for financial transactions and for customers, whilst, Uganda tops the list for the most use of the service for suppliers, and Zambia falls to the bottom of the list in nearly all three categories.
Table 2 Use of mobile money by firms (%) Kenya Tanzania Uganda Zambia Use mobile money for financial transactions 50 40 46 3 Use mobile money for suppliers 40 42 50 44 Use mobile money for customers 72 54 66 40 Source: Based on author’s calculations of the Enterprise Surveys (2013)
The survey questioned each firm separately on the many reasons for using the service. The analysis of data collected from the survey, offers some luring insights as to why these businesses use the mobile money service. The firms surveyed were given six options to choose from for the main reason for using the service. The following bar chart (Figure 3) presents the reasons for these four countries. The main reason among all four countries, for using the service is a reduction in time spent on financial transactions, wherein 52 percent of firms in Tanzania, 43 percent in Kenya, 36 percent in Uganda, and 40 percent in Zambia give preference to this reason.
146
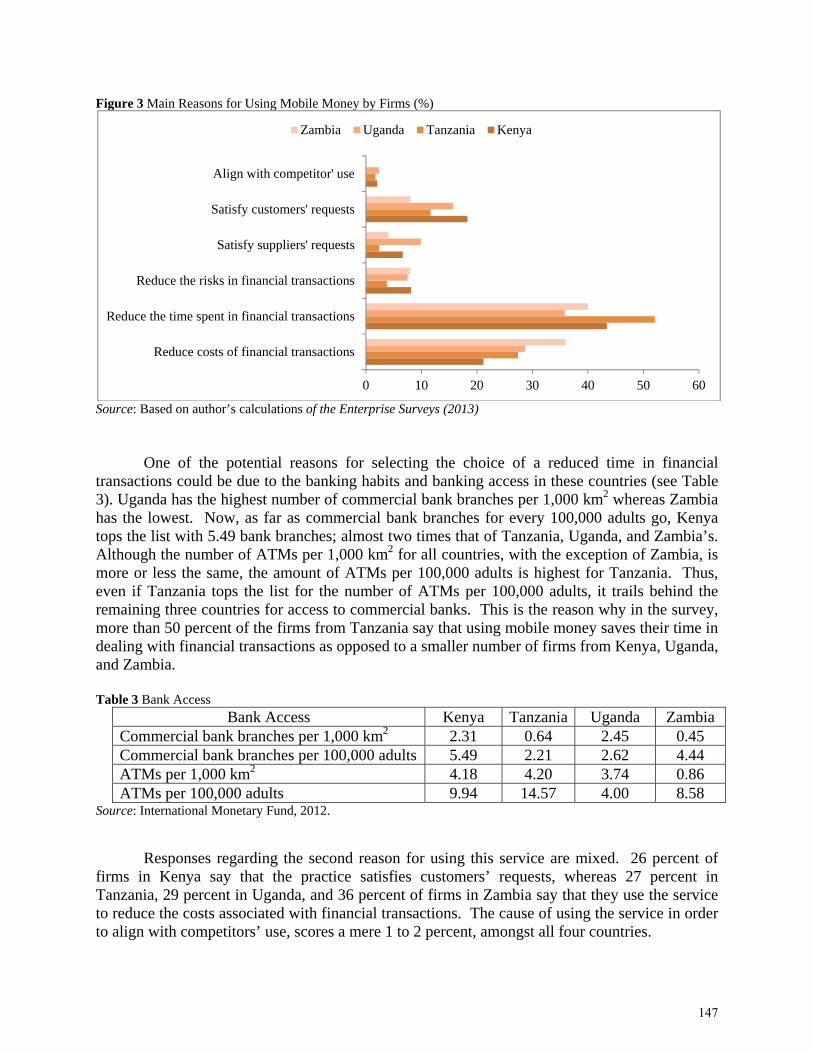
Figure 3 Main Reasons for Using Mobile Money by Firms (%)
Source: Based on author’s calculations of the Enterprise Surveys (2013)
One of the potential reasons for selecting the choice of a reduced time in financial transactions could be due to the banking habits and banking access in these countries (see Table 3). Uganda has the highest number of commercial bank branches per 1,000 km2 whereas Zambia has the lowest. Now, as far as commercial bank branches for every 100,000 adults go, Kenya tops the list with 5.49 bank branches; almost two times that of Tanzania, Uganda, and Zambia’s. Although the number of ATMs per 1,000 km2 for all countries, with the exception of Zambia, is more or less the same, the amount of ATMs per 100,000 adults is highest for Tanzania. Thus, even if Tanzania tops the list for the number of ATMs per 100,000 adults, it trails behind the remaining three countries for access to commercial banks. This is the reason why in the survey, more than 50 percent of the firms from Tanzania say that using mobile money saves their time in dealing with financial transactions as opposed to a smaller number of firms from Kenya, Uganda, and Zambia.
Table 3 Bank Access
Bank Access Kenya Tanzania Uganda Zambia Commercial bank branches per 1,000 km2 2.31 0.64 2.45 0.45 Commercial bank branches per 100,000 adults 5.49 2.21 2.62 4.44 ATMs per 1,000 km2 4.18 4.20 3.74 0.86 ATMs per 100,000 adults 9.94 14.57 4.00 8.58
Source: International Monetary Fund, 2012.
Responses regarding the second reason for using this service are mixed. 26 percent of firms in Kenya say that the practice satisfies customers’ requests, whereas 27 percent in Tanzania, 29 percent in Uganda, and 36 percent of firms in Zambia say that they use the service to reduce the costs associated with financial transactions. The cause of using the service in order to align with competitors’ use, scores a mere 1 to 2 percent, amongst all four countries.
0 10 20 30 40 50 60
Reduce costs of financial transactions
Reduce the time spent in financial transactions
Reduce the risks in financial transactions
Satisfy suppliers' requests
Satisfy customers' requests
Align with competitor' use
Zambia Uganda Tanzania Kenya
147

A field study was commissioned by the Swedish International Development Agency
(SIDA) in Tanzania to study the role played by the service in micro and small firms. Although cash is king in the country, firms use the service if there is trust between senders and recipients. The use of the service is usually initiated by sellers. If some firms use mobile money, then the other firms in the same location start using it. The acceptance of the service is more predominant if transactions are for frequent and small goods including standardized goods, avoiding the problem of goods returned. Firms also report having more liquidity, increased efficiency, and an improvement in the growth of the firm. Finally, firms report practicing the Just in Time (JIT) technique for inventory management, since the adoption of the service.
1.4 The Industrial Structure An understanding of the industrial structure in Sub-Saharan Africa will help us discern the use of the service among business communities. The Structural Adjustment Policies, which needed to reduce government spending and size of the public sector, in the 1980s and 1990s engineered by International Monetary Fund and other global-financial-aid agencies led to the growth of informal sector in the Sub-Saharan Africa region. As a result of this, people who lost their jobs due to downsizing in the government run businesses turned to informal sector for employment13. Typically, these informal firms are unregistered, are run by owners, and are either micro or small enterprises in nature14. Because a majority of new jobs are created in the informal sector, the relative size of this sector is ever increasing (see annexure for the number of small, medium, and large firms in the sample).
Thus, the region has a large number of micro and small firms, a fewer number of medium-sized firms, and a small number of large firms, however, few micro and small firms grow to transform into medium or large-sized firms (Altenburg & von Drachenfels, 2008). Typically, these micro and small firms belong to the informal sector of the economy. Schneider (2004) estimates a share of the informal sector in 145 economies. His estimation shows that in Kenya 36 percent, in Tanzania 60.2 percent, in Uganda 45.4 percent, and in Zambia 50.8 percent of the economy represents the informal sector as a percentage of the official GDP.
The magnitude of employment also supports the fact that the informal sector comprising
of micro and small firms dominates the region. There are some studies that estimate the percentage share in the form of employment of the economy in the informal sector for agriculture and non-agriculture sectors. United Nations Development Program’s Commission on the Private Sector and Development (2004) estimates that a share of non-agricultural labor that is employed in the informal sector accounts for 80 percent. In a country-specific study for Kenya, Orwa (2007) maintains that self-employment (informal employment) accounted for over four million individuals in 2000, and that number rose to over 5 million individuals in just two years in 2002; and this increase represented more than 74 percent of the total employment for that period.
13 Global Financial Development and Financial Inclusion Report (2014), World Bank, Washington DC 14 The World Bank defines a micro firm that has less than 5 employees, a small firm that has in between 5 and 19 employees, a medium firm that has in between 20 and 99 employees, and a large firm that has more than 99 employees.
148

Some studies offer explanation for the growth of informal sector. Palmade (2005) claimed that firms remain informal because the time, costs, and efforts of registering with authorities are prohibitively high for firms in the informal sector. In his study, which focuses on the reasons behind a growth of the informal sector in Southern and Eastern African economies, Mead (1994) maintained that usually, the less fortunate people, who lack employment opportunities, get pushed into self-employment, and thus, help shape the informal sector.
This notion of “pushed self-employment” has also been demonstrated by various
countries in the Sub-Saharan African region. Nelson and De Bruijn (2005), who studied the informal sector in Tanzania, claim that the ever increasing size of this sector is due to lack of employment opportunities in the formal sector. Also, Sandefur (2006) studied small and micro firms in the manufacturing sector from Ghana, which showed a growth rate of almost 33 percent from 1987 to 2003, to confirm the increasing level of informal self-employment in the economy. Finally, Bigsten (2004) claim that usually, the business owners in the informal sector in Kenya lack experience and education. Thus, they are not in a position to compete with the firms in the formal sector nor do they find jobs in the formal sector. Hence, these individuals are left with the only option of setting up businesses in the informal sector as a means to survival.
These micro and small firms remain the same even after a considerable amount of time.
Sandefur (2006) examined Ghanaian census data of employment in manufacturing firms from 1987 through 2003. His analysis was based on the number of workers employed by firms, a proxy to a size of a firm. He concluded that in these two periods, few micro and small firms demonstrated sizeable increase in their operations in general, and firms did not make a transition from micro or small enterprises to large firms in particular.
One more characteristic of the industrial sector in Sub-Saharan Africa is anemic inter-
firm linkages in the form of economic exchanges between the formal and informal economy. Very few enterprises are integrated into “value chains” and those chains are short (Altenburg & von Drachenfels, 2008). In his case studies on Kenya and Tanzania, Lawrence (2005) demonstrated that “linkages between the small scale and large scale sectors are weak, and backward linkages are particularly weak between small scale manufacturing and agriculture.” Also, Yumkella and Vinanchiarachi (2003) confirm that in the Sub-Saharan Africa region, small and micro firms are not in a position to supply semi-finished products to large firms because these micro and small firms are not capable of fulfilling the requirements of large firms in terms of quality and uninterrupted supply of products. Finally, in a country-specific study on Uganda, Kappel, Lay, and Steiner (2004) studied over 250 micro and small firms that belonged to 10 sectors and were located in urban areas. They observe that a majority of the firms do not have any economic exchanges with other firms and that 80 percent of these firms had never supplied any products to medium or large firms.
Additionally, firms in the Sub-Saharan African region lacked export activities as part of
their total sales. In 1980s, the countries in the region adopted liberalization and trade policy reforms. However, a majority of countries experienced an increase in imports without any formidable increase in exports (Ackah & Morrissey, 2005). The region experienced high growth rates in the early 2000, partly because of increased commodity prices. However, the global share of merchandise export was less than 3 percent, expected the export activity to severe exposed to
149

volatility of goods prices and exchange rates around the globe (Altenburg & von Drachenfels, 2008). Finally, more than the firms under this study, more than 80 percent of the firms are not engaged in any kind of export — direct or indirect — activities.
The rest of the paper is organized as follows. Section 2 discusses the literature on the
usage of mobile money at individual and at the business levels. It also highlights contributions of the paper. Section 3 discusses the data set and the econometric methodology used in the paper. Section 4 shows results of the study and the last section conclude the paper with a few policy recommendations for the service providers.
2. LITERATURE REVIEW For the most part, the literature on mobile money focuses on the benefits of the same for individual users who belong to varied backgrounds, ranging from geographical locations, demographics, income and educational levels, banking habits, and banking access. Nevertheless, it is critical to know the success stories of these individual users because some of them could become entrepreneurs or business owners, making them potential users of the service in their enterprises. Moreover, introduction of new products in the service — integration of mobile money and the formal banking service — contributed to increase the customer base for the same. There are various reasons behind the proliferation of mobile money at the individual level. Heyer and Mas (2009) maintained that people use the service because of its ubiquitous nature, which increased convenience and reduced opportunity costs (travel time to the retail agent and long lines), a key element for the less fortunate people in the society. Moreover, the electronic nature of these transactions enhanced safety and offered real-time monetary exchanges (Demombynes & Thegeya, 2012; Plyler et al., 2010). Finally, the service users could pay for unforeseen health care costs without sacrificing for other needs, such as food (Suri, 2012).
The use of mobile money is evident even during the time of chaotic situations. When Morawczynski (2009) conducted a survey, social unrest erupted in Kenya, due to the disputed presidential elections of Dec, 2007. Although a majority of banks and micro financial institutions were closed during the violence, Safaricom’s M-PESA outlets were functioning, empowering users to access their money and escape to their villages, thus, surviving the social disturbance. The survey indicated that urban agents saw the number of customers registering for the service double or even triple, and the experienced urban migrants made withdrawals rather than deposits, and that agents served more than 500 customers daily. Mobile money could also be used during the time of natural calamities. In their study on Rwanda, Blumenstock, Eagle, and Fafchamps (2012) showed that there was a significant increase in airtime transfer to people in the Lake Kivu area, a region that was affected by an earthquake in 2008, thus demonstrating that the service has the potential for allowing those affected by natural calamities to receive financial assistance.
However, unlike early individual cell phone and mobile money users, early mobile
money users in case of businesses were micro and small enterprises. After interviewing 75 firms in Kenya, Mas and Ng'weno (2012) claimed that usually large firms in the formal sector are less likely to use the service than small firms in the informal sector. They argue that reasons for not
150

using the service by large firms are twofold namely: 1. The mobile money transactions do not get reflected in the computer systems, therefore employees from the accounting department have to enter each transaction manually, a process that increases time, errors, and frauds. 2. Transfer of funds from mobile money account to a firm’s normal account took four days, whereas checks took two days to get converted into cash.
Kendall, Lyon, and Higgins (2012) study more than 800 small and medium enterprises from four urban and semi-urban locations in Kenya and their study concluded that the service was picking up in the small and medium enterprises. Their survey shows that 99 percent of the firms had at least one active service account and that 80 percent of them use mobile money at least once a week. That number for individual users was one, in two weeks. In addition, 48 percent respondents said that their customers initiate the payment by the service, resulting in a cascading effect for the service usage. The customers claimed they use the service because it is convenient for frequent payments that require traveling long distances. Also, they did not have to travel to unsafe areas to make or receive payments. They also avoided travel to unsafe areas to make or receive payments. Additionally, they do not have to leave their work during the business hours in order to take care of payments or receipts.
There are numerous obstacles that keep individuals and businesses from joining the formal banking system. Comninos, Esselaar, Ndiwalana, and Stork (2009) used “research ICT Africa” (2007/08) to study the responses of individuals with respect to their banking access. They maintain that because a majority people from Africa are employed in the informal sector (60 percent in Kenya, Tanzania, and Uganda, and 70 percent in Zambia), so they do not have regular income to open bank accounts or collateral for loans, which is a prime condition necessary to qualifying the formal banking system. Additionally, most employed people opened bank accounts only if it was mandated by their employers. 30 percent in Kenya and Uganda, and 20 percent in Tanzania and Zambia said they did not require bank accounts.
A key feature of the service users was their banking habits. In its early stage, the mobile
money service was not technically viewed as a banking system because it did not offer interest on mobile money account balances (a major concern, especially in countries where inflation is always on the rise), did not facilitate access to credit, and did not insure money stored in mobile money accounts (Aker & Mbiti, 2010; Jack & Suri, 2011). Thus, the storage of money in the form of mobile money could be viewed as a sort of “rudimentary bank account.” Comninos et al. (2009) argued that although mobile money has gained popularity in the African region, the existing services are mostly value-added features, complimentary to the existing, formal banking setup. Users of the service view the service as a safe electronic store for money.
There is convincing evidence in the literature that early mobile money users were banked.
For example, in a household survey from Kenya, Pulver (2009) found that 70 percent of M-PESA users are banked as opposed to 40 percent whereas among non M-PESA users 40 percent are banked. Moreover, survey findings by Ndiwalana, Morawczynki, and Popov (2010) from Uganda showed that 72.6% respondents who used mobile money and were employed report to have access to financial services via personal accounts in banks. However, the authors argue that this result was because of the sample have had more affluent respondents than the average people in the country.
151
Enterprises find the service not only convenient but also appealing when integrated with
the formal banking system. Mbogo (2010) used the Theory of Technology Acceptance Model to rank the preferences given by over 400 micro business owners in Kenya, for using the service in their firms. The author cites convenience, support from service providers, and service accessibility as main reasons for mobile money usage in their businesses. In their field survey of 87 small firms from Iringa, Tanzania in 2012, Mawona and Mpogole (2013) claimed that business owners welcomed the service, especially when connected to bank accounts. Almost, 65 percent of the respondents said that they used mobile money either for customers or suppliers, but only 20 percent of the respondents’ claimed to use mobile money for saving money. Additionally, they choose the service because it is accessible, convenient, had lower transaction costs, and high security.
A year into its launch, Safaricom in Kenya began exploring various avenues to increase
the number of products and customers. In early 2008, Safaricom partnered with PesaPoint, one of the leading ATM service providers in Kenya. PesaPoint had more than 110 ATMs scattered, in all eight provinces of the country. These ATM centers offer many advantages to mobile money users: 1. Mobile money users did not need bank accounts to use ATMs. 2. Unlike mobile money agents, ATMs were accessible at night. 3. ATMs carried more cash than agents, and 4. ATMs transact in large amounts (up to US$ 500) whereas the commission structure of agents discourage them to deal with large transactions (Mas & Morawczynski, 2009). Thus, one can argue that when mobile money users employ the ATMs, they get a flavor of banking services, thus getting them one step closer to the formal banking system.
In Kenya, in Feb 2009, Zain, a mobile network company introduced an innovative mobile
money service, taking it to a whole new level. It introduced Zap (oftentimes, establishing its stores next to M-PESA) with the slogan “mobile wallet” (Mas & Morawczynski, 2009). Its services were linked to bank accounts, making it one of the reasons behind its growth rates. Zap’s initial growth rate (200 K since its launch) was almost the same as M-PESA’s (260 K in first three months). This growth rate for Zap was an indication that users viewed the service solely as means of financial transactions that they like to use coupled with their bank accounts. Additionally, Zap’s growth rate is an indication that mobile money users are more likely to have bank accounts, proving mobile money compliments the banking system.
The mobile money service has continued to evolve, offering more products than ever
before. Beginning in 2013, Safaricom’s “pay bill” option allowed users to deposit money into savings, insurance, pension, and investment accounts. Some of the popular service providers were Psa Pap offered by Family Bank, Pata Cash offered by Kenya Post Office Savings Bank, KCB Connect offered by Kenya Commercial Bank, and Faulu and SMEP offered by Safaricom (Wanyonyi & Bwisa, 2013).
Based on the mobile money usage by enterprises, it is clear that small firms are more
likely to use the service than large ones. Also, enterprises are more likely to use the service if they have a long term business association with their suppliers or customers, making the age of the firms a key element in the adoption of the service. Additionally, firms in the service sector deal in smaller amounts of money so they are more likely to use the service than firms from other
152
sectors. The first three hypotheses stem from these three characteristics of the firms. Moreover, the literature review of individual users show convincing evidence that the adopters of the service are banked. Thus, it led the author to investigate the characteristics of businesses that use mobile money. To answer this question, the author developed the following hypothesis and empirical models. 2.1 Contribution of the Paper Thus far, the success stories of mobile money usage revolve mostly around individual users comes from many different backgrounds, each one varying in socio-economic class, educational level, banking habits/access, and location. Although there are papers that examine the usage of mobile money by firms, these studies have notable shortcomings. First, sample sizes are as small as 40, making them an inaccurate representatives of the population. Additionally, geographical areas for field studies are often limited to a municipality, questioning the application of their findings is universal. Furthermore, independent surveys do not compartmentalize sectors; consequently, the results of these surveys fail to represent the respective country’s economy. More importantly, not one of these studies included a detailed empirical analysis. In this paper, the author addresses all the mentioned short comings, making the study an ideal representative of the population — a literary gap this paper seeks to bridge. The exposition not only draws on the very first empirical research for the use of this service by firms from Sub-Saharan African countries but also uses the data — which have observations of more than 2700 firms — covers four countries in Sub-Saharan Africa, and includes all sectors in those economies.
To the author’s knowledge, this is the first paper that uses a current, rich, and comprehensive data set from the World Bank Enterprise Surveys Program, 2013, making it timely and current. This paper contributes to the existing body of literature in three ways: 1. establishes a relationship between firms that use mobile money and their characteristics, 2. analyses whether the use of mobile money is more prevalent at supplier’s or customer’s ends and 3. studies the relationship for businesses among four Sub-Saharan African countries—Kenya, Tanzania, Uganda and Zambia, thus making it a comprehensive study.
3. THE DATA SET AND ECONOMETRIC METHODOLOGY The World Bank has been instrumental in boosting business climate for economic development, especially in developing countries. It promotes healthy business environment in order to achieve an increase in employment opportunities and investments. To promote this agenda, the World Banks has undertaken an organized endeavor of collecting firm-level data across countries around the globe. The Enterprise Surveys Program is an ongoing World Bank’s program that collects data with respect to enterprises’ experiences and impressions about the business environment in which they operate, survive, and flourish. Starting from 2005, the program has been using a standardized methodology for administering a questionnaire for sampling, implementation, and quality control. Currently, the program covers more than 130,000 enterprises in 125 countries, most of which are client-countries of the World Bank. Because the
153
survey program facilitates comparison across countries and time, it helps researchers to formulate policy recommendations for improvement in business environment15.
The sample of the program contains nonagricultural-formal firms. The program strongly focuses on generating panel data, a process that facilitates researchers to study firms over a long period of horizon. It encompasses the information about enterprises with respect to firm characteristics, firm performance, and business environment. The anonymous raw data sets are made available to researchers on the web site of the program. The firms in the sample belong to all three sectors in the economy — manufacturing, retail, and services. The construction, transportation, and communication sectors are also part of the sample. However, agriculture, extractive industries, and fully government-owned firms are not incorporated in the sample. Also, only formal firms, which are registered, are part of the sample.
A stratified random selection is used to draw samples. The standard strata for each
country are geographical location, sectors, and firm size. The stratification under geographical location is geared toward including representatives of the prime economic centers in a country. The stratification of the sectors is based up on the size of the economy, and the stratification of the firm size is small (5-19 employees), medium (20-99 employees), and large (100 or more employees). The questionnaire is translated into the local language of the surveyed country. Also, pretesting and pilot interviews are conducted before the main field work is undertaken, resulting in fewer measurement errors. Moreover, the questions are simple and direct, and participating firms are specifically noted about the anonymity and confidentiality of their responses.
A model uses a set of twelve specific questions on the usage of mobile money by
enterprises. The Survey on this particular set of questions begins by asking a question “does this establishment use mobile money for any of its financial transaction?” The Survey further asks the firms the reasons behind using the service (analysis of this question appears in Figure: 3). It also enquires whether the firms use mobile money to receive and to pay their customers and suppliers. Finally, it also provides the information about the annual percentage of payments and receipts transacted in the form of mobile money.
To study the characteristics of the firms that use mobile money, the model uses the
answer to the question — whether the firm uses mobile money for its financial transactions — as a dependent variable. To address these questions, the characteristics of the firms, such as sizes (small, medium, and large), age, export activities, banking habits and sectors (manufacturing, retail, and services) are taken into account. These variables are used extensively in the literature ((Rajan & Zingales, 1996) (Beck, Demirgüç-Kunt, & Singer, 2013) (G. R. Clarke, Cull, & Kisunko, 2012) (Asiedu, Kalonda-Kanyama, Ndikumana, & Nti-Addae, 2013; G. R. G. Clarke & Gosavi, 2013; Hansen & Rand, 2014)).
The variables are constructed as follows. The dependent variable is the mobile money
usage by firms for their financial transactions. This variable equals “1” if firms use the service for financial transactions and “0” otherwise. The independent variables are an array of firm-
15 For more detailed discussion on the data set visit the web site World Bank’s “Enterprise Surveys Program”.
154
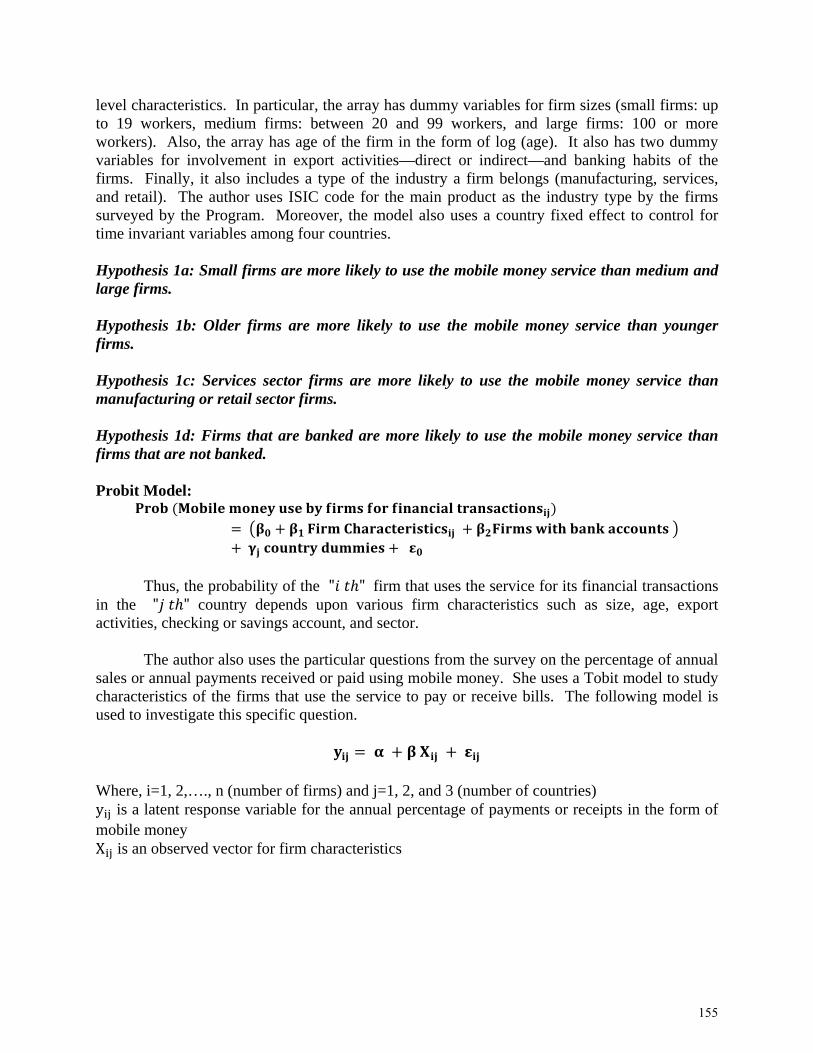
level characteristics. In particular, the array has dummy variables for firm sizes (small firms: up to 19 workers, medium firms: between 20 and 99 workers, and large firms: 100 or more workers). Also, the array has age of the firm in the form of log (age). It also has two dummy variables for involvement in export activities—direct or indirect—and banking habits of the firms. Finally, it also includes a type of the industry a firm belongs (manufacturing, services, and retail). The author uses ISIC code for the main product as the industry type by the firms surveyed by the Program. Moreover, the model also uses a country fixed effect to control for time invariant variables among four countries.
Hypothesis 1a: Small firms are more likely to use the mobile money service than medium and large firms. Hypothesis 1b: Older firms are more likely to use the mobile money service than younger firms. Hypothesis 1c: Services sector firms are more likely to use the mobile money service than manufacturing or retail sector firms. Hypothesis 1d: Firms that are banked are more likely to use the mobile money service than firms that are not banked. Probit Model:
Thus, the probability of the " " firm that uses the service for its financial transactions in the " " country depends upon various firm characteristics such as size, age, export activities, checking or savings account, and sector.
The author also uses the particular questions from the survey on the percentage of annual
sales or annual payments received or paid using mobile money. She uses a Tobit model to study characteristics of the firms that use the service to pay or receive bills. The following model is used to investigate this specific question.
Where, i=1, 2,…., n (number of firms) and j=1, 2, and 3 (number of countries) y is a latent response variable for the annual percentage of payments or receipts in the form of mobile money X is an observed vector for firm characteristics
155
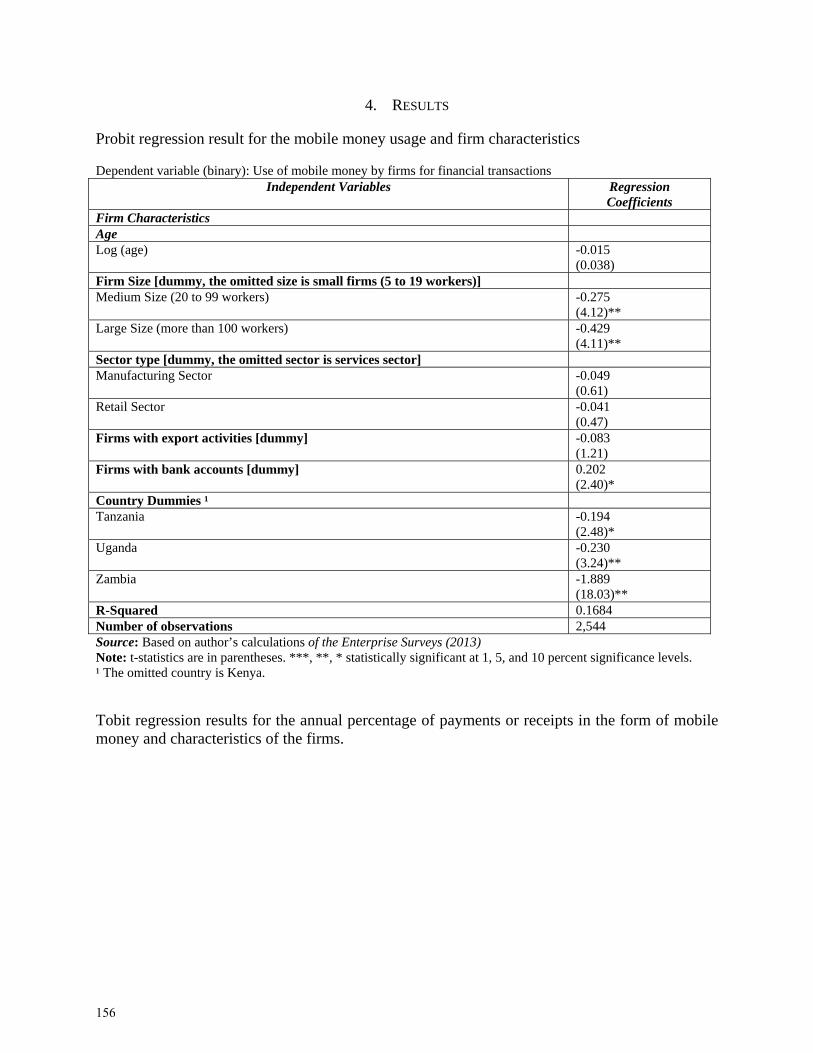
4. RESULTS Probit regression result for the mobile money usage and firm characteristics Dependent variable (binary): Use of mobile money by firms for financial transactions
Independent Variables Regression Coefficients
Firm Characteristics Age Log (age) -0.015
(0.038) Firm Size [dummy, the omitted size is small firms (5 to 19 workers)] Medium Size (20 to 99 workers) -0.275
(4.12)** Large Size (more than 100 workers) -0.429
(4.11)** Sector type [dummy, the omitted sector is services sector] Manufacturing Sector -0.049
(0.61) Retail Sector -0.041
(0.47) Firms with export activities [dummy] -0.083
(1.21) Firms with bank accounts [dummy] 0.202
(2.40)* Country Dummies ¹ Tanzania -0.194
(2.48)* Uganda -0.230
(3.24)** Zambia -1.889
(18.03)** R-Squared 0.1684 Number of observations 2,544 Source: Based on author’s calculations of the Enterprise Surveys (2013) Note: t-statistics are in parentheses. ***, **, * statistically significant at 1, 5, and 10 percent significance levels. ¹ The omitted country is Kenya. Tobit regression results for the annual percentage of payments or receipts in the form of mobile money and characteristics of the firms.
156
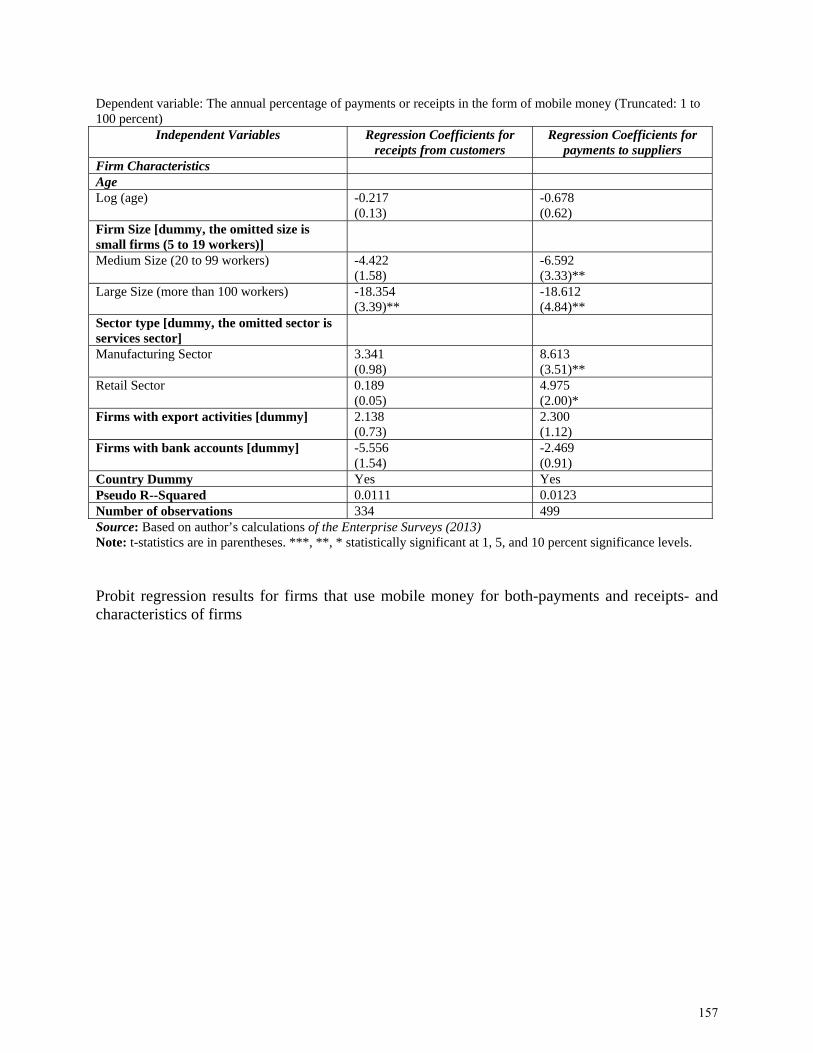
Dependent variable: The annual percentage of payments or receipts in the form of mobile money (Truncated: 1 to 100 percent)
Independent Variables Regression Coefficients for receipts from customers
Regression Coefficients for payments to suppliers
Firm Characteristics Age Log (age) -0.217
(0.13) -0.678 (0.62)
Firm Size [dummy, the omitted size is small firms (5 to 19 workers)]
Medium Size (20 to 99 workers) -4.422 (1.58)
-6.592 (3.33)**
Large Size (more than 100 workers) -18.354 (3.39)**
-18.612 (4.84)**
Sector type [dummy, the omitted sector is services sector]
Manufacturing Sector 3.341 (0.98)
8.613 (3.51)**
Retail Sector 0.189 (0.05)
4.975 (2.00)*
Firms with export activities [dummy] 2.138 (0.73)
2.300 (1.12)
Firms with bank accounts [dummy] -5.556 (1.54)
-2.469 (0.91)
Country Dummy Yes Yes Pseudo R--Squared 0.0111 0.0123 Number of observations 334 499 Source: Based on author’s calculations of the Enterprise Surveys (2013) Note: t-statistics are in parentheses. ***, **, * statistically significant at 1, 5, and 10 percent significance levels. Probit regression results for firms that use mobile money for both-payments and receipts- and characteristics of firms
157
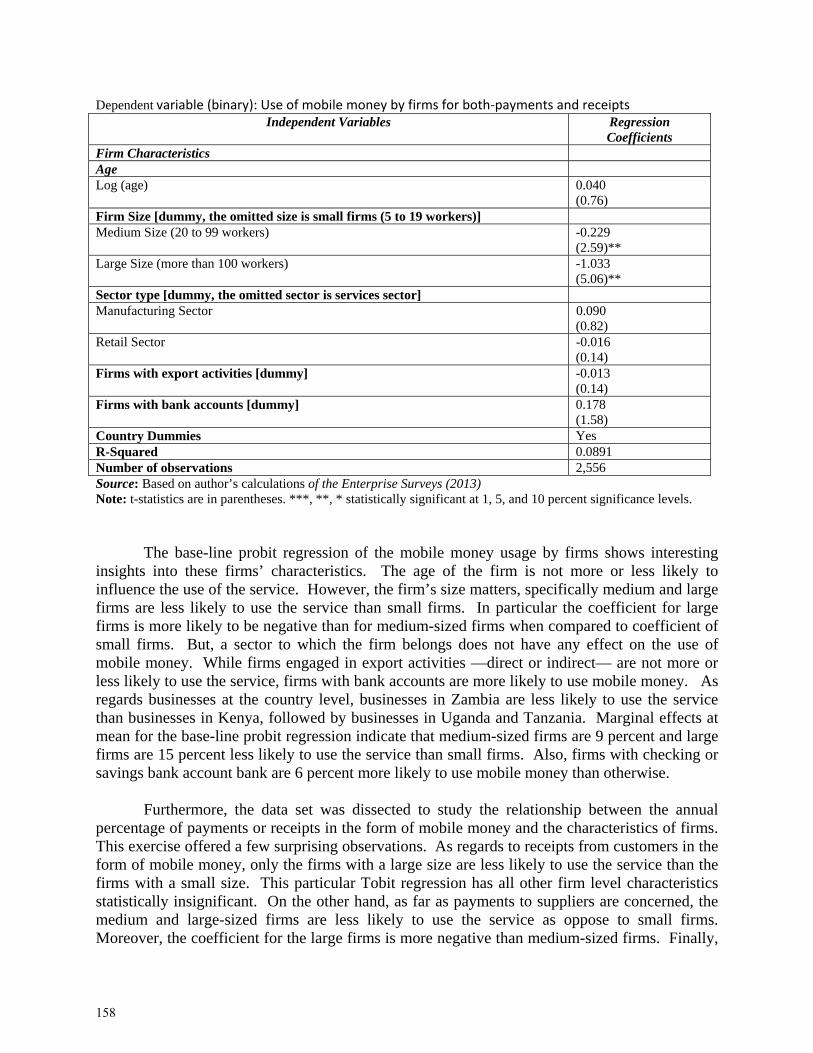
Dependent variable (binary): Use of mobile money by firms for both‐payments and receipts Independent Variables Regression
Coefficients Firm Characteristics Age Log (age) 0.040
(0.76) Firm Size [dummy, the omitted size is small firms (5 to 19 workers)] Medium Size (20 to 99 workers) -0.229
(2.59)** Large Size (more than 100 workers) -1.033
(5.06)** Sector type [dummy, the omitted sector is services sector] Manufacturing Sector 0.090
(0.82) Retail Sector -0.016
(0.14) Firms with export activities [dummy] -0.013
(0.14) Firms with bank accounts [dummy] 0.178
(1.58) Country Dummies Yes R-Squared 0.0891 Number of observations 2,556 Source: Based on author’s calculations of the Enterprise Surveys (2013) Note: t-statistics are in parentheses. ***, **, * statistically significant at 1, 5, and 10 percent significance levels.
The base-line probit regression of the mobile money usage by firms shows interesting insights into these firms’ characteristics. The age of the firm is not more or less likely to influence the use of the service. However, the firm’s size matters, specifically medium and large firms are less likely to use the service than small firms. In particular the coefficient for large firms is more likely to be negative than for medium-sized firms when compared to coefficient of small firms. But, a sector to which the firm belongs does not have any effect on the use of mobile money. While firms engaged in export activities —direct or indirect— are not more or less likely to use the service, firms with bank accounts are more likely to use mobile money. As regards businesses at the country level, businesses in Zambia are less likely to use the service than businesses in Kenya, followed by businesses in Uganda and Tanzania. Marginal effects at mean for the base-line probit regression indicate that medium-sized firms are 9 percent and large firms are 15 percent less likely to use the service than small firms. Also, firms with checking or savings bank account bank are 6 percent more likely to use mobile money than otherwise.
Furthermore, the data set was dissected to study the relationship between the annual
percentage of payments or receipts in the form of mobile money and the characteristics of firms. This exercise offered a few surprising observations. As regards to receipts from customers in the form of mobile money, only the firms with a large size are less likely to use the service than the firms with a small size. This particular Tobit regression has all other firm level characteristics statistically insignificant. On the other hand, as far as payments to suppliers are concerned, the medium and large-sized firms are less likely to use the service as oppose to small firms. Moreover, the coefficient for the large firms is more negative than medium-sized firms. Finally,
158
the sector to which the firm belongs has a positive coefficient. The coefficient for the manufacturing sector is more positive than the retail sector when compared with the services sector. These sector coefficients are statistically insignificant in the base line probit model. Moreover, the probit regression results for firms that use mobile money for both-payments and receipts- and characteristics of firms indicate that those firms’ size matters.
One of the potential reasons for not using the service by medium and large firms is the
functional characteristics of the service such as, a cap on the money transacted, time needed to see the money transferred, and a back-up service for records by service providers. Usually, medium and large businesses have monetary value of financial transactions more than the cap set by service providers. They have accounting departments to maintain records of financial transactions. Therefore, these shortcomings of the service may discourage the above-mentioned firms to use mobile money. Furthermore, as the service adds more features to attract new customers, mobile money accounts are connected to the bank accounts. Businesses may find it extremely convenient to use the service in conjunction with the bank account. Finally, because mobile money is a recent phenomenon in Zambia, businesses in that country are least likely to use the service than the businesses in Kenya.
5. CONCLUSIONS AND POLICY RECOMMENDATIONS
The paper uses the World Bank’s Enterprise Survey Program data set from 2013 to study the characteristics of the firms that use mobile money services in four Sub-Saharan African countries. The Survey was conducted in Kenya, Tanzania, Uganda, and Zambia and consisted of almost 3000 firms in all sectors of the economy, thus making its analysis universal to the African region. The author uses the probit model to study characteristics of firms that use the service. The results indicate that medium and large firms are less likely to use the service than small firms and firms that use the service are more likely to have bank accounts. However, firm level characteristics such as; age, sector, and export activities are not more or less likely to make the firms use the service. Moreover, firms in Zambia are less likely to use mobile money followed by firms in Uganda and Tanzania than firms in Kenya.
However, when the data are dissected for the annual percentage of payments or receipts in the form of mobile money and characteristics of the firms, the results are somewhat different than the base line probit model results. The results of the Tobit model for receipts from customers indicate that only large firms are more likely to use the service than small firms. On the other hand, the results of the Tobit model for payments to suppliers show that the firm’s size and sector do play a role.
The policy recommendations for the providers of mobile money stem from a few problems associated with the service. Mas and Ng'weno (2012) cites a few short comings associated with the service. These short comings are 1. The mobile money transactions do not get reproduced in the computer systems of businesses, therefore employees from the accounting departments have to enter each transaction manually, a process that increases time, errors, and frauds. 2. Transfer of funds from mobile money account to a firm’s normal account takes four days, whereas checks take two days to get converted into cash, 3. System delays and downtime
159

at Safaricom make it harder for customers who wait until last minute to make a payment, 4. Corporate financial transactions have a lower and upper limit on transferring funds from firms’ mobile money accounts to bank accounts, 5. Safaricom keeps the records of mobile money transfers for businesses only up to six months, and 6. Businesses like to see a hard copy of payment.
The providers of mobile money have tremendous potential to serve the business
community, making the service a win-win proposition for both parties involved. To this end, the author provides a few policy recommendations for mobile money service providers. One of the potential reasons for not using the service by medium and large firms can be the cap (US$ 500) on the amount of money one can transfer in one transaction. Generally, medium and large businesses have transactions that are more than the cap of US$ 500 per transaction. Thus, if the service providers increase the limit on monetary transactions, they may experience an increase in their customer base.
Also, service providers keep the record of monetary transactions only for six months. This also acts as a major problem for accounting departments in medium and large firms. Usually, accounts in medium and large firms are audited; thus these firms need records of all financial transactions for a given financial year. Therefore, service providers need to maintain records of financial transactions at least for a considerable amount of time (say five years), they may get more customers. Furthermore, these transactions need to be made available upon demand without any time delay. Transactions take three days to be reflected at the firm level. Thus, it would be beneficial for all parties involved, if transactions get reflected at the firm level on real time basis. Finally, system delays and downtime at the end of the service providers act as a hurdle for the business community to view the service as a reliable and viable option to perform financial transactions. Therefore, service providers need to pay attention to develop the dependable infrastructure of the service.
The governments in these countries can play a role in regulating the transactions via this
service. In particular, financial transactions via mobile money can be used for auditing and tax purposes. This specific provision will help small and micro businesses especially, because they often do not have resources and expertise to maintain records of their financial transactions. Additionally, these electronic transactions can be used by financial institutions to scrutinize creditworthiness of businesses, a key player in granting and extending credit.
160
REFERENCES
Ackah, C., & Morrissey, O. (2005). Trade policy and performance in sub-Saharan Africa since the 1980s: CREDIT Research Paper.
Aker, J. C., & Mbiti, I. M. (2010). Mobile phones and economic development in Africa. The Journal of Economic Perspectives, 207-232.
Altenburg, T., & von Drachenfels, C. (2008). Creating an enabling environment for private sector development in sub-Saharan Africa. UNIDO and GTZ, Vienna.
Asiedu, E., Kalonda-Kanyama, I., Ndikumana, L., & Nti-Addae, A. (2013). Access to Credit by Firms in Sub-Saharan Africa: How Relevant is Gender? The American Economic Review, 103(3), 293-297.
Beck, T., Demirgüç-Kunt, A., & Singer, D. (2013). Is small beautiful? financial structure, size and access to finance. World Development, 52, 19-33.
Bigsten, A. P. K. K. L. (2004). What to Do with the Informal Sector? Development Policy Review, 22(6), 701-715.
Blumenstock, J., Eagle, N., & Fafchamps, M. (2012). Risk and reciprocity over the mobile phone network: evidence from Rwanda.
Clarke, G. R., Cull, R., & Kisunko, G. (2012). External finance and firm survival in the aftermath of the crisis: Evidence from Eastern Europe and Central Asia. Journal of Comparative Economics, 40(3), 372-392.
Clarke, G. R. G., & Gosavi, A. (2013). Determinants of firm performance during and after the 2008-09 financial crisis in Europe and Central Asia (H. C. A. Ed.). New York: NOVA.
Comninos, A., Esselaar, S., Ndiwalana, A., & Stork, C. (2009). Airtime to Cash: Unlocking the Potential of Africa's Mobile Phones for Banking the Unbanked.
Demombynes, G., & Thegeya, A. (2012). Kenya's mobile revolution and the promise of mobile savings. World Bank Policy Research Working Paper(5988).
Gebreab, F. A. (2002). Getting connected: Competition and diffusion in African mobile telecommunications markets: World Bank Publications.
Gupta, S. (2013). The Mobile Banking and Payment Revolution. European Financial Review, 3-6.
Hansen, H., & Rand, J. (2014). The myth of female credit discrimination in African manufacturing. Journal of Development Studies, 50(1), 81-96.
Heyer, A., & Mas, I. (2009). Seeking fertile grounds for mobile money. Unpublished paper. Hughes, N., & Lonie, S. (2007). M-PESA: mobile money for the “unbanked” turning cellphones
into 24-hour tellers in Kenya. Innovations, 2(1-2), 63-81. Ivatury, G., & Mas, I. (2008). The early experience with branchless banking. Focus Note, 46. Ivatury, G., & Pickens, M. (2006). Mobile phone banking and low-income customers: evidence
from South Africa: Consultative Group to Assist the Poor. Jack, W., & Suri, T. (2011). Mobile money: the economics of M-PESA: National Bureau of
Economic Research.
161
Jenkins, B. (2008). Developing mobile money ecosystems. Washington, DC: International Finance Corporation and Harvard Kennedy School.
Kappel, R., Lay, J., & Steiner, S. (2004). The Missing Links-Uganda's Economic Reforms and Pro-Poor Growth.
Kendall, J., Lyon, B., & Higgins, D. (2012). Mobile Money Usage Patterns of Kenyan Small and Medium Enterprises. Available at SSRN 2116481.
Kuntchev, V., Ramalho, R., Rodríguez-Meza, J., & Yang, J. S. (2012). What have we learned from the Enterprise Surveys regarding access to finance by SMEs? Enterprise Analysis Unit of the Finance and Private Sector Development, The World Bank Group.
Lawrence, P. (2005). Explaining Sub‐Saharan Africa's Manufacturing Performance. Development and Change, 36(6), 1121-1141.
Mas, I. (2009). The economics of branchless banking. Innovations, 4(2), 57-75. Mas, I., & Morawczynski, O. (2009). Designing mobile money services lessons from M-PESA.
Innovations, 4(2), 77-91. Mas, I., & Ng'weno, A. (2012). Why Doesn't Every Kenyan Business Have a Mobile Money
Account? FSD Insights(4). Mawona, A., & Mpogole, H. (2013). ICT and financial inclusion: Adoption of mobile phone
banking among small business owners in Iringa, Tanzania. Paper presented at the IST-Africa Conference and Exhibition (IST-Africa), 2013.
Mbogo, M. (2010). The impact of mobile payments on the success and growth of micro-business: The case of m-pesa in Kenya. Journal of Language, Technology & Entrepreneurship in Africa, 2(1), 182-203.
Mead, D. C. (1994). The contribution of small enterprises to employment growth in Southern and Eastern Africa. World Development, 22(12), 1881-1894.
Medhi, I., Ratan, A., & Toyama, K. (2009). Mobile-banking adoption and usage by low-literate, low-income users in the developing world Internationalization, Design and Global Development (pp. 485-494): Springer.
Morawczynski, O. (2009). Exploring the usage and impact of “transformational” mobile financial services: the case of M-PESA in Kenya. Journal of Eastern African Studies, 3(3), 509-525.
Morawczynski, O., & Pickens, M. (2009). Poor people using mobile financial services: observations on customer usage and impact from M-PESA.
Ndiwalana, A., Morawczynki, O., & Popov, O. (2010). Mobile money use in Uganda: A preliminary study. M4D 2010, 121.
Nelson, E. G., & De Bruijn, E. J. (2005). The voluntary formalization of enterprises in a developing economy—the case of Tanzania. Journal of International Development, 17(4), 575-593.
Orwa, B. (2007). Jua kali associations in Kenya: A force for development and reform: Center for International Private Enterprise.
162
Palmade, V. A. A. (2005). Rising Informality. World Bank Group, Private-sector Development Vice Presidency (Note No. 298), Washington, DC.
Plyler, M., Haas, S., & Ngarajan, G. (2010). Community-Level Economic Effects of M-PESA in Kenya: Initial Findings. College Park, MD: IRIS Center, Assessing the Impact of Innovation Grants in Financial Services Project.
Pulver, C., William Jack, and Tavneet Suri. (2009). The Perfromance and Impact of M-Pesa: Priliminary Evidence from a Household Survey Financial Sector Depening, Kenya.
Rajan, R. G., & Zingales, L. (1996). Financial dependence and growth: National bureau of economic research.
Samuel, J., Shah, N., & Hadingham, W. (2005). Mobile communications in South Africa, Tanzania, and Egypt: Results from community and business surveys. The Impact of Mobile Phones, Vodaphone Policy Paper Series(2), 44-52.
Sandefur, J. (2006). Explaining the Trend toward Informal Employment in Africa: Evidence from Ghanaian Manufacturing. Centre for the Study of African Economies, Oxford University, Preliminary Draft.
Schneider, F. G. (2004). The Size of the Shadow Economies of 145 Countries all over the World: First Results over the Period 1999 to 2003: IZA Discussion paper series.
Suri, T., Jack, W., and Stoker, T., . (2012). Documenting the birth of a financial economy. Proceedings of the National Academy of Science.
Wanyonyi, P. W., & Bwisa, H. M. (2013). Influence of Mobile Money Transfer Services on the Performance of Micro Enterprises in Kitale Municipality. International Journal of Academic Research in Business & Social Sciences, 3(5).
Yumkella, K., & Vinanchiarachi, J. (2003). Leading Issues on Africa's Path to Industrialisation: The Role of Support Systems and Instruments. Journal of African economies, 12(1), 30-40.
163
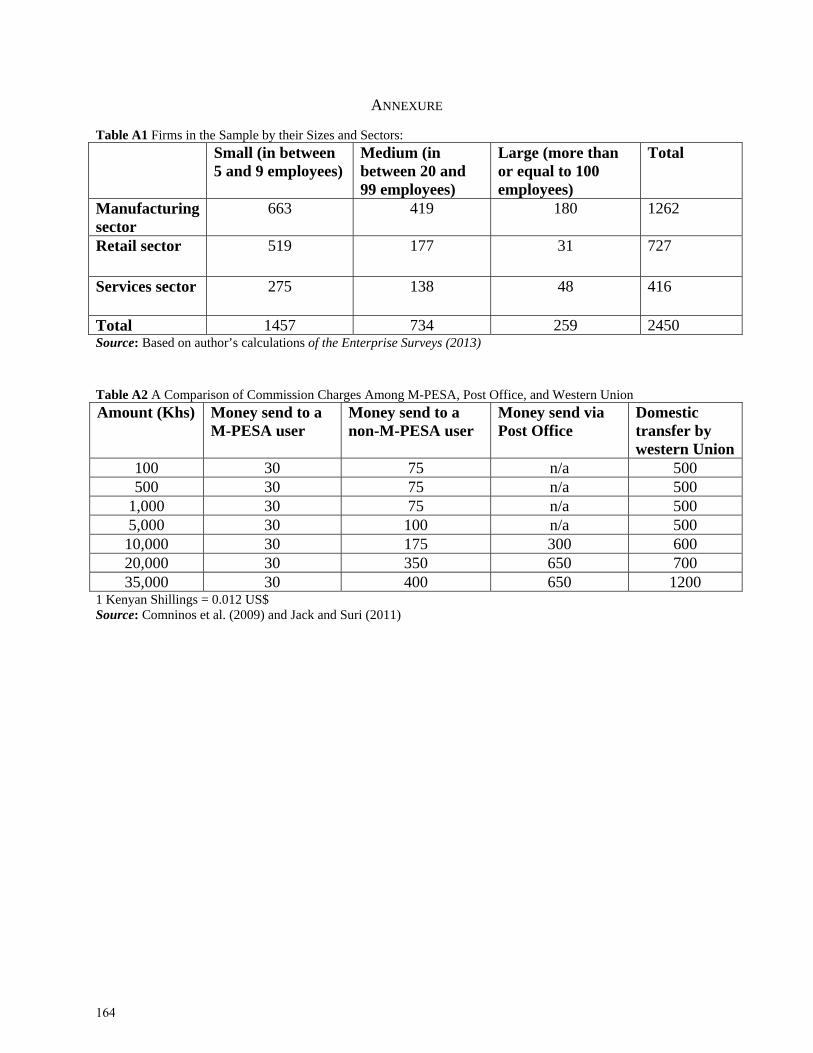
ANNEXURE
Table A1 Firms in the Sample by their Sizes and Sectors: Small (in between
5 and 9 employees) Medium (in between 20 and 99 employees)
Large (more than or equal to 100 employees)
Total
Manufacturing sector
663 419 180 1262
Retail sector 519 177 31 727
Services sector 275 138 48 416
Total 1457 734 259 2450 Source: Based on author’s calculations of the Enterprise Surveys (2013) Table A2 A Comparison of Commission Charges Among M-PESA, Post Office, and Western Union
Amount (Khs) Money send to a M-PESA user
Money send to a non-M-PESA user
Money send via Post Office
Domestic transfer by western Union
100 30 75 n/a 500 500 30 75 n/a 500
1,000 30 75 n/a 500 5,000 30 100 n/a 500 10,000 30 175 300 600 20,000 30 350 650 700 35,000 30 400 650 1200
1 Kenyan Shillings = 0.012 US$ Source: Comninos et al. (2009) and Jack and Suri (2011)
164
Efficiency of Capital Markets: Is the Value Premium Dead?
WILLIAM PROCASKY, CFA1 A. R. Sanchez, Jr. School of Business,
Texas A&M International University, Laredo, Texas, USA The efficiency of capital markets and associated market anomalies is a research subject that has historically received a lot of attention in the Finance world, mostly in developed markets. However a great deal of this work is now dated, and it is worth another look to see if the identified anomalies have persisted over the last two decades. In addition, now that the breadth and depth of data on emerging markets is more readily available, there is need a need to examine whether the anomalies are pervasive in these yet-to-be robustly analyzed markets. Against that backdrop, the purpose of this paper is to examine one of the most well-known anomalies, the value-growth premium. Specifically, I update it for the United States and 12 developed countries to incorporate such contemporary events as the Financial Crisis of 2008-9, as well as extend the analysis to 19 emerging markets using MSCI’s value and growth indexes, which were not available during prior research. Using daily return data for the first time, I find no evidence of the anomaly’s existence in either developed markets since 2002 or emerging markets from 1997-2014. From this, I draw the conclusion that the anomaly has either been exhaustively exploited over the last decade in developed markets, or perhaps more intriguingly, may not be persistent when examined using more granular data. In addition, it generally does not appear to extend to individual emerging markets, although there is some evidence that it exists during certain time periods on a pooled global basis. KEYWORDS Market Efficiency, Value Premium, Stock Anomalies, Value-Growth Anomaly, International Financial Markets, Emerging Markets JEL G100, G120, G140, G150
1 Address correspondence to William Procasky, CFA, A. R. Sanchez, Jr. School of Business, Texas A&M International University, Laredo, Texas, USA. E-mail: [email protected]
165
Why Banks Choose to Play Different Roles in the Syndicated Loan?
BOLORTUYA ENKHTAIVAN1
Doctoral Student, Texas A&M International University, Laredo, Texas, USA
In this paper I investigate why banks choose to play different roles in the syndicated loans. I study different behavioral variables along with financial capacity of a bank to determine its likelihood of becoming a lead versus participant in the syndicate using logistic regression. I find that financially strong banks choose to become lead banks in the syndicated loan to commit greater responsibilities. Moreover, behavioral variables such as dominance in the syndicated loan market, previous relationship with the borrower and the expertise in the borrower’s industry are both statistically and economically significant determinants of banks’ roles in the syndicate. Furthermore, I find that in bad times behavioral variables are crucial in determining lender roles particularly for low asset banks and financial variables lose their significances. However, for large banks only bank dominance is significant in bad times along with other financial variables.
1 Address correspondence to Bolortuya Enkhtaivan, Doctoral Student at Texas A&M International University, Laredo, Texas, USA. E-mail: [email protected]
166

Incorporating Ethics and Social Responsibility in International Business Curricula
ARTURO Z. VASQUEZ-PARRAGA1
Professor, College of Business Administration, The University of Texas-Pan American, Edinburg, Texas, USA
To satisfy the AACSB requirement of ethics learning in U.S. and international business schools, with its focus on business curriculum, this paper addresses 1) the AACSB’s directives for teaching ethics in business schools, 2) the results of recent research on student ethics with the objective of guiding the development and implementation of a proper course in business ethics, and 3) curricula as the best way to serve actual student needs. The study of student ethics also helps us understand how students form ethical judgments, how students make ethical decisions, and how inclined students are towards cheating and plagiarizing.
1 Address correspondence to Arturo Z. Vasquez-Parraga, Professor of Marketing and International Business, College of Business Administration, The University of Texas-Pan American, Edinburg, Texas, USA. E-mail: [email protected]
167
“Minority STEM Improvement” Project – A Peer Interactive Learning Environment
ROHITHA GOONATILAKE Department of Mathematics and Physics, COAS,
Texas A&M International University, Laredo, Texas, USA
RUNCHANG LIN1
Department of Mathematics and Physics, COAS, Texas A&M International University, Laredo, Texas, USA
QINGWEN NI
Department of Mathematics and Physics, COAS, Texas A&M International University, Laredo, Texas, USA
TERESA N NGUYEN
Department of Mathematics and Physics, COAS, Texas A&M International University, Laredo, Texas, USA
TAMIU has been awarded a $426,666 U.S. Department of Education grant from October 2010 to September 2014, entitled “Minority STEM Improvement”. In this project, a web-based Virtual Teaching Assistant System (ViTAS) was developed and implemented to provide an interactive learning environment for students to improve their performance in mathematics, engineering, and physics courses. This project was successful in developing an innovative approach in education in STEM fields at TAMIU and increasing the participation of underrepresented ethnic minorities, particularly women, in scientific and technological careers. It helped TAMIU strengthen its STEM programs, provided students opportunities in career preparation and development, and enabled faculty members to develop new pedagogy in STEM courses.
1 Address correspondence to Runchang Lin, Department of Mathematics and Physics, COAS, Texas A&M International University, Laredo, Texas, United States of America. E-mail: [email protected]
168

Facebook Assimilation and Relationship Management: Differences among HBCU and HSI Accounting Students
Scholastic and Social Relationship Management
GEORGE E. HEILMAN1,
Winston-Salem State University, Winston-Salem, North Carolina, USA
SATHASIVAM MATHIYALAKAN,
Winston-Salem State University, Winston-Salem, North Carolina, USA
JORGE O. BRUSA,
Texas A&M International University, Laredo, Texas, USA
Facebook proves a rich source for the exploration of a diverse set of issues related to the use of social media, especially within academia. This study presents the results of an examination and comparison of Facebook use by accounting students. Using respondents from a Historically Black College or University (HBCU) and a Hispanic Serving Institution (HSI), the investigation attempts to understand if differences in environmental or cultural academic context affect student perceptions of Facebook assimilation and impact on its use within the academic setting. The findings indicate that significant differences exist between HBCU and HSI accounting students. HSI accounting students tend to spend more time on Facebook and other social media, have higher levels of assimilation, and perceive greater levels of academic use and impact than HBCU accounting students. KEYWORDS Assimilation, Attitude, Facebook, Social network, Students, HBCU, HSI
1 Address correspondence to George E. Heilman, Winston-Salem State University, Winston-Salem, North Carolina, USA. E-mail: [email protected]
169
1. INTRODUCTION Recent research indicates that about two-thirds of all internet users belong to at least one social networking site (Duggan & Brenner, 2013). Facebook, which has grown rapidly since its founding in 2004, has become the world's leading site for social networking, reporting nearly 1.4 billion monthly active users (Facebook, 2015). Because of this huge user base, Facebook has been the backdrop for a wide variety of social media use and social media user investigations. Topics have included academic major (Heilman et al., 2014; Mathiyalakan et al., 2014), age (Heilman et al., 2014; Mathiyalakan et al., 2013), assimilation (Ellison, Steinfield and Lampe, 2007; Heilman, Mathiyalakan, White, Seshie and Clark, 2014; ) gender (Heilman et al., 2014; Junco et al., 2010), effect of social media on student engagement and academic performance (Junco, 2012; Krischner and Karpinski, 2010; Mathiyalakan, Heilman, White, Wood and Weisenfeld, 2014; Lampe, Ellison and Steinfield, 2008), ethnicity (Gabre and Kumar, 2012; Grasmuck et al., 2009, Mathiyalakan et al., 2014), identity construction (Boyd and Heer, 2006), privacy (Lewis, Kaufman and Christakis, 2008; Pinchot and Paullet, 2012; Mathiyalakan et al., 2014; Whitcomb and Fiedler, 2010), and social capital and relationships (Elison et al., 2007; Mathyalakan et al., 2014. This study focuses on two of these dimensions – Facebook assimilation and student academic usage.
Assimilation refers to the act of adopting, absorbing or taking and utilizing (Merriam-Webster, 2014). Ellison, Steinfield and Lampe (2007) developed a series of “attitudinal questions designed to tap the extent to which the participant was emotionally connected to Facebook and the extent to which Facebook was integrated into their daily activities” (Ellison et al, 2007 p.1150). These question were incorporated into later Facebook investigations, where they have been collectively referred to attitudes (Ross, Orr, Sisic, Arseneault, Simmering and Orr, 2008), attitudes toward Facebook (Lampe et al., 2008) and assimilation of Facebook (Heilman et al., 2014).
Investigations of Facebook use in academics has included a wide array of topics. Examples of the range of study areas include class-related communication (Roblyer, McDaniel, Webb, Herman and Witty, 2010; Sánchez, Totijo and Javed, 2013), collaboration (Lampe, Wohn, Vitak, Ellison and Wash, 2011; Sánchez et al., 2013), effect on GPA (Karpinski and Duberstein, 2009; Kolek and Saurers, 2008), and perceived impact on academic performance (kirschner and Karpinski (2010).
This study investigates the assimilation of Facebook into students’ lives and student perceptions of its use and impact on their academic life as seen from the perspective of ethnically diverse universities. More specifically, the study focuses on perceptual differences that may exist among students at a Historically Black College or University (HBCU) and a Hispanic Serving Institution (HSI) regarding the use of Facebook. To that end, a survey assessing a wide variety of Facebook attitudes and perceptions was created by drawing items from the literature. Of interest in this report are the items associated with assimilation and the academic use of Facebook. The survey was administered to a sample of HBCU and HSI business students in an attempt to gain further insight into how these students have assimilated Facebook, the perceived impact it has on their academic lives, and how these perceptions might differ across ethnically different academic environments.
170
2. BACKGROUND There is a growing body of recent research that focuses on student use of Facebook. For example, Case and King (2012) examined the attitude and usage of social networking by university students and found that a higher percentage of females in relation to males indicate that social networking is important to them. There was also a difference based on academic classification, with a higher percentage of freshmen as opposed to seniors indicating that social networking was important to them. Akyildiz and Argan (2011), in their examination of Facebook usage among college students in Turkey, and found that more than 90% of the students had a Facebook account; they logged in to Facebook several times a day, had 101-300 friends, and spent 15-30 minutes daily on Facebook-related activities. Their predominant uses of Facebook tended to be for having fun, contacting friends, and following the news as opposed to conducting educational and school related work. Studies of students in other countries have supported an average use time of at least 30 minutes per session while finding little support for Facebook's educational value (Akyildiz and Argan, 2011; Hew, 2011; Pempek, Yermolayeva and Calvert, 2009).
Although enhancing the educational experience may not be a predominant theme among Facebook users, there is some research that indicates it can be useful. Indeed, students are much more open than faculty to the possibility of using Facebook to support class work (Roblyer et al., 2010). Jackson (2012) found that incoming students who joined a university-sponsored Facebook group that provided pre-enrollment contact and integration information had higher retention rates than the new students who didn't join, while Duncan and Barczyk (2013) noted that students tended to have favorable impressions of Facebook for classroom use and, surprisingly, older students indicated a greater social learning experience than younger students. Lampe et al. (2011) found that male students who had higher levels of Facebook use, higher levels of Facebook interaction with instructors and were willing to use Facebook in ways that might not have the approval of the instructor exhibited higher propensity to use Facebook for collaborative learning.
A small body of literature has focused on Facebook use among minorities and within minority serving institutions. Grasmuck, Martin and Zhao (2009) examined the Facebook profiles of 83 college students (20 white and 63 African-Americans, Latinos, Indian, and Vietnamese) in an attempt to understand how the students construct their Facebook identities. They found that African-American, Latino, and Indian students tended to use themes, colors, and quotes to identify with and/or belong to their respective ethnic groups. Such identification along group or ethnic/racial lines was not found among white or Vietnamese students. Heilman et al. (2014). A comparison of traditional and nontraditional HBCU students found that the nontraditional students have a higher opinion of the role and impact of Facebook but are less trusting of it (Mathiyalakan, Heilman, White, Dalmadge and Bembry, 2013). Investigations of gender differences in Facebook privacy attitudes, assimilation and relationship management among HBCU student found that the women logged into Facebook more often, stayed on longer, logged in from a wider variety of locations, tended to be more concerned about privacy, had higher levels of Assimilation and used Facebook as a tool to maintain social capital more than men (Heilman, Mathiyalakan and White, 2014; Mathiyalakan, Heilman and White, 2013). Gender difference also exist in Facebook privacy attitudes among Hispanic students, in that
171

Hispanic women have greater concern about Internet and Facebook privacy and data security than do Hispanic males and exhibit greater awareness of and control over their Facebook privacy in terms of posting, look-ups and friending (Mathiyalakan, Heilman, White, Bembry, Brusa and Gutiérrez, 2014). An investigation of differences in privacy attitudes between African-American and Hispanic college students found that Hispanics worried more about Internet and Facebook privacy and data security and tended to have more restrictive Facebook privacy settings than African-Americans (Mathiyalakan, Heilman and White, 2014).
An even smaller body of literature has looked specifically at Facebook use among Accounting majors. Gabre and Kumar (2012) investigated the effects of perceived stress on the academic performance of accounting majors enrolled in an HBCU and found an association between higher Facebook use and higher levels of stress. They also found that females reported higher stress than males, African-Americans reported higher stress than non-African-American students and accounting students who were Facebook users had lower academic performance after controlling for stress. An investigation of perceptions of the role of Facebook in the lives of Accounting majors found that nontraditional accounting students generally indicated a much higher level of assimilation of Facebook and a greater use of Facebook for social outreach and social maintenance than traditional Accounting students Heilman, Mathiyalakan, White, Seshie and Clark (2014). In an initial attempt to assess difference in Facebook use and attitudes across majors, a comparison of Accounting and MIS majors at an HBCU found that Accounting had a higher percentage of females, a higher GPA average, and that Accounting students tended to use Facebook less for academics and socializing than the MIS majors
The subjects for this study are Accounting majors at two minority-serving institutions. The study contributes to the literature assessing student assimilation of social media, specifically Facebook, and the use of Facebook for academics. The study also examines differences in attitudes and perceptions regarding Facebook use by Accounting majors at the two ethnically different minority settings.
3. METHODOLOGY An online survey was administered to students enrolled at a Historically Black College or University (HBCU) located in a Mid-Atlantic U.S. state and a Hispanic Serving Institution (HSI) located in a Southwestern U.S. state. Respondents were students enrolled in undergraduate core business courses. The students were given course credit for completing the survey. There were no financial incentives for survey completion.
The respondents were asked to provide selected demographic and background information such as gender, age, ethnicity, school classification, GPA, and major. Respondents were also asked whether they had a Facebook account, the year that they joined Facebook if they had an account, how often then logged in to Facebook, length of stay for each log in, and their approximate number of friends.
Attitudinal and perceptual items in the survey were drawn from prior Facebook research (Ellison et al., 2007; Lampe et al., 2006; Lampe et al., 2008a; Lampe et al. 2008b; Pempek et al.,
172
2009; Ross et al, 2009). Each of these items was measured on a five point Likert-type scale where 1 represents “Strongly Disagree” and 5 represents “Strongly Agree.” Six items related to Facebook assimilation and nine items related to use of Facebook for academis were selected for analysis in this study.
4. RESULTS 4.1 Respondent Demographics A total of 345 usable surveys were collected from the students at the two universities, 239 from the HBCU and 106 from the HSI. All the respondents who completed the survey had a Facebook account. Of the239 HBCU respondents, 37 identified themselves as Accounting majors. Of the 106 HSI respondents, 20 identified themselves as Accounting majors. Table 1 presents the demographic data for respondents of the 23 usable surveys.
Except for Ethnicity, the only significant difference in distribution of demographic information was for self-reported GPA. The proportion of HBCU students reporting a GPA > 3.500 was marginally significantly higher than for HSI students (p<.10).
173

Table 1 Demographical Information
Demographic Category HBCU
(N = 37) HSI
(N = 20) Total
(N = 57) Gender Male 13 7 20 Female 24 13 37 Age Under 18 1 0 1 18 - 22 22 14 36 23 – 26 6 6 12 27 – 30 1 0 1 Over 30 7 0 7 Ethnicity Asian American 2 0 2 Black or African American 26 0 26 Hispanic or Latino 2 20 22 Caucasian 5 0 5 International 1 0 1 Two or more races 1 0 1 Classification Freshman 1 1 2 Sophomore 14 8 22 Junior 11 7 18 Senior 11 4 15 GPA 2.000 – 2.499 7 4 11 2.500 – 2.999 14 5 19 3.000 – 3.499 7 10 17 > 3.500 9 1 10
4.2 Facebook and Social Media Usage TABLE 2 USE OF FACEBOOK AND OTHER SOCIAL MEDIA
Category HBCU (N (N = 37)
HSI (N = 20)
Overall (N = 57)
FB & other social media 1: < 1 hour/day 19 3 0 2: > 1 hour/day but < 2 hours/day 11 7 0 3: > 2 hours/day but < 3 hours/day 5 5 1 4: > 3 hours/day but < 4 hours/day 2 1 3 5: > 4 hours/day 0 4 9
sig. diff. at 1% Average categorical value 1.73
(SD=0.90) 2.80
(SD=1.36) 2.11
(SD=1.19) Table 2 presents self-reported use statistics for Facebook and other social media. The students were asked to select a category (less than 1 hour, 1 to 2 hours, 2 to 3 hours, 3 to 4 hours, more than 4 hours) that best represents the amount of time they spend on social media each day. As shown by the average categorical score, typical overall use is in the 1 to 2 hour/day range.
Results of a Fischer’s Exact Test indicates a relationship between school attended and amount of time spent using Facebook and other social media (p<.01). Half of the HBCU accounting students report spending less than one hour/day on Facebook and other social media
174
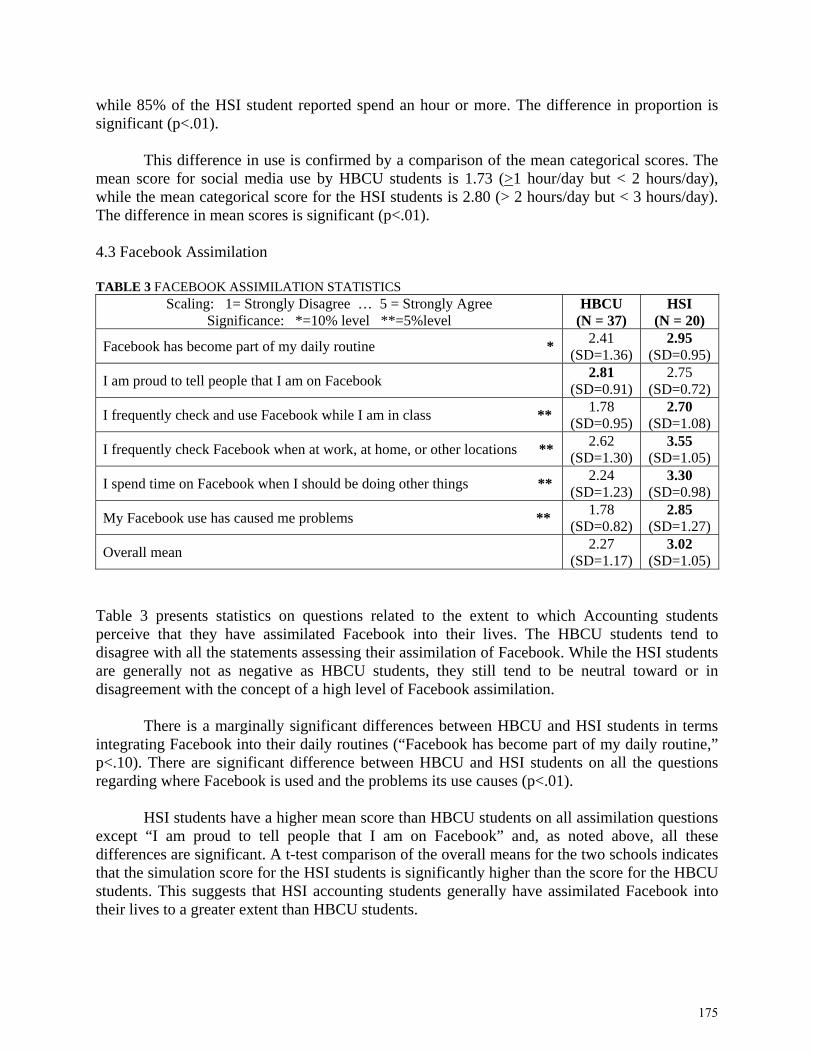
while 85% of the HSI student reported spend an hour or more. The difference in proportion is significant (p<.01).
This difference in use is confirmed by a comparison of the mean categorical scores. The mean score for social media use by HBCU students is 1.73 (>1 hour/day but < 2 hours/day), while the mean categorical score for the HSI students is 2.80 (> 2 hours/day but < 3 hours/day). The difference in mean scores is significant (p<.01). 4.3 Facebook Assimilation TABLE 3 FACEBOOK ASSIMILATION STATISTICS
Scaling: 1= Strongly Disagree … 5 = Strongly Agree Significance: *=10% level **=5%level
HBCU (N = 37)
HSI (N = 20)
Facebook has become part of my daily routine * 2.41
(SD=1.36) 2.95
(SD=0.95)
I am proud to tell people that I am on Facebook 2.81
(SD=0.91) 2.75
(SD=0.72)
I frequently check and use Facebook while I am in class ** 1.78
(SD=0.95) 2.70
(SD=1.08)
I frequently check Facebook when at work, at home, or other locations ** 2.62
(SD=1.30) 3.55
(SD=1.05)
I spend time on Facebook when I should be doing other things ** 2.24
(SD=1.23) 3.30
(SD=0.98)
My Facebook use has caused me problems ** 1.78
(SD=0.82) 2.85
(SD=1.27)
Overall mean 2.27
(SD=1.17) 3.02
(SD=1.05) Table 3 presents statistics on questions related to the extent to which Accounting students perceive that they have assimilated Facebook into their lives. The HBCU students tend to disagree with all the statements assessing their assimilation of Facebook. While the HSI students are generally not as negative as HBCU students, they still tend to be neutral toward or in disagreement with the concept of a high level of Facebook assimilation.
There is a marginally significant differences between HBCU and HSI students in terms integrating Facebook into their daily routines (“Facebook has become part of my daily routine,” p<.10). There are significant difference between HBCU and HSI students on all the questions regarding where Facebook is used and the problems its use causes (p<.01).
HSI students have a higher mean score than HBCU students on all assimilation questions except “I am proud to tell people that I am on Facebook” and, as noted above, all these differences are significant. A t-test comparison of the overall means for the two schools indicates that the simulation score for the HSI students is significantly higher than the score for the HBCU students. This suggests that HSI accounting students generally have assimilated Facebook into their lives to a greater extent than HBCU students.
175
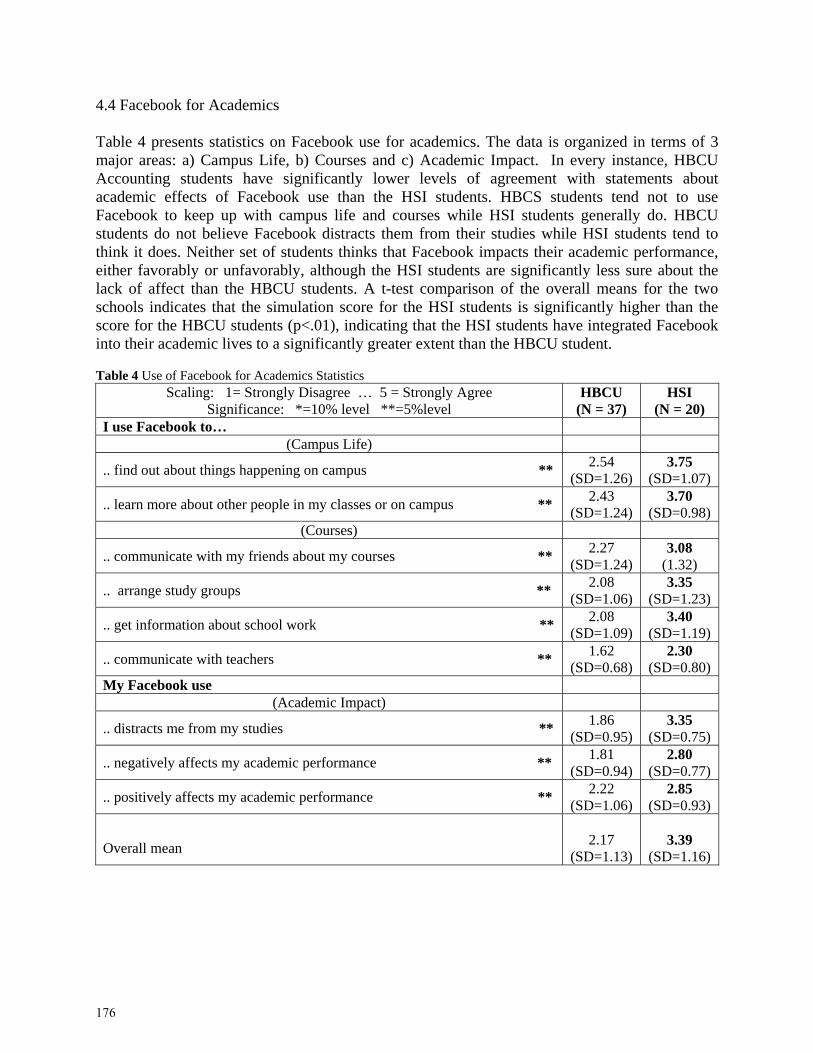
4.4 Facebook for Academics Table 4 presents statistics on Facebook use for academics. The data is organized in terms of 3 major areas: a) Campus Life, b) Courses and c) Academic Impact. In every instance, HBCU Accounting students have significantly lower levels of agreement with statements about academic effects of Facebook use than the HSI students. HBCS students tend not to use Facebook to keep up with campus life and courses while HSI students generally do. HBCU students do not believe Facebook distracts them from their studies while HSI students tend to think it does. Neither set of students thinks that Facebook impacts their academic performance, either favorably or unfavorably, although the HSI students are significantly less sure about the lack of affect than the HBCU students. A t-test comparison of the overall means for the two schools indicates that the simulation score for the HSI students is significantly higher than the score for the HBCU students (p<.01), indicating that the HSI students have integrated Facebook into their academic lives to a significantly greater extent than the HBCU student. Table 4 Use of Facebook for Academics Statistics
Scaling: 1= Strongly Disagree … 5 = Strongly Agree Significance: *=10% level **=5%level
HBCU (N = 37)
HSI (N = 20)
I use Facebook to… (Campus Life)
.. find out about things happening on campus ** 2.54
(SD=1.26) 3.75
(SD=1.07)
.. learn more about other people in my classes or on campus ** 2.43
(SD=1.24) 3.70
(SD=0.98) (Courses)
.. communicate with my friends about my courses ** 2.27
(SD=1.24) 3.08
(1.32)
.. arrange study groups ** 2.08
(SD=1.06) 3.35
(SD=1.23)
.. get information about school work ** 2.08
(SD=1.09) 3.40
(SD=1.19)
.. communicate with teachers ** 1.62
(SD=0.68) 2.30
(SD=0.80) My Facebook use
(Academic Impact)
.. distracts me from my studies ** 1.86
(SD=0.95) 3.35
(SD=0.75)
.. negatively affects my academic performance ** 1.81
(SD=0.94) 2.80
(SD=0.77)
.. positively affects my academic performance ** 2.22
(SD=1.06) 2.85
(SD=0.93)
Overall mean 2.17
(SD=1.13) 3.39
(SD=1.16)
176
5. CONCLUSIONS, STUDY LIMITATIONS, & FUTURE RESEARCH
The purpose of this study is to examine Accounting student use of Facebook in an attempt to gain an understanding of how Facebook has been assimilated into their lives and how it is used academically. The study also compares these perceptions for students at two culturally diverse academic institutions – one a Historically Black College or University (HBCU) and the other a Hispanic Serving Institution (HSI).
There is no statistically significant difference in distribution of students across demographic variables except that the HBCU students report a marginally higher GPA. The significant difference in overall scores for Assimilation of Facebook and Use of Facebook for Academics, along with significant differences in most of the individual Assimilation questions and all the Use of Facebook for Academics questions, indicates that Facebook is much more tightly integrated into the lives of the HSI students. The Hispanic students’ greater affinity for Facebook suggests that the HSI faculty could realize some educational gains by greater use of Facebook in the curriculum.
Like all other academic studies that use students, there are weaknesses in this study. As this is a pilot study, the sample size is small. We used a convenience sample and thus the findings may not be applicable to the larger population. Before any generalizations can be made, a greater sample size is needed. Despite these shortcomings, we do have some interesting findings.
177
6. REFERENCES Akyildiz, M. and Argan, M., “Using Online Social Networking: Students’ Purposes of Facebook
Usage at the University of Turkey. AABRILV2011 Proceedings. 2011; http://www.aabri.com/LV11Manuscripts/LV11094.pdf
Boyd, D., and Heer, J., “Profiles as Conversation: Networked identity performance on Friendster”, Proceedings of the Thirty-Ninth Hawaii International Conference on System Sciences, Los Alamitos, CA: IEEE Press, 2006.
Case, C.J. and King, D.L., “Exploring the Undergraduate World of Electronic Social Networking: An Examination of Attitude, Adoption, and Usage”, Issues in Information Systems, Volume 13, Number 1, Pages 51-58, 2012.
Duggan, M. and Brenner, J., The Demographics of Social Media Users - 2012, Pew Research Center’s Internet & American Life Project, 2013; http://pewinternet.org/~/media//Files/Reports/2013/PIP_SocialMediaUsers.pdf.
Duncan, D.G. and Barczyk, C.C., “Facebook in the University Classroom: Do Students Perceive that it Enhances Community of Practice and Sense of Community”, International Journal of Business and Social Science, Volume 4, Number 3, Pages 1-14, 2013.
Ellison, N.B., Steinfield, C. and Lampe, C., “The Benefits of Facebook ‘Friends:’ Social Capitol and College Student use of Online Social Network Sites”, Journal of Computer-Mediated Communication, 12(4), Pages 1143-1168, 2007.
Facebook, ‘Investor Relations - Facebook Reports Fourth Quarter and Full Year 2014 Results,” 2015; http://investor.fb.com/releasedetail.cfm?ReleaseID=893395
Gabre, H.G. and Kumar, G., “The Effects of perceived Stress and Facebook on Accounting Students’ Academic Performance”, Accounting & Finance Research, 1(2), Pages 87-100, 2012.
Grasmuck, S., Martin, J. and Zhao, S., “Ethno-Racial Identity Displays on Facebook”, Journal of Computer-Mediated Communication, 15(1), Pages 158-188, 2009.
Heilman, G.E., Mathiyalakan, S. & White, S.D. “Facebook Assimilation and Relationship Management: Gender Differences among HBCU Students.” European Journal of Business Research, 13(3), Pages 13-22, 2014.
Heilman, G.E., Mathiyalakan, S., White, S.D., Seshie, G.O. and Clark, G., “Differences in Facebook Assimilation and Relationship Management between Traditional and Nontraditional Accounting Students”, International Journal of Business Strategy, 14(1), Pages 7-16, 2014.
Hew, K., “Students’ and teachers’ use of Facebook”, Computers in Human Behavior, 27(2), Pages 662-676, 2011.
Jackson, V., “The use of a social networking site with pre-enrolled Business School students to enhance their first year experience at university, and in doing so improve retention”, Widening Participation and Lifelong Learning, 14, Pages 25-41, 2012.
178
Junco, R., “Too much face and not enough books: The relationship between multiple indices of Facebook use and academic performance”, Computers in Human Behavior, 28(1), Pages 187-198, 2012.
Junco, R., Merson, D., and Salter, D.W., “The Effect of Gender, Ethnicity, and Income 0on College Students’ Use of Communication Technologies”, CyberPsychology, Behavior, and Social Networking, 13(6), Pages.619-627, 2010.
Kirschner, P.A. and Karpinski, A.C., “Facebook and academic performance”, Computers in Human Behavior, 26, Pages 1237-1245, 2010.
Lampe, C., Ellison, N.B. and Steinfield, C., “Changes in Use and Perception of Facebook”, Proceedings of the 2008 ACM Conference on Computer supported cooperative work, pp. 721-730, 2008.
Lampe, C., Ellison, N. and Steinfield, C., “A Face(book) in the Crowd: Social Searching vs. Social Browsing”, Proceedings of the 2006 20th anniversary conference on Computer supported cooperative work, Pages 167-170, 2006.
Lampe, C., Wohn, D.Y., Vitak, J. Ellison, N.B and Wash, R., “Student use of Facebook for organizing collaborative activites”, Computer-Supported Collaborative Learning, 6, Pages 329-347, 2011.
Lewis, K., Kaufman, J. and Christakis, N., “The Taste for Privacy: An Analysis of College Student Privacy Settings in an Online Social Network”, Journal of Computer-Mediated Communication, 14(1), Pages 79-100, 2008.
Mathiyalakan S., Heilman, G.E. & White, S.D. “Gender Difference in Student Attitude toward Privacy in Facebook” Communications of the IIMA, 13(4), Pages 35-42, 2013.
Mathiyalakan S., Heilman, G.E. & White, S.D. “Facebook Privacy Attitudes: A Comparison of Two Minority Groups.” International Journal for Innovation Education and Research, 2(11), Pages 37-49, 2014.
Mathiyalakan, S, Heilman, G.E., White, S.D., Bembry, S.A., Brusa, J.O and Gutiérrez, P.G. “HSI Student Attitudes Toward Privacy in Facebook”, Journal of Academy for Advancement of Business Research, 2(1), Pages 98-104, 2014.
Mathiyalakan, S, Heilman, G.E., White, S.D., Dalmadge, C.L. and Bembry, S.A., “A Study on Differences Between Traditional and Non Traditional Students in Attitude Toward Facebook and Facebook Privacy”, Journal of Strategic and International Studies, 8(3) 3, Pages 115-122, 2013.
Mathiyalakan, S., Heilman, G.E., White, S.D., Wood, L.I. and Weisenfeld, L., “Facebook Attitudes And Usage: Comparing Accounting And MIS Students”, Journal of Academy of Business and Economics, 14(1), Pages 37-44, 2014.
Merriam-Webster, Dictionary, 2014; http://www.merriam-webster.com/dictionary/assimilation Pempek, T.A., Yermolayeva, Y.A. and Calvert, S.L., “College students’ social networking
experiences on Facebook”, Journal of Applied Developmental Psychology, 30(3), Pages 227-238, 2009.
179
Pinchot, J.L. and Paullet, K.L.,”What’s in Your profile? Mapping Facebook Profile data to Personal Security Questions”, Issues in Information Systems, 13(1), Pages 284-293, 2012.
Ross, C., Orr, E.S., Sisic, M., Arseneault, J.M., Simmering, M.G. and Orr, R.R., “Personality and motivations associated with Facebook use”, Computers in Human Behavior, 25(2), Pages 578-586, 2009.
Roblyer, M.D., McDaniel, M., Webb, M., Herman, J. and Witty, J.V., “Findings on Facebook in higher education: A comparison of college faculty and student uses and perceptions of social networking sites”, Internet and Higher Education, 13, Pages 134-140, 2010.
Sanchez, R.A., Totijo, V. and Javed, U., Students’ perceptions of Facebook for academic purposes”, Computers & Education, 70, Pages 138-149, 2014.
Whitcomb, K.M. and Fiedler, K.D., “The Impact of Negative Emotion on Perceived Privacy Risk in a Social Network Community. Proceedings of Southeast Decision Science Annual Meeting, Wilmington, NC, Feb 17-19, Pages 231-235, 2010.
180

The Importance of the University Entrepreneurship in Mexico
JOSÉ NICOLÁS BARRAGÁN CODINA Universidad Autónoma de Nuevo León
RUBÉN HERNÁN LEAL LÓPEZ
1 Universidad Politécnica de Tapachula
FELIPE PALÉ CERVANTES
Universidad Autónoma de Nuevo León
Nowadays practically nobody discusses that the paper of the universities does not restrict only to the activities of education and investigation. It is more, the society demands a major implication of the universities in the economic and social development of the country. This process has originated the appearance and consolidation of a new type of university: the enterprising university. The consolidation of this third mission like mechanism of reorientation of the universities and the interest of the different levels of government in every territory in the active participation of a new environment favorable to the implantation and development of the entrepreneurship and the collaboration university - company. In this new environment it is necessary to give content to new agents between the already existing ones that, of joint form, are going to recover different papers in order to propitiate the implication of the universities in this third mission. KEYWORDS Entrepreneurship, University, Development, Education
1 Address correspondence to Rubén Hernán Leal López, Universidad Politécnica de Tapachula. E-mail: [email protected]
181

INTRODUCTION The society demands every time a major implication of the university in the process of economic and social development of the regions. It has given place to the enterprising university called, which combines and integrates the traditional activities of education and investigation with the contribution to the economic and social development (Etzkowitz, 1998; Goddard, 1988). This new consideration of the university since enterprising it needs of a redesign of his global strategy, so that this one allows him to expire with the challenges imposed by his new paper in the company. The promotion and diffusion of the enterprising culture in the bosom of the university and to all the levels of the same one (education, investigation and even the own management), it appears as a key piece of the above mentioned strategy and to favor the economic and social contribution of the university of really effective form. Consequently, to attend successfully to the demands of the company and to be recognized as enterprising university is necessary a phase of transformation not only as for aims and strategies of the university, but in his own behavior and culture, so much to institutional as personal level. This transformation of the traditional university towards the enterprising one has been studied by Clark in universities so much European (Clark 1998) as of the rest of the world (Clark 2004), identifying five common elements that favor the above mentioned transformation, between that it is necessary to emphasize the existence of an enterprising integrated culture both in the institution and in the attitude and the form in which his agents recover his activities.
In this context, and departing from the base of the existence of a certain level of enterprising culture integrated the universities, we think that one of the principal activities that must be carried out inside his new paper since enterprising is the promotion of the emprendedurismo and the support to the development of companies. For the development of the above mentioned activities we will have to have in it counts so much new agents as new roles for the already existing ones. It implies, on one hand, the putting jointly of the different aims of the implied agents and, for other one, putting in relation these individual aims with the aims of the university as entity and attending to his new role as enterprising. For it it is necessary to develop a systemic frame (Clark, 1996; CERES, 1998; Etzkowitz, 2003) that integrates to the different agents and his aims so that it allows obtaining a clear image of the process of promotion to the entrepreneurship and the rest to the development of companies on the universities and the related centers of investigation.
The social contribution of the university thinks nowadays, once again, between the topics that there receive an attention favored on the part of investigators and politicians. In this respect, the idea of enterprising university is widely recognized as the frame in which to realize the above mentioned contribution, in opposition to the classic concept of university and his social contribution. In agreement with the new role of the universities, we find the widespread belief of which, major all that is the number of company’s spin-off that a university is capable of creating, so much more enterprising it will be considered to the above mentioned university.
In this regard, we coincide with Clark (2004) when it affirms that "the entrepreneurship in the universities should not be seen as the synonymous one of commercialization ". On the other hand, the study of the enterprising universities of major success worldwide has given place to an extensive literary related production both with his characteristics and with the way into which the
182

universities can turn successfully in enterprising. Some of these works it can be found in O'Shea et to. (2007); Etzkowitz (1983, 2004); Clark (1998), between others. According to these authors, the enterprising university can be understood as a flexible organization that interacts with his social and economic environment adapting to the changes and looking for additional resources of financing for the investigation and the education. The enterprising universities have jointly a core of strong government, a wide periphery of development, an academic motivated center, a base of diversified financing and an enterprising integrated culture, as Clark (1998) describes. This author nevertheless, does not formulate the dependence and the existing and necessary relation between these five characteristics for the transformation of the traditional university in enterprising.
As it has been defined in the previous paragraph, and as it is revealed in the literature on the third mission of the university (Molas-Gallart et to, 2002), the enterprising university must attend to a wide number of activities related to his three basic roles: education, investigation and contribution to the socioeconomic development; and, at the same time, they have to be managed as an everything. All these activities, including the management, must be developed for the university according to his name of enterprising, which implies that agents' great variety, instruments and infrastructures must be involved in the same ones. In this respect, some of the infrastructures that major relevancy acquires inside the new mission of the university are the scientific parks, which, in agreement with our concept of Enterprising University, we think that they are narrowly related to the " wide periphery developed " of the university The concept of enterprising culture it is defined by Gibb (1999) as the " set of values, beliefs and aptitudes commonly shared in a company, which supports the idea of that is desirable an enterprising way of life supporting constant the search of an enterprising effective behavior on the part of the individuals or groups ". In narrow relation with this concept and, attending to the activities that the enterprising university must develop as part of his third mission, we identify two critical tasks. The first one is the Promotion of the Entrepreneurship, which integrates, on the one hand, the process of dynamization (Castro Martínez et to, 2001) of the agents implied towards an enterprising behavior in the area of the creation and development of companies and, for other one, the approximation to the above mentioned area of the activities of investigation and education related to the entrepreneurship and related topics. In this definition we want to emphasize that the concept 'dynamization' is understood as that change of behavior that ' someone moves to do something ' (Castro Martínez et, 2001). In agreement with these authors, two activities must be promoted inside the process of dynamization: the awareness and the motivation, on one hand, and the provision of resources and facilities (services) for other one. The second key task is the Support to the Development of Companies, which we define as the process that gathers the search, recognition and development of opportunities of business, the putting in march of the company, as well as the later development and growth of the same one. In our opinion these two activities must develop of joint form, inside an integral frame since, the majority of the agents are involved in both activities and, in addition, the tasks to carrying out in each of them can meet benefited from the synergies between the above mentioned agents, improving thus the process of promotion to the entrepreneurship considered as an everything. Therefore, the systemic consideration of the above mentioned process reinforces all his elements and provides the frame adapted for the obtaining of ideal results across the creation of networks between the different agents and actors involved in the same one.
183
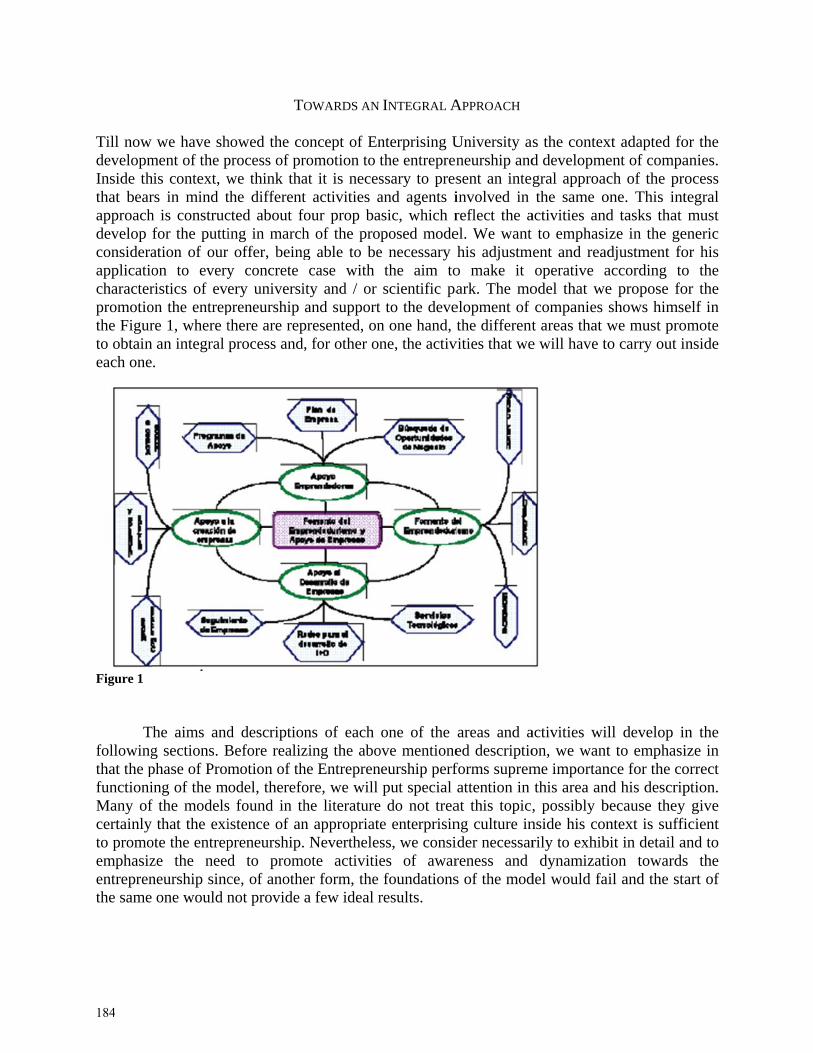
Till now developmInside ththat bearapproachdevelop consideraapplicatiocharacterpromotiothe Figurto obtaineach one
Figure 1
Tfollowingthat the pfunctioniMany ofcertainly to promoemphasizentreprenthe same
we have shment of the phis context, wrs in mind th is construcfor the puttiation of ouron to everyristics of eveon the entrepre 1, where t
n an integral .
The aims andg sections. Bphase of Proming of the mf the models
that the exiote the entrepze the needneurship sincone would n
TO
howed the coprocess of prwe think thathe differentcted about foing in march
offer, beingy concrete ery universipreneurship there are repprocess and
d descriptionBefore realizmotion of thodel, therefo
s found in thistence of anpreneurship.d to promoce, of anothenot provide
OWARDS AN
oncept of Enromotion to tat it is necest activities afour prop bah of the prog able to becase with
ity and / or and support
presented, on, for other on
ns of each zing the abohe Entreprenore, we will he literaturen appropriate Neverthelesote activitieer form, the a few ideal r
INTEGRAL A
nterprising Uthe entreprenssary to presand agents iasic, which rposed mode
e necessary the aim toscientific pa
t to the deven one hand, ne, the activ
one of the ove mentioneneurship perf
put special e do not treae enterprisinss, we consies of awarfoundations
results.
APPROACH
University aneurship andsent an integinvolved in reflect the ael. We want his adjustm
o make it ark. The mo
elopment ofthe different
vities that we
areas and aed descriptioforms supremattention in
at this topic,ng culture inider necessarreness and s of the mod
s the contexd developmegral approacthe same o
activities andto emphasi
ment and readoperative a
odel that wecompanies t areas that we will have to
activities wilon, we wantme importanthis area an, possibly b
nside his conrily to exhib
dynamizatidel would fai
xt adapted foent of compach of the pr
one. This intd tasks that ize in the gedjustment foaccording toe propose foshows himswe must proo carry out i
ll develop it to emphasi
nce for the cod his descrip
because theyntext is suffi
bit in detail aion towardsil and the st
or the anies. ocess tegral must
eneric or his o the or the elf in
omote inside
n the ize in orrect ption.
y give ficient and to s the art of
184
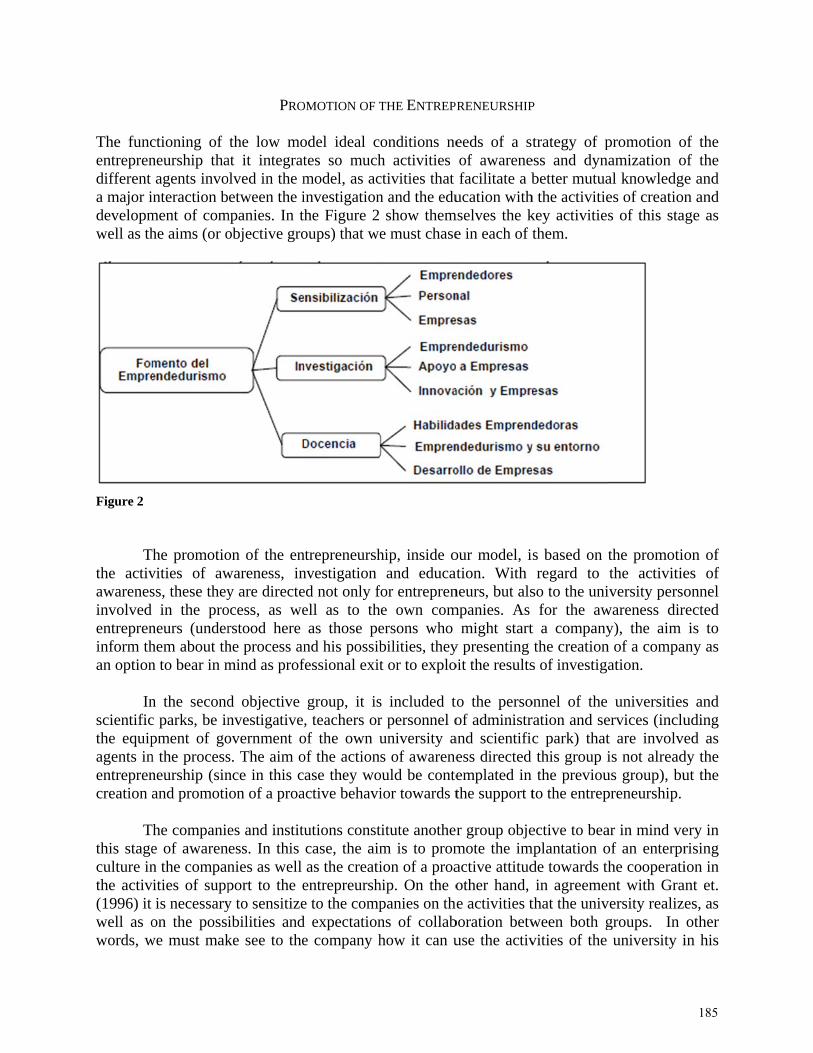
The funcentreprendifferent a major idevelopmwell as th
Figure 2
Tthe activawarenesinvolved entrepreninform than option
Inscientificthe equipagents inentreprencreation a
Tthis stageculture inthe activ(1996) it well as owords, w
ctioning of neurship thaagents invo
interaction bment of comhe aims (or o
The promotiovities of awss, these they
in the proneurs (underhem about thn to bear in m
n the secondc parks, be inpment of gon the processneurship (sinand promoti
The companiee of awarenn the compan
vities of suppis necessary
on the possiwe must mak
PRO
the low moat it integratolved in the metween the i
mpanies. In thobjective gro
on of the enwareness, iny are directe
ocess, as werstood here he process anmind as prof
d objective nvestigativeovernment os. The aim once in this con of a proa
es and instituess. In this nies as well port to the ey to sensitizeibilities andke see to the
OMOTION OF T
odel ideal ctes so muchmodel, as acinvestigationhe Figure 2 oups) that we
ntrepreneurshnvestigation ed not only fell as to thas those pe
nd his possibfessional exit
group, it is, teachers or
of the own uof the actionase they wo
active behavi
utions constcase, the aimas the creati
entrepreurshe to the compd expectatione company h
THE ENTREP
onditions neh activities ctivities that n and the edu
show theme must chase
hip, inside oand educat
for entreprene own comersons who bilities, theyt or to explo
s included tr personnel ouniversity as of awarene
ould be conteior towards t
titute anotherm is to promion of a proa
hip. On the opanies on thens of collabhow it can u
RENEURSHIP
eeds of a stof awarenefacilitate a b
ucation withmselves the k
e in each of t
our model, iation. With neurs, but alsmpanies. As
might starty presenting oit the results
to the persoof administr
and scientificess directed emplated in the support t
r group objemote the imactive attitudother hand, e activities t
boration betwuse the activ
P
trategy of pess and dynabetter mutua
h the activitiekey activitiesthem.
s based on tregard to
so to the unifor the aw
t a companythe creation
s of investiga
onnel of the ration and sec park) thatthis group ithe previou
to the entrep
ective to beamplantation o
de towards thin agreemen
that the univween both gvities of the
promotion oamization oal knowledges of creations of this sta
the promotiothe activitie
iversity persowareness diry), the aim
n of a compaation.
universitieservices (inclut are involveis not alread
us group), bupreneurship.
ar in mind veof an enterprhe cooperatint with Gra
versity realizgroups. In university i
of the of the e and n and
age as
on of es of onnel rected
is to any as
s and uding ed as
dy the ut the
ery in rising ion in
ant et. es, as other in his
185

own benethis instit
Oinvestigain all the
Swhole pranswerinand Rosethe ideaentreprensuccess oone that model.
Figure 3
This stagentreprenof busineThe aims
efit and senstution to solv
Other two aimation and tea
areas.
ince we courocess, offerng in certain enberg, 1986al functioninneurship. Thof the modellearns how
ge integrateneurs duringess, bearing s and activiti
sitize them ove certain pr
ms that we mching. Thus
uld have obring and receway the me
6). In agreemng of our
he success ol in his set. Tthis stage in
es the activg the process
in mind thaties of this sta
on his right aroblems (tea
must not forgwe will clos
bserved, the eiving feedbechanism desment with th
model wilof this stage The functionnfluences an
SUPPORT T
vities that th of planningt in this stagage turn out
and, in certaching them h
get and that ase the circle
activities pback of the rscribed in thhe expositionll depend is a conditi
ning of the mnd one sees i
TO ENTREPRE
hey must bg of the futurge the compato be reflect
ain way 'oblihow to do it
appear in theof the prom
proposed in rest of areashe interactiven of the moon an appion necessarmodel showinfluenced b
ENEURS
be carried ore company any still is nted in the Fig
igation', of at).
e previous fimotion of the
this stage as and activite model of i
odel of Klinepropriate Prry, but not s
ws itself in thby the rest o
out to offerand develop
not competingure 4.
asking for he
figure are thoentrepreneu
are related ties of the minnovation (Ke and Rosenromotion ofsufficient, fohe Figure 3 if elements o
r support topment of theng on the ma
elp to
ose of urship
to the model,
Kline nberg, f the or the in the of the
o the e plan arket.
186

This stagadjustmeduring a followingcould devsince wentrepren
Owhat it bcapital, fcompanyduring thlocate thecompanieseveral nmust devpartners, this respe
From ourcompanieoffering t
Fcompanyit. The Fi
ge it includeent to the maperiod in w
g one, they rvelop, what e can obseneurship.
One of the acbecomes necfinancial insy. The accesshe first yearse facilities anes, but alsonew companvelop his com
being able ect, facilitati
r point of vies and his lathem suppor
or it, in thisy for his firstigure 6 show
S
s all those aarket. The ai
which she is creceive specgreat part oferve in the
tivities that wessary to facstitutions ans to incubatis of life of tnd the savin for the con
nies are in ammercial nethe agents i
ing this way
SUPPOR
iew, the enteaunch the mart and servic
s stage we pt years as w
ws the activit
SUPPORT THE
activities of sim of the saconsidered tcial importanf the activitiee Figure 5
we must beacilitate to th
nd possible pion and relatthe company
ng that suppontact, relatio
a common spetwork acrosinvolved in the launch o
RT TO THE DE
erprising unarket, but sues during the
propose the aell as the latties carried o
E ENTREPREN
support to thme one is th
to be highly nce the netwes they will b, where th
ar in mind ine company cpartners whted services y, not only foses having gons and mupace. Finallyss the contacthe process
of the compa
EVELOPMENT
niversities noupport also ae stage of de
accomplishmter support tout in this fin
NEURSHIP
he new comhe vigilance vulnerable.
works and cobe directed t
he activities
n this stage, icontacts wit
ho were inteconstitutes afor the dispogeneral serviutual learniny, during thct with clien
offer informany to the m
T OF COMPAN
ot only musta fluid relatioevelopment a
ment of a foto facilitate hnal stage of t
mpany duringand supportBoth in this
ontacts that tto give supps of suppo
is the accessth ' businesserested in taa support of osition of spices shared w
ng that can hese first yeants, suppliersmation, supp
market.
NIES
t support theon with thesand growth.
ollow-up andhis growth ithe model.
g his creationt of the coms stage and ithe new comport in this asort learn to
s to financin angels ' andaking part ingreat impor
paces in whiwith other lotake place wars, the coms and commeport and rela
e creation ofe new comp
d coaching of this one ne
n and mpany in the
mpany spect, o the
g, for d risk n the
rtance ich to odged when
mpany ercial ate in
f new panies
of the eeded
187
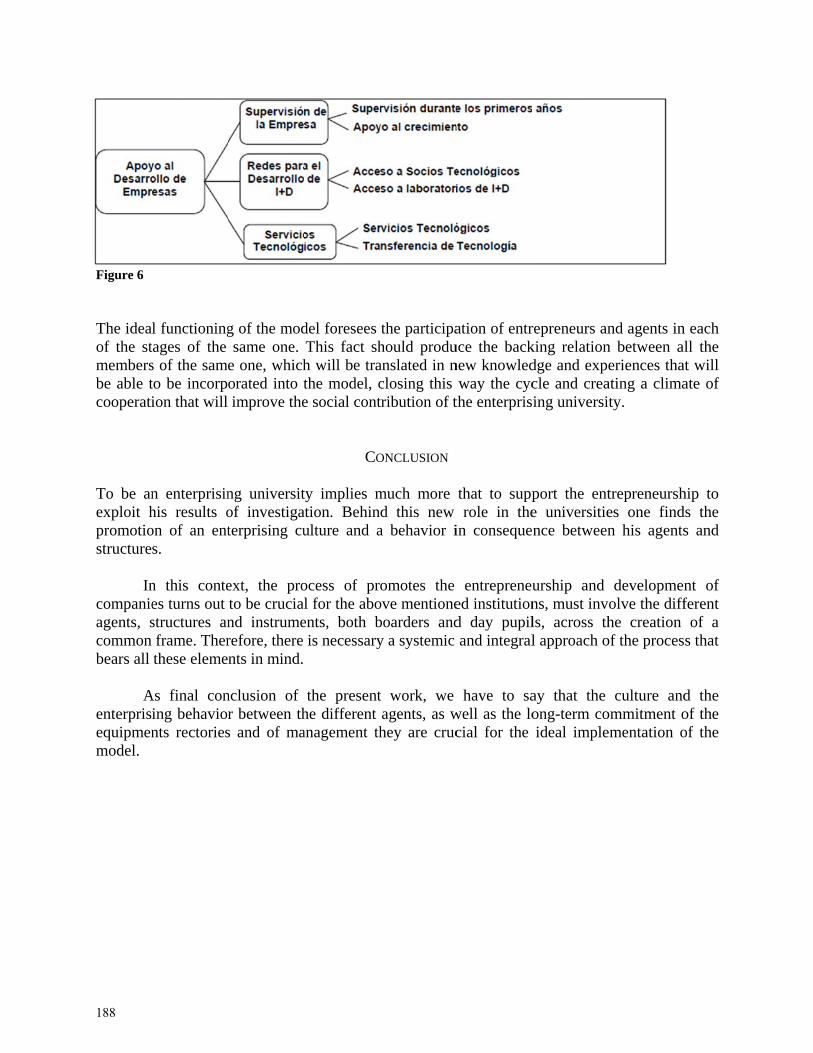
Figure 6
The ideaof the stmembersbe able tcooperati
To be anexploit hpromotiostructure
Incompanieagents, scommon bears all
Aenterprisequipmenmodel.
l functioningtages of the s of the samto be incorpion that will
n enterprisinhis results oon of an ents.
n this contees turns out structures anframe. Therthese eleme
As final coning behaviornts rectories
g of the modsame one.
e one, whichorated into timprove the
ng universitof investigaterprising cu
ext, the proto be cruciand instrumerefore, there nts in mind.
nclusion of r between ths and of ma
del foresees This fact shh will be trathe model, ce social cont
CO
ty implies mation. Behinulture and a
ocess of prl for the abo
ents, both bis necessary
the presenthe different anagement th
the participahould produanslated in nclosing this tribution of t
ONCLUSION
much more d this new a behavior i
omotes the ove mentioneboarders andy a systemic
t work, we agents, as whey are cruc
ation of entruce the backnew knowled
way the cycthe enterpris
that to supprole in the
in conseque
entrepreneued institutiond day pupiland integral
have to sawell as the locial for the
repreneurs anking relationdge and expecle and creaing universi
port the ente universitience between
urship and ns, must invls, across thl approach o
ay that the ong-term coideal imple
nd agents inn between aleriences tha
ating a climaty.
trepreneurshes one findn his agents
developmenolve the diffhe creation
of the proces
culture andommitment oementation o
n each ll the
at will ate of
hip to ds the s and
nt of ferent
of a s that
d the of the of the
188
REFERENCES Castro Martínez, E.; Fernández de Lucio, I.; Gutiérrez Gracia, A. y Añón Marín, M.J. (2001).
"La Estrategia de Dinamización en la Cooperación Investigación-Empresa: Desarrollo Conceptual y Aplicaciones". XI Seminario Internacional de Gestión Tecnológica ALTEC 2005.
Salvador de Bahía, Octubre de 2005 CERES (1998). “Innovación en la Universidad. Empresas Spin-off”. Informe interno. Valencia:
Universidad Politécnica de Valencia. Clark, B. (2004). "Delineating the Character of the Entrepreneurial University". Higher
Education Policy, Vol.17; pp.355-370. Clark, B. (1996). "Creando Universidades Emprendedoras en Europa". Revista Valenciana
d'Estudis Autonòmics, Vol.21; pp.373-392. Clark, B. (1998). Creating Entrepreneurial Universities: Organizational Pathways of
Transformation. Oxford: Pergamon Press. Cuyvers, R. y Zimmermann, E. (2002). "KUL as a virtual incubator for new, knowledgeintensive
busi-nesses", en K. Debackere y R. De Bondt (Eds.). Leuven Research and Development: 30 years of break-throughs and innovations towards an entrepreneurial university. Leuven: KUL Press,
Dalmau, J.I.; Alonso, J.L. y Colomer, J. (2003). Programa IDEAS. Un modelo de éxito para fomentar la creación de empresas desde las universidades. Valencia: Universidad Politécnica de Valencia.
Etzkowitz, H. (1983). "Entrepreneurial scientists and entrepreneurial universities in American academic science". Minerva, Vol.1, no.2-3; pp.198-233.
Etzkowitz, H. (1998). "The norms of entrepreneurial science: cognitive effects of the new university-industry linkages". Research Policy, Vol.27, no.8; pp.823-833.
Etzkowitz, H. (2003). "Research groups as 'quasifirms' the invention of the entrepreneurial university". Research Policy, Vol.32, no.1; pp.109-131.
Etzkowitz, H. (2004). "The evolution of entrepreneurial university". International Journal of Technology and Globalisation, Vol.1, no.1; pp.64-77.
Gibb, A. (1999). "Creating an entrepreneurial culture in support of SMEs". Small Enterprise Development, Vol.10, no.4; pp.27-38.
Goddard, J. (1998). "The role of universities in regional development". Working paper for CRE-Columbus. Paris, 1 de agosto de 1998
Grant, C.A.; Van der Sijde, P.C.; Henry, C.; Koswenska, I.; Scott, T. y Chassagne, G. (1996). "Routes of technology transfer to SMEs: a cross-european perspective". Industry & Higher Education, pp.293-299.
Grit, K. (2000). Economisering als probleem - Een studie naar de bedrijfsmatige stad en de ondernemende universiteit. Editorial Van Gorcum.
189
Groen, A. (2005). "Knowledge intensive entrepreneurship in networks: towards a multilevel/ multi dimensional approach". Journal of Entreprising Culture, Vol.13, no.1; pp.69-88.
Kirwan, P.; Van der Sijde, P.C. y Groen, A. (2006). "Assessing the needs of new technology based firms (NTBFs): an investigation among spin-off companies from six European Universities". The International Entrepreneurship and Management Journal, Vol.2, no.2; pp.173-187.
Kline, S.J. y Rosenberg, N. (1986) “An Overview of Innovation”, en Landau, R. y Rosenberg, N. (Eds.). The Positive Sum Strategy. Washington: National Academy Press, pp 275-306.
Molas-Gallart, J.; Salter, A. y Patel, P. (2002). "Measuring third stream activities". Brighton. SPRU.
Nikos (2004). "Nikos (2004) Progress Report 2001-2004. Nikos, University of Twente. The Netherlands.". The Nethederlands. Nikos, University of Twente.
O'Shea, R.P.; Allen, T.J.; Morse, K.P.; O'Gorman, C. y Roche, F. (2007). "Delineating the anatomy of an entrepreneurial university: the Massachusetts Institute of Technology experience". R&D Management, Vol.37, no.1; pp.1-16.
Parsons, T. (1964). The social system. New York: The Free Press. Rasmussen, E. y Borch, O.J. (2006). "The university and the spin-off process. A dynamic
capability approach", en D. Urbano (Ed.). Diversity in entrepreneurship. 3rd Inter-RENT Online Publication. Turku: European Council for Small Business and Entrepreneurship.
Van der Sijde, P.C.; Ridder, A.; Van Benthem, J. y Groen, A. (2002). "Entrepreneurship and entrepreneurship stimulation at the University of Twente",en P.C. Van der Sijde; A. Ridder;
J.M. Gòmez; J.T. Pastor; D. Galiano y I. Mira (Eds.). Infrastructures for Academic Spin-off Companies. CEE Limencop, S.L.
190
2015 PLS Applications Symposium1
Conducting a Factor-Based PLS-SEM Analysis with WarpPLS
NED KOCK Texas A&M International University, Laredo, Texas, USA
There has been much debate among proponents and detractors of the use of the partial least squares (PLS) method in the context of structural equation modeling (SEM). This debate is centered on one main issue – classic PLS methods do not deal with actual factors, but with composites. As a result, classic PLS methods yield biased estimates of model parameters, even as sample sizes grow to infinity. In this presentation we discuss a new method to conduct factor-based PLS-SEM analyses, which could be a solid step in the resolution of this debate. We illustrate the use of this new method through a business process redesign study. Our illustration employs the software WarpPLS, version 5.0, which has been developed by the presenter. This software makes no data distribution assumptions, enables linear and nonlinear multivariate analyses (including PLS-SEM analyses), and is currently used by over 7,000 researchers in 33 countries to analyze data in a variety of disciplines. KEYWORDS Multivariate Statistics, Partial Least Squares, Structural Equation Modeling, Components, Factors, Business Process Redesign
1 For additional information on the 2015 PLS Applications Symposium, please visit: http://plsas.net/
191

2015 PLS Applications Symposium1
What Drives Profits, Revenue or Assets?
J.A. (JIM) CONNELL University of Montevallo, Montevallo, Alabama, USA
In common financial modeling, revenue leads to profits through the path of the income statement. This manuscript addresses the question of how the firm’s asset level fits into this model. The assets controlled by the firm are used to produce the products or services responsible for revenue, so assets should be positively correlated with both revenue and profits. At the same time, profits that are not paid out as dividends are reinvested in the firm, increasing the asset base. From this viewpoint, an increase in profits should lead to an increase in assets. Both of the suggested models are estimated and compared, using the 2013 Fortune 500 as a dataset. KEYWORDS Multivariate Statistics, Partial Least Squares, Structural Equation Modeling, Finance, Accounting
1 For additional information on the 2015 PLS Applications Symposium, please visit: http://plsas.net/
192
2015 PLS Applications Symposium1
A PLS Modeling Approach for Analysis of Survey Data Examining Adoption of Agile Software Engineering
TOM GRADEL Temple University, Philadelphia, Pennsylvania, USA
JOHN T. NOSEK Temple University, Philadelphia, Pennsylvania, USA
Agile software engineering practices have had a dramatic affect on the development of software and are acknowledged as a primary contributor for increasing the success rate of software projects from a dismal 16% in 2007 to 39% in 2013. Over that same multi-year period, Ambysoft created many surveys that examined how people and companies applied Agile in a variety of different projects and environments. Although facets of Agile, such as pair programming, have been studied in detail, little is known about why Agile performs as well as it does, since Agile encompasses complex interactions between people, processes and technology. An opportunistic data set consisting of seven years of survey data is currently being examined to determine whether a PLS-based approach to data analysis is sufficient to extract drivers of project success as a result of using Agile. Although there are many surveys and many years of data, much of it cannot be used, so a subset of available data will be extracted for model construction. WarpPLS will be used to construct a path analysis model of drivers to Agile success. Path analysis has been chosen because it is desirable to have multiple indicators to provide meaning to latent variables (LVs) representing drivers to project success outcomes. Control variables will also be formulated, likely including information such as the experience level of the person completing the survey, their national or international location, their industry focus, and the type of the Agile approach used. For example, Scrum is the most popular Agile approach, but there are others. Since a theoretical model has yet to be constructed, indicators will be examined for high degrees of correlation, and combinations of these indicators will be used to construct reflective model variables. Other formative model variables will be constructed using indicators that are less highly correlated. Since multicollinearity between LVs is undesirable because the contribution of individual variables within the model may be misstated, WarpPLS will be used to examine multicollinearity between variables by determining a Pearson correlation coefficient (r) and variance inflation factors (VIFs). LVs will be adjusted if significant levels of multicollinearity are measured. Interactions between the LVs will be constructed based on the authors' knowledge of Agile and theoretical models of salient features of Agile components. For example, Agile methods are team-centric, so prior models of drivers to team performance will be used to suggest interactions between model variables. Similarly, task 1 For additional information on the 2015 PLS Applications Symposium, please visit: http://plsas.net/
193

performance can be related to self-management, potentially resulting in creation of other links within the model. Both direct and moderating links between LVs will be constructed in this fashion. In summary, model construction will be exploratory based on the opportunistic sample data. An anticipated second phase will validate the model constructed in this phase based on a new independent data set. This second phase is not part of this presentation. KEYWORDS Agile software, Partial Least Squares, WarpPLS, path analysis, PLS
194

2015 PLS Applications Symposium1
Cultural Intelligence and Job Performance in International Transportation Business Settings: A PLS-based Structural Equation
Modeling Study
SHAUN SEXTON Megabus USA, Chicago, Illinois, USA
NED KOCK Texas A&M International University, Laredo, Texas, USA
Motivating language (ML) is a technique used by managers to motivate subordinates using a three-part method aimed at reducing uncertainty, creating meaning, and establishing empathy. Preliminary research has shown that ML can help to improve such worker outcome variables as satisfaction, intent to stay, innovativeness, and performance. This study posits that a supervisor’s use of ML will significantly improve a subordinate’s cultural intelligence (CQ), which identifies an individual’s ability to adapt to new cultural situations through another multi-part method involving a person’s cognitive, metacognitive, motivational, and behavioral dynamics. This study examined a market leader in the motorcoach transportation industry by surveying employees from one of its largest divisions. Of the returned surveys, 257 were usable, with responses from all departments and each level of the organizational hierarchy. This industry has a large number of non-traditional workers who do not report to a traditional office setting but complete tasks outside the workplace. Hypotheses were examined using a linear model initially. However, an exploratory nonlinear test was also conducted to identify relationships that may have the shape of a U and J curve. Initial results indicated significant relationships between ML and the employee outcome variables, CQ and the employee outcome variables, and interrelationships among the employee outcome variables. KEYWORDS Multivariate Statistics, Partial Least Squares, Structural Equation Modeling, Motivating Language, Cultural Intelligence
1 For additional information on the 2015 PLS Applications Symposium, please visit: http://plsas.net/
195
Los INCOTERMS y su Importancia para los Contratos Internacionales
José Ángel Adame Barco Facultad de Comercio, Administración, y Ciencias Sociales,
Universidad Autónoma de Tamaulipas
Jesús Eduardo Sánchez Gámez1 Facultad de Comercio, Administración, y Ciencias Sociales,
Universidad Autónoma de Tamaulipas
Dr. Fernando Hernández Contreras Facultad de Comercio, Administración, y Ciencias Sociales,
Universidad Autónoma de Tamaulipas Con la globalización las empresas lograron extender sus mercados hacia otros países logrando así distribuir sus servicios alrededor de todo el globo, con lo que a su vez surgió la necesidad de establecer términos que fueran comprendidos, aceptados y aplicables mundialmente a la hora de establecer un contrato de compra venta internacional. PALABRAS CLAVE INCOTERMS, términos de comercio internacional, contratos internacionales. With globalization, companies were able to expand their markets to other countries. This allowed the distribution of their services and merchandise all around the globe. Because of this, a necessity arose for an establishment of terms which could be understood, accepted, and globally applicable at the moment of setting up a contract of international trade. KEYWORDS INCOTERMS, terms of international trade, international contracts.
1 Address correspondence to Jesús Eduardo Sánchez Gámez, Facultad de Comercio, Administración, y Ciencias Sociales, Universidad Autónoma de Tamaulipas. E-mail: [email protected]
196
1.-INTRODUCCIÓN La globalización ha permitido que las empresas expandan sus horizontes y distribuyan sus mercancías a cada vez más lugares a lo largo del planeta. Es así como hoy día tenemos abundantes bloques y organizaciones dedicadas al comercio internacional. Una de estas organizaciones que ha contribuido a facilitar las diversas modalidades de la entrega de mercancías es la Cámara Internacional de Comercio. Cuando se celebra un contrato internacional entre comprador y vendedor se deben establecer los términos de venta. Los términos de venta hacen referencia al punto en el que un vendedor transfiere al comprador una propiedad y los acuerdos que se hacen para trasportarla. Existe un conjunto de reglas ampliamente conocidas e utilizadas llamados Términos de Comercio Exterior (INCOTERMS) que permiten una sencilla y clara interpretación de los términos más utilizados al momento de establecer acuerdos de compra y venta de bienes a nivel internacional.2 También conocidos como términos de comercio internacional, fueron desarrollados por la Cámara Internacional de Comercio, con sede en la ciudad de Paris, que reunió a los mejores especialistas en la materia para discutir los términos que deberían usarse. Entraron en vigor el 10 de julio de 1990 y desde entonces han sido modificados con la finalidad de adaptarlos a las prácticas comerciales que estén vigentes en ese tiempo.3 En cada termino de aclaran las responsabilidades por parte de los compradores y vendedores, de esta manera no es necesario detallar cada parte del contrato, simplemente se nombra el termino elegido. Mas sin embargo el alcance de los INCOTERMS solo establece los derechos y obligaciones en un contrato de compra venta de las partes involucradas y solas a mercancías físicas, quedando excluidos los términos de contratación de los transportes, fletes, seguros, financiación, forma de pago etc.4
A la par de lo INCOTERMS tenemos otro elemento de gran importancia: la creación de
contratos estipular las condiciones de la entrega de las mercancías. Los citados contratos adquieren importancia dentro de la actividad comercial debido a que permiten colocar mercancías en diversos mercados a través de las fronteras. Es importante destacar que un contrato es internacional solo cuando las partes involucradas en el traslado de las mercancías esta en diferentes países. Al implementarse el uso de los INCOTERMS se logra resolver gran parte de las desconfianzas acerca de las prácticas comerciales que existían entre las partes, reducir el tiempo de negociación, les ahorro gastos y perdidas innecesarias y maximizo su margen de ganancias5. Esta investigación tiene por objeto analizar las ventajas del empleo de los INCOTERMS y proponer la creación e inserción de nuevos términos en contratos internacionales. Se organiza de la siguiente manera: la sección 2 habla sobre el surgimiento de los INCOTERMS en la vida del comercio global, 2 Rubio, José (et al), Gestión del cobro de las operaciones de venta internacional, (Alicante, Editorial Club Universitario, 2008). Pág. 66. 3 Acosta, Felipe, INCOTERMS, Términos de Compra- Venta Internacional, (México, Ediciones Fiscales ISEF, 2005). Pág. 13. 4 Organización de las Naciones Unidas, Anuario, (Publicación de las Naciones Unidas, 2000) Pág. 630. 5 (ibid)
197
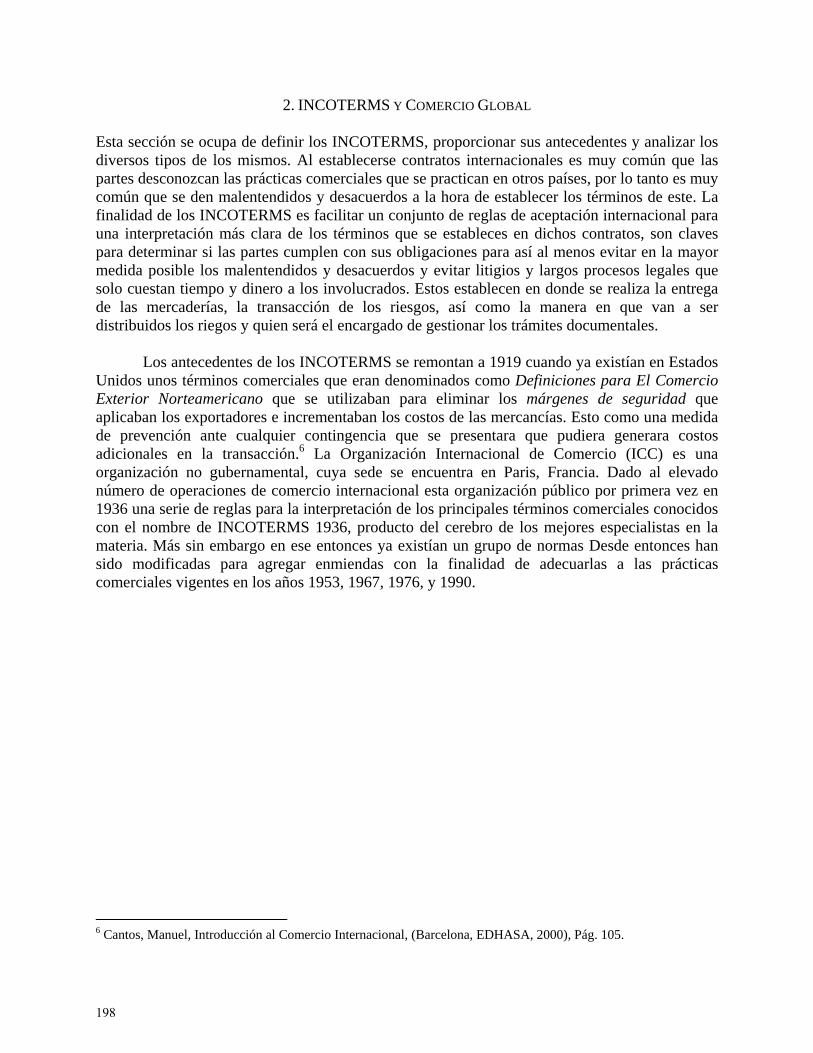
2. INCOTERMS Y COMERCIO GLOBAL Esta sección se ocupa de definir los INCOTERMS, proporcionar sus antecedentes y analizar los diversos tipos de los mismos. Al establecerse contratos internacionales es muy común que las partes desconozcan las prácticas comerciales que se practican en otros países, por lo tanto es muy común que se den malentendidos y desacuerdos a la hora de establecer los términos de este. La finalidad de los INCOTERMS es facilitar un conjunto de reglas de aceptación internacional para una interpretación más clara de los términos que se estableces en dichos contratos, son claves para determinar si las partes cumplen con sus obligaciones para así al menos evitar en la mayor medida posible los malentendidos y desacuerdos y evitar litigios y largos procesos legales que solo cuestan tiempo y dinero a los involucrados. Estos establecen en donde se realiza la entrega de las mercaderías, la transacción de los riesgos, así como la manera en que van a ser distribuidos los riegos y quien será el encargado de gestionar los trámites documentales.
Los antecedentes de los INCOTERMS se remontan a 1919 cuando ya existían en Estados
Unidos unos términos comerciales que eran denominados como Definiciones para El Comercio Exterior Norteamericano que se utilizaban para eliminar los márgenes de seguridad que aplicaban los exportadores e incrementaban los costos de las mercancías. Esto como una medida de prevención ante cualquier contingencia que se presentara que pudiera generara costos adicionales en la transacción.6 La Organización Internacional de Comercio (ICC) es una organización no gubernamental, cuya sede se encuentra en Paris, Francia. Dado al elevado número de operaciones de comercio internacional esta organización público por primera vez en 1936 una serie de reglas para la interpretación de los principales términos comerciales conocidos con el nombre de INCOTERMS 1936, producto del cerebro de los mejores especialistas en la materia. Más sin embargo en ese entonces ya existían un grupo de normas Desde entonces han sido modificadas para agregar enmiendas con la finalidad de adecuarlas a las prácticas comerciales vigentes en los años 1953, 1967, 1976, y 1990.
6 Cantos, Manuel, Introducción al Comercio Internacional, (Barcelona, EDHASA, 2000), Pág. 105.
198
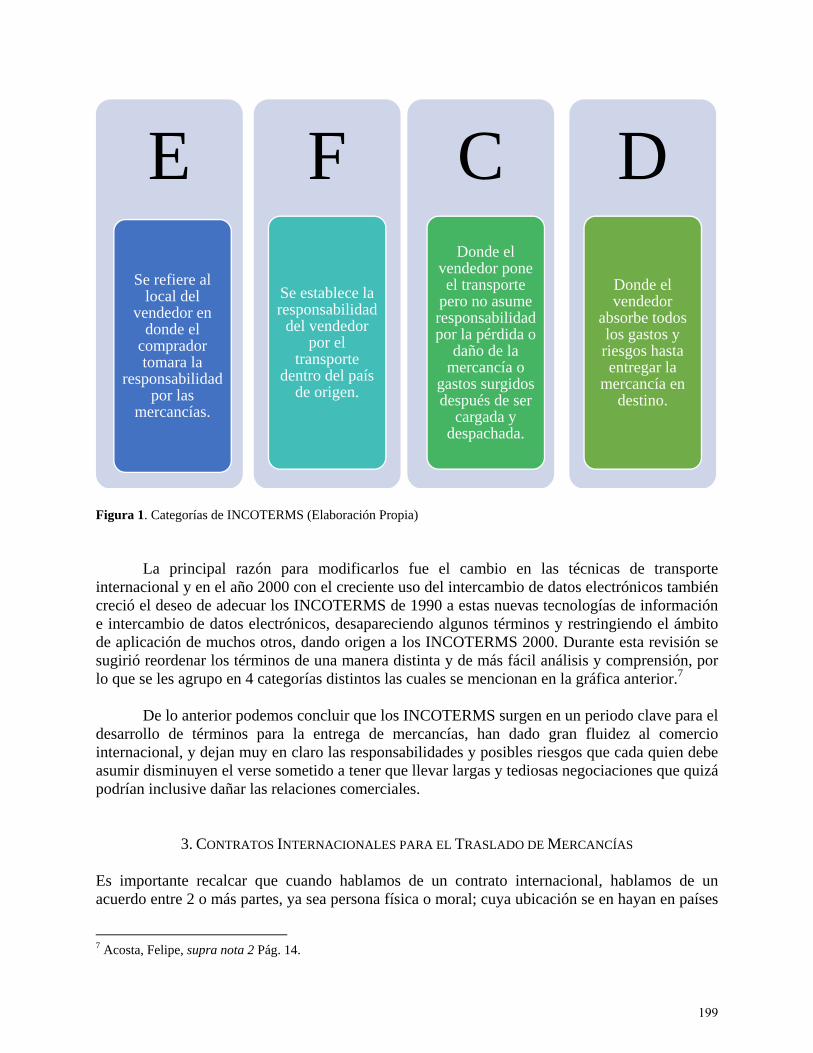
Figura 1. Categorías de INCOTERMS (Elaboración Propia)
La principal razón para modificarlos fue el cambio en las técnicas de transporte internacional y en el año 2000 con el creciente uso del intercambio de datos electrónicos también creció el deseo de adecuar los INCOTERMS de 1990 a estas nuevas tecnologías de información e intercambio de datos electrónicos, desapareciendo algunos términos y restringiendo el ámbito de aplicación de muchos otros, dando origen a los INCOTERMS 2000. Durante esta revisión se sugirió reordenar los términos de una manera distinta y de más fácil análisis y comprensión, por lo que se les agrupo en 4 categorías distintos las cuales se mencionan en la gráfica anterior.7
De lo anterior podemos concluir que los INCOTERMS surgen en un periodo clave para el
desarrollo de términos para la entrega de mercancías, han dado gran fluidez al comercio internacional, y dejan muy en claro las responsabilidades y posibles riesgos que cada quien debe asumir disminuyen el verse sometido a tener que llevar largas y tediosas negociaciones que quizá podrían inclusive dañar las relaciones comerciales.
3. CONTRATOS INTERNACIONALES PARA EL TRASLADO DE MERCANCÍAS Es importante recalcar que cuando hablamos de un contrato internacional, hablamos de un acuerdo entre 2 o más partes, ya sea persona física o moral; cuya ubicación se en hayan en países
7 Acosta, Felipe, supra nota 2 Pág. 14.
E
Se refiere al local del
vendedor en donde el
comprador tomara la
responsabilidad por las
mercancías.
F
Se establece la responsabilidad
del vendedor por el
transporte dentro del país
de origen.
CDonde el
vendedor pone el transporte
pero no asume responsabilidad por la pérdida o
daño de la mercancía o
gastos surgidos después de ser
cargada y despachada.
D
Donde el vendedor
absorbe todos los gastos y riesgos hasta entregar la
mercancía en destino.
199

diferentes. La Organización Mundial del Comercio surgió el 15 de abril de 1994 con la firma de los acuerdos de la Ronda Uruguay en Marraquech, que puso fin al octavo ciclo de negociaciones comerciales multilaterales del GATT, a fin de que sea la encargada de gestionar todos los distintos tipos de acuerdos sobre negocios y productos a nivel internacional. A la vez tendrá la función de ayudar a facilitar las relaciones comerciales y discutir y solucionar conflictos entre los países miembros. Los más beneficiados con este acuerdo y con la gestión de este organismo serían las empresas que operan en un ámbito internacional, ya que les brindaría mayor seguridad jurídica y económica al momento de entablar relaciones con otras en otros países.
Pero, ¿realmente por qué es importante establecer un contrato? Al aumentar competitividad de las empresas y la complejidad de los movimientos internacionales incrementa también los riesgos e incertidumbres entre las partes. Un contrato es considerado un “instrumento” o método de prevención que obliga a las partes a cooperar entre sí de manera permanente para prever y cubrir posibles riesgos en el traslado de sus mercancía.
Hay distintos aspectos que se deben tomar en cuenta al establecer un contrato, como la
diferencia y la gran diversidad de prácticas comerciales vigentes en cada país, tomando en cuenta tanto su legislación; ya se aduanera o en general, así como hay que considerar los riesgos de entrega e incumplimiento pero es importante conocer también el tipo de contrato que vamos a utilizar. 8
En la Tabla 1 se enlistan las distintas clases de contratos con lo que nos podemos encontrar y sus características.
Clases de Contratos.
Partes Involucradas.
Públicos: Entre gobiernos.
Privados: Entre empresarios
Por Nacionalidad de las Partes.
Domésticos: Partes o residencias en el mismo estado.
Internacionales: Partes o domicilios en distintos estados.
Naturaleza de sus Vínculos.
Unilaterales: Originan obligaciones para una sola de las partes
Bilaterales: Obligaciones iguales para ambas partes.
Por su finalidad.
Onerosos: Cada parte pretende obtener un beneficio equitativo a su participación.
Gratuitos: No existe contraprestación ni precio.
Por su Regulación Legal.
Tradicionales: Con regulación por códigos y leyes.
Atípicos: Carecen de alguna regulación codificada.
8 De la Fuente, Marta (et al), Modelos de contratos Internacionales, (Madrid, Fundación Confemetal, 1999).
200

Por su Ejecución.
De Tracto Único: Ejecución única.
De Tracto sucesivo: Su aplicación será de modo continuo.
Por la Forma del Contrato.
Consénsuales: Se establecen por el mero acuerdo de las partes.
Solemnes: Precisan forma reglada para su celebración.
Reales: Requieren consentimiento y entrega del bien por una de las partes o ambas.
Tabla 1. Clases de Contratos (Elaboración Propia). Es de suma importancia elegir el que mejor se adapte a nuestras necesidades e intereses que aunado a el uso del INCOTERM adecuado reducirán en gran medida los riesgos en nuestra operación.
4. INCOTERMS: ¿YA TODO ESTÁ ESCRITO? La ICC al ser una institución privada no tiene la facultad para establecer normas con validez jurídica, por lo tanto; las partes involucradas no se ven obligadas a hacer uso obligatorio de los INCOTERMS. A pesar de que sean de uso diario en prácticamente todos los contratos que se establecen, estos no tendrán validez ante un tribunal o un juez. Si se decide utilizarlos se debe estipular de manera clara el término que se va a utilizar, además de la versión empleada dentro del contrato que se va a establecer y plantear la posibilidad de cambiarlo para que puede adaptarse a las necesidades de alguna o ambas partes.9
Los INCOTERMS solamente tratan algunos de los aspectos relacionados a los contratos
de compraventa, como el lugar donde el vendedor deberá entregar las mercaderías a su comprador, el régimen con el cual se hará el traspaso de riesgos, y las responsabilidades y los gastos que deberán asumir cada uno de los involucrados. Más sin embargo los INCOTERMS no son leyes y por lo tanto no son de aplicación obligatoria, por lo tanto no hacen alusión a aspectos como el régimen del contrato, o que pasara si este un se cumpliera, la forma de pago y el régimen de propiedad de las mercancías. Estos solo son aplicables a contratos de compraventa de bienes muebles, es decir; mercancías físicas. No podrán ser aplicados para la venta de bienes inmuebles como por ejemplo un software o el derecho de propiedad intelectual.
A pesar de que sus condiciones establecen que son de uso internacional, nada impide que
puede hacerse uso de estos cuando la operación es interna, resultando un gran apoyo, pero por lógica excluyendo los puntos que hagan referencia a la importación y exportación.10
9 Rubio, José (et al), supra nota 1 Pág. 69. 10 Gonzales, Isabel (et al), Gestión del comercio exterior, (Madrid, ESIC EDITORIAL, 2011), Pág. 67.
201

5. MARCO DE APLICACIÓN DE LOS INCOTERMS A LOS CONTRATOS INTERNACIONALES. De acuerdo a las clausulas acordadas en nuestro contrato hay diversos criterios de aplicación y recomendaciones para la ideal elección del INCOTERM que se acople a este. Es necesario especificar nuestro término de acuerdo a las 3 iniciales en inglés que identifican cada término y a continuación el lugar, terminal o almacén al que se hace referencia con la mayor precisión posible, ya que esta determina dos condiciones esenciales en las condiciones citadas que son el punto de entrega y transmisión de riesgos y el momento en que el vendedor se deslinda de responsabilidades; seguido de la versión en la que se asienta nuestro contrato. Si se desea utilizar variantes de los INCOTERMS es importante aclarar y explicar dentro del contrato los detalles el alcance que tendrán dichas variables. A su vez la regla, así como sus variantes deben ser especificadas en los distintos documentos de compra y venta como pueden ser los pedidos, facturas, certificados, listas de transporte, listas de empaque y sobre todo en los documentos aduaneros.
A pesar de que el contrato de venta y el de transportación son independientes uno de otro,
es de suma importancia notificar a la empresa encargada del transporte la regla que se va a utilizar, esto para coordinar sus obligaciones y los costos de transporte que nos será de gran utilidad para poder llevar a cabo cotizaciones detalladas para asegurar la rentabilidad de la operación y reducir el costo final de nuestra cadena de logística.11
6. EXPLICACIÓN Y ANÁLISIS DE LOS INCOTERMS. Dentro de los INCONTERMS las obligaciones y responsabilidades que deben de asumir los compradores y vendedores se engloban en títulos.
11 Cabrera, Alfonso, Las reglas Incoterms 2010®. Manual para usarlas con eficacia, (Barcelona, Marge Books, 2013). Pág. 194.
202
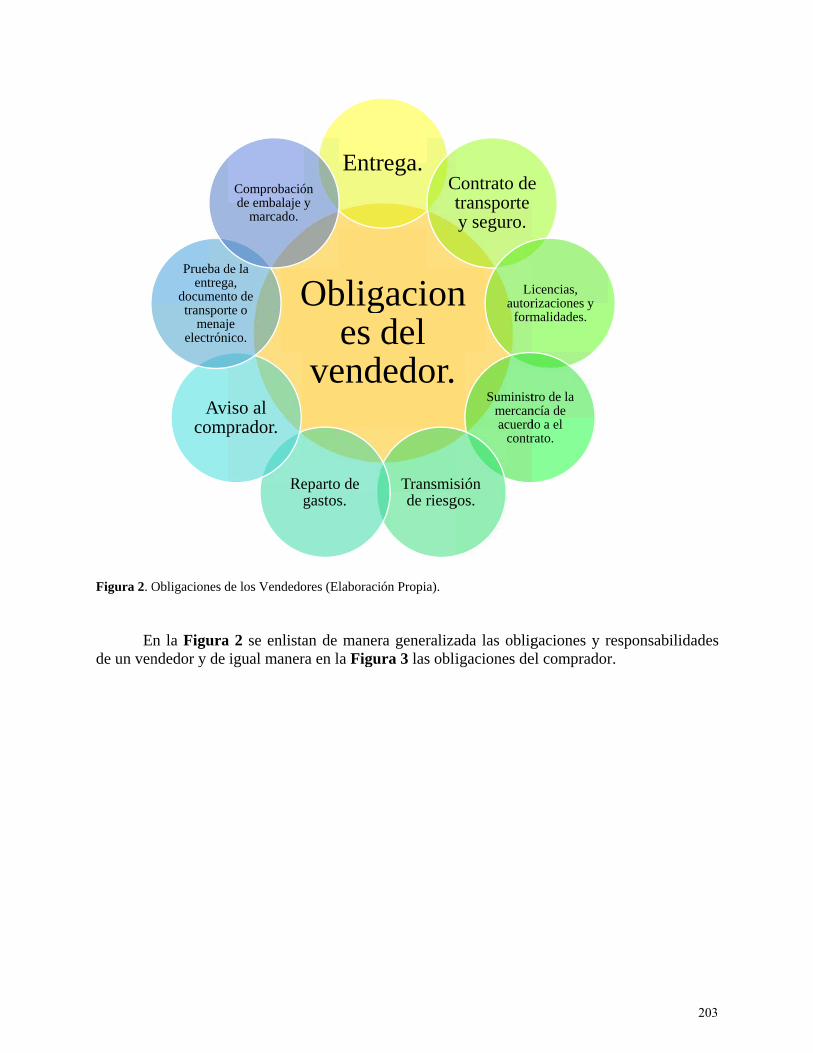
Figura 2. O
Ede un ven
Obligaciones d
En la Figurandedor y de
Avicomp
Prueba dentreg
documenttranspor
menajelectróni
de los Vendedo
a 2 se enlistaigual maner
O
Reg
iso al prador.
de la a, to de te o e ico.
Comprobacióde embalaje y
marcado.
ores (Elaboraci
an de manerra en la Figu
Obliges
vend
Entr
eparto de gastos.
ón y
ión Propia).
ra generalizaura 3 las obli
gaciondel
dedor.
rega.Ct
Transmisde riesg
ada las obligigaciones de
n
Contrato detransporte y seguro.
Liautor
form
Suministmercanacuerd
contr
sión gos.
gaciones y rel comprador
e
icencias, rizaciones y malidades.
tro de la ncía de do a el rato.
responsabilidr.
dades
203

Figura 3. O
YINCOTE
Grupo E.
1. E
En este disposiciestar ya factura cnecesaria
12 Acosta,
Obligaciones d
Ya establecidERM, para su
. De Salida
EXW: En Fab
término el ión del compdebidamente
comercial coas para los tr
, Felipe supra n
Avivend
Prueba dentreg
documenttranspor
menajelectróni
de los Comprad
das las obligu mejor com
brica - Lugar
más beneficprador la mee marcada yorrespondienrámites adua
nota 2 Pág. 51.
O
c
Rde
iso al dedor.
de la a, to de te o e ico.
Inspeccióde la
mercancía
dores (Elaborac
gaciones de mprensión se
r Convenido
ciado es el rcadería en s
y embalada, nte y auxiliaanales.
.
Obliges
comp
Pagopre
Reparto gastos.
n
a.
ción Propia).
cada parte esepararon en
o.12
vendedor ysu fábrica enademás el var al compr
gaciondel rador
o del cio.
au
f
Transmisde riesg
explicaremon 4 grupos:
ya que su ún el plazo acvendedor debrador con la
n
r.
Licencias, autorizaciones
y formalidades.
Contray s
Recepde
entre
sión gos.
s como se e
única obligacordado. La mbe de emitira documenta
s
ntrato de ansporte seguro.
pcion la
ega.
engloban en
ación es ponmercancía dr al compradación y lice
cada
ner a deberá dor la encias
204
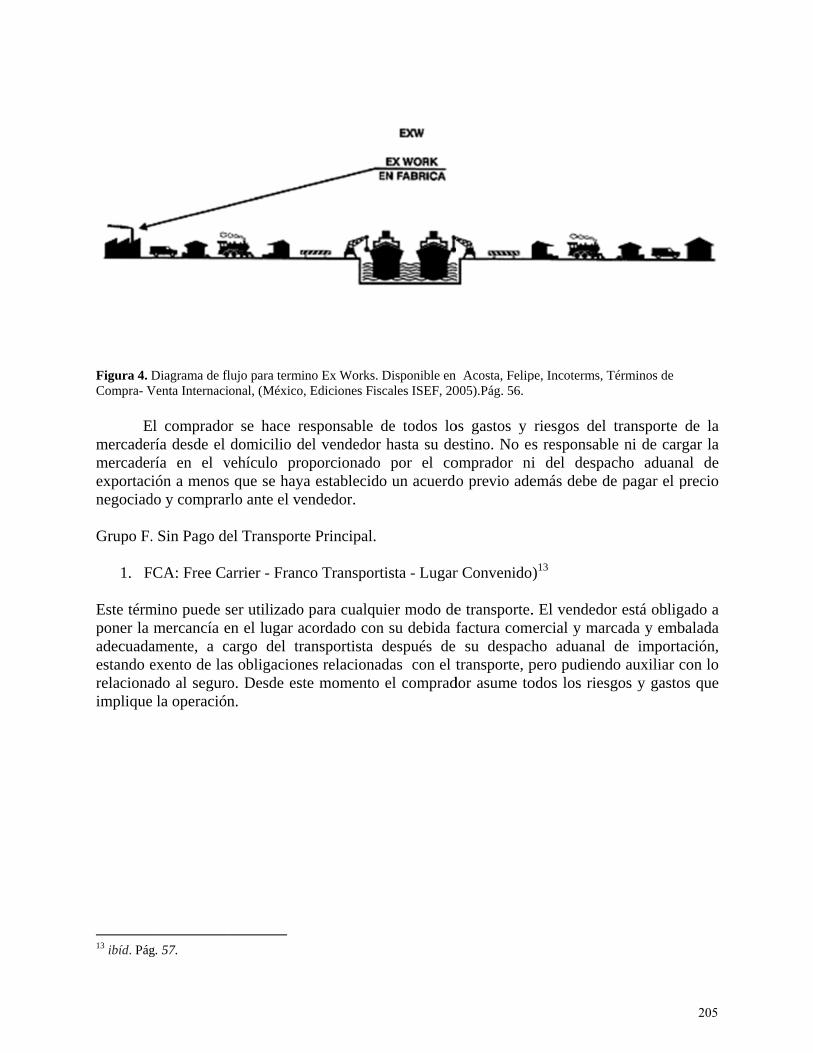
Figura 4. DCompra- V
Emercadermercaderexportacinegociad Grupo F.
1. F Este térmponer la adecuadaestando erelacionaimplique
13 ibíd. Pág
Diagrama de flVenta Internaci
El compradoría desde el ría en el vión a menos
do y comprar
. Sin Pago de
CA: Free Ca
mino puede smercancía e
amente, a cexento de lasado al seguro la operación
g. 57.
lujo para termiional, (México,
r se hace redomicilio d
vehículo pros que se hayarlo ante el ve
el Transport
arrier - Franc
ser utilizado en el lugar acargo del trs obligaciono. Desde estn.
ino Ex Works., Ediciones Fis
esponsable del vendedoroporcionadoa establecidoendedor.
e Principal.
co Transport
para cualquacordado conansportista
nes relacionate momento
Disponible enscales ISEF, 20
de todos lor hasta su de por el coo un acuerdo
tista - Lugar
uier modo den su debida fdespués de
adas con el tel comprad
Acosta, Felip005).Pág. 56.
os gastos y estino. No esomprador nio previo ade
r Convenido)
e transporte.factura com
su despachtransporte, p
dor asume to
pe, Incoterms, T
riesgos del s responsabli del despaemás debe d
)13
. El vendedomercial y mar
ho aduanal pero pudiendodos los ries
Términos de
transporte le ni de cargacho aduanade pagar el p
or está obligrcada y emb
de importado auxiliar csgos y gasto
de la gar la al de precio
ado a balada ación, con lo s que
205

Figura 5. DVenta Inter
E
compradlugar doncualquier
2. F
Va seguexportacimercancíresponsabexcluidoque hay q
3. F La abrevdel barcodel vendeel transpo Grupo C
1. C El vendeacordado
14 Rubio, J
Diagrama de flrnacional, (Mé
El compradoror no ha estande el transpr modo de tr
OB: Libre a
uido del puión. Puede uía es cargabilidad del v. En terminoque conocer
AS: Free Al
viatura va sego en el puertoedor. El comorte por mar
. Con Pago d
CFR: Costo y
edor pone lao a bordo del
José (et al), sup
lujo para termiéxico, Edicione
r debe cubrirablecido un lportista se haransporte.
a bordo – Pue
erto de emusarse solamada a bordvendedor haso traspasar la
los usos y c
longside Shi
guida del noo convenido
mprador se er o vías acuát
del Transpor
y Flete – Pue
as mercancíal buque desi
pra nota 1. Pág
ino FCA. Dispoes Fiscales ISE
r el monto aclugar, el ven
ará cargo de
erto de Emb
mbarque. Exmente para el do del barcsta que la ma borda en ccostumbres lo
p - Libre al c
ombre del puo, sobre el mencarga del dticas interior
rte Principal
erto de Desti
as embaladagnado, con f
g. 77
onible en AcoEF, 2005).Pág.
cordado por ndedor puedela mercancía
arque Conve
xige que el transporte p
co con todmercancía hay
ada puerto pocales del pu
costado del b
uerto de embmuelle con tod
despacho adures.
ino Convenid
as marcas e flete pagado
osta, Felipe, Inc65.
el pago de le elegir denta. Este térmi
enido.14
vendedor por mar o víados los gasya pasado lapuede tener uuerto en don
buque – Pue
barque. La mdos los gasto
duanal. Puede
do.
inspeccionao pero seguro
coterms, Térmi
las mercancítro de la zonino puede us
despache laas interioresstos, derecha borda del bun significad
nde se trate.
erto de Carga
mercadería sos y riesgos e emplearse
adas en el po no cubierto
inos de Compr
ías y si el na estipulada sarse con
a mercaderís. Significa qhos y riesgbarco, con eldo distinto p
a Convenido
se pone a lo hasta ahí a cúnicamente
puerto de deo y con la fa
ra-
a el
ía de que la gos a l flete por lo
o.
largo cargo
e para
estino actura
206

comerciapuede em
2. C La mercadebe con
Figura 3. D
E
un 10%) la mercan
3. C
El vendede pérdientregada
4. C El vendeque se m Grupo D
1. D Se utilizvendedorcorrectam 15 ibíd. Pá16 Cantos, M
al corresponmplearse en e
CIF: Costo, S
ancía es puentratar el segu
Diagrama de fl
El vendedor siendo el be
ncía traspasa
CPT: Transpo
edor paga el da o daño a al transpor
CIP: Transpo
edor debe comencionan en
. De Llegada
DAF: Entrega
za para cualr ha cumplidmente embal g. 78. Manuel supra
ndiente. El vel caso de tra
Seguro y Flet
esta en pueruro y paga la
lujo para termi
se ve obligaeneficiado coa la borda de
orte Pagado
flete del trase transfier
rtista. El ven
orte y Seguro
onseguir un n el término C
a Donde se I
ado en fronte
lquier tipo do con su obladas y marc
nota 5. Pág. 11
vendedor se ansporte por
te - Puerto d
rto de destina comisión c
ino CIF. Dispo
ado a consegon este el coel buque.
Hasta - Lug
ansporte de lre del vendndedor debe d
o Pagados H
seguro a su CPT.
Incluye Entr
era – Entreg
de transporbligación cucadas en el lu
16.
responsabler mar o vías n
de Destino C
no con flete correspondie
nible en http://
guir un seguomprador. La
ar de Destin
a mercaderíedor al comdespachar la
asta - Lugar
cargo y ade
rega.16
gado en Fron
rte, principauando una veugar conveni
e del despanavegables i
Convenido.
pagado y sente.
/exponentenerg
uro con cobea transferenc
no Convenid
a hasta el demprador cuaa mercadería
r de Destino
emás corre c
ntera.
almente paraez despachadido de la fro
acho de aduinteriores.15
seguro cubie
gy.com/FOB.h
ertura mínimcia de riesgo
do.
estino mencando la mea para su exp
Convenido
con las mism
a ferrocarrilda entrega l
ontera pero a
uana y solam
erto. El vend
html
ma (El precioos se hace cu
ionado. El rrcadería ha
portación.
mas obligac
l y carreteras mercancí
antes de la ad
mente
dedor
o más uando
riesgo sido
ciones
o. El ías ya duana
207

fronteriza del país receptor. Hay que indicar de manera precisa el lugar en la frontera y el comprador se responsabilizara a partir de ahí hasta el lugar de destino.
2. DES: Entregada Sobre el Barco – Puerto de Destino Convenido. El vendedor termina con su obligación cuando pone los bienes a disposición del comprador a bordo del barco en el puerto de destino, sin el despacho aduanal para la importación.
3. DEQ - Entregada en Muelle con Derechos Pagados – Lugar de Destino Convenido. El vendedor ha cumplido sus obligaciones cuando ya con el despacho aduanal de importación; pone las mercancías a disposición del comprador sobre el muelle en el puerto de destino acordado previamente. El comprador no se verá obligado a descargar las mercancías del buque.
4. DDU: Entregada Derechos No pagados – Lugar de Destino Convenido. El vendedor ha terminado con sus responsabilidades cuando pone la mercancía a disposición del comprador en el lugar acordado en el país de importación. El vendedor asume todos los gastos y riesgos relacionados con la entrega de los bienes hasta ese sitio pero excluyendo derechos, cargas oficiales e impuestos, y de igual manera todos los gastos y riesgos de llevar a cabo las formalidades aduaneras.
5. DDP: Entregada con Derechos Pagados – Lugar de Destino Convenido. El vendedor corre con las mismas obligaciones que se mencionan en el término CPT y además los derechos, impuestos y cargas que sean necesarios para llevar la mercadería hasta el lugar convenido.17 18
7. ¿CÓMO ESCOGER EL INCOTERM ADECUADO?
Una vez que ya se analizó cada termino y se identificaron las obligaciones de cada parte, lo más lógico es escoger el término que mejor se adapte a las características del contrato que se desee entablar tomando en cuenta la posición los interese y las capacidades que tenga cada parte.
Es de suma importancia tener bien claro las la parte que jugamos en nuestro contrato, ya
sea de vendedor o comprador para poder identificar el término que mejor se nos adapte y nos beneficie. También hay analizar el nivel de confianza que se tenga en el otro contratante así como que tanto lo conocemos y que tanto estén ambas partes relacionadas con las prácticas de comercio exterior, para así dardos una idea de las obligaciones que la otra parte puede asumir. A menor confianza mayor serán las obligaciones que asumiremos en el contrato por el bien de nuestra empresa y viceversa.19
17 Acosta, Felipe, supra nota 2.Pág. 51. 18 ibíd. Pág. 74. 19 ibíd. Pág. 85.
208

8. CONCLUSIÓN
Es importante conocer las circunstancias de nuestro contrato y la posición en la que nos encontramos al negociar con la otra parte. Generalmente el comprador se va a encontrar con una fuerza mayor de negociación que el vendedor en una operación de compraventa internacional debido a la fuerte competencia que existe y que hace que los vendedores tengan un mayor margen de compradores, los cuales estarían dispuestos a adquirir sus mercancías, por lo que comúnmente tratan de escoger un término que los beneficie más a ellos. Por otro lado hay que analizar el poder económico de cada una de las partes ya que esto definirá la capacidad de cada una para asumir obligaciones y costos implicados en la operación. El transporte a utilizar es una parte esencial que se debe considerar, algo muy común en la práctica es utilizar un término que no va con nuestra operación, tomando en cuenta las distintas modalidades, especialmente en el transporte marítimo. Otro aspecto clave es tomar en cuenta el, la delicadeza y el valor de la mercancía que se transporta para escoger el tipo de transporte adecuado. No se utilizara el mismo medio para transportar mercancías a granel que para mercancías en agrupadas en bultos contenedores o paletas. Para escoger el INCOTERM adecuado también debemos analizar el país al que se envían las mercancías, hay países en los cuales no habrá problemas para pactar un término de llegada, tales como inseguridad, guerrillas, etc., de otra manera implicaría muchos riesgos serios para los vendedores.20 Elegir un INCOTERM no es algo que se deba de hacer de manera automatizada o a la ligera, si se toman en cuenta los aspectos mencionados anteriormente evitaremos problemas y nos garantizara mantener una relación comercial estable y duradera con nuestros contratantes.
20 ibíd. Pág. 87.
209
BIBLIOGRAFÍA
Rubio, José (et al), Gestión del cobro de las operaciones de venta internacional, (Alicante, Editorial Club Universitario, 2008). Pág. 66.
Acosta, Felipe, INCOTERMS, Términos de Compra- Venta Internacional, (México, Ediciones Fiscales ISEF, 2005). Pág. 13.
Organización de las Naciones Unidas, Anuario, (Publicación de las Naciones Unidas, 2000) Pág. 630.
Cantos, Manuel, Introducción al Comercio Internacional, (Barcelona, EDHASA, 2000), Pág. 105.
De la Fuente, Marta (et al), Modelos de contratos Internacionales, (Madrid, Fundación Confemetal, 1999).
Gonzales, Isabel (et al), Gestión del comercio exterior, (Madrid, ESIC EDITORIAL, 2011), Pág. 67.
Cabrera, Alfonso, Las reglas Incoterms 2010®. Manual para usarlas con eficacia, (Barcelona, Marge Books, 2013). Pág. 194.
REFERENCIAS ELECTRÓNICAS
http://exponentenergy.com/FOB.html
210

Infraestructura logística como apalancamiento para aumentar la competitividad y reducir el costo país: Revisión de cuatro estudios con ecuaciones estructurales.
JOSÉ FERNANDO DÍAZ ZAMORA1
Universidad Tecnológica de Nuevo Laredo, Nuevo Laredo, Tamaulipas, México
La infraestructura Logística son el conjunto de carreteras, puentes, aduanas, aeropuertos, puertos, instalaciones de telecomunicaciones que se apoya un país para comunicar a las personas y empresas o transportar las mercancías a la largo y ancho de una nación. Este documento pretende analizar los métodos estadísticos utilizados para estudiar las variables que impactan en la infraestructura logística través de ecuaciones estructurales y como de menor y mayor grado estas variables impactan positivamente o negativamente con el desarrollo económico de un país través de disminuir tiempos de tráfico, tiempos de acceso a puertos y reteniendo el tráfico por la ubicación y tecnología de la misma. Y esto contribuye a mover mercancías y personas a lugares donde no existe las mercancías para subsistir a la población con costo y tiempo menores. PALABRAS CLAVE infraestructura logística, ecuaciones estructurales, desarrollo económico, tiempo y costo. Logistics infrastructure is the set of roads, bridges, customs, airports, ports, and telecommunications facilities that a country relies on to communicate to people and companies or to transport goods throughout the nation. This paper aims to analyze the statistical methods used to study the variables that impact the logistics infrastructure through structural equations and as minor and major degree these variables positively or negatively impact the economic development of a country through reducing traffic times, port access times, and retaining traffic through location and technology itself. This helps to move goods and people to places where merchandise does not exist to subsist the population with lower cost and time. KEYWORDS logistics infrastructure, structural equations, economic development, time and cost.
1 Address correspondence to José Fernando Díaz Zamora, Universidad Tecnologica de Nuevo Laredo, Nuevo Laredo, Tamaulipas, Mexico. E-mail: [email protected]
211

INTRODUCCIÓN La Logística es una de las herramientas para apalancarse para desarrollar ventajas competitivas que te permitan disminuir costos y tiempos, simplificar procesos y satisfacer al cliente, sobre todo en estos tiempos donde la globalización a ocasionado que el mundo sea más plano y pequeño por la utilización de las tecnologías de la información y el Internet.
El enfoque fue en la infraestructura logística donde la idea fundamental es la de disminuir el costo país de México , haciendo más eficientes las carreteras, el ferrocarril, los puertos mexicanos, las aduanas, los aeropuertos, las TI en fin cualquier medio utilizado por la logística que nos ayude a este propósito, ser más competitivos a nivel internacional.
En un mundo reducido por la globalización traducido en el comercio electrónico
donde las mercancías pueden ser trasladadas desde diferentes puntos del mundo, la logística y sus herramientas como son su infraestructura en los Hub, sus procesos eficientes con el fin de disminuir tiempos, costos, procesos ligeros y aumentar la satisfacción del cliente son una herramienta a utilizar para alcanzar estos logros y , mantenerse en un mercado internacional.
En México, Tamaulipas y Nuevo Laredo las plataformas logísticas están tomando
fuerza en el tema de la competitividad, ya que es una de las herramientas que se apalancan las economías de los estados para ser eficientes disminuyendo tiempos y costos pais, utilizando las vías de comunicación, puertos marítimos, secos y aeropuertos de un país si esta infraestructura nos hace distribuir físicamente a un menor costo y más rápido las mercancías y esto se traduce en dinero , luego entonces estamos contribuyendo al desarrollo de la competitividad.
En un plano hacia las empresas esto hace que las empresas sean más eficientes
utilizando estos hub donde el cliente tiene a su disposición los diferentes opciones de medios de transporte y tecnologías de la transportación de mercancías donde utiliza las diferentes modalidades de servicio para transportar dependiendo de sus necesidades y su presupuesto y también porque no decirlo la infraestructura a su alcance dependiendo del origen y destino de las mercancías . Y más específico estas plataformas traen consigo servicios auxiliares agregados y necesarios para ser más eficientes y sus pobladores que están alrededor de estas instalaciones y dentro de estas plataformas logísticas se ven beneficiados con la generación directa y indirecta de empleos así como generador de la inversión extranjera como catalizador de la economía. Lo que vamos encontrar es como y porque es importante contar con infraestructura logística adecuada donde podamos realizar la distribución física de un producto a costo razonable y en un tiempo adecuado con estándares a nivel internacional.
En este documento se trata de analizar como la variable de la infraestructura logística
impacta en los índices de competitividad y el costo del país , se analiza través de 4 casos de cadena de suministros y logística utilizando las ecuaciones estructurales para ver sus constructos y sus relaciones con las de otras variables que impactan en la cadena de suministros. Y se llega a conclusiones de que este sistema es mas utilizado para medir esta relación de la logística y la cadena de suministros.
Ver de qué forma la infraestructura está relacionada con el desarrollo económico de
un país. Y su nivel de competitividad y como afecta este al costo país al realizar la distribución física.
212

MARCO TEÓRICO La Logística es una de las herramientas para desarrollar ventajas competitivas que te permitan disminuir costos y tiempos, simplificar procesos y satisfacer al cliente, sobre todo en estos tiempos donde la globalización ocasionado que en el mundo es más plano y pequeño por la utilización de las tecnologías de la información y el Internet. (teoría de la ventaja competitiva Michael Porter, 1990 ).
El enfoque fue en la infraestructura logística donde la idea de esta es la de disminuir el costo país de México , haciendo mas eficiente las carreteras, el ferrocarril, los puertos mexicanos, las aduanas, los aeropuertos, las TI en fin cualquier medio utilizado por la logística que nos ayude a este propósito, ser más competitivos a a nivel internacional. (Teoría del valor David Ricardo, 1817)
El efecto de la globalización, la situación económica que hoy vivimos y el creciente
dinamismo en el comercio internacional están ejerciendo presiones que nos obligan a reaccionar de forma ágil y eficiente. (Krugman Poul, 1991) Estos factores y la urgencia de modernizar la infraestructura han hecho que hoy sea urgente en México, el establecer un PLAN RECTOR de la LOGÍSTICA y del Comercio Internacional en dónde se busque impactar directamente el nivel de competitividad.
El entorno ha cambiado en las Macro economías ., y hoy?...….En el 2013 fantasma de
una Crisis es inminente. Liberalización del comercio mundial y regional. La competencia comienza a ser cada vez más global o local. Incorporación acelerada de tecnologías de la información (TI). El comercio ya no se puede desligar del tema del medio ambiente. La competencia se vuelve ahora agresiva, leal y desleal. (bertil ohlin, 1977).
La cadena de suministros se puede definir de diferentes formas: Para Stadtler (2001), significa la integración de diferentes organizaciones a lo largo de toda la cadena, coordinando el flujo de materiales, información y finanzas de forma que satisfaga la demanda de los clientes; o por ejemplo, para Companys (2003) significa una red de organizaciones interrelacionadas que intervienen en diferentes fases del proceso productivo mediante actividades que añaden valor al producto, bien o servicio. Otros conceptos están dados por la función y los resultados que se obtienen de su administración, ya que al incrementar la eficiencia del proceso a través de las empresas, permite reducir los costos, mejorar la calidad y agilizar las operaciones Hammer (2001). La administración de la cadena de suministro tiene como propósito sincronizar las funciones de la empresa con la de los proveedores, a fin de acoplar el flujo de materiales, servicios en información, con la demanda del cliente Krajewski y Ritzman (2000). El paradigma del siglo 21 que enfrenta la administración de la cadena de suministro es referente a la infraestructura de tecnologías de información. Desde el punto de vista de Kovacs y Paganelli (1990), estas se centran en la globalización y gestión de herramientas que integran la obtención, operación y logística de componentes para satisfacer al cliente. Lo cual implica mayor flexibilidad de manufactura, velocidad de transportación y disponibilidad de información, así como también mayor compromiso gerencial.
Logística empresarial- “Es el proceso que integra y coordina los elementos de la cadena de suministro para asegurar lo mejor posible el flujo de materiales, de información y dinero en orden de cumplir con los requerimientos de los clientes y consumidores de la manera más eficiente y al menor costo posible”
213
Cadena de valores.- “Es el conjunto de todos los procesos secuenciados e involucrados, desde los consumidores finales hasta los proveedores iniciales; que aportan productos, servicios e información; y que agregan valor a los clientes externos e internos de la organización.” “The Logistics Institute, at Georgia Tech”
La infraestructura- de un país es el conjunto de carreteras , puentes ,aduanas, aeropuertos, telecomunicaciones que sirven para comunicarnos o movilizar mercancías a lo largo y ancho de un país.
La distribución es la ruta que siguen los productos desde el origen hasta el consumidor o usuario final. Puede haber dos tipos de distribución la física y la comercial.
La física es el movimiento de la mercancía desde el origen hasta destino final utilizando canales de distribución desde minoristas hasta mayoristas productos y consumidor, etc.
La distribución comercial.- es la actividad donde participan los actores o empresas que venden o comercian la mercancía o producto. Desde fabricante, mayoristas, minoristas, etc. hasta al cliente final.
Los procesos son el conjunto de actividades a realizar para conseguir un objetivo o meta dentro de la organización para lograr su máxima eficiencia.
Calidad total. Calidad es el grado de satisfacción que logramos al prestar el servicio
O vender el producto, esto desde la perspectiva del cliente. Al existir este grado de satisfacción en la empresa todos los niveles deben estar comprometidos con lograr este objetivo desde los niveles menores del organigrama hasta el nivel más alto del mismo deben tener las mismas políticas con el cliente de tal forma que se da la calidad total en la organización.
Almacén.-Esta función controla físicamente y mantiene todos los artículos
inventariados, se deben establecer resguardo físicos adecuados para proteger los artículos de algún daño de uso innecesario debido a procedimientos de rotación de inventarios defectuosos y a robos. Los registros de deben mantener, lo cual facilitan la localización inmediata de los artículos.
Subcontratación.- Llamada también 3PL o operadores logísticos o prestadores de logística todos son lo mismo estos son proveedores de logística independientes que realiza cualquiera o todas la actividades o funciones necesarias para llevar las mercancías desde origen hasta destino y satisfacer al cliente, disminuir costos, tiempos y aumentar satisfacción al cliente. Que incluyen administración de la cadena de abastos, tecnología de información, inventarios, almacenamiento, gestión de transporte, servicios al cliente, en fin todo lo que este a su alcancé.
Sistema de Información Logístico (SIL).- Una estructura interactiva formada por
personas, equipos y métodos destinados a crear un flujo de información capaz de proporcionar una base adecuada para la toma de decisiones.
Servicio al cliente..-Concepto: Es el conjunto de actividades interrelacionadas que ofrece un suministrador con el fin de que el cliente obtenga el producto en el momento y
214
lugar adecuado y se asegure un uso correcto del mismo. El servicio al cliente es una potente herramienta de marketing.
Logística inversa.-es el proceso de proyectar, implementar y controlar un flujo de materia prima, inventario en proceso, productos terminados e información relacionada desde el punto de consumo hasta el punto de origen de una forma eficiente y lo más económica posible con el propósito de recuperar su valor ó el de la propia devolución.
Transporte.-El enfoque del transporte se basa en que el responsable de logística debe
de comprenden y tener bases sobre la transportación de la mercancías , uno de los elementos más importantes de los costos logísticos es este, el movimiento de carga absorbe entre uno y dos tercios de los costos totales de la logística. El enfoque se basa sobre las instalaciones y servicios que constituyen el sistema de transporte , y en las tarifas(costos) y desempeño de los distintos servicios de transporte que un administrador puede seleccionar, o sea las alternativas que existen en el servicios de transporte.
DESARROLLO La Infraestructura Logística ha sido subestimada y peor aún la falta de la misma para apoyarse en esta para el desarrollo económico de un país o una región , a esto se agrega la falta de políticas eficientes de infraestructura , dan como resultado la `poca generación de resultados para utilizar esta infraestructura de una nación y poder transportar mercancías a un costo más económico que otras naciones, a su vez al ser más eficiente en la administración de la cadena de suministros puedan disminuir los costos de los productos en un país , contribuyendo así a la economía directa de la población. O al mover mercancías de un punto a a un punto b estos kilómetros recorridos sean con costo más bajo que otra región y las empresas a nivel mundial prefieran mover por esa región las mercancías por las razones de disminuir costos, hacer menos tiempo, realizar menos gastos en mantenimiento de las unidades, menos gastos en maniobras por la automatización de procesos logísticos en la operación. Esta infraestructura se utiliza como variable del desarrollo económico, pero pocas veces es tomada en cuenta en las políticas de desarrollo social y económico de las naciones.
De hecho varias naciones en latino América utilizan casi nulamente esta correlación
positiva entre infraestructura logística y desarrollo económico. Restringiendo su crecimiento a largo plazo y reduciendo la pobreza, algunas naciones que utilizan esta en su política económica aun falta el enlace de esta y el desarrollo productivo regional.
La infraestructura puede incluir la infraestructura básica, tecnológica e información,
salud y educación. En general, la buena calidad de la infraestructura puede ayudar a reducir la pobreza y la desigualdad al conectar comunidades pobres a los mercados, permite a los niños en áreas marginadas acceder a educación o acceder a través de la web, mejorar los niveles de salud a través de servicios de saneamiento como agua potable. Al respecto el informe señala serias deficiencias como se observa en los diferentes estudios realizados:
En la investigación de calvo (2013) Se lleva a cabo en dos etapas primero un análisis factorial para ver la fiabilidad de los constructos (el valor mínimo aceptado para ser relevante es de .70 ) y posterior se analiza el modelo estructural con los índices de bondad.( Este deben ser mayor que .70). primero se utilizó el programa spss 15.0 y el programa informático que se utilizó Amos 18.0 . se plantean las hipótesis Ho , H1 y H2, H3 y los
215
modelos se comparan con los modelos estructurales. Se analizan en un cuadro a través de análisis de cronbach donde todos las variables están por encima de .70 , el AVE todos están excepto uno esta por encima de .50. este documento nos sienta las bases para comparar modelos través del sistemas de ecuaciones estructúrales.
En la investigación de Fernandez(2013). En la actualidad existen investigaciones que
mencionan esa importancia, pero no existen modelos explicativos entre las variables, en las que se asocien la logística y abastecimiento con los índices de desempeño de la cadena de suministro de la cual forman parte, por lo que en este artículo se reporta un modelo de ecuaciones estructurales que busca vincular el impacto de las logística nacional e internacional y el abastecimiento con los índices de desempeño de la cadena de suministro para las Este trabajo se contribuyó a incrementar la literatura sobre el empleo de ecuaciones estructurales para la comparación y análisis de diferentes modelos conceptuales, incorporando un análisis de las relaciones causales entre las variables analizadas.
En el proyecto de investigación de Avelar (2007) Literatura utilizada en análisis de
desempeño en la cadena de suministros. Y los modelos utilizados para analizar la cadena de suministros que está relacionada críticamente con la logística. conocer las diferentes variables de estudio del fenómeno. Se analizó la infraestructura regional dando como resultado que es relevante en la logística. Se puede analizar un modelo de ecuaciones estructurales que afecta directamente a la infraestructura logística.
En el caso de Leal (2009) propone un modelo de desarrollo portuario basado en Ios
supuestos de la economía geográfica evolucionaría. se propone una metodología cuya futura implementación resultará útil para medir las relaciones causa efecto entre las variables presentadas en el modelo teórico, relaciones que hasta ahora han sido sometidas a mediciones parciales por Ios modelos existentes. Nos maneja teorías como la de Notteboom y rodriguez (2008)que nos indican que la inversión en infraestructura no tendría impacto en el rendimiento portuario.postulados de schumpeter (1934) que afirman que la innovación y la tecnología son el principal inductor del desarrollo económico. Se agregan 3 variables en el estudio ubicación, infraestructura y transporte para estudiar la accesibilidad al puerto.surgen otras hipótesis de estudio en cuanto entorno lo que rodea al puerto sea legal (leyes) o físico ubicación al atraer o retener tráfico.
216
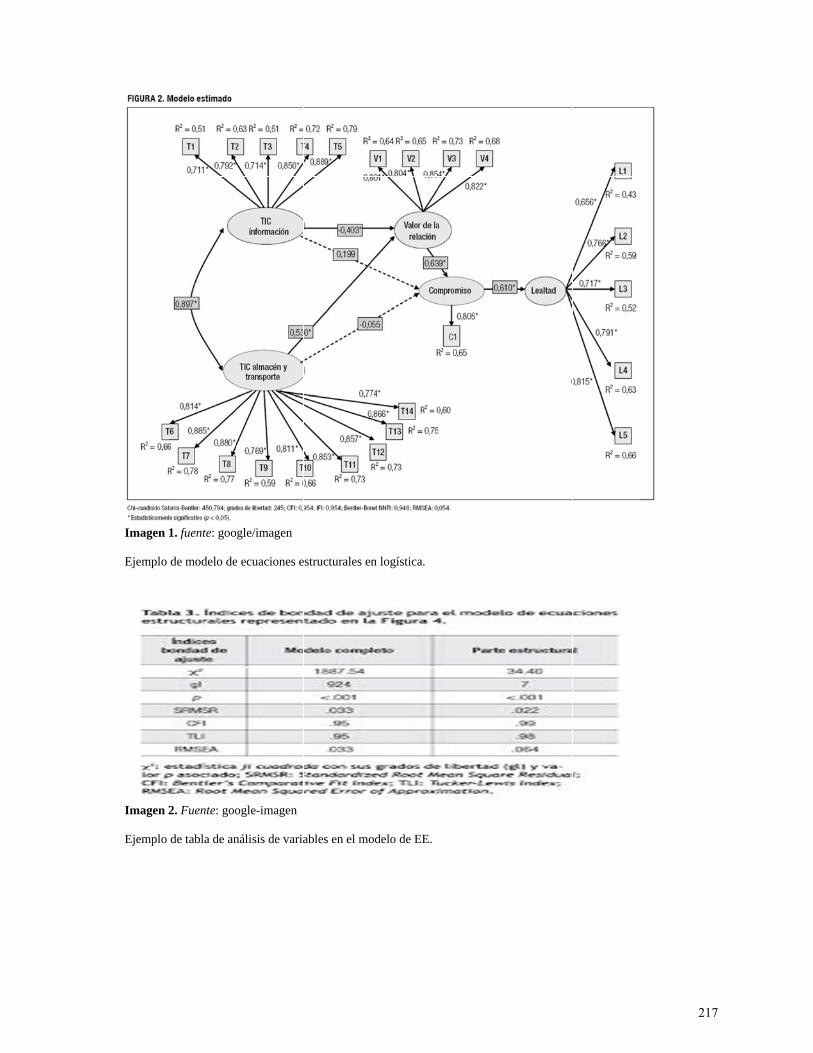
Imagen 1 Ejemplo
Imagen 2 Ejemplo
1. fuente: goo
de modelo de
2. Fuente: goo
de tabla de an
gle/imagen
e ecuaciones e
ogle-imagen
nálisis de varia
estructurales en
ables en el mo
n logística.
odelo de EE.
217
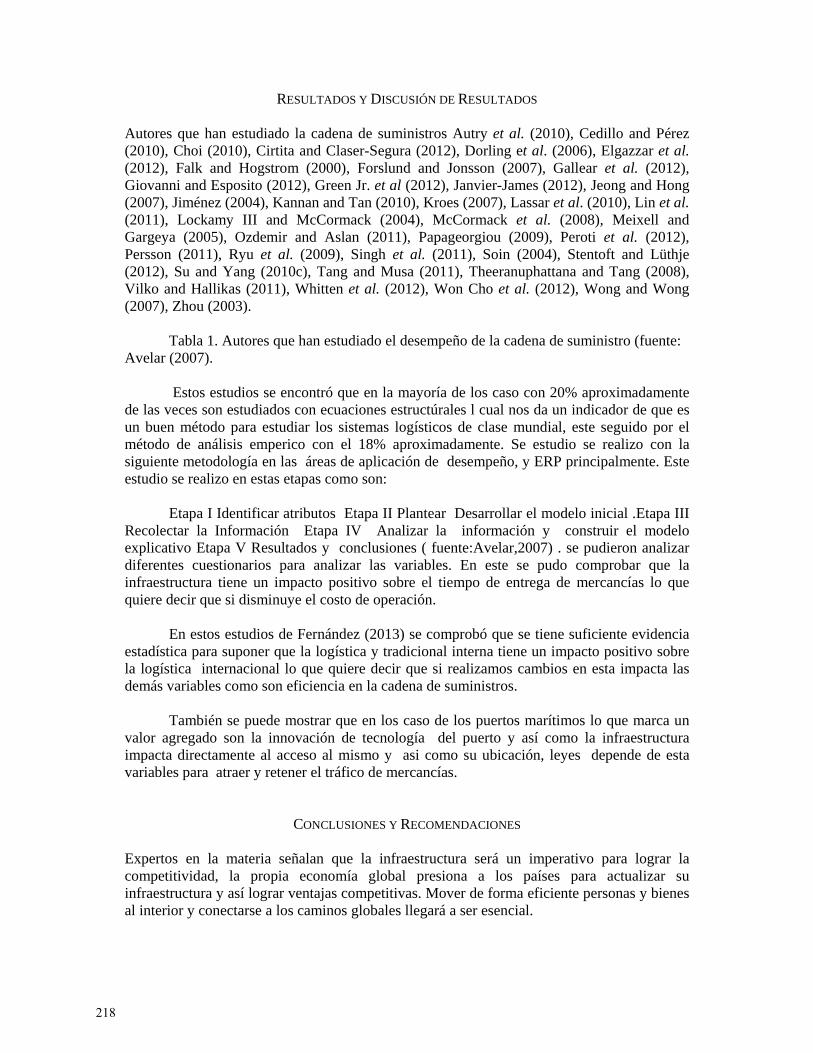
RESULTADOS Y DISCUSIÓN DE RESULTADOS
Autores que han estudiado la cadena de suministros Autry et al. (2010), Cedillo and Pérez (2010), Choi (2010), Cirtita and Claser-Segura (2012), Dorling et al. (2006), Elgazzar et al. (2012), Falk and Hogstrom (2000), Forslund and Jonsson (2007), Gallear et al. (2012), Giovanni and Esposito (2012), Green Jr. et al (2012), Janvier-James (2012), Jeong and Hong (2007), Jiménez (2004), Kannan and Tan (2010), Kroes (2007), Lassar et al. (2010), Lin et al. (2011), Lockamy III and McCormack (2004), McCormack et al. (2008), Meixell and Gargeya (2005), Ozdemir and Aslan (2011), Papageorgiou (2009), Peroti et al. (2012), Persson (2011), Ryu et al. (2009), Singh et al. (2011), Soin (2004), Stentoft and Lüthje (2012), Su and Yang (2010c), Tang and Musa (2011), Theeranuphattana and Tang (2008), Vilko and Hallikas (2011), Whitten et al. (2012), Won Cho et al. (2012), Wong and Wong (2007), Zhou (2003).
Tabla 1. Autores que han estudiado el desempeño de la cadena de suministro (fuente: Avelar (2007).
Estos estudios se encontró que en la mayoría de los caso con 20% aproximadamente
de las veces son estudiados con ecuaciones estructúrales l cual nos da un indicador de que es un buen método para estudiar los sistemas logísticos de clase mundial, este seguido por el método de análisis emperico con el 18% aproximadamente. Se estudio se realizo con la siguiente metodología en las áreas de aplicación de desempeño, y ERP principalmente. Este estudio se realizo en estas etapas como son:
Etapa I Identificar atributos Etapa II Plantear Desarrollar el modelo inicial .Etapa III Recolectar la Información Etapa IV Analizar la información y construir el modelo explicativo Etapa V Resultados y conclusiones ( fuente:Avelar,2007) . se pudieron analizar diferentes cuestionarios para analizar las variables. En este se pudo comprobar que la infraestructura tiene un impacto positivo sobre el tiempo de entrega de mercancías lo que quiere decir que si disminuye el costo de operación.
En estos estudios de Fernández (2013) se comprobó que se tiene suficiente evidencia estadística para suponer que la logística y tradicional interna tiene un impacto positivo sobre la logística internacional lo que quiere decir que si realizamos cambios en esta impacta las demás variables como son eficiencia en la cadena de suministros.
También se puede mostrar que en los caso de los puertos marítimos lo que marca un valor agregado son la innovación de tecnología del puerto y así como la infraestructura impacta directamente al acceso al mismo y asi como su ubicación, leyes depende de esta variables para atraer y retener el tráfico de mercancías.
CONCLUSIONES Y RECOMENDACIONES Expertos en la materia señalan que la infraestructura será un imperativo para lograr la competitividad, la propia economía global presiona a los países para actualizar su infraestructura y así lograr ventajas competitivas. Mover de forma eficiente personas y bienes al interior y conectarse a los caminos globales llegará a ser esencial.
218
México también tiene deficiencias en requerimientos básicos de la competitividad como la preocupante calidad de sus instituciones, la pobre gobernanza pública, la corrupción, los bajos niveles de confianza ciudadana hacia los políticos, la ineficiencia gubernamental, el oneroso sistema fiscal; los elevados niveles de criminalidad y violencia con altos costos para los negocios y ciudadanos. Pero al mismo tiempo, México es un país con una posición geográfica envidiable.
A través de estos estudios nos da un perspectiva más amplia al estudio de la
infraestructura logística conociendo como las ecuaciones estructurales son estudiados alrededor del mundo con éxito, dando un panorama de variables que impactan en menor o mayor grado el desarrollo económico de un país, pero todas impactan en el tiempo y costo del país.
219

REFERENCIAS Avelar Sosa, L Domínguez, J., & Villegas, O. O. V. (2007). Proyecto de investigación.
Modelo para evaluar el desempeño de las cadenas de suministro de exportación: un enfoque con ecuaciones estructurales.
Calvo-Porral, C., Martínez-Fernández, V. A., & Juanatey-Boga, O. ANÁLISIS DE DOS MODELOS DE ECUACIONES ESTRUCTURALES ALTERNATIVOS PARA MEDIR LA INTENCION DE COMPRA.
Cipoletta Tomassian, G. (2011). Principios de políticas de infraestructura, logística y movilidad basadas en la integralidad y la sostenibilidad.
Fernández, J. B., Alcaraz, J. L. G., Sosa, L. A., Araceli, A., Macías, M., & Valdivieso, I. C. (2013). LA LOGÍSTICA INTERNACIONAL Y SU IMPACTO EN LA EFICIENCIA DE LA CADENA DE SUMINISTRO EN MAQUILADORAS DE CIUDAD JUÁREZ. Cultura Científica y Tecnológica, 10(49), 26
Leala, E., Notteboomb, T., & Sánchezc, R. J. Distribución espacial de la actividad portuaria: Notas teóricas y metodológicas para su modelación e investigación
Moreno, S. (2008). La infraestructura y la competitividad en México. Centro de Estudios Sociales y de Opinión Pública, Documento de Trabajo, 60.
220
Estudio de Factibilidad de Operaciones en Aeropuerto de Carga de Nuevo Laredo
LIC. FELIPE ALEJANDRO CASTILLO LOERA1
Universidad Tecnológica de Nuevo Laredo
LIC. MARIO ALBERTO VILLARREAL ÁLVAREZ Universidad Tecnológica de Nuevo Laredo
ALAN GUADALUPE VÁZQUEZ ALFARO
Universidad Tecnológica de Nuevo Laredo Los aeropuertos constituyen un importante activo de la infraestructura logística nacional, los cuales posibilitan el comercio por carga aérea, también ofrece niveles de servicio muy altos por los tiempos de transportación asociados. Esto para cargas sensibles a la rapidez de entrega y se da un factor estratégico que es la seguridad, adquiere una importancia estratégica y le confiere al país la posibilidad de establecer rutas comerciales de gran impacto económico. Todas las mercancías de comercio exterior que ingresan a las instalaciones de los aeropuertos son resguardadas en almacenes y áreas de transferencia, comprendidas dentro de los Recintos Fiscalizados habilitados por la Aduana aeroportuaria y están sujetas al reconocimiento aduanero para su despacho, tanto en la importación como en la exportación. PALABRAS CLAVE Aeropuerto, Comercio, Carga Aérea, Aduana. Airports are an important asset of national logistics infrastructur which allow airfreight trade. It also offers high level services because of the transportation associated timing. These for urgent merchandise give a safety issue, have strategic importance and give the country a possibility for establishing commercial routes with a huge economic impact. All international trade merchandise entering the airport facilities are sheltered in stores and transfer areas, including within duty enclosures by airport customs and are subject to customs inspections for dispatch of both imports and exports. KEYWORDS Airport, Trade, Air Freight, Customs.
1Address correspondence to Lic. Felipe Alejandro Castillo Loera, Universidad Autónoma de Tamaulipas. E-mail: [email protected]
221
Pymes: Factores que Influyen en la Apertura, Desarrollo y Éxito de la Micro Empresa en México
LIC. MARIO ALBERTO VILLARREAL ÁLVAREZ
1 Universidad Autónoma de Tamaulipas, Tampico, Tamaulipas, México
DR. FERNANDO HERNÁNDEZ CONTRERAS
Universidad Autónoma de Tamaulipas, Tampico, Tamaulipas, México
DR. JOSÉ LUIS DÍAZ ROLDAN Universidad Autónoma de Tamaulipas, Tampico, Tamaulipas, México
El objetivo de este trabajo consistió en realizar un análisis de la evolución de las MIPYME en México se demuestra si las políticas para las empresa han tenido o no una incidencia positiva, para este fin en primer lugar se aborda el tema de la influencia del gobierno en el proceso de crecimiento y permanencia de las pequeñas empresas; posteriormente, se realiza un breve bosquejo acerca de la problemática de este sector empresarial; después se analiza el desarrollo del sector productivo en Nuevo. Laredo; por último, se muestra la evolución de las políticas en competitividad y las evaluaciones que se han realizado acerca del impacto de las misma en la mediana empresa mexicana. La conclusión principal de este trabajo es que las políticas han sido insuficientes para apoyar la creación, permanencia y desarrollo de las PYME (considerando tanto el número de unidades económicas como los empleos generados), sobre todo las del sector industrial mismas que ha perdido competitividad frente a la empresa grande (Juárez Báez, Gómez Villanueva, 2010). PALABRAS CLAVE empresa, crecimiento, competitividad desarrollo The aim of this study was to conduct an analysis of the evolution of MIPYME in Mexico is demonstrated if policies for the company had no or a positive impact, for this purpose first the issue of government influence is addressed in the growth process and permanence of small businesses; subsequently, a brief outline on the problems of this sector is made; after the development of the productive sector in New analyzes. Laredo; Finally, the development of policies on competitiveness and evaluations that have been conducted on the impact of the same on the median Mexican company shown. The main conclusion of this work is that policies have been insufficient to support the creation, retention and development of PYME (considering both the number of affordable units as the jobs created), especially those in the same industry that has lost competitiveness against the large company (Juárez Baez, Gomez Villanueva, 2010). KEYWORDS business, growth, competitiveness development
1 Address correspondence to Lic. Mario Alberto Villareal Álvarez, Universidad Autónoma de Tamaulipas, Tampico, Tamaulipas, México. E-mail: [email protected]
222
Informática Forense
JORGE EDUARDO GARZA SÁNCHEZ1
Facultad de Comercio, Administración y Ciencias Sociales, Universidad Autónoma de Tamaulipas
JUAN JOSÉ HERNÁNDEZ VIDALES
Facultad de Comercio, Administración y Ciencias Sociales, Universidad Autónoma de Tamaulipas
El objetivo principal de esta investigación es el de dar a conocer esta práctica de la informática que es muy escasa en México, ya que los procesos son un poco difíciles de aplicarse; ya que tienen normas y protocolos los cuales se tienen que seguir paso a paso. Mediante el uso de hardware y software especializado; además de tener una aplicación en el ámbito legal ya que es una ciencia que nos ayuda a resolver delitos que se realizan por medio de dispositivos electrónicos, así como recuperar información que puede ser fundamental para resolver varios tipos de fraudes, los que van desde el robo de información hasta el mal uso de ella, además de tener la posibilidad de recuperar información de un equipo que ha sido dañado, maltratado física o lógicamente. PALABRAS CLAVE Forense, Análisis, Evaluación, Software, Hardware.
1 Address correspondence to Garza Sanchez Jorge Eduardo, Facultad de Comercio, Administración y Ciencias Sociales, Universidad Autónoma de Tamaulipas. E-mail: [email protected]
223

INTRODUCCIÓN Muchas son las definiciones que de informática forense podemos encontrar en gran número de publicaciones, pero todas ellas –de una manera u otra– hacen hincapié en unos puntos esenciales; así, de una forma simple, podríamos definir la informática forense como un proceso metodológico para la recogida y análisis de los datos digitales de un sistema de dispositivos de forma que pueda ser presentado y admitido ante los tribunales. De la definición vemos que se trata de un proceso, técnico y científico, que debe estar sujeto a una metodología, tendente primero a la recogida y después al análisis de los datos digitales que se pueden extraer de un sistema o conjunto de dispositivos informáticos o electrónicos, y todo ello con el propósito de ser presentados ante un tribunal. El fin último y principal objetivo que se deduce de la palabra forense, es su uso en un procedimiento judicial.2
Informática forense es el proceso de identificar, preservar, analizar, y presentar evidencia digital, de la manera que esta sea legalmente aceptable en un proceso jurídico.
HISTORIA DE LA INFORMÁTICA FORENSE En 1978 Florida reconoce los crímenes de sistemas informáticos en el "Computer Crimes Act", en casos de sabotaje, copyright, modificación de datos y ataques similares.
Nace Copy II PC de Central Point Software en 1981. También es conocida como copy2pc, se usa para la copia exacta de disquetes, que generalmente están protegidos para evitar copias piratas. El producto será posteriormente integrado en las "Pc Tools". La compañía es un éxito y es comprada por Symantec en 1994.
En 1982 Peter Norton publica UnErase: Norton Utilities 1.0, la primera versión del conjunto de herramientas "Norton Utilities", entre las que destacan UnErase, una aplicación que permite recuperar archivos borrados accidentalmente. Otras aplicaciones también serán útiles desde la perspectiva forense, como FileFix o TimeMark. Con el éxito de la suite de aplicaciones Peter publica varios libros técnicos, como Inside the I. B. M. Personal Computer: Access to Advanced Features and Programming, del que su octava edición se publicó en 1999, 11 años después de la primera edición.. La compañía será vendida a Symantec en 1990.
En 1984 el FBI forma el Magnetic Media Program, que más tarde, en 1991, será el Computer Analysis and Response Team (CART).
En 1986 Clifford Stoll colabora en la detección del hacker Markus Hess. En 1988 publica el documento Stalking the Wily Hacker contando lo ocurrido. Este documento es transformado 1989 en el libro El huevo del cuco, anticipando una metodología forense.
En 1987 se crea la High Tech Crime Investigation Association (HTCIA), asociación de Santa Clara que agrupa a profesionales tanto de agencias gubernamentales como compañías
2 LA INFORMÁTICA FORENSE: EL RASTRO DIGITAL DEL CRIMEN, Francisca Rodríguez Más, Alfredo Doménech Rosado, Derecho y Cambio Social
224
privadas para centralizar conocimiento e impartir cursos. John C. Smith detalla la historia de esta organización aún vigente en su página web.
En 1987 nace la compañía AccessData, pionera en el desarrollo de productos orientados a la recuperación de contraseñas y el análisis forense con herramientas como la actual Forensic Toolkit (FTK).
En 1988 se crea la International Association of Computer Investigative Specialists (IACIS), que certificará a profesionales de agencias gubernamentales en el Certified Forensic Computer Examiner (CFCE), una de las certificaciones más prestigiosas en el ámbito forense.
En este mismo año se desarrolla el programa Seized Computer Evidence Recovery Specialists o SCERS, con el objetivo de formar a profesionales en computer forensics.
El libro "A forensic methodology for countering computer crime", de P. A. Collier y B. J. Spaul acuña en 1992 el término "computer forensics". Otros libros posteriores continuarán desarrollando el termino y la metodología, como: "High-Technology Crime: Investigating Cases Involving Computers" de Kenneth S. Rosenblatt.
En 1995 se funda el International Organization on Computer Evidence (IOCE), con objetivo de ser punto de encuentro entre especialistas en la evidencia electrónica y el intercambio de información.
A partir de 1996 la Interpol organiza los International Forensic Science Symposium, como foro para debatir los avances forenses, uniendo fuerzas y conocimientos.
En agosto de 2001 nace la Digital Forensic Research Workshop (DFRWS), un nuevo grupo de debate y discusión internacional para compartir información.
INFORMÁTICA FORENSE Disciplina que se dedica a resolver casos de las tecnologías de la información.
Aplicación de técnicas científicas y analíticas especializadas a infraestructura tecnológica
que permiten identificar, preservar, analizar y presentar datos que sean válidos dentro de un proceso legal.
De acuerdo con algunas empresas de investigación, la seguridad de la información seguirá siendo una preocupación ejecutiva durante, al menos, los próximos cinco años, debido a las nuevas olas tecnológicas que modificarán las medidas de seguridad existentes.
Precisamente, con el objetivo de reducir en porcentaje este problema, es que aparece una nueva modalidad llamada "Informática Forense", que permite la solución de conflictos tecnológicos relacionados con seguridad informática y protección de datos.
225
Gracias a ella las empresas obtienen respuesta a:
Problemas de privacidad Competencia desleal Fraude Robo de información confidencial Espionaje industrial
Todos, problemas surgidos por un uso indebido de los beneficios que nos entregan las
tecnologías de la información.
¿De qué se trata? Mediante sus procedimientos se identifican, aseguran, extraen, analizan y presentan pruebas generadas y guardadas electrónicamente para que puedan ser aceptadas en un proceso legal.
Las distintas metodologías forenses incluyen la captura segura de datos de diferentes medios digitales y evidencias digitales, sin alterar la información de origen.
Las evidencias digitales recabadas permiten elaborar un dictamen fundamentado y con justificación de las hipótesis que en él se barajan a partir de las pruebas recogidas.
Gracias a este proceso, la informática forense aparece como una "disciplina auxiliar" de la justicia moderna, para enfrentar los desafíos y técnicas de los intrusos informáticos, así como garante de la verdad utilizando la "evidencia digital".
OBJETIVOS DE LA INFORMÁTICA FORENSE La informática forense tiene 3 objetivos, a saber: 1. La compensación de los daños causados por los criminales o intrusos. 2. La persecución y procesamiento judicial de los criminales. 3. La creación y aplicación de medidas para prevenir casos similares.
Estos objetivos son logrados de varias formas, entre ellas, la principal es la recolección de evidencia. Usos de la Informática forense Existen varios usos de la informática forense, muchos de estos usos provienen de la vida diaria, y no tienen que estar directamente relacionados con la informática forense: 1. Prosecución Criminal: Evidencia incriminatoria puede ser usada para procesar una variedad de crímenes, incluyendo homicidios, fraude financiero, tráfico y venta de drogas, evasión de impuestos o pornografía infantil.
226
2. Litigación Civil: Casos que tratan con fraude, discriminación, acoso, divorcio, pueden ser ayudados por la informática forense. 3. Investigación de Seguros: La evidencia encontrada en computadores, puede ayudar a las compañías de seguros a disminuir los costos de los reclamos por accidentes y compensaciones. 4. Temas corporativos: Puede ser recolectada información en casos que tratan sobre acoso sexual, robo, mal uso o apropiación de información confidencial o propietaria, o aún de espionaje industrial. 5. Mantenimiento de la ley: La informática forense puede ser usada en la búsqueda inicial de órdenes judiciales, así como en la búsqueda de información una vez se tiene la orden judicial para hacer la búsqueda exhaustiva.
ANÁLISIS FORENSE: Es un área perteneciente al ámbito de la seguridad informática surgida a raíz del incremento de los diferentes incidentes de seguridad. En el análisis forense se realiza un análisis posterior de los incidentes de seguridad, mediante el cual se trata de reconstruir como se ha penetrado o vulnerado en el sistema. Por tanto, cuando se está realizando un análisis forense se intenta responder a las siguientes preguntas:
¿Quién ha realizado el ataque? ¿Cómo se realizo? ¿Qué vulnerabilidades se han explotado? ¿Qué hizo el intruso una vez que accedió al sistema?
Metodología y fases de un análisis forense En el análisis forense nos vamos a encontrar con 3 fases bien diferenciadas a pesar de que, dependiendo del enfoque y del tipo que sea, dicho análisis se podrá dividir en más fases. Adquisición de datos La adquisición de datos es una de las actividades más críticas en el análisis forense. Dicha criticidad es debida a que, si se realizase mal, todo el análisis e investigación posterior no sería válido debido a que la información saldría con impurezas, es decir, la información que creemos que es del origen no lo es realmente.
Una vez que se ha detectado un incidente de seguridad, uno de los primeros problemas del analista en la recogida de datos se resume en decir si el equipo hay que apagarlo o no. ¿Apagar o no el equipo? Esta decisión, aunque pueda parecer trivial, no lo es tanto, porque las consecuencias pueden ser varias: perder evidencias que estén en la memoria volátil, ver los usuarios conectados, ver los procesos en ejecución, conocer las conexiones existentes, etc.
227

Otro de los problemas que nos encontraremos a veces y dependiendo del tipo de organización es la obtención de los siguientes datos: nombre y apellidos del responsable del equipo y usuario del sistema. Otros datos que se deben obtener como mínimo serían: modelo y descripción del sistema, número de serie, sistema operativo que está corriendo, así como el coste económico aproximado que tiene dicho incidente (por ejemplo, si ha sido atacado el sistema de gestión de un láser y para su equilibrado se precisa de técnicos que tienen que desplazarse, sería un coste axial como el tiempo de estar parado). Redacción del informe La redacción del informe es una tarea ardua a la par que compleja, porque no sólo hay que recoger todas las evidencias, indicios y pruebas recabados sino que, además, hay que explicarlos de una manera clara y sencilla. Hay que tener en cuenta que muchas veces dichos informes van a ser leídos por personas sin conocimientos técnicos y obviamente tiene que ser igual de riguroso y debe ser entendido, con lo que habrá que explicar minuciosamente cada punto.
Todo informe deberá tener perfectamente identificada la fecha de finalización de éste, así como a las personas involucradas en su desarrollo.
Aunque a continuación explicaremos los dos tipos de informes que hemos mencionado anteriormente (informe ejecutivo e informe técnico) en ciertas situaciones se pueden unificar en uno dependiendo del caso y de la situación, aunque no es recomendable. Informe ejecutivo Los principales lectores de los informes ejecutivos son la alta dirección de las empresas, organismos, etc.; es decir, personas que no tienen un perfil técnico.
Por tanto, el lenguaje del informe no debe ser muy técnico y, si se utiliza alguna jerga técnica, tiene que ser explicada de una manera clara. Este informe consta de los siguientes puntos: • Introducción: se describe el objeto del informe así como el coste del incidente acaecido. • Descripción: se detalla que ha pasado en el sistema de una manera clara y concisa sin entrar en cuestiones muy técnicas. Hay que pensar que dicho informe será leído por personal sin conocimientos técnicos o con muy escasos conocimientos. • Recomendaciones: se describen las acciones que se deben realizar una vez comprobado que se ha sufrido una incidencia para evitar otra incidencia del mismo tipo, así como si debe ser denunciado. Informe técnico En este tipo de informe sus principales lectores son personas con un perfil técnico (ingenieros, técnicos superiores, etc.), siendo el objetivo del informe describir qué ha ocurrido en el sistema. El informe debe contener al menos los siguientes puntos:
228
• Introducción: donde se describe el objeto principal del informe y se detallan los puntos fundamentales en que se disecciona el informe. • Preparación del entorno y recogida de datos: se describen los pasos a seguir para la preparación del entorno forense, la adquisición y verificación de las imágenes del equipo afectado, etc. • Estudio forense de las evidencias: en este punto se describe la obtención de las evidencias así como de su significado. • Conclusiones: donde se describen de una manera detallada las conclusiones a las que se han llegado después de haber realizado el análisis.
COMUNIDADES QUE UTILIZAN INFORMÁTICA FORENSE. Entidades que aplican la ley, Fuerzas militares, Industrias y bancos. ¿Qué no es Informática Forense? • No es el simple hecho de recuperar ficheros eliminados por error de un equipo. • No es el descubrir porque una máquina se ha contaminado por un virus y su eliminación: eso es trabajo de un Antivirus. • No esta limitada a aquello que podemos encontrar en una sola máquina: la información útil puede estar dispersa en diferentes sistemas. Herramientas de Análisis Forense • Software Comercial: En los últimos años han aparecido multitud de empresas que ofrecen herramientas comerciales de análisis forense. • Software OpenSource: El auge de la Informática Forense ha hecho que se incremente la cantidad de gente interesada en el tema, y muchas de ellas han creado herramientas Open Source de potencial muy elevado accesibles a cualquiera: TCT (The Coroner’s Toolkit): Suite de herramientas de AF creada por dos de los padres de la AF: Dan Farmer y Wietse Venema. TSK / Autopsy (The Sleuth Kit): Herramientas basadas en TCT Foremost: Recuperación de archivos según sus cabeceras y pies. ODESSA (Open Digital Evidence Search and Seizure Architecture): suite de herramientas para recuperar información en sistemas Windows (papelera de reciclaje, históricos de navegación web, etc.)
PROBLEMAS ACTUALES EN LA INFORMATICA FORENSE • No existen metodologías estandarizadas para la recuperación de evidencias digitales. Iniciativas como CTOSE van en este camino.
229
• Se recurre a los expertos forenses mucho tiempo después de producirse los incidentes, con lo que la información que podía ser útil suele perderse o alterarse parcial o totalmente. • La forma de obtener y almacenar las evidencias digitales está basada en unas “buenas maneras”. • El Análisis Forense lo llega a realizar personal que no tiene base tecnológica y no conoce profundamente los Sistemas Operativos y dispositivos de donde debe obtener la información. • A los técnicos que realizan Análisis Forense les es costoso demostrar que los métodos seguidos son válidos a alguien que no tiene una base tecnológica. • Emplear la I.F. dentro de una empresa puede violar la intimidad o los derechos de los empleados siempre que no se sigan códigos éticos. El ¿Futuro? de la Informática Forense • Los investigadores forenses ya no pueden quedarse limitados a los ordenadores. • Con el auge de los honeypots y honeynets, los atacantes emplean métodos para ocultar, ofuscar o encriptar la información utilizada en los ataques (exploits, rootkits, etc.) con lo que la reconstrucción de los ataques es más compleja y requiere conocimientos de ingeniería inversa. • Cada vez más, han ido apareciendo nuevos dispositivos, más complejos y que almacenan información importante: Teléfonos móviles: teléfonos, mensajes, listados de llamadas, etc. PDAs: prácticamente se asemejan más a los ordenadores la información que almacenan puede ser tan importante como la de estos. Relojes, tarjetas inteligentes, etc... • Entonces: ¿si en un HD pueden haber datos “eliminados” recuperables y utilizables como evidencia...¿por qué no en una PDA, o en un móvil? • Mientras que la ciencia forense ha mejorado técnicas para investigar sobre un mismo medio, la informática forense debe adaptarse y mejorar sus técnicas para investigar sobre un medio cambiante día a día.
HERRAMIENTAS EN LA INFORMÁTICA FORENSE Los programadores han creado muchas aplicaciones para la informática forense.
En muchos casos, su uso dependo de los presupuestos que tenga el departamento que esté haciendo la investigación y la experiencia que se tiene. A continuación mostraremos unos cuantos programas y dispositivos que hacen posible el análisis de un sistema informático en caso de un supuesto delito:
230
El software de imagen de disco graba la estructura y contendido de un disco duro. Con este software, no solo es posible copiar la información del disco, sino preservar la manera en que los ficheros están organizados y su relación con los otros archivos del sistema.
El software o hardware de escritura, copian y reconstruyen los discos duros bit a bit. Tanto las herramientas software como hardware eluden cambiar cualquier información. Algunas herramientas requieren que los investigadores retiren los discos duros del ordenador del sospechoso antes de hacer una copia.
Las herramientas de hashing hacen comparaciones de los discos duros originales a las copias. Analizan los datos y las asignan un número único. Si los números encriptados del original y la copia coinciden, la copia es una réplica perfecta del original.
Los investigadores utilizan programas de recuperación de archivos para buscar y restaurar datos borrados. Estos programas localizan los datos que el ordenador a marcado como eliminados pero que aun no han sido sobrescritos. Algunas veces esto resulta en un archivo incompleto, lo cual puede ser mucho más difícil de analizar.
Hay varios programas diseñados para preservar la información en la memoria RAM de un ordenador. De forma distinta a un disco duro, los datos en la RAM dejan de existir cuando alguien apaga el ordenador. Si el software adecuado, esta información puede perderse fácilmente.
El software de análisis revisa toda la información en el disco duro buscado contenido específico. Al poder los ordenadores modernos, tener mucha capacidad de almacenamiento, es difícil y tedioso buscar archivos manualmente. Por ejemplo, algunos programas de análisis buscan y evalúan las cookies de Internet, lo cual pueden decir al investigador cosas sobre la actividad del sospechoso en la red. Otros programas permiten a los investigadores buscar un tipo determinado de contenido que los investigadores estén buscando.
El software decodificador de información encriptada y los famosos programas para craquear contraseñas son muy utilizados y útiles para acceder a los datos protegidos. Los investigadores utilizan varios programas de este tipo, los cuales se actualizan cada poco tiempo.
Estas herramientas son útiles siempre y cuando los investigadores sigan los
procedimientos correctos. De otra manera, un abogado podría sugerir que cualquier evidencia encontrada en un equipo informático no es fiable. Por supuesto, hay gente que dice que ninguna de estas pruebas son fiables al cien por cien.
FASES EN UNA INVESTIGACIÓN DE INFORMÁTICA FORENSE. El científico en computadoras y experto reconocido en informática forense, Judd Robbins, nos da una lista de los pasos que deberían seguir los investigadores para recuperar evidencias en un ordenador sospechoso de tener pruebas delictivas. Por supuesto, cada grupo de investigadores,
231

dependiendo del cuerpo y el país, tendrán variaciones sobre los métodos a utilizar, pero el método de Robbins está mundialmente reconocido:
Asegurar el sistema informático para mantener el equipo y los datos a salvo. Esto significa que los investigadores deben asegurarse de que individuos no autorizados puedan acceder al ordenador, o a los dispositivos de almacenamiento dentro de la investigación. Si el sistema informático se conecta a Internet, dicha conexión debe ser cancelada.
Se debe encontrar todos los ficheros y archivos del sistema, incluyendo aquellos que están encriptados, protegidos con contraseña, escondidos o borrados, pero que no estén todavía sobrescritos. Los investigadores deben hacer una copia de todos los archivos del sistema. Con esto queremos decir, tanto del disco duro como todos los demás dispositivos que puedan almacenar información. Al poder alterar un archivo cuando accedemos a el, es importante para los investigadores trabajar solamente con copias mientras se busca evidencias. El sistema original debe permanecer intacto.
Hay que recuperar toda la información borrada que se pueda, usando aplicaciones que pueden detectar dicha información y hacerla disponible de nuevo para su visionado.
Se debe revelar el contenido de ficheros y archivos ocultos, con programas espacialmente diseñados para esta función.
Desencriptar y acceder a información protegida.
Analizar áreas especiales de los discos del ordenador, incluyendo las partes que normalmente no están accesibles. En términos de informática, el espacio no usado en los discos de un ordenador, se llama espacio no localizado. Dicho espacio podría contener archivos o partes de ficheros que son relevantes al caso.
Hay que documentar cada paso del procedimiento. Es importante para los investigadores mostrar pruebas de que sus investigaciones han preservado toda la información del sistema informático sin cambiar o dañar nada. Puede pasar años entre una investigación y el juicio, y sin la documentación apropiada, puede que las pruebas no sean admisibles. Robbins dice que la documentación no solo debería incluir los archivos y los datos recuperados del sistema, sino también un informe de la condición física del sistema, y si algún dato estaba encriptado u oculto.
Todos estos pasos son importantes, pero el primero es crítico. Si los investigadores no
pueden probar que han asegurado su sistema informático, las evidencias encontradas podrían no valer de nada. Es un trabajo complejo. En los primeros años en la historia del ordenador, el sistema podía incluir solo un PC y unos cuantos disquetes. Hoy en día, puede incluir varios ordenadores, discos, dispositivos externos de almacenamiento, periféricos, y servidores Web.
Los que comenten delitos informáticos, han encontrado maneras de hacer más difícil el seguimiento de los investigadores para que puedan encontrar información. Usan programas y
232

aplicaciones conocidas como anti-forenses. Los investigadores deben conocer estas herramientas de software, y saber cómo deshabilitarlas sin quieren tener éxito accediendo a la información. En la siguiente sección de este curso rápido sobre informática forense, veremos en qué consisten estos programas anti-forenses. Encuéntralo pulsando aquí.
233

BIBLIOGRAFIA Lázaro Domínguez, Francisco. (2013). Introducción A La Informática Forense. España: Ra-Ma
Editorial. José Arquillo Cruz. (2006). Herramienta de Apoyo para el Análisis Forenses de Computadoras.
España: Universidad de Jaén. José Arquillo Cruz. (2009). Análisis forense de sistemas informáticos. España: UOC. Varios. (2013). Algorithms, Key Sizes and Parameters Report. España: ENISA.
REFERENCIAS SANS Institute (SANS InfoSec Reading Room): www.sans.org/rr/ Forensics Science Communications: http://www.fbi.gov/hq/lab/fsc/current/index.htm Página web de Wietse Venema http://www.porcupine.org/ ActivaLink (página web de Ervin Sarkisov): http://www.activalink.net/ sleuthkit.org (página web de SleuthKit y Autopsy): http://www.sleuthkit.org/ Proyecto Honeynet: http://www.honeynet.org/ Códigos éticos en I.F. y hacking en general: http://www.isc2.org/ http://www.osstmm.org/
http://www.thesedonaconference.org/ [ReEx00] Michael G. Noblett. (2000) Recovering and Examining Computer Forensic Evidence.
Disponible en: http://www.fbi.gov/hq/lab/fsc/backissu/oct2000/computer.htm [ScWo00] Scientific Working Group on Digital Evidence (SWGDE) (2000)
Computer Evidence Defined http://www.forensics-intl.com/def3.html Cano Martines Jeimy José. (2006) Buenas prácticas en la administración de la evidencia digital
Disponible: http://gecti.uniandes.edu.co/docs/buenas%20practica%20evidencia%20dig ital%20jcano.pdf
234

Comparación empírica entre el proceso unificado y el desarrollo de software por prototipos.
RAMÓN VENTURA ROQUE HERNÁNDEZ1
Facultad de Comercio, Administración y Ciencias Sociales, Universidad Autónoma de Tamaulipas
JUAN MANUEL SALINAS ESCANDÓN
Facultad de Comercio, Administración y Ciencias Sociales, Universidad Autónoma de Tamaulipas
CALEB ALFREDO ÁLAMOS ACOSTA
Facultad de Comercio, Administración y Ciencias Sociales, Universidad Autónoma de Tamaulipas
ROBERTO ARREOLA RIVERA
Facultad de Comercio, Administración y Ciencias Sociales, Universidad Autónoma de Tamaulipas
En este artículo se presentan los resultados de una investigación en la que se pidió a dos grupos de programadores que desarrollaran varios proyectos de software de corta duración, requerimientos reales y presupuesto limitado. Un grupo utilizó el Proceso unificado y el otro usó Prototipos. Los programadores expresaron su percepción acerca del desarrollo a través de un cuestionario en donde evaluaron aspectos relacionados con la metodología que siguieron. El trabajo presenta una comparación entre ambos grupos y enfatiza las diferencias obtenidas. PALABRAS CLAVE Comparación, Desarrollo de software, Proceso Unificado, Prototipos. This paper presents the results of a research in which two groups of programmers were asked to develop several short software projects with limited budget and real end-user requirements. The first group followed the Unified Process (UP), and the second group used a Prototypes approach. The programmers expressed their perception about the development process using a questionnaire in which several aspects related to the methodology were evaluated. This paper presents a comparison between the two groups, and highlights the differences that were discovered. KEYWORDS Comparison, Software Development, Unified Process, Prototypes.
1Address correspondence to Ramón Ventura Roque Hernández, Facultad de Comercio, Administración y Ciencias Sociales, Universidad Autónoma de Tamaulipas. E-mail: [email protected], [email protected]
235
INTRODUCCIÓN El desarrollo de software es una actividad que debe realizarse sin descuidar el cumplimiento de estándares de calidad. Los modelos de proceso de software ayudan a este objetivo proporcionando una representación ordenada y adaptable de las actividades que intervienen en el desarrollo de un proyecto. Dos modelos de proceso muy utilizados en la Ingeniería de Software son el Proceso Unificado (PU) y el desarrollo por Prototipos. El PU surge en la década de los noventa como una respuesta profesional, ágil y orientada a objetos a la necesidad de crear software cada vez más complejo. El desarrollo por Prototipos surge de la necesidad de flexibilizar enfoques tardados y rígidos con la incorporación de prácticas iterativas y evolutivas, las cuales se volvieron populares en escenarios en donde el software debía ser entregado en corto tiempo y se contaba con entornos de desarrollo que incluían elementos para la fácil y rápida creación de interfaces de usuario. Tanto el PU como los prototipos persiguen el objetivo de satisfacer los requerimientos de los usuarios con un software confiable y de buena calidad en corto tiempo.
Seguir un modelo de proceso de software no es garantía de que el producto final sea
entregado a tiempo o cumpla con los requisitos planteados inicialmente. El proceso puede ser evaluado para asegurar el cumplimiento de criterios de calidad, para lo cual se realizan valoraciones de características de interés bien definidas. En el proceso de evaluación se pueden considerar factores cualitativos y cuantitativos. Por ejemplo, las actitudes de administradores y profesionales pueden brindar perspectivas orientadoras en la toma de decisiones y en la mejora general del proceso adoptado.
Para el PU, las posturas y percepciones de los involucrados en el proceso de desarrollo
son relevantes, ya que las Personas son una de las cuatro “P” que se valoran en el desarrollo de software con este enfoque (las otras tres son Proyecto, Producto y Proceso). En (Jacobson, Booch, & Rumbaugh, 2005) se reconoce que el proceso debería orientarse hacia las personas que lo utilizan ya que éste afecta directamente su motivación, comodidad, dinámica de trabajo, y sensación de cumplimiento. Por otra parte, los enfoques ágiles coinciden en valorar a los individuos y sus interacciones por encima de los procesos y las herramientas.
En este artículo se presentan las diferencias entre la percepción de dos grupos de
programadores acerca del proceso de desarrollo de proyectos de software cortos siguiendo el Proceso Unificado y el enfoque por prototipos. En la investigación se recabó la evaluación que los participantes dieron a diez aspectos del proceso a través de un cuestionario con afirmaciones y valoraciones en la escala de Likert.
El trabajo se encuentra estructurado de la siguiente manera: primero se abordan los
antecedentes del Proceso Unificado y del desarrollo por Prototipos, posteriormente se describe la metodología que se siguió en esta investigación, luego se analizan los resultados prácticos que se obtuvieron y finalmente se presentan las conclusiones y el trabajo futuro.
236
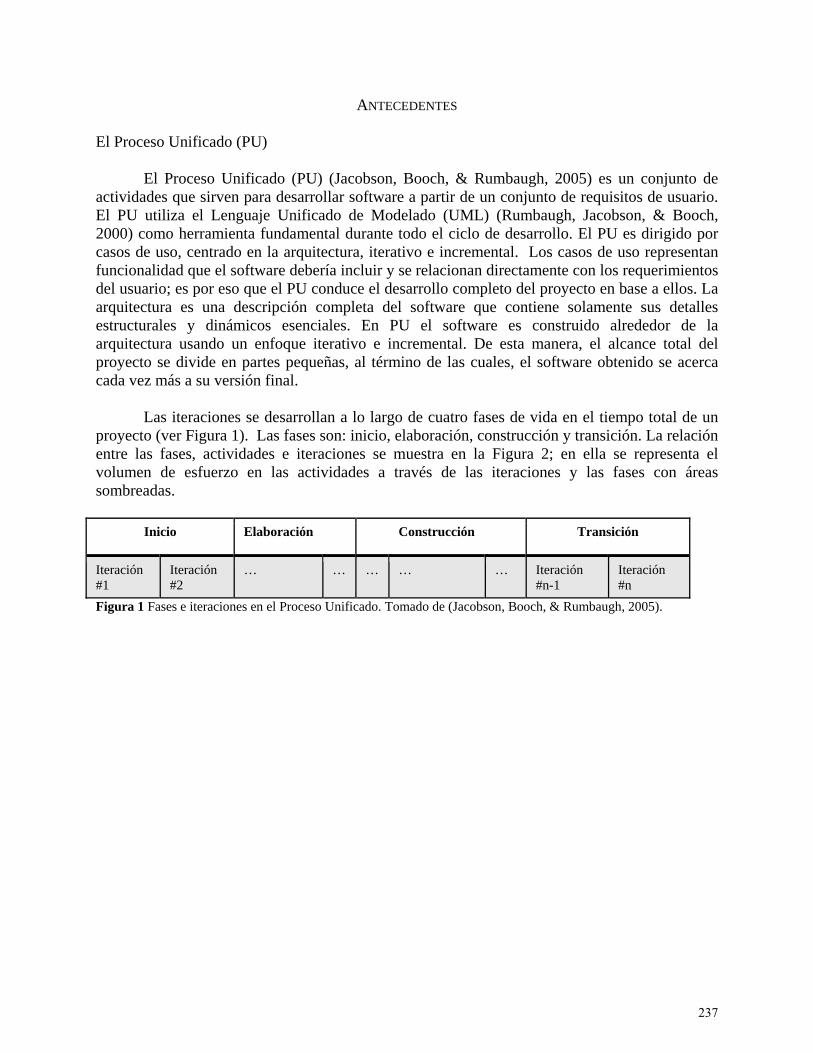
ANTECEDENTES El Proceso Unificado (PU)
El Proceso Unificado (PU) (Jacobson, Booch, & Rumbaugh, 2005) es un conjunto de actividades que sirven para desarrollar software a partir de un conjunto de requisitos de usuario. El PU utiliza el Lenguaje Unificado de Modelado (UML) (Rumbaugh, Jacobson, & Booch, 2000) como herramienta fundamental durante todo el ciclo de desarrollo. El PU es dirigido por casos de uso, centrado en la arquitectura, iterativo e incremental. Los casos de uso representan funcionalidad que el software debería incluir y se relacionan directamente con los requerimientos del usuario; es por eso que el PU conduce el desarrollo completo del proyecto en base a ellos. La arquitectura es una descripción completa del software que contiene solamente sus detalles estructurales y dinámicos esenciales. En PU el software es construido alrededor de la arquitectura usando un enfoque iterativo e incremental. De esta manera, el alcance total del proyecto se divide en partes pequeñas, al término de las cuales, el software obtenido se acerca cada vez más a su versión final.
Las iteraciones se desarrollan a lo largo de cuatro fases de vida en el tiempo total de un proyecto (ver Figura 1). Las fases son: inicio, elaboración, construcción y transición. La relación entre las fases, actividades e iteraciones se muestra en la Figura 2; en ella se representa el volumen de esfuerzo en las actividades a través de las iteraciones y las fases con áreas sombreadas.
Inicio Elaboración Construcción Transición
Iteración #1
Iteración #2
… … … … … Iteración #n-1
Iteración #n
Figura 1 Fases e iteraciones en el Proceso Unificado. Tomado de (Jacobson, Booch, & Rumbaugh, 2005).
237

Figura 2 FRumbaugh
Eespecificprincipalimplemensiguiendocompletolos esfue Desarroll Un protoestá siendpromuevrápida in
L
2012). Scaracteríssirve comalcance ddescarta
N
importanesta razó
Flujos de trabajh, 2005)
En la fase daciones prec
lmente en cntan las funo los casos o. En la fase rzos en la sa
lo por protot
otipo es un mdo construid
ve la comunitegración de
Los prototipoi es evolutivsticas en funmo un mediodel productoy se comien
No importa lante ya que paón que se deb
jo (Actividades
de inicio secisas de los ronstruir lo ciones más rde uso y nude transició
atisfacción d
tipos
medio para qudo (Kendall &icación entree cambios y a
os pueden svo, el softwnción de loso de extracco que se vaza el desarro
a clase de para el usuaribe cuidar la
s) y fases del c
e comienza requerimientfundamentalrelevantes q
utriendo la an se cuenta c
de los usuario
ue el cliente & Kendall, 2e el cliente yacorta el tiem
ser evolutivware comienz
s comentarioión de reque
a a construirollo del softw
rototipo queio no hay difacilidad de
ciclo de vida de
con el protos que inclul de la arqu
que contribuiarquitectura, con una versos y en la co
proporcione2013). El desy el equipo mpo de desa
vos o desechza con una vos del usuarerimientos or; una vez qware con una
e se construyiferencia ente uso y de in
e un proyecto e
oyecto y seuirá. En la fuitectura. Enirán a la ope que graduasión confiab
orrección o aj
e retroalimensarrollo de sde program
arrollo del pr
hables (Sánversión inicrio. Si es do de entendimque cumple a arquitectur
ya, la interfatre el sistemnteracción p
en PU. (Jacobs
e describe fase de elabon la fase deeración del salmente descle del softwa
ajustes de fun
ntación sobrsoftware bas
madores, a la royecto.
nchez, Sicilicial, la cual desechable, miento de lasu objetivo
ra real y más
az de usuarioma real y un para no gene
son, Booch, &
el softwareoración se tre construcciósoftware, siecribirá al sisare y se focancionalidad.
re el softwarado en protovez que log
a, & Rodríva refinandel prototipoa funcionalido, el prototips robusta.
o es un elemprototipo. Erar desánim
e con rabaja ón se empre stema alizan
re que otipos gra la
guez, o sus
o solo dad y po se
mento Es por
mo por
238
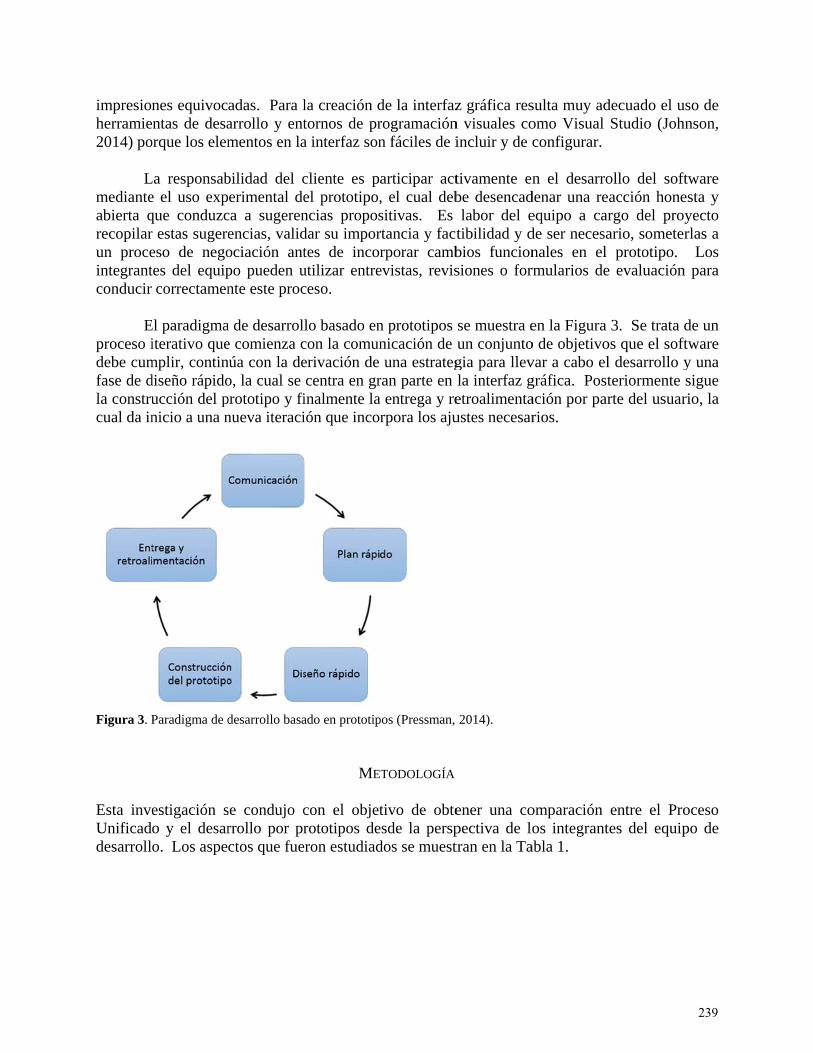
impresionherramie2014) po
L
medianteabierta qrecopilarun proceintegrantconducir
E
proceso idebe cumfase de dla construcual da in
Figura 3. P
Esta inveUnificaddesarroll
nes equivocntas de desa
orque los elem
La responsabe el uso expque conduzcr estas sugereeso de negotes del equipcorrectamen
El paradigmaiterativo que
mplir, contindiseño rápidoucción del pnicio a una n
Paradigma de d
estigación so y el desaro. Los aspe
adas. Para larrollo y entmentos en la
bilidad del cerimental de
ca a sugerenencias, validociación antpo pueden unte este proc
a de desarrole comienza cnúa con la deo, la cual se prototipo y finueva iteraci
desarrollo basa
se condujo crrollo por prctos que fue
la creación dtornos de pra interfaz son
cliente es pel prototipo,ncias proposdar su importes de incorutilizar entreceso.
lo basado encon la comunerivación de centra en grinalmente laión que incor
ado en prototip
ME
con el objetrototipos de
eron estudiad
de la interfazrogramaciónn fáciles de i
articipar act, el cual debsitivas. Es rtancia y factrporar camb
evistas, revis
n prototipos nicación de una estrateg
ran parte en a entrega y rerpora los aju
pos (Pressman,
TODOLOGÍA
tivo de obte
esde la perspdos se muest
z gráfica resn visuales coincluir y de c
tivamente enbe desencadlabor del e
tibilidad y dbios funcionsiones o for
se muestra eun conjuntogia para llevla interfaz getroalimentaustes necesar
2014).
ener una copectiva de lotran en la Ta
sulta muy adomo Visual configurar.
n el desarrodenar una reequipo a carde ser necesanales en el rmularios de
en la Figura o de objetivovar a cabo elgráfica. Postación por parrios.
omparación os integrant
abla 1.
decuado el uStudio (Joh
ollo del softacción honergo del proyario, someter
prototipo. e evaluación
3. Se trata dos que el softl desarrollo yteriormente rte del usuar
entre el Protes del equip
uso de hnson,
ftware esta y yecto rlas a Los
n para
de un ftware y una sigue rio, la
oceso po de
239

Número de
aspecto
Descripción
1 En el desarrollo participamos activamente 2 Tuvimos problemas para organizarnos 3 Se nos dificultó tomar decisiones 4 Durante el desarrollo me mantuve motivado todo el tiempo 5 El desarrollo de software en general se puede beneficiar con
esta metodología 6 Esta metodología es adecuada para desarrollar software
cuando se tienen pocos recursos disponibles 7 Se obtuvo un software de buena calidad 8 La metodología utilizada contribuyó a la obtención rápida de
un programa final de calidad 9 La metodología utilizada favorece el desarrollo rápido de
aplicaciones 10 En el futuro buscaré aplicar esta metodología a otros
proyectos. Tabla 1 Aspectos estudiados en esta investigación.
Para el logro de este objetivo, se formaron dos grupos de programadores, cada uno dividido a su vez en equipos pequeños de hasta tres integrantes como máximo. La experiencia de los programadores era comparable en ambos grupos y se ubicaba en el nivel intermedio. A cada equipo se le encargó la creación de un software de escritorio orientado por necesidades de usuarios reales que contaban con presupuesto limitado para su desarrollo. Los proyectos tenían menos de cien requerimientos y se completaron en dos meses en promedio. El software fue desarrollado en C# (Stephens, 2014) usando una interfaz gráfica basada en Windows Forms (Liberty & Hurwitz, 2012) con excepción de un caso, en donde se usó en lenguaje Java (Schildt, 2014). Los proyectos que fueron considerados válidos para incluirse el presente estudio fueron 15 que siguieron el Proceso Unificado y 10 que utilizaron un enfoque por Prototipos.
Una vez que cada equipo finalizó su proyecto, se aplicó un cuestionario a cada uno de los
equipos, en donde se solicitó la evaluación de los aspectos incluidos en la Tabla 1. Se usó la escala de Likert para recabar las respuestas. A cada posible respuesta se le asignó un valor numérico de 0 a 4 de la siguiente manera: Totalmente en desacuerdo (0), en desacuerdo (1), neutral (2), de acuerdo (3), totalmente de acuerdo (4).
Se utilizó el paquete estadístico SPSS (Wagner, 2014) para realizar el análisis de los
datos, que consistió en la prueba no paramétrica de Mann Whitney (Anderson, Sweeney, & Williams, 2011) para buscar diferencias significativas entre las posturas de los dos grupos de estudio. Con este objetivo se plantearon las siguientes hipótesis:
H0: No existen diferencias estadísticas significativas entre las posturas de los programadores que siguieron PU y Prototipos hacia el aspecto estudiado i.
240
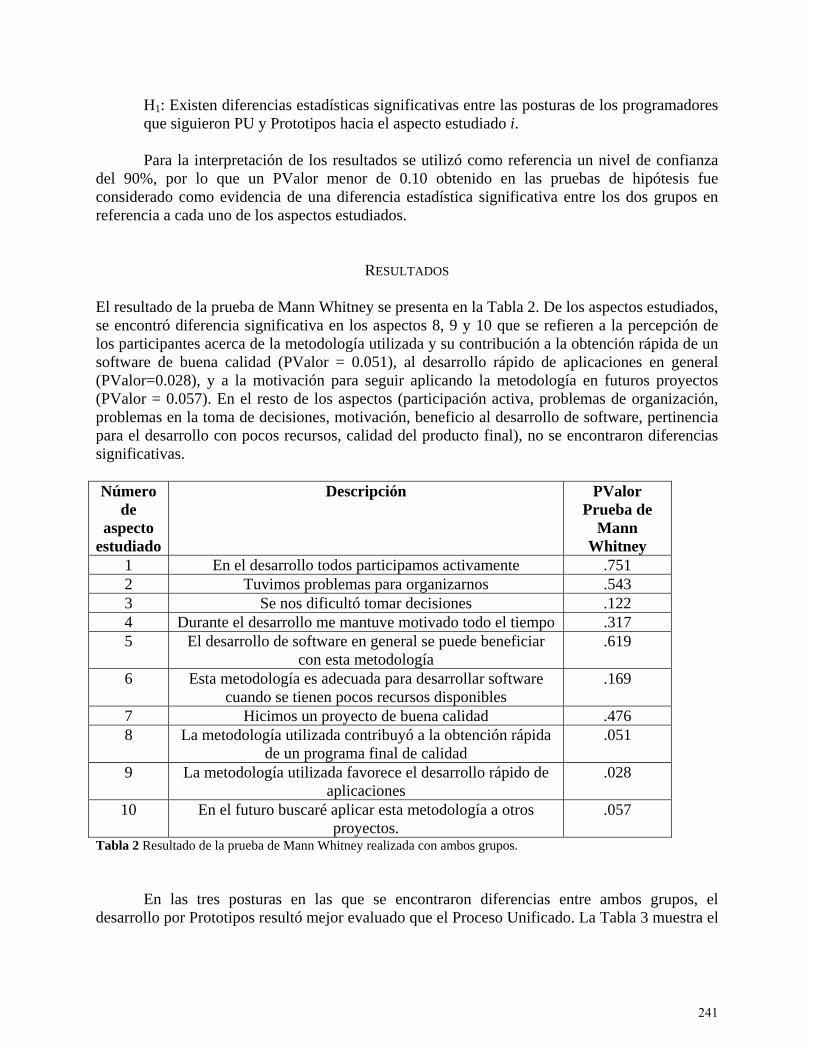
H1: Existen diferencias estadísticas significativas entre las posturas de los programadores que siguieron PU y Prototipos hacia el aspecto estudiado i.
Para la interpretación de los resultados se utilizó como referencia un nivel de confianza
del 90%, por lo que un PValor menor de 0.10 obtenido en las pruebas de hipótesis fue considerado como evidencia de una diferencia estadística significativa entre los dos grupos en referencia a cada uno de los aspectos estudiados.
RESULTADOS
El resultado de la prueba de Mann Whitney se presenta en la Tabla 2. De los aspectos estudiados, se encontró diferencia significativa en los aspectos 8, 9 y 10 que se refieren a la percepción de los participantes acerca de la metodología utilizada y su contribución a la obtención rápida de un software de buena calidad (PValor = 0.051), al desarrollo rápido de aplicaciones en general (PValor=0.028), y a la motivación para seguir aplicando la metodología en futuros proyectos (PValor = 0.057). En el resto de los aspectos (participación activa, problemas de organización, problemas en la toma de decisiones, motivación, beneficio al desarrollo de software, pertinencia para el desarrollo con pocos recursos, calidad del producto final), no se encontraron diferencias significativas. Número
de aspecto
estudiado
Descripción PValor Prueba de
Mann Whitney
1 En el desarrollo todos participamos activamente .751 2 Tuvimos problemas para organizarnos .543 3 Se nos dificultó tomar decisiones .122 4 Durante el desarrollo me mantuve motivado todo el tiempo .317 5 El desarrollo de software en general se puede beneficiar
con esta metodología .619
6 Esta metodología es adecuada para desarrollar software cuando se tienen pocos recursos disponibles
.169
7 Hicimos un proyecto de buena calidad .476 8 La metodología utilizada contribuyó a la obtención rápida
de un programa final de calidad .051
9 La metodología utilizada favorece el desarrollo rápido de aplicaciones
.028
10 En el futuro buscaré aplicar esta metodología a otros proyectos.
.057
Tabla 2 Resultado de la prueba de Mann Whitney realizada con ambos grupos.
En las tres posturas en las que se encontraron diferencias entre ambos grupos, el desarrollo por Prototipos resultó mejor evaluado que el Proceso Unificado. La Tabla 3 muestra el
241

rango promedio (Prueba de Mann Whitney) de cada aspecto con diferencias. La Tabla 4 muestra la mediana y el rango intercuartil de las respuestas para cada aspecto.
Id Aspecto Prueba MW
Rango Promedio PU
Prueba MW Rango Promedio
Prototipos 8 La metodología utilizada contribuyó a la obtención
rápida de un programa final de calidad 10.87 16.20
9 La metodología utilizada favorece el desarrollo rápido de aplicaciones
10.63 16.55
10 En el futuro buscaré aplicar esta metodología a otros proyectos.
11.13 15.80
Tabla 3 Rango promedio de los aspectos en los que el desarrollo por Prototipos resultó mejor evaluado que el Proceso Unificado.
Id Aspecto Mediana + Rango intercuartil
PU
Mediana + Rango intercuartil
Prototipos
8 La metodología utilizada contribuyó a la obtención rápida de un programa final de calidad
3 + 1 4 + 1
9 La metodología utilizada favorece el desarrollo rápido de aplicaciones
3 + 1 4 + 1
10 En el futuro buscaré aplicar esta metodología a otros proyectos.
4 + 1 4 + 0
Tabla 4. Evaluación de los aspectos en los que el desarrollo por Prototipos resultó mejor evaluado que el Proceso Unificado.
De acuerdo a las respuestas obtenidas, el desarrollo por prototipos obtuvo las puntuaciones más altas en cuanto a su contribución al desarrollo rápido de aplicaciones de calidad, al mismo tiempo que capturó la atención e interés de los participantes, quienes aceptaron buscar la aplicación de esta metodología a nuevos proyectos posteriores. Esto puede deberse a la naturaleza dinámica de trabajo que se implementó en el enfoque por Prototipos, en donde se privilegió la obtención de un software funcional con la retroalimentación continua del cliente: sus sugerencias y modificaciones se incorporaron con rapidez al software. Por otra parte, en el desarrollo con el Proceso Unificado se generaron más entregables de análisis y diseño como documentación y diagramas, los cuales requirieron esfuerzo y tiempo adicionales.
CONCLUSIONES
En este artículo se presentaron los resultados de una investigación que estudió la evaluación que los participantes dieron a la metodología de desarrollo de software con la que trabajaron. En este proceso, se contó con dos grupos de programadores que desarrollaron proyectos de software de escritorio, de corta duración, requerimientos reales y presupuesto limitado. Un grupo utilizó el Proceso Unificado y el otro desarrolló con Prototipos. Los programadores expresaron su percepción acerca del desarrollo a través de un cuestionario en donde evaluaron aspectos relacionados con la metodología que siguieron.
242
Se encontraron diferencias significativas entre la valoración de los participantes en
aspectos como 1) la contribución de la metodología al desarrollo rápido de software en general, 2) la contribución de la metodología a la obtención rápida de un producto de calidad y 3) la intención de seguir aplicando la metodología en proyectos subsecuentes. En estos tres aspectos el desarrollo por Prototipos obtuvo evaluaciones por encima del Proceso Unificado.
Se debe considerar que para esta investigación, el número de proyectos estudiado fue
reducido y el nivel de experiencia de los programadores fue intermedio. También es importante resaltar que los proyectos fueron de escritorio, tuvieron una interfaz gráfica basada en Windows Forms y en su mayoría usaron lenguaje C#.
La comparación del Proceso Unificado y el desarrollo por prototipos desde otras
perspectivas como por ejemplo: la percepción de los investigadores y la calidad del software quedan planteadas como trabajo futuro.
243
REFERENCIAS
Anderson, Sweeney, & Williams. (2011). Estadística para negocios y economía. Cengage Learning.
Jacobson, I., Booch, G., & Rumbaugh, J. (2005). El Proceso Unificado de Desarrollo de Software. Pearson Addison Wesley.
Johnson, B. (2014). Professional Visual Studio. Wrox. Kendall, & Kendall. (2013). Systems Analysis and Design. Prentice Hall. Liberty, J., & Hurwitz, D. (2012). Programming .NET Windows Applications. O'Reilly. Pressman, R. (2014). Software Engineering: A Practitioner's approach (6 ed.). McGrawHill. Rumbaugh, J., Jacobson, I., & Booch, G. (2000). El Lenguaje Unificado de Modelado. Manual
de Referencia. Addison Wesley. Sánchez, S., Sicilia, M. A., & Rodríguez, D. (2012). Ingeniería del Software: Un enfoque desde
la guía SWEBOK. Alfaomega. Schildt, H. (2014). Java: The Complete Reference. Mcgraw-Hill. Stephens, R. (2014). C# 5.0 Programmer's reference. Wrox. Wagner, W. (2014). Using IBM SPSS Statistics for Research Methods and Social Science
Statistics. SAGE Publications.
244
Los principios ágiles del desarrollo de software: Un estudio sobre percepción.
RAMÓN VENTURA ROQUE HERNÁNDEZ1,
Facultad de Comercio, Administración y Ciencias Sociales, Universidad Autónoma de Tamaulipas
ADÁN LÓPEZ MENDOZA,
Facultad de Comercio, Administración y Ciencias Sociales, Universidad Autónoma de Tamaulipas
DANIEL BARRIA CABRERA, Facultad de Comercio, Administración y Ciencias Sociales,
Universidad Autónoma de Tamaulipas
MARLENE ARRIAGA HUERTA, Facultad de Comercio, Administración y Ciencias Sociales,
Universidad Autónoma de Tamaulipas
En este trabajo se abordan los principios del desarrollo ágil de software y se presentan los resultados de una investigación que se condujo entre programadores de experiencia principiante e intermedia con el objetivo de caracterizar su postura ante las filosofías y prácticas ágiles más populares. A los encuestados se les plantearon varias afirmaciones y respondieron a ellas utilizando la escala de Likert. Algunos de los aspectos estudiados incluyen: la obtención de software funcional, documentación, entregas rápidas, requerimientos cambiantes, participación del cliente y valoraciones durante el proceso. El artículo resume los resultados y reflexiona sobre ellos. PALABRAS CLAVE Principios ágiles, desarrollo de software, percepción This paper addresses the principles of agile software development and presents the results of a survey conducted among programmers with beginner to intermediate level of expertise. The objective of the research was to characterize their attitudes towards agile philosophies and practices. The respondents were posed with several statements, and they evaluated them using the Likert scale. Some of the studied aspects were: obtaining functional software, documentation, fast deliveries, changing requirements, client’s participation, and ratings during the process. This work summarizes the results and provides insights on them. KEYWORDS Agile Principles, Software Development, Perception
1 Address correspondence to Ramón Ventura Roque Hernández, Facultad de Comercio, Administración y Ciencias Sociales, Universidad Autónoma de Tamaulipas. E-mail: [email protected], [email protected]
245

INTRODUCCIÓN Una metodología ágil es una forma de construir software que enfatiza las iteraciones, la adaptabilidad del proceso y la colaboración del cliente y del equipo de trabajo (Sánchez, Sicilia, & Rodríguez, 2012). Las iteraciones son ciclos cortos o mini proyectos auto contenidos (Larman, 2004) a través de los cuales se va agregando valor al software que se está desarrollando. De esta manera, un proyecto completo se termina después de trabajar en él repetidamente durante varias iteraciones. La adaptabilidad del proceso se refiere a la capacidad de aceptar nuevos requerimientos para el software después de haber iniciado su desarrollo y modificar la estrategia de trabajo para lograr satisfacer esas nuevas necesidades que van surgiendo. La colaboración del cliente y del equipo es un pilar fundamental para el éxito de los proyectos ágiles. En la agilidad se reconoce a los clientes como la principal fuente de evaluaciones y retroalimentación para el software. Por otra parte, se concibe a los integrantes del equipo como seres humanos importantes que son capaces de auto organizarse para cumplir con sus objetivos.
Las metodologías ágiles aceptan que el software tiene requisitos cambiantes y difícilmente predecibles. Las necesidades del cliente trazan el camino por el cual el equipo se conducirá durante el proyecto completo. En un entorno de trabajo ágil se adoptan modelos iterativos e incrementales y se configuran en ellos las actividades de análisis, diseño, construcción y prueba (Pressman, 2014) evitando trabajo y documentación innecesaria.
Aunque existen diversos enfoques ágiles como Programación Extrema (Beck & Andres,
2004) y Scrum (Sims & Johnson, 2011), los fundamentos de todos ellos se encuentran en el manifiesto ágil (Agile Alliance, 2015), el cual es un conjunto de filosofías y principios que privilegian a los individuos y sus interacciones sobre los procesos y herramientas; al software funcional sobre la documentación completa; a la colaboración del cliente sobre la negociación contractual; a la respuesta al cambio sobre el seguimiento de un plan.
Los principios ágiles pueden adoptarse en equipos pequeños de manera relativamente sencilla; sin embargo puede ser difícil implementarlos (Sommerville, 2011) en entornos en donde: 1) Los gerentes del proyecto tienen poca experiencia en agilidad. 2) Hay procedimientos y estándares ya establecidos que deben seguirse. 3) Se necesitan niveles de habilidad elevados en los miembros del equipo. 4) Persiste una resistencia cultural contra la agilidad, la cual puede ser resultado de prácticas tradicionales prolongadas o prejuicios empresariales o individuales.
Conociendo que las personas son lo más importante en un desarrollo ágil y que la resistencia a la agilidad puede obstaculizar su adopción, para este trabajo se decidió conducir una investigación entre programadores de experiencia principiante e intermedia con el objetivo de conocer más acerca de su postura ante las filosofías y prácticas ágiles más populares. Este artículo presenta los resultados obtenidos en este estudio. Primero se abordan los antecedentes de la agilidad y sus principios, luego se explica la metodología que se siguió en esta investigación, posteriormente presentan y discuten los resultados, y finalmente se exponen las conclusiones y el trabajo futuro.
246
ANTECEDENTES
Principios ágiles de desarrollo de software La agilidad es una práctica de la Ingeniería del Software que en los últimos años se ha popularizado por lograr que los proyectos sean terminados en corto tiempo y de manera exitosa. Los procesos de software ágiles que los equipos de desarrollo deseen adoptar deberán estar orientados por los principios ágiles que define la Alianza ágil (Agile Alliance, 2015); éstos se encuentran resumidos y explicados a continuación: 1. La más alta prioridad es satisfacer al cliente mediante la entrega temprana y continua de software con valor.- En la agilidad, la prioridad más alta es el cliente, no los jefes ni la burocracia o las políticas organizacionales. En este sentido, la entrega de software, principal producto de interés para el cliente, debe ser periódica, oportuna y pertinente. 2. Se acepta que los requerimientos cambien, incluso en etapas tardías del desarrollo.- En un entorno ágil se sabe que es común que ocurran cambios en los requisitos del software, ya sea porque las necesidades de usuario se modifican, porque existen cambios en la tecnología, o por respuesta a estrategias de la competencia. 3. Se entrega software funcional frecuentemente.- Se adopta un enfoque iterativo con el cual es posible entregar software en periodos de dos semanas a dos meses. Siempre se prefiere el periodo más corto posible, pues los ciclos cortos permiten focalizar mejor los esfuerzos. 4. Los responsables de negocio y los desarrolladores trabajan juntos de forma cotidiana durante todo el proyecto.- Si cliente y desarrolladores forman un solo equipo que está en comunicación constante, la retroalimentación del cliente acerca del software es continua y se acrecienta el entendimiento mutuo entre el personal técnico y el cliente. 5. Los proyectos se desarrollan en torno a individuos motivados. Hay que darles el entorno y el apoyo que necesitan, y confiarles la ejecución del trabajo.- Los equipos son auto organizados y están conformados por seres humanos, los cuales, además de ser profesionales, son los elementos más importantes desde la visión del proceso ágil. 6. El método más eficiente y efectivo de comunicar información al equipo de desarrollo y entre sus miembros es la conversación cara a cara.- La agilidad es un proceso basado en la comunicación eficiente y aunque ésta puede existir en distintas modalidades, la preferida será siempre cara a cara. Incluso si se trabaja con equipos virtuales, se prefiere una videoconferencia a un correo electrónico o a una conversación basada en texto. 7. El software funcionando es la medida principal de progreso.- Durante todo el proceso se trabaja para obtener un producto final completo y funcional para el cliente, por lo que el progreso se mide en base a este criterio. 8. Los procesos ágiles promueven el desarrollo sostenible. Los promotores, desarrolladores y usuarios deben ser capaces de mantener un ritmo constante de forma indefinida.- El ritmo de
247

trabajo debe ser regular y no sobrecargado. La agilidad evita las extensas jornadas laborales pues reconoce que disminuyen la productividad de las personas. 9. La atención continua a la excelencia técnica y al buen diseño mejora la Agilidad.- Trabajar ágilmente no significa dejar de lado las buenas prácticas o el diseño para ahorrar tiempo. Al contrario, significa realizar estas actividades durante todo el desarrollo de manera continua y eficiente. 10. La simplicidad es esencial.- Los enfoques ágiles implementan las características del software que son absolutamente necesarias para cumplir los requerimientos de usuario sin esforzarse por incluir características accesorias que seguramente no se usarán. 11. Las mejores arquitecturas, requisitos y diseños emergen de equipos auto-organizados.- Los equipos se organizan para cumplir los objetivos del proyecto; en este proceso, los desarrolladores interactúan, se apoyan y aprenden de sus compañeros logrando productos de alta calidad. 12. A intervalos regulares el equipo reflexiona sobre cómo ser más efectivo para a continuación ajustar y perfeccionar su comportamiento en consecuencia.- El proceso de reflexión permite retroalimentar al equipo sobre las prácticas que emplea. Es así como el proceso mejora constantemente.
METODOLOGÍA Para esta investigación, se encuestó a 43 programadores con nivel de experiencia principiante e intermedio. Aunque todos conocían teóricamente los principios ágiles, de los 43 participantes, 18 (41%) no habían desarrollado proyectos siguiendo los principios de agilidad y 25 (58.1%) sí, usando Programación Extrema, Scrum o Desarrollo Rápido de Aplicaciones (RAD). El cuestionario consistía en diez afirmaciones que debían ser valoradas con la escala de Likert seleccionando una de las siguientes opciones: completamente de acuerdo, de acuerdo, neutral, en desacuerdo y completamente en desacuerdo. El cuestionario entregado a los participantes no categorizaba las afirmaciones, sin embargo, éstas se agruparon para su comprensión y análisis en la Tabla 1.
248
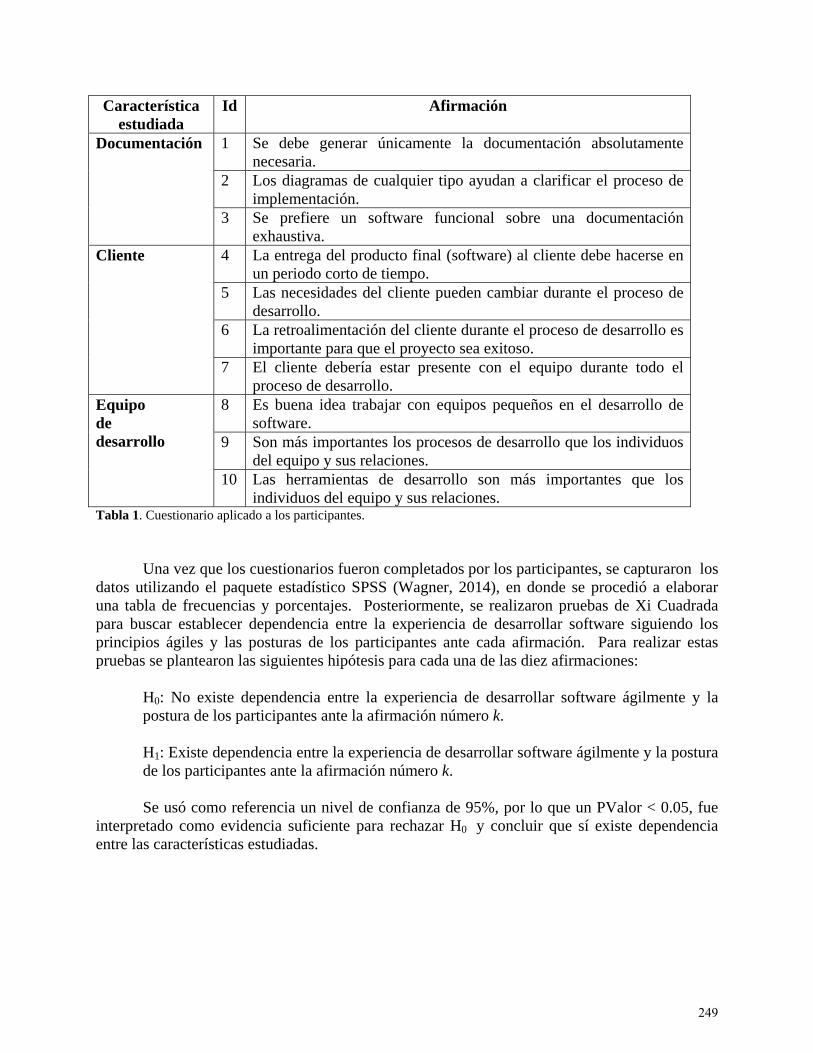
Característica estudiada
Id Afirmación
Documentación 1 Se debe generar únicamente la documentación absolutamente necesaria.
2 Los diagramas de cualquier tipo ayudan a clarificar el proceso de implementación.
3 Se prefiere un software funcional sobre una documentación exhaustiva.
Cliente 4 La entrega del producto final (software) al cliente debe hacerse en un periodo corto de tiempo.
5 Las necesidades del cliente pueden cambiar durante el proceso de desarrollo.
6 La retroalimentación del cliente durante el proceso de desarrollo es importante para que el proyecto sea exitoso.
7 El cliente debería estar presente con el equipo durante todo el proceso de desarrollo.
Equipo de desarrollo
8 Es buena idea trabajar con equipos pequeños en el desarrollo de software.
9 Son más importantes los procesos de desarrollo que los individuos del equipo y sus relaciones.
10 Las herramientas de desarrollo son más importantes que los individuos del equipo y sus relaciones.
Tabla 1. Cuestionario aplicado a los participantes.
Una vez que los cuestionarios fueron completados por los participantes, se capturaron los datos utilizando el paquete estadístico SPSS (Wagner, 2014), en donde se procedió a elaborar una tabla de frecuencias y porcentajes. Posteriormente, se realizaron pruebas de Xi Cuadrada para buscar establecer dependencia entre la experiencia de desarrollar software siguiendo los principios ágiles y las posturas de los participantes ante cada afirmación. Para realizar estas pruebas se plantearon las siguientes hipótesis para cada una de las diez afirmaciones:
H0: No existe dependencia entre la experiencia de desarrollar software ágilmente y la postura de los participantes ante la afirmación número k.
H1: Existe dependencia entre la experiencia de desarrollar software ágilmente y la postura de los participantes ante la afirmación número k.
Se usó como referencia un nivel de confianza de 95%, por lo que un PValor < 0.05, fue
interpretado como evidencia suficiente para rechazar H0 y concluir que sí existe dependencia entre las características estudiadas.
249
RESULTADOS
En la Tabla 2 se muestran los porcentajes de respuestas recabadas para cada planteamiento del cuestionario. La postura de casi la totalidad de los encuestados (95.3%) coincide en que solamente la documentación absolutamente necesaria se debería generar durante el proceso y que las necesidades del cliente son de naturaleza cambiante (93%), ambas son filosofías promovidas por la agilidad. Por otra parte, el proceso de desarrollo ágil si bien no se centra en la creación de diagramas, siempre se ve favorecido de su uso para clarificar, especificar y comunicar. El 88.4% de los participantes se mostró de acuerdo con esta filosofía.
En la literatura se reconoce que la retroalimentación del cliente durante todo el proceso de desarrollo es muy importante para que el equipo dirija sus esfuerzos correctamente. El 79.1% de los encuestados coincidió explícitamente con este hecho. Por otra parte, el 72.1% estuvo de acuerdo en que los equipos pequeños son mejores para desarrollar software. Esta es una práctica promovida por algunos enfoques, sin embargo, existe evidencia de que los equipos grandes también pueden trabajar ágilmente.
Privilegiar la obtención de un software funcional sobre una documentación exhaustiva fue aceptada por el 66.7 % de los encuestados, mientras que el 51.2% coincidió en que el software debería entregarse al cliente en un corto plazo.
Una de las prácticas promovidas por la Programación Extrema (cliente en el lugar de desarrollo), produjo una división de opiniones en los encuestados. Solamente el 48.8% estuvo de acuerdo con ella. Esto, quizás debido a que conocen que en la práctica resulta complejo tener permanentemente y de manera física al cliente en el lugar de desarrollo. También se observaron opiniones divididas en los planteamientos que valoran a los procesos y las herramientas sobre los equipos, sus integrantes y sus relaciones: solamente el 46.5% estuvo en desacuerdo.
250
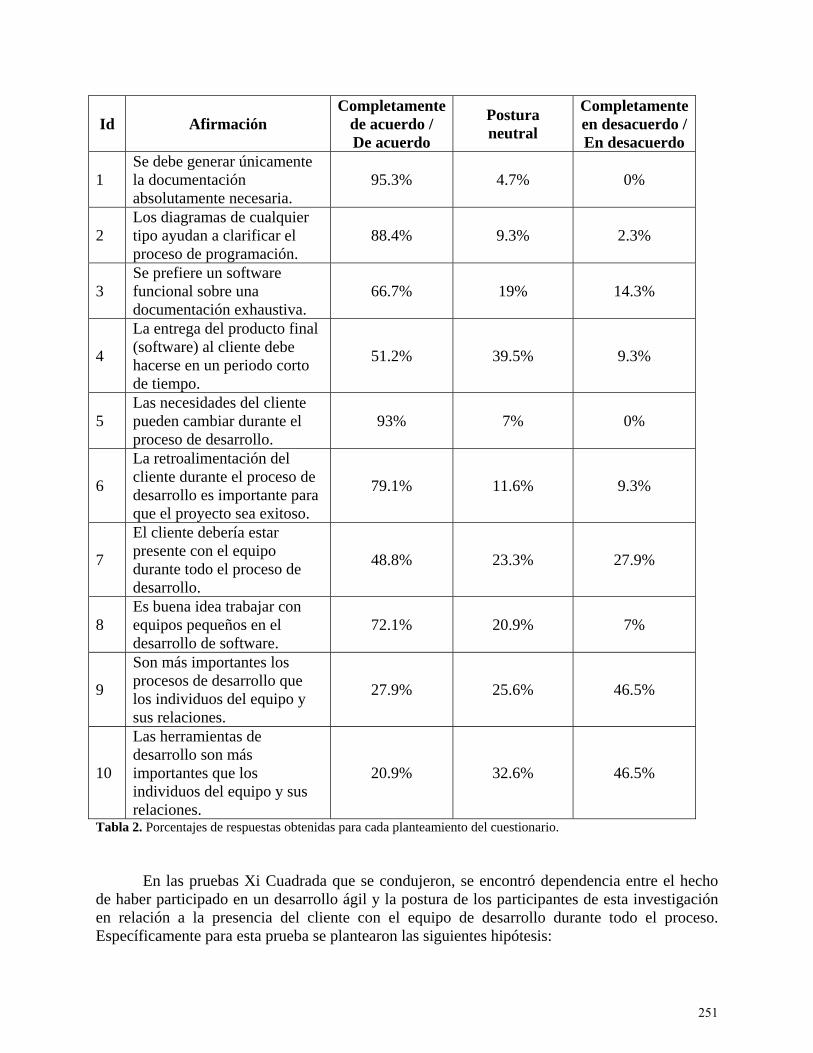
Id Afirmación Completamente
de acuerdo / De acuerdo
Postura neutral
Completamente en desacuerdo / En desacuerdo
1 Se debe generar únicamente la documentación absolutamente necesaria.
95.3% 4.7% 0%
2 Los diagramas de cualquier tipo ayudan a clarificar el proceso de programación.
88.4% 9.3% 2.3%
3 Se prefiere un software funcional sobre una documentación exhaustiva.
66.7% 19% 14.3%
4
La entrega del producto final (software) al cliente debe hacerse en un periodo corto de tiempo.
51.2% 39.5% 9.3%
5 Las necesidades del cliente pueden cambiar durante el proceso de desarrollo.
93% 7% 0%
6
La retroalimentación del cliente durante el proceso de desarrollo es importante para que el proyecto sea exitoso.
79.1% 11.6% 9.3%
7
El cliente debería estar presente con el equipo durante todo el proceso de desarrollo.
48.8% 23.3% 27.9%
8 Es buena idea trabajar con equipos pequeños en el desarrollo de software.
72.1% 20.9% 7%
9
Son más importantes los procesos de desarrollo que los individuos del equipo y sus relaciones.
27.9% 25.6% 46.5%
10
Las herramientas de desarrollo son más importantes que los individuos del equipo y sus relaciones.
20.9% 32.6% 46.5%
Tabla 2. Porcentajes de respuestas obtenidas para cada planteamiento del cuestionario.
En las pruebas Xi Cuadrada que se condujeron, se encontró dependencia entre el hecho de haber participado en un desarrollo ágil y la postura de los participantes de esta investigación en relación a la presencia del cliente con el equipo de desarrollo durante todo el proceso. Específicamente para esta prueba se plantearon las siguientes hipótesis:
251

H0: No existe dependencia entre la experiencia de desarrollar software ágilmente y la postura de los participantes en relación a la presencia del cliente con el equipo de desarrollo durante todo el proyecto.
H1: Existe dependencia entre la experiencia de desarrollar software ágilmente y la postura de los participantes en relación a la presencia del cliente con el equipo de desarrollo durante todo el proyecto.
Se creó la tabla de contingencia mostrada en la Tabla 3 y se obtuvo un valor de X2= 5.495
y un PValor = 0.019 con lo que se rechazó H0 y se concluyó dependencia entre los criterios estudiados.
“El cliente debería estar presente con el equipo durante todo el proceso de desarrollo”
No de acuerdo (Neutral o
desacuerdo)
Explícitamente de acuerdo
Total
No desarrolló software usando enfoque ágil.
13 5 18 (41.9%)
Desarrolló software usando enfoque ágil.
9 16 25 (58.1%)
Total X2= 5.495 PValor = .019
22 (51.2%) 21 (48.8%) 43
Tabla 3 Tabla de contingencia: Experiencia de desarrollo ágil y postura ante la presencia del cliente durante el proceso de desarrollo.
Los resultados permitieron identificar que la participación de un programador en un desarrollo ágil puede modificar su opinión respecto a los principios y filosofías ágiles. Específicamente, se encontró que los programadores encuestados que participaron en desarrollos ágiles, están de acuerdo con que el cliente esté presente con ellos mientras el software es desarrollado, mientras que los programadores que no han llevado la agilidad a la práctica, preferirían que el cliente no estuviera presente.
CONCLUSIONES Y TRABAJO FUTURO En este trabajo se presentaron los resultados de un estudio conducido entre programadores de experiencia principiante e intermedia con el objetivo de caracterizar su postura ante las filosofías y prácticas ágiles más populares. Se encontró que casi la totalidad de los participantes (más del 90%) reconocieron que las necesidades del cliente son cambiantes y que solo la documentación necesaria debería generarse durante el desarrollo de software. Por otra parte, al preguntar si el cliente debería estar presente todo el tiempo en el lugar de desarrollo, se encontró que las opiniones estaban divididas. Solamente el 48.8% estuvo de acuerdo con este planteamiento. Lo mismo ocurrió con los planteamientos que valoran a los procesos y las herramientas sobre los equipos, sus integrantes y sus relaciones, con los que solamente el 46.5% estuvo en desacuerdo.
252

Por otra parte, se encontró dependencia entre el hecho de tener experiencia práctica en el desarrollo ágil y la postura de los participantes en relación a la presencia del cliente con el equipo de desarrollo. Esto prueba que la práctica del desarrollo de software ágil puede influir en la percepción de los programadores sobre algunos principios ágiles.
Se plantea como trabajo futuro profundizar sobre el estudio de la percepción de todos los principios ágiles en programadores que participan en distintos tipos de proyectos, así como determinar los factores que influyen en la aceptación de las prácticas ágiles en los equipos de desarrollo.
253

REFERENCIAS Agile Alliance. (2015, marzo 01). Manifiesto por el Desarrollo Ágil de Software. Retrieved from
http://www.agilemanifesto.org/ Beck, K., & Andres, C. (2004). eXtreme Programming explained. Embrace Change. Estados
Unidos: Addison Wesley. Larman, C. (2004). Agile & Iterative Development - A Manager's Guide. Addison Wesley. Pressman, R. (2014). Software Engineering: A Practitioner's approach (6 ed.). McGrawHill. Sánchez, S., Sicilia, M. A., & Rodríguez, D. (2012). Ingeniería del Software: Un enfoque desde
la guía SWEBOK. Alfaomega. Sims, C., & Johnson, H. (2011). Elements of Scrum. Foster City, California: Dymaxicom. Sommerville, I. (2011). Ingeniería de Software. Pearson. Wagner, W. (2014). Using IBM SPSS Statistics for Research Methods and Social Science
Statistics. SAGE Publications.
254

Comercio Electronico
FRANCISCO JAVIER ESTRADA REYES1
Universidad Autónoma de Tamaulipas
KARLA PAOLA BERMUDEZ Universidad Autónoma de Tamaulipas
DAVID ALEJANDRO CONTRERAS
Universidad Autónoma de Tamaulipas
LUIS DAVID ROMERO MARTINEZ Universidad Autónoma de Tamaulipas
El comercio electrónico es una herramienta que las empresas deben adoptar con facilidad, ya que el cambio en la actualidad es constante, no solo vender de la manera tradicional es lo suficiente para poder satisfacer al cliente. Cuando el consumidor conoce el producto y está familiarizado con él, buscara una manera más cómoda de seguir consumiéndolo, esta forma podría ser vender a través del internet. Que es lo que pasa con los videojuegos que ahora ya no es de ir a comprarlo físicamente si no, más que nada descargarlo desde una base de datos proporcionada por la empresa. PALABRAS CLAVE Comercio, internet, digital.
1 Address correspondence to Francisco Javier Estrada Reyes, Universidad Autónoma de Tamaulipas. E-mail: [email protected]
255

Province-Level Impacts of Canada’s Trade Agreements: Ontario and the Canada-Korea FTA
DAN CIURIAK Ciuriak Consulting Inc.
DMITRY LYSENKO
1 Ciuriak Consulting Inc.
JINGLIANG XIAO
Ciuriak Consulting Inc. Canada has recently concluded free trade agreements (FTAs) with two major economies, one trans-Atlantic (the EU) and one trans-Pacific (Korea); as well, it is negotiating a still larger agreement with Pacific Rim countries in the Trans-Pacific Partnership (TPP) initiative. From an economic geography perspective, Canada’s provinces stand to be affected very differently by these agreements, depending on their geographic location within Canada (proximity to the west coast versus the east coast). As well, given the highly asymmetric degree of liberalization across different sectors that these agreements entail, provinces stand to be affected differentially based on their areas of specialization in trade and, thus, their degree of trade exposure to sectors undergoing relatively deeper liberalization. However, there is no existing multi-country computable general equilibrium (CGE) model that is capable of simulating the impact of such agreements on Canada’s provinces as separate trading entities, including the impact on interprovincial trade flows, which would also be impacted by international trade liberalization. In this study, we introduce a hybrid approach to developing estimates of FTA impacts on Canada’s provinces, using a dynamic version of the Global Trade Analysis Project (GTAP) model to generate Canada-level impacts, which are then decomposed on the basis of computable partial equilibrium (CPE) model simulations of the same agreements. We demonstrate the approach by developing the impacts of the Canada-Korea FTA on Ontario. KEYWORDS Canada, Ontario, provincial trade, trade liberalization, CGE, CPE, GTAP, GSIM JEL CODES F14, F15, F17
1 Dmitry Lysenko is a trade economist with the Government of Nova Scotia. This paper does not express the views of the Government of Nova Scotia and no responsibility for the views should be attributed to the Government of Nova Scotia. Acknowledgements: Thanks to Natassia Ciuriak for editing the manuscript.
256
1 INTRODUCTION On 11 March 2014, agreement was reached on a Canada-Korea Free Trade Agreement (CKFTA). For Canada, it marked a second deal in short order with a major economy, following the initialing of the Comprehensive Economic Partnership Agreement (CETA) with the European Union on 18 October 2013. Canada is also actively engaged in the negotiations towards the Trans-Pacific Partnership (TPP).
In terms of economic geography, Canada’s provinces stand to be affected very differently by the CKFTA versus the CETA, depending on their geographic location within Canada (proximity to the west coast versus the east coast). As well, given the highly asymmetric degree of liberalization across different sectors that these agreements entail, provinces stand to be affected differentially based on their areas of comparative advantage in trade and, thus, their degree of trade exposure to sectors undergoing relatively deeper liberalization.
However, there is no established methodology to evaluate these differential impacts by
province. In particular, there is no multi-country computable general equilibrium (CGE) model – the standard tool for evaluation of major multi-sectoral trade agreements – that is capable of simulating the impact of regional trade agreements on Canada’s provinces as separate trading entities, including the impact on interprovincial trade flows, which would also be impacted by trade diversion when international trade is liberalized.
In this study, we introduce a hybrid approach to developing estimates of FTA impacts on
Canada’s provinces using a dynamic version of the Global Trade Analysis Project (GTAP) CGE model to generate Canada-level impacts, which are then decomposed on the basis of simulations, using a computable partial equilibrium (CPE) model – the Global Simulation Model (GSIM) – of the same agreements.
The trade impacts from the CGE model simulations capture the complex linkages across
sectors at the national level from the various quantifiable elements of the CKFTA including the following:
a) Tariff elimination or reduction on goods; b) The extent of utilization of preferences and the costs of complying with the associated rules
of origin (ROOs); c) Reduction of non-tariff barriers (NTBs) on goods; d) Reduction of NTBs on services; and e) Liberalization of restrictions on foreign direct investment (FDI).
In the GSIM simulations, we represent Ontario as a separate trading entity alongside the
Rest of Canada (ROC), drawing on available data of provinces’ international and interprovincial trade. The GSIM simulations capture only the first-round effect of tariff elimination on goods; however, we demonstrate how this information can be used to decompose the more general GTAP results into first-order approximations of the general equilibrium effects on Ontario of the CKFTA.
257

For the present study, we draw on the results of a parallel study by Ciuriak and Xiao (2014) on the CKFTA as negotiated; we provide a summary of the Canada-level impacts from that study and develop the Ontario-level impacts on that basis.
This paper is organized as follows. The next section provides basic background on the
economies of Ontario, the ROC, and Korea. Section 3 summarizes the Canada-level impacts of the CKFTA. Section 4 develops the Ontario-ROC impacts. Section 5 concludes. Appendix A provides a detailed discussion of the construction of the dataset used for the GSIM simulations.
2 BACKGROUND 2.1 Macroeconomic The CKFTA links Canada to the 11th largest economy globally in terms of gross domestic product (GDP) (2013). On a state-to-state comparison, measured at market prices, Canada is larger than Korea; on a regional basis, the ROC has an economy that is of the same order of magnitude as Korea, with Ontario’s economy being about half the size of Korea’s. Table 1 sets out summary information on the economies of Ontario, ROC, and Korea. Table 1 Ontario, Rest of Canada, and Korea: Summary Statistics, 2013 Korea Rest of Canada Ontario GDP at market prices (USD billions) $1,222 $1,153 $672 GDP at purchasing power parity (USD billions) $1,526 $1,053 $614 Population (millions) 50.22 21.62 13.54 Per-capita GDP at market prices $24,329 $53,330 $49,631 Per-capita GDP at purchasing power parity (PPP) $33,189 $48,705 $45,347 Source: International Monetary Fund (IMF) (April 2014); and Government of Ontario, Ministry of Finance (June 2014).
Korea’s economic outlook from official sources, such as the IMF’s World Economic Outlook, is for steady growth over the medium term at about 3.75%. For Canada, the comparable figure is 2.2%. For its part, Ontario’s official budget forecast (Government of Ontario, Ministry of Finance, May 2014) projects growth of about 2.4% over the medium term. Over the time horizon for the CKFTA impact assessment in Ciuriak and Xiao (2014), 2015-2035, Korea grows more rapidly than Canada by a good margin. Moreover, Korea’s fundamentals, a stable economy with a solid sovereign risk profile, support some degree of real appreciation of its currency over the medium to longer term. Taken together, these considerations suggest that the CKFTA deepens commerce with an economy that, from the perspective of both Ontario and the ROC, is larger and growing more rapidly.
258
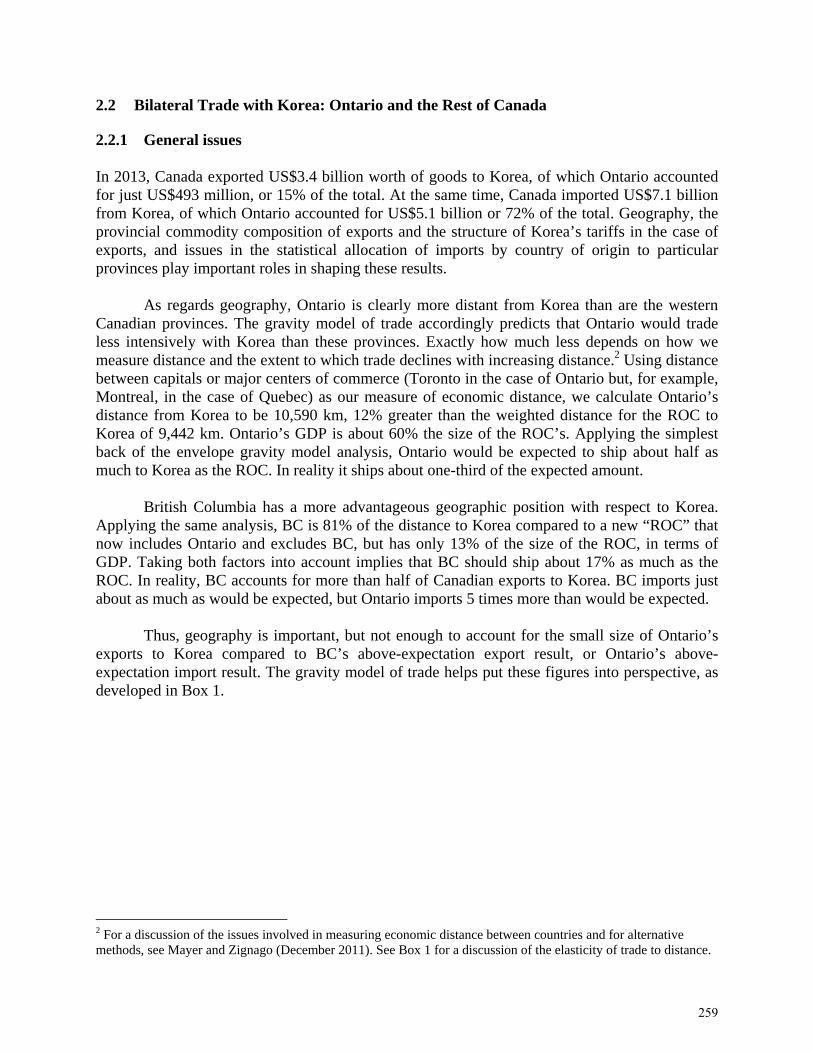
2.2 Bilateral Trade with Korea: Ontario and the Rest of Canada 2.2.1 General issues In 2013, Canada exported US$3.4 billion worth of goods to Korea, of which Ontario accounted for just US$493 million, or 15% of the total. At the same time, Canada imported US$7.1 billion from Korea, of which Ontario accounted for US$5.1 billion or 72% of the total. Geography, the provincial commodity composition of exports and the structure of Korea’s tariffs in the case of exports, and issues in the statistical allocation of imports by country of origin to particular provinces play important roles in shaping these results.
As regards geography, Ontario is clearly more distant from Korea than are the western Canadian provinces. The gravity model of trade accordingly predicts that Ontario would trade less intensively with Korea than these provinces. Exactly how much less depends on how we measure distance and the extent to which trade declines with increasing distance.2 Using distance between capitals or major centers of commerce (Toronto in the case of Ontario but, for example, Montreal, in the case of Quebec) as our measure of economic distance, we calculate Ontario’s distance from Korea to be 10,590 km, 12% greater than the weighted distance for the ROC to Korea of 9,442 km. Ontario’s GDP is about 60% the size of the ROC’s. Applying the simplest back of the envelope gravity model analysis, Ontario would be expected to ship about half as much to Korea as the ROC. In reality it ships about one-third of the expected amount.
British Columbia has a more advantageous geographic position with respect to Korea.
Applying the same analysis, BC is 81% of the distance to Korea compared to a new “ROC” that now includes Ontario and excludes BC, but has only 13% of the size of the ROC, in terms of GDP. Taking both factors into account implies that BC should ship about 17% as much as the ROC. In reality, BC accounts for more than half of Canadian exports to Korea. BC imports just about as much as would be expected, but Ontario imports 5 times more than would be expected.
Thus, geography is important, but not enough to account for the small size of Ontario’s
exports to Korea compared to BC’s above-expectation export result, or Ontario’s above-expectation import result. The gravity model of trade helps put these figures into perspective, as developed in Box 1.
2 For a discussion of the issues involved in measuring economic distance between countries and for alternative methods, see Mayer and Zignago (December 2011). See Box 1 for a discussion of the elasticity of trade to distance.
259
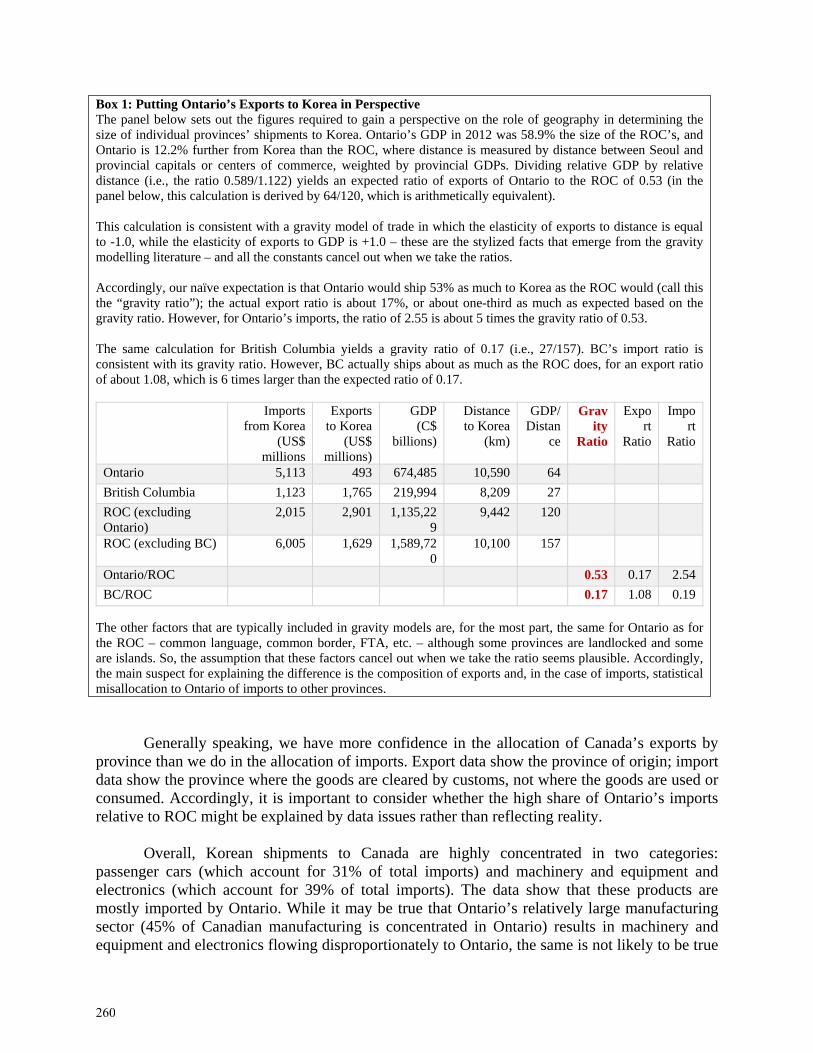
Box 1: Putting Ontario’s Exports to Korea in Perspective The panel below sets out the figures required to gain a perspective on the role of geography in determining the size of individual provinces’ shipments to Korea. Ontario’s GDP in 2012 was 58.9% the size of the ROC’s, and Ontario is 12.2% further from Korea than the ROC, where distance is measured by distance between Seoul and provincial capitals or centers of commerce, weighted by provincial GDPs. Dividing relative GDP by relative distance (i.e., the ratio 0.589/1.122) yields an expected ratio of exports of Ontario to the ROC of 0.53 (in the panel below, this calculation is derived by 64/120, which is arithmetically equivalent). This calculation is consistent with a gravity model of trade in which the elasticity of exports to distance is equal to -1.0, while the elasticity of exports to GDP is +1.0 – these are the stylized facts that emerge from the gravity modelling literature – and all the constants cancel out when we take the ratios. Accordingly, our naïve expectation is that Ontario would ship 53% as much to Korea as the ROC would (call this the “gravity ratio”); the actual export ratio is about 17%, or about one-third as much as expected based on the gravity ratio. However, for Ontario’s imports, the ratio of 2.55 is about 5 times the gravity ratio of 0.53. The same calculation for British Columbia yields a gravity ratio of 0.17 (i.e., 27/157). BC’s import ratio is consistent with its gravity ratio. However, BC actually ships about as much as the ROC does, for an export ratio of about 1.08, which is 6 times larger than the expected ratio of 0.17.
Imports from Korea
(US$ millions
Exports to Korea
(US$ millions)
GDP (C$
billions)
Distance to Korea
(km)
GDP/ Distan
ce
Gravity
Ratio
Export
Ratio
Import
Ratio
Ontario 5,113 493 674,485 10,590 64
British Columbia 1,123 1,765 219,994 8,209 27
ROC (excluding Ontario)
2,015 2,901 1,135,229
9,442 120
ROC (excluding BC) 6,005 1,629 1,589,720
10,100 157
Ontario/ROC 0.53 0.17 2.54
BC/ROC 0.17 1.08 0.19
The other factors that are typically included in gravity models are, for the most part, the same for Ontario as for the ROC – common language, common border, FTA, etc. – although some provinces are landlocked and some are islands. So, the assumption that these factors cancel out when we take the ratio seems plausible. Accordingly, the main suspect for explaining the difference is the composition of exports and, in the case of imports, statistical misallocation to Ontario of imports to other provinces.
Generally speaking, we have more confidence in the allocation of Canada’s exports by province than we do in the allocation of imports. Export data show the province of origin; import data show the province where the goods are cleared by customs, not where the goods are used or consumed. Accordingly, it is important to consider whether the high share of Ontario’s imports relative to ROC might be explained by data issues rather than reflecting reality.
Overall, Korean shipments to Canada are highly concentrated in two categories:
passenger cars (which account for 31% of total imports) and machinery and equipment and electronics (which account for 39% of total imports). The data show that these products are mostly imported by Ontario. While it may be true that Ontario’s relatively large manufacturing sector (45% of Canadian manufacturing is concentrated in Ontario) results in machinery and equipment and electronics flowing disproportionately to Ontario, the same is not likely to be true
260
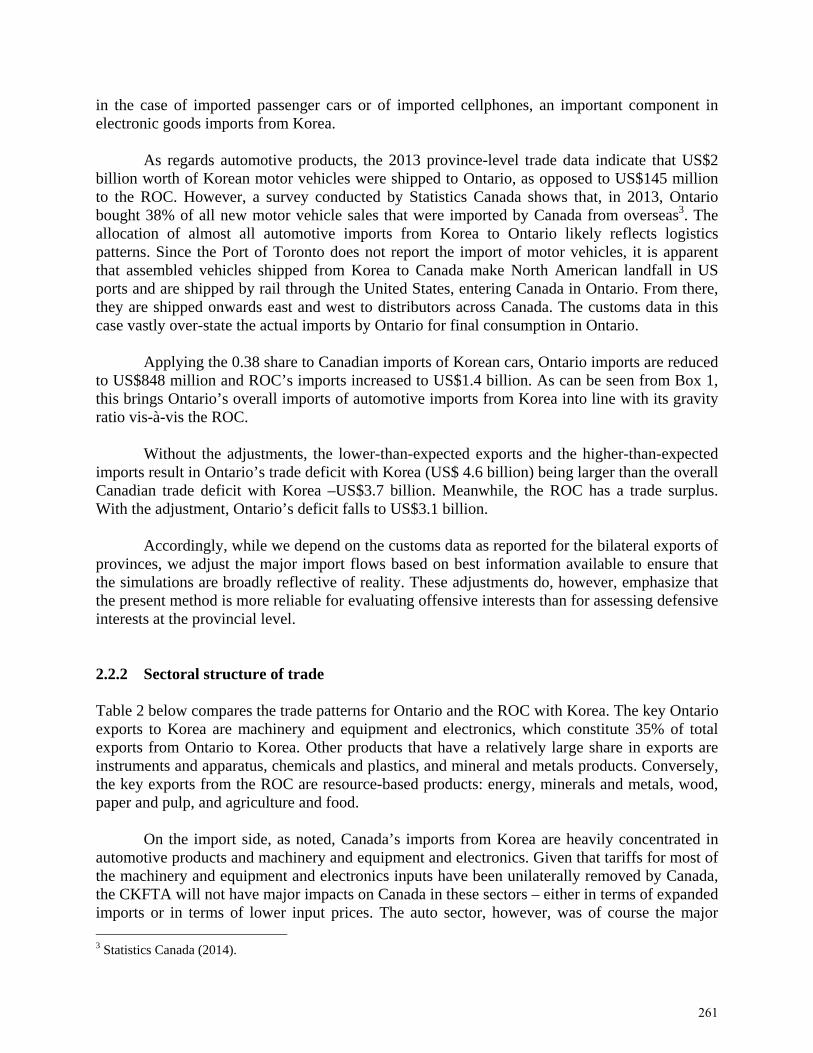
in the case of imported passenger cars or of imported cellphones, an important component in electronic goods imports from Korea.
As regards automotive products, the 2013 province-level trade data indicate that US$2
billion worth of Korean motor vehicles were shipped to Ontario, as opposed to US$145 million to the ROC. However, a survey conducted by Statistics Canada shows that, in 2013, Ontario bought 38% of all new motor vehicle sales that were imported by Canada from overseas3. The allocation of almost all automotive imports from Korea to Ontario likely reflects logistics patterns. Since the Port of Toronto does not report the import of motor vehicles, it is apparent that assembled vehicles shipped from Korea to Canada make North American landfall in US ports and are shipped by rail through the United States, entering Canada in Ontario. From there, they are shipped onwards east and west to distributors across Canada. The customs data in this case vastly over-state the actual imports by Ontario for final consumption in Ontario.
Applying the 0.38 share to Canadian imports of Korean cars, Ontario imports are reduced
to US$848 million and ROC’s imports increased to US$1.4 billion. As can be seen from Box 1, this brings Ontario’s overall imports of automotive imports from Korea into line with its gravity ratio vis-à-vis the ROC.
Without the adjustments, the lower-than-expected exports and the higher-than-expected
imports result in Ontario’s trade deficit with Korea (US$ 4.6 billion) being larger than the overall Canadian trade deficit with Korea –US$3.7 billion. Meanwhile, the ROC has a trade surplus. With the adjustment, Ontario’s deficit falls to US$3.1 billion.
Accordingly, while we depend on the customs data as reported for the bilateral exports of
provinces, we adjust the major import flows based on best information available to ensure that the simulations are broadly reflective of reality. These adjustments do, however, emphasize that the present method is more reliable for evaluating offensive interests than for assessing defensive interests at the provincial level.
2.2.2 Sectoral structure of trade Table 2 below compares the trade patterns for Ontario and the ROC with Korea. The key Ontario exports to Korea are machinery and equipment and electronics, which constitute 35% of total exports from Ontario to Korea. Other products that have a relatively large share in exports are instruments and apparatus, chemicals and plastics, and mineral and metals products. Conversely, the key exports from the ROC are resource-based products: energy, minerals and metals, wood, paper and pulp, and agriculture and food.
On the import side, as noted, Canada’s imports from Korea are heavily concentrated in automotive products and machinery and equipment and electronics. Given that tariffs for most of the machinery and equipment and electronics inputs have been unilaterally removed by Canada, the CKFTA will not have major impacts on Canada in these sectors – either in terms of expanded imports or in terms of lower input prices. The auto sector, however, was of course the major 3 Statistics Canada (2014).
261
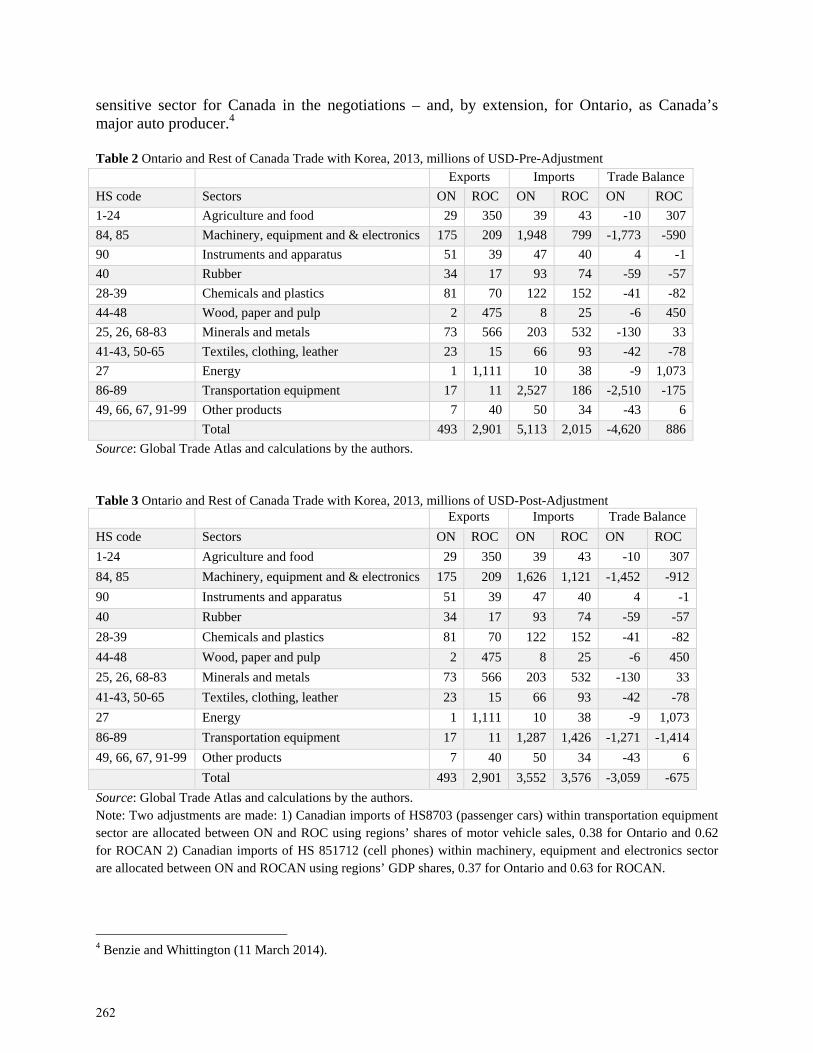
sensitive sector for Canada in the negotiations – and, by extension, for Ontario, as Canada’s major auto producer.4 Table 2 Ontario and Rest of Canada Trade with Korea, 2013, millions of USD-Pre-Adjustment Exports Imports Trade Balance
HS code Sectors ON ROC ON ROC ON ROC
1-24 Agriculture and food 29 350 39 43 -10 307
84, 85 Machinery, equipment and & electronics 175 209 1,948 799 -1,773 -590
90 Instruments and apparatus 51 39 47 40 4 -1
40 Rubber 34 17 93 74 -59 -57
28-39 Chemicals and plastics 81 70 122 152 -41 -82
44-48 Wood, paper and pulp 2 475 8 25 -6 450
25, 26, 68-83 Minerals and metals 73 566 203 532 -130 33
41-43, 50-65 Textiles, clothing, leather 23 15 66 93 -42 -78
27 Energy 1 1,111 10 38 -9 1,073
86-89 Transportation equipment 17 11 2,527 186 -2,510 -175
49, 66, 67, 91-99 Other products 7 40 50 34 -43 6
Total 493 2,901 5,113 2,015 -4,620 886
Source: Global Trade Atlas and calculations by the authors. Table 3 Ontario and Rest of Canada Trade with Korea, 2013, millions of USD-Post-Adjustment Exports Imports Trade Balance
HS code Sectors ON ROC ON ROC ON ROC
1-24 Agriculture and food 29 350 39 43 -10 307
84, 85 Machinery, equipment and & electronics 175 209 1,626 1,121 -1,452 -912
90 Instruments and apparatus 51 39 47 40 4 -1
40 Rubber 34 17 93 74 -59 -57
28-39 Chemicals and plastics 81 70 122 152 -41 -82
44-48 Wood, paper and pulp 2 475 8 25 -6 450
25, 26, 68-83 Minerals and metals 73 566 203 532 -130 33
41-43, 50-65 Textiles, clothing, leather 23 15 66 93 -42 -78
27 Energy 1 1,111 10 38 -9 1,073
86-89 Transportation equipment 17 11 1,287 1,426 -1,271 -1,414
49, 66, 67, 91-99 Other products 7 40 50 34 -43 6
Total 493 2,901 3,552 3,576 -3,059 -675
Source: Global Trade Atlas and calculations by the authors. Note: Two adjustments are made: 1) Canadian imports of HS8703 (passenger cars) within transportation equipment sector are allocated between ON and ROC using regions’ shares of motor vehicle sales, 0.38 for Ontario and 0.62 for ROCAN 2) Canadian imports of HS 851712 (cell phones) within machinery, equipment and electronics sector are allocated between ON and ROCAN using regions’ GDP shares, 0.37 for Ontario and 0.63 for ROCAN.
4 Benzie and Whittington (11 March 2014).
262
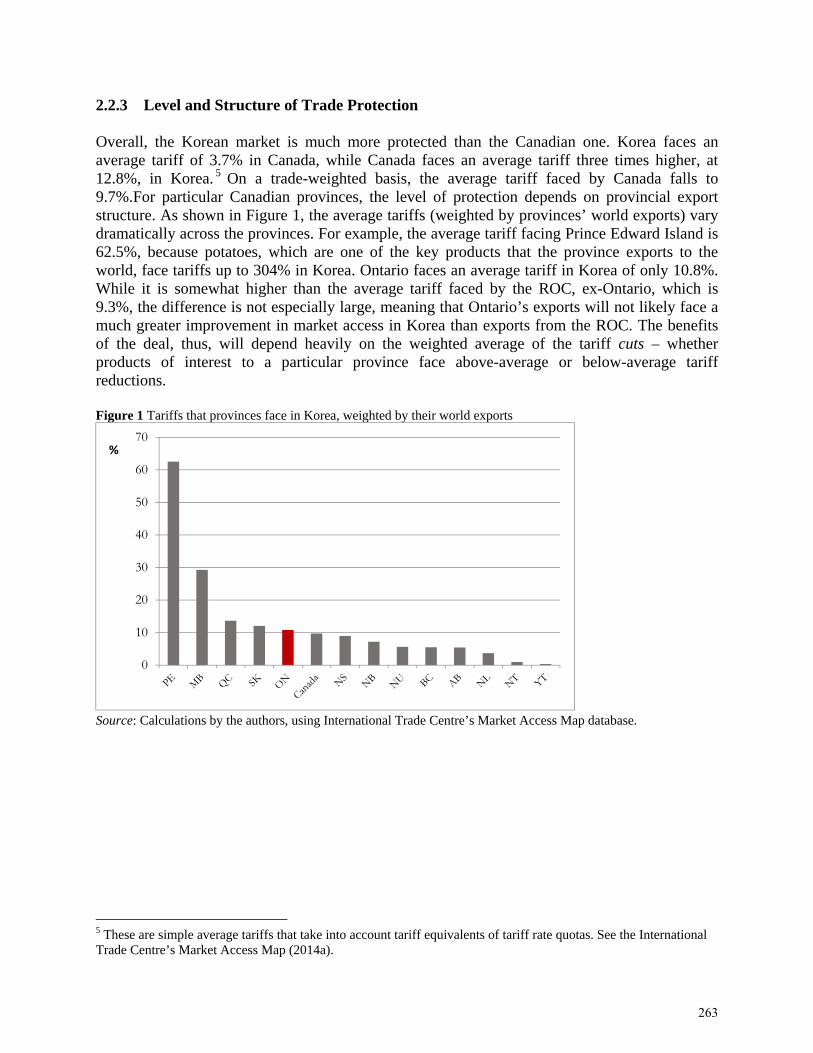
2.2.3 Level and Structure of Trade Protection Overall, the Korean market is much more protected than the Canadian one. Korea faces an average tariff of 3.7% in Canada, while Canada faces an average tariff three times higher, at 12.8%, in Korea. 5 On a trade-weighted basis, the average tariff faced by Canada falls to 9.7%.For particular Canadian provinces, the level of protection depends on provincial export structure. As shown in Figure 1, the average tariffs (weighted by provinces’ world exports) vary dramatically across the provinces. For example, the average tariff facing Prince Edward Island is 62.5%, because potatoes, which are one of the key products that the province exports to the world, face tariffs up to 304% in Korea. Ontario faces an average tariff in Korea of only 10.8%. While it is somewhat higher than the average tariff faced by the ROC, ex-Ontario, which is 9.3%, the difference is not especially large, meaning that Ontario’s exports will not likely face a much greater improvement in market access in Korea than exports from the ROC. The benefits of the deal, thus, will depend heavily on the weighted average of the tariff cuts – whether products of interest to a particular province face above-average or below-average tariff reductions. Figure 1 Tariffs that provinces face in Korea, weighted by their world exports
Source: Calculations by the authors, using International Trade Centre’s Market Access Map database.
5 These are simple average tariffs that take into account tariff equivalents of tariff rate quotas. See the International Trade Centre’s Market Access Map (2014a).
0
10
20
30
40
50
60
70%
263
2.2.4 Sectoral Issues and Sensitivities for Ontario The most sensitive sector for Ontario is auto manufacturing. In this sector, of particular concern is that, although reciprocal liberalization involves similar reductions of tariffs (Korea will eliminate an 8% tariff on vehicle imports, while Canada will phase out its corresponding 6.1% tariff), the base level of Canadian exports to Korea is very low. Auto industry representatives argue that NTBs explain the lack of exports from Canada. In this regard, the CKFTA contains a range of disciplines on NTBs; that being said, some of the techniques that have been alleged (e.g., ordering tax audits for people who bought imported vehicles) would be difficult to control through negotiated treaties.6
However, we doubt that the low level of Canada’s exports of automotive products to Korea can be attributed solely to NTBs. Consider, for example, the massive difference between exports of autos to Korea from the US and Canada. In 2013, this ratio was 336. By comparison, the ratio of US vehicle exports to the world / Canadian vehicle exports to the world was 1.26. Since the same manufacturers are shipping to Korea from the United States and Canada, it follows that the difference is not in Korea, but in North America. The most likely reason lies in export mandates given to Canadian subsidiaries of multinational producers: the Japanese assemblers in Canada will have no export mandate to Korea; the US-based multinationals export to Korea from the United States, but evidently choose not to do so from Canada. Alternatively, it might be geopolitics at play, with Korea succumbing to pressure from the United States that it is quite comfortable rejecting from third parties (e.g., a “snapback” provision on auto sector liberalization was included in the Korea-US FTA, but not in either the Korea-EU FTA or the CKFTA).
2.2.5 Conclusions Overall, the CKFTA appears to pose a greater challenge for Ontario than for the ROC. This reflects a concentration of imports from Korea in Ontario and, particularly, in areas of Ontario’s manufacturing specialization, along with a disadvantageous geographical position for export development.
3 CANADA-LEVEL IMPACTS OF THE CKFTA The CKFTA falls into the class of modern, comprehensive agreements, whose scope extends beyond trade in goods and services to cover investment, government procurement, intellectual property, temporary entry of business persons, e-commerce, competition policy, and environmental and labour issues, along with dispute settlement. The detailed assumptions underlying the policy shocks are set out in Ciuriak and Xiao (2014); the services impacts follow Ciuriak, Dadkhah and Xiao (2014). Table 8 summarizes the model results for Canada and Korea, respectively, of the impacts of the CKFTA over the period 2015, when the Agreement is assumed to come into force, through 2035.
6 Deveau (11 March 2014).
264

The CKFTA has small but positive impacts on both Canada and Korea in terms of economic welfare and GDP. The gains are comparable for both economies in percentage terms, but Canada gains somewhat more in absolute terms due to its higher levels on both indicators. The GDP gain indicated for Canada is somewhat larger than the official figure quoted by the Department of Foreign Affairs, Trade and Development (C$1.7 billion)7; bearing in mind the differences in modelling frameworks, our figures should be considered as broadly corroborative of DFATD’s analysis.
Short-run impacts are small, reflecting not only the phasing-in of tariff cuts, but also the
phased-in response of investment to changed conditions. In terms of GDP, Canada’s gains build over time from a small initial gain to reach 0.05% of GDP, when the full effects of the Agreement have been realized; Korea’s build up to 0.06%.
For both economies, the economic welfare gains are commensurate with the GDP gains,
rising by 0.066% for Canada and by 0.065% for Korea. In level terms, the welfare gains are very similar, with Canadian household income in aggregate being boosted by US$1.69 billion and Korea’s by US$1.64 billion.
Based on projections calibrated to Canada’s 13,320,610 households in the 2011 Census,8
income rises from about $13 per household immediately (based on projected 2015 number of households) to about $107 per household when the full effects of the Agreement are in place in 2035 (based on the projected number of households in Canada in 2035).
In terms of job impacts, the Agreement expands labour input in the economy by the
equivalent of 1,531 jobs immediately (360 skilled and 1,171 unskilled, based on GTAP definitions of skilled and unskilled), rising to 8,468 jobs (2,165 skilled and 6,303 unskilled) in 2035.
7 See Government of Canada, Department of Foreign Affairs, Trade and Development (2014). 8 See Statistics Canada (2013). Projections reported here are based on the medium-growth scenario in Statistics Canada (June 2010) applied to the 2011 census benchmarks.
265
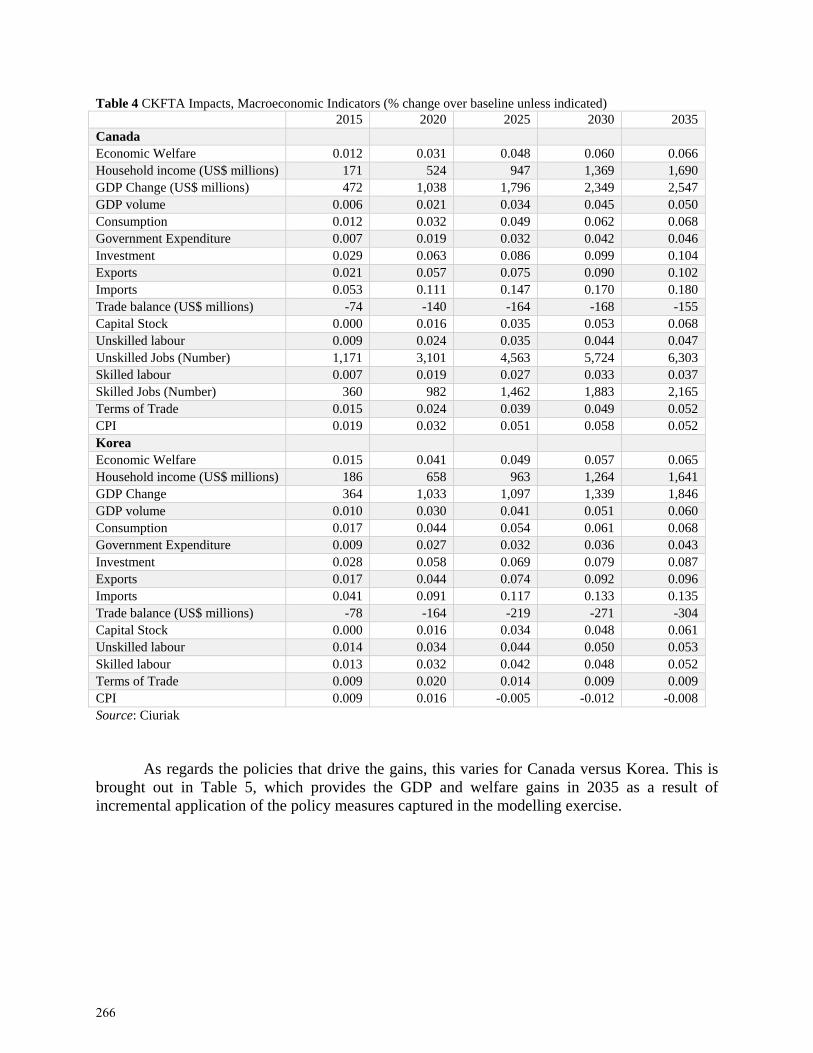
Table 4 CKFTA Impacts, Macroeconomic Indicators (% change over baseline unless indicated) 2015 2020 2025 2030 2035 Canada Economic Welfare 0.012 0.031 0.048 0.060 0.066 Household income (US$ millions) 171 524 947 1,369 1,690 GDP Change (US$ millions) 472 1,038 1,796 2,349 2,547 GDP volume 0.006 0.021 0.034 0.045 0.050 Consumption 0.012 0.032 0.049 0.062 0.068 Government Expenditure 0.007 0.019 0.032 0.042 0.046 Investment 0.029 0.063 0.086 0.099 0.104 Exports 0.021 0.057 0.075 0.090 0.102 Imports 0.053 0.111 0.147 0.170 0.180 Trade balance (US$ millions) -74 -140 -164 -168 -155 Capital Stock 0.000 0.016 0.035 0.053 0.068 Unskilled labour 0.009 0.024 0.035 0.044 0.047 Unskilled Jobs (Number) 1,171 3,101 4,563 5,724 6,303 Skilled labour 0.007 0.019 0.027 0.033 0.037 Skilled Jobs (Number) 360 982 1,462 1,883 2,165 Terms of Trade 0.015 0.024 0.039 0.049 0.052 CPI 0.019 0.032 0.051 0.058 0.052 Korea Economic Welfare 0.015 0.041 0.049 0.057 0.065 Household income (US$ millions) 186 658 963 1,264 1,641 GDP Change 364 1,033 1,097 1,339 1,846 GDP volume 0.010 0.030 0.041 0.051 0.060 Consumption 0.017 0.044 0.054 0.061 0.068 Government Expenditure 0.009 0.027 0.032 0.036 0.043 Investment 0.028 0.058 0.069 0.079 0.087 Exports 0.017 0.044 0.074 0.092 0.096 Imports 0.041 0.091 0.117 0.133 0.135 Trade balance (US$ millions) -78 -164 -219 -271 -304 Capital Stock 0.000 0.016 0.034 0.048 0.061 Unskilled labour 0.014 0.034 0.044 0.050 0.053 Skilled labour 0.013 0.032 0.042 0.048 0.052 Terms of Trade 0.009 0.020 0.014 0.009 0.009 CPI 0.009 0.016 -0.005 -0.012 -0.008 Source: Ciuriak
As regards the policies that drive the gains, this varies for Canada versus Korea. This is
brought out in Table 5, which provides the GDP and welfare gains in 2035 as a result of incremental application of the policy measures captured in the modelling exercise.
266
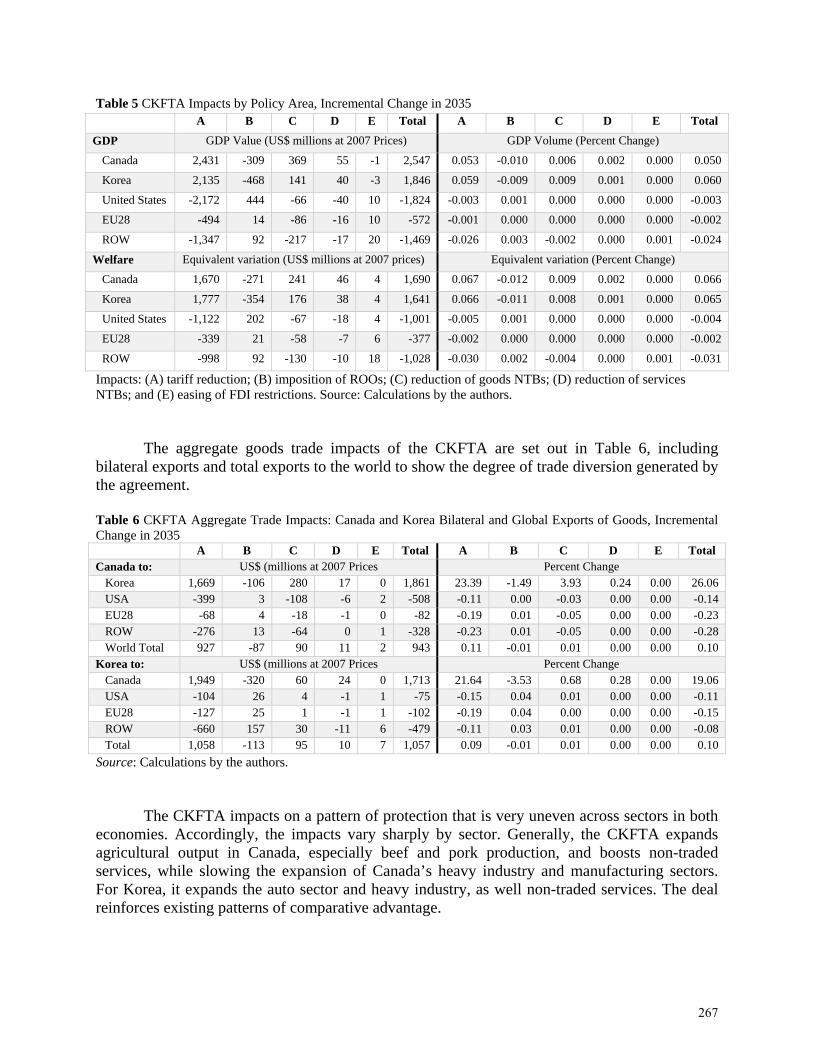
Table 5 CKFTA Impacts by Policy Area, Incremental Change in 2035 A B C D E Total A B C D E Total
GDP GDP Value (US$ millions at 2007 Prices) GDP Volume (Percent Change)
Canada 2,431 -309 369 55 -1 2,547 0.053 -0.010 0.006 0.002 0.000 0.050
Korea 2,135 -468 141 40 -3 1,846 0.059 -0.009 0.009 0.001 0.000 0.060
United States -2,172 444 -66 -40 10 -1,824 -0.003 0.001 0.000 0.000 0.000 -0.003
EU28 -494 14 -86 -16 10 -572 -0.001 0.000 0.000 0.000 0.000 -0.002
ROW -1,347 92 -217 -17 20 -1,469 -0.026 0.003 -0.002 0.000 0.001 -0.024
Welfare Equivalent variation (US$ millions at 2007 prices) Equivalent variation (Percent Change)
Canada 1,670 -271 241 46 4 1,690 0.067 -0.012 0.009 0.002 0.000 0.066
Korea 1,777 -354 176 38 4 1,641 0.066 -0.011 0.008 0.001 0.000 0.065
United States -1,122 202 -67 -18 4 -1,001 -0.005 0.001 0.000 0.000 0.000 -0.004
EU28 -339 21 -58 -7 6 -377 -0.002 0.000 0.000 0.000 0.000 -0.002
ROW -998 92 -130 -10 18 -1,028 -0.030 0.002 -0.004 0.000 0.001 -0.031
Impacts: (A) tariff reduction; (B) imposition of ROOs; (C) reduction of goods NTBs; (D) reduction of services NTBs; and (E) easing of FDI restrictions. Source: Calculations by the authors.
The aggregate goods trade impacts of the CKFTA are set out in Table 6, including bilateral exports and total exports to the world to show the degree of trade diversion generated by the agreement. Table 6 CKFTA Aggregate Trade Impacts: Canada and Korea Bilateral and Global Exports of Goods, Incremental Change in 2035 A B C D E Total A B C D E Total Canada to: US$ (millions at 2007 Prices Percent Change
Korea 1,669 -106 280 17 0 1,861 23.39 -1.49 3.93 0.24 0.00 26.06 USA -399 3 -108 -6 2 -508 -0.11 0.00 -0.03 0.00 0.00 -0.14 EU28 -68 4 -18 -1 0 -82 -0.19 0.01 -0.05 0.00 0.00 -0.23 ROW -276 13 -64 0 1 -328 -0.23 0.01 -0.05 0.00 0.00 -0.28 World Total 927 -87 90 11 2 943 0.11 -0.01 0.01 0.00 0.00 0.10
Korea to: US$ (millions at 2007 Prices Percent Change Canada 1,949 -320 60 24 0 1,713 21.64 -3.53 0.68 0.28 0.00 19.06 USA -104 26 4 -1 1 -75 -0.15 0.04 0.01 0.00 0.00 -0.11 EU28 -127 25 1 -1 1 -102 -0.19 0.04 0.00 0.00 0.00 -0.15 ROW -660 157 30 -11 6 -479 -0.11 0.03 0.01 0.00 0.00 -0.08 Total 1,058 -113 95 10 7 1,057 0.09 -0.01 0.01 0.00 0.00 0.10
Source: Calculations by the authors.
The CKFTA impacts on a pattern of protection that is very uneven across sectors in both economies. Accordingly, the impacts vary sharply by sector. Generally, the CKFTA expands agricultural output in Canada, especially beef and pork production, and boosts non-traded services, while slowing the expansion of Canada’s heavy industry and manufacturing sectors. For Korea, it expands the auto sector and heavy industry, as well non-traded services. The deal reinforces existing patterns of comparative advantage.
267
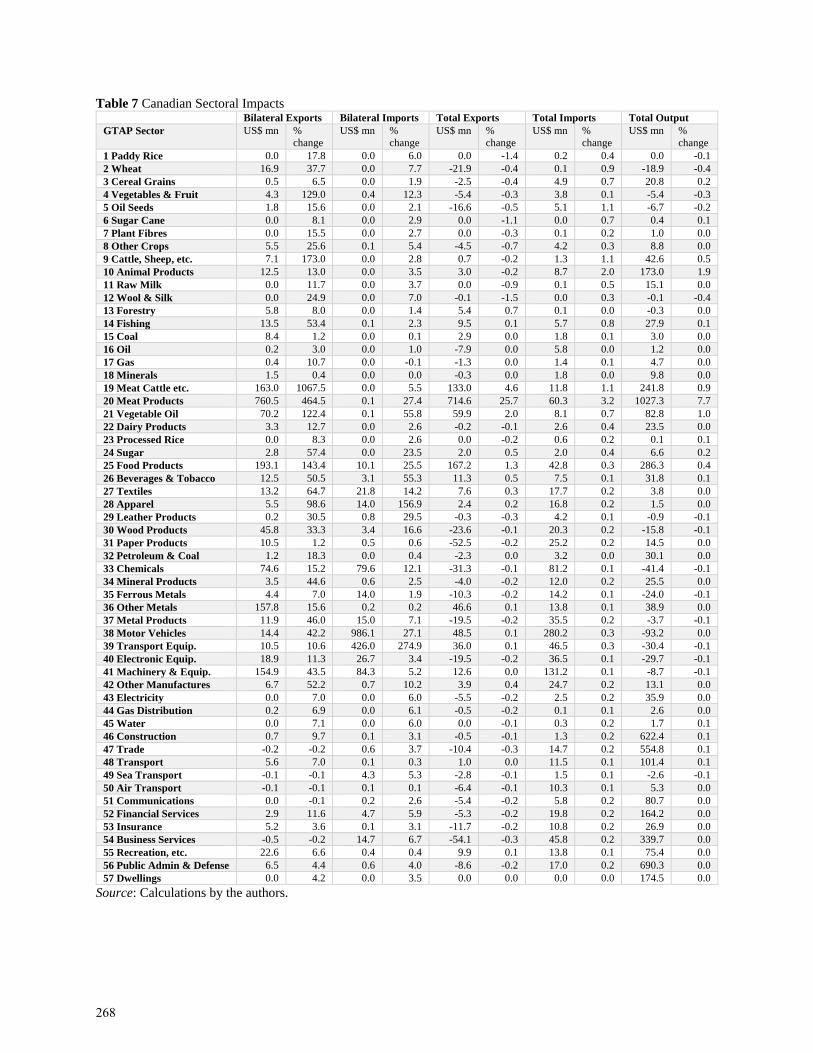
Table 7 Canadian Sectoral Impacts Bilateral Exports Bilateral Imports Total Exports Total Imports Total Output GTAP Sector US$ mn %
change US$ mn %
change US$ mn %
change US$ mn %
change US$ mn %
change 1 Paddy Rice 0.0 17.8 0.0 6.0 0.0 -1.4 0.2 0.4 0.0 -0.1 2 Wheat 16.9 37.7 0.0 7.7 -21.9 -0.4 0.1 0.9 -18.9 -0.4 3 Cereal Grains 0.5 6.5 0.0 1.9 -2.5 -0.4 4.9 0.7 20.8 0.2 4 Vegetables & Fruit 4.3 129.0 0.4 12.3 -5.4 -0.3 3.8 0.1 -5.4 -0.3 5 Oil Seeds 1.8 15.6 0.0 2.1 -16.6 -0.5 5.1 1.1 -6.7 -0.2 6 Sugar Cane 0.0 8.1 0.0 2.9 0.0 -1.1 0.0 0.7 0.4 0.1 7 Plant Fibres 0.0 15.5 0.0 2.7 0.0 -0.3 0.1 0.2 1.0 0.0 8 Other Crops 5.5 25.6 0.1 5.4 -4.5 -0.7 4.2 0.3 8.8 0.0 9 Cattle, Sheep, etc. 7.1 173.0 0.0 2.8 0.7 -0.2 1.3 1.1 42.6 0.5 10 Animal Products 12.5 13.0 0.0 3.5 3.0 -0.2 8.7 2.0 173.0 1.9 11 Raw Milk 0.0 11.7 0.0 3.7 0.0 -0.9 0.1 0.5 15.1 0.0 12 Wool & Silk 0.0 24.9 0.0 7.0 -0.1 -1.5 0.0 0.3 -0.1 -0.4 13 Forestry 5.8 8.0 0.0 1.4 5.4 0.7 0.1 0.0 -0.3 0.0 14 Fishing 13.5 53.4 0.1 2.3 9.5 0.1 5.7 0.8 27.9 0.1 15 Coal 8.4 1.2 0.0 0.1 2.9 0.0 1.8 0.1 3.0 0.0 16 Oil 0.2 3.0 0.0 1.0 -7.9 0.0 5.8 0.0 1.2 0.0 17 Gas 0.4 10.7 0.0 -0.1 -1.3 0.0 1.4 0.1 4.7 0.0 18 Minerals 1.5 0.4 0.0 0.0 -0.3 0.0 1.8 0.0 9.8 0.0 19 Meat Cattle etc. 163.0 1067.5 0.0 5.5 133.0 4.6 11.8 1.1 241.8 0.9 20 Meat Products 760.5 464.5 0.1 27.4 714.6 25.7 60.3 3.2 1027.3 7.7 21 Vegetable Oil 70.2 122.4 0.1 55.8 59.9 2.0 8.1 0.7 82.8 1.0 22 Dairy Products 3.3 12.7 0.0 2.6 -0.2 -0.1 2.6 0.4 23.5 0.0 23 Processed Rice 0.0 8.3 0.0 2.6 0.0 -0.2 0.6 0.2 0.1 0.1 24 Sugar 2.8 57.4 0.0 23.5 2.0 0.5 2.0 0.4 6.6 0.2 25 Food Products 193.1 143.4 10.1 25.5 167.2 1.3 42.8 0.3 286.3 0.4 26 Beverages & Tobacco 12.5 50.5 3.1 55.3 11.3 0.5 7.5 0.1 31.8 0.1 27 Textiles 13.2 64.7 21.8 14.2 7.6 0.3 17.7 0.2 3.8 0.0 28 Apparel 5.5 98.6 14.0 156.9 2.4 0.2 16.8 0.2 1.5 0.0 29 Leather Products 0.2 30.5 0.8 29.5 -0.3 -0.3 4.2 0.1 -0.9 -0.1 30 Wood Products 45.8 33.3 3.4 16.6 -23.6 -0.1 20.3 0.2 -15.8 -0.1 31 Paper Products 10.5 1.2 0.5 0.6 -52.5 -0.2 25.2 0.2 14.5 0.0 32 Petroleum & Coal 1.2 18.3 0.0 0.4 -2.3 0.0 3.2 0.0 30.1 0.0 33 Chemicals 74.6 15.2 79.6 12.1 -31.3 -0.1 81.2 0.1 -41.4 -0.1 34 Mineral Products 3.5 44.6 0.6 2.5 -4.0 -0.2 12.0 0.2 25.5 0.0 35 Ferrous Metals 4.4 7.0 14.0 1.9 -10.3 -0.2 14.2 0.1 -24.0 -0.1 36 Other Metals 157.8 15.6 0.2 0.2 46.6 0.1 13.8 0.1 38.9 0.0 37 Metal Products 11.9 46.0 15.0 7.1 -19.5 -0.2 35.5 0.2 -3.7 -0.1 38 Motor Vehicles 14.4 42.2 986.1 27.1 48.5 0.1 280.2 0.3 -93.2 0.0 39 Transport Equip. 10.5 10.6 426.0 274.9 36.0 0.1 46.5 0.3 -30.4 -0.1 40 Electronic Equip. 18.9 11.3 26.7 3.4 -19.5 -0.2 36.5 0.1 -29.7 -0.1 41 Machinery & Equip. 154.9 43.5 84.3 5.2 12.6 0.0 131.2 0.1 -8.7 -0.1 42 Other Manufactures 6.7 52.2 0.7 10.2 3.9 0.4 24.7 0.2 13.1 0.0 43 Electricity 0.0 7.0 0.0 6.0 -5.5 -0.2 2.5 0.2 35.9 0.0 44 Gas Distribution 0.2 6.9 0.0 6.1 -0.5 -0.2 0.1 0.1 2.6 0.0 45 Water 0.0 7.1 0.0 6.0 0.0 -0.1 0.3 0.2 1.7 0.1 46 Construction 0.7 9.7 0.1 3.1 -0.5 -0.1 1.3 0.2 622.4 0.1 47 Trade -0.2 -0.2 0.6 3.7 -10.4 -0.3 14.7 0.2 554.8 0.1 48 Transport 5.6 7.0 0.1 0.3 1.0 0.0 11.5 0.1 101.4 0.1 49 Sea Transport -0.1 -0.1 4.3 5.3 -2.8 -0.1 1.5 0.1 -2.6 -0.1 50 Air Transport -0.1 -0.1 0.1 0.1 -6.4 -0.1 10.3 0.1 5.3 0.0 51 Communications 0.0 -0.1 0.2 2.6 -5.4 -0.2 5.8 0.2 80.7 0.0 52 Financial Services 2.9 11.6 4.7 5.9 -5.3 -0.2 19.8 0.2 164.2 0.0 53 Insurance 5.2 3.6 0.1 3.1 -11.7 -0.2 10.8 0.2 26.9 0.0 54 Business Services -0.5 -0.2 14.7 6.7 -54.1 -0.3 45.8 0.2 339.7 0.0 55 Recreation, etc. 22.6 6.6 0.4 0.4 9.9 0.1 13.8 0.1 75.4 0.0 56 Public Admin & Defense 6.5 4.4 0.6 4.0 -8.6 -0.2 17.0 0.2 690.3 0.0 57 Dwellings 0.0 4.2 0.0 3.5 0.0 0.0 0.0 0.0 174.5 0.0
Source: Calculations by the authors.
268

Table 8 Korean Sectoral Impacts Bilateral Exports Bilateral Imports Total Exports Total Imports Total Output GTAP Sector US$ mn %
change US$ mn %
change US$ mn %
change US$ mn %
change US$ mn %
change 1 Paddy Rice 0.0 6.0 0.0 17.8 0.0 2.8 -1.3 -0.8 -28.3 0.0 2 Wheat 0.0 7.7 16.9 37.7 0.0 2.1 -3.9 -0.3 -0.3 0.0 3 Cereal Grains 0.0 1.9 0.5 6.5 0.0 0.8 -6.8 -0.2 -0.7 0.0 4 Vegetables & Fruit 0.4 12.3 4.3 129.0 1.6 0.9 -1.8 -0.2 -31.8 0.0 5 Oil Seeds 0.0 2.1 1.8 15.6 0.0 1.2 -1.3 -0.2 -0.1 0.2 6 Sugar Cane 0.0 2.9 0.0 8.1 0.0 0.8 0.0 0.0 0.0 0.0 7 Plant fibers 0.0 2.7 0.0 15.5 0.1 1.1 0.1 0.0 0.3 0.4 8 Other Crops 0.1 5.4 5.5 25.6 2.7 1.7 -6.5 -0.4 -3.7 0.2 9 Cattle, Sheep, etc. 0.0 2.8 7.1 173.0 0.0 1.6 1.1 2.5 -105.9 -1.5 10 Animal Products 0.0 3.5 12.5 13.0 0.5 0.8 1.0 0.1 -142.6 -1.3 11 Raw Milk 0.0 3.7 0.0 11.7 0.0 1.3 -0.1 -0.5 -4.8 0.0 12 Wool & Silk 0.0 7.0 0.0 24.9 0.0 2.7 -0.1 -0.5 0.1 0.4 13 Forestry 0.0 1.4 5.8 8.0 0.0 0.2 -1.0 0.0 -1.7 0.0 14 Fishing 0.1 2.3 13.5 53.4 0.6 0.3 3.9 0.2 -16.0 0.0 15 Coal 0.0 0.1 8.4 1.2 0.0 0.0 4.3 0.0 0.0 0.0 16 Oil 0.0 1.0 0.2 3.0 0.0 -0.1 45.2 0.0 0.1 0.0 17 Gas 0.0 -0.1 0.4 10.7 0.0 -0.1 14.0 0.1 0.0 0.0 18 Minerals 0.0 0.0 1.5 0.4 -0.3 -0.1 15.6 0.1 13.1 0.0 19 Meat Cattle etc. 0.0 5.5 163.0 1067.5 0.2 2.1 67.8 3.2 -74.4 -0.7 20 Meat Products 0.1 27.4 760.5 464.5 0.8 2.3 365.4 14.2 -366.7 -2.4 21 Vegetable Oil 0.1 55.8 70.2 122.4 0.2 1.0 3.6 0.1 -15.5 -0.4 22 Dairy Products 0.0 2.6 3.3 12.7 0.1 0.3 0.5 0.1 2.6 0.1 23 Processed Rice 0.0 2.6 0.0 8.3 0.2 1.1 -0.3 -0.5 -24.3 0.0 24 Sugar 0.0 23.5 2.8 57.4 0.2 0.1 -0.3 0.0 -0.9 0.0 25 Food Products 10.1 25.5 193.1 143.4 14.4 0.6 93.8 0.8 -164.9 -0.2 26 Beverages & Tobacco 3.1 55.3 12.5 50.5 3.4 0.4 1.0 0.1 0.6 0.0 27 Textiles 21.8 14.2 13.2 64.7 15.1 0.1 19.4 0.1 33.8 0.1 28 Apparel 14.0 156.9 5.5 98.6 13.4 1.6 11.3 0.1 25.7 0.1 29 Leather Products 0.8 29.5 0.2 30.5 15.3 1.7 -10.6 -0.2 34.2 0.7 30 Wood Products 3.4 16.6 45.8 33.3 4.3 0.5 19.0 0.3 -0.9 0.0 31 Paper Products 0.5 0.6 10.5 1.2 -2.8 -0.1 10.9 0.1 27.3 0.0 32 Petroleum & Coal 0.0 0.4 1.2 18.3 -1.2 0.0 11.6 0.0 105.4 0.0 33 Chemicals 79.6 12.1 74.6 15.2 36.7 0.0 89.8 0.1 184.7 0.1 34 Mineral Products 0.6 2.5 3.5 44.6 -4.1 -0.1 19.4 0.1 64.1 0.1 35 Ferrous Metals 14.0 1.9 4.4 7.0 -6.6 0.0 65.7 0.1 143.3 0.1 36 Other Metals 0.2 0.2 157.8 15.6 20.4 0.1 41.1 0.1 10.2 0.0 37 Metal Products 15.0 7.1 11.9 46.0 0.8 0.0 28.5 0.2 70.9 0.1 38 Motor Vehicles 986.1 27.1 14.4 42.2 882.0 0.9 79.5 0.4 1371.1 0.5 39 Transport Equip. 426.0 274.9 10.5 10.6 274.8 0.5 28.9 0.2 295.7 0.4 40 Electronic Equip. 26.7 3.4 18.9 11.3 -98.6 -0.1 57.4 0.1 -47.5 0.0 41 Machinery & Equip. 84.3 5.2 154.9 43.5 -103.9 -0.1 162.5 0.1 34.6 0.0 42 Other Manufactures 0.7 10.2 6.7 52.2 0.1 0.0 14.0 0.1 35.8 0.1 43 Electricity 0.0 6.0 0.0 7.0 0.0 0.0 0.0 0.2 59.9 0.1 44 Gas Distribution 0.0 6.1 0.2 6.9 0.0 -0.1 0.4 0.1 0.3 0.0 45 Water 0.0 6.0 0.0 7.1 0.0 -0.1 0.3 0.1 10.0 0.0 46 Construction 0.1 3.1 0.7 9.7 -9.1 -0.1 9.5 0.1 672.4 0.1 47 Trade 0.6 3.7 -0.2 -0.2 2.0 0.1 16.2 0.0 210.3 0.1 48 Transport 0.1 0.3 5.6 7.0 -2.5 0.0 8.8 0.0 74.2 0.0 49 Sea Transport 4.3 5.3 -0.1 -0.1 4.0 0.0 2.4 0.0 7.9 0.0 50 Air Transport 0.1 0.1 -0.1 -0.1 -1.0 0.0 9.1 0.1 4.3 0.0 51 Communications 0.2 2.6 0.0 -0.1 -0.8 -0.1 3.3 0.1 87.1 0.1 52 Financial Services 4.7 5.9 2.9 11.6 -0.5 0.0 6.3 0.1 125.0 0.0 53 Insurance 0.1 3.1 5.2 3.6 -0.8 -0.1 2.6 0.1 50.9 0.0 54 Business Services 14.7 6.7 -0.5 -0.2 -1.0 0.0 32.2 0.1 321.0 0.1 55 Recreation, etc. 0.4 0.4 22.6 6.6 -0.1 0.0 14.3 0.1 127.6 0.1 56 Public Admin & Defense 0.6 4.0 6.5 4.4 -3.4 -0.1 17.5 0.1 495.1 0.0 57 Dwellings 0.0 3.5 0.0 4.2 0.0 0.0 0.0 0.0 123.3 0.0
Source: Calculations by the authors.
269

4 THE IMPACTS OF THE CKFTA ON ONTARIO’S ECONOMY 4.1 Outline of Methodology To obtain Ontario-level impacts consistent with the GTAP model results reported above, we construct a GTAP-consistent set of provincial international and interprovincial trade flows. For convenience, we group all other provinces and territories into a ROC aggregate and focus on Ontario’s trade with Korea and other international partners and with the ROC so defined. Statistics Canada has developed estimates of provinces’ interprovincial and international trade flows that are consistent with the Canadian System of National Accounts (CSNA), drawing on a range of sources and applying a range of statistical techniques. 9 However, these CSNA-consistent provincial trade data are based on different aggregation concepts than international merchandise trade data and GTAP data; accordingly, constructing trade flow matrices for the GSIM database requires the resolution of a number of issues. These issues and how they were handled are discussed in the appendix to this paper.
We first simulate the GSIM model on each of the GTAP sectors separately to identify separately the trade impacts on Ontario and the ROC. We use these results to break down the Canada-level impacts obtained by GTAP model simulation into Ontario-specific and ROC-specific impacts. For this purpose, shipments by Ontario producers to the domestic Ontario market and to the ROC, together with ROC shipments to Ontario and ROC domestic shipments, comprise total Canadian domestic shipments.
To illustrate the method of integrating the GSIM results with the GTAP results, it is
useful to walk through a specific example. This is shown in Table 9 below. In this table, black-lined data are original GSIM data, red-lined data are from GTAP, the green-line dated are sums, and the blue-lined data are the inferred data from our method. Table 9 Derivation of GTAP-FDI Model-based impacts on Ontario: Illustrative Calculation
Base Change Total Change
% Total Change
Ontario ROC International
Exports Ontario ROC International
Exports
GSIM “Grains” Destination Destination
Ontario (source) 629,000 84,310 254,241 0 0 0 0 0.00%
ROC (source) 264,968 1,750,000 1,083,611 -6 -32 73 35 0.00%
Canada (source) 2,728,277 1,337,851 -38 73 35 0.00%
GTAP “Grains” Destination Destination
Ontario (source) 670,035 89,810 192,847 4,582 614 -4 5,192 0.55%
ROC (source) 282,254 1,864,168 1,046,295 1,924 12,713 -2,130 12,506 0.39%
Canada (source 2,906,267 1,239,143 19,833 -2,134 17,699 0.43%
Source: Calculations by the authors.
9 A detailed description of the sources of information and methods applied by Statistics Canada to develop the provincial trade data is provided by Généreux and Langen (2002).
270
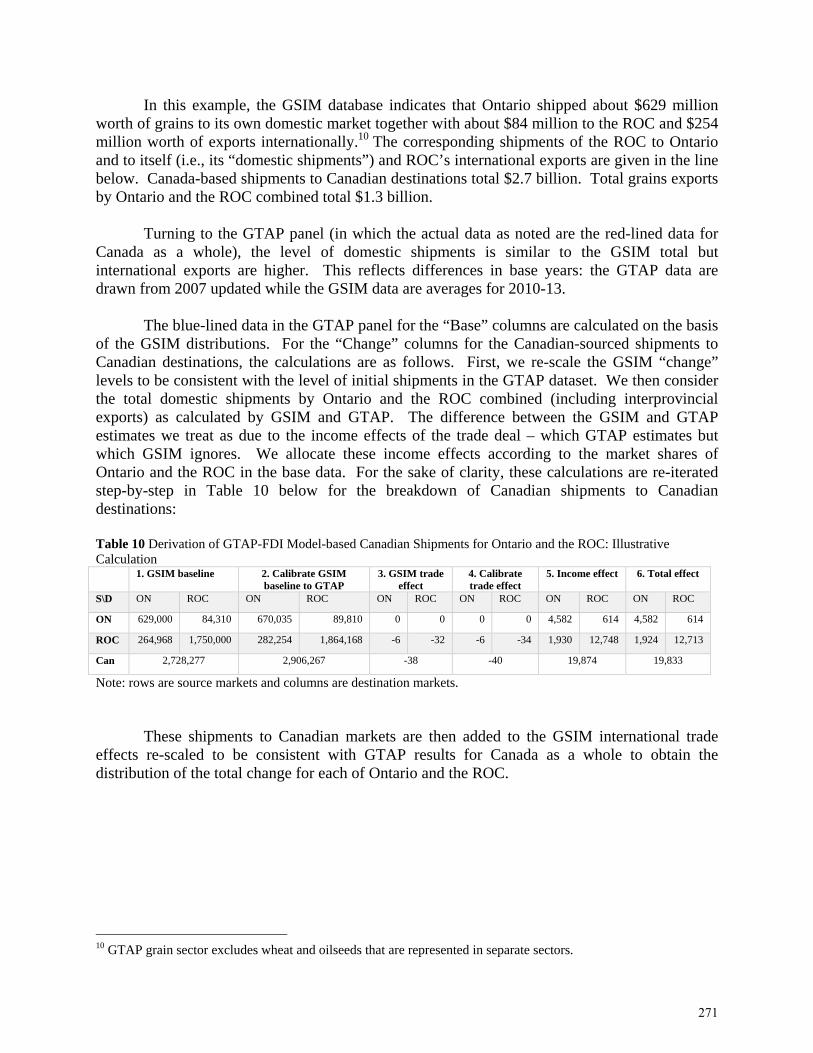
In this example, the GSIM database indicates that Ontario shipped about $629 million worth of grains to its own domestic market together with about $84 million to the ROC and $254 million worth of exports internationally.10 The corresponding shipments of the ROC to Ontario and to itself (i.e., its “domestic shipments”) and ROC’s international exports are given in the line below. Canada-based shipments to Canadian destinations total $2.7 billion. Total grains exports by Ontario and the ROC combined total $1.3 billion.
Turning to the GTAP panel (in which the actual data as noted are the red-lined data for
Canada as a whole), the level of domestic shipments is similar to the GSIM total but international exports are higher. This reflects differences in base years: the GTAP data are drawn from 2007 updated while the GSIM data are averages for 2010-13.
The blue-lined data in the GTAP panel for the “Base” columns are calculated on the basis
of the GSIM distributions. For the “Change” columns for the Canadian-sourced shipments to Canadian destinations, the calculations are as follows. First, we re-scale the GSIM “change” levels to be consistent with the level of initial shipments in the GTAP dataset. We then consider the total domestic shipments by Ontario and the ROC combined (including interprovincial exports) as calculated by GSIM and GTAP. The difference between the GSIM and GTAP estimates we treat as due to the income effects of the trade deal – which GTAP estimates but which GSIM ignores. We allocate these income effects according to the market shares of Ontario and the ROC in the base data. For the sake of clarity, these calculations are re-iterated step-by-step in Table 10 below for the breakdown of Canadian shipments to Canadian destinations: Table 10 Derivation of GTAP-FDI Model-based Canadian Shipments for Ontario and the ROC: Illustrative Calculation 1. GSIM baseline 2. Calibrate GSIM
baseline to GTAP 3. GSIM trade
effect 4. Calibrate trade effect
5. Income effect 6. Total effect
S\D ON ROC ON ROC ON ROC ON ROC ON ROC ON ROC
ON 629,000 84,310 670,035 89,810 0 0 0 0 4,582 614 4,582 614
ROC 264,968 1,750,000 282,254 1,864,168 -6 -32 -6 -34 1,930 12,748 1,924 12,713
Can 2,728,277 2,906,267 -38 -40 19,874 19,833
Note: rows are source markets and columns are destination markets.
These shipments to Canadian markets are then added to the GSIM international trade effects re-scaled to be consistent with GTAP results for Canada as a whole to obtain the distribution of the total change for each of Ontario and the ROC.
10 GTAP grain sector excludes wheat and oilseeds that are represented in separate sectors.
271

Table 11 Derivation of GTAP-FDI Model-based Canadian Shipments to Korea and the ROW: Illustrative Calculation 1. GSIM baseline 2. Calibrate GSIM
baseline to GTAP 3. GSIM trade
effect 4. Calibrate trade effect
5. Income effect
6. Total effect
S\D KOR ROW KOR ROW KOR ROW KOR ROW KOR ROW KOR ROW
ON 0 254,241 0 192,847 0 0 0 0 0 -397 0 -298
ROC 4,047 1,079,564 4,909 1,041,387 97 -24 118 -22 310 -
2,143 428 -2,264
Canada 1,337,851 1,239,142 73 95 -2,230 -2,134
Note: rows are source markets and columns are destination markets.
These calculations combine the information from GSIM on first-round trade effects and the information from GTAP on second-round income effects to generate GTAP-consistent estimates for total shipments by Ontario and the ROC separately. In turn, the data on shipments impacts can be used to obtain an approximation of the impact on Ontario’s and the ROC’s GDP based on the assumption that the ratio of shipments to GDP for Canada as a whole is representative of the ratio of shipments to GDP for each of Ontario and the ROC.
The main additional assumption underpinning this calculation, over and above the
allocation of trade and income effects and the use of shipments data to infer the scale of the GDP impact, is that the Ontario economy grows in line with the Canadian economy, thus maintaining its current share of the 2035 Canadian economy.
The GSIM simulations indicates no expansion of Ontario’s international grain exports,
because Ontario does not export grain to Korea, and thus does not benefit from the tariff cut in CKFTA. However, for the ROC, the “first round” effect of Korea’s tariff reduction is an increase in international shipments of $73,000, which is partly at the expense of a reduction of shipments of $38,000 to the ROC domestic market and to Ontario. This reduction of shipments to the non-liberalized Canadian domestic markets is a logical consequence of the partial equilibrium modelling framework. Unless additional supply can be generated without raising costs, there will inevitably be some trade diversion and thus a reduction of shipments to non-liberalized markets. The GTAP simulations, however, take into account the effect of all the tariff and other changes driven by the CKFTA. In the case of this sector, the expansion of exports implied by the small tariff cuts offered by Korea in this sector are “swamped” by the larger tariff cuts in the meat products sectors. This effect is same as in “Dutch Disease”, where an expansion of oil exports depresses exports of manufactured goods. Accordingly, the ROC’s total international exports decline. At the same time, the income gains from the CKFTA expand domestic demand, which drives up shipments for both Ontario and the ROC.
The technique used to generate the regional decomposition of Canada-level impacts can also be employed to decompose derived GTAP-based Ontario’s sector impacts into subsectors that are not represented in GTAP. For example, GTAP sector 20 “Meat products not elsewhere specified” includes a variety of meat products, including pork and poultry. This aggregation is particularly problematic because pork and poultry sectors have very different economic and are typically treated very differently in trade negotiations. For example, poultry is one of Canada’s supply-managed products, whereas pork is an export-oriented sector. Therefore, we construct a GSIM dataset for 3 subsectors of sector 20: Poultry, Pork, and Rest of Sector 20. We then run
272
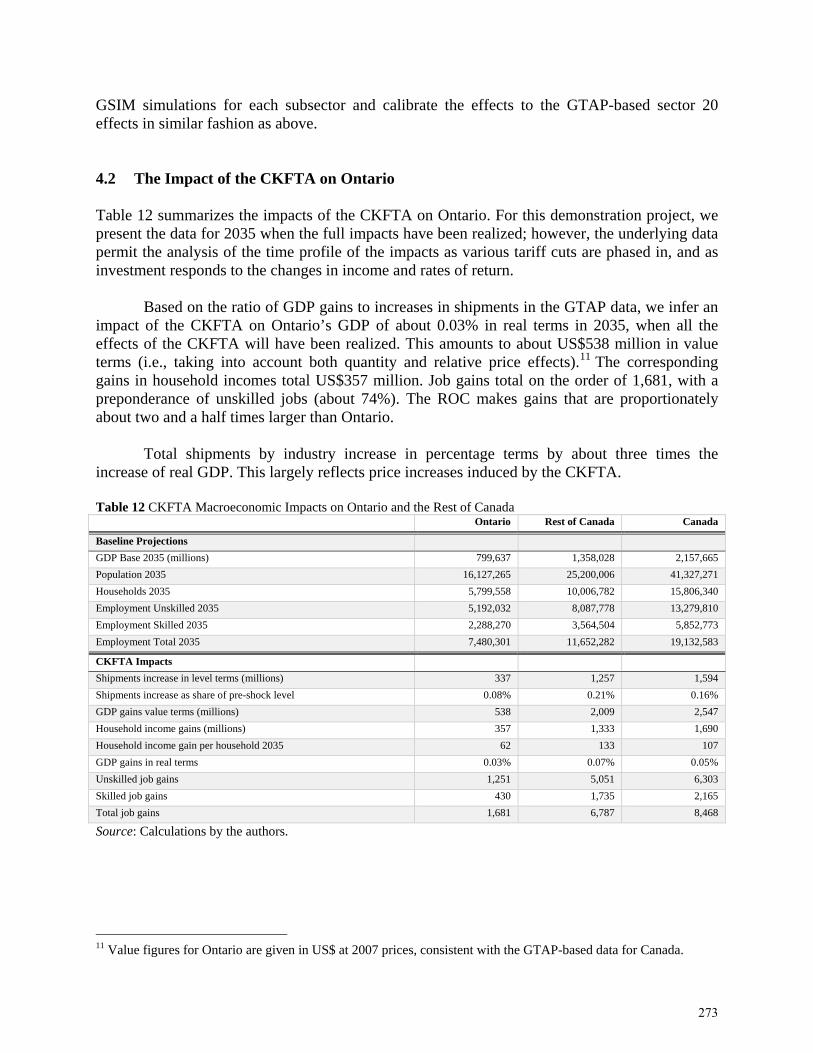
GSIM simulations for each subsector and calibrate the effects to the GTAP-based sector 20 effects in similar fashion as above. 4.2 The Impact of the CKFTA on Ontario Table 12 summarizes the impacts of the CKFTA on Ontario. For this demonstration project, we present the data for 2035 when the full impacts have been realized; however, the underlying data permit the analysis of the time profile of the impacts as various tariff cuts are phased in, and as investment responds to the changes in income and rates of return.
Based on the ratio of GDP gains to increases in shipments in the GTAP data, we infer an impact of the CKFTA on Ontario’s GDP of about 0.03% in real terms in 2035, when all the effects of the CKFTA will have been realized. This amounts to about US$538 million in value terms (i.e., taking into account both quantity and relative price effects).11 The corresponding gains in household incomes total US$357 million. Job gains total on the order of 1,681, with a preponderance of unskilled jobs (about 74%). The ROC makes gains that are proportionately about two and a half times larger than Ontario.
Total shipments by industry increase in percentage terms by about three times the
increase of real GDP. This largely reflects price increases induced by the CKFTA.
Table 12 CKFTA Macroeconomic Impacts on Ontario and the Rest of Canada Ontario Rest of Canada Canada
Baseline Projections
GDP Base 2035 (millions) 799,637 1,358,028 2,157,665
Population 2035 16,127,265 25,200,006 41,327,271
Households 2035 5,799,558 10,006,782 15,806,340
Employment Unskilled 2035 5,192,032 8,087,778 13,279,810
Employment Skilled 2035 2,288,270 3,564,504 5,852,773
Employment Total 2035 7,480,301 11,652,282 19,132,583
CKFTA Impacts
Shipments increase in level terms (millions) 337 1,257 1,594
Shipments increase as share of pre-shock level 0.08% 0.21% 0.16%
GDP gains value terms (millions) 538 2,009 2,547
Household income gains (millions) 357 1,333 1,690
Household income gain per household 2035 62 133 107
GDP gains in real terms 0.03% 0.07% 0.05%
Unskilled job gains 1,251 5,051 6,303
Skilled job gains 430 1,735 2,165
Total job gains 1,681 6,787 8,468
Source: Calculations by the authors.
11 Value figures for Ontario are given in US$ at 2007 prices, consistent with the GTAP-based data for Canada.
273
4.3 Sectoral Impacts Sectoral data are reported in terms of change in the value of shipments (Table 13). Note that for the provincial breakdown, two GTAP sectors are collapsed: GTAP “raw milk” and “dairy products” are combined into one category “dairy”; and “paddy rice” and “processed rice” are combined into one category “rice”. In terms of trade impacts, there are several sectors where Ontario makes gains that are large relative to the ROC (red-highlighted). In some cases (e.g., textiles), this reflects disproportionately large export sales to Korea. In others (e.g., beverages and tobacco), this reflects stronger gains in the domestic market driven by the CKFTA’s overall income effects. In wood products, Ontario does better overall because of outcomes in third markets.
The results presented here are “first pass” estimates generated for illustrative purposes; in policy applications, the key sectoral outcomes would be subject to further reality checks and sensitivity analysis to ensure that individually they are plausible.
As regards Canada’s key sensitive sector, automotive products, both Ontario and the
ROC experience negative impacts, but Ontario’s are substantially greater – although, all in all, the impacts are relatively minor, as the main brunt of the impact of Korea’s automotive market share gains in Canada come from displacement of US and European imports. While GTAP is not an ideal tool for refined sectoral analysis, the result is broadly in the same ballpark as those of Van Biesebroeck, Gao, and Verboven (2012), who found an FTA with Korea would reduce Canadian domestic auto production by 0.15% to 0.25%, depending on the demand model employed. The results are also broadly consistent with Ciuriak (2012) for the auto impacts of an FTA with Japan.
274
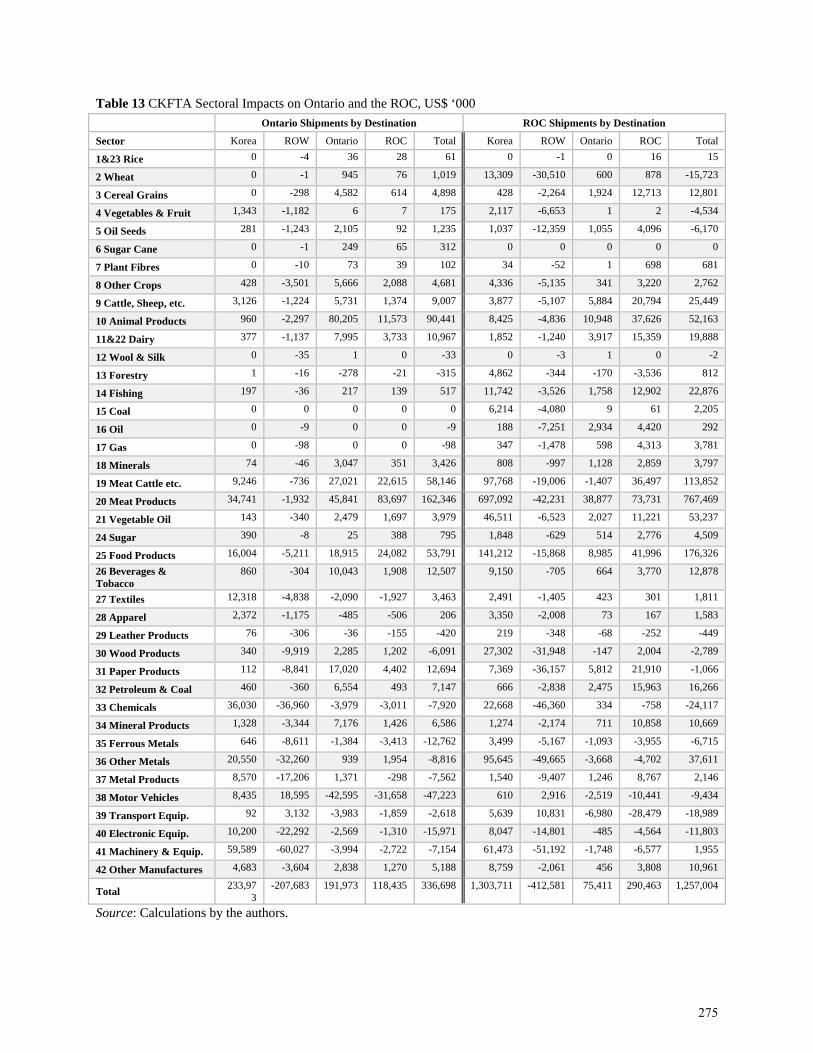
Table 13 CKFTA Sectoral Impacts on Ontario and the ROC, US$ ‘000
Ontario Shipments by Destination ROC Shipments by Destination
Sector Korea ROW Ontario ROC Total Korea ROW Ontario ROC Total
1&23 Rice 0 -4 36 28 61 0 -1 0 16 15
2 Wheat 0 -1 945 76 1,019 13,309 -30,510 600 878 -15,723
3 Cereal Grains 0 -298 4,582 614 4,898 428 -2,264 1,924 12,713 12,801
4 Vegetables & Fruit 1,343 -1,182 6 7 175 2,117 -6,653 1 2 -4,534
5 Oil Seeds 281 -1,243 2,105 92 1,235 1,037 -12,359 1,055 4,096 -6,170
6 Sugar Cane 0 -1 249 65 312 0 0 0 0 0
7 Plant Fibres 0 -10 73 39 102 34 -52 1 698 681
8 Other Crops 428 -3,501 5,666 2,088 4,681 4,336 -5,135 341 3,220 2,762
9 Cattle, Sheep, etc. 3,126 -1,224 5,731 1,374 9,007 3,877 -5,107 5,884 20,794 25,449
10 Animal Products 960 -2,297 80,205 11,573 90,441 8,425 -4,836 10,948 37,626 52,163
11&22 Dairy 377 -1,137 7,995 3,733 10,967 1,852 -1,240 3,917 15,359 19,888
12 Wool & Silk 0 -35 1 0 -33 0 -3 1 0 -2
13 Forestry 1 -16 -278 -21 -315 4,862 -344 -170 -3,536 812
14 Fishing 197 -36 217 139 517 11,742 -3,526 1,758 12,902 22,876
15 Coal 0 0 0 0 0 6,214 -4,080 9 61 2,205
16 Oil 0 -9 0 0 -9 188 -7,251 2,934 4,420 292
17 Gas 0 -98 0 0 -98 347 -1,478 598 4,313 3,781
18 Minerals 74 -46 3,047 351 3,426 808 -997 1,128 2,859 3,797
19 Meat Cattle etc. 9,246 -736 27,021 22,615 58,146 97,768 -19,006 -1,407 36,497 113,852
20 Meat Products 34,741 -1,932 45,841 83,697 162,346 697,092 -42,231 38,877 73,731 767,469
21 Vegetable Oil 143 -340 2,479 1,697 3,979 46,511 -6,523 2,027 11,221 53,237
24 Sugar 390 -8 25 388 795 1,848 -629 514 2,776 4,509
25 Food Products 16,004 -5,211 18,915 24,082 53,791 141,212 -15,868 8,985 41,996 176,326
26 Beverages & Tobacco
860 -304 10,043 1,908 12,507 9,150 -705 664 3,770 12,878
27 Textiles 12,318 -4,838 -2,090 -1,927 3,463 2,491 -1,405 423 301 1,811
28 Apparel 2,372 -1,175 -485 -506 206 3,350 -2,008 73 167 1,583
29 Leather Products 76 -306 -36 -155 -420 219 -348 -68 -252 -449
30 Wood Products 340 -9,919 2,285 1,202 -6,091 27,302 -31,948 -147 2,004 -2,789
31 Paper Products 112 -8,841 17,020 4,402 12,694 7,369 -36,157 5,812 21,910 -1,066
32 Petroleum & Coal 460 -360 6,554 493 7,147 666 -2,838 2,475 15,963 16,266
33 Chemicals 36,030 -36,960 -3,979 -3,011 -7,920 22,668 -46,360 334 -758 -24,117
34 Mineral Products 1,328 -3,344 7,176 1,426 6,586 1,274 -2,174 711 10,858 10,669
35 Ferrous Metals 646 -8,611 -1,384 -3,413 -12,762 3,499 -5,167 -1,093 -3,955 -6,715
36 Other Metals 20,550 -32,260 939 1,954 -8,816 95,645 -49,665 -3,668 -4,702 37,611
37 Metal Products 8,570 -17,206 1,371 -298 -7,562 1,540 -9,407 1,246 8,767 2,146
38 Motor Vehicles 8,435 18,595 -42,595 -31,658 -47,223 610 2,916 -2,519 -10,441 -9,434
39 Transport Equip. 92 3,132 -3,983 -1,859 -2,618 5,639 10,831 -6,980 -28,479 -18,989
40 Electronic Equip. 10,200 -22,292 -2,569 -1,310 -15,971 8,047 -14,801 -485 -4,564 -11,803
41 Machinery & Equip. 59,589 -60,027 -3,994 -2,722 -7,154 61,473 -51,192 -1,748 -6,577 1,955
42 Other Manufactures 4,683 -3,604 2,838 1,270 5,188 8,759 -2,061 456 3,808 10,961
Total 233,97
3 -207,683 191,973 118,435 336,698 1,303,711 -412,581 75,411 290,463 1,257,004
Source: Calculations by the authors.
275
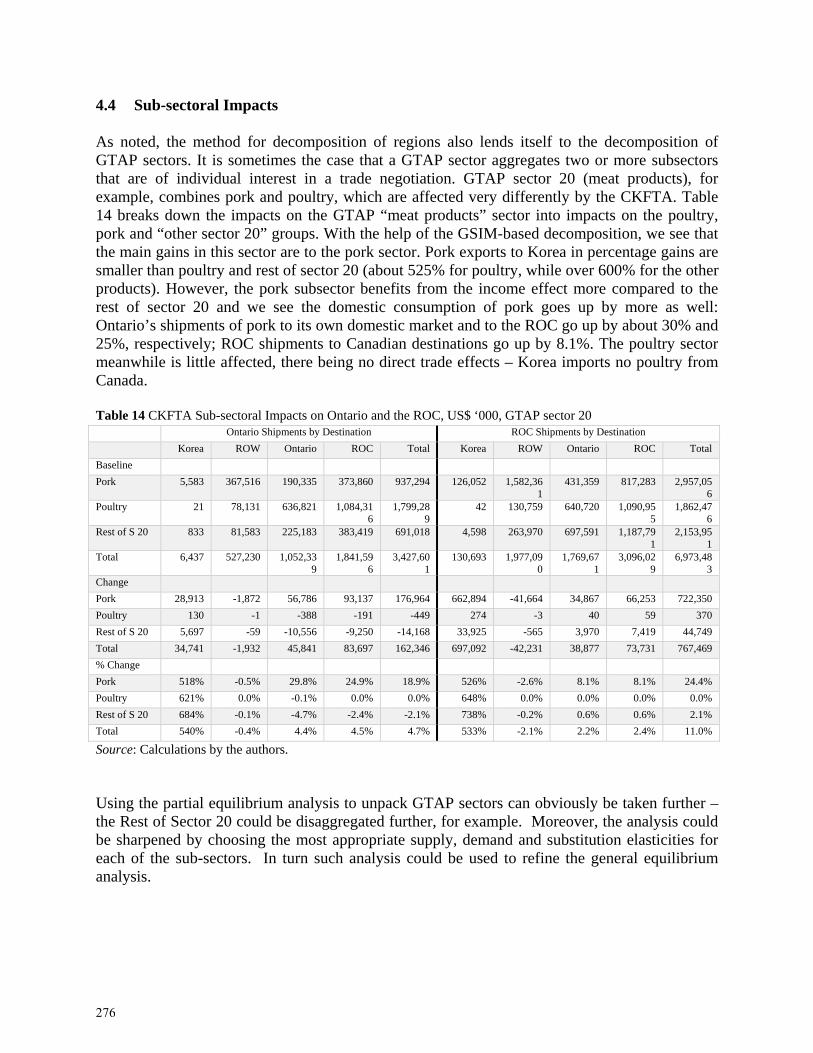
4.4 Sub-sectoral Impacts As noted, the method for decomposition of regions also lends itself to the decomposition of GTAP sectors. It is sometimes the case that a GTAP sector aggregates two or more subsectors that are of individual interest in a trade negotiation. GTAP sector 20 (meat products), for example, combines pork and poultry, which are affected very differently by the CKFTA. Table 14 breaks down the impacts on the GTAP “meat products” sector into impacts on the poultry, pork and “other sector 20” groups. With the help of the GSIM-based decomposition, we see that the main gains in this sector are to the pork sector. Pork exports to Korea in percentage gains are smaller than poultry and rest of sector 20 (about 525% for poultry, while over 600% for the other products). However, the pork subsector benefits from the income effect more compared to the rest of sector 20 and we see the domestic consumption of pork goes up by more as well: Ontario’s shipments of pork to its own domestic market and to the ROC go up by about 30% and 25%, respectively; ROC shipments to Canadian destinations go up by 8.1%. The poultry sector meanwhile is little affected, there being no direct trade effects – Korea imports no poultry from Canada. Table 14 CKFTA Sub-sectoral Impacts on Ontario and the ROC, US$ ‘000, GTAP sector 20 Ontario Shipments by Destination ROC Shipments by Destination
Korea ROW Ontario ROC Total Korea ROW Ontario ROC Total
Baseline
Pork 5,583 367,516 190,335 373,860 937,294 126,052 1,582,361
431,359 817,283 2,957,056
Poultry 21 78,131 636,821 1,084,316
1,799,289
42 130,759 640,720 1,090,955
1,862,476
Rest of S 20 833 81,583 225,183 383,419 691,018 4,598 263,970 697,591 1,187,791
2,153,951
Total 6,437 527,230 1,052,339
1,841,596
3,427,601
130,693 1,977,090
1,769,671
3,096,029
6,973,483
Change
Pork 28,913 -1,872 56,786 93,137 176,964 662,894 -41,664 34,867 66,253 722,350
Poultry 130 -1 -388 -191 -449 274 -3 40 59 370
Rest of S 20 5,697 -59 -10,556 -9,250 -14,168 33,925 -565 3,970 7,419 44,749
Total 34,741 -1,932 45,841 83,697 162,346 697,092 -42,231 38,877 73,731 767,469
% Change
Pork 518% -0.5% 29.8% 24.9% 18.9% 526% -2.6% 8.1% 8.1% 24.4%
Poultry 621% 0.0% -0.1% 0.0% 0.0% 648% 0.0% 0.0% 0.0% 0.0%
Rest of S 20 684% -0.1% -4.7% -2.4% -2.1% 738% -0.2% 0.6% 0.6% 2.1%
Total 540% -0.4% 4.4% 4.5% 4.7% 533% -2.1% 2.2% 2.4% 11.0%
Source: Calculations by the authors. Using the partial equilibrium analysis to unpack GTAP sectors can obviously be taken further – the Rest of Sector 20 could be disaggregated further, for example. Moreover, the analysis could be sharpened by choosing the most appropriate supply, demand and substitution elasticities for each of the sub-sectors. In turn such analysis could be used to refine the general equilibrium analysis.
276

5 DISCUSSION AND CONCLUSIONS This study employs a novel methodology that enables the evaluation of the province-level impacts of Canada’s FTAs. Based on estimates of the CKFTA impacts on Canada’s economy, derived using a dynamic version of the workhorse GTAP model, we decompose the impacts into Ontario-specific and ROC-specific results on the basis of GSIM simulations, which are based on the same basic parameters and shock files. This allows first order approximations of the general equilibrium effects on Ontario of the various quantifiable elements that are included in the GTAP estimates of the impact of the CKFTA; recall that these include the following: a) Tariff elimination or reduction on goods; b) The extent of utilization of preferences, and the costs of complying with the associated
ROOs; c) Reduction of NTBs on goods; d) Reduction of NTBs on services; and e) Liberalization of restrictions on FDI.
Our preliminary results suggest that the CKFTA is likely to benefit Ontario, but less so
than the ROC. We infer an impact of the CKFTA on Ontario’s GDP of about 0.02% in real terms in 2035, when all the effects of the CKFTA will have been realized. This amounts to about US$500 million in value terms (i.e., taking into account both quantity and relative price effects). The corresponding gains in household incomes total US$332 million. Job gains total on the order of 1,562, with a preponderance of unskilled jobs (about 74%). The ROC makes gains that are proportionately about two and a half times larger than Ontario.
The key result in this illustrative exercise is that the Ontario economy reacts differently
than the ROC’s to an international trade agreement. The differences are stark; the ultimate impact on any individual sector reflects the combination of impacts on shipments to Korea, to the rest of the world, as well as shipments to the domestic markets, including inter-provincial trade. Importantly, these impacts on total shipments also reflect the outcomes of imports from Korea and from third countries. Accordingly, it is not possible to read out the impact on Ontario’s economy of the CKFTA on a pro-rated basis of the estimated Canada-level impacts, nor from anticipated export gains alone. This is a key result for provincial economic policy considerations.
The study has broken new ground in a number of areas: to our knowledge, this approach is novel in terms of both the mechanics and the conceptual interpretation. The conclusions are, in our judgement, at a general level, broadly robust to the numerous caveats that accompany the analysis. However, the specific numbers cited in this study, especially the sectoral impacts, are subject to greater uncertainty and should be treated with due caution. For policy purposes, the sectoral results should be complemented by additional reality checks and sensitivity analysis, and for key sectors to sector-specific analysis.
For policy analysis, the framework developed here makes available a general quantitative approach to sub-national trade policy analysis for jurisdictions such as Canada for which provincial-level trade data are available The approach can also be applied to national-level trade data to decompose GTAP-generated results for aggregated regions. Further, the approach allows
277

a breakdown of GTAP sector impacts into sub-sectors that may be of particular interest in a given trade negotiation.
278
REFERENCES
Baldwin, Richard. “A Domino Theory of Regionalism.” In Expanding Membership of the European Union, edited by Richard Baldwin, Pertti Haaparnata, and Jaakko Kiander. Cambridge, 25-53. UK: Cambridge University Press, 1995.
Benzie, Robert and Les Whittington. “South Korea trade deal leaves Ontario auto industry vulnerable, warns Eric Hoskins.” The Star, 11 March 2014.
Ciuriak, Dan. “Auto Sector Impacts of a Canada-Japan Free Trade Agreement: A Market-Segment-Based Evaluation.” Ciuriak Consulting Working Paper (2012).
Ciuriak, Dan. “East Asian FTAs and Their Implications for Economic Welfare and Global Trade: The Domino Theory Revisited.” Working Paper (2010).
Ciuriak, Dan and Jingliang Xiao. “The Canada-Korea Free Trade Agreement: A First Look at the Numbers.” Working Paper (20 September 2014).
Ciuriak, Dan, Ali Dadkhah, and Jingliang Xiao. 2014. “The Canada-Korea Free Trade Agreement: Re-evaluating the Services Trade Measures, Working Paper, November 2014.
Ciuriak, Dan, Jingliang Xiao and Ali Dadkhah. 2014. “The Canada-Korea Free Trade Agreement: What it means for Canada,” E-Brief, C.D. Howe Institute
By Dan Ciuriak, and Jingliang Xiao and Ali Dadkhah Deveau, Scott. “Ford Canada, Ontario blast South Korean trade deal, saying Ottawa’s pact will
flood country with foreign cars.” Financial Post, 11 March 2014. Généreux, Pierre A. and Brent Langen. “The Derivation of Provincial (Inter-regional) Trade
Flows: The Canadian Experience.” Presented at the 14th International Input-Output Techniques Conference, Université du Québec à Montréal, 10-15 October 2002.
Global Trade Atlas. Global Trade Information Services. Columbia, SC: GTIS, Inc., 2014. Government of Canada, Department of Foreign Affairs, Trade and Development. “Canada-Korea
Free Trade Agreement (CKFTA).” Canada.ca, 2014. Government of Ontario, Ministry of Finance. “Ontario Fact Sheet June 2014.” Ontario Ministry of
Finance, June 2014. Government of Ontario, Ministry of Finance. Budget 2014: Building Opportunity, Securing Our
Future. Toronto: Queen’s Printer for Ontario, May 2014. International Monetary Fund (IMF). “World Economic Outlook Database.” Washington, D.C.: IMF,
April 2014. International Trade Centre. Market Access Map. Geneva: ITC, 2014a. International Trade Centre. Trade Map. Geneva: ITC, 2014b. Mayer, Thierry and Soledad Zignago. “Notes on CEPII’s distances measures: The GeoDist
database.” CEPII Working Paper 2011-25 (December 2011). Statistics Canada. “Household size, by province and territory (2011 Census).” 2011 Census of
Population and Statistics Canada catalogue 98-313-XCB (2013).
279

Statistics Canada. “Table 079-0003: New Motor Vehicle Sales, Canada, provinces and territories.” CANSIM database, 2014.
Statistics Canada. “Table 386-0002: Interprovincial and international trade flows at producer prices, *Terminated*.” CANSIM database, 2011.
Statistics Canada. Population Projections for Canada, Provinces and Territories, 2009 to 2036: Catalogue no. 91-520-X. Ottawa: Minister of Industry, June 2010.
United Nations Statistics Division (UNSD). “Complete HS and SITC conversion and correspondence tables along with detailed note on its conversion methodology.” UNSD, 2010.
Van Biesebroeck, Johannes, Hang Gao, and Frank Verboven. “Impact of FTAs on Canadian Auto Industry.” Paper prepared for DFAIT Canada, 31 January 2012.
World Integrated Trade Solution (WITS). “Product Concordance.” WITS, n.d.
280
APPENDIX A: GSIM PROVINCIAL TRADE DATABASE METHODOLOGY For the purposes of the GSIM simulations, we construct the following database that includes trade and tariff matrices. A1: Regions The database includes Ontario, the ROC, 19 economies, and an aggregate region, the Rest of the World (ROW). The following 19 economies are included: Australia, Chile, China, EU28, Hong Kong, India, Indonesia, Japan, Korea, Malaysia, Mexico, New Zealand, Peru, Philippines, Russia, Singapore, Taiwan, the United States, and Vietnam. A2: State-Level International Trade Data We source annual data on bilateral trade flows at HS 6-digit level from the International Trade Centre (ITC) Trade Map database.12 We use import data for all reporting countries to represent the bilateral trade flow in each direction. Thus, Canada’s exports to Korea are measured by Korea’s reported imports from Canada. This choice is guided by the general opinion of statistical agencies that import data are more reliable measures of imports by source than are the mirror export data. In part, this reflects the fact that imports are subject to tariffs that vary by source of imports, thus making customs agencies verify source of imports for tax purposes. Export data, meanwhile, may be consigned to intermediate destinations (e.g., Canadian exports being shipped to Mexico might, in the first instance, be shipped to a distribution centre in the United States) and might be misclassified as to the ultimate destination. Export flows to the ROW are calculated as a residual, using WTO Members’ imports as a proxy for world imports. Modelling results are not sensitive to this assumption. A3: Aggregation of State-Level Trade Data The Trade Map data are classified according to HS nomenclature. In order to construct GTAP product aggregates, HS codes are matched to GTAP codes. The mapping depends on the version of HS nomenclature; differences in the HS versions of import data reported by countries were, accordingly, taken into account. The mappings between GTAP codes and different HS versions are provided within the World Integrated Trade Solutions, a software facility created by the World Bank and the United Nations Conference on Trade and Development (UNCTAD).13 In order to create an HS2012-GTAP mapping, an HS2012-HS2007 concordance table, produced by the United Nations Statistics Division, was used.14
With the GTAP-HS concordance in hand, bilateral trade flows are aggregated by year and by GTAP product code. Further, the bilateral trade flows are averaged over the 2010-2013 period (2010-2012 for Hong-Kong, Peru, and Vietnam).
12,International Trade Centre (2014b). 13 WITS (n.d.). 14 UNSD (2010).
281
A4: Provincial International Trade Flows and their Aggregation Statistics Canada has developed estimates of provinces’ interprovincial and international trade flows, which are consistent with the Canadian System of National Accounts (CSNA), drawing on a range of sources and applying a range of statistical techniques. 15 However, CSNA-consistent provincial trade data and international merchandise trade data come from different sources and are based on different aggregation concepts; accordingly, constructing trade flow matrices for the GSIM database requires the resolution of a number of issues.
International exports of Canadian provinces are drawn from the Global Trade Atlas database. As there are no corresponding international mirror import data for Canadian provincial exports, we necessarily rely on export data to represent provinces’ exports. We use domestic exports, rather than total exports, which include re-exports. Canadian merchandise export data indicate the province of origin; accordingly, provinces’ international export data require no further adjustment. The data are matched to GTAP codes and averaged over the 2010-2013 period.
The corresponding data for provinces’ international imports cannot be used directly,
because imports are recorded in the province in which they clear customs; this generates a major trans-shipment problem. For example, virtually no international imports clear customs in PEI; accordingly, imports that clear Canadian customs in other provinces must be re-assigned to PEI. This adjustment is very substantial: as noted by Généreux and Langen (2002), PEI international imports for goods in 1997 were about sixteen times larger in the CSNA-consistent provincial trade flows than in the Canadian International Merchandise Trade data.
To address the trans-shipment problem, we rely on CSNA-consistent provincial
international import data to establish the level of imports, since these correspond to imports by province of destination, rather than by province of customs clearance. However, these data are classified on the basis of Input-Output (I-O) definitions. To address this problem, the international imports of each I-O product are pro-rated to HS 10-digit codes using the province’s HS-based international imports shares of the 10-digit HS products that correspond to the I-O product.16 The allocation makes use of the HS-I-O concordance table produced by Statistics Canada. The allocated international imports at HS 10-digit level are then aggregated back up to GTAP sectors.
The CSNA-consistent import data do not specify country of origin. Accordingly, these
data have to be assigned to provinces on some basis. For the present study, we rely on provinces’ customs-based international imports data to allocate each province’s adjusted product data by country of origin. Insofar as provinces source their imports through logistics chains that result in direct entry from abroad, this method of allocation will be accurate. Insofar as the logistics chain for a particular product result in bulk shipments to one point of entry into Canada, followed by
15 A detailed description of the sources of information and methods applied by Statistics Canada to develop the provincial trade data is provided by Généreux and Langen (2002). 16 In several cases, there are no HS international imports that correspond to the positive CSNA-consistent I-O international imports. In this case, Canadian HS international imports shares are used in the allocation.
282
internal distribution post-customs clearance, this method will overstate the source country’s share in the province of entry and understate it in all other provinces.
We identified that market shares of provincial imports were particularly biased by
logistics chains in two cases: imports of cars and cell phones from Korea that use Ontario as a major point of entry into Canada. To address this issue, prior to pro-rating CSNA-consistent international imports to HS 10-digit codes, we used Canadian customs-based data on imports of cars and cell phones from Korea and other markets and allocated these across provinces using provincial motor vehicle sales and GDP shares respectively. This reallocation generated a pattern of HS-based international imports shares in each province that better represents actual import patterns. This improved allocation at the basic 10-digit HS level flows through the aggregation process and results in an improved allocation of imports by GTAP sector and province.
CSNA-consistent provincial international imports that are used in the allocation
procedure include both goods and services. Some of the products represent a mix of goods and services. Therefore, even if several HS codes correspond to those mixed products, allocation of total import value to them would be wrong because it would imply allocation of imports of services to those codes. Therefore, a number of I-O products are dropped from the allocation. Specifically, we exclude the following products, which represent a mix of services and goods: 1) software; 2) other services; 3) utilities; and 4) retail margins, sales of used goods, and commissions. The implication is that our data on goods do not include imports of goods that correspond to these excluded I-O products.
The provincial CSNA-consistent trade data are taken from Statistics Canada’s CANSIM
database, Table 3860002, while the provinces’ international trade data are obtained from the Global Trade Atlas database.
A5: Scaling and Benchmarking International Imports of Provinces The risk with allocation of I-O products based on HS shares is that we may give a wrong weight to a specific product and that may bias our estimates of import aggregates. Aggregation to higher levels should, in principle, limit the biases and, at the I-O product level, should, in principle, remove all deviations caused by the assumptions. However, because some of the GTAP product codes are still quite detailed (as compared to I-O product codes), our estimates may still be biased for more narrowly defined product groups.
In order to improve our estimates further, we benchmark provincial imports to Canadian imports. We use our estimates of provincial imports to get provincial shares of imports within each product group and then apply those shares to Canadian imports (Canadian imports are reliable numbers).
In the allocation-aggregation procedure of provincial imports described above, we use the
data on the CSNA-consistent provincial international imports for the most recent year (2010): that is, allocation is performed using provinces’ 2010 HS-based international imports. In order to scale up provincial imports, we benchmark them to Canadian imports averaged over the period 2010-2013.
283
A6: Inter-Provincial Trade Flows CSNA-consistent interprovincial data are also classified by I-O product categories. To create inter-provincial GTAP-based trade flows, each province’s HS-based shipment shares to the United States of products defined at the 8-digit level are applied to the corresponding I-O based aggregate trade flows between the provinces.17 The resulting interprovincial trade flows at the HS 8-digit level are then aggregated up to the GTAP sectors. This procedure is based on the assumption that the detailed products that the province sends abroad are also shipped inter-provincially in the same proportions. Aggregation to higher levels should, as in the case of provinces’ international imports, limit the biases and, at the I-O level, should, in principle, remove all deviations caused by the assumptions.
The provincial CSNA-consistent inter-provincial trade data are taken from Statistics Canada’s CANSIM database, Table 386-0002.
We scale up interprovincial trade flows using provinces’ international exports (scale factor = average 2013-2010 export to world / export in 2010 to world). If the 2010 estimate of interprovincial export is zero, it is not scaled up. If the 2010 estimate is positive and the growth rate of the 2012-2010 average of world export is zero, the estimate is not scaled up either.
Finally, we review the data and make adjustments in several sectors as needed. Specifically,
we have to make adjustment in supply-managed products because methodology that is based on international exports is not appropriate for these products.
A7: State-Level Domestic Shipments The GSIM model also requires data on domestic absorption for each trading entity – i.e., the portion of output that is shipped for domestic consumption or use.
For international trade partners of Canadian provinces, for the purposes of GTAP-classified trade matrices, we use the GTAP database estimates of imports as a share of domestic disappearance of goods, coupled with known import levels to estimate domestic shipments. The GTAP dataset is based on 2007 data; accordingly, we implicitly assume that the import share of markets in the period 2010-2013 was the same as in 2007.
ROW domestic shipments are estimated as a sum of domestic shipments of all countries in the model that are calculated using GTAP data, multiplied by (World GDP – sum of these countries GDP)/sum of these countries GDP. This assumption has no material impact on the modelling results.
17 In several cases, when a province ships a product inter-provincially without corresponding shipments to the United States, other shares are used: e.g., the province’s shipment shares to the world in 2010 or another year. In several cases, a province ships a product to other provinces, but it never export it internationally. In this case, HS shares of other provinces’ within product data are used. Specifically, Yukon shares are used to allocate one of the products of the Northwest Territories and Nova Scotia shares are used to allocate one of the products of PEI.
284
A8: Province-Level Domestic Shipments To generate estimates of domestic shipments by province, we use data from the Canadian IO tables and calculate domestic shipments of all provinces as output minus international export minus interprovincial export.18 We perform this calculation by product as classified in I-O tables. Domestic shipments of the ROC are calculated as follows: Canadian domestic shipments minus domestic shipments of Ontario minus exports of ROC to Ontario minus imports of ROC from Ontario.
Then, we aggregate the estimates up to very broad sectors (Fishery; Agriculture; Chemical, Rubber, and Plastic; Pulp and Paper; Wood and Forestry; Minerals, Mineral Fuels, and Products Thereof; Textile and Leather; Transport Equipment; Machinery and Equipment; Metals; and Other Manufacturing). Further, we disaggregate domestic shipments using GTAP international exports of Ontario and ROC.
Finally, we review the data and make further adjustments as needed. Specifically, estimates of domestic shipments of dairy products were found to be too low (our methodology does not work for supply-managed products that are oriented towards the domestic market), while domestic shipments of wheat, which have a very high export intensity, were too high. Thus, we reallocated domestic market share from wheat to dairy.
Generally, the results of simulations are not sensitive to the value of domestic shipments. Therefore, these rough estimates of domestic shipments are satisfactory for our purposes. A9: Tariffs Tariff data are from the ITC’s Market Access Map database.19 Specific tariffs in the national tariff schedules are converted by ITC to ad valorem equivalents (i.e., tariffs expressed as a percentage of the value of the dutiable products). The most recent tariffs that would incorporate preferential tariffs are used. See table below for the reference year for tariffs of particular countries in the dataset.
We use tariffs at the 6-digit level and calculate weighted-average tariffs of each region in the model. The weights are based on the region’s world exports. Some countries do not have export data, which is required for weighting. For example, Philippines reports all its exports following HS 2002 revision and, therefore, these exports cannot be matched to tariffs of countries that report the tariffs following HS 2012 revision. The following tariffs are not weighted for that reason: tariffs that Indonesia faces in countries that report them following HS 2012 revision; tariffs that Philippines faces in countries that report them following HS 2007 revision and HS 2012 revision; and tariffs that Taiwan faces in countries that report them
18 Some estimates of domestic shipments turn out to be negative (perhaps because we do not take into account shipments out of inventories). There are only few cases of this and the negative numbers are small. We set them equal to zero. 19 International Trade Centre (2014a).
285
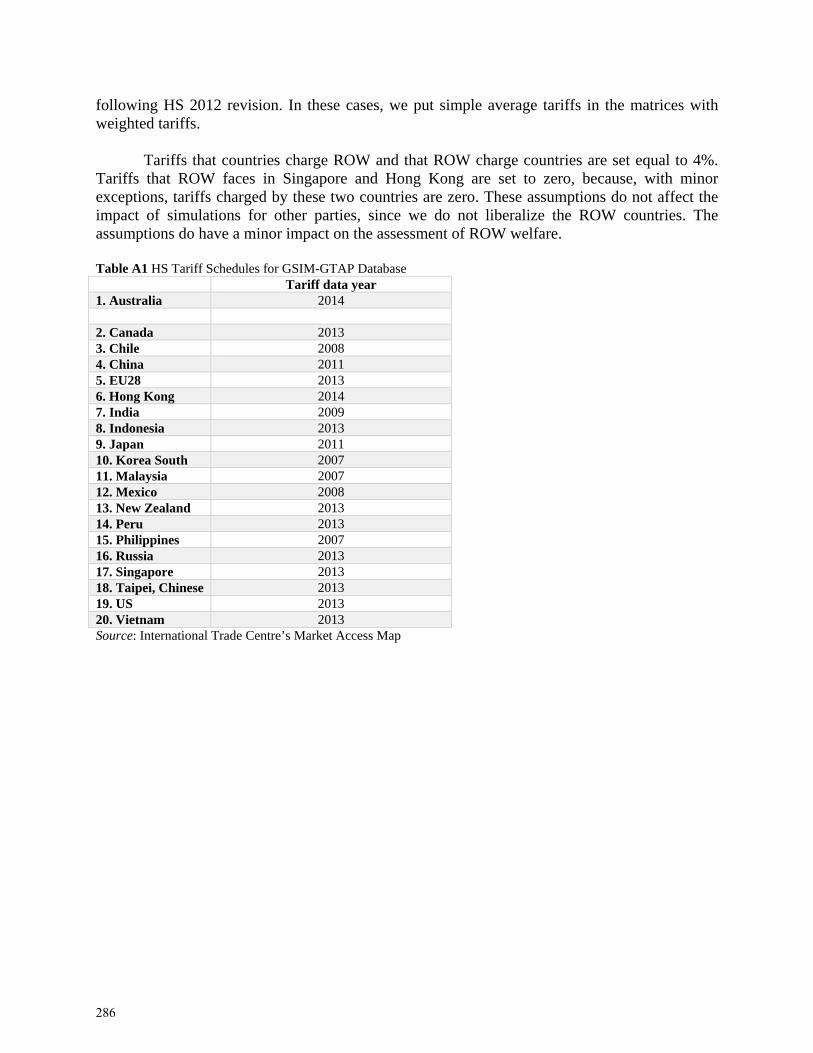
following HS 2012 revision. In these cases, we put simple average tariffs in the matrices with weighted tariffs.
Tariffs that countries charge ROW and that ROW charge countries are set equal to 4%.
Tariffs that ROW faces in Singapore and Hong Kong are set to zero, because, with minor exceptions, tariffs charged by these two countries are zero. These assumptions do not affect the impact of simulations for other parties, since we do not liberalize the ROW countries. The assumptions do have a minor impact on the assessment of ROW welfare. Table A1 HS Tariff Schedules for GSIM-GTAP Database Tariff data year 1. Australia 2014 2. Canada 2013 3. Chile 2008 4. China 2011 5. EU28 2013 6. Hong Kong 2014 7. India 2009 8. Indonesia 2013 9. Japan 2011 10. Korea South 2007 11. Malaysia 2007 12. Mexico 2008 13. New Zealand 2013 14. Peru 2013 15. Philippines 2007 16. Russia 2013 17. Singapore 2013 18. Taipei, Chinese 2013 19. US 2013 20. Vietnam 2013 Source: International Trade Centre’s Market Access Map
286
The Evolutionary Effects of Democracy: In the Long Run, We Are All Trading?
CHRISTOPHER J. BOUDREAUX1
A.R. Sanchez, Jr. School of Business, Texas A&M International University, Laredo, Texas, USA
It is well established that democracy affects trade, but how does this relationship change over time? The results suggest that democracy increases trade openness both in the short and long run. However, democracy only leads to a reduction in trade restrictions in the short term. In addition, the durability of a polity is employed as an instrument in order to consider the possibility that democracy and trade are endogenously related. This method helps to isolate a causal effect of democracy on trade, and the results suggest that the economic effect of democracy is 2-3 times larger than under OLS. KEYWORDS Trade; Democracy; Political Economy; Long Run JEL F59, F14, D90, O57
1 Address correspondence to Christopher J. Boudreaux, Texas A&M International University, Laredo, Texas, USA. Email: [email protected]
287

1. INTRODUCTION As early as the 19th century, David Ricardo explained how benefits accruing from the division of labor can allow individuals in nations to engage in mutually beneficial exchange by focusing their labor on their lowest opportunity costs. While economists disagree on many issues, one topic in which there is a general consensus is the beneficial effects of free trade. In a survey, Frey (1984) suggests that 88% of professional economists view free trade as superior to trade with barriers, and Frey et al (1984) survey economists and find that there is a general consensus towards the answer, "tariffs and import quotas reduce general economic welfare." The empirical evidence appears to support these views on the benefits of exchange in international trade.
Since the 1970s, globalization has increased dramatically. Over four billion people have joined hands to trade in the past twenty-five years as part of an ever increasing attempt to globalize (Milner & Kubota, 2005). Further, trade barriers have declined dramatically since the mid 1980’s and continue to decline. Rodrik (1992) described this involvement in the reduction of trade barriers as political leaders taking advantage of opportune moments during financial crises to accrue benefits for themselves.
At the same time, democratization is simultaneously taking place. This opens up the
possibility that democratization plays at least a part of the increase in involvement in trade and openness of economics across the world. Of course, this is not the first paper to recognize this phenomenon. Milner & Kubota (2005) emphasize the need to control for time dummies in a panel of countries in order to control for this time effect and many others follow suit. Milner & Mukherjee (2009) offer a recent review of the literature on international political economy and trade and offer the conclusion that democratization has led to increases in trade. However, there is still much more to be explored in this literature.
This study makes two key contributions. First, while many studies have analyzed the impact of democracy on trade in a panel of countries, we are unaware of any study that measures this impact over different time periods. To our knowledge, this is the first study that analyzes the economic impact of democracy on trade in the short run and long run. Second, most studies treat measures of trade protection and trade output as substitute measures; some studies analyze the relationship between democracy and average tariff rates, others look at the impact of democracy on trade openness, and still others use the sum of exports and imports or some alternative derivative measure to gauge the impact of democracy on trade. However, it is more accurate to treat these measures as complements. Moreover, to our knowledge, no study has appropriately controlled for the degree of trade protection when analyzing the relationship between democracy and trade. Democracy can influence trade through two channels. It can influence trade directly through influencing the amount of trade that takes place. In addition, democracy can influence trade indirectly through influencing trade policy, and the trade policy will influence trade output. Therefore, the second contribution of this study is that it analyzes the relationship between democracy and trade using indirect measures of trade (e.g., tariff rates) and direct measures of trade (e.g., imports and exports).
The findings in this study suggest that democracy and international trade are positively correlated using a panel of more than 100 countries during the period 1970-2010, which is
288
consistent with many previous studies (Milner & Mukherjee (2009). More importantly, the results suggest that the impact of democracy on trade output becomes larger over time; the coefficient estimates more than double from the five year estimation period to the twenty year period, which suggests that it takes time for the effects to be felt. In contrast, democracy only affects trade policy in the short term. These results are robust to a wide set of fragility checks including alternative democracy measures, inclusion of previously unutilized trade protection covariates, and controls for potential endogeneity stemming from reverse causality. This paper is organized as follows: Section 2 discusses the relationship between democracy and trade, Section 3 describes the data, Section 4 presents the identification strategy, Section 5 presents the results, Section 6 discusses the findings, and Section 7 summarizes and ends with areas for future research.
2. INTERNATIONAL POLITICAL ECONOMY OF TRADE Krugman (1987) asserts that because trade interventions influence the distribution of income and its levels, the political process at the domestic level must be taken into consideration in any explanation of trade policy. Scholars have taken this suggestion seriously and a large literature has surfaced in the past decade to analyze the international political economy of trade. Milner & Kubota (2005) provide some evidence to suggest that democratization leads to a greater increase in trade flows as measured by average tariff rates and the Sachs-Warner trade openness measure. Many other studies also arrive at similar conclusions using alternative measures of trade protection and trade liberalization.
Early studies tested the hypothesis that democratic transitions are likely to increase trade openness. Stokes (2001) and Weyland (2002) find evidence to support this hypothesis across countries in Latin America. Dutt & Mitra (2002) suggest that democratization may be associated with trade liberalization in countries where workers benefit from higher wages due to globalization. O’Rourke & Taylor (2006) suggest that democracy has a positive effect on trade conditional on factor endowments such as the capital-labor ratio.
The argument for democracy leading to increased trade is summarized by Milner & Kubota (2005). They argue that democratization expands the involvement in a polity, and it empowers groups in society that were formerly excluded from the political process. More importantly, the previously unheard voices of the low-skilled and unskilled workers favor trade openness because they are the abundant factors that stand to benefit from trade. Democratization increases the voices of the abundant factor and political leaders face incentives to pay attention to the preferences of labor by lowering trade barriers. Therefore, one may expect democracy to increase trade due to the civil liberties and political freedom associated with democratization. 2.1 Long Term and Short Term Effects of Democracy The largest contribution of this paper is to analyze the impact of democracy on trade in multiple time intervals. This intertemporal effect may be important for two reasons. First, it may be the case that democracy affects trade, but this effect takes time. Therefore, finding empirical
289

evidence towards the efficacy of democratization and trade may be effected by the frequency of the time periods. Because it takes time for institutions to become developed and ingrained in society, the hypothesis is that longer time periods will have larger effects than shorter periods. Therefore, annual time periods in a panel setting may be too short to accurately assess the impact of democracy on trade. This study utilizes a panel of more than 100 countries in 5, 10, and 20 year intervals to assess the impact of democracy on trade in multiple time intervals.
The second contribution of this study is that it identifies the economic magnitude for each time interval. It may be true that democracy effects trade (see Milner & Mukherjee, 2009 for a review of the literature). However, if this effect does take time, it would be interesting to analyzing the economic significance of short term and long term effects of democracy and trade. 2.2 Direct and Indirect Effects of Democracy The literature treats measures of trade output and trade restrictions as substitute measures. Some studies use measures of trade output (Grofman & Gray, 2000; Eichengreen & Leblang, 2008; Yu, 2010). Other studies use measures of trade protections, usually including measures of tariff rates (Fidrmuc, 2001; Milner & Kubota, 2005; Giavazzi & Tabellini, 2005). However, these measures of trade are really complement measures. This is especially true when attempting to explain the variation in trade amounts as the dependent variable. In this case, measures of trade amounts such as exports and import values are also determined by trade protection measures, i.e., import amounts are affected by the prevailing tariff and regulatory restrictions policies.
One contribution of this study is that it analyzes the impact of democracy on trade output while also controlling for the degree of trade protection. Most studies do not take this into consideration in their empirical examination. This study also analyzes the impact of democracy on trade output and trade policy using the same data, controls, and empirical identification. This enables the researcher to directly compare whether the impact of democracy on trade is larger for the direct effect (trade output) or the indirect effect (trade policy).
3. DATA The data used in this study are gathered from a variety of sources at the country level for the years 1970-2010. There are two main measures of trade used in this study. The first is a measure of trade output, which comes from the World Bank. It is the total merchandise trade, and it is computed as the sum of exports and imports as a percentage of GDP. The second measure captures the indirect effect of trade policy and regulations. This measure is taken from area four of the 2012 Fraser Institute's Economic Freedom of the World Index. This fourth area captures the freedom of a country to trade internationally. This measure is a simple average of four sub components: (i) tariffs, (ii) regulatory trade barriers, (iii) black market exchange rates, and (iv) controls of the movement of capital and people. It is available on a five year basis from 1970-2000, and it is available annually after that.
290

The main explanatory measure of interest is the Polity2 measure taken from the Polity IV index. This is used as the primary measure of political institutions. In addition, a dummy for democracy is also utilized as an additional explanatory measure of interest, and it is also derived from the Polity IV index. In addition to the main measures of the dependent variable and explanatory variables, there are many control variables that must be considered.
Income data are measured by membership in the Organization for Economic Cooperation and Development (OECD). These data are gathered from the OECD website, which lists the OECD members and the date of membership. World Trade Organization (WTO) membership (formerly the GATT) is also gathered in a similar manner. These data are gathered from the WTO website, which lists the member country and the date it joined the GATT or the WTO if it joined more recently. Population size is gathered from the World Bank, which lists the population of more than 100 countries for the period of study from 1970-2010. Finally, additional measures are gathered for data on the capital stock and human capital of each country. These data are gathered from the Penn World Tables, version 08. All of these data are summarized in Table 1.
4. IDENTIFICATION STRATEGY The hypothesis that democracy effects trade, and it has a differential, intertemporal effect is testable, and the form of the base equation estimated is specified as follows:
(1)
Where Tit indicates the trade of country i at time t. α, β, and δ are unknown parameters, and ε is the error term. The dependent variable, T, is a vector of trade output and trade protection. It is comprised of a measure of trade output, merchandise trade, which is defined as the sum of exports and imports as a percentage of GDP. This vector also includes a measure of trade restrictions taken from area four of the EFW index. This measure is the simple average of four sub-components: (i) freedom from tariffs, (ii) freedom from regulatory trade barriers, (iii) freedom from black market exchange rates, and (iv) freedom from the restriction of the movement of capital and people.
The explanatory variable of interest, P, contains two measures of political institutions. The first and main measure of political institutions is taken from the Polity2 variable from the Polity IV index. This measure is scored on a scale of -10 to 10 where -10 describes a complete autocracy and 10 describes a complete democracy. The second measure is a dummy, Democracy. It takes a value of 1 if the country's Polity2 score is positive, and it takes a value of 0 if its Polity2 score is negative. The former political institutional variable is much more descriptive because two countries may be classified as democracies in the latter but have completely different Polity2 scores. Therefore, the Polity2 measure will be the main measure utilized in this study, and the democracy dummy variable will be used as a check towards the robustness of the findings.
291

X is a vector of controls representing exogenous decision factors purported to influence trade protection and trade liberalization. The first explanatory variable that must be considered when analyzing the variation in trade is the level of economic development of a country. Higher income countries may trade more. However, one problem that is rarely addressed in this literature is the endogenous relationship between trade and income. Most studies include income, Real GDP growth, or log of GDP as an additional explanatory variable, but it is most likely true that trade also effects income leading to endogeneity issues that stem from reverse causality. As such, introducing an endogenous control variable may add more problems than it prevents. Therefore, this study utilizes a proxy for income, which is expected to control for the impact of income on trade without introducing any endogeneity. The proxy measure used in this study is a dummy for OECD membership. OECD or Organization for Economic Cooperation and Development serves the purpose of capturing the income effect of trade because higher income countries are generally part of the OECD whereas lower income countries are not. It also mitigates the endogenous relationship between income and trade because it is unlikely that trade causes OECD membership, thus avoiding potential reverse causality issues. To our knowledge, this is the first study to recognize and control for this potentially endogenous issue. In addition to income measures, a few other control variables must be considered.
Trade agreement membership may also be an important determinant of trade because many countries are required to reduce trade barriers as a condition of joining the WTO (formerly the GATT). Membership in the WTO represents an ongoing agreement to open trade channels with other countries. Therefore, membership in these agreements are purported to influence trade. A movement from a 0 to 1 in the data for this study represents a country joining the WTO, and it analyzes its impact on trade over time. In addition to country membership, country characteristics such as demographic changes may affect international trade.
A country's size may be an important determinant of international trade through its geographical size (i.e., square miles or distance to trading centers) and the size of its population. However, the geography variables are all time-invariant measures, and fixed effects models involving a within-analysis framework drop all variables that are time-invariant and idiosyncratic to each country. Therefore, this study only adds the size of the population as a demographic determinant of trade. The geographical measures are built into the fixed effects model, ceteris paribus. It may be the case that large countries trade less (e.g. China and India) and small countries trade more (e.g. Hong Kong and Singapore). Controlling for population size also helps to analyze the impact of a growing population on trade within a country.
Mayer (1984) and Yang (1995) suggest that in a Hecksher-Ohlin world, the Stolper-Samuelson Theorem explains how individuals stand to gain or lose from changes in trade policy given their allocations of labor and capital. Developing countries have less capital than labor, and their trading partners tend to be more developed economies, which tend to be capital-intensive importing sectors. The high-skilled workers in capital intensive economies favor trade openness. Similarly, the low-skilled workers in labor abundant economies favor trade openness. (Jäkel & Smolka, 2013).
292

4.1 Instrumental Variables - Controlling for Reverse Causality Some studies have suggested that in addition to democracy causing more trade, it may also be true that trade causes more democracy. The argument is as follows: countries that trade more with others, will end up adopting more customs and culture from their trading partners. Trade allows the free transmission of information and knowledge, with democratic institutions as no exception. Therefore, it is a possibility that trade also predicts democratic liberalization. A few studies do support this view (Acemoglu & Robinson, 2006; Adsera & Boix, 2002; Boix 2003; Boix & Garicano, 2001; Eichengreen & Leblang, 2008). However, a recent review of the literature on international political economy and trade (Milner & Mukherjee, 2009) casts doubt on this view. They summarize the literature and find scant evidence towards the argument that trade causes more democracy. This is a view also shared by Yu (2010). Nevertheless, a good study takes all possible issues into consideration, and this study mitigates concerns of endogeneity by utilizing an instrument, durable, which is the measure of time a country has been consistently autocratic or consistently democratic. This measure is purported to be related to democracy but unrelated to trade.
The equation in model (1) now has an additional reduced form equation to be modeled in the first stage of the model. This reduced form model is specified as follows:
(2)
where P is the measure of political institutions for a country i during time t. γ and δ are parameters to be estimated. The instrument, D, is the measure of durability of a country's political institution, which is taken from the Polity IV index. The set of covariates, X, is included in the second stage of the regression in (1), and it is also included in the reduced form model in (2). is the error term from the estimation.
In order for the instrument to be valid, it must satisfy two conditions: (i) the instrument
must be relevant, and (ii) the instrument must satisfy the exclusion restriction. In addition, the instrument must also pass a few statistical tests for strength and validity. The relevant test statistics are reported in Table 2 and Table 3. Table 2 describes the relationship between democracy and trade under the assumption that the relationship is exogenous, and Table 3 examines this relationship under the assumption that it is endogenous. The strength and validity of the instrument is assessed in the next section.
5. RESULTS
The first result for the hypothesis that democracy impacts trade output can found in Table 2. This table tests this hypothesis in three different time intervals: (i) 5 years, (ii) 10 years, and (iii) 20 years. Here, time intervals refer to the frequency of data collection. Because institutions take time to develop, it is more realistic to capture variation in democracy and trade over 5, 10, or 20 year periods rather than using annual data.
293
The dependent variable in Table 2, Trade output, is measured as the value of imports and exports as a percentage of GDP. Overall, there is a strong statistical relationship between democracy and trade using Polity2 as the measure of democracy in all six specifications, and the results suggest an interesting finding. Democracy and trade output are positively correlated and the impact of democracy on trade doubles from the short term (5 years) to the long term (20 years). Because the specification is log-linear, the coefficients can be interpreted as percentages on the left hand side of the equation. Therefore, a 1 point increase in Polity2 is associated with a 0.8% increase in trade in the short term and a 1.8% increase in trade in the long term. More importantly, it emphasizes that the economic impact of democracy may take time to influence trade.
WTO and OECD membership exhibit positive relationships with trade, but their relationships are very fragile; the dummy variable, WTO, only rejects the null hypothesis at the chosen level of statistical significance (p<0.05) in column 5, which analyzes the relationship between democracy and trade in twenty year intervals. Thus, joining the WTO may increase trade, but it increases trade over the long term.
Country size may also be a determinant of international trade. The results from Table 2 suggest that increasing a country's population is inversely related with trade output, but this is only true in 10 year intervals. There is no statistical relationship between population and trade in the short or long term.
In contrast to the previous control variables, capital stock maintains a positive and statistically significant relationship with trade in most of the specifications. An increase of 100,000 in the capital stock is associated with a 1.5% to 2.7% increase trade.
The measure of trade protection, EFW4, never exhibits a statistically significant relationship with trade. This is surprising due to the strong bi-variate correlation between EFW4 and Trade (33% in five year periods and 37% in 20 year periods). Therefore, this lack of a statistical finding suggests that most of the relationship between trade policy and trade output stems from differences between countries; while countries with fewer trade restrictions might have more trade than countries with more trade restrictions in a comparison between countries, the same result does not hold when analyzing reductions in trade restrictions and its impact on trade within countries. This lack of a finding suggests that much of the variation in trade protection can be explained through other factors idiosyncratic to each country.
Table 3 examines the relationship between democracy and trade under the assumption that democracy and trade are endogenously determined. This model takes advantage of an instrument, durable, which is correlated with democracy and uncorrelated with trade. In order for the instrument to be valid, it must satisfy two conditions: (1) The instrument must be relevant, and (2) the instrument must satisfy the exclusion restriction. We begin our discussion with the relevance assumption.
First, the instrument must be correlated with the explanatory variable of interest. For the instrument to be strong, it needs to be correlated with the endogenous regressor in the model (Polity2, EFW4). The instrument, Durable, is expected to be correlated with political institutions.
294
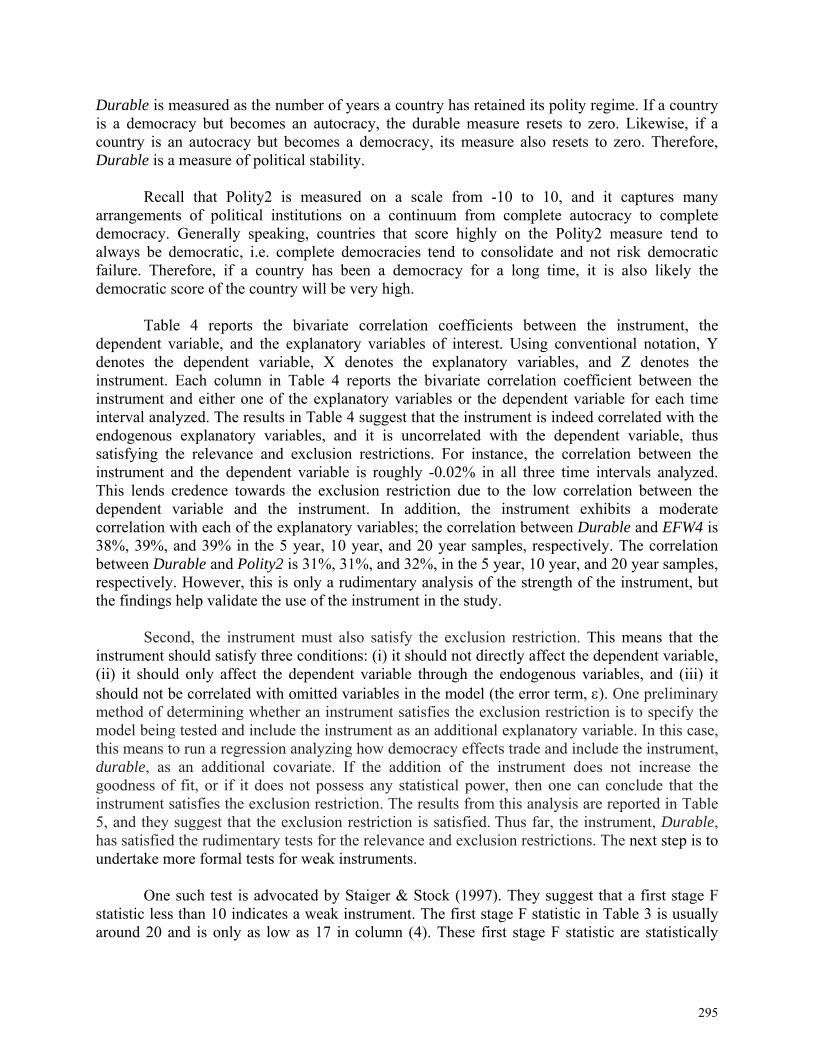
Durable is measured as the number of years a country has retained its polity regime. If a country is a democracy but becomes an autocracy, the durable measure resets to zero. Likewise, if a country is an autocracy but becomes a democracy, its measure also resets to zero. Therefore, Durable is a measure of political stability.
Recall that Polity2 is measured on a scale from -10 to 10, and it captures many arrangements of political institutions on a continuum from complete autocracy to complete democracy. Generally speaking, countries that score highly on the Polity2 measure tend to always be democratic, i.e. complete democracies tend to consolidate and not risk democratic failure. Therefore, if a country has been a democracy for a long time, it is also likely the democratic score of the country will be very high.
Table 4 reports the bivariate correlation coefficients between the instrument, the dependent variable, and the explanatory variables of interest. Using conventional notation, Y denotes the dependent variable, X denotes the explanatory variables, and Z denotes the instrument. Each column in Table 4 reports the bivariate correlation coefficient between the instrument and either one of the explanatory variables or the dependent variable for each time interval analyzed. The results in Table 4 suggest that the instrument is indeed correlated with the endogenous explanatory variables, and it is uncorrelated with the dependent variable, thus satisfying the relevance and exclusion restrictions. For instance, the correlation between the instrument and the dependent variable is roughly -0.02% in all three time intervals analyzed. This lends credence towards the exclusion restriction due to the low correlation between the dependent variable and the instrument. In addition, the instrument exhibits a moderate correlation with each of the explanatory variables; the correlation between Durable and EFW4 is 38%, 39%, and 39% in the 5 year, 10 year, and 20 year samples, respectively. The correlation between Durable and Polity2 is 31%, 31%, and 32%, in the 5 year, 10 year, and 20 year samples, respectively. However, this is only a rudimentary analysis of the strength of the instrument, but the findings help validate the use of the instrument in the study.
Second, the instrument must also satisfy the exclusion restriction. This means that the
instrument should satisfy three conditions: (i) it should not directly affect the dependent variable, (ii) it should only affect the dependent variable through the endogenous variables, and (iii) it should not be correlated with omitted variables in the model (the error term, ). One preliminary method of determining whether an instrument satisfies the exclusion restriction is to specify the model being tested and include the instrument as an additional explanatory variable. In this case, this means to run a regression analyzing how democracy effects trade and include the instrument, durable, as an additional covariate. If the addition of the instrument does not increase the goodness of fit, or if it does not possess any statistical power, then one can conclude that the instrument satisfies the exclusion restriction. The results from this analysis are reported in Table 5, and they suggest that the exclusion restriction is satisfied. Thus far, the instrument, Durable, has satisfied the rudimentary tests for the relevance and exclusion restrictions. The next step is to undertake more formal tests for weak instruments.
One such test is advocated by Staiger & Stock (1997). They suggest that a first stage F statistic less than 10 indicates a weak instrument. The first stage F statistic in Table 3 is usually around 20 and is only as low as 17 in column (4). These first stage F statistic are statistically
295
significant and exceeds 10. Therefore, the instrument passes the first rule of thumb provided by Staiger & Stock (1997). However, as Cameron & Trivedi (2009) suggest, this rule of thumb is ad hoc and may not be conservative enough when there are many overidentifying restrictions. Because there is only one instrument utilized in this study, the instrument is just identified, and there is no need to worry about overidentifying restrictions. Nonetheless, one reasonable argument could suggest that this rule of thumb is not enough to verify the strength of an instrument.
An alternative guideline for assessing the strength of instruments is to follow the advice
put forth by Stock & Yogo (2005). Their guidelines provide more flexibility on the minimum value of 10 for the first stage F statistic. According to Table 2 in Stock & Yogo (2005), an equation just identified with n=1, r=0.10, and K2=1, yields a critical value of 16.38. Here, n refers to the number of endogenous explanatory variables, r refers to the desired maximum size of a 5% Wald test, and K2 refers to the number of instruments. Therefore, if the critical value in our estimation exceeds the critical value of 16.38, we can have more confidence that the instrument is strong. The Cragg-Donald Wald F statistic is used as a benchmark for comparison to the critical values in Table 2 of Stock & Yogo (2005). The Cragg-Donald Wald F statistic ranges from 153-195 in the 5 year sample, 57-82 in the 10 year sample, and 26-43 in the 20 year sample in Table 3. Therefore, this test suggests that the instrument is strong in all three samples.
In summary, all four weak instrument tests have rejected the null hypothesis that the
instrument is weak. The correlation table (Table 4) suggests that the instrument is relevant. Table 5 suggests that the instrument satisfies the exclusion restriction due to the statistical insignificance of including the instrumental variable in the second stage regression. Furthermore, the minimum first stage F statistic benchmark provided by Staiger & Stock (1997) is satisfied, and the Cragg-Donald Wald F statistic exceeds the critical value of 16.38 as suggested by Stock & Yogo (2005). The specifications provide a sizeable goodness-of-fit, as measured by the F test, which captures the joint significance of the model. Now that we can be reasonably confident that the instrument is strong, the results in Table 3 can be analyzed in more detail.
The results do change slightly under the assumption that democracy and trade are
endogenously related in Table 3. Democracy is no longer statistically related to trade in either five or ten year intervals, though the p-value in column (3) is 0.054, which is enough to reject at the 10% level for a two-tailed test but not enough to reject at the 5% level. However, in contrast to the 5 and 10 year intervals, democracy remains related to trade in twenty year periods. In addition, modeling this endogenous relationship, exhibits a much larger economic effect of democracy on trade. Previously, the twenty year interval specification suggested that increasing Polity2 by 1 unit is correlated with a 1.8% increase in trade. After controlling for potential endogeneity, this economic effect increases in size such that a 1 unit increase in Polity2 is now associated with a 3% increase in trade over twenty years. Therefore, the results in Table 3 in conjunction with Table 2 suggest that democracy is positively associated with trade, and the economic effect of democracy on trade is largest in the long term.
Similar to the previous specifications, WTO and OECD memberships exhibit statistical but fragile effects on trade, although the effects on trade are more robust than exhibited previously. OECD membership is only statistically related with trade in a five year period, and
296
only in the specification that excludes trade policy as a determinant of trade output. In contrast, WTO membership is only statistically related with trade in a twenty year interval.
Table 6 switches the focus from the direct effect of democracy on trade towards the indirect effect; democracy may affect trade policies, which effect trade output. In contrary to the direct measures, there is much less evidence towards the efficacy of democracy in reducing trade barriers. The one exception is the short term. Using five year intervals, the estimate from column 1 of Table 6 suggests that democracy is associated with a reduction in trade restrictions. This corroborates the view that democracy possesses a statistically significant and inverse relationship with trade restrictions (Harrigan, 1993; Leamer 1988; Rodrik, 1994; Treffler, 1993) because larger numbers in the EFW index mean the freedom from trade restrictions. However, this result is very fragile as it does not retain statistical significance when estimating the relationship in longer time intervals and under the assumption that the relationship is endogenous. Still, the results may suggest that the indirect and direct effect of democracy work in opposite directions. Taken together, the results suggest that democracy reduces trade restrictions in the short term, and it increases trade amounts in the long term. Therefore, the adage that institutions take time to develop may be especially useful here.
Table 7 repeats these exercises using an alternative explanatory variable as a robustness check. This variable, Democracy, is a dummy with a value of 1 if a country has a Polity2 score that is positive, and a 0 if a country has a Polity2 score that is negative. Using this alternative definition is less precise than using actual Polity2 measures, but it helps to assess the robustness of the results. In addition, this measure allows one to gauge the economic magnitude of democratization in terms of trade output. For instance, Mansfield, Milner, & Rosendorff (2000) find that regime type matters for trade; trade between an autocracy and democracy is 15% lower on average than trade between a pair of democracies or autocracies. Eichengreen & Leblang (2008) find that democracy increases trade using a dichotomous measure similar to the one used in this study. Therefore, this alternative measure should serve its purpose as a robustness check and help ascertain the economic effect of regime change.
The results in Table 7 suggest that the previous results were not merely coincidence; the estimation using this alternative explanatory measure of political institutions supports the previous findings. That is, democracy is positively associated with trade output in all three specifications, its economic magnitude increases over time, and the results are stronger in the long term than in the short term under the assumption that trade and democracy are endogenously determined.
The variable, Democracy, possesses a positive and statistically significant relationship with trade output in each OLS specification and in the twenty year interval period when using IV methods. The coefficient, 0.50, in column (6) suggests that if a country changes from an autocratic regime to a democratic regime, it will experience a 50% increase in trade over twenty years, ceteris paribus. This is a larger effect than in the five or 10 year period of study where democratization leads to a 25% and 30% increase in trade, respectively. A more conservative OLS estimate suggests that democratization leads to an 19% increase in trade over a twenty year period, under the assumption that democracy and trade are determined exogenously. Either way, democratization leads to a sizeable increase in trade over the long term.
297
As tested previously, the instrument, Durable, passes the weak instrument tests when the alternative explanatory measure, Democracy, is utilized in Table 7. The first stage F statistic always exceeds 10 (Staiger & Stock, 1997), and the Cragg-Donald Wald F statistic exceeds the critical value of 16.38 (Stock & Yogo, 2005).
6. DISCUSSION OF THE RESULTS The main results from this analysis are two-fold: (1) democracy matters for trade but it matters more in the long term, and (2) democracy impacts trade directly but not very much indirectly through trade protection. Democracy only impacts trade protection in the short term.
There are a few reasons why democracy may take time to affect trade. First, democratic reforms work through multiple channels. Democracy could reduce conspicuous trade barriers, but it may also simultaneously increase less transparent trade barriers (Kono, 2006). Assuming that the conspicuous trade barriers are reduced more than the obfuscated trade barriers increase, there is a net increase in trade liberalization. Even under this assumption, it may take time for democracy to work through the channel of trade policy and then through actual trade outcomes. Democracy and trade is not the first relationship where time is of central importance.
Rode & Gwartney (2012) discuss how democratization takes time to influence market liberalization. However, they find that democratization leads to greater increases in economic freedom in the short run and lesser increases in the long run. Similarly, Rock (2009) finds that democratization leads to an increase in corruption in the short run and a decrease in corruption in the long run. Both of these studies identify a period of 10-12 years as their turning points. Therefore, this study also contributes to this literature by providing evidence towards the long run effect of democracy on trade.
The results from this study suggest that democratic reforms affect trade policy in the short term and then trade output in the long term. Most democratic reforms do not occur over time, and there is much experimentation through trial and error. Further complicating the issue, there is always a risk for democratic failure. Assuming that democratic reforms do pass and begin to persist, it takes time for their effects to be felt in the economy. This study suggest the largest effects are felt in the long term after democratic reforms have had time to stick (Boettke et al., 2008).
7. CONCLUSION
This study addresses two important questions: (1) How does democracy affect trade over time and (2) does democracy affect trade output when trade restrictions are taken into consideration? The key findings in this study suggest that democracy does affect trade output, even after controlling for differences in trade policies. Using a panel of more than 100 countries from 1970-2010 suggests that democracy affects trade, but its effect is much larger in the long term. Thus, the economic effects of democracy can be felt much more over time.
298
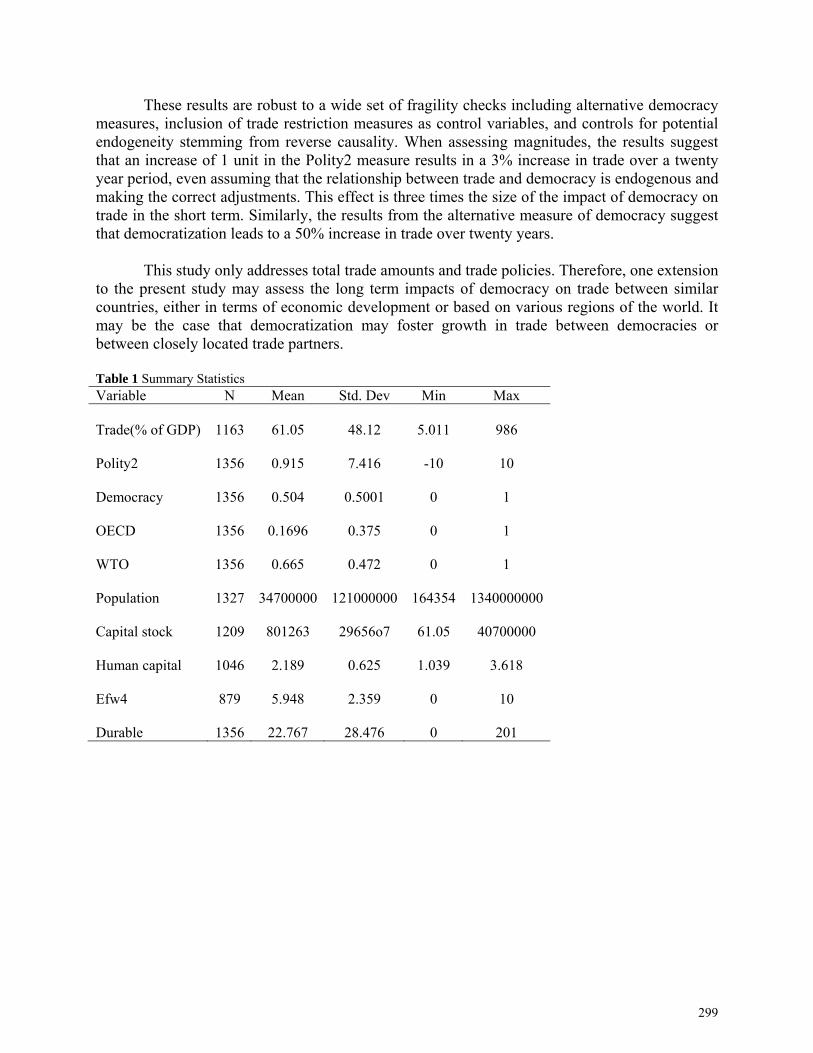
These results are robust to a wide set of fragility checks including alternative democracy measures, inclusion of trade restriction measures as control variables, and controls for potential endogeneity stemming from reverse causality. When assessing magnitudes, the results suggest that an increase of 1 unit in the Polity2 measure results in a 3% increase in trade over a twenty year period, even assuming that the relationship between trade and democracy is endogenous and making the correct adjustments. This effect is three times the size of the impact of democracy on trade in the short term. Similarly, the results from the alternative measure of democracy suggest that democratization leads to a 50% increase in trade over twenty years.
This study only addresses total trade amounts and trade policies. Therefore, one extension
to the present study may assess the long term impacts of democracy on trade between similar countries, either in terms of economic development or based on various regions of the world. It may be the case that democratization may foster growth in trade between democracies or between closely located trade partners. Table 1 Summary Statistics Variable N Mean Std. Dev Min Max Trade(% of GDP) 1163 61.05 48.12 5.011 986 Polity2 1356 0.915 7.416 -10 10 Democracy 1356 0.504 0.5001 0 1 OECD 1356 0.1696 0.375 0 1 WTO 1356 0.665 0.472 0 1 Population 1327 34700000 121000000 164354 1340000000 Capital stock 1209 801263 29656o7 61.05 40700000 Human capital 1046 2.189 0.625 1.039 3.618 Efw4 879 5.948 2.359 0 10 Durable 1356 22.767 28.476 0 201
299
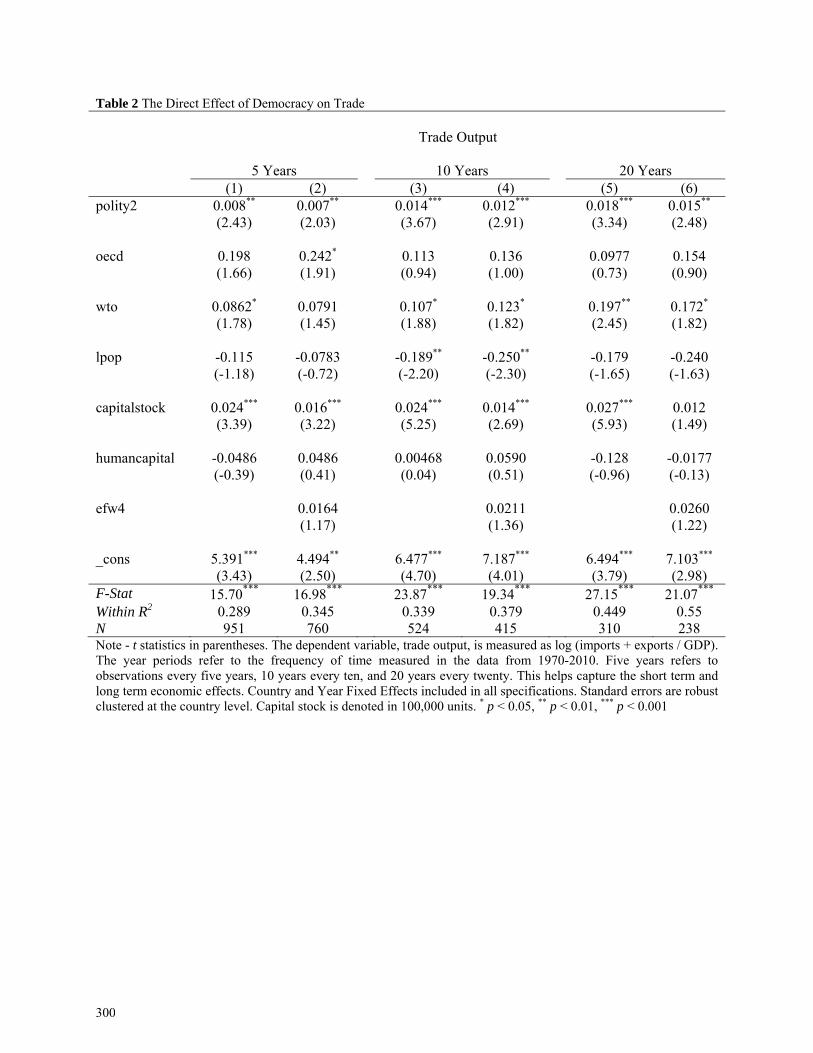
Table 2 The Direct Effect of Democracy on Trade Trade Output 5 Years 10 Years 20 Years (1) (2) (3) (4) (5) (6) polity2 0.008** 0.007** 0.014*** 0.012*** 0.018*** 0.015** (2.43) (2.03) (3.67) (2.91) (3.34) (2.48) oecd 0.198 0.242* 0.113 0.136 0.0977 0.154 (1.66) (1.91) (0.94) (1.00) (0.73) (0.90) wto 0.0862* 0.0791 0.107* 0.123* 0.197** 0.172* (1.78) (1.45) (1.88) (1.82) (2.45) (1.82) lpop -0.115 -0.0783 -0.189** -0.250** -0.179 -0.240 (-1.18) (-0.72) (-2.20) (-2.30) (-1.65) (-1.63) capitalstock 0.024*** 0.016*** 0.024*** 0.014*** 0.027*** 0.012 (3.39) (3.22) (5.25) (2.69) (5.93) (1.49) humancapital -0.0486 0.0486 0.00468 0.0590 -0.128 -0.0177 (-0.39) (0.41) (0.04) (0.51) (-0.96) (-0.13) efw4 0.0164 0.0211 0.0260 (1.17) (1.36) (1.22) _cons 5.391*** 4.494** 6.477*** 7.187*** 6.494*** 7.103*** (3.43) (2.50) (4.70) (4.01) (3.79) (2.98) F-Stat 15.70*** 16.98*** 23.87*** 19.34*** 27.15*** 21.07*** Within R2 0.289 0.345 0.339 0.379 0.449 0.55 N 951 760 524 415 310 238 Note - t statistics in parentheses. The dependent variable, trade output, is measured as log (imports + exports / GDP). The year periods refer to the frequency of time measured in the data from 1970-2010. Five years refers to observations every five years, 10 years every ten, and 20 years every twenty. This helps capture the short term and long term economic effects. Country and Year Fixed Effects included in all specifications. Standard errors are robust clustered at the country level. Capital stock is denoted in 100,000 units. * p < 0.05, ** p < 0.01, *** p < 0.001
300

Table 3 The Direct Effect of Democracy on Trade, Controlling for Potential Endogeneity Trade Output 5 Years 10 Years 20 Years
(1) (2) (3) (4) (5) (6) polity2 0.014 0.01 0.017* 0.017 0.027*** 0.032** (1.41) (1.02) (1.91) (1.63) (2.59) (2.35) oecd 0.176 0.232** 0.105 0.123 0.0879 0.156 (1.60) (2.00) (0.95) (1.01) (0.77) (1.12) wto 0.0806* 0.0790 0.105* 0.129 0.195** 0.213** (1.79) (1.48) (1.92) (1.83) (2.45) (2.04) lpop -0.128 -0.0930 -0.195** -0.283** -0.198* -0.365**
(-1.20) (-0.75) (-2.23) (-2.30) (-1.76) (-2.01) capitalstock 0.025*** 0.016*** 0.025*** 0.015*** 0.029*** 0.013 (3.62) (3.29) (5.41) (2.78) (6.41) (1.57) humancapital -0.0361 0.0502 0.00891 0.0583 -0.123 -0.0360 (-0.30) (0.44) (0.08) (0.52) (-0.97) (-0.31) efw4 0.0155 0.0195 0.0180 (1.04) (1.22) (0.84) First Stage F 21.46*** 22.72*** 20.10*** 17.40*** 21.36*** 14.44***
First Stage Prob. > F (0.000) (0.000) (0.000) (0.000) (0.000) (0.000) Cragg-Donald Wald F 194.624 152.672 82.203 57.037 42.639 26.384 F-Statistic 15.30*** 16.03*** 22.79*** 17.29*** 25.58*** 17.13***
N 949 760 522 415 293 221 Note - t statistics in parentheses. The dependent variable, trade output, is measured as log(imports + exports / GDP). The year periods refer to the frequency of time measured in the data from 1970-2010. Five years refers to observations every five years, 10 years every ten, and 20 years every twenty. This helps capture the short term and long term economic effects. Country and Year Fixed Effects included in all specifications. Standard errors are robust clustered at the country level. Capital stock is denoted in 100,000 units. * p < 0.05, ** p < 0.01, *** p < 0.001
301

Table 4 Correlation Table for the Instrument
Instrument, Z = Durable
5 year 10 year 20 year
Y Trade -0.0242 -0.0227 -0.0246
X1 Polity2 0.3074 0.3147 0.3161
X2 EFW4 0.3772 0.392 0.3861
Table 5 Testing Exclusion Restrictions: Adding Durable for a preliminary test of Instrument Strength Trade Output 5 year 10 year 20 year (1) (2) (3) polity2 0.007* 0.013*** 0.015** (1.79) (3.20) (2.53) oecd 0.197* 0.114 0.103 (1.70) (0.96) (0.80) wto 0.088* 0.108* 0.202** (1.79) (1.86) (2.46) lpop -0.132 -0.198** -0.208* (-1.21) (-2.21) (-1.89) humancapital -0.052 0.004 -0.138 (-0.42) (0.03) (-1.05) capitalstock 0.024*** 0.024*** 0.028*** (3.50) (5.32) (6.12) durable -0.001 -0.001 -0.002 (-0.68) (-0.40) (-1.01) _cons 5.672*** 6.627*** 6.997*** (3.22) (4.57) (4.02) N 951 524 310 Note - t statistics in parentheses. The dependent variable, trade output, is measured as log(imports + exports / GDP). The year periods refer to the frequency of time measured in the data from 1970-2010. Five years refers to observations every five years, 10 years every ten, and 20 years every twenty. This helps capture the short term and long term economic effects. Country and Year Fixed Effects included in all specifications. Standard errors are robust clustered at the country level. Capital stock is denoted in 100,000 units. * p < 0.05, ** p < 0.01, *** p < 0.001
302
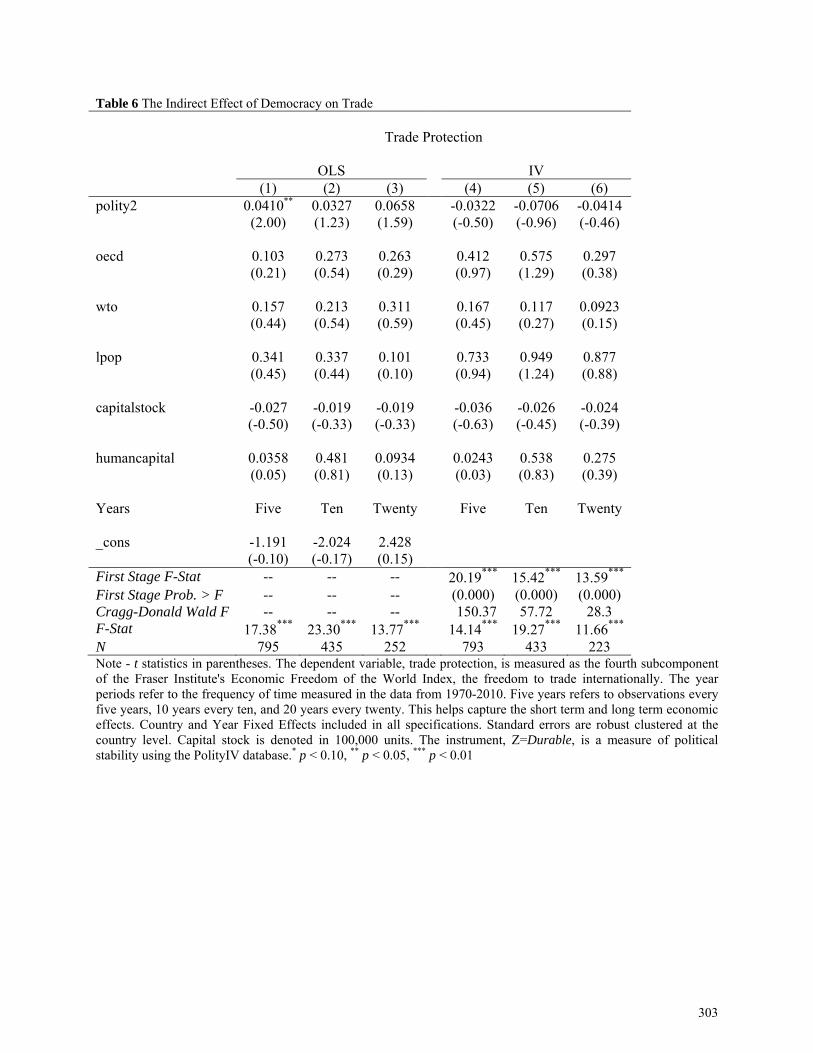
Table 6 The Indirect Effect of Democracy on Trade Trade Protection OLS IV (1) (2) (3) (4) (5) (6) polity2 0.0410** 0.0327 0.0658 -0.0322 -0.0706 -0.0414 (2.00) (1.23) (1.59) (-0.50) (-0.96) (-0.46) oecd 0.103 0.273 0.263 0.412 0.575 0.297 (0.21) (0.54) (0.29) (0.97) (1.29) (0.38) wto 0.157 0.213 0.311 0.167 0.117 0.0923 (0.44) (0.54) (0.59) (0.45) (0.27) (0.15) lpop 0.341 0.337 0.101 0.733 0.949 0.877 (0.45) (0.44) (0.10) (0.94) (1.24) (0.88) capitalstock -0.027 -0.019 -0.019 -0.036 -0.026 -0.024 (-0.50) (-0.33) (-0.33) (-0.63) (-0.45) (-0.39) humancapital 0.0358 0.481 0.0934 0.0243 0.538 0.275 (0.05) (0.81) (0.13) (0.03) (0.83) (0.39) Years Five Ten Twenty Five Ten Twenty _cons -1.191 -2.024 2.428 (-0.10) (-0.17) (0.15) First Stage F-Stat -- -- -- 20.19*** 15.42*** 13.59*** First Stage Prob. > F -- -- -- (0.000) (0.000) (0.000) Cragg-Donald Wald F -- -- -- 150.37 57.72 28.3 F-Stat 17.38*** 23.30*** 13.77*** 14.14*** 19.27*** 11.66*** N 795 435 252 793 433 223 Note - t statistics in parentheses. The dependent variable, trade protection, is measured as the fourth subcomponent of the Fraser Institute's Economic Freedom of the World Index, the freedom to trade internationally. The year periods refer to the frequency of time measured in the data from 1970-2010. Five years refers to observations every five years, 10 years every ten, and 20 years every twenty. This helps capture the short term and long term economic effects. Country and Year Fixed Effects included in all specifications. Standard errors are robust clustered at the country level. Capital stock is denoted in 100,000 units. The instrument, Z=Durable, is a measure of political stability using the PolityIV database.* p < 0.10, ** p < 0.05, *** p < 0.01
303

Table 7 Robustness Check - An Alternative Measure of Democracy Trade Output 5 Years 10 Years 20 Years
(1) (2) (3) (4) (5) (6) Democracy 0.105** 0.251 0.191*** 0.306* 0.19** 0.50** (2.00) (1.36) (3.51) (1.82) (2.42) (2.42) oecd 0.201* 0.163** 0.114 0.094 0.104 0.088 (1.76) (1.68) (1.00) (0.99) (0.77) (0.89) wto 0.085* 0.073 0.109* 0.105* 0.203** 0.206** (1.74) (1.64) (1.91) (1.92) (2.52) (2.47) lpop -0.114 -0.133 -0.191** -0.206** -0.179* -0.228* (-1.19) (-1.20) (-2.26) (-2.29) (-1.70) (-1.88) capitalstock 0.023*** 0.025*** 0.024*** 0.025*** 0.026*** 0.029*** (3.27) (3.58) (5.12) (5.38) (5.65) (6.39) humancapital -0.051 -0.027 -0.003 0.005 -0.138 -0.133 (-0.41) (-0.28) (-0.03) (0.04) (-1.05) (-1.11) Model? OLS IV OLS IV OLS IV First Stage F -- 13.28*** -- 10.61*** -- 12.27*** First Stage Prob. > F -- (0.000) -- (0.001) -- (0.0000)Cragg-Donald Wald F -- 87.48 -- 34.28 -- 18.4 F-Statistic 14.78*** 15.50*** 22.77*** 22.98*** 25.46*** 25.92*** N 953 952 525 523 311 294 Note - t statistics in parentheses. The dependent variable, trade output, is measured as log(imports + exports / GDP). The year periods refer to the frequency of time measured in the data from 1970-2010. Five years refers to observations every five years, 10 years every ten, and 20 years every twenty. This helps capture the short term and long term economic effects. Country and Year Fixed Effects included in all specifications. Standard errors are robust clustered at the country level. Capital stock is denoted in 100,000 units. The instrument, Z=Durable, is a measure of political stability using the PolityIV database * p < 0.05, ** p < 0.01, *** p < 0.001
304

REFERENCES
Acemoglu, D. & Robinson, J.A. (2006). Economic Origins of Dictatorship and Democracy. New York: Cambridge University Press.
Adsera, A., & Boix, C. (2002). Trade, democracy, and the size of the public sector: the political underpinnings of openness. International Organization,56(02), 229-262.
Alt, J. E., Frieden, J., Gilligan, M. J., Rodrik, D., & Rogowski, R. (1996).The Political Economy of International Trade Enduring Puzzles and an Agenda for Inquiry. Comparative Political Studies, 29(6), 689-717.
Baumol, W. (1990).Entrepreneurship: Productive, Unproductive, and Destructive. Journal of Political Economy, 98, 893-92l.
Becker, G. (1983). A Theory of Competition Among Pressure Groups for Political Influence. Quarterly Journal of Economics. 98, pp. 371-400.
Boettke, P. J., Coyne, C. J., & Leeson, P. T. (2008). Institutional stickiness and the new development economics. American Journal of Economics and Sociology, 67(2), 331-358.
Boix, C. (2003). Democracy and redistribution. Cambridge University Press. Boix, C., & Garicano, L. (2001). Democracy, Inequality, and Country-Specific
Wealth. Unpublished manuscript.. Department of Political Science, University of Chicago, 153.
Dawson, J. W. (2003). Causality in the freedom–growth relationship. European Journal of Political Economy, 19(3), 479-495.
Dutt, P., & Mitra, D. (2002). Endogenous trade policy through majority voting: an empirical investigation. Journal of International Economics, 58(1), 107-133.
Fidrmuc, J. (2003). Economic reform, democracy and growth during post-communist transition. European Journal of Political Economy, 19(3), 583-604.
Frey, B.S., Pommerehne, W., Schneider, F., and Gilbert, G. (1984). Consensus and Dissension among Economists: An Empirical Inquiry. The American Economic Review, Vol. 74, No. 5. pp. 986-994
Frey, B. S. (1984). The public choice view of international political economy. International Organization, 38(1), 199-223.
Friedman, M., & Friedman, R. (1990). Free to choose: A personal statement. Houghton Mifflin Harcourt.
Giavazzi, F., & Tabellini, G. (2005). Economic and political liberalizations. Journal of Monetary Economics, 52(7), 1297-1330.
Grofman, B., & Gray, M. (2000). Geopolitical Influences on Trade Openness in Thirty-One Long-Term Democracies, 1960-1995. Unpublished Paper, University of California, Irvine.
Grossman, G.M., & Helpman, E. (1994). Protection for sale. American Economic Review. 84:2, pp. 833-850.
305

Gwartney, J. D., Lawson, R., & Block, W. (1996). Economic freedom of the world: 1975-1995. Vancouver: Fraser Institute.
Harrigan, J. (1993). OECD imports and trade barriers in 1983. Journal of International Economics, 35(1), 91-111.
Jäkel, I. C., & Smolka, M. (2013). Individual attitudes towards trade: Stolper-Samuelson revisited. Open Economies Review, 24(4), 731-761.
Kono, D. Y. (2006). Optimal obfuscation: Democracy and trade policy transparency. American Political Science Review, 100(03), 369-384.
Krueger, A. (1974). The Political Economy of the rent-seeking Society. American Economic Review.64, pp.291-303.
Krugman, P. R. (1987). Is free trade passé?. The Journal of Economic Perspectives, 1(2), 131-144.
Learner, E. E. (1988). Cross-Section Estimation of the Effects of Trade Barriers. Empirical methods for international trade, 51-82.
Lundström, S. (2005). The effect of democracy on different categories of economic freedom. European Journal of Political Economy, 21(4), 967-980.
Mansfield, E. D., Milner, H. V., & Rosendorff, B. P. (2000). Free to trade: Democracies, autocracies, and international trade. American Political Science Review, 305-321.
Milner, H. V., & Kubota, K. (2005). Why the move to free trade? Democracy and trade policy in the developing countries. International organization, 59(01), 107-143.
Milner, H. V., & Mukherjee, B. (2009). Democratization and economic globalization. Annual Review of Political Science, 12, 163-181.
O'Rourke, K. H., & Taylor, A.M. (2006). Democracy and protectionism.. National Bureau of Economic Research, No. w12250
Peltzman, S. (1976).Toward a more general theory of regulation. Journal of Law & Economics, 19, 211-40.
Rock, M. T. (2009). Corruption and democracy. Journal of Development Studies, 45(1), 55-75. Rode, M., & Gwartney, J. D. (2012). Does democratization facilitate economic
liberalization?. European Journal of Political Economy, 28(4), 607-619. Rodrik, D. (1994). The rush to free trade in the developing world: Why so late? Why now? Will
it last? In Voting for Reform: Democracy, Political Liberalization, and Economic Adjustment, ed. Stephan Haggard and Steven B. Webb. New York: Oxford University Press. 61-88.
Rowley, C. K. (2001). The international economy in public choice perspective. The Elgar companion to public choice, 645-72.
Staiger, D., & Stock, J. H. (1997). Instrumental variables regression with weak instruments. Econometrica, 65(3), 557-586
Stigler, G.J. (1971). The theory of economic regulation. Bell Journal of Economics and Managements Science. 2, 3-21.
306
Stock, J. H., & Yogo, M. (2005). Testing for weak instruments in linear IV regression. Identification and inference for econometric models: Essays in honor of Thomas Rothenberg, 1.
Stokes, S. (2001). Mandates and democracy. Neoliberalism by Surprise in Latin America. Cambridge.
Tavares, J. (2008). Trade, factor proportions, and political rights. The Review of Economics and Statistics, 90(1), 163-168.
Trefler, D. (1993). Trade liberalization and the theory of endogenous protection: an econometric study of US import policy. Journal of Political Economy, 138-160.
Tullock, G. (1967). The welfare costs of tariffs, monopolies, and theft. Western Economic Journal, 5, 224-232
Tybout, J., Choi, E. K., & Harrigan, J. (2003). Handbook of international trade. Handbook of international trade.
Weyland, K. G. (2002). The politics of market reform in fragile democracies: Argentina, Brazil, Peru, and Venezuela. Princeton University Press.
Yang, C. (1995). Endogenous Tariff Formation under Representative Democracy: A Probabilistic Voting Model. The American Economic Review, 85(4): 956-963.
Yu, M. (2010). Trade, democracy, and the gravity equation. Journal of Development Economics, 91(2), 289-300.
307
Does Transition Towards Democracy Led to Trade Openness? The Case of Sub-Saharan Africa
JOHN KAGOCHI1
School of Business University of Houston-Victoria
Victoria, Texas, USA
NAZIF DURMAZ School of Business
University of Houston-Victoria Victoria, Texas, USA
There has been considerable research on the incidence of democracy on trade openness since the 1980's when revolution towards free trade and democracy erupted in the developing countries. Most studies have focused on Asian, Latin American, and former soviet bloc countries and few have focused on Sub-Saharan Africa (SSA). This study is an attempt to fill that gap uses a gravity model approach to test the effects of transition towards democracy in SSA. Our results are expected show that democracy has substantial impact on openness to trade and democratic countries will trade with other countries irrespective of their regime type. KEYWORDS Gravity Model, panel data, democracy, trade openness, Sub-Saharan Africa
1 Address correspondence to John Kagochi, University of Houston-Victoria, 3007 N Ben Wilson, Victoria, Texas, 77901, USA. Email: [email protected]
308

Emerging Markets and Value-at-Risk A Reflection for Multinational Enterprises
KASHI KHAZEH, PHD Department of Economics and Finance,
Salisbury University, Salisbury, Maryland, USA
LEONARD ARVI, PHD1 Department of Economics and Finance,
Salisbury University, Salisbury, Maryland, USA
EUGENE HAHN, PHD Department of Information Systems and Decision Sciences,
Salisbury University, Salisbury, Maryland, USA
This study focuses and compares the efficacy of two approaches of the transaction exposure (value-at-risk “VaR” and modified value-at-risk “MVaR”) for multinational enterprises (MNEs) conducting business in one and/or up to eight specific emerging markets for the duration of 2011-2103. These two approaches (VaR & MVaR) are then paralleled with the ex-post results. Particularly, not only the maximum 1-day loss is assessed and matched across the two aforementioned approaches, but also paralleled with actual results. These comparisons afford realistic evidence to assist MNEs to determine the level of their tolerance with respect to each version of value-at-risk over time. Moreover, these outcomes present MNEs useful information in defining if hedging this risk is warranted. If they decide to hedge, given that the real cost of hedging could be positive, MNEs need to contemplate as to which hedging technique (i.e., forward/futures, money market, and or option) to use. FIELD OF RESEARCH Finance
1 Address correspondence to Leonard Arvi, PhD., Department of Economics and Finance, Salisbury University, Salisbury, Maryland, USA. E-mail: [email protected]
309

Price Transmission and Volatility Spillovers in Asian Rice Markets: Evidence from a Panel GARCH Model
JIM LEE1
Texas A&M University-Corpus Christi, Corpus Christi, Texas, USA
HAROLD GLENN A. VALERA
University of Waikato, Hamilton, New Zealand
This study examines world rice price transmission and volatility spillovers across major Asian rice markets over the period 2005-2013. In addition to the conventional GARCH models, we use a panel GARCH framework to estimate the spillover effects along with the consideration of heterogeneity and interdependence among six countries—Bangladesh, China, India, the Philippines, Thailand and Vietnam. Empirical results suggest that changes in the world price of rice and the 2007-2008 price shocks affected not only the price levels of domestic rice markets but also their conditional variances. Moreover, interdependence across those rice markets contributed to a strong spillover of a price shock in one country to another within the region. KEYWORDS Rice market, price transmission, volatility spillover, GARCH, food policy JEL Q1, C3
1 Address correspondence to Jim Lee, Texas A&M University-Corpus Christi, Corpus Christi, Texas, USA. E-mail: [email protected]
310

1. INTRODUCTION
In an effort to maintain the welfare of domestic rice producers and consumers, policymakers in Asian developing countries must address the issues concerning volatility in rice prices and spillover effects from the world market. Surges in rice prices in 2007 and 2008 have renewed interest in the impact of both the levels and volatility of prices that the world rice market exerts on domestic markets.
An important aspect of the world’s rice markets is the debate over the implications of government policies used to insulate local markets from price changes in the rest of the world. Minot (2011) and Baltzer (2013) show that trade barriers, such as export quotas and import tariffs, reduce price transmission across countries. However, Timmer (2010) argues that policy actions undertaken by countries to stabilize domestic prices often produce spillover effects that ultimately increase world price instability. If government interventions through short-term trade policy actions are not at all effective, then these actions may facilitate full price transmission from the world to domestic markets. As such, ineffective trade interventions would raise both the levels and volatility of world prices. Furthermore, world and domestic prices would become more correlated.
A large body of literature has highlighted the role of policies in the extent of price
transmission and volatility spillovers between the world and domestic markets. Quiroz and Soto (1995), Baffes and Gardner (2003), Rapsomanikis et al. (2004), Imail et al. (2008), Dawe (2009) and Baltzer (2013) have provided evidence in support that government price stabilization policies lead to incomplete or low price transmission. However, Sharma (2002), Conforti (2004), Rapsomanikis (2011), Robles (2011), Goshray (2011), Alam et al. (2012), and John (2013) have also provided empirical support to a strong relationship between international and domestic agricultural commodity prices in the presence of government interventions.
A common feature of the above studies is that their empirical work is mostly confined to
time-series data of individual countries. Empirical work on individual time-series data, however, ignores the possibility that changes in one country’s rice price levels and their volatility could spill over to another country. Interdependence across Asian rice markets was evident during the 2007-08 rice “crisis” episode when trade policy actions by governments raised both the levels and volatility of world rice prices, which eventually affected their own markets. In particular, many observers believe that the rice export restrictions by India and Vietnam in 2007 and the Philippine National Food Authority’s rice import tenders for Vietnamese rice imports in early 2008 all contributed to sharp increases and high volatility in the world rice prices during that period. Between October 2007 and April 2008, world market rice prices tripled, reaching the highest levels ever recorded in nominal terms.
Against the above background, the objective of this paper is to conduct an empirical
investigation on recent price transmission and volatility spillovers across major rice markets in Asia, namely Bangladesh, China, India, the Philippines, Thailand and Vietnam. Those are among the world’s largest rice producers, and the Philippines is also the world’s largest rice importer. One distinction of our work is to capture possible interdependence across rice markets in those countries as well as their heterogeneity.
311

In the literature concerning developments in world rice markets, our work extends the recent studies of Ghoshray (2011), Rapsomanikis (2011) and John (2013). More specifically, instead of the conventional time-series framework found in those studies, we estimate both the mean and variance relationships between the world and domestic rice prices using the panel Generalized Autoregressive Conditional Heteroskedasticity (GARCH) framework recently advanced by Cermeño and Grier (2006), and Lee (2010). The GARCH approach allows us to shed light on historical changes in rice price uncertainty through the dynamics of the conditional variance and covariance processes. The extension of GARCH to the panel setting, which pools time-series and cross-section data together, enables us to evaluate both the nature and the size of rice price transmission and volatility spillovers while accounting for possible interdependence and heterogeneity across countries.
The rest of the paper is organized as follows. Section 2 outlines the conceptual
framework for the empirical study. Section 3 presents the panel GARCH model and the data. Section 3 discusses the empirical results. Section 4 concludes and draws policy implications.
2. CONCEPTUAL FRAMEWORK
In order to motivate our study concerning the recent price transmission from the world to domestic rice markets in Asia, we present a simplistic model of the law of one price (LOP). According to Fackler and Goodwin (2001), the LOP can be written in two alternative forms as
(1) (2)
where refers to the domestic price, denotes the world price, and τ corresponds to transportation and transaction costs in trade. Equation (1) represents the strong form of the LOP which, if the commodity is freely traded, indicates an integrated relationship between prices in the world and domestic markets. The price gap between the two markets is represented by transportation and transaction costs τ (Baltzer, 2013). This case holds only in the long run when price changes in the world market are completely and instantaneously transmitted to prices in the domestic markets. Complete integration of markets and price transmission imply that the price effect arising from changes in one country’s domestic supply and demand conditions will prompt trade with other countries. The implication is that domestic prices tend to equalize with the world price except for transport costs. In the short run, price transmission may be incomplete if the pass-through of price changes between the world and domestic markets is not immediate but occurs after some time.
Equation (2) represents the weak form of the LOP, which suggests that the price gap between the world and domestic prices of a commodity should be at most equal to the transactions costs. Let and represent, respectively, import parity and export parity price gap that is generated by the transportation and transactions costs. Based on this price gap, incentives for international arbitrage can occur in two ways (Baltzer, 2013). First, sufficiently large excess domestic supplies, which lower domestic prices below export parity, should ensure that domestic prices do not stay too far below export parity for too long. Second,
312
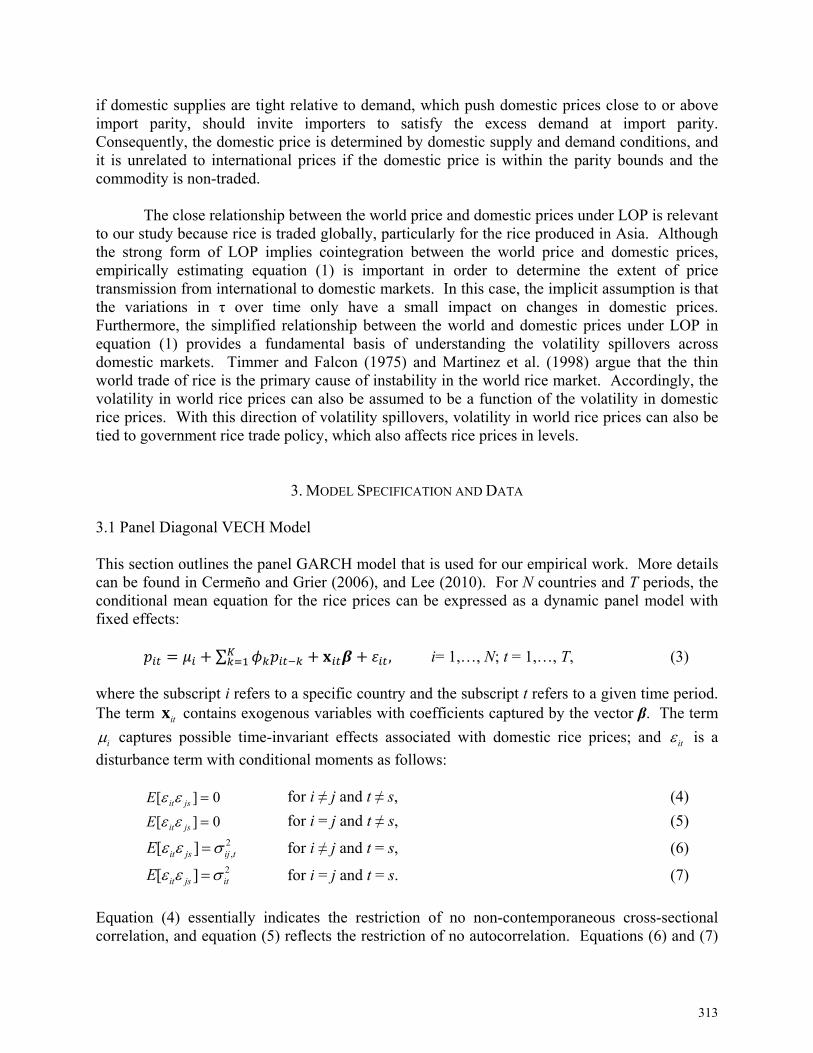
if domestic supplies are tight relative to demand, which push domestic prices close to or above import parity, should invite importers to satisfy the excess demand at import parity. Consequently, the domestic price is determined by domestic supply and demand conditions, and it is unrelated to international prices if the domestic price is within the parity bounds and the commodity is non-traded.
The close relationship between the world price and domestic prices under LOP is relevant
to our study because rice is traded globally, particularly for the rice produced in Asia. Although the strong form of LOP implies cointegration between the world price and domestic prices, empirically estimating equation (1) is important in order to determine the extent of price transmission from international to domestic markets. In this case, the implicit assumption is that the variations in τ over time only have a small impact on changes in domestic prices. Furthermore, the simplified relationship between the world and domestic prices under LOP in equation (1) provides a fundamental basis of understanding the volatility spillovers across domestic markets. Timmer and Falcon (1975) and Martinez et al. (1998) argue that the thin world trade of rice is the primary cause of instability in the world rice market. Accordingly, the volatility in world rice prices can also be assumed to be a function of the volatility in domestic rice prices. With this direction of volatility spillovers, volatility in world rice prices can also be tied to government rice trade policy, which also affects rice prices in levels.
3. MODEL SPECIFICATION AND DATA 3.1 Panel Diagonal VECH Model This section outlines the panel GARCH model that is used for our empirical work. More details can be found in Cermeño and Grier (2006), and Lee (2010). For N countries and T periods, the conditional mean equation for the rice prices can be expressed as a dynamic panel model with fixed effects:
∑ , i= 1,…, N; t = 1,…, T, (3)
where the subscript i refers to a specific country and the subscript t refers to a given time period. The term itx contains exogenous variables with coefficients captured by the vector β. The term
i captures possible time-invariant effects associated with domestic rice prices; and it is a
disturbance term with conditional moments as follows: [ ] 0it jsE for i ≠ j and t ≠ s, (4)
[ ] 0it jsE for i = j and t ≠ s, (5) 2,[ ]it js ij tE for i ≠ j and t = s, (6)
2[ ]it js itE for i = j and t = s. (7)
Equation (4) essentially indicates the restriction of no non-contemporaneous cross-sectional correlation, and equation (5) reflects the restriction of no autocorrelation. Equations (6) and (7)
313
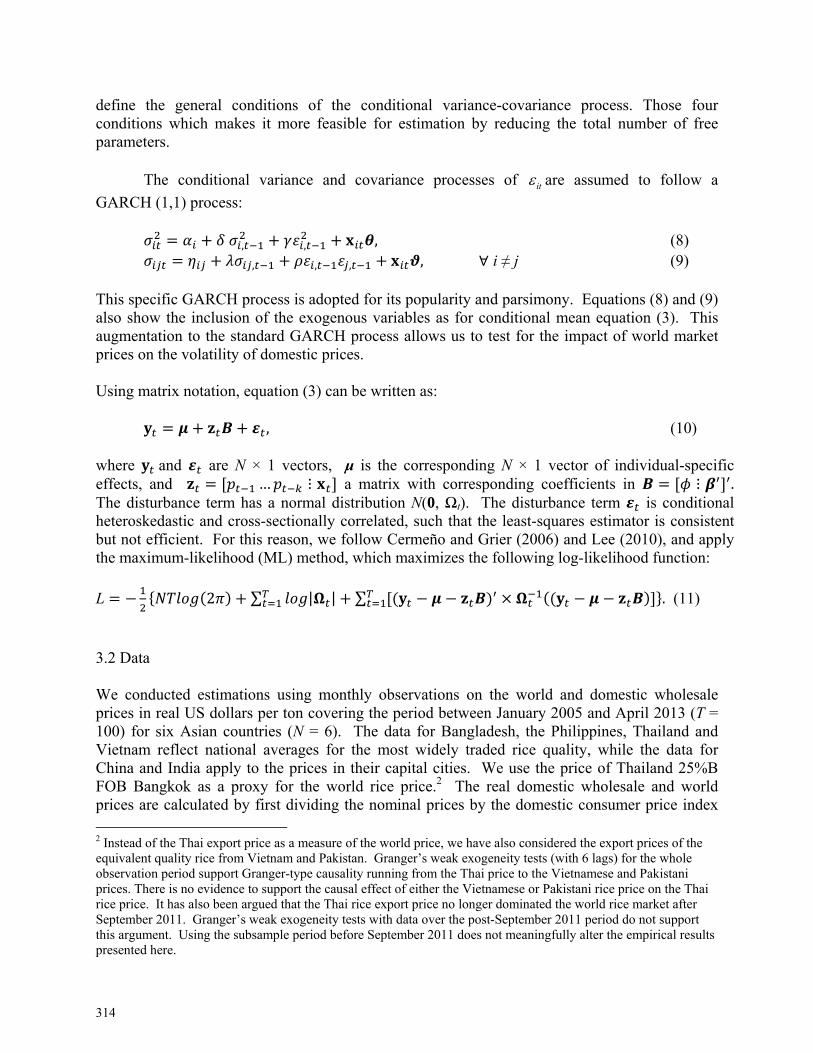
define the general conditions of the conditional variance-covariance process. Those four conditions which makes it more feasible for estimation by reducing the total number of free parameters.
The conditional variance and covariance processes of it are assumed to follow a
GARCH (1,1) process:
, , , (8) , , , , ∀ i ≠ j (9) This specific GARCH process is adopted for its popularity and parsimony. Equations (8) and (9) also show the inclusion of the exogenous variables as for conditional mean equation (3). This augmentation to the standard GARCH process allows us to test for the impact of world market prices on the volatility of domestic prices. Using matrix notation, equation (3) can be written as:
, (10) where and are N × 1 vectors, μ is the corresponding N × 1 vector of individual-specific effects, and … ⋮ a matrix with corresponding coefficients in ⋮ . The disturbance term has a normal distribution N(0, Ωt). The disturbance term is conditional heteroskedastic and cross-sectionally correlated, such that the least-squares estimator is consistent but not efficient. For this reason, we follow Cermeño and Grier (2006) and Lee (2010), and apply the maximum-likelihood (ML) method, which maximizes the following log-likelihood function:
L 2 ∑ | | ∑ . (11)
3.2 Data We conducted estimations using monthly observations on the world and domestic wholesale prices in real US dollars per ton covering the period between January 2005 and April 2013 (T = 100) for six Asian countries (N = 6). The data for Bangladesh, the Philippines, Thailand and Vietnam reflect national averages for the most widely traded rice quality, while the data for China and India apply to the prices in their capital cities. We use the price of Thailand 25%B FOB Bangkok as a proxy for the world rice price.2 The real domestic wholesale and world prices are calculated by first dividing the nominal prices by the domestic consumer price index 2 Instead of the Thai export price as a measure of the world price, we have also considered the export prices of the equivalent quality rice from Vietnam and Pakistan. Granger’s weak exogeneity tests (with 6 lags) for the whole observation period support Granger-type causality running from the Thai price to the Vietnamese and Pakistani prices. There is no evidence to support the causal effect of either the Vietnamese or Pakistani rice price on the Thai rice price. It has also been argued that the Thai rice export price no longer dominated the world rice market after September 2011. Granger’s weak exogeneity tests with data over the post-September 2011 period do not support this argument. Using the subsample period before September 2011 does not meaningfully alter the empirical results presented here.
314
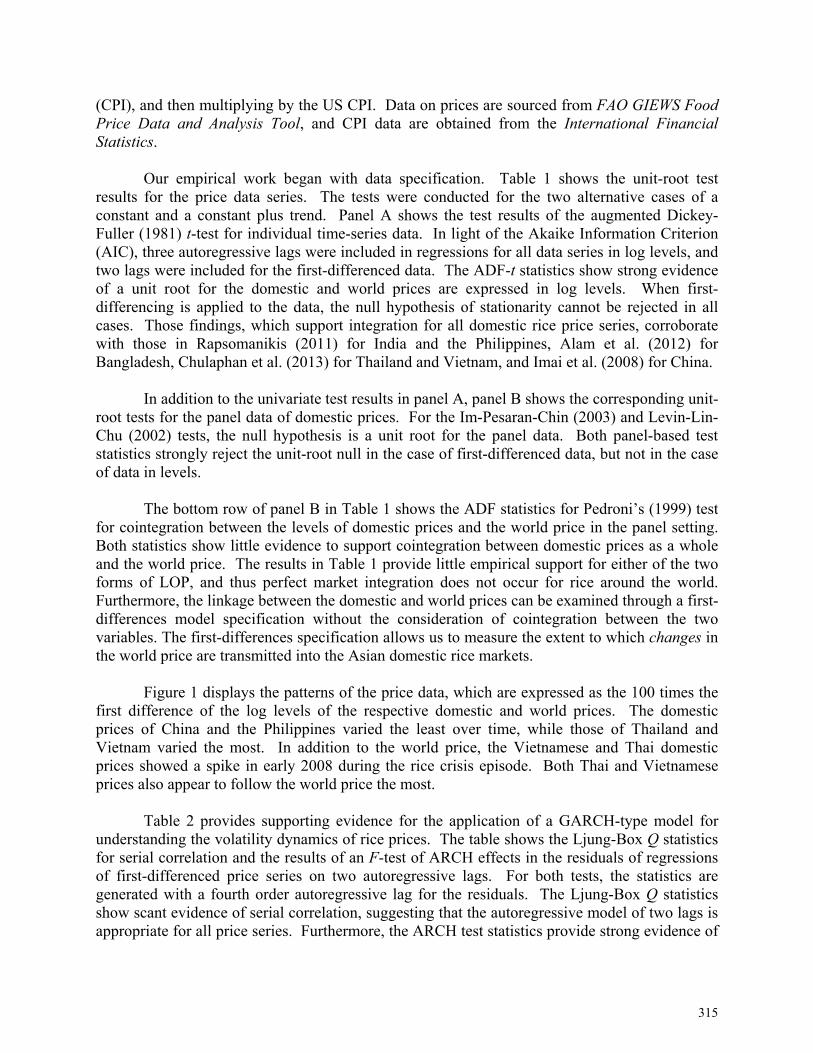
(CPI), and then multiplying by the US CPI. Data on prices are sourced from FAO GIEWS Food Price Data and Analysis Tool, and CPI data are obtained from the International Financial Statistics. Our empirical work began with data specification. Table 1 shows the unit-root test results for the price data series. The tests were conducted for the two alternative cases of a constant and a constant plus trend. Panel A shows the test results of the augmented Dickey-Fuller (1981) t-test for individual time-series data. In light of the Akaike Information Criterion (AIC), three autoregressive lags were included in regressions for all data series in log levels, and two lags were included for the first-differenced data. The ADF-t statistics show strong evidence of a unit root for the domestic and world prices are expressed in log levels. When first-differencing is applied to the data, the null hypothesis of stationarity cannot be rejected in all cases. Those findings, which support integration for all domestic rice price series, corroborate with those in Rapsomanikis (2011) for India and the Philippines, Alam et al. (2012) for Bangladesh, Chulaphan et al. (2013) for Thailand and Vietnam, and Imai et al. (2008) for China.
In addition to the univariate test results in panel A, panel B shows the corresponding unit-root tests for the panel data of domestic prices. For the Im-Pesaran-Chin (2003) and Levin-Lin-Chu (2002) tests, the null hypothesis is a unit root for the panel data. Both panel-based test statistics strongly reject the unit-root null in the case of first-differenced data, but not in the case of data in levels.
The bottom row of panel B in Table 1 shows the ADF statistics for Pedroni’s (1999) test
for cointegration between the levels of domestic prices and the world price in the panel setting. Both statistics show little evidence to support cointegration between domestic prices as a whole and the world price. The results in Table 1 provide little empirical support for either of the two forms of LOP, and thus perfect market integration does not occur for rice around the world. Furthermore, the linkage between the domestic and world prices can be examined through a first-differences model specification without the consideration of cointegration between the two variables. The first-differences specification allows us to measure the extent to which changes in the world price are transmitted into the Asian domestic rice markets.
Figure 1 displays the patterns of the price data, which are expressed as the 100 times the
first difference of the log levels of the respective domestic and world prices. The domestic prices of China and the Philippines varied the least over time, while those of Thailand and Vietnam varied the most. In addition to the world price, the Vietnamese and Thai domestic prices showed a spike in early 2008 during the rice crisis episode. Both Thai and Vietnamese prices also appear to follow the world price the most.
Table 2 provides supporting evidence for the application of a GARCH-type model for
understanding the volatility dynamics of rice prices. The table shows the Ljung-Box Q statistics for serial correlation and the results of an F-test of ARCH effects in the residuals of regressions of first-differenced price series on two autoregressive lags. For both tests, the statistics are generated with a fourth order autoregressive lag for the residuals. The Ljung-Box Q statistics show scant evidence of serial correlation, suggesting that the autoregressive model of two lags is appropriate for all price series. Furthermore, the ARCH test statistics provide strong evidence of
315
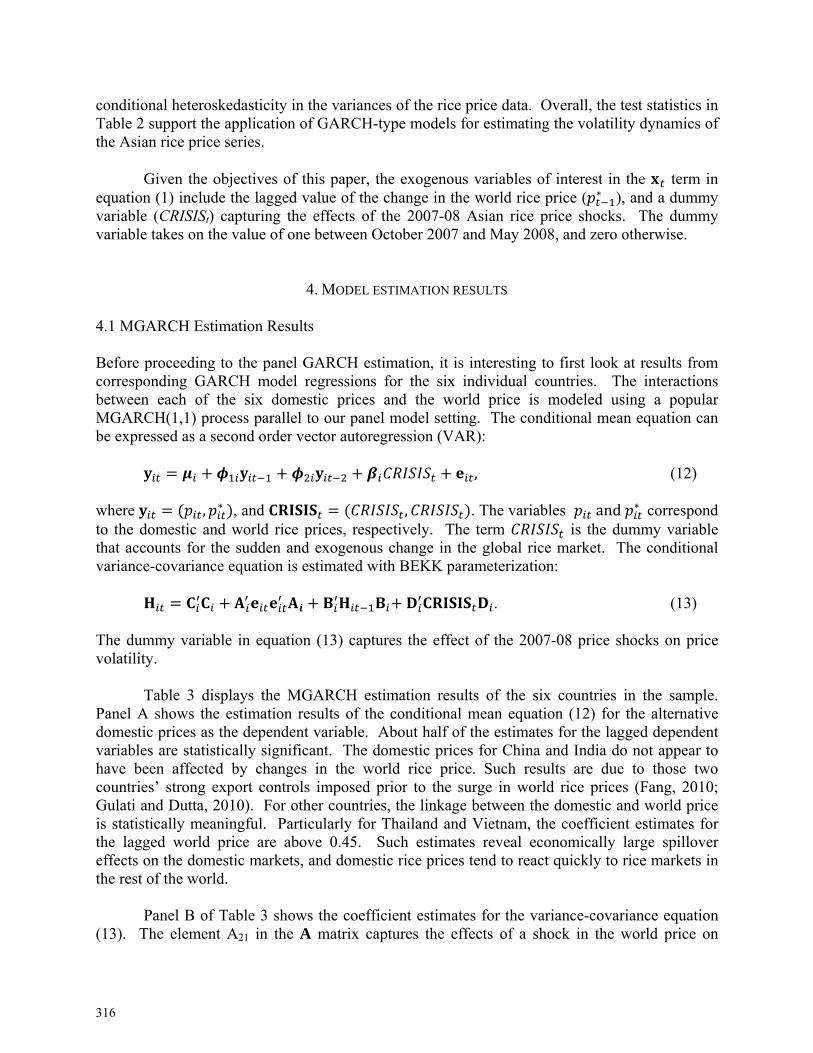
conditional heteroskedasticity in the variances of the rice price data. Overall, the test statistics in Table 2 support the application of GARCH-type models for estimating the volatility dynamics of the Asian rice price series.
Given the objectives of this paper, the exogenous variables of interest in the term in
equation (1) include the lagged value of the change in the world rice price ( ∗ ), and a dummy variable (CRISISt) capturing the effects of the 2007-08 Asian rice price shocks. The dummy variable takes on the value of one between October 2007 and May 2008, and zero otherwise.
4. MODEL ESTIMATION RESULTS
4.1 MGARCH Estimation Results Before proceeding to the panel GARCH estimation, it is interesting to first look at results from corresponding GARCH model regressions for the six individual countries. The interactions between each of the six domestic prices and the world price is modeled using a popular MGARCH(1,1) process parallel to our panel model setting. The conditional mean equation can be expressed as a second order vector autoregression (VAR):
, (12)
where , ∗ , and , . The variables and ∗ correspond to the domestic and world rice prices, respectively. The term is the dummy variable that accounts for the sudden and exogenous change in the global rice market. The conditional variance-covariance equation is estimated with BEKK parameterization: . (13) The dummy variable in equation (13) captures the effect of the 2007-08 price shocks on price volatility.
Table 3 displays the MGARCH estimation results of the six countries in the sample. Panel A shows the estimation results of the conditional mean equation (12) for the alternative domestic prices as the dependent variable. About half of the estimates for the lagged dependent variables are statistically significant. The domestic prices for China and India do not appear to have been affected by changes in the world rice price. Such results are due to those two countries’ strong export controls imposed prior to the surge in world rice prices (Fang, 2010; Gulati and Dutta, 2010). For other countries, the linkage between the domestic and world price is statistically meaningful. Particularly for Thailand and Vietnam, the coefficient estimates for the lagged world price are above 0.45. Such estimates reveal economically large spillover effects on the domestic markets, and domestic rice prices tend to react quickly to rice markets in the rest of the world.
Panel B of Table 3 shows the coefficient estimates for the variance-covariance equation
(13). The element A21 in the A matrix captures the effects of a shock in the world price on
316

individual domestic prices. Estimates are empirically meaningful for all countries except India. India has kept its domestic rice prices below international prices for most years using domestic price stabilization policies and export restrictions (Gulati and Dutta, 2010). The estimates for the element B21 in the B matrix reflect the extent to which volatility in the world price affects volatility in domestic prices. Estimates are statistically significant for the Philippines and Thailand, but not for the other Asian countries. The results for the Philippines are consistent with those reported by Rapsomanikis (2011), who argued that rice price instability arose from the government’s imposition of export and import restrictions especially during the 2008 rice crisis. The estimate for Thailand reflects the uncertainty over the government’s policy on selling its rice stocks from the paddy pledging program, which contributed to the greater price fluctuations (Poapongsakorn, 2010).
The elements A12 and B12 reflect the impacts of changes in the domestic markets on the
world market. More specifically, A12 shows the extent to which a shock to a country’s rice market affects the world rice price, and B12 shows how much volatility in domestic rice prices affects the volatility in the world rice price. The estimate for A12 is statistically significant for all countries except China. The positive sign of the associated coefficient estimates suggests that an unexpected increase in domestic prices in these countries raises the world price. For the Philippines, Thailand and Vietnam, the estimate for B12 is also statistically significant, further highlighting the significance of price volatility in those countries on the world rice market. Both coefficient estimates for those three countries also imply that when governments impose trade measures that result in higher world rice prices, volatility in the world rice market rises as well.
The coefficient estimates for the dummy variable reflect the importance of the Asian rice
price crisis on the volatility dynamics of domestic and world prices (D11 and D22), as well as their covariances (D21). The estimates are statistically significant for all these coefficients in the cases of the Philippines, Thailand and Vietnam, highlighting again the close relationship between those major rice markets and the world market. The statistical significance and positive estimates for D21 highlights the positive volatility spillovers between the domestic and world markets.
The estimates for the element B11 reflect the varying levels of persistence in the volatility
of rice prices. The estimate is the highest at 0.88 for Vietnam, and the lowest at 0.31 in the case of China. The sharp contrasts among those estimates are also evident in Figure 2, which plots the patterns of the conditional variance series for the six countries. Figure 2 also displays the patterns of the conditional covariances between the domestic prices and the world price. Interestingly, the patterns vary appreciably across countries, although most covariance series reach a peak during the 2007-08 rice crisis. The series for Bangladesh and China are relatively smaller than the series for other countries. The overall positive covariances indicate that the world rice price and domestic prices tended to change over time in the same direction.
Overall, the bivariate MGARCH model estimations in Table 3 show mixed findings for
the linkage between the world price and domestic price across different Asian countries. Overall evidence of this relationship in either the conditional mean or the conditional variance equation is much stronger for the Philippines, Thailand and Vietnam, than for Bangladesh, India and China.
317
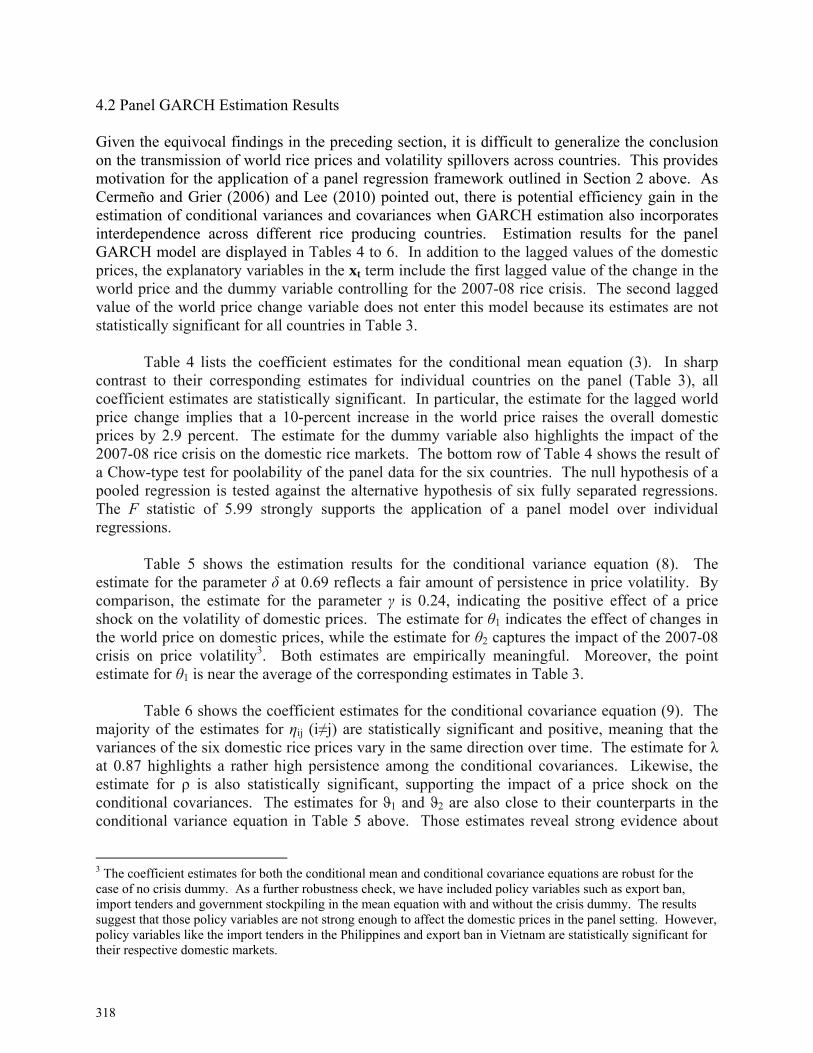
4.2 Panel GARCH Estimation Results Given the equivocal findings in the preceding section, it is difficult to generalize the conclusion on the transmission of world rice prices and volatility spillovers across countries. This provides motivation for the application of a panel regression framework outlined in Section 2 above. As Cermeño and Grier (2006) and Lee (2010) pointed out, there is potential efficiency gain in the estimation of conditional variances and covariances when GARCH estimation also incorporates interdependence across different rice producing countries. Estimation results for the panel GARCH model are displayed in Tables 4 to 6. In addition to the lagged values of the domestic prices, the explanatory variables in the xt term include the first lagged value of the change in the world price and the dummy variable controlling for the 2007-08 rice crisis. The second lagged value of the world price change variable does not enter this model because its estimates are not statistically significant for all countries in Table 3.
Table 4 lists the coefficient estimates for the conditional mean equation (3). In sharp
contrast to their corresponding estimates for individual countries on the panel (Table 3), all coefficient estimates are statistically significant. In particular, the estimate for the lagged world price change implies that a 10-percent increase in the world price raises the overall domestic prices by 2.9 percent. The estimate for the dummy variable also highlights the impact of the 2007-08 rice crisis on the domestic rice markets. The bottom row of Table 4 shows the result of a Chow-type test for poolability of the panel data for the six countries. The null hypothesis of a pooled regression is tested against the alternative hypothesis of six fully separated regressions. The F statistic of 5.99 strongly supports the application of a panel model over individual regressions.
Table 5 shows the estimation results for the conditional variance equation (8). The estimate for the parameter δ at 0.69 reflects a fair amount of persistence in price volatility. By comparison, the estimate for the parameter γ is 0.24, indicating the positive effect of a price shock on the volatility of domestic prices. The estimate for θ1 indicates the effect of changes in the world price on domestic prices, while the estimate for θ2 captures the impact of the 2007-08 crisis on price volatility3. Both estimates are empirically meaningful. Moreover, the point estimate for θ1 is near the average of the corresponding estimates in Table 3. Table 6 shows the coefficient estimates for the conditional covariance equation (9). The majority of the estimates for ηij (i≠j) are statistically significant and positive, meaning that the variances of the six domestic rice prices vary in the same direction over time. The estimate for λ at 0.87 highlights a rather high persistence among the conditional covariances. Likewise, the estimate for ρ is also statistically significant, supporting the impact of a price shock on the conditional covariances. The estimates for ϑ1 and ϑ2 are also close to their counterparts in the conditional variance equation in Table 5 above. Those estimates reveal strong evidence about
3 The coefficient estimates for both the conditional mean and conditional covariance equations are robust for the case of no crisis dummy. As a further robustness check, we have included policy variables such as export ban, import tenders and government stockpiling in the mean equation with and without the crisis dummy. The results suggest that those policy variables are not strong enough to affect the domestic prices in the panel setting. However, policy variables like the import tenders in the Philippines and export ban in Vietnam are statistically significant for their respective domestic markets.
318

the impact of changes in the world price and the 2007-08 price shocks on the covariances of Asian domestic rice markets. Despite the finding of interdependence, we evaluate country-specific effects in the variance and covariance equations by applying likelihood ratio (LR) tests based on the log-likelihood values of the panel model estimated separately with and without individual effects. The LR statistic is 37.12 for conditional variance equation (8) and 61.34 for the conditional covariance equation (9). Both statistics are significant at the 1% level, suggesting the presence of individual effects and heterogeneity across countries.
The overall estimation results in Tables 4 to 6 underscore the extent of interdependence across the rice markets of Asian countries. Such interdependence has helped contribute to the spillover of a price shock in one country to another within the region. More importantly, the estimation results with the panel GARCH model confirm the role of changes in the world rice price on domestic rice markets.
5. CONCLUSIONS
This paper has examined the transmission and volatility spillover of the world price of rice to domestic rice markets based on a panel of six Asian countries over the period 2005-2013. Empirical results of conventional MGARCH models suggest an empirically meaningful relationship between the world rice price and the domestic price in either the conditional mean or the conditional variance equation for the Philippines, Thailand and Vietnam. Furthermore, strong levels of persistence in the volatility of domestic and world prices were observed in the cases of Vietnam and Thailand. In a panel GARCH setting, regression results suggest that changes in world price of rice and the 2007-08 price shocks increased not only the domestic markets’ overall price levels but also their rice volatility. There is also strong evidence of interdependence across different Asian rice markets, and the extent of interdependence contributes to the spillover of a price shock in one country to another within the region. Those results raise questions regarding the effect of government policies in the extent of price volatility spillovers, which were evident in the case of import tenders in the Philippines and export ban in Vietnam. Our empirical results also have direct bearing on the debate about the benefits of international policy coordination in the world rice market.
319
REFERENCES
Alam, M. J., Buysse, J., McKenzie, A. M., Begum, I. A., Wailes, E. J., & Huylenbroeck, G. V. (2012). The dynamic relationships between world and domestic prices of rice under the regime of agricultural trade liberalization in Bangladesh. Journal of the Asia Pacific economy, 17(1), 113-126.
Baffes, J., & Gardner, B. (2003). The transmission of world commodity prices to domestic markets under policy reforms in developing countries. Journal of policy reform, 6(3), 159-180.
Baltzer, K. (2013). International to domestic price transmission in fourteen developing countries during the 2007-08 food crisis. World Institute for Development Economic Research, WIDER Working Paper No. 2013/03.
Cermeño, R., & Grier, K. B. (2006). Conditional heteroskedasticity and cross-sectional dependence in panel data: an empirical study of inflation uncertainty in the G7 countries. In: B. H. Baltagi (ed.), Panel Data Econometrics, vol. 10. New York: Elsevier, pp. 259-278.
Chulaphan, W., Chen, S., Jatuporn, C., & Huang, W. (2013). Different causal relationships of export rice prices in the international market. American-Eurasian Journal of Agricultural and Environmental Sciences, 13(2), 185-190.
Conforti, P. (2004). Price transmission in selected agricultural markets. Food and Agriculture Organization, Commodity and Trade Policy Research Working Paper No. 7.
Dawe, D. (2009). Cereal price transmission in several large Asian countries during the global food crisis. Asian Journal of Agriculture and Development, 6(1), 1-12.
Dickey, D. A., & Fuller, W. A. (1981). Likelihood ratio statistics for autoregressive time series with a unit root. Econometrica, 49, 1057–1072.
Fackler, P. & Goodwin, B. (2001). Spatial price analysis, In Gardner, B. & Rausser, G. (ed), Handbook of Agricultural Economics, Amsterdam: Elsevier Science.
Fang C. (2010). How China stabilized grain prices during the global price crisis. In: Dawe, D. (ed.), The Rice Crisis: Markets, Policies and Food Security. Earthscan and Food and Agriculture Organization.
Ghoshray, A. (2011). Underlying trends and international price transmission of agricultural commodities. Asian Development Bank, Economics Working Paper Series No. 257.
Gulati, A., & Dutta, M. (2010). Rice policies in India in the context of the global rice price spike. In: Dawe, D. (ed.), The Rice Crisis: Markets, Policies and Food Security. Earthscan and Food and Agriculture Organization.
Headey, D. & Fan, S. (2008). Anatomy of a crisis: the causes and consequences of surging food prices. Agricultural Economics, 39(1), 375-391.
Im, K.S., Pesaran, M.H. & Shin, Y. (2003). Testing for Unit Roots in Heterogeneous Panels. Journal of Econometrics, 115, 53-74.
320

Imai, K., Gaiha, R., & Thapa, G. (2008). Transmission of world commodity prices to domestic commodity prices in India and China. Brooks World Poverty Institute, Working Paper 45.
John, A. (2013). Price relations between export and domestic rice markets in Thailand. Food Policy, 42, 48-57.
Lee, J. (2010). The link between output growth and volatility: Evidence from a GARCH model with panel data. Economics Letters, 106(2), 143-145.
Levin, A., Lin, C., & Chu, J., (2002). Unit root tests in panel data: Asymptotic and finite-sample properties. Journal of Econometrics, 108(1), 1-24.
Martinez, E., Shively, G., & Masters, W. (1998). Testing the link between public intervention and food price variability: Evidence from rice markets in the Philippines. Paper presented at the annual meetings of the American Agricultural Economics Association, Salt Lake City, UT.
Minot, N. (2010). Transmission of world food price changes to markets in Sub-Saharan Africa. International Food Policy Research Institute, unpublished research report.
Pedroni, P. (1999). Critical values for cointegration tests in heterogeneous panels with multiple regressors, Oxford Bulletin of Economics and Statistics, 61, 653-70.
Poapongsakorn, N. (2010). The political economy of Thai rice price and export policies in 2007-08. In: Dawe, D. (ed.), The Rice Crisis: Markets, Policies and Food Security. Earthscan and Food and Agriculture Organization.
Quiroz, J. A., & Soto, R. (1996). International price signals in agricultural markets: Do governments care? GERENS and ILADES/Georgetown University, mimeo.
Rapsomanikis, G., & Mugera, H. (2011). Price transmission and volatility spillover in food markets of developing countries. In Piot-Lepet, I. & Barek, R.M. (ed.), Methods to Analyse Agricultural Commodity Price Volatility. Berlin: Springer Verlag, 165-180.
Timmer, P.C. & Falcon, W.P. (1975). The political economy of rice production and trade in Asia. In: Reynolds, L.G. (ed.), Agriculture in Development Theory. New Haven: Yale University Press.
Timmer, C. P. (2010). The changing role of rice in Asia’s food security. Asian Development Bank, Sustainable Development Working Paper Series No. 15.
321
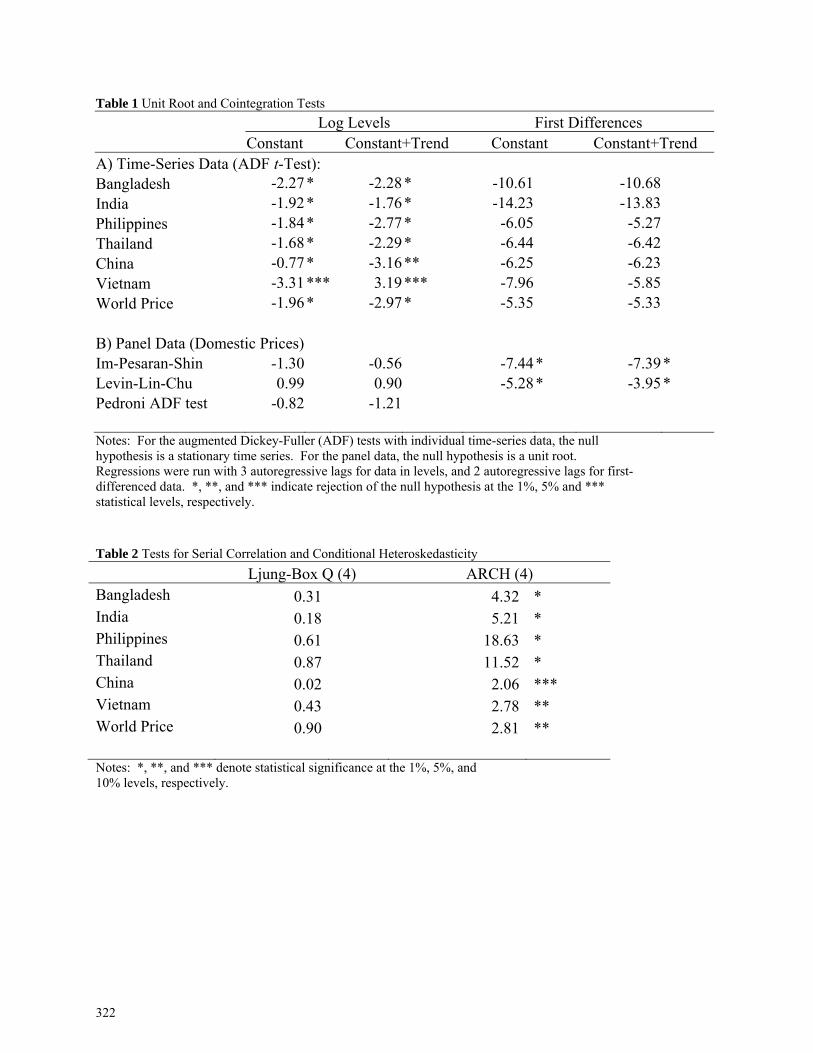
Table 1 Unit Root and Cointegration Tests
Log Levels First Differences Constant Constant+Trend Constant Constant+Trend
A) Time-Series Data (ADF t-Test): Bangladesh -2.27 * -2.28* -10.61 -10.68India -1.92 * -1.76* -14.23 -13.83Philippines -1.84 * -2.77* -6.05 -5.27Thailand -1.68 * -2.29* -6.44 -6.42China -0.77 * -3.16** -6.25 -6.23Vietnam -3.31 *** 3.19*** -7.96 -5.85World Price -1.96 * -2.97* -5.35 -5.33 B) Panel Data (Domestic Prices) Im-Pesaran-Shin -1.30 -0.56 -7.44* -7.39* Levin-Lin-Chu 0.99 0.90 -5.28* -3.95* Pedroni ADF test -0.82 -1.21 Notes: For the augmented Dickey-Fuller (ADF) tests with individual time-series data, the null hypothesis is a stationary time series. For the panel data, the null hypothesis is a unit root. Regressions were run with 3 autoregressive lags for data in levels, and 2 autoregressive lags for first-differenced data. *, **, and *** indicate rejection of the null hypothesis at the 1%, 5% and *** statistical levels, respectively. Table 2 Tests for Serial Correlation and Conditional Heteroskedasticity
Ljung-Box Q (4) ARCH (4) Bangladesh 0.31 4.32 * India 0.18 5.21 * Philippines 0.61 18.63 * Thailand 0.87 11.52 * China 0.02 2.06 *** Vietnam 0.43 2.78 ** World Price 0.90 2.81 ** Notes: *, **, and *** denote statistical significance at the 1%, 5%, and 10% levels, respectively.
322
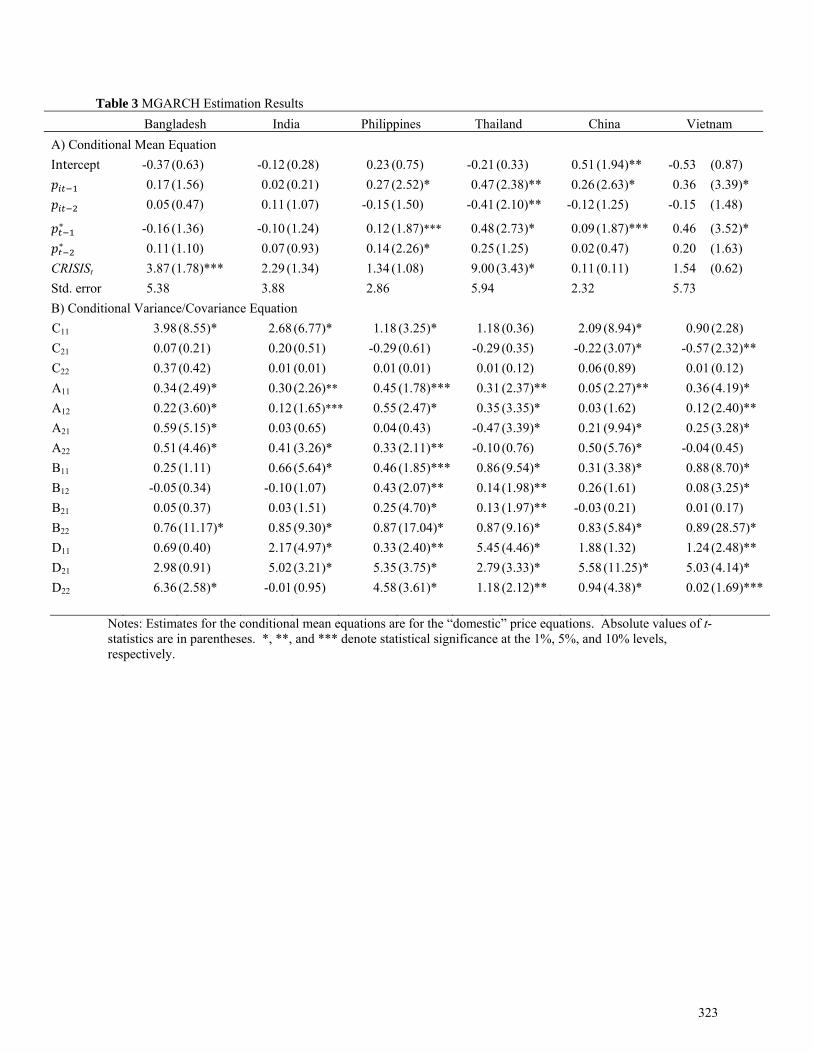
Table 3 MGARCH Estimation Results
Bangladesh India Philippines Thailand China Vietnam
A) Conditional Mean Equation
Intercept -0.37 (0.63) -0.12 (0.28) 0.23 (0.75) -0.21 (0.33) 0.51 (1.94)** -0.53 (0.87)
0.17 (1.56) 0.02 (0.21) 0.27 (2.52)* 0.47 (2.38)** 0.26 (2.63)* 0.36 (3.39)*
0.05 (0.47) 0.11 (1.07) -0.15 (1.50) -0.41 (2.10)** -0.12 (1.25) -0.15 (1.48)
∗ -0.16 (1.36) -0.10 (1.24) 0.12 (1.87)*** 0.48 (2.73)* 0.09 (1.87)*** 0.46 (3.52)* ∗ 0.11 (1.10) 0.07 (0.93) 0.14 (2.26)* 0.25 (1.25) 0.02 (0.47) 0.20 (1.63)
CRISISt 3.87 (1.78)*** 2.29 (1.34) 1.34 (1.08) 9.00 (3.43)* 0.11 (0.11) 1.54 (0.62)
Std. error 5.38 3.88 2.86 5.94 2.32 5.73
B) Conditional Variance/Covariance Equation
C11 3.98 (8.55)* 2.68 (6.77)* 1.18 (3.25)* 1.18 (0.36) 2.09 (8.94)* 0.90 (2.28)
C21 0.07 (0.21) 0.20 (0.51) -0.29 (0.61) -0.29 (0.35) -0.22 (3.07)* -0.57 (2.32)**
C22 0.37 (0.42) 0.01 (0.01) 0.01 (0.01) 0.01 (0.12) 0.06 (0.89) 0.01 (0.12)
A11 0.34 (2.49)* 0.30 (2.26)** 0.45 (1.78)*** 0.31 (2.37)** 0.05 (2.27)** 0.36 (4.19)*
A12 0.22 (3.60)* 0.12 (1.65)*** 0.55 (2.47)* 0.35 (3.35)* 0.03 (1.62) 0.12 (2.40)**
A21 0.59 (5.15)* 0.03 (0.65) 0.04 (0.43) -0.47 (3.39)* 0.21 (9.94)* 0.25 (3.28)*
A22 0.51 (4.46)* 0.41 (3.26)* 0.33 (2.11)** -0.10 (0.76) 0.50 (5.76)* -0.04 (0.45)
B11 0.25 (1.11) 0.66 (5.64)* 0.46 (1.85)*** 0.86 (9.54)* 0.31 (3.38)* 0.88 (8.70)*
B12 -0.05 (0.34) -0.10 (1.07) 0.43 (2.07)** 0.14 (1.98)** 0.26 (1.61) 0.08 (3.25)*
B21 0.05 (0.37) 0.03 (1.51) 0.25 (4.70)* 0.13 (1.97)** -0.03 (0.21) 0.01 (0.17)
B22 0.76 (11.17)* 0.85 (9.30)* 0.87 (17.04)* 0.87 (9.16)* 0.83 (5.84)* 0.89 (28.57)*
D11 0.69 (0.40) 2.17 (4.97)* 0.33 (2.40)** 5.45 (4.46)* 1.88 (1.32) 1.24 (2.48)**
D21 2.98 (0.91) 5.02 (3.21)* 5.35 (3.75)* 2.79 (3.33)* 5.58 (11.25)* 5.03 (4.14)*
D22 6.36 (2.58)* -0.01 (0.95) 4.58 (3.61)* 1.18 (2.12)** 0.94 (4.38)* 0.02 (1.69)***
Notes: Estimates for the conditional mean equations are for the “domestic” price equations. Absolute values of t-statistics are in parentheses. *, **, and *** denote statistical significance at the 1%, 5%, and 10% levels, respectively.
323
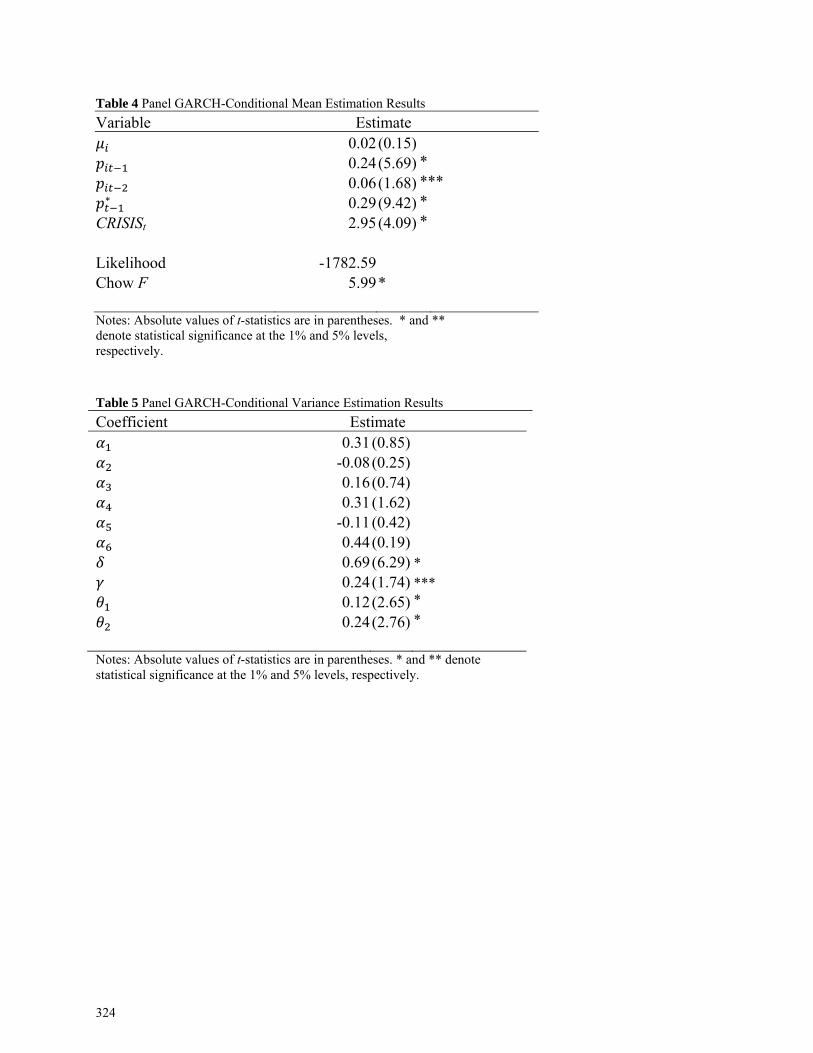
Table 4 Panel GARCH-Conditional Mean Estimation Results
Variable Estimate 0.02(0.15)
0.24(5.69) * 0.06(1.68) ***
∗ 0.29(9.42) * CRISISt 2.95(4.09) * Likelihood -1782.59 Chow F 5.99* Notes: Absolute values of t-statistics are in parentheses. * and ** denote statistical significance at the 1% and 5% levels, respectively.
Table 5 Panel GARCH-Conditional Variance Estimation Results
Coefficient Estimate 0.31(0.85) -0.08(0.25) 0.16(0.74) 0.31(1.62) -0.11(0.42) 0.44(0.19)
0.69(6.29) * 0.24(1.74) *** 0.12(2.65) *
0.24(2.76) *
Notes: Absolute values of t-statistics are in parentheses. * and ** denote statistical significance at the 1% and 5% levels, respectively.
324

Table 6 Panel GARCH-Conditional Covariance Estimation Results
Coefficient Estimate 0.48(1.81) *** 3.56(8.24) * 0.03(1.09) 1.77(6.19) * 0.41(3.22) * 0.32(1.65) *** 0.67(7.43) * 0.16(9.15) * 0.05(0.46) 0.44(8.96) * 2.71(31.62) * 0.04(0.34) 0.20(1.77) *** -0.09(1.31) 0.07(1.38) 0.75(5.93) * 0.36(0.97) -0.06(0.11) 0.09(0.69) 0.96(5.35) * 0.05(0.31)
0.87(8.24) * 0.35(9.32) * 0.20(3.48) * 6.88(4.67) *
Notes: Absolute values of t-statistics are in parentheses. *, **, and *** denote statistical significance at the 1%, 5%, and 10% levels, respectively.
325
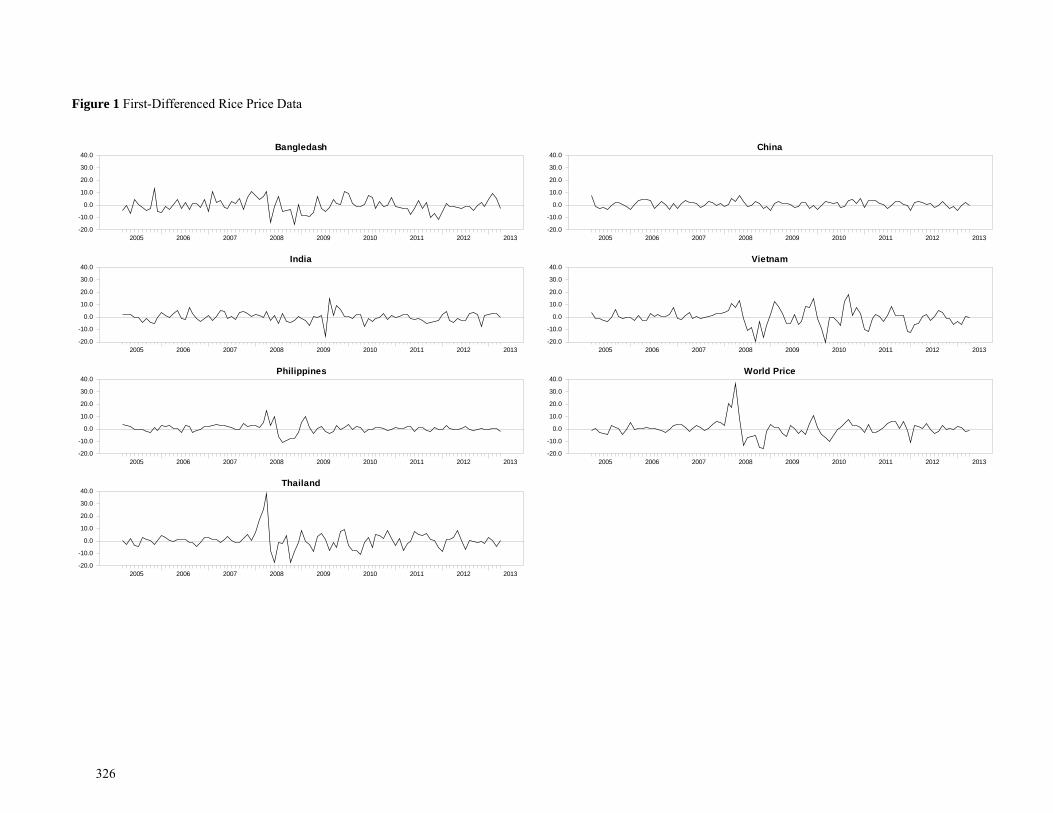
Figure 1 First-Differenced Rice Price Data
Bangledash
2005 2006 2007 2008 2009 2010 2011 2012 2013-20.0
-10.0
0.0
10.0
20.0
30.0
40.0
India
2005 2006 2007 2008 2009 2010 2011 2012 2013-20.0
-10.0
0.0
10.0
20.0
30.0
40.0
Philippines
2005 2006 2007 2008 2009 2010 2011 2012 2013-20.0
-10.0
0.0
10.0
20.0
30.0
40.0
Thailand
2005 2006 2007 2008 2009 2010 2011 2012 2013-20.0
-10.0
0.0
10.0
20.0
30.0
40.0
China
2005 2006 2007 2008 2009 2010 2011 2012 2013-20.0
-10.0
0.0
10.0
20.0
30.0
40.0
Vietnam
2005 2006 2007 2008 2009 2010 2011 2012 2013-20.0
-10.0
0.0
10.0
20.0
30.0
40.0
World Price
2005 2006 2007 2008 2009 2010 2011 2012 2013-20.0
-10.0
0.0
10.0
20.0
30.0
40.0
326
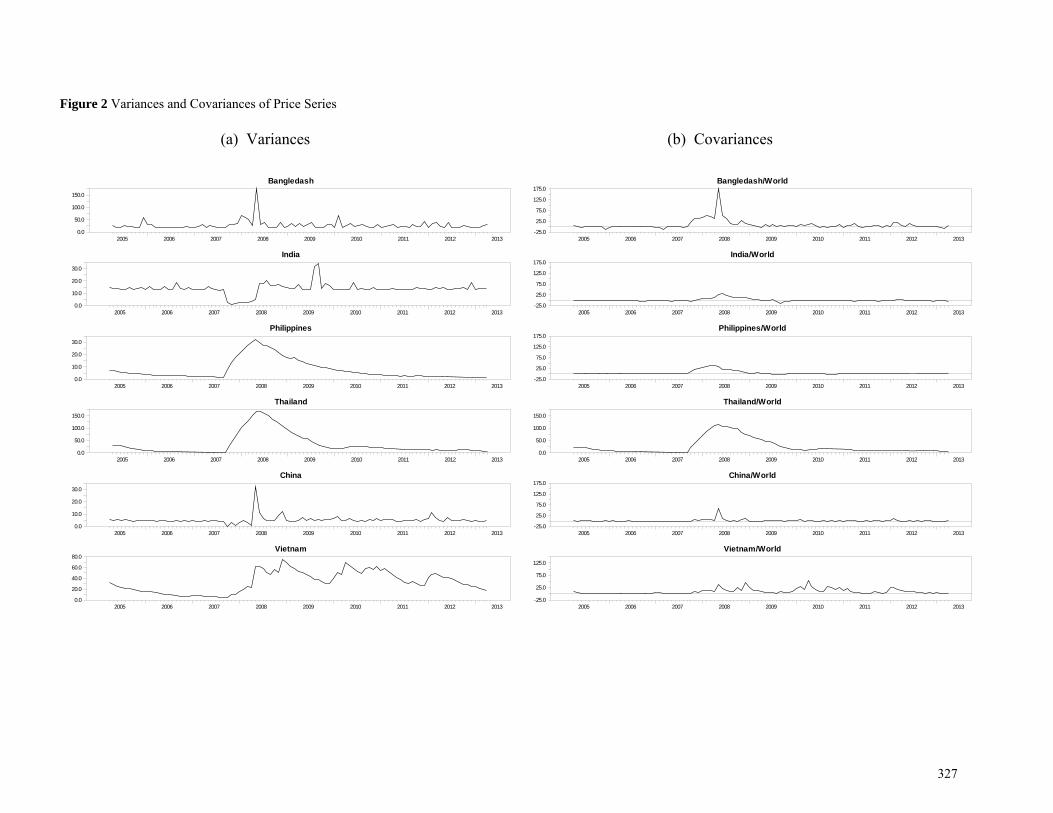
Figure 2 Variances and Covariances of Price Series
(a) Variances (b) Covariances
Bangledash
2005 2006 2007 2008 2009 2010 2011 2012 20130.0
50.0
100.0
150.0
India
2005 2006 2007 2008 2009 2010 2011 2012 20130.0
10.0
20.0
30.0
Philippines
2005 2006 2007 2008 2009 2010 2011 2012 20130.0
10.0
20.0
30.0
Thailand
2005 2006 2007 2008 2009 2010 2011 2012 20130.0
50.0
100.0
150.0
China
2005 2006 2007 2008 2009 2010 2011 2012 20130.0
10.0
20.0
30.0
Vietnam
2005 2006 2007 2008 2009 2010 2011 2012 20130.0
20.0
40.0
60.0
80.0
Bangledash/World
2005 2006 2007 2008 2009 2010 2011 2012 2013-25.0
25.0
75.0
125.0
175.0
India/World
2005 2006 2007 2008 2009 2010 2011 2012 2013-25.0
25.0
75.0
125.0
175.0
Philippines/World
2005 2006 2007 2008 2009 2010 2011 2012 2013-25.0
25.0
75.0
125.0
175.0
Thailand/World
2005 2006 2007 2008 2009 2010 2011 2012 20130.0
50.0
100.0
150.0
China/World
2005 2006 2007 2008 2009 2010 2011 2012 2013-25.0
25.0
75.0
125.0
175.0
Vietnam/World
2005 2006 2007 2008 2009 2010 2011 2012 2013-25.0
25.0
75.0
125.0
327
Benford’s Law and the Effects of the Korean Financial Reforms on Cosmetic Earnings Management
MICHAEL LACINA University of Houston-Clear Lake,
Houston, Texas, USA
B. BRIAN LEE1
College of Business, Prairie View A&M University, Prairie View, Texas, USA
DONG WUK KIM
Jeju National University, Jeju-si, Jeju-do, South Korea We utilize a Benford distribution to examine the earnings management change following the Korean financial reforms. We examine, reading from the left, whether firms listed on the Korea Exchange adjusted their propensity to convert high second digits of their net income in the post-financial reform period (2000-2012) compared to the pre-financial reform period (1990-1996). We show that managers convert high second digits of positive net income to improve first digits, but try to retain high second digits of negative net income to avoid an increase in first digits. Our results are consistent with firms engaging in earnings management more often in the post-financial reform period than in the pre-financial reform period. This is possibly due to an increase in performance-based evaluation and market-oriented systems following the financial reforms. JEL CLASSIFICATIONS M4; L14; C89 KEYWORDS Benford’s Law; Earnings management; Korean financial reforms
1 Address correspondence to B. Brian Lee, College of Business, Prairie View A&M University, Prairie View, Texas, USA. E-mail: [email protected] The authors thank Henry Huang for helpful comments and suggestions and thank participants at the 2011 American Accounting Association Southwest Region meeting, the 43rd Southwest Decision Sciences Institute meeting, and the 2013 American Accounting Association Annual meeting for useful discussions.
328
1. INTRODUCTION
The purpose of this study is to examine how reforms in the Korean financial reporting and oversight system in combination with the implementation of performance-based evaluation and market-oriented systems have affected the practice of earnings management. Many Asian countries, including Korea, underwent a massive financial crisis in 1997. In the aftermath of the crisis, the Korean government initiated a wide range of reforms in the financial reporting system, referring to the financial reporting regulatory system in the U.S. as an ideal model. The newly organized regulatory body, the Korean Accounting Standards Board (KASB), issued a number of accounting standards that are comparable to International Financial Reporting Standards (IFRSs) and Statements of Financial Accounting Standards (SFASs). Tightened accounting rules in Korea are supposed to improve earnings quality by reducing managers' latitude in reporting earnings. Also, following the financial crisis, new laws and regulations along with activist shareholder organizations have improved the monitoring of Korean companies. This improved oversight is also likely to reduce the freedom available to firms in managing earnings. Lee and Seo (2010) report lower discretionary accruals in the post-financial reform period than in the pre-financial reform period, consistent with successful implementation of tightened accounting rules and increased oversight. On the other hand, one strand of literature in earnings management reports that high quality accounting standards alone do not necessarily lead to increased quality in accounting information because of managers’ incentives (Ball et al. 2003; Leuz et al. 2003; Ball and Shivakumar 2005; Burgstahler et al. 2006). All accounting standards are embedded with reporting discretion for managers to reflect their personal information in measuring firm performance and thus increase the faithful representation of accounting information. Also, the reporting discretion can aid managers in accomplishing their personal agendas. The financial reform induced a paradigm shift in the Korean labor market from internal, group, and seniority-based rewards to external (i.e., market-oriented), individual and performance-based rewards. Furthermore, in the post-financial reform period, the capital markets have expanded in providing capital to firms that used to rely on governmental agencies and banks for funding. The labor and capital markets in Korea have followed those in the U.S. as the benchmark and thus managers of Korean public firms are under pressure to deliver expected outputs to investors and increase stock price. This could encourage earnings management (Kim and Yi 2006). Therefore, developments since the financial reforms have likely produced two conflicting effects on earnings management in Korea: a deterrence effect because of stronger accounting rules and increased oversight versus an incentive effect from the implementation of performance-based evaluation and market-oriented systems. The accounting literature has documented earnings management in numerous ways. One strand of research observes whether managers are motivated to beat certain cognitive thresholds in the capital markets (e.g., Burgstahler and Dichev 1997; Degeorge et al. 1999; Brown and Caylor 2005). For example, as investors would like their firms to report positive earnings, increase earnings, and beat analysts’ expectations, managers attempt to please market participants by releasing earnings numbers that achieve such objectives.
329
In a similar vein, a number of papers have studied earnings management by considering the limited ability of financial statement users to process accounting numbers. Brenner and Brenner (1982) indicate that buyers of goods and services may not be completely rational in processing a selling price such as $2.99. As buyers are inclined to weigh heavily the first digit (hereafter FIRST) of the selling price—the whole number $2—they may perceive the asking price of $2.99 as in the neighborhood of $2 rather than $3. Indeed, a number of studies indicate that firms attempt to report higher FIRST digits in their positive accounting numbers (e.g., Carslaw 1988; Thomas 1989; Niskanen and Keloharju 2000; Van Caneghem 2002; Kinnunen and Koskela 2003; Skousen et al. 2004). Suppose that Firm A's earnings are $2,900 while Firm B's earnings are $2,100. Firm A's earnings are greater than those of Firm B by almost 38%. However, if financial statement users emphasize the FIRST digit, 2, then they consider both firms to have earned profits in the neighborhood of $2,000. Accordingly, the managers of Firm A would be motivated to produce additional earnings of $100 (or 3.4% of current earnings) to bring the earnings to the next level of the FIRST digit, $3,000. Managers of Firm B would have less incentive because they would have to raise earnings by $900 (42.9% of current earnings). The aforementioned studies empirically document this type of earnings management. They measure the frequency of second and third digits (reading from the left) in financial statement numbers (hereafter SECOND and THIRD, respectively) and test whether their distributions follow an expected pattern, such as that from Benford's Law. Benford’s Law formulates the expected frequencies of the values 0 (or 1) to 9 for each digit in a number. According to Benford’s Law, the frequencies of the values are not equal. Using Benford’s Law, we are motivated to examine how conflicting issues resulting from the financial reforms—tightened accounting rules and increased oversight versus an increased incentive for managers to meet thresholds and please investors in performance-based evaluation and market-oriented systems—affect earnings management in Korea. We collect a sample of firms from the Korea Exchange from 1990 to 2012 and partition them into two groups, the pre-financial reform period (1990-1996) and the post-financial reform period (2000-2012), by removing data from the reform period (1997-1999). Our findings show that in the post-financial reform period, for positive net income (NI), firms report SECOND digit 0s more often but SECOND digit 9s less often than their corresponding Benford proportions. On the other hand, for negative NI, firms report SECOND digit 0s less often but SECOND digit 9s more often than their corresponding Benford proportions. In the pre-financial reform period, however, results are not consistent. Firms report SECOND digit 0s of positive NI more often than their corresponding Benford proportion, but for positive NI there is no significant difference between observed and Benford proportions of SECOND digit 9s. Furthermore, for negative NI, firms in the pre-reform period report SECOND digit 9s more often than their corresponding Benford proportion, but there is no difference between observed and Benford proportions of SECOND digit 0s. We find that in the post-financial reform period for positive NI, firms report THIRD digit 0s more often but THIRD digit 9s less often than their corresponding Benford proportions. There is no significant finding for other combinations: positive NI in the pre-financial reform period and negative NI in both pre- and post-financial reform periods.
330

The paper's contributions to the accounting literature are twofold. First, this paper uses the Korean financial reforms to provide empirical evidence that upon the initiation of evaluation and market-oriented systems that provide incentives for earnings management, earnings management increases even in the presence of tightened accounting rules and increased oversight. Second, this paper uses Benford's Law to examine earnings management in the Korean context. The organization of the remainder of this paper is as follows. Section 2 provides background information, including a review of previous studies and the development of hypotheses. Section 3 includes the data selection process and descriptive statistics. Section 4 discusses empirical findings and Section 5 concludes this paper.
2. BACKGROUND AND DEVELOPMENT OF HYPOTHESIS
In the wake of the financial crisis of 1997, the Korean government initiated financial reforms in conjunction with the International Monetary Fund and the World Bank. In 1999, their combined efforts created the Korea Accounting Institute (KAI), which is equivalent to the Financial Accounting Foundation (FAF) in the U.S. The KAI has assumed a leadership role in reforming the financial systems in Korea by forming the KASB, which is in charge of accounting standard setting.1 The KASB is, like the FASB, a private and independent standard setting body. The KASB has implemented drastic reforms in Korean accounting and auditing systems; their intended effects are comparable to those of the U.S. Sarbanes-Oxley Act of 2002. The KASB adopted accounting standards by referring to IFRSs and SFASs. These tightened accounting rules are supposed to reduce managers’ discretion in managing earnings.2 Furthermore, following the 1997 financial crisis, oversight of management and financial reporting has increased as a result of the establishment of U.S.-style audit committees, increases in the number of outsiders on boards of directors, reduced barriers on foreign ownership in Korean corporations, expanded rights of minority shareholders, and monitoring from shareholder activist NGOs (non-profit, non-governmental organizations) (Krause 2000; Yoon et al. 2002). External monitors of corporate governance were almost non-existent before the Korean financial crisis (Kim and Kim 2008). In 1998, the Korean Securities and Exchange Law began requiring that at least one-quarter of directors for a Korea Stock Exchange (KSE) firm be outside directors. In 2001, this required proportion increased to one-half for firms with assets greater than or equal to 2 trillion KRW (Korean Won) (approximately $1.8 billion). Companies listed on the KOSDAQ face the same requirements with a few exceptions (Kim and Kim 2008). In addition, since 2001, publicly traded companies with assets greater than or equal to 2 trillion KRW have been required to organize an audit committee. In 1998, the limits on foreign equity ownership in Korean corporations were removed (Jang 2003; Claessens 2008). As a result, the amount of foreign ownership in Korean listed companies increased from 13% in 1996 to 37% at the end of 2006. Foreign investors are not likely to hold Korean authority figures with the same level of respect as Korean investors and are less likely to respect the country’s emphasis on group harmony. Therefore, foreign investors may be more likely to question Korean managers’ accounting practices and procedures. Additionally, the laws and regulations resulting from the Korean financial reforms improve the rights of minority shareholders. Before the crisis, more than 5 percent ownership was required for the enforcement of most shareholder rights, including
331

inspection of the firm’s books. However, since the financial crisis, lower ownership ratios for various shareholder initiatives have enhanced minority shareholder rights in Korea (Claessens 2008). For instance, since 1998, only 0.1% ownership (0.05% ownership for public companies with assets greater than 2 trillion KRW) has been required for the right to inspect the books and records of publicly traded companies (Jang 2003). Also, in Korea, the adoption of the Security-Related Class Action Bill took place in 2003 and became effective on January 1, 2005. This bill allows minority shareholders to bring a lawsuit against a firm if they experience financial losses resulting from tampered financial reports, fraudulent audits, or certain other irregularities (Chung 2004). Moreover, shareholder activist NGOs, which normally receive funding through membership fees, have played a major part in promoting corporate governance in Korea after the financial crisis (Kim and Kim 2008). These NGOs have filed lawsuits against firms for alleged malfeasance and have taken action against firms that they deem to be deficient in corporate governance practices and/or improving shareholder value (Kim and Kim 2008). The Appendix includes a timetable of the financial reform process in Korea. It is probable that tightened accounting rules along with increased oversight of financial reporting have made accrual-based earnings management in Korea more difficult and costly in the post-financial reform period (Lee and Seo 2010). The outcomes of such efforts, however, depend upon managers’ reporting incentives (Hail et al. 2010). All accounting standards include reporting discretion so that managers can reflect their private information in measuring firm performance. Since they are the most knowledgeable of their business transactions, reporting discretion allows them to provide outside users with financial reports that accurately represent firm performance. Nonetheless, managers are also incentivized to promote their personal agendas through reporting discretion, such as meeting earnings targets, complying with covenants, and others. Although increased enforcement could restrict the ability of managers to use discretion for their personal agendas to some extent, managers are still often able to accomplish what they want through financial reporting (for example, Greenspan 2002; Fuller and Jensen 2002; Ewert and Wagenhofer 2005; Cohen et al. 2008; Cohen and Zarowin 2010). Managers have access to a wide range of options to affect financial reports, including accounting accruals, strategic choices of business, and others. This line of thought has led to several studies about how managers’ incentives moderate the effect of accounting standards on earnings quality (Ball et al. 2003; Leuz et al. 2003; Ball and Shivakumar 2005; Burgstahler et al. 2006). These studies show that high quality accounting standards alone do not necessarily lead to high quality earnings properties if managers pursue personal agendas through earnings management.
The financial reform in Korea has also affected many areas in business including the incentive mechanism for managers. In the pre-financial reform period, most Korean firms adopted a lifetime employment model in conjunction with seniority-based pay and promotion systems, as in Japanese firms (Kotkin and Kishimoto 1986; Sullivan 1992; Lee and Kim 2006; Bae et al. 2011). Thus, the goal of the performance evaluation system was to promote the collective output of an organization by cultivating an internal labor market characterized by seniority, harmony, and hierarchy. As the Korean government played a major role in funding firms in strategic industries as part of its efforts to expand the national economy, firms heavily depended upon governmental agencies or banks for governmental subsidies and loans with low
332
interest rates (Amsden 1989). Thus, firms needed to satisfy the funding requirements of these institutions and communicated their financial information through informal channels. 3 Most earnings management would take place to meet the expectations of these institutions, not investors in capital markets, where a demand for financial statements was not high.
After the 1997 financial crisis, there was a social consensus on a need for a flexible labor
market in Korea since annual economic growth was not high enough to sustain firms’ commitments to lifetime employment (Park 2001). In 1998, the labor law was revised to allow firms to lay off their employees for “managerial reasons.” This induced a paradigm shift in the labor market from internal, group, and seniority-based rewards to external, individual, and performance-based rewards (Lee and Kim 2006). For example, in 1997, employees older than 50 held 37% of the upper-level managerial positions. However, this ratio declined to 32% by 2000 (KMEL 2015). Korean firms forced less productive upper-level managers with high compensations based on their seniority into early retirement. Furthermore, the Korean capital market has expanded. For example, in 1996, there were 760 listed firms in the Korea Exchange, of which market capitalization value was $139 billion, with no foreign firm. In 2013, the Korea Exchange included 1,798 domestic firms and 17 foreign firms, with $1,234 billion as the exchange's market capitalization value (WFE 2015). In addition, Korean firms started to introduce stock option plans for the first time in 1997 (Sul and Kim 2003; Kim and Kim 2008). Accordingly, a demand for quality financial information has increased and managers of Korean firms have become concerned about investors in the capital markets, as are their counterparts in the U.S. capital markets, which have been a benchmark for the Korean financial reform. For example, Kim and Yi (2006) report increased earnings management in the post-financial reform period. They find that public firms engage in earnings management to a larger extent than do private firms, an indication that that managers of Korean public firms tried positively to influence investors in the capital market. Their findings in the Korean capital market are in contrast to those in European capital markets, where earnings management has been more pervasive in private firms than in public firms (Ball and Shivakumar 2005; Burgstahler et al. 2006).
Thus, this study extends previous studies by analyzing earnings management to examine how managers’ labor market and capital market incentives moderate the effect of high quality accounting standards and increased oversight in producing financial information. To document earnings management, this study adopts Benford's Law (1938), which formulates the expected frequency of each digit in collected numerical data in a sequence from the beginning digit, counting from the left. The collected numerical data contain nine FIRST digits ranging from 1 to 9. Contrary to intuition, the frequencies of FIRST digits are not equal.4 Rather, the probabilities gradually decrease as a FIRST digit in magnitude increases, meaning a distribution skewed to the highest digit in magnitude, 9. We observe a similar distribution for the ten SECOND digits (ranging from 0 to 9) with moderated skewness; then the skewed distribution of the ten THIRD digits further weakens.
333
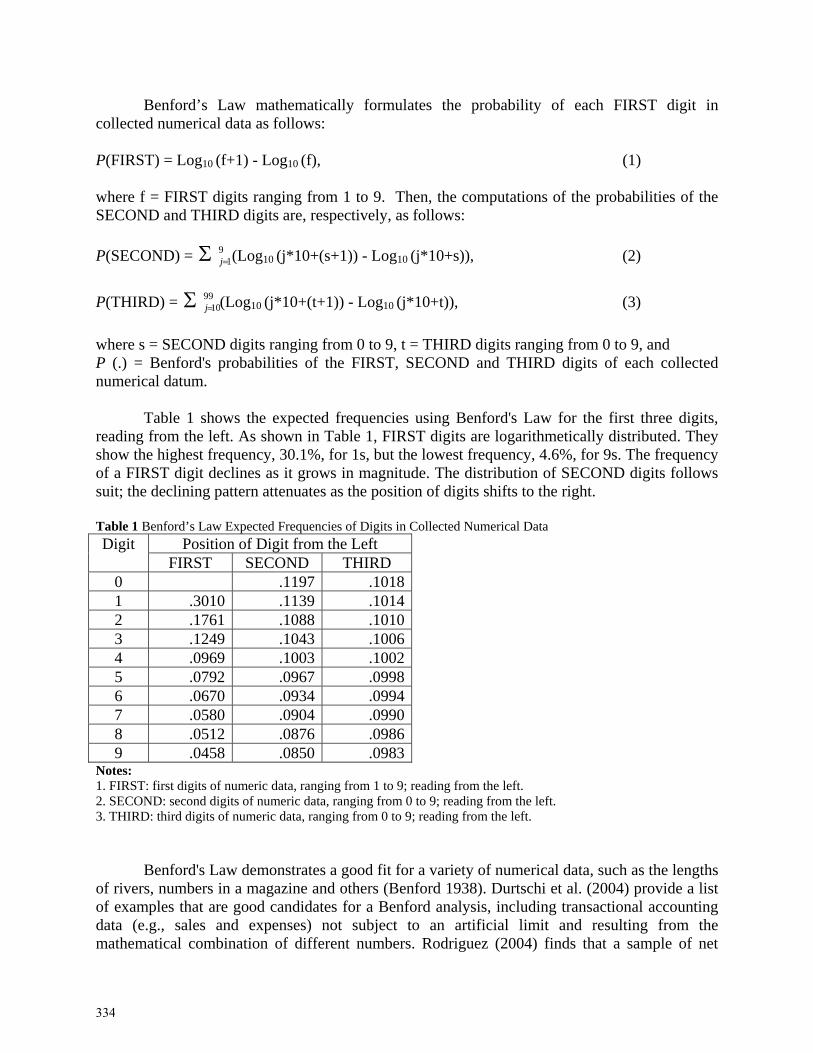
Benford’s Law mathematically formulates the probability of each FIRST digit in collected numerical data as follows: P(FIRST) = Log10 (f+1) - Log10 (f), (1) where f = FIRST digits ranging from 1 to 9. Then, the computations of the probabilities of the SECOND and THIRD digits are, respectively, as follows:
P(SECOND) = 91j (Log10 (j*10+(s+1)) - Log10 (j*10+s)), (2)
P(THIRD) = 9910j (Log10 (j*10+(t+1)) - Log10 (j*10+t)), (3)
where s = SECOND digits ranging from 0 to 9, t = THIRD digits ranging from 0 to 9, and P (.) = Benford's probabilities of the FIRST, SECOND and THIRD digits of each collected numerical datum. Table 1 shows the expected frequencies using Benford's Law for the first three digits, reading from the left. As shown in Table 1, FIRST digits are logarithmetically distributed. They show the highest frequency, 30.1%, for 1s, but the lowest frequency, 4.6%, for 9s. The frequency of a FIRST digit declines as it grows in magnitude. The distribution of SECOND digits follows suit; the declining pattern attenuates as the position of digits shifts to the right. Table 1 Benford’s Law Expected Frequencies of Digits in Collected Numerical Data Digit Position of Digit from the Left
FIRST SECOND THIRD 0 .1197 .10181 .3010 .1139 .10142 .1761 .1088 .10103 .1249 .1043 .10064 .0969 .1003 .10025 .0792 .0967 .09986 .0670 .0934 .09947 .0580 .0904 .09908 .0512 .0876 .09869 .0458 .0850 .0983
Notes: 1. FIRST: first digits of numeric data, ranging from 1 to 9; reading from the left. 2. SECOND: second digits of numeric data, ranging from 0 to 9; reading from the left. 3. THIRD: third digits of numeric data, ranging from 0 to 9; reading from the left. Benford's Law demonstrates a good fit for a variety of numerical data, such as the lengths of rivers, numbers in a magazine and others (Benford 1938). Durtschi et al. (2004) provide a list of examples that are good candidates for a Benford analysis, including transactional accounting data (e.g., sales and expenses) not subject to an artificial limit and resulting from the mathematical combination of different numbers. Rodriguez (2004) finds that a sample of net
334

income observations taken from SEC records has FIRST digit probabilities consistent with Benford’s law. He did not test other digits. Most human-influenced numbers do not follow a Benford distribution. These include check numbers, ATM withdrawals and accounting transactions with a built-in limit (e.g., less than $500 for each purchase order). Carslaw (1988) is, to our knowledge, the first empirical study in accounting to examine the distributions of the digits of financial statement numbers. He studies New Zealand firms and documents their earnings management practice by referring to Benford's Law. New Zealand's firms with positive earnings report a higher (lower) frequency of 0s (9s) in the SECOND digits of their earnings than their Benford proportion. The results imply that firms with high SECOND digits likely manage earnings in order to improve the FIRST digit and leave a 0 as the SECOND digit. Thomas (1989) extends Carslaw’s findings to U.S. firms and examines firms with both positive and negative earnings. For the sample with positive earnings, Thomas replicates Carslaw's findings. However, firms with negative earnings show the opposite trend by reporting fewer (more) SECOND digit 0s (9s). The results in Carslaw (1988) and Thomas (1989) imply that firms are concerned that financial statement users place excessive influence on the FIRST digit of earnings. This is consistent with arguments in Brenner and Brenner (1982). Niskanen and Keloharju (2000), Van Caneghem (2002), and Skousen et al. (2004) report similar results using Finnish, British, and Japanese samples, respectively. Further, Kinnunen and Koskela (2003) expand prior findings by examining earnings of firms in eighteen countries and report that firms with both positive and negative earnings follow patterns similar to those observed by Thomas (1989). Aono and Guan (2008) analyze earnings numbers and find a lower proportion of SECOND digit 0s in positive net income numbers in the two years following the enactment of the U.S. Sarbanes-Oxley Act (SOX) relative to the two years before SOX. However, for negative net income numbers, they find no significant difference after SOX compared to before SOX. Our paper extends the research above to Korean firms by focusing on the distribution of SECOND digits in net income and comparing differences in distributions between two periods: pre- and post-financial reform in Korea. Based on the previous discussion, we are unable to predict whether earnings management has increased or decreased following the Korean financial reforms. Therefore, we state our hypothesis in the null form as follows:
H: Managers of Korean firms engage in earnings management to create favorable cognitive reference points with the same frequency in the post-financial reform period as in the pre-financial reform period.
335
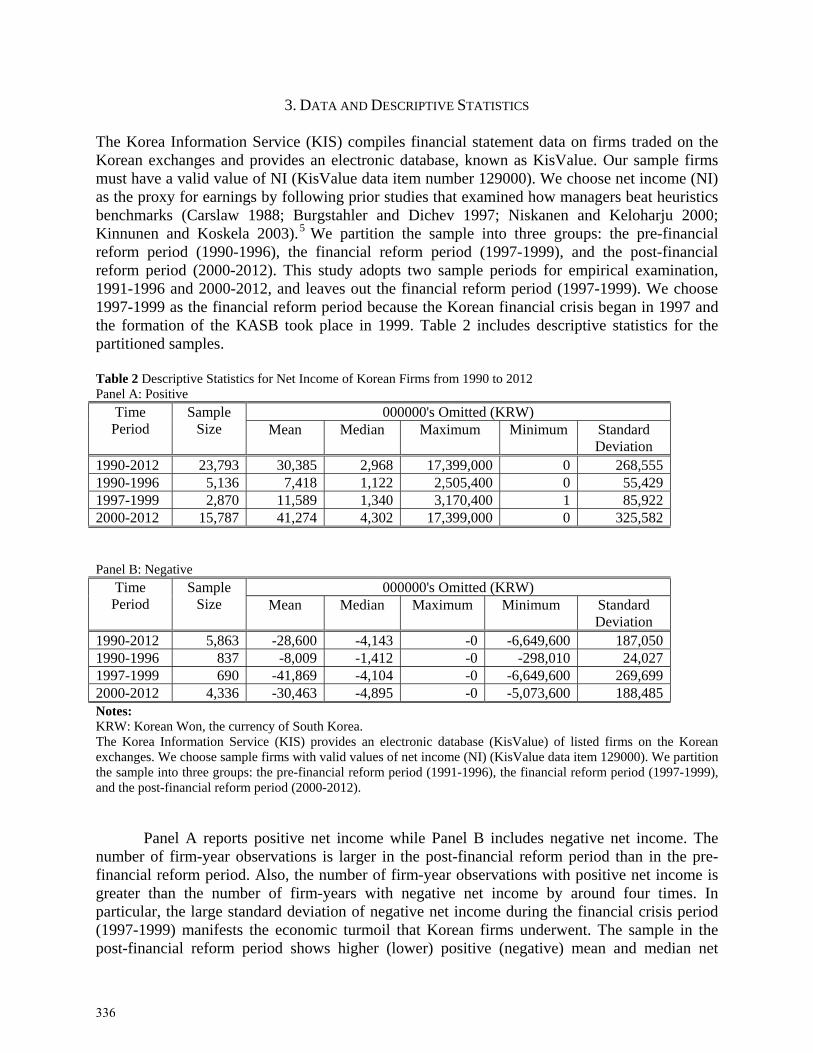
3. DATA AND DESCRIPTIVE STATISTICS
The Korea Information Service (KIS) compiles financial statement data on firms traded on the Korean exchanges and provides an electronic database, known as KisValue. Our sample firms must have a valid value of NI (KisValue data item number 129000). We choose net income (NI) as the proxy for earnings by following prior studies that examined how managers beat heuristics benchmarks (Carslaw 1988; Burgstahler and Dichev 1997; Niskanen and Keloharju 2000; Kinnunen and Koskela 2003).5 We partition the sample into three groups: the pre-financial reform period (1990-1996), the financial reform period (1997-1999), and the post-financial reform period (2000-2012). This study adopts two sample periods for empirical examination, 1991-1996 and 2000-2012, and leaves out the financial reform period (1997-1999). We choose 1997-1999 as the financial reform period because the Korean financial crisis began in 1997 and the formation of the KASB took place in 1999. Table 2 includes descriptive statistics for the partitioned samples. Table 2 Descriptive Statistics for Net Income of Korean Firms from 1990 to 2012 Panel A: Positive
Time Period
Sample Size
000000's Omitted (KRW) Mean Median Maximum Minimum Standard
Deviation 1990-2012 23,793 30,385 2,968 17,399,000 0 268,5551990-1996 5,136 7,418 1,122 2,505,400 0 55,4291997-1999 2,870 11,589 1,340 3,170,400 1 85,9222000-2012 15,787 41,274 4,302 17,399,000 0 325,582 Panel B: Negative
Time Period
Sample Size
000000's Omitted (KRW) Mean Median Maximum Minimum Standard
Deviation 1990-2012 5,863 -28,600 -4,143 -0 -6,649,600 187,0501990-1996 837 -8,009 -1,412 -0 -298,010 24,0271997-1999 690 -41,869 -4,104 -0 -6,649,600 269,6992000-2012 4,336 -30,463 -4,895 -0 -5,073,600 188,485Notes: KRW: Korean Won, the currency of South Korea. The Korea Information Service (KIS) provides an electronic database (KisValue) of listed firms on the Korean exchanges. We choose sample firms with valid values of net income (NI) (KisValue data item 129000). We partition the sample into three groups: the pre-financial reform period (1991-1996), the financial reform period (1997-1999), and the post-financial reform period (2000-2012). Panel A reports positive net income while Panel B includes negative net income. The number of firm-year observations is larger in the post-financial reform period than in the pre-financial reform period. Also, the number of firm-year observations with positive net income is greater than the number of firm-years with negative net income by around four times. In particular, the large standard deviation of negative net income during the financial crisis period (1997-1999) manifests the economic turmoil that Korean firms underwent. The sample in the post-financial reform period shows higher (lower) positive (negative) mean and median net
336

income than does its counterpart in the pre-financial reform period. Durtschi et al. (2004) indicate the larger the ratio of the mean to the median, the more likely the dataset follows Benford’s Law. This suggests that net income in Table 2 likely follows a Benford distribution.
4. METHODOLOGY AND EMPIRICAL FINDINGS
Table 3 reports on the sample distribution of FIRST digits. The chi-square goodness of fit test jointly determines whether the actual proportion of all sample firms’ FIRST digits follows a Benford distribution. However, sample size affects statistical significance. A larger sample would have a higher likelihood than a smaller sample of rejecting the null hypothesis that the two distributions, Benford and actual, are equal to each other (Nigrini 2011). In order to mitigate this
concern, a mean variation (MV) statistic is also computed by
9
19/|))(|(
j jj pEp where =
the proportion of FIRST digit j in earnings and E = the Benford proportion of FIRST digit j (Johnson and Ireland 2007). Table 3 FIRST Digits of Net Income Compared to a Benford Distribution for Listed Firms in Korea Panel A: Positive
Time Period Sample Size Chi-Square Goodness of Fit
Mean Variation (t-statistic)
1990-2012 23,793 25.64*** .25% (3.41)***
1990-1996 5,136 10.71 .40% (3.61)***
2000-2012 15,787 23.16*** .31% (4.19)***
Panel B: Negative
Time Period Sample Size Chi-Square Goodness of Fit
Mean Variation (t-statistic)
1990-2012 5,863 13.07 .38% (2.93)**
1990-1996 837 7.85 .82% (3.29)**
2000-2012 4,336 15.73** .50% (3.40)***
Notes: The chi-square goodness of fit test jointly determines whether the actual proportion of all digits follows a
Benford distribution. The mean variation (MV) statistic is computed by
9
19/|))(|(
j jj pEp where = the
proportion of FIRST digit j in earnings, and E = the Benford proportion of FIRST digit j. *** and ** indicate statistical significance at the .01 and .05 level, respectively (t-statistic significance is based on two-tailed tests). The results of the chi-square tests show no rejection of the null hypothesis for positive or negative net income in the pre-financial reform period. Nonetheless, the observed distributions of FIRST digits in positive and negative net incomes in the post-financial reform period differ significantly from the corresponding Benford distribution at the .01 and .05 level, respectively. A
337
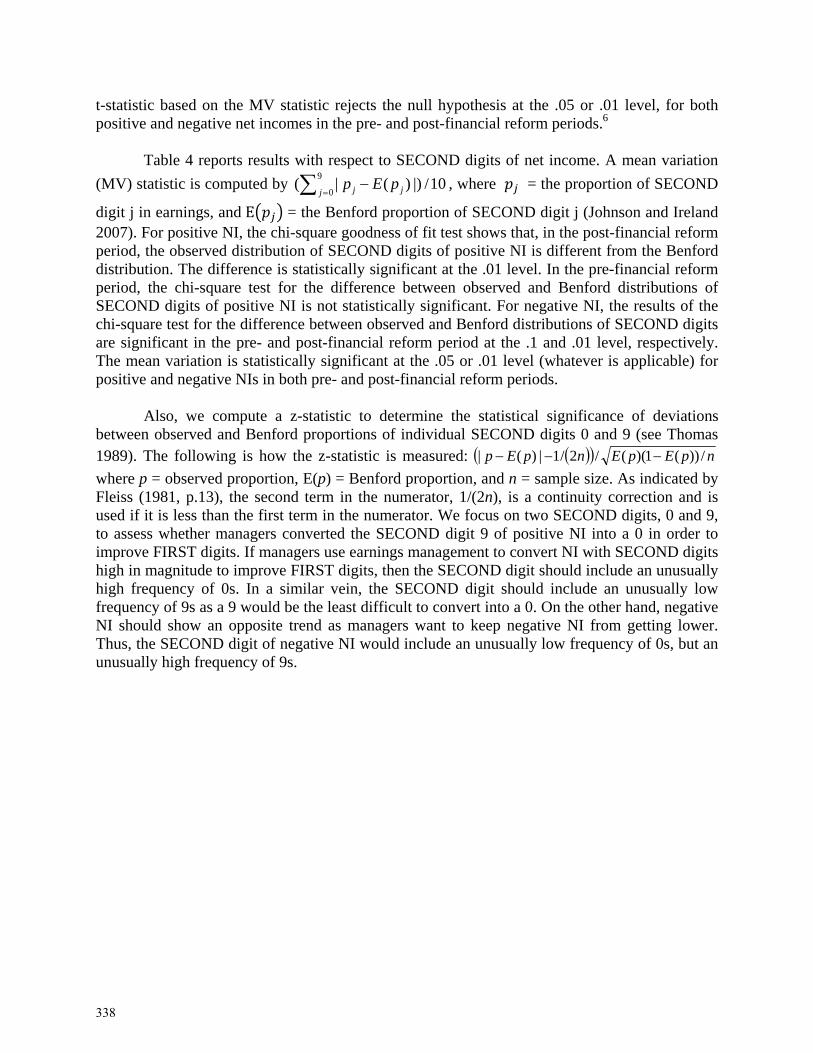
t-statistic based on the MV statistic rejects the null hypothesis at the .05 or .01 level, for both positive and negative net incomes in the pre- and post-financial reform periods.6 Table 4 reports results with respect to SECOND digits of net income. A mean variation
(MV) statistic is computed by
9
010/|))(|(
j jj pEp , where = the proportion of SECOND
digit j in earnings, and E = the Benford proportion of SECOND digit j (Johnson and Ireland 2007). For positive NI, the chi-square goodness of fit test shows that, in the post-financial reform period, the observed distribution of SECOND digits of positive NI is different from the Benford distribution. The difference is statistically significant at the .01 level. In the pre-financial reform period, the chi-square test for the difference between observed and Benford distributions of SECOND digits of positive NI is not statistically significant. For negative NI, the results of the chi-square test for the difference between observed and Benford distributions of SECOND digits are significant in the pre- and post-financial reform period at the .1 and .01 level, respectively. The mean variation is statistically significant at the .05 or .01 level (whatever is applicable) for positive and negative NIs in both pre- and post-financial reform periods. Also, we compute a z-statistic to determine the statistical significance of deviations between observed and Benford proportions of individual SECOND digits 0 and 9 (see Thomas 1989). The following is how the z-statistic is measured: npEpEnpEp /))(1)((/2/1|)(|
where p = observed proportion, E(p) = Benford proportion, and n = sample size. As indicated by Fleiss (1981, p.13), the second term in the numerator, 1/(2n), is a continuity correction and is used if it is less than the first term in the numerator. We focus on two SECOND digits, 0 and 9, to assess whether managers converted the SECOND digit 9 of positive NI into a 0 in order to improve FIRST digits. If managers use earnings management to convert NI with SECOND digits high in magnitude to improve FIRST digits, then the SECOND digit should include an unusually high frequency of 0s. In a similar vein, the SECOND digit should include an unusually low frequency of 9s as a 9 would be the least difficult to convert into a 0. On the other hand, negative NI should show an opposite trend as managers want to keep negative NI from getting lower. Thus, the SECOND digit of negative NI would include an unusually low frequency of 0s, but an unusually high frequency of 9s.
338

Table 4 SECOND Digit 0s and 9s of Net Income Compared to Benford Distributions for Listed Firms in Korea Panel A: Positive Time
Period Sample
Size Chi-
Square Goodness
of Fit
Mean Variation
(t-statistic)
Deviation from the Benford
Proportion of Zero (z-stat)
DIFF between
Deviations of
Zero (z-stat)
Deviation from the Benford
Proportion of Nine (z-stat)
DIFF between
Deviations of
Nine (z-stat)
1990-2012
23,793 74.31*** .40% (2.97)**
1.42% (6.77)***
-.89% (4.92)***
1990-96
5,136 11.28 .37% (3.83)***
.90% (1.96)**
.69% (3.62)***
-.61% (1.55)
-.29% (1.99)**
2000-2012
15,787 59.15*** .43% (2.87)**
1.59% (6.17)***
-.90% (-4.06)***
Panel B: Negative Time
Period Sample
Size Chi-
Square Goodness
of Fit
Mean Variation
(t-statistic)
Deviation from the Benford
Proportion of Zero (z-stat)
DIFF between
Deviations of
Zero (z-stat)
Deviation from the Benford
Proportion of Nine (z-stat)
DIFF between
Deviations of
Nine (z-stat)
1990-2012
5,863 66.82*** .85% (4.13)***
-1.68% (3.95)***
1.92% (5.25)***
1990-96
837 15.50* 1.07% (3.98)***
-.97% (.81)
-1.06% (2.07)**
2.13% (2.15)**
-.35% (.69)
2000-2012
4,336 48.24*** .78% (3.39)***
-2.03% (4.09)***
1.78% (4.18)***
Notes: 1. The chi-square goodness of fit test jointly determines whether the actual proportion of sample firms’ SECOND digits follows a Benford distribution.
2. A mean variation (MV) statistic is computed by 101 10/|))(|( j jj pEp , where = the observed proportion
of SECOND digit j in earnings, and E = the Benford proportion of SECOND digit j. 3. We compute deviation by subtracting the Benford proportion from the actual proportion of an applicable digit. For example, for the SECOND digit zero of positive net income in the 1990-2012 sample, we compute deviation (1.42%) by subtracting 11.97% (the Benford proportion) from 13.39% (observed distribution). The measurement of
the z-statistic is as follows: npEpEnpEp /))(1)((/2/1|)(| where p = observed proportion, E (p) =
Benford proportion, and n = sample size. The second term in the numerator, 1/(2n), is a continuity correction. It is used when it is less than the first term. 4. DIFFs represent the difference between deviations in the pre- and post-financial reform periods. The two-sample z-test measures the statistical significance of DIFF. The following is the measurement of this test statistic for DIFF:
prepostprepost nnpppp 111/)( , where pk = observed proportion, nk = sample size, k is the time period
(post-reform or pre-reform), and p = prepostpreprepostpost nnnpnp ** .
***, **, and * indicate statistical significance at the .01, .05, and .1 level, respectively (t-statistic and z-statistic significance levels are based on two-tailed tests). We compute deviations by subtracting the Benford frequencies of 0s and 9s from their corresponding observed frequencies. For example, the deviation of SECOND digit 0s of positive
339

NI in the 1990-2012 time period of 1.42% is computed by subtracting 11.97% (the Benford proportion) from 13.39% (observed proportion). 7 The z-statistics document the statistical significance of the deviations. In the post-financial reform period, positive (negative) NI demonstrates an observed frequency of 0s that is higher (lower) than its corresponding Benford proportion by 1.59% (2.03%); the deviation is statistically significant at the .01 level. Also, in the post-reform period, positive (negative) NI shows an observed frequency of 9s that is lower (higher) than its corresponding Benford proportion by 0.90% (1.78%); the deviation is statistically significant at the .01 level. In the pre-financial reform period, the actual frequency of SECOND digit 0s of positive NI is higher than its corresponding Benford proportion by 0.90%; the deviation is statistically significant at the .05 level. However, SECOND digit 9s of positive NI do not show a significant decline relative to the Benford proportion. Also, in the pre-reform period, the frequency of SECOND digit 9s of negative NI is greater than its corresponding Benford distribution by 2.13% and the deviation is statistically significant at the .05 level; but the frequency of SECOND digit 0s of negative NI is not significantly different from that of its corresponding Benford proportion. In the post-financial reform period, for positive NI, a relatively large proportion of SECOND digit 0s coupled with a relatively small proportion of SECOND digit 9s implies that managers likely used earnings management to convert a SECOND digit 9 to improve the FIRST digit. On the other hand, for negative NI, a relatively small proportion of SECOND digit 0s in conjunction with a relatively large proportion of SECOND digit 9s indicates that managers try to suppress the level of FIRST digits by avoiding the conversion of SECOND digit 9s. The results are somewhat weaker in the pre-financial reform period. For example, there is an unusually high frequency of SECOND digit 0s for positive NI. However, the difference between observed and Benford frequencies of SECOND digit 9s is negative but insignificant at conventional levels. Further, the chi-square goodness of fit test for positive NI during the pre-reform period is not statistically significant. For negative NI in the pre-reform period, there is an unusually high proportion of SECOND digit 9s. On the other hand, the observed proportion of SECOND digit 0s is less than the Benford proportion but insignificant. The chi-square goodness of fit test for FIRST digits of negative NI in the pre-reform period is statistically significant at the 0.10 level. In order to document a change in the trend, we compare deviations of SECOND digit 0s and 9s between pre- and post-financial reform periods by computing DIFF. We compute DIFF by subtracting the deviation of SECOND digit 0s or 9s in the pre-financial reform period from its counterpart in the post-financial reform period. For example, we compute DIFF of positive NI (.69%) by subtracting the deviation of SECOND digit 0s in the pre-financial reform period (.90%) from its counterpart in the post-financial reform period (1.59%). We apply the same method in computing DIFFs for SECOND digit 9s of positive NI and SECOND digit 0s and 9s of negative NI. The two-sample z-test measures the statistical significance of DIFF. The calculation of the two-sample z-test statistic for DIFF is as follows: prepostprepost nnpppp 11 - 1/)( , where
pk = observed proportion, nk = sample size, k is the time period (post-reform or pre-reform), and
340
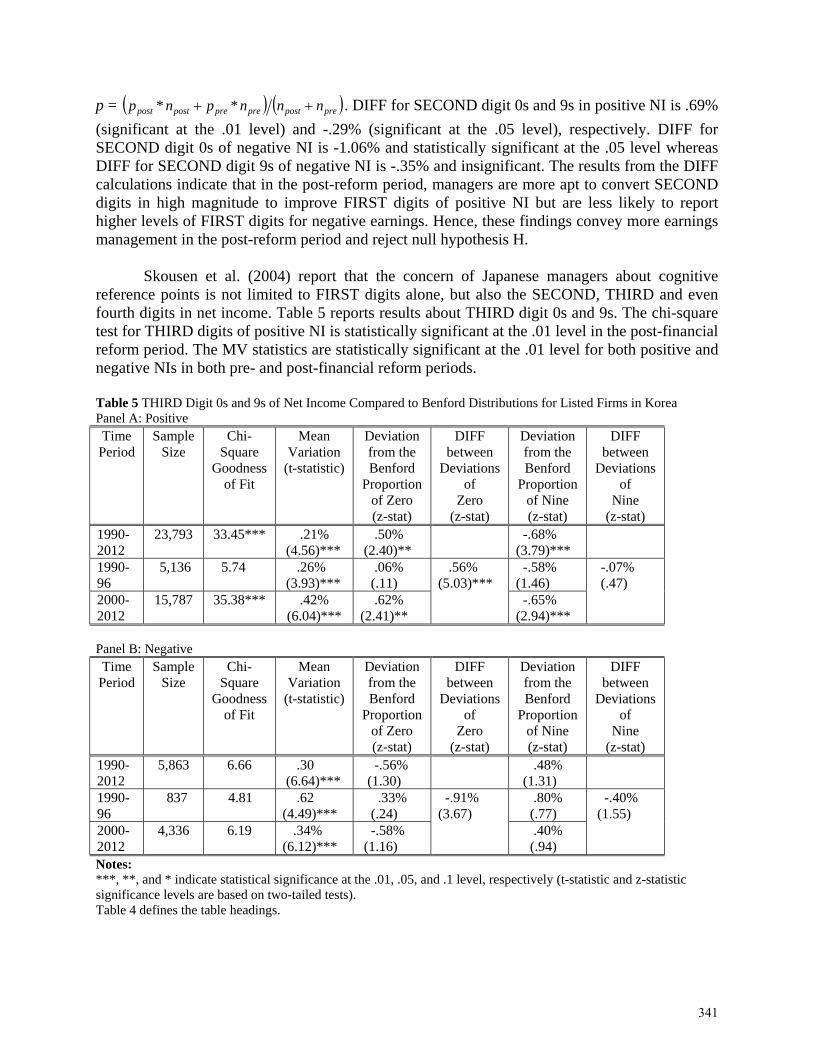
p = prepostpreprepostpost nnnpnp ** . DIFF for SECOND digit 0s and 9s in positive NI is .69%
(significant at the .01 level) and -.29% (significant at the .05 level), respectively. DIFF for SECOND digit 0s of negative NI is -1.06% and statistically significant at the .05 level whereas DIFF for SECOND digit 9s of negative NI is -.35% and insignificant. The results from the DIFF calculations indicate that in the post-reform period, managers are more apt to convert SECOND digits in high magnitude to improve FIRST digits of positive NI but are less likely to report higher levels of FIRST digits for negative earnings. Hence, these findings convey more earnings management in the post-reform period and reject null hypothesis H. Skousen et al. (2004) report that the concern of Japanese managers about cognitive reference points is not limited to FIRST digits alone, but also the SECOND, THIRD and even fourth digits in net income. Table 5 reports results about THIRD digit 0s and 9s. The chi-square test for THIRD digits of positive NI is statistically significant at the .01 level in the post-financial reform period. The MV statistics are statistically significant at the .01 level for both positive and negative NIs in both pre- and post-financial reform periods. Table 5 THIRD Digit 0s and 9s of Net Income Compared to Benford Distributions for Listed Firms in Korea Panel A: Positive Time
Period Sample
Size Chi-
Square Goodness
of Fit
Mean Variation
(t-statistic)
Deviation from the Benford
Proportion of Zero (z-stat)
DIFF between
Deviations of
Zero (z-stat)
Deviation from the Benford
Proportion of Nine (z-stat)
DIFF between
Deviations of
Nine (z-stat)
1990-2012
23,793 33.45*** .21% (4.56)***
.50% (2.40)**
-.68% (3.79)***
1990-96
5,136 5.74 .26% (3.93)***
.06% (.11)
.56% (5.03)***
-.58% (1.46)
-.07% (.47)
2000-2012
15,787 35.38*** .42% (6.04)***
.62% (2.41)**
-.65% (2.94)***
Panel B: Negative Time
Period Sample
Size Chi-
Square Goodness
of Fit
Mean Variation
(t-statistic)
Deviation from the Benford
Proportion of Zero (z-stat)
DIFF between
Deviations of
Zero (z-stat)
Deviation from the Benford
Proportion of Nine (z-stat)
DIFF between
Deviations of
Nine (z-stat)
1990-2012
5,863 6.66 .30 (6.64)***
-.56% (1.30)
.48% (1.31)
1990-96
837 4.81 .62 (4.49)***
.33% (.24)
-.91% (3.67)
.80% (.77)
-.40% (1.55)
2000-2012
4,336 6.19 .34% (6.12)***
-.58% (1.16)
.40% (.94)
Notes: ***, **, and * indicate statistical significance at the .01, .05, and .1 level, respectively (t-statistic and z-statistic significance levels are based on two-tailed tests). Table 4 defines the table headings.
341

The observed frequency of THIRD digit 0s in positive NI is greater than its Benford proportion by .62% in the post-financial reform period; the deviation is statistically significant at the .05 level. The frequency of THIRD digit 9s in positive NI in the post-reform period is less than its Benford proportion by 0.65%; the deviation is statistically significant at the .01 level. There is no statistically significant deviation for THIRD digit 0s or 9s of positive NI in the pre-financial reform period, as well as for THIRD digit 0s or 9s of negative NI in the pre- and post-financial reform periods. We also compute DIFF for THIRD digits. For 0’s in positive NI, DIFF is 0.56% and significant at the .01 level. For the other cases, DIFF is insignificant at conventional levels.8 We now examine whether managers of Korean firms engaged in converting positive NI with SECOND digits in high magnitude to add one more digit to NI. For example, if earnings are $990,000, i.e. six digits, they could report seven digits, $1,000,000, by adding only $10,000. Adding one more digit to earnings is likely even more attractive to managers than improving the magnitude of the FIRST digit. In Table 6, we choose firm observations with positive NI and with a FIRST digit 1 in conjunction with a SECOND digit 0 or a FIRST digit 9 together with a SECOND digit 9. Table 6 SECOND Digit 0 (9) of Net Income Contingent upon FIRST Digit 1 (9) for Listed Firms in Korea
Time Period
FIRST Digit
Sample Size
SECOND Digit
Deviation from the Benford Proportion of Zero or Nine (z-
statistic)
DIFF (z-statistic)
1990-96 1 1,511 0 3.38% (4.01)***
.65 (.61)
2000-12 1 4,686 0 4.03% (8.48)***
1990-96 9 228 9 -2.35% (1.15)
1.41 (.70)
2000-12 9 649 9 -.94% (.79)
Notes: 1. The sample size is the number of observations with a FIRST digit of 1 (9). 2. Deviation: a difference between the observed proportion and the Benford proportion of the SECOND digit 0 (9) contingent upon a given FIRST digit of 1 (9). For example, for FIRST digit 1 in conjunction with SECOND digit 0 in the pre-financial reform period, we compute the deviation of 3.38% by subtracting 11.97% (the Benford proportion of SECOND digit 0) from 15.35% (observed distribution of SECOND digit 0, contingent on FIRST digit 1). Table 4 shows the corresponding z-statistic. 3. DIFF: difference between deviations in the pre- and post-financial reform periods. The two-sample z-test measures the statistical significance level of DIFF. Its z-statistic, shown in Table 4, measures the statistical significance of DIFF. *** indicates statistical significance at the .01 level (significance level based on two-tailed tests). The sample sizes shown in Table 6 are the numbers of observations with a FIRST digit 1 or 9 (whatever is applicable). For income numbers with FIRST digit 1s, we compute a deviation by subtracting 11.97% (Benford's proportion of SECOND digit 0s) from an observed proportion of SECOND digit 0s. For example, for FIRST digit 1 in conjunction with SECOND digit 0 in the pre-financial reform period, the deviation 3.38% is computed by subtracting 11.97% (Benford proportion) from 15.35% (observed proportion). In both pre- and post-financial reform periods, managers of Korean firms appear to try to create FIRST digit 1s by converting pre-managed NI
342
amounts. Deviations in both time periods are positive and statistically significant at the .01 level. On the other hand, we observe frequencies of FIRST digits 9s in combination with second digit 9s that are less than the Benford proportion in both pre- and post-financial reform periods. However, the deviations are not statistically significant, possibly due to the small sample sizes of firms with FIRST and SECOND digit 9s.9 Moreover, the DIFF values in Table 6 are statistically insignificant.
5. CONCLUSIONS
The financial reforms in Korea have resulted in a massive overhaul of its financial systems by importing rules and regulations from advanced countries, particularly the U.S, and by the establishment of the KASB. In addition, oversight has significantly improved due to the establishment of audit committees, increases in the proportions of independent board members and foreign stock ownership, expanded rights for minority shareholders, and monitoring from activist shareholder organizations. However, during the same period, Korea introduced systems that tie managers’ evaluations to their firms’ performance and lead to firms’ increased reliance on capital markets. The question is whether tightened accounting rules and increased oversight can effectively discourage these managers from earnings management in the presence of performance-based evaluation and market-oriented systems. This study adopts Benford's Law to examine the change in the level of earnings management over years by partitioning the sample period into the pre-financial reform period (1991-1996) and the post-financial reform period (2000-2012). Earnings management is tested by measuring proportions of SECOND digit (reading from the left) 0s and 9s in net income and then comparing them to their corresponding Benford proportions. Empirical results show that in the post- and pre-financial reform periods, firms with positive (negative) earnings report a higher (lower) proportion of SECOND digit 0s than their predicted Benford proportion while those with positive (negative) earnings report a lower (higher) proportion of SECOND digit 9s than their predicted Benford proportion. However, the results are significantly stronger in the post-financial reform period than in the pre-financial reform period. Furthermore, managers of Korean firms with positive NI appear to try to convert THIRD digit 9s to improve SECOND digits in the post-financial reform period. There is no indication of such conversion of THIRD digit 9s into SECOND digits for positive NI in the pre-financial reform period or for negative NI in the pre- or post-financial reform periods. In addition, firms appear to be eager to add one additional digit to their positive earnings in pre- and post-financial reform periods. Taken together, these findings suggest that, in the post-reform period, the incentives for earnings management from the introduction of performance-based evaluation and market-oriented systems in Korea dominate the deterrence from earnings management of the Korean reforms. Future research can examine the type of earnings management that Korean managers use to improve the FIRST digit of earnings numbers in the post-financial reform period. Lee and Seo (2010) find that discretionary accruals decrease in the post-financial reform period. This is likely due to the successful implementation of new accounting principles and increased oversight of
343

firms. Thus, in the post-financial reform period, managers may resort to less obvious forms of earnings management, such as real earnings management.
344
REFERENCES
Amsden, A. H. 1989. Asia’s Next Giant South Korea and Late Industrialization. Oxford University Press, New York.
Aono, J. Y., and L. Guan, 2008, The impact of Sarbanes-Oxley Act on cosmetic earnings management, Research in Accounting Regulation 20, pp. 205-215.
Bae, J., S.J. Chen, and C. Rowley, 2011, From a paternalistic model towards what? HRM trends in Korea and Taiwan, Personnel Review 40 (6), pp. 700-722.
Ball, R., A. Robin, and S. Wu, 2003, Incentives versus standards: Properties of accounting income in four East Asian countries, Journal of Accounting and Economics 36, pp. 235-270.
Ball, R. and L. Shivakumar, 2005, Earnings quality in U.K. private firms: comparative loss recognition timeliness. Journal of Accounting and Economics 39, pp. 83-128.
Benford, F., 1938, The law of anomalous numbers, Proceedings of the American Philosophical Society 78(4), pp. 551-572.
Brenner, G. A., and R. Brenner, 1982, Memory and markets, or why are you paying $2.99 for a widget? The Journal of Business 55, pp. 147-158.
Brown, L. D., and M. L. Caylor, 2005, A temporal analysis of quarterly earnings thresholds: propensities and valuation consequences, The Accounting Review 80, pp. 423-440.
Burgstahler, D., and I. Dichev, 1997, Earnings management to avoid earnings decreases and losses, Journal of Accounting and Economics 24, pp. 99-126.
Burgstahler, D., L. Hail, and C. Leuz, 2006, The importance of reporting incentives: Earnings management in European private and public firms. The Accounting Review 81, pp. 983-1016.
Carslaw, C.A.P.N., 1988, Anomalies in income numbers: Evidence of goal oriented behavior, The Accounting Review 63, pp. 321-327.
Chung, D.H., 2004, Introduction to South Korea’s new securities-related class action, Journal of Corporation Law 30(1), pp. 165-180.
Claessens, S., 2008, Progress in corporate governance, In Korea’s Economy 24 (Korea Economic Institute, Washington, D.C).
Cohen, D.A., A. Dey, and T.Z. Lys, 2008, Real and accrual-based earnings management in the pre- and post-Sarbanes-Oxley periods, The Accounting Review 83(3), pp. 757-787.
Cohen, D.A., and P. Zarowin, 2010, Accrual-based and real earnings management activities around seasoned equity offerings, Journal of Accounting and Economics 50, pp. 2-19.
Degeorge, F, J. Patel, and R. Zeckhauser, 1999, Earnings management to exceed thresholds, The Journal of Business 72, pp.1-33.
Durtschi, C., W. Hillison, and C. Pacini, 2004, The effective use of Benford's Law to assist in detecting fraud in accounting data, Journal of Forensic Accounting 5, pp. 17-34.
Ewert, R., and A. Wagenhofer, 2005, Economic effects of tightening accounting standards to restrict earnings management, The Accounting Review 80(4), pp. 1101-1124.
345
Fleiss, J.L. 1981. Statistical Methods for Rates and Proportions. 2nd edn. (John Wiley & Sons, Inc., New Jersey).
Fuller, J., and M.C. Jensen, 2002, Just say no to Wall Street, Journal of Applied Corporate Finance 14, pp. 41-46.
Greenspan, A., 2002, Federal Reserve Board's Semiannual Monetary Policy Report to the Congress. Testimony before the Committee on Banking, Housing, and Urban Affairs, U.S. Senate, July 16 (Government Printing Office, Washington, D.C.).
Hail, L., C. Leuz, and P. Wysocki, 2010. Global accounting convergence and the potential adoption of IFRS by the U.S. (Part I): conceptual underpinnings and economic analysis, Accounting Horizons 24 (3), pp. 355-394.
Jang, H., 2003, Evolution of corporate governance in Korea after the economic crisis. RIETI Conference, Tokyo. Available from http://www.rieti.go.jp/en/events/03011001/report.html.
Johnson, C. B., and T.C. Ireland, 2007, An empirical examination of manipulation in components of the income statement, Journal of Forensic Accounting 8(1-2), pp. 1-28.
Kim, E. H., and W. Kim, 2008, Changes in Korean corporate governance: a response to crisis, Journal of Applied Corporate Finance 20(1), pp. 47-58.
Kim, J and C. H. Yi, 2006, Ownership structure, business group affiliation, listing status, and earnings management: Evidence from Korea, Contemporary Accounting Research 23 (2), pp. 427-464.
Kinnunen, J., and M. Koskela, 2003, Who is Miss World in cosmetic earnings management? A cross-national comparison of small upward rounding of net income numbers among eighteen countries, Journal of International Accounting Research 2, pp. 39-68.
Kotkin, J. and Y. Kishimoto, 1986, “Theory F”, Inc., 8, April, 53-60. Korean Ministry of Employment and Labor (KMEL), 2015, Annual Employment Statistics [Data
file]. Available from the Korean Ministry of Employment and Labor, website: http://laborstat.moel.go.kr/.
Krause, L.B., 2000, The aftermath of the Asian financial crisis for South Korea, The Journal of the Korean Economy 1(1), pp. 1-21.
Lee, B. B., and S.D. Seo, 2010, Reforms in the Korean financial reporting systems and earnings quality, Asia-Pacific Financial Markets 17(1), pp. 51-61.
Lee, E. and S. Kim, 2006, Best practices and performance-based HR system in Korea, Seoul Journal of Business 12 (1), pp. 3-17.
Leuz, C., D. Nanda, P. D. Wysocki, 2003, Earnings management and investor protection: an international comparison, Journal of Financial Economics 69, pp. 505-527.
Newcomb, S., 1881, Note on the frequency of use of the different digits in natural numbers, American Journal of Mathematics 4, pp. 39-40.
Nigrini, M.J. 2011. Forensic Analytics: Methods and Techniques for Forensic Accounting Investigations. (John Wiley & Sons, Inc., New Jersey).
346
Niskanen, J., and M. Keloharju, 2000, Earnings cosmetics in a tax-driven accounting environment: evidence from Finnish public firms, The European Accounting Review 9, pp. 443-452.
Park, D.J., 2001, The change of labour policy and its effects on the labour market in Korea. Management Research News 23, pp. 48-49.
Rodriguez, R.J., 2004, Reducing false alarms in the detection of human influence on data, Journal of Accounting, Auditing & Finance 19(2), pp. 141-158.
Skousen, C.J., L. Guan, and T.S. Wetzel, 2004, Anomalies and unusual patterns in reported earnings: Japanese managers round earnings, Journal of International Financial Management and Accounting 15(3), pp. 212-234.
Sul, W., and S.J. Kim, 2003, Are stock option plans utilized effectively for ventures?: evidence from Korean venture firms, Journal of Financial Management & Analysis 16(2), pp. 37-48.
Sullivan, J., 1992, Japanese management philosophies: From the vacuous to the brilliant. California Management Review 34, pp. 66-87.
Thomas, J.K., 1989, Unusual patterns in reported earnings, The Accounting Review 64(4), pp. 773-787.
Van Caneghem, T., 2002, Earnings management induced by cognitive reference points, The British Accounting Review 34, pp. 167-178.
World Federation of Exchanges (WFE), 2015, Annual statistics [Data file]. Available from the World Federation of Exchanges Web Site: http://www.world-exchanges.org/statistics
Yoon, H., Y. N. Kee, and Y. J. Shin, 2002, Corporate governance, International Financial Law Review 21, pp. 37-38.
347

APPENDIX
Timetable of the Financial Reform Process in Korea
On December 3, 1997, the International Monetary Fund (IMF) and the Korean government agree on a bailout fund of $57 billion. On December 29, 1997, thirteen financial reform bills are enacted to restructure the financial systems in Korea to comply with the stipulations in the bailout agreement. There are reforms in four major areas: corporate, financial system, labor, and public sector. The corporate reforms deal with corporate governance, in particular for chaebols (a South Korean form of conglomerate). The objectives of the financial system reforms are to strengthen legal and regulatory infrastructure in the Korean capital market. The goal of the labor reforms is to improve flexibility in the labor market (e.g., legalizing layoffs). The public sector reforms focus on improving the accountability of public agencies. The timetable lists corporate and financial system reform events, which are of interest for this project.
Corporate Reform Date Financial System Reform
December 1997
Foreigners can own commercial banks.
The five guidelines for chaebols are: 1) Enhancement of management
transparency by reforming accounting systems, protecting minority shareholders’ rights and mandating outside directors;
2) increase in accountability of major shareholders;
3) elimination of cross-debt guarantees within a chaebol;
4) improvement of capital structures; and
5) specialization in core business lines.
January 1998
Listed firms on the Korea Stock Exchange (KSE) are required to include outside directors for at least one quarter of their boards.
February 1998
Foreign firms can merge with or acquire Korean companies.
The shareholding threshold for derivative actions (e.g., inspection of books) against listed firms is reduced to 0.1% of outstanding shares from 5%.
May 1998 1) Foreigners can invest in listed firms in the KSE and the KOSDAQ.
2) Foreigners can become bank executives.
July 1998 Foreigners can invest in non-listed firms and real estate.
Introduction of a cumulative voting system for shareholders with less than 3% of outstanding shares.
June 1999
September 1999
The Korean government establishes the Korea Accounting Institute (KAI), which consists of five organizations: 1) The General Membership, 2) the Board of Directors,
348
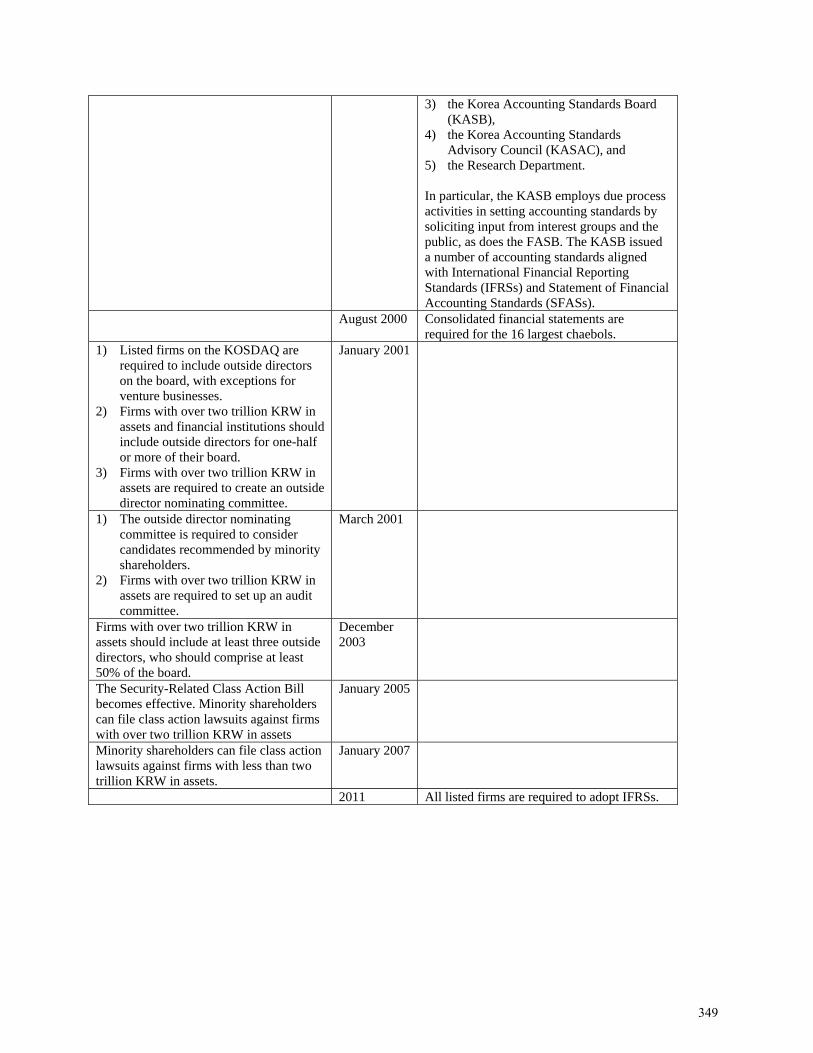
3) the Korea Accounting Standards Board (KASB),
4) the Korea Accounting Standards Advisory Council (KASAC), and
5) the Research Department. In particular, the KASB employs due process activities in setting accounting standards by soliciting input from interest groups and the public, as does the FASB. The KASB issued a number of accounting standards aligned with International Financial Reporting Standards (IFRSs) and Statement of Financial Accounting Standards (SFASs).
August 2000 Consolidated financial statements are required for the 16 largest chaebols.
1) Listed firms on the KOSDAQ are required to include outside directors on the board, with exceptions for venture businesses.
2) Firms with over two trillion KRW in assets and financial institutions should include outside directors for one-half or more of their board.
3) Firms with over two trillion KRW in assets are required to create an outside director nominating committee.
January 2001
1) The outside director nominating committee is required to consider candidates recommended by minority shareholders.
2) Firms with over two trillion KRW in assets are required to set up an audit committee.
March 2001
Firms with over two trillion KRW in assets should include at least three outside directors, who should comprise at least 50% of the board.
December 2003
The Security-Related Class Action Bill becomes effective. Minority shareholders can file class action lawsuits against firms with over two trillion KRW in assets
January 2005
Minority shareholders can file class action lawsuits against firms with less than two trillion KRW in assets.
January 2007
2011 All listed firms are required to adopt IFRSs.
349
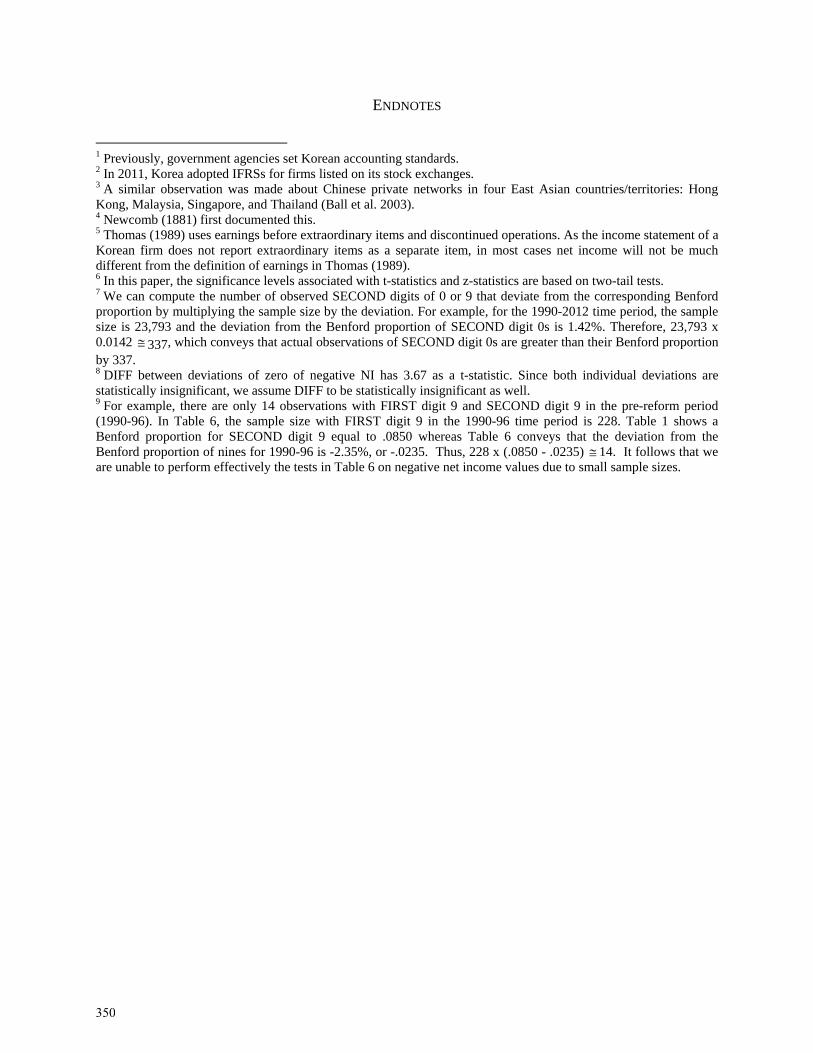
ENDNOTES
1 Previously, government agencies set Korean accounting standards. 2 In 2011, Korea adopted IFRSs for firms listed on its stock exchanges. 3 A similar observation was made about Chinese private networks in four East Asian countries/territories: Hong Kong, Malaysia, Singapore, and Thailand (Ball et al. 2003). 4 Newcomb (1881) first documented this. 5 Thomas (1989) uses earnings before extraordinary items and discontinued operations. As the income statement of a Korean firm does not report extraordinary items as a separate item, in most cases net income will not be much different from the definition of earnings in Thomas (1989). 6 In this paper, the significance levels associated with t-statistics and z-statistics are based on two-tail tests. 7 We can compute the number of observed SECOND digits of 0 or 9 that deviate from the corresponding Benford proportion by multiplying the sample size by the deviation. For example, for the 1990-2012 time period, the sample size is 23,793 and the deviation from the Benford proportion of SECOND digit 0s is 1.42%. Therefore, 23,793 x 0.0142 337, which conveys that actual observations of SECOND digit 0s are greater than their Benford proportion by 337. 8 DIFF between deviations of zero of negative NI has 3.67 as a t-statistic. Since both individual deviations are statistically insignificant, we assume DIFF to be statistically insignificant as well. 9 For example, there are only 14 observations with FIRST digit 9 and SECOND digit 9 in the pre-reform period (1990-96). In Table 6, the sample size with FIRST digit 9 in the 1990-96 time period is 228. Table 1 shows a Benford proportion for SECOND digit 9 equal to .0850 whereas Table 6 conveys that the deviation from the Benford proportion of nines for 1990-96 is -2.35%, or -.0235. Thus, 228 x (.0850 - .0235) 14. It follows that we are unable to perform effectively the tests in Table 6 on negative net income values due to small sample sizes.
350
2015 PLS Applications Symposium1
The Effect of Information and Communications Technology Diffusion on Corruption and Transparency:
A Global Study Employing Robust Path Analysis
LEEBRIAN GASKINS Texas A&M International University, Laredo, TX, USA
NED KOCK Texas A&M International University, Laredo, TX, USA
Is the diffusion of information and communication technologies (ICTs) the “magic bullet” for effectively reducing corruption? Can government transparency be increased by ICT diffusion? Does ICT diffusion increase governmental transparency, thereby reducing corruption? A few previous studies have measured the relationship between ICTs, transparency, and corruption. Generally, such studies focused on the role of electronic governance (e-governance) in facilitating state-citizen interactions and how e-governance acts as a corruption deterrent. This study digresses from past literature by directly exploring the effects of the ICT environment, using the Networked Readiness Index (NRI), and diffusion of two specific ICTs (e.g. the number of Internet users per 100 people and mobile cellular phone users per 100 people) on corruption and transparency through robust path analysis. This study also examines how macroeconomic and national sociocultural variables mediate and moderate the relationships of ICTs on transparency and corruption. The results show that for each increase unit in NRI, transparency increased by 9.423% and corruption decreased by 14.017%. Furthermore, increasing access to the Internet by 27 people per 100 persons increased transparency by 17.581% and reduced corruption by 15.239%. Additionally, each unit increase in per capita GDP results in an increase in transparency by 7.068% and a decrease in corruption by 10.507%. Conversely, increases in FDI and mobile cellular diffusion demonstrated marginal results on increasing transparency and reducing corruption. Implications of these findings as well as avenues for further research are discussed. KEYWORDS Multivariate Statistics, Robust Path Analysis, Partial Least Squares, Information and Communications Technology, Government Corruption
1 For additional information on the 2015 PLS Applications Symposium, please visit: http://plsas.net/
351
2015 PLS Applications Symposium1
The Moderating Effect of Industry Concentration on the Relationship between Corporate Social Responsibility and Firm
Performance
CAU N. NGUYEN Texas A&M International University, Laredo, Texas, USA
ALBI ALIKAJ Texas A&M International University, Laredo, Texas, USA
EFRAIN MEDINA Texas A&M International University, Laredo, Texas, USA
The relationship between corporate social responsibility (CSR) and firm performance has been studied extensively by many scholars. However, this relationship has proven inconclusive due to the mixed results produced in extant literature. The purpose of our paper is to test whether industry concentration plays a role in such inconsistencies. We base our study on the idea that consumers are more likely to purchase from firms that have engaged in CSR activities. We also draw from the industrial organization literature and argue that higher industry concentration reduces the bargaining power of buyers. In a higher concentrated industry, consumers have fewer choices, and whether or not the firm engages in CSR activities does not affect the consumers’ purchase decision. Therefore, industry concentration acts as a moderator of the CSR-firm performance relationship. We use data from KLD and Compustat and test our hypotheses using a PLS-based structural equation modeling analysis. The findings of our study show that as industry concentration increases, the relationship between CSR and firm performance decreases. KEYWORDS Corporate Social Responsibility, SEM, Industrial Organization, Industry Concentration
1 For additional information on the 2015 PLS Applications Symposium, please visit: http://plsas.net/
352

2015 PLS Applications Symposium1
Effects of Corruption and Regulation on Firm: A Multiple-Country Study
WEI NING Texas A&M international University, Laredo, Texas, USA
CASSANDRA WHEELER Texas A&M international University, Laredo, Texas, USA
PRITY PATEL Texas A&M international University, Laredo, Texas, USA
Economics literature suggests that both regulation and corruption pose threats for economic growth. However, their effects are primarily studied on national or regional level, resulting in limited implications for companies operating in areas where both corruption and regulation hinder business operations. Using a data set obtained from a large scale, multiple-country firm level survey, we found that both regulation and corruption are positively and significantly associated with a company’s willingness to make informal payment in order to get business done. This study provides micro-level support for the general belief that corruption and regulation hurt business. Managerial implications and direction for future research are also discussed. KEYWORDS corruption, regulation, informal payment, developing economy.
1 For additional information on the 2015 PLS Applications Symposium, please visit: http://plsas.net/
353

2015 PLS Applications Symposium1
Does Internet and National Culture Influence a Country’s Perception of Corruption?
CASSANDRA WHEELER Texas A&M International University, Laredo, Texas, USA
EFRAIN MEDINA Texas A & M International University, Laredo, Texas, USA
There are some studies that have measured the relationship between internet usage, Hofstede’s dimensions of national culture, and corruption levels. These studies focus on the role of internet usage as a mean to reduce levels of corruption which increases the transparency of a government. This study attempts to illustrate the influence of internet usage and three of Hofstede’s dimensions of national culture on the corruption levels by gathering data from 64 countries from the year 2009 to 2013. The Warp PLS software results revealed that as internet usage increased there is a reduction in a country’s corruption levels. Furthermore, the results also showed that there is no statistical significance between power distance, individualism, and uncertainty avoidance on corruption levels in countries. Our findings illustrate that internet usage has a crucial role in the reduction of corruption which is important in a society that is becoming more technological-oriented. KEYWORDS Information and communication technologies, national culture, corruption perception, internet users, power distance, individualism, uncertainty avoidance, transparency.
1 For additional information on the 2015 PLS Applications Symposium, please visit: http://plsas.net/
354
The New Determinant Creation Theory: The Case of Mexico
JUAN CARLOS BOTELLO, PHD1 Business School, Universidad Popular Autónoma del Estado de Puebla, México
MARTÍN DÁVILA, PHD
Social Sciences School, Universidad Popular Autónoma del Estado de Puebla, México According to the literature related to the movement of foreign direct investment (FDI) worldwide, there are two main causes for these flows. The first one is related to the decision taken by companies to invest in certain markets according to their own international strategy and, the second corresponds to the government’s policy designed to attract capital through the use of various factors such as infrastructure, skilled labor, cheap labor, industrial policy, natural resources, gross domestic product, the legal system, geographic location, cancellation fees, among others. Thus, governments attract capitals to certain types of industries using the attractiveness of their determinants. Considering the above approach, if a government wants to attract capital, should it create new determinants to attract new investments flows or renew the most common used to? This paper is based on the application of the new determinant creation theory. To demonstrate it, Mexico was divided into three regions such as the north, center and south. Each region has certain number of states. The center of the country is the region that captured the largest amount of FDI inflows due to the use of some strategic determinants. KEYWORDS Foreign direct investment, determinants, public policy, theories
1 Address correspondence to Juan Carlos Botello, PhD, Business School, Universidad Popular Autónoma del Estado de Puebla, México. E-mail: [email protected]
355
1. INTRODUCTION In recent years, FDI has grown faster than trade flows and global production for various reasons such as political and economic changes in many developing countries, which are characterized by the change to democratic political systems as well as changes toward economic and legal systems oriented in the direction of trade liberalization in which Mexico played an important role since 1986 when signed as a GATT member.
Many developing countries have made economic and structural arrangements in order to obtain some benefits and attract FDI. Because of such liberalization and changes, the FDI increased in developing countries in the 1990´s (Erdal and Tatoglu, 2002).
Since 1993, the FDI became an important source of private capitals outflows and inflows
for Mexico as well as for many countries around the world. From that year, Mexico's public policy oriented to FDI flows uptake changed since a new foreign investment law was created. The new law expressed the need to encourage domestic and foreign productive investment within the country. Later on, in 2007 the PROMEXICO federal office was open for the purpose of attracting investment flows through different strategies like working together with the 32 states to make them attractive to foreign capitals.
The attractiveness of a state or a city depends on the number and kind of determinants
they possess. Based on the 32 Mexico´s states reports, the most relevant determinants used to obtain FDI are infrastructure, skilled labor, low labor cost, security, tax-break, natural resources, gross domestic product, legal system, geographical location and industrial policy. Related to industrial policy, Deichmann et al. (2003) found that some factors determining the spatial decisions of multinational firms in a Middle East country depend on policy implications. Considering the above, the government agenda should focus on making the country more attractive for FDI, especially in times of crisis when traditional determinants are put to the test and inspire proposals for new opportunities.
Popovici (2012) notes that the idea of entering a new era of determinants of FDI is not new as there are several studies that highlight the key factors for attracting FDI. This emphasizes that the classical theories of FDI probably should be changed and others should be based on the emergence of new local capacities.
This research is divided as follows. In second part, a literature review is offered. Several
papers were analyzed to describe the key factors for attracting FDI based on classical theories in order to compare them with the determinants used by Mexican government during 2000 to 2013. Section three includes the data and variables used to demonstrate the models proposed in section five. Descriptive statistics are presented in section four and finally, conclusions are discussed in section six.
356
2. LITERATURE REVIEW Most of the literature related to the attraction of FDI by countries is based on different theories such as localization economies and their determinants or related to trade and resource endowments. In that sense, the eclectic paradigm of Dunning (1988) argues that the path FDI takes is partly due to the specific advantages which one country has, based upon its regional geographic location and / or location in the world. These advantages arise from using resource endowments and / or assets held abroad by some countries in the world which are attractive to a company by combining them with its own resources.
That combination suggests that if a foreign company wants to use the resources of a country, it should establish a subsidiary by initiating a flow of FDI and then establish a start-up of an operating facility (Hill, 2008).
Likewise, the theory of international production suggests that the decision of a company to start manufacturing operations in other countries depends on certain attractions that the country of origin of the company has compared to the resources and benefits that it will obtain in locating a manufacturing subsidiary abroad (Morgan and Katsikeas, 1997). The theory of trade and resource endowment explains that FDI is directed toward countries with low wages and abundant natural resources that provide inherent differences of opportunity and initial favorable conditions for businesses.
There is a consensus as to the characteristics required for a host country to attract FDI which is that it depends on the motivations that foreign investors have in relation to their investment projects . According to Dunning (1983), the first reason is related to the market, whose main purpose is to serve local and regional markets from the FDI host country if the market grows and generate some return for the investor, the second relates to the investment made by a company in acquiring resources that are not available in the country of origin such as natural resources and low-cost inputs including labor. The latter corresponds to the level of efficiency achieved through the dispersion of value chain activities considering that the geographical proximity to the country of origin will minimize transportation costs. All this suggests that the direction in which FDI is aimed, is highly related to the comparative advantages (Kinoshita, 2003) of a given country. Then, one country that has, among other determinants, access to markets as well as cheap labor and abundant natural resources will attract large inflows of FDI.
Berkoz (2009) argues that countries have traditional factors and environmental variables that are attractive to foreign companies. The traditional factors are market potential, labor costs, economic growth and government policies. The environmental variables correspond to political, economic, legal and infrastructural factors.
Kinoshita (2003) in turn, maintains that the most important determinants a country has to attract FDI are government institutions, natural resources and economies of agglomeration. Government institutions are one factor contributing to decisions by investors as to whether to invest or not in a particular country because these institutions directly affect the operating conditions of enterprises. The investment cost for companies is not only economic but they also
357
have to fight against entrenched practices in countries such as bribery and time lost in engaging in diverse and various negotiations resulting from the arrival of the company to a new market. Therefore, for the operating conditions of a company to appear reliable to the investor, there are two institutional variables to be considered: The legal system and the quality of the bureaucracy. As for the legal system, both its impartiality as well as popular perception of it is good determinants of the reliability of legal institutions in the country. Likewise, the variable related to the quality of the bureaucracy describes a non-political and professional bureaucracy which in turn facilitates the procedures for staff to be hired. With respect to agglomeration economies, investors seek those markets where there are benefits derived from the concentration of economic units which results in positive externalities (benefits and technological spill, use of skilled labor and concentrated in specific locations and links forward and backward with related industries) but also by investments made by other investors which can be seen as a positive sign of favorable investment conditions reducing uncertainty. As for the natural resources, Rasiah (2000) argues that developing economies with a resource-rich endowment obtains FDI.
Other studies describing the FDI determinants indicate that the infrastructure, good governance, taxes (Rasiah, 2000) and the labor market are conditions that governments must maintain (Bellak, et. al., 2010) but Lim (1983) found a negative relationship between investment incentives and FDI in 27 developing countries.
Groh and Wich (2009) describe the attractions to attract FDI in a country as labor costs, quality and the provision of quality infrastructure and legal systems. On the other hand, some authors consider that the provision of infrastructure should be a precondition for companies to establish subsidiaries in foreign markets as are a major emphasis on the provision of transport infrastructure as well as information and communication technologies (Botric and Skuflic, 2006, Goodspeed, et. al., 2009).
Studies by Wei et al. (1999), Mariotti and Piscitello (1995), Broadman and Sun (1997) and He (2002) conclude that there is a positive relationship between infrastructure and FDI because the better the infrastructure is in a location the higher its desirability. Rasiah (2000), states out that FDI in developing countries is concentrated in economies endowed with good infrastructure.
In a recent research conducted by Botello and Davila (2013), concluded that public policy used in some states of Mexico to attract FDI, is based on the attractiveness of some determinants like skilled labor, cheap labor and infrastructure.
As opposed to what Botello and Davila (2013) concluded, Ondrich and Wasylenko (1993) and Rasiah (2000) found that there is no evidence that wages affect the location of new foreign plants, specially cheap labor but that it´s not the case for skilled labor. Flexible production forms have given rise to greater dispersal of organizational power as well as process innovation; local accumulation at peripheral sites has stimulated economic progress, albeit only in locations generating the requisite skills (Rasiah, 2000), suggesting that specialized FDI requires skilled labor. In the same way, Mendoza (2011) found that manufacturing companies established with foreign economic resources in Mexico demands skilled labor.
358
According to the research studies mentioned above, there are similarities in the description of the traditional determinants, which explain the attractiveness of a country with respect to foreign capital which suggests that the design of public policy in some countries and Mexico in particular, in relation to attracting financial resources from abroad, is very similar. In the case of Mexico, the statistics of attracting FDI for the period covering 2000 to 2013 show that relationship. In fact, the 32 Mexico´s states reports for 2000 to 2013 showed that the most common used determinants for attracting FDI are infrastructure, skilled labor, cheap labor, industrial policy, natural resources, gross domestic product, the legal system, geographic location, tax break and security. Berkoz (2009) found almost the same determinants for the case of Turkey and suggests that a location analysis needs to be done in order to develop specific growth strategies to be applied by policy-makers in their plans to attract FDI to certain locations.
Figueroa (2012) assumes that tax facilities, proximity to markets, and cheap labor are insufficient factors to guarantee the cycle of capital, since what stands out is the outgoing transfer of the innovation activity itself, which suggests that the attraction of new FDI flows requires the creation of new determinants or the renewal of the most used. The advance of global knowledge has become itself as an attractive determinant to catch the attention of investors. In recent years, many countries around the world are worried about the way they are going to attract capitals. Should they create new determinants or renewal the ones that are always used? As for the case of Mexico, an FDI behavior from 2000 to 2013 is described in section 5.
3. OBJECTIVES, VARIABLES, HYPOTHESES AND DATA 3.1 Objectives The objective of this research is to make a comparison between the north, the center and the south of Mexico about the use of determinants to attract FDI from 2000 to 2013 based on the new determinant creation theory. 3.2 Variables The dependent variable used in this research is: 3.2.1 fdi (amount of foreign direct investment). Foreign Direct Investment (FDI) has been
selected as a dependent variable relative to the amount of Mexico´s foreign direct investment inflows from 2000 to 2013.
The independent variables in their different modalities that will be considered for the theoretical
models are: 3.2.2 ifra (infrastructure). This variable explains if infrastructure was used as a determinant to
attract foreign direct investment from 2000 to 2013 by the 32 states of Mexico. 3.2.3 qualab (qualified labor). This variable explains if skilled labor was used as a determinant
to attract foreign direct investment from 2000 to 2013 by the 32 states of Mexico.
359
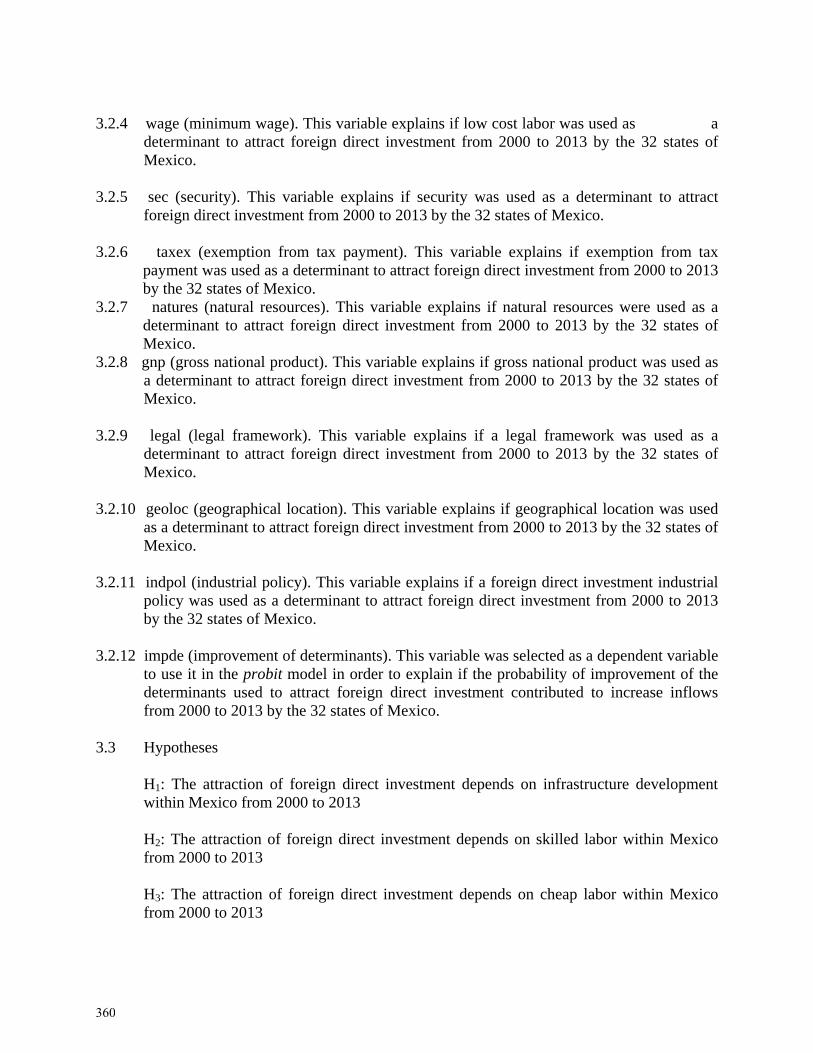
3.2.4 wage (minimum wage). This variable explains if low cost labor was used as a
determinant to attract foreign direct investment from 2000 to 2013 by the 32 states of Mexico.
3.2.5 sec (security). This variable explains if security was used as a determinant to attract
foreign direct investment from 2000 to 2013 by the 32 states of Mexico. 3.2.6 taxex (exemption from tax payment). This variable explains if exemption from tax
payment was used as a determinant to attract foreign direct investment from 2000 to 2013 by the 32 states of Mexico.
3.2.7 natures (natural resources). This variable explains if natural resources were used as a determinant to attract foreign direct investment from 2000 to 2013 by the 32 states of Mexico.
3.2.8 gnp (gross national product). This variable explains if gross national product was used as a determinant to attract foreign direct investment from 2000 to 2013 by the 32 states of Mexico.
3.2.9 legal (legal framework). This variable explains if a legal framework was used as a
determinant to attract foreign direct investment from 2000 to 2013 by the 32 states of Mexico.
3.2.10 geoloc (geographical location). This variable explains if geographical location was used
as a determinant to attract foreign direct investment from 2000 to 2013 by the 32 states of Mexico.
3.2.11 indpol (industrial policy). This variable explains if a foreign direct investment industrial
policy was used as a determinant to attract foreign direct investment from 2000 to 2013 by the 32 states of Mexico.
3.2.12 impde (improvement of determinants). This variable was selected as a dependent variable
to use it in the probit model in order to explain if the probability of improvement of the determinants used to attract foreign direct investment contributed to increase inflows from 2000 to 2013 by the 32 states of Mexico.
3.3 Hypotheses
H1: The attraction of foreign direct investment depends on infrastructure development within Mexico from 2000 to 2013 H2: The attraction of foreign direct investment depends on skilled labor within Mexico from 2000 to 2013 H3: The attraction of foreign direct investment depends on cheap labor within Mexico from 2000 to 2013
360

H4: The attraction of foreign direct investment depends on security within Mexico from 2000 to 2013 H5: The attraction of foreign direct investment depends on tax exemption within Mexico from 2000 to 2013 H6: The attraction of foreign direct investment depends on natural resources endowment within Mexico from 2000 to 2013 H7: The attraction of foreign direct investment depends on gross national product in Mexico from 2000 to 2013 H8: The attraction of foreign direct investment depends on the legal framework within Mexico from 2000 to 2013 H9: The attraction of foreign direct investment depends on geographical location of Mexico from 2000 to 2013 H10: The attraction of foreign direct investment depend on industrial policy within Mexico from 2000 to 2013 H11: The attraction of foreign direct investment depend on the improvement of the determinants within Mexico from 2000 to 2013. H12: The probability of determinants improvement will attract more foreign direct investment flows.
3.4 Data
Four hundred and sixteen yearly state reports were reviewed by the authors to build a database for this research. These reports were accumulated by the government of each state of Mexico. The determinants used to attract foreign direct investment by the 32 states during 2000 and 2013 were skilled labor, cheap labor, tax exemption, legal framework, security, natural resources, infrastructure, gross national product by state, industrial policy and geographical location which according to different authors, are the most common used around the world despite that it is not clear if the determinants are new or renewal for countries.
4. DESCRIPTIVE STATISTICS North region is integrated by Baja California, Baja California Sur, Chihuahua, Coahuila, Durango, Nuevo Leon, San Luis Potosí, Sinaloa, Sonora, Tamaulipas and Zacatecas states. Table 1 shows that Nuevo Leon did the maximum intake of FDI in 2010 with 5,379.70 US billion dollars and the minimum intake was made by Durango in 2005 with -21.
361
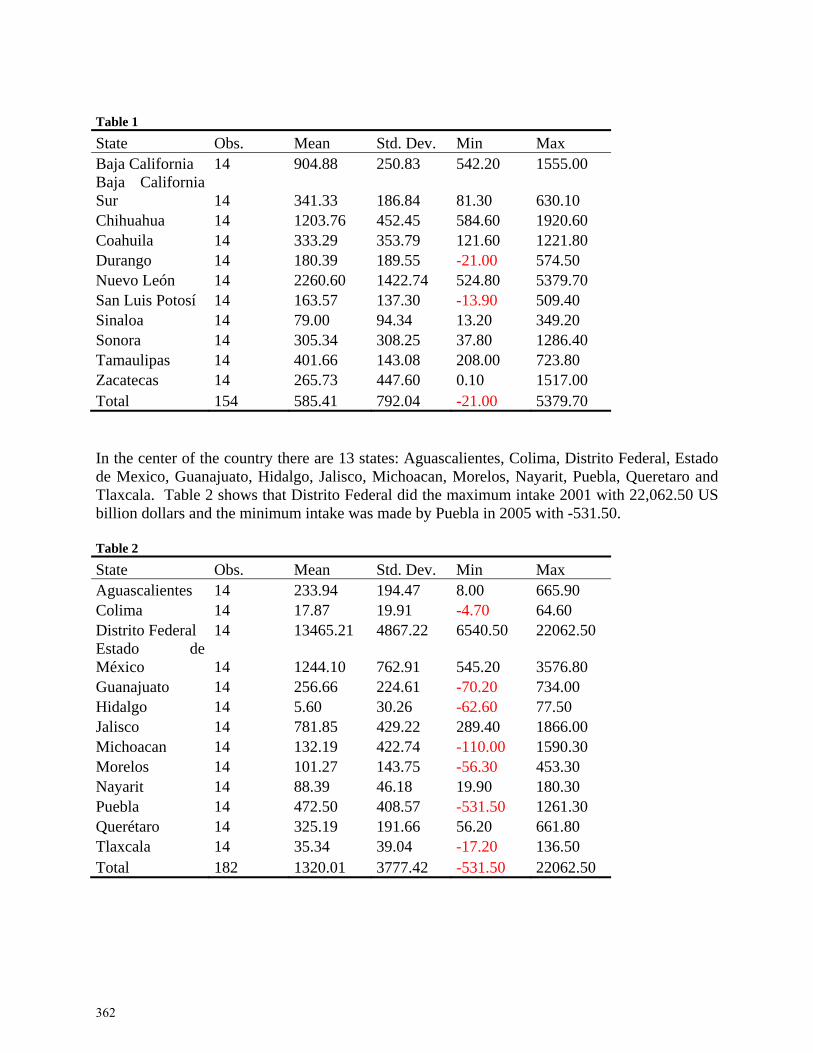
Table 1
State Obs. Mean Std. Dev. Min Max Baja California 14 904.88 250.83 542.20 1555.00 Baja California Sur 14 341.33 186.84 81.30 630.10 Chihuahua 14 1203.76 452.45 584.60 1920.60 Coahuila 14 333.29 353.79 121.60 1221.80 Durango 14 180.39 189.55 -21.00 574.50 Nuevo León 14 2260.60 1422.74 524.80 5379.70 San Luis Potosí 14 163.57 137.30 -13.90 509.40 Sinaloa 14 79.00 94.34 13.20 349.20 Sonora 14 305.34 308.25 37.80 1286.40 Tamaulipas 14 401.66 143.08 208.00 723.80 Zacatecas 14 265.73 447.60 0.10 1517.00 Total 154 585.41 792.04 -21.00 5379.70 In the center of the country there are 13 states: Aguascalientes, Colima, Distrito Federal, Estado de Mexico, Guanajuato, Hidalgo, Jalisco, Michoacan, Morelos, Nayarit, Puebla, Queretaro and Tlaxcala. Table 2 shows that Distrito Federal did the maximum intake 2001 with 22,062.50 US billion dollars and the minimum intake was made by Puebla in 2005 with -531.50. Table 2
State Obs. Mean Std. Dev. Min Max Aguascalientes 14 233.94 194.47 8.00 665.90 Colima 14 17.87 19.91 -4.70 64.60 Distrito Federal 14 13465.21 4867.22 6540.50 22062.50 Estado de México 14 1244.10 762.91 545.20 3576.80 Guanajuato 14 256.66 224.61 -70.20 734.00 Hidalgo 14 5.60 30.26 -62.60 77.50 Jalisco 14 781.85 429.22 289.40 1866.00 Michoacan 14 132.19 422.74 -110.00 1590.30 Morelos 14 101.27 143.75 -56.30 453.30 Nayarit 14 88.39 46.18 19.90 180.30 Puebla 14 472.50 408.57 -531.50 1261.30 Querétaro 14 325.19 191.66 56.20 661.80 Tlaxcala 14 35.34 39.04 -17.20 136.50 Total 182 1320.01 3777.42 -531.50 22062.50
362
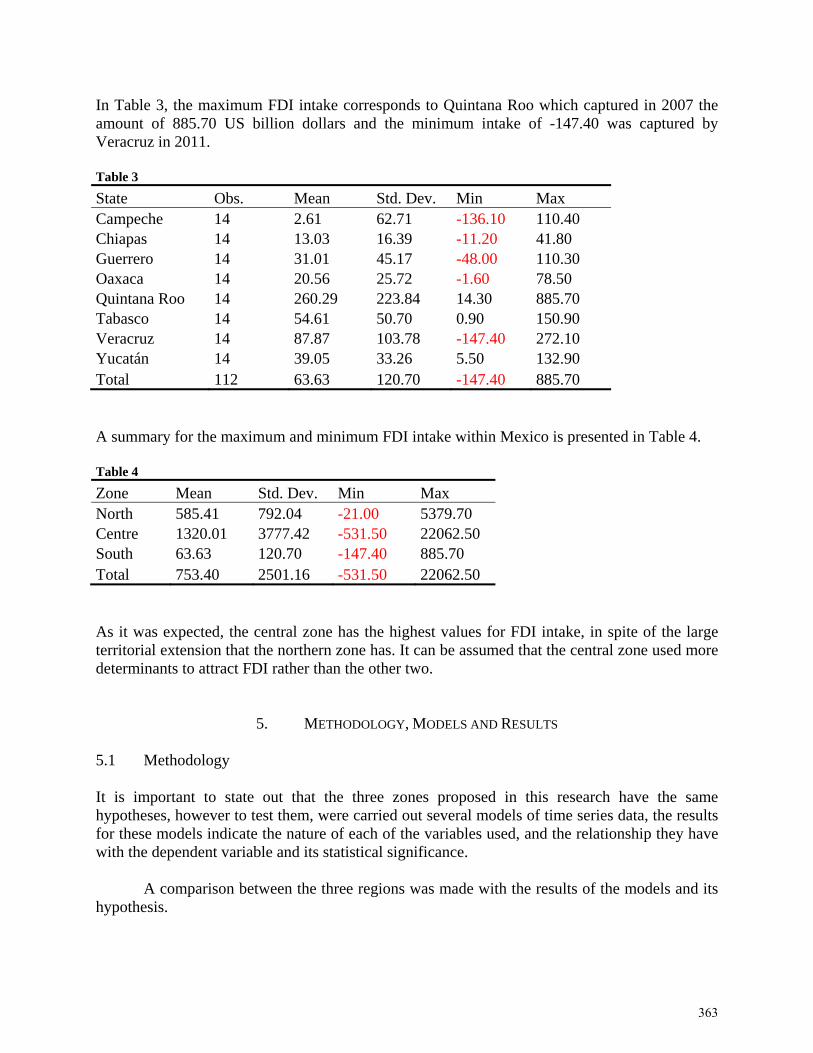
In Table 3, the maximum FDI intake corresponds to Quintana Roo which captured in 2007 the amount of 885.70 US billion dollars and the minimum intake of -147.40 was captured by Veracruz in 2011. Table 3
State Obs. Mean Std. Dev. Min Max Campeche 14 2.61 62.71 -136.10 110.40 Chiapas 14 13.03 16.39 -11.20 41.80 Guerrero 14 31.01 45.17 -48.00 110.30 Oaxaca 14 20.56 25.72 -1.60 78.50 Quintana Roo 14 260.29 223.84 14.30 885.70 Tabasco 14 54.61 50.70 0.90 150.90 Veracruz 14 87.87 103.78 -147.40 272.10 Yucatán 14 39.05 33.26 5.50 132.90 Total 112 63.63 120.70 -147.40 885.70 A summary for the maximum and minimum FDI intake within Mexico is presented in Table 4. Table 4
Zone Mean Std. Dev. Min Max North 585.41 792.04 -21.00 5379.70 Centre 1320.01 3777.42 -531.50 22062.50 South 63.63 120.70 -147.40 885.70 Total 753.40 2501.16 -531.50 22062.50 As it was expected, the central zone has the highest values for FDI intake, in spite of the large territorial extension that the northern zone has. It can be assumed that the central zone used more determinants to attract FDI rather than the other two.
5. METHODOLOGY, MODELS AND RESULTS 5.1 Methodology It is important to state out that the three zones proposed in this research have the same hypotheses, however to test them, were carried out several models of time series data, the results for these models indicate the nature of each of the variables used, and the relationship they have with the dependent variable and its statistical significance.
A comparison between the three regions was made with the results of the models and its hypothesis.
363
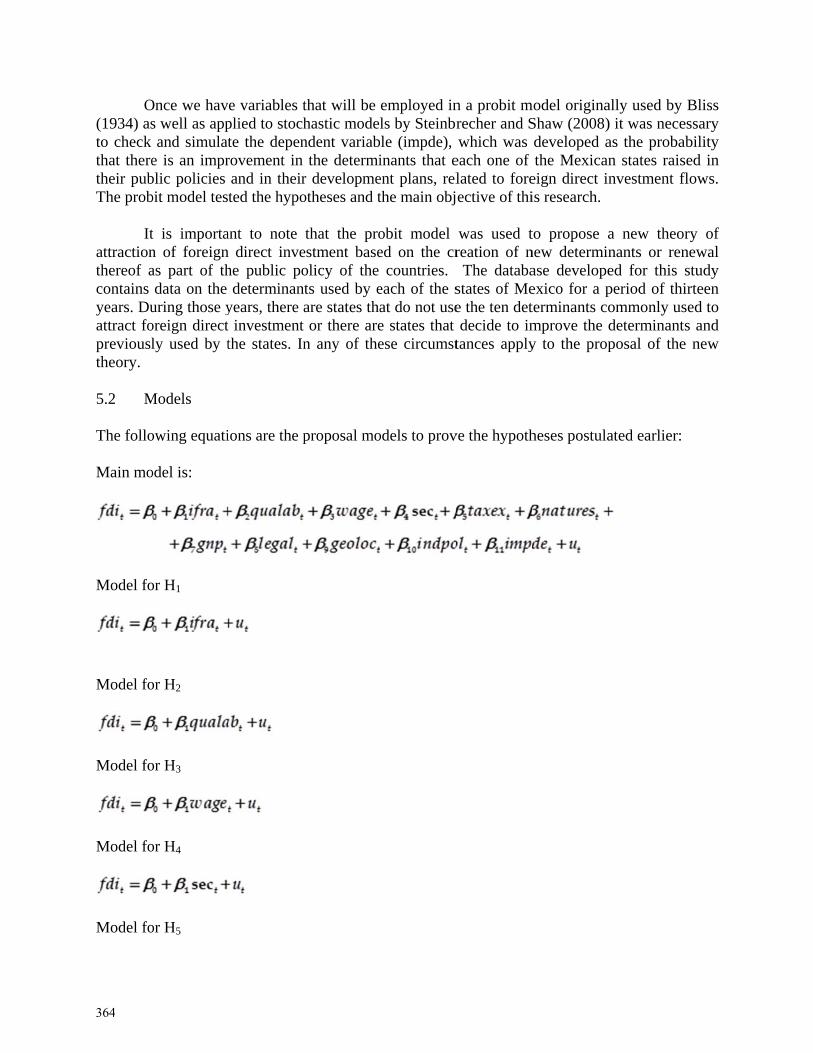
O(1934) asto check that theretheir pubThe prob
Itattractionthereof acontains years. Duattract fopreviousltheory. 5.2 M The follo Main mo
Model fo
Model fo
Model fo
Model fo
Model fo
Once we havs well as appand simulat
e is an imprblic policies bit model tes
t is importan of foreignas part of thdata on the
uring those yoreign directly used by t
Models
owing equati
odel is:
or H1
or H2
or H3
or H4
or H5
e variables tplied to stochte the depenrovement in and in theirted the hypo
ant to note n direct invehe public po
determinanyears, there at investment the states. In
ions are the p
that will be hastic modelndent variab
the determir developmeotheses and t
that the proestment baseolicy of the ts used by eare states thaor there are
n any of the
proposal mo
employed inls by Steinbrle (impde), inants that eent plans, relthe main obj
obit model ed on the cr
countries. each of the sat do not usee states that ese circumst
odels to prov
n a probit mrecher and Swhich was
each one of lated to foreective of thi
was used treation of n
The databastates of Mee the ten detdecide to im
tances apply
ve the hypoth
model originaShaw (2008)developed athe Mexican
eign direct inis research.
to propose anew determinase developeexico for a pterminants comprove the y to the prop
heses postula
ally used by ) it was neceas the proban states raisnvestment f
a new theornants or rened for this period of thiommonly usdeterminantposal of the
ated earlier:
Bliss essary ability sed in flows.
ry of newal study irteen sed to s and
e new
364
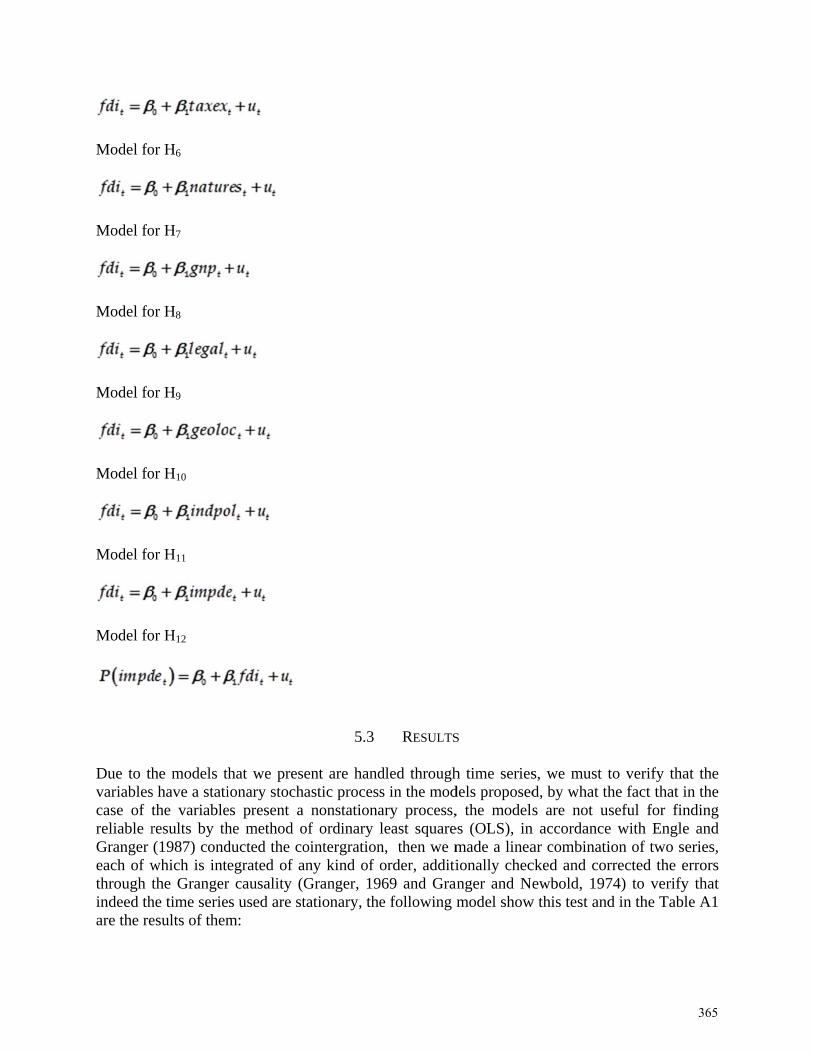
Model fo
Model fo
Model fo
Model fo
Model fo
Model fo
Model fo
Due to thvariablescase of treliable rGranger each of wthrough tindeed thare the re
or H6
or H7
or H8
or H9
or H10
or H11
or H12
he models ths have a statithe variableresults by th(1987) condwhich is intethe Granger
he time serieesults of them
hat we presionary stoches present a he method oducted the coegrated of ar causality (Gs used are stm:
5.3
ent are handastic processnonstationa
of ordinary lointergrationany kind of oGranger, 19tationary, the
RESULTS
dled throughs in the modary process,least squaren, then we morder, additi
969 and Grane following m
S
h time seriesdels proposed, the modelses (OLS), inmade a lineaionally chec
anger and Nemodel show
s, we must td, by what ths are not u
n accordancear combinaticked and corewbold, 197
w this test and
to verify thahe fact that iseful for fin
e with Engleion of two srrected the e74) to verifyd in the Tabl
at the in the nding e and eries, errors y that le A1
365

In
autoregreand that 1940) to and in th
O
sure thatcorresponinvestme
Tthe depenthe indepLegal sys
Svariablesto A15) d
Omodel (Mthe deterto central
The theoare basedperiod 20foreign dpart of itand cannrelations the litera
Sduring thflows of creation tgovernm
n addition, essive (VARhas to be coprove if thee Table A2 a
Once we havt the variabnding relatio
ent flows tha
The interactiondent variabpendent varistem and Ge
ubsequentlys was done todemonstrate
Once interacModel for Hrminants incrl zone only d
ries proposed on the use 000-2013, Mdirect investms public polinot use thatbetween theture review.
ince the perhat period deforeign diretheory propo
ments. The pr
was reviseR), where it worrected for te model has are presented
ve corrected bles shown ons with eac
at have been
on of all indble in Table ables ifra, s
eografic Loc
y, the interaco confirm itthat all the v
tions were 12) was donereased flowsdue to a long
ed by severaof different
Mexico used ment, howevicy because t determinane rest of the
riod studiedecided to creect investmenosed by Boterobit model d
ed collinearwas found ththe variablesan asymptotd the results
the errors ta Stationa
ch of the prsubmitted in
dependent vaA3. It was
ec, legal andalization) we
ction of thes significancvariables hav
tested usinge. The results of foreign g extension f
6.
al authors to determinantten determi
ver, the safeit is now knnt in attractdeterminant
d is thirteen eate or renewnt, so the puello and Davdemonstrates
ity of the hat indeed ths are stationatic chi-squarof them:
that could bary Stochastroposed varin Mexico in
ariables in thexpected th
d geoloc (coere not.
e dependent ce (Models fve a high sig
g linear regts showed thdirect inves
for north and
CONCLUSIO
explain howts as part of iinants in comty-related de
nown that Mting foreignts and the de
years, it waw their determurpose of thivila (2015) as that relatio
variables the variables ary, besides re distributio
e present intic Process iables as detthe period p
he Main mohat all the vaorresponding
variable wfor H1 to H1
gnificance.
gressions, a hat the probastment. The d south resul
ONS
w countries aits public pommon for eaeterminant nexico is faci
n direct invependent var
as observed minants in ois article waas part of theonship.
through a mpresented awe use the
on, the mode
n the time sewe procee
terminants fproposal from
odel is showariables werg to Infraestr
with each of 1). The resul
simulation ability of anpresented relts.
attract FDI aolicy. In this ach of the 32not found to ing serious s
vestment. Thriable which
that some order to attras to test the e public poli
model of va high collineWald test (Wel was as fo
eries, and weded to findfor foreign dm 2000 to 20
wn with respere significanructure, Sec
f the indepenlts (see table
using the pn improvemeesults corres
are diverse. Ssense, durin2 states to abe significa
security probhere are poh is coherent
states of Mact more andnew determcy of the 32
vector earity Wald, llows
we are d the direct 013.
ect to nt but,
urity,
ndent es A4
probit ent in spond
Some ng the attract ant as blems sitive t with
exico d new
minant 2 state
366
If any government in the world is interested in attracting new or more foreign direct investment must create or renovate determinants used to attract investment flows. There are probably cities or provinces who want to attract resources for certain types of industry but they must create or renew the related determinants, such that the different types of industry prevailing in a country use different determinants and some of them they shall not be used to attract new resources and should focus on the development of new determinants.
The comparison that was made between the three regions demonstrated that the states
located at the center of the country have invested more resources that the other two zones which indicates that those states used more than 5 determinants to attract FDI.
367
REFERENCES Bellak, C., Leibrecht, M. y Liebensteiner, M. (2010). “Attracting Foreign Direct Investment: the
public policy scope for south east European countries”, Eastern Journal of European Studies, Volume 1, Issue 2.
Berkoz, L. & Sence, S. (2009). Locational Preferences of FDI Firms in Turkey: A Detailed Examination of Regional Determinants. European Planning Studies, 17(8), pp. 1243-1256
Bliss, Ch. I. (1934). The method of probits. Science 79 (2037), pp. 38–39. Botello, Juan C. and Martín Dâvila (2013). Public Policy as a Determinant for Attracting Foreign
Direct Investment in Mexico since 2000-2013. International Journal of Business and Economic Development, 2(1), pp. 78-89
Botello, Juan C. and Davila, Martin (2015). The new determinant creation theory: a way to attract new foreign direct investment flows. International Journal of Business and Economic Development, 3(1).
Botric, V., Skuflic, L. (2006). “Main determinants of foreign direct investment in the southeast European countries”, Transition Studies Review, Volume 13, No 2.
Broadman, H.G. & Sun, X. (1997). The Distribution of Foreign Direct Investment in China, The World Economy, 20(3), pp. 339-362
Deichmann, J., Karidis, S. & Sayek, S. (2003). Foreign Direct Investment in Turkey: Regional Determinants, Applied Economics, 35(16), pp. 1767-1778.
Dunning, J. (1988). “Explaining international production” London: Unwin Hyman Engle, Robert F. and Clive W. J. Granger (1987). Cointegration and Error Correction:
Representation, Estimation, and Testing. Econometrica, 55(2), pp. 251-276 Erdal, F. & Tatoglu, F. (2002). Locational Determinants of Foreign Direct Investments in an
Emerging Market economy: The Turkish experience, Multinational Business Review, 10(1), pp. 21-27
Figueroa, S. (2012). Emergent Vulnerability in Attracting Foreign Direct Investment in Latin America: The Case of Mexico. Perspectives on Global Development and Technology, 11, pp. 374-385
Goodspeed, T., Martinez-Vazquez, J. y Zhang, L. (2009). “Public Policies and FDI Location: Differences between developing and developed countries”, International Studies Program Working Paper, GDU paper No 0910
Granger, Clive W. J. (1969). Investigating causal relations by econometric models and cross-spectral methods. Econometrica, 37(3), pp. 424-438
Granger, Clive W. J. and Paul Newbold (1974). Spurious Regressions in Econometrics. Journal of Econometrics, 2, pp. 111-120
Groh, A., Wich, M. (2009). “A Composite Measure to Determine a Host Country´s Attractiveness for FDI”. IESE Business School Working Paper Number 833
He, C. (2002). Information costs, agglomeration economies and the location of foreign direct investment in China, Regional Studies, 36(9), pp. 1029-1036
368

Hill, Charles. (2012). “International Business”, 12 Ed. USA. McGraw Hill. Kinoshita, Y. (2003). “Why does FDI go where it goes? New Evidence from the transition
economies. William Davidson Institute Working Paper Number 573 Lim, D. (1983). Fiscal incentives and direct foreing investment in less developed countries,
Journal of Development Studies, 19(2), pp. 207-212 Mariotti, S. & Piscitello, L. (1995) Information Cost and Location of FDI´s Within the Host
Country: Empirical Evidence from Italy, Journal of International Business Studies, 26(4), pp. 815-840
Mendoza, J. (2011). Impacto de la Inversión Extranjera Directa en el Crecimiento Manufacturero en México. Revista Problemas del Desarrollo, 167(42), pp. 45-69
MEXICO, GOBIERNO DEL ESTADO DE AGUASCALIENTES (2000), Informes de gobierno (2000-2013).
MEXICO, GOBIERNO DEL ESTADO DE BAJA CALIFORNIA (2000), Informes de gobierno (2000-2013).
MEXICO, GOBIERNO DEL ESTADO DE BAJA CALIFORNIA SUR (2000), Informes de gobierno (2000-2013).
MEXICO, GOBIERNO DEL ESTADO DE CAMPECHE (2000), Informes de gobierno (2000-2013).
MEXICO, GOBIERNO DEL ESTADO DE CHIAPAS (2000), Informes de gobierno (2000-2013).
MEXICO, GOBIERNO DEL ESTADO DE CHIHUAHUA (2000), Informes de gobierno (2000-2013).
MEXICO, GOBIERNO DEL ESTADO DE COAHUILA (2000), Informes de gobierno (2000-2013).
MEXICO, GOBIERNO DEL ESTADO DE COLIMA (2000), Informes de gobierno (2000-2013).
MEXICO, GOBIERNO DEL DISTRITO FEDERAL (2000), Informes de gobierno (2000-2013). MEXICO, GOBIERNO DEL ESTADO DE DURANGO (2000), Informes de gobierno (2000-
2013). MEXICO, GOBIERNO DEL ESTADO DE MEXICO (2000), Informes de gobierno (2000-
2013). MEXICO, GOBIERNO DEL ESTADO DE GUANAJUATO (2000), Informes de gobierno
(2000-2013). MEXICO, GOBIERNO DEL ESTADO DE GUERRERO (2000), Informes de gobierno (2000-
2013). MEXICO, GOBIERNO DEL ESTADO DE HIDALGO (2000), Informes de gobierno (2000-
2013). MEXICO, GOBIERNO DEL ESTADO DE JALISCO (2000), Informes de gobierno (2000-
2013).
369
MEXICO, GOBIERNO DEL ESTADO DE MICHOACAN (2000), Informes de gobierno (2000-2013).
MEXICO, GOBIERNO DEL ESTADO DE MORELOS (2000), Informes de gobierno (2000-2013).
MEXICO, GOBIERNO DEL ESTADO DE NAYARIT (2000), Informes de gobierno (2000-2013).
MEXICO, GOBIERNO DEL ESTADO DE NUEVO LEON (2000), Informes de gobierno (2000-2013).
MEXICO, GOBIERNO DEL ESTADO DE OAXACA (2000), Informes de gobierno (2000-2013).
MEXICO, GOBIERNO DEL ESTADO DE PUEBLA (2000), Informes de gobierno (2000-2013).
MEXICO, GOBIERNO DEL ESTADO DE QUINTANA ROO (2000), Informes de gobierno (2000-2013).
MEXICO, GOBIERNO DEL ESTADO DE QUERETARO (2000), Informes de gobierno (2000-2013).
MEXICO, GOBIERNO DEL ESTADO DE SAN LUIS POTOSÍ (2000), Informes de gobierno (2000-2013).
MEXICO, GOBIERNO DEL ESTADO DE SINALOA (2000), Informes de gobierno (2000-2013).
MEXICO, GOBIERNO DEL ESTADO DE SONORA (2000), Informes de gobierno (2000-2013).
MEXICO, GOBIERNO DEL ESTADO DE TABASCO (2000), Informes de gobierno (2000-2013).
MEXICO, GOBIERNO DEL ESTADO DE TLAXCALA (2000), Informes de gobierno (2000-2013).
MEXICO, GOBIERNO DEL ESTADO DE VERACRUZ (2000), Informes de gobierno (2000-2013).
MEXICO, GOBIERNO DEL ESTADO DE YUCATÁN (2000), Informes de gobierno (2000-2013).
MEXICO, GOBIERNO DEL ESTADO DE ZACATECAS (2000), Informes de gobierno (2000-2013).
Morgan, R., Katsikeas, A. (1997). Theories of international trade, foreign direct investment and firm internationalization: a critique, Management Decision, 35(1), pp. 68-78
Ondrich, J. & Wasylenko, M. (1993). Foreign Direct Investment in the United States (Kalamazoo, MI: W.E. Upjohn Institute for Employment Research)
Popovici, C., Calin, A. (2012). Attractiveness Of Public Policies For Fdi In Central And Eastern European Countries. Annals of Faculty of Economics, 1(1), 61-67.
Rasiah, R. (2000). Globalization and Private Capital Movements. Third World Quarterly, 21(6), pp. 943-961.
370

Steinbrecher, G. & Shaw, T. (2008). Quantile mechanics. European Journal of Applied Mathematics 19(2), pp. 87–112.
Wald, Abraham (1940). The Fitting of Straight Lines if Both Variables are Subject to Error. Annals of Mathematical Statistics, 11, pp. 284-300.
Wei, Y., Liu, X. Parker, D. & Vaidya, K. (1999). The Regional Distribution of Foreign Direct Investment in China. Regional Studies, 33(9), pp. 857-867.
371
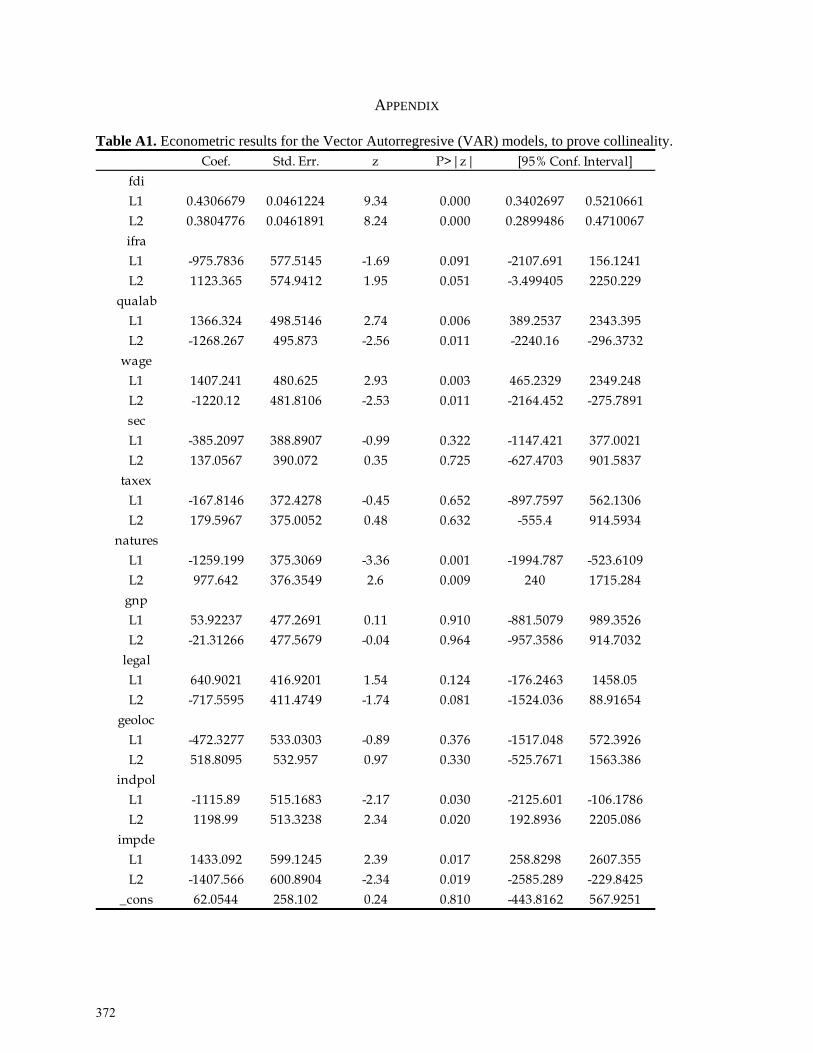
APPENDIX
Table A1. Econometric results for the Vector Autorregresive (VAR) models, to prove collineality.
Coef. Std. Err. z P>|z|
fdi
L1 0.4306679 0.0461224 9.34 0.000 0.3402697 0.5210661
L2 0.3804776 0.0461891 8.24 0.000 0.2899486 0.4710067
ifra
L1 -975.7836 577.5145 -1.69 0.091 -2107.691 156.1241
L2 1123.365 574.9412 1.95 0.051 -3.499405 2250.229
qualab
L1 1366.324 498.5146 2.74 0.006 389.2537 2343.395
L2 -1268.267 495.873 -2.56 0.011 -2240.16 -296.3732
wage
L1 1407.241 480.625 2.93 0.003 465.2329 2349.248
L2 -1220.12 481.8106 -2.53 0.011 -2164.452 -275.7891
sec
L1 -385.2097 388.8907 -0.99 0.322 -1147.421 377.0021
L2 137.0567 390.072 0.35 0.725 -627.4703 901.5837
taxex
L1 -167.8146 372.4278 -0.45 0.652 -897.7597 562.1306
L2 179.5967 375.0052 0.48 0.632 -555.4 914.5934
natures
L1 -1259.199 375.3069 -3.36 0.001 -1994.787 -523.6109
L2 977.642 376.3549 2.6 0.009 240 1715.284
gnp
L1 53.92237 477.2691 0.11 0.910 -881.5079 989.3526
L2 -21.31266 477.5679 -0.04 0.964 -957.3586 914.7032
legal
L1 640.9021 416.9201 1.54 0.124 -176.2463 1458.05
L2 -717.5595 411.4749 -1.74 0.081 -1524.036 88.91654
geoloc
L1 -472.3277 533.0303 -0.89 0.376 -1517.048 572.3926
L2 518.8095 532.957 0.97 0.330 -525.7671 1563.386
indpol
L1 -1115.89 515.1683 -2.17 0.030 -2125.601 -106.1786
L2 1198.99 513.3238 2.34 0.020 192.8936 2205.086
impde
L1 1433.092 599.1245 2.39 0.017 258.8298 2607.355
L2 -1407.566 600.8904 -2.34 0.019 -2585.289 -229.8425
_cons 62.0544 258.102 0.24 0.810 -443.8162 567.9251
[95% Conf. Interval]
372
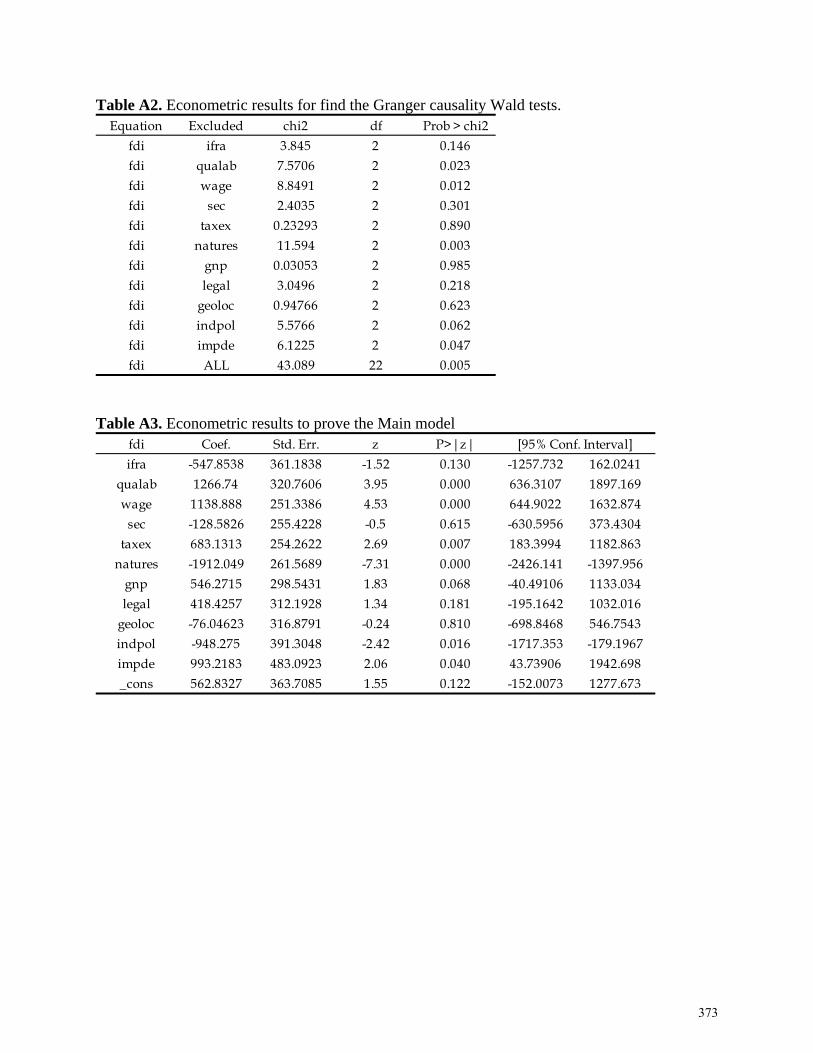
Table A2. Econometric results for find the Granger causality Wald tests.
Table A3. Econometric results to prove the Main model
Equation Excluded chi2 df Prob > chi2
fdi ifra 3.845 2 0.146
fdi qualab 7.5706 2 0.023
fdi wage 8.8491 2 0.012
fdi sec 2.4035 2 0.301
fdi taxex 0.23293 2 0.890
fdi natures 11.594 2 0.003
fdi gnp 0.03053 2 0.985
fdi legal 3.0496 2 0.218
fdi geoloc 0.94766 2 0.623
fdi indpol 5.5766 2 0.062
fdi impde 6.1225 2 0.047
fdi ALL 43.089 22 0.005
fdi Coef. Std. Err. z P>|z|
ifra -547.8538 361.1838 -1.52 0.130 -1257.732 162.0241
qualab 1266.74 320.7606 3.95 0.000 636.3107 1897.169
wage 1138.888 251.3386 4.53 0.000 644.9022 1632.874
sec -128.5826 255.4228 -0.5 0.615 -630.5956 373.4304
taxex 683.1313 254.2622 2.69 0.007 183.3994 1182.863
natures -1912.049 261.5689 -7.31 0.000 -2426.141 -1397.956
gnp 546.2715 298.5431 1.83 0.068 -40.49106 1133.034
legal 418.4257 312.1928 1.34 0.181 -195.1642 1032.016
geoloc -76.04623 316.8791 -0.24 0.810 -698.8468 546.7543
indpol -948.275 391.3048 -2.42 0.016 -1717.353 -179.1967
impde 993.2183 483.0923 2.06 0.040 43.73906 1942.698
_cons 562.8327 363.7085 1.55 0.122 -152.0073 1277.673
[95% Conf. Interval]
373
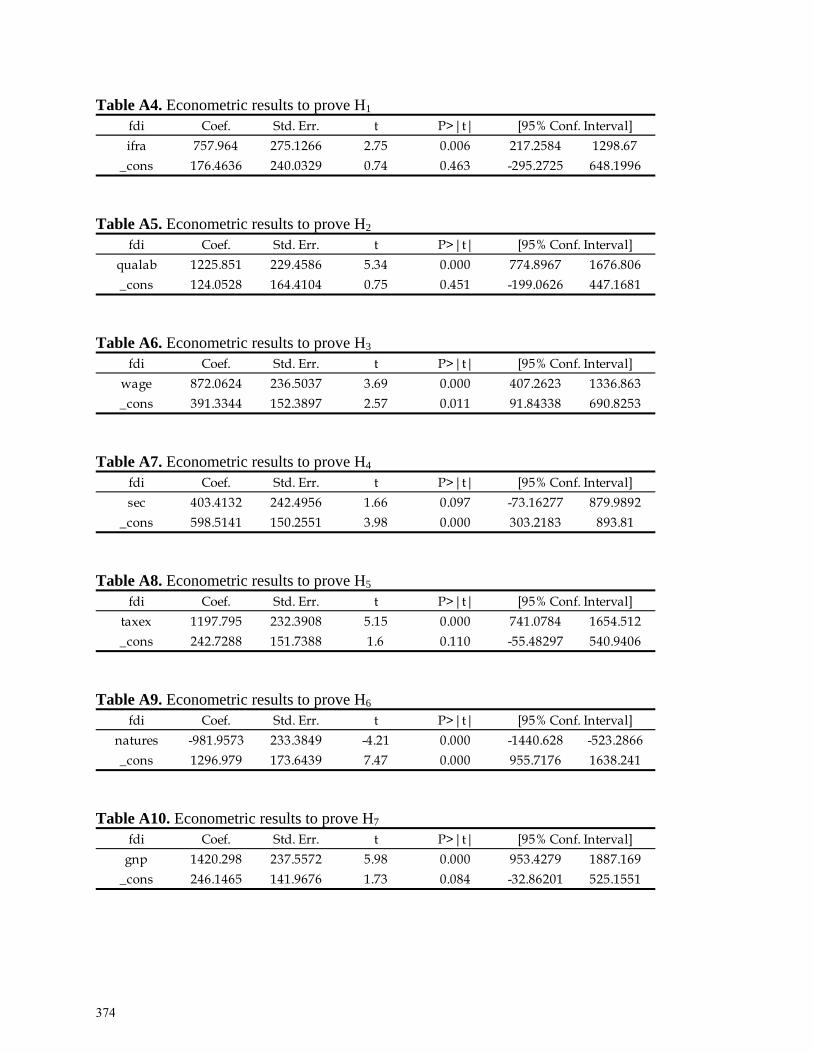
Table A4. Econometric results to prove H1
Table A5. Econometric results to prove H2
Table A6. Econometric results to prove H3
Table A7. Econometric results to prove H4
Table A8. Econometric results to prove H5
Table A9. Econometric results to prove H6
Table A10. Econometric results to prove H7
fdi Coef. Std. Err. t P>|t|
ifra 757.964 275.1266 2.75 0.006 217.2584 1298.67
_cons 176.4636 240.0329 0.74 0.463 -295.2725 648.1996
[95% Conf. Interval]
fdi Coef. Std. Err. t P>|t|
qualab 1225.851 229.4586 5.34 0.000 774.8967 1676.806
_cons 124.0528 164.4104 0.75 0.451 -199.0626 447.1681
[95% Conf. Interval]
fdi Coef. Std. Err. t P>|t|
wage 872.0624 236.5037 3.69 0.000 407.2623 1336.863
_cons 391.3344 152.3897 2.57 0.011 91.84338 690.8253
[95% Conf. Interval]
fdi Coef. Std. Err. t P>|t|
sec 403.4132 242.4956 1.66 0.097 -73.16277 879.9892
_cons 598.5141 150.2551 3.98 0.000 303.2183 893.81
[95% Conf. Interval]
fdi Coef. Std. Err. t P>|t|
taxex 1197.795 232.3908 5.15 0.000 741.0784 1654.512
_cons 242.7288 151.7388 1.6 0.110 -55.48297 540.9406
[95% Conf. Interval]
fdi Coef. Std. Err. t P>|t|
natures -981.9573 233.3849 -4.21 0.000 -1440.628 -523.2866
_cons 1296.979 173.6439 7.47 0.000 955.7176 1638.241
[95% Conf. Interval]
fdi Coef. Std. Err. t P>|t|
gnp 1420.298 237.5572 5.98 0.000 953.4279 1887.169
_cons 246.1465 141.9676 1.73 0.084 -32.86201 525.1551
[95% Conf. Interval]
374

Table A11. Econometric results to prove H8
Table A12. Econometric results to prove H9
Table A13. Econometric results to prove H10
Table A14. Econometric results to prove H11
Table A15. Econometric results to prove H12
fdi Coef. Std. Err. t P>|t|
legal 761.7603 248.067 3.07 0.002 274.235 1249.286
_cons 246.6893 202.3196 1.22 0.223 -150.9289 644.3076
[95% Conf. Interval]
fdi Coef. Std. Err. t P>|t|
geoloc 540.6997 319.2987 1.69 0.091 -86.81721 1168.217
_cons 300.8014 292.1284 1.03 0.304 -273.3178 874.9205
[95% Conf. Interval]
fdi Coef. Std. Err. t P>|t|
indpol 715.055 316.7725 2.26 0.024 92.50291 1337.607
_cons 156.4527 289.4305 0.54 0.589 -412.3642 725.2696
[95% Conf. Interval]
fdi Coef. Std. Err. t P>|t|
impde 878.5583 251.8138 3.49 0.001 383.6694 1373.447
_cons 149.3871 208.7929 0.72 0.475 -260.953 559.7273
[95% Conf. Interval]
impde Coef. Std. Err. z P>|z|
fdi 0.0010048 0.0002014 4.99 0.000 0.0006101 0.0013996
_cons 0.1999643 0.0775323 2.58 0.010 0.0680037 0.3519249
[95% Conf. Interval]
375

Foreign Direct Investment and Politics
VAHDET KAYA, PHD1 College of Business, Lamar University
ASHRAF EL-HOUBI, PHD
College of Business, Lamar University
With the increased popularity of liberal economy policies, developing technologies, and communication, world foreign investment market is expanding rapidly. Foreign Direct Investment has a major role over development of less developed countries since it is a source of capital and employment for those with insufficient capital sources to create new employment opportunities. Foreign Direct Investment is a good source that can lead to increase efficiency and competitiveness. There has been grown interest in the literature about this topic and the importance of foreign direct investment. While there are several different factors that have been tested; the most common factors can be summarized as GDP growth, trade openness, taxes and exchange rates, political factors, institutional quality and exchange rates. In this paper, authors are going to test the effect of political factors on FDI using cross section panel data analysis and will present the results.
1 Address correspondence to Vahdet Kaya, College of Business, Lamar University. E-mail: [email protected]
376

Chinese FDI Outflow and Life Satisfaction of Destination Countries: A Research of Key Locations in Complex Network based on
Chinese FDI Outflow, Life Satisfaction of OECD Destination Countries, and Cultural Distances
DA HUO1
School of International Trade and Economics, Central University of Finance and Economics,
Beijing, China
KEN HUNG A.R. Sanchez School of Business,
Texas A&M International University, Laredo, Texas, USA
With development of Chinese economy and further processing of open-door policy, China has enhanced the international involvement, and the Chinese FDI outflow is highly increased to global destinations, including a number of OECD countries. The Chinese FDI outflow is important to life satisfaction of OECD destination countries. This research studies the investment efficiency of Chinese FDI outflow to OECD destination countries based on life satisfaction as the output by DEA model. This research also measures the cultural distances between China and OECD destination countries based on Hofstede cultural dimensions. This research further reveals key locations in complex network based on Chinese FDI outflow to OECD countries, life satisfaction of OECD destination countries, and their cultural distances by heuristic method. This research offers decision support to global managers and policy makers by identifying key locations in complex network based on Chinese FDI outflows, life satisfaction of destination countries, and cultural distances. KEYWORDS Chinese FDI Outflow, OECD Countries, Cultural Distance, Complex Network, DEA Model, Heuristic Method JEL F21, F23, J17, Z13
1 Address correspondence to Da Huo, School of International Trade and Economics, Central University of Finance and Economics, No. 39, South College Road, Haidian District, Beijing, China. E-mail: [email protected]
377
Sistema de Costeo ABC Implicación en el Proceso Productivo
JOSÉ LUIS DÍAZ ROLDÁN1
Facultad de Comercio Administración y Ciencias Sociales, Universidad Autónoma de Tamaulipas, Nuevo Laredo, Tamaulipas, México
LIC. MARIO VILLARREAL ÁLVAREZ
Facultad de Comercio Administración y Ciencias Sociales, Universidad Autónoma de Tamaulipas, Nuevo Laredo, Tamaulipas, México
DR. FERNANDO HERNÁNDEZ CONTRERAS
Facultad de Comercio Administración y Ciencias Sociales, Universidad Autónoma de Tamaulipas, Nuevo Laredo, Tamaulipas, México
El coste de manufactura del producto es la principal preocupación de una organización manufacturera; el coste dará a la empresa y al producto la oportunidad de competir y permanecer en el mercado. Los competidores están permanentemente atentos y preocupados de ofrecer costes atractivos que compitan y rivalicen. La motivación del estudio es, identificar que modelos de control son utilizados en empresas de esta ciudad fronteriza para lograr sus objetivos estratégicos, si este sistema es justificable en planificación, organización y control. Provocando que los productos y servicios puedan mejorar sus procesos, induciendo al cliente a incrementar el consumo. La investigación pretende mostrar la adopción de sistemas de costeo, y de acuerdo a trabajos de investigación previos, aboga por la aplicación de modelos tal como el ABC, que proporcionan información útil en la toma de decisiones en pro de mejorar la competitividad y promover más utilidad económica a la organización. Con un cuestionario dirigido a directores y gerentes de empresa en la ciudad, se analizan resultados. El paquete SPSS permite obtener datos sobre estadísticos descriptivos como: frecuencias, porcentajes, mínimo, máximo, mediana, moda, pruebas apareadas; así como la obtención de gráficos y hacer más asequible el análisis de la información recogida. PALABRAS CLAVES Cambio, Costes, Estrategia The cost of manufacturing the product is the main concern of a manufacturing organization; the cost will give the company and the product a chance to compete and stay in business. Competitors are constantly vigilant and concerned to offer attractive costs that compete and rival. The motivation of the study is to identify control models that are used in companies in this border city to achieve their strategic objectives, and whether this system is justifiable in
1 Address correspondence to José Luis Díaz Roldán, Facultad de Comercio Administración y Ciencias Sociales, Universidad Autónoma de Tamaulipas, Nuevo Laredo, Tamaulipas, México. E-mail: [email protected]
378

planning, organization and control. Causing products and service to improve their processes induces the client to increase consumption. The research aims to show the adoption of costing systems, and according to previous research works, calls for the application of models such as the ABC, which provide useful information in making decisions towards improving competitiveness and promote more economic use to the organization. Results are analyzed with a questionnaire for directors and managers of companies in the city. The SPSS package provides data on descriptive statistics such as frequencies, percentages, minimum, maximum, median, mode, paired test, and it obtains more graphics. It allows the analysis of the information collected to be more accessible. KEYWORDS Rates, Costs, Strategy
379
La modificación controlada de los factores que influencian los procesos creativos como herramientas de diferenciación en las
compañías manufactureras
ALFONSO GALVAN1
Estudiante de Doctorado en Administración de Empresas, Universidad Autónoma de Tamaulipas
En tiempos recientes se ha demostrado que la capacidad de generar ideas nuevas por partes de los empleados en las empresas es un factor determinante para el éxito de las iniciativas de mejora y por ende para incrementar su nivel de competitividad. Este estudio intenta probar la hipótesis siguiente: Si una empresa es capaz de modificar los factores que afectan los procesos creativos de forma controlada, tendrá en esto una herramienta de diferenciación que le dará una ventaja competitiva.
1 Address correspondence to Alfonso Galvan, Estudiante de Doctorado en Administración de Empresas, Universidad Autónoma de Tamaulipas. E-mail: [email protected]
380

Estructura y Evolución Reciente de las Ventajas Comparativas de México y de sus Estados
JOSÉ DE JESÚS SALAZAR CANTÚ1
Profesor del Departamento de Economía, Tecnológico de Monterrey, Monterrey, Nuevo León, México
RAYMUNDO CRUZ RODRÍGUEZ GUAJARDO Profesor del Departamento de Economía,
Tecnológico de Monterrey, Monterrey, Nuevo León, México Empleando el índice de Yu, Cai y Leung (2009) y regresiones galtonianas, se estudia la estructura de ventajas comparativas de México y sus estados. Los resultados permiten ver que existen posibilidades de incrementar el comercio interindustrial, con países con estructuras de ventajas comparativas diferentes a la de México. Si bien los flujos de exportaciones mexicanas han crecido notablemente en los últimos 20 años, la evolución de su estructura exportadora ha cambiado poco. En el nivel estatal, la nueva información oficial de exportaciones, revela cambios importantes en la estructura de ventajas comparativas en algunos estados y que los sectores con ventaja comparativa concentran, en la mayoría de las entidades, altos porcentajes de la producción, el empleo y el activo fijo totales, de los subsectores que participan en la exportación. PALABRAS CLAVE Ventaja comparativa, regresión galtoniana, comercio internacional. Using the Yu, Cai and Leung (2009) index and galtonians regressions, the structure of comparative advantages of Mexico and its states is studied. The results allow us to see that there are possibilities of increasing inter-industry trade with countries with different comparative advantages structures to that of Mexico. While flows of Mexican exports have grown significantly in the past 20 years, the evolution of its export structure has changed little. At the state level, the new official exports information reveals significant changes in the structure of comparative advantages in some states and that the sectors with comparative advantage concentrated, in most states, high rates of production, employment and fixed assets totals of the subsectors involved in exporting. KEYWORDS Comparative advantage, galtonian regression, international trade.
1 Address correspondence to Jose De Jesus Salazar Cantu, Profesor del Departamento de Economía, Tecnológico de Monterrey, Monterrey, Nuevo León, México. E-mail: [email protected]
381

Shale Rush: Impacto Económico en Tamaulipas
JESÚS ANGEL CHAPA BARRERA1
Universidad Autónoma de Tamaulipas Desde los inicios del siglo XX hasta estos tiempos, el mercado energético, particularmente el de extracción y consumo de hidrocarburos, han sido considerados como instrumentos financieros de suma importancia para fortalecer las economías nacionales. El continente Americano es un gran anfitrión del mercado de este mercado, esto gracias a que en las últimas décadas se ha comprobado la existencia de reservas petrolíferas en el bloque Norte del continente; Canadá, EUA y México. La fiebre del Gas y Petróleo no convencional (Shale) en Texas (EUA) y Alberta (CANADÁ), han dejado grandes beneficios medibles en sus economías, siendo esto una gran área de oportunidad y desarrollo para el estado de TAMAULIPAS (MÉXICO) en virtud de la reciente apertura del mercado en México gracias a la Reforma Energética impulsada por el Presidente C. Enrique Peña Nieto dentro del Plan Nacional de Desarrollo enfocada para Modernizar y “MOVER A MÉXICO”. PALABRAS CLAVE Reforma energética, Mercado energético, Hidrocarburos, Economía.
1 Address correspondence to Jesús Angel Chapa Barrera, Universidad Autónoma de Tamaulipas. E-mail: [email protected]
382
Process Design for Cost-Efficient International Just-In-Time Delivery of Perishable Goods on
Dynamically Changing Routes
DIDIMO A. DEWAR V., PHD1 Professor, Universidad de las Americas Puebla
FABIAN VOITH
Undergraduate Student, ESB University Global players are entering the market of food shipments. There is still considerable potential for growth and profit. This research assumes that proper supply chain management is the main factor for competitiveness in global competition. The paper presents a proposal to efficiently implement a complex supply chain with low financial requirements and high flexibility for perishable goods on dynamically changing routes. The developed tools help to determine the most crucial variables such as: Product selection, box and pallet loading (Binary Knapsack Problem), hub and airline, required documents, delivery route (Travelling Salesman Problem), accruing costs, with and without free trade agreements.
1 Address correspondence to Didimo A. Dewar V., PhD, Professor, Universidad de las Americas Puebla. E-mail: [email protected]
383
Knowledge Management as Strategy to Achieve Competitive Advantage
Case Study: Mexican Customs Brokers from Nuevo Laredo
FRANCISCO JOSÉ BURGOA RAMÍREZ1
Professor and Student of Doctoral Program in Strategic Management, Universidad Autónoma de Tamaulipas
By placing knowledge management in organizations, the term organization is the process of streamlining activities because of their better knowledge and understanding (FIOL & LYLES, 1985). From this definition we can provide a basis for the ideas of knowledge management because we start from the reality of business organizations, which seek to increase their profits. These ideas can be applied to business activities that can locate it in a better way with certain trends that have emerged in the business environment such as quality management, marketing, strategy, knowledge management can likewise be a trend which can be applied in both the business sector and the public.
1 Address correspondence to Francisco Jose Burgoa Ramirez, Professor and Student of Doctoral Program in Strategic Management, Universidad Autónoma de Tamaulipas. E-mail: [email protected]
384
Methodological Proposal for the Study of the Impact of Globalization on
Business Strategy of Mexican International Enterprises
JOSÉ G. VARGAS-HERNÁNDEZ, M.B.A., PHD1 University Center for Economic and Managerial Sciences, University of Guadalajara, Núcleo
Universitario Los Belenes, Zapopan, Jalisco, México
MC. CÉSAR FRANCISCO CÁRDENAS DÁVILA División de Posgrados, Universidad Autónoma de Durango Campus Culiacán, Culiacán,
Sinaloa, México
The aim of this paper is to support a methodology proposal for the analysis of the impact on commercial globalization trend in relation to the internationalization of Mexicans firms. Also this paper analyzes the advantage the Mexican firms took in the liberalization agenda of the Mexican government with the multilateralism and regionalism policies. For this purpose, the statistic descriptive modeling methodology is used to relate grow of the internationalization of the Mexican firms and the impact in the foreign investment of the main multinationals in Mexico, forcing them to centering in competitive productive processes and improving their internal organization, innovation and development. KEYWORDS Globalization, internationalization, multilateralism, multinationals, regionalism. JEL F62, F21, F13, F23, F15 La finalidad de esta investigación es proporcionar una propuesta metodológica para el análisis del impacto que tiene la globalización comercial en la internacionalización de las empresas mexicanas, mismas que, aprovechándose de la política comercial aperturista de México, a través del multilateralismo y el regionalismo, han incrementado su presencia en los mercados internacionales. A través del método de investigación estadístico descriptivo, se analizará el aumento en la internacionalización de las empresas mexicanas así como el impacto de los inversionistas extranjeros y las principales multinacionales en la libre competencia, situación que obliga a las empresas mexicanas a centrarse en la innovación y el desarrollo, en adoptar procesos productivos más competitivos, así como una mejora en su organización interna. PALABRAS CLAVE Globalización, internacionalización, multilateralismo, multinacionales, regionalismo.
1Address correspondence to Jose G. Vargas-Hernandez, M.B.A., PhD, University Center for Economic and Managerial Sciences, University of Guadalajara, Nucleo Universitario Los Belenes, Zapopan, Jalisco, Mexico. E-mail: [email protected], [email protected], [email protected]
385

1. INTRODUCTION Mexico has experienced a steady increase in the internationalization of Mexican companies, which increased largely due to the openness trade policy adopted by the country. Following the entry of Mexico to the General Agreement on Tariffs Trade (GATT for its acronym in English) in 1986 and to adopt business trends on multilateralism and regionalism, has led to an increase in the internationalization of Mexican companies. In light of the foregoing, Mexico, from the late 90's, has experienced an increase in investment abroad of large Mexican companies that have survived the market reforms and structural adjustment policies (Vargas-Hernández, 2011). From this, it follows that the support of the Mexican government to Mexican companies as well as the impact of trade globalization, results in a sustained increase in the internationalization of Mexican companies.
This paper analyzes the impact of trade globalization in the internationalization of Mexican companies, same as, taking advantage of Mexico's trade policy openness, through multilateralism and regionalism have increased their presence in international markets. Through descriptive statistical method of investigation, it is analyzed and developed the increased internationalization of Mexican companies and the impact of foreign investors and major multinationals in the competition, which forces Mexican companies to focus on innovation and development and to adopt more competitive production processes and improved internal organization.
2. BACKGROUND OF THE PROBLEM Following the entry of Mexico to the General Agreement on Tariffs Trade (GATT for its acronym in English) in 1986 and to take business trends multilateralism and regionalism, has led to an increase in the internationalization of Mexican companies, situation that has caused an increase in investment abroad of large Mexican companies that have survived the market reforms and structural adjustment policies (Vargas Hernández, 2011). From this, it follows that the support of the Mexican government to Mexican companies as well as the impact of trade globalization, results in a sustained increase in the internationalization of Mexican companies increased, and in the decisions of these to select an internationalization strategy to a specific market.
3. DEFINITION OF THE PROBLEM Currently, it is observed an increase in the internationalization of Mexican companies, derivative from trade openness policy adopted by Mexico and the globalization of trade out of which it is part. This trend can be divided into two branches: First observed multilateralism, same as is understood as trade openness of a country through the conclusion of free trade, and on the other, regionalism, which is understood as the trade openness of a country through regional integration (Arango Quintero and Cardona Montoya, 2008).
386

Therefore, the research questions are: A. What is the degree of increase in the internationalization of Mexican companies, from
Mexico's entry into the General Agreement on Tariffs Trade (GATT for its acronym in English) in 1986 to date, derived from the globalization of trade which is part of the country?
B. What is the degree of increase in the internationalization of Mexican companies, since the adoption of trade policy openness of the country, because of multilateralism?
C. What is the rate of increase in the internationalization of Mexican companies, since the
adoption of trade policy openness of the country, because of regionalism? D. What is the impact of multilateralism and regionalism in the selection of a destination
country at the time of the internationalization of a company?
4. JUSTIFICATION
The importance on the world stage of globalization of markets, societies and cultures, is resulting in a direct impact on the internationalization of Mexican companies, same as, taking advantage of Mexico's trade policy openness, through multilateralism and regionalism have increased their presence in international markets. Similarly, to attract foreign investors and major multinationals to the country, it has impacted directly on free competition, which forces Mexican companies to focus on innovation and development, to adopt more competitive production processes and as an improvement in its internal organization.
5. ASSUMPTIONS A. The trade globalization has an impact on the internationalization strategies of companies.
B. Multilateralism adopted by a country has an impact on the internationalization of its
companies. C. Regionalism adopted by a country has an impact on the internationalization of its
companies. D. Multilateralism and regionalism adopted by a country have an impact on the selection of a
country at the time of the internationalization of a company.
6. THE TRADE GLOBALIZATION A. Conceptual Framework The last 25 years the world economy has been characterized by numerous scientific and
387

technological progresses, which has changed the pattern of production throughout the world, creating a growing interdependence that encompasses the total activities of an industrial economic sector, either regional or global level. This process is known as globalization and its main feature is that it has generated a significant increase in the flow of trade and investment; in such a way that globalization is seen as a struggle to participate in a greater number of markets and better capture larger volume of foreign direct investment (Gómez 2006).
An integration of the different concepts of trade globalization is poured in the following
table:
Table 1 Commercial globalization Terms Meanings and authors Products at low cost. Set of economic, technological and social factors that allowed
multinational companies to sell their products almost there are no differences in various countries (Levitt, 1984).
Increased volume of FDI flows.
A fight for participating in a greater number of markets and achieve to capture higher volume flows of foreign direct investment (Gómez, 2006).
Operates without a country on a global scale.
Global company is one that has abandoned its national identity and operates as a non-country on a global scale (Ohmae, 1991).
Accelerated global integration of economies.
Worldwide accelerated integration of economies through trade, production, financial flows, technology diffusion, information networks and cultural flows (IMF, 1996).
Dynamic global market integration.
Dynamic process of increasing freedom and global integration of markets for labor, goods, services, technology and capital (De la Dehesa, 2000).
Source: Prepared. The process of economic globalization is to operate with relatively low costs as if the whole world or the most important regions of the cities were a single entity.
An approach to the definition of globalization would be to integrate it from its
characteristics. Globalization is an economic, technological, social and cultural scale process, which involves increased communication and interdependence among countries, unifying its markets, societies and cultures, through a series of social, economic and political transformations that give them global. B. Theoretical Framework 1. Globalization of Markets Pineda (1998) takes in his work an approach to the definition of globalization, analyzing seven approaches that try to explain globalization as theory. Among them, the presence of capitalism as a driving force of change worldwide in recent decades largely explains the emergence of the phenomenon of globalization. With countless multidisciplinary impacts as capitalism involves
388
other than strictly economic, sociological, cultural, political, religious, technological, environmental, among others, none of which able to explain the complexity of the phenomenon of globalization.
The main beneficiaries of this process of globalization are multinational corporations that benefit from huge economies of scale, whether in production, distribution and administration to scale and product standardization, as stated by Levitt (1984). The most effective global competitors incorporate a higher quality and profitability to their cost structures, selling in all national markets the same products they sell in their home market, fully standardized products without any differentiation.
In light of the foregoing, Mexican companies not only face fierce competition in
international markets but facing international competitors in the domestic market, with standardized products, with improved technology and above all more economical. Consumers initially had local preferences, but today they are seduced by the low price. Currently, it can be observed an increase in the internationalization of Mexican companies, derivative trade openness policy adopted by Mexico and the globalization of trade of which it is part, trend that can be divided into two branches, first multilateralism and on the other part the regionalism. 2. Adoption of Trade Policy Openness In the eighties, the economic and political framework was created for the United States and agencies like the World Bank and the International Monetary Fund actively promote implementation of neoliberal policies in developing countries, including Latin American (Ruiz Naples, 2004). Undoubtedly one of the most important neoliberal policies of that time was the adoption by Mexico of the General Agreement on Tariffs Trade (GATT for its acronym in English) in 1986-now World Trade Organization (WTO) - which had resulted in the adoption of trade policy openness.
Among the main commitments assumed by Mexico, was the gradual reduction of tariffs
on trade as well as the adoption of trade policies of non-discrimination, among which are included national treatment and treatment of the most favored nation, generating with this the greater trade openness in Mexico. Derived from the developments described above, the Mexican government, in compliance with the economic policies of former President Carlos Salinas de Gortari (1988-1994), conducted a series of privatizations of state enterprises and later opened a new concept of growth national economic production that oriented outward to export.
In the context of trade liberalization and tariff scale deregulation, Mexico opted for free
trade area with Canada and the United States, leading to the signature of the Free Trade with North America (NAFTA or NAFTA for its acronym in English) by Salinas de Gortari on December 17, 1992. Trade liberalization could be the start of a successful integration if it achieved positive effects on the dynamics of innovation and technological process. Any strategy to improve the local economy should be aware of the social dimension that contains the expanded vision of development on the limited size reflected only in quantitative terms of growth, as it could be understood the scope of NAFTA (Hernandez Soto Vázquez, 2008) .
389
a. Mexico and Multilateralism Arango Cardona Quintero and Montoya (2008) define multilateralism as trade openness of a country through the conclusion of trade agreements with a country, taking advantage of the liberalizing trade policies of both countries, in order to increase international trade protecting investors and creating trade policies that benefit both countries.
"In the area of international trade relations, the fundamental and distinctive feature of the strategy promoted by the United States to ensure stability and prosperity has been multilateralism," sustained Renato Ruggiero, Director General of the WTO on October 16, 1995. Ruggiero established the importance of vision and leadership of the United States, first under the GATT and now the WTO. The core of the international trading system is constituted by the principles of non-discrimination and the nation most favored (NMF). Ruggiero gave six reasons why governments have adhered to the principle of MFN and why it is "essential to resist the lure of the apparent short-term benefits of bilateralism" (Ruggiero, 1995).
As it asserts Jimenez Martinez (2007), the free trade agreements that Mexico has, is one
of the most important elements in the process of internationalization. Thus, companies in the region should take full advantage of trade liberalization and to ensure their presence in other countries. The establishment of various treaties can serve as a trigger for the company's operations in foreign markets, and is a clear factor that directly affects the continued development of the internationalization process. After signing the Free Trade Agreement with North America, which includes tariff preferences for signers’ countries, support for foreign investment, alternative means of dispute resolution against unfair trade practices, regulations, and intellectual property rights, among others.
Mexico began a race to sign trade agreements with other countries, with the sole aim to diversify exports and build tariff preferences with other countries. Currently, Mexico has a network of 10 FTAs with 45 countries (TLC's), according to the Ministry of Economy (2014). In these trade agreements, is now including the new TLC Mexico-Central America, which entered into effect on July 1, 2013. In the Mexico-Central America FTA are included Mexico, Costa Rica, Nicaragua, El Salvador, Guatemala and Honduras. This treaty, replaced the three existing trade agreements that Mexico had with Central America (FTA Mexico - Costa Rica 1995, Mexico-Nicaragua in 1998 and TLC's Triangle Northern Mexico in 2001), resulting with this, a total of 10 FTAs with 45 countries. It will be pending to attach to this trade agreements list the recent Free Trade Agreement Mexico-Panama, as in April 2014 was signed by the presidents of both countries.
Similarly, Mexico has 9 limited agreements, Economic Complementation Agreements
and partial scope agreements, as part of the Latin American Integration Association (LAIA) and 30 Agreements for the Reciprocal Promotion and Protection of Investments (BITs). b. Mexico and Regionalism Arango Cardona Quintero and Montoya (2008) explain regionalism, such as trade openness of a country through regional integration with two or more countries, through the holding of regional
390

trade agreements. In fact, the authors argue that regional integration agreements, initially conceived as exceptions to the multilateral trading system, have become the guiding principles of global business dynamics. Regional agreements emerged as a scheme which recognizes exceptions recognizing that multilateralism is a system that is built between countries at different levels of development and seeks to create the conditions for a global free trade.
In recent years, it has been observed the establishment of economic blocs, through which
various nations celebrate regional agreements that allow them to join forces to get the most out of its exchange trade (Jiménez Martínez, 2007). This situation has led to a significant increase in trade between regions of neighboring countries, as prime examples are the European Union, NAFTA, the Central American bloc Mercosur and the latest Pacific Partnership (Mexico, Peru, Colombia and Chile). According to the Ministry of Economy (2014), Mexico participates in the Latin American Integration Association (LAIA). Also, México actively participates in multilateral and regional organizations and forums such as the World Trade Organization (WTO), the Asian-Pacific Economic Cooperation (APEC), the Organization for Economic Cooperation and Development (OECD), among others.
The flagship in the process of regionalization organisms is undoubtedly the Forum Asia Pacific Economic Cooperation (APEC for its acronym in English), of which Mexico is a party. The APEC moves on three pillars: trade liberalization, promotion of investment and technical cooperation. Unlike the European Union, the Asia Pacific region did not seek to form a community, but a forum for cooperation to achieve common goals. According to Martínez Lagorreta (2002), interest in creating an organization of this type born after World War II in a region where economic growth forced an economic and political interaction expeditiously. In this way, regional forums and organizations and industry forums and government groups were formed.
Another body, undoubtedly important, is the Pacific Alliance, led by Mexico has
achieved regional integration between Mexico, Colombia, Peru and Chile, precisely those South American countries that do not belong to block of the Southern Common Market, having completely different trade and economic policies. Such regional bloc, the Pacific Alliance, aims to build a participatory and consensual membership, an area of deep integration to move progressively towards the free movement of goods, services, capital and people, i.e., a common market. Similarly, Pacific Alliances aims to promote higher growth, development and competitiveness of economies throughout, with a view to achieving greater well-being and overcome socioeconomic inequality. It intends becoming a platform of political articulation, economic and trade integration and projection to the world, with special emphasis on Asia-Pacific.
Cooperation and regional integration in Latin America are growing. In recent years,
progress has been more on the real integration of Latin American economies that during the past three decades. A series of regional, sub regional and bilateral agreements is achieving increasing liberalization of mutual trade and economic and growing political (Van Klaveren, 1990) cooperation. One of the main advantages in signing FTAs with trading blocs, is not only to have a greater presence in other markets, but the power to reduce both tariff and non-tariff barriers in international trade, standardizing requirements among member countries of the block. This
391
situation happens for example with the European Union, representing 28 countries, or the Southern Common Market (MERCOSUR), composed of five countries.
The integration then becomes an ideal geostrategic mechanism to achieve favorable
positions in key areas by countries with greater bargaining power (Arango Cardona Quintero and Montoya, 2008). It will be under investigation, analyzing the mechanism that openness has impacted more Mexican companies, still the case or multilateralism or regionalism. Regionalism offers advantages for foreign investment and exports as they are counting on a single integrated market by several countries with similar market characteristics. This would represent a strategy of international expansion for the company or, standardization and reduction of regulations and tariff and nontariff restrictions. Among these nontariff restrictions can be mentioned the phytosanitary regulations, health, previous permits and export licenses, which would result in greater ease for businesses when exporting their products.
7. INTERNATIONALIZATION OF COMPANIES A. Conceptual Framework In order to make an integration of the different concepts of internationalization, they are poured in the following table:
392

Table 2 Internationalization Terms Meanings and Authors Formulas and commitment levels subject to change.
Sequential process consisting of several stages that require progressive international nature of the company and a growing involvement of outside resources. Internationalization has to be seen as a complex process, which supports various institutional formulas depending on the level of commitment of the company in international markets. These formulas and levels of engagement are subject to change as the company consolidates its presence in the international arena (Duarte Lopez, 1996).
Evolutionary and long-term dynamic process that gradually affects the value chain.
Corporate growth strategy for international geographic diversification through an evolutionary and dynamic long-term process that gradually affects the different activities of the value chain. Also, the organizational company structure with a growing commitment and increasing involvement of its resources and capabilities to the international environment, and knowledge based (Larrinaga Villarreal, 2006).
Economic activity in other countries.
The development of the economic activity of the company in other countries (Good, 1996, 2006).
Adopt rules for transaction The process of adapting exchange transaction modalities in international markets (Andersen, 1993).
Opening new markets, low production costs.
The objectives of internationalizing a business are opening new markets, lower production costs and structure of production and distribution of the company more efficient (Canals, 1994).
Resources or customers outside the borders.
Internationalize the company is managing any area of business or customers using resources beyond the borders of the country where the company is (Zaldo, 1997).
Gradual commitment to international markets.
It argues that the internationalization of a company is a gradual commitment of management to international markets (Johanson and Wiedershein, 1975, Johanson and Vahlne, 1977, 1990; Nordsrrom and Vahlne, 1993).
Source: Prepared. 1. Multinational Companies The rapid emergence of developing economies is characterized by a wave of economic growth and the rise of national companies to become global competitors themselves. These companies are globalizing their businesses and competing with the traditional American model of modern multinational corporations (Vargas-Hernández, 2010).
393
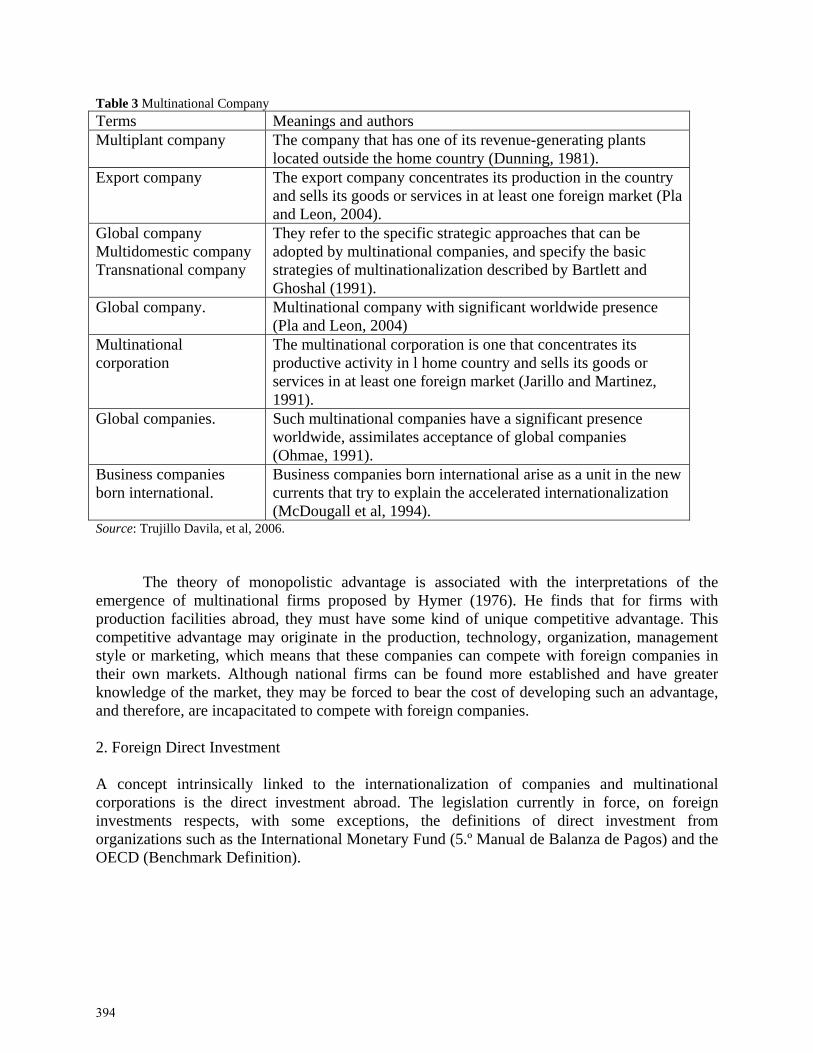
Table 3 Multinational Company Terms Meanings and authors Multiplant company The company that has one of its revenue-generating plants
located outside the home country (Dunning, 1981). Export company The export company concentrates its production in the country
and sells its goods or services in at least one foreign market (Pla and Leon, 2004).
Global company Multidomestic company Transnational company
They refer to the specific strategic approaches that can be adopted by multinational companies, and specify the basic strategies of multinationalization described by Bartlett and Ghoshal (1991).
Global company. Multinational company with significant worldwide presence (Pla and Leon, 2004)
Multinational corporation
The multinational corporation is one that concentrates its productive activity in l home country and sells its goods or services in at least one foreign market (Jarillo and Martinez, 1991).
Global companies. Such multinational companies have a significant presence worldwide, assimilates acceptance of global companies (Ohmae, 1991).
Business companies born international.
Business companies born international arise as a unit in the new currents that try to explain the accelerated internationalization (McDougall et al, 1994).
Source: Trujillo Davila, et al, 2006.
The theory of monopolistic advantage is associated with the interpretations of the emergence of multinational firms proposed by Hymer (1976). He finds that for firms with production facilities abroad, they must have some kind of unique competitive advantage. This competitive advantage may originate in the production, technology, organization, management style or marketing, which means that these companies can compete with foreign companies in their own markets. Although national firms can be found more established and have greater knowledge of the market, they may be forced to bear the cost of developing such an advantage, and therefore, are incapacitated to compete with foreign companies. 2. Foreign Direct Investment A concept intrinsically linked to the internationalization of companies and multinational corporations is the direct investment abroad. The legislation currently in force, on foreign investments respects, with some exceptions, the definitions of direct investment from organizations such as the International Monetary Fund (5.º Manual de Balanza de Pagos) and the OECD (Benchmark Definition).
394

Table 4 Foreign Direct Investment Terms Meanings and authors. Lasting relationship between a resident and a nonresident of an economy.
Lasting relationship between a resident in one economy (subsidiary) and a non-resident (holding company), with the intention of influencing their management, which is required for the latter owns at least 10% of the share capital of the first (OECD Benchmark Definition).
Flow of resources Investments in a country other than the country of origin for the investor, which draws resources flow (Dunnign, 1988).
Strategy in the internationalization process
It establishes that foreign direct investment is an option of international presence, a mode strategy in the internationalization process of the firm (Duarte Lopez, 1996).
Multinational enterprise Concept closely linked to multinational corporations as defined and determined (Dunnign, 1979, 1980, 1988).
Source: Prepared.
The ways in which such investment occurs are: Investment for the creation of new companies, acquisition of part or all of the share capital of an existing company, reinvested earnings and intercompany loans and related stock companies (Fernandez-Otheo, 2005). Hymer (1976) also considers the cause of FDI the elimination of conflict between competing companies when the markets in which they operate are imperfect. Scepter (1999) states that the solution to these problems could arise when an organization would control all companies rather than independent companies exist, or if they produce agreements between different market participants. B. Theoretical Framework 1. Theory of Internalization The internalization theory of multinational companies has its origin in the theory of transaction costs. The latter assumes that when markets are perfectly competitive, no need any control mechanism, since the threat of being replaced by another company, eliminates the possibility of developing opportunistic behavior and force companies to act efficiently (Whitelock, 2002). When reducing the number of suppliers, then the company is less likely to replace and, therefore, the transaction costs are increased due to the need of a rigorous bargaining and to assume and take some monitoring costs to ensure that the contract is fulfilled in conditions that had been established (Dwyer and Oh, 1988). The analysis of the transaction costs predicts that the company internationalizes markets, when asset specificity is high.
The theory of internationalization, as indicated, considers that experiential knowledge is
the key to explain the process of internationalization of the company. It is particularly important because it allows linking its internal resources with market opportunities (Ericsson et al. 2000, 2001, Luo, 1999). In the field of exports the theory of internationalization is identified with knowledge concerning consumers, competitors, channels, environment, as a key element of the knowledge base of the firm (Morgan et al., 2003) is identified.
395
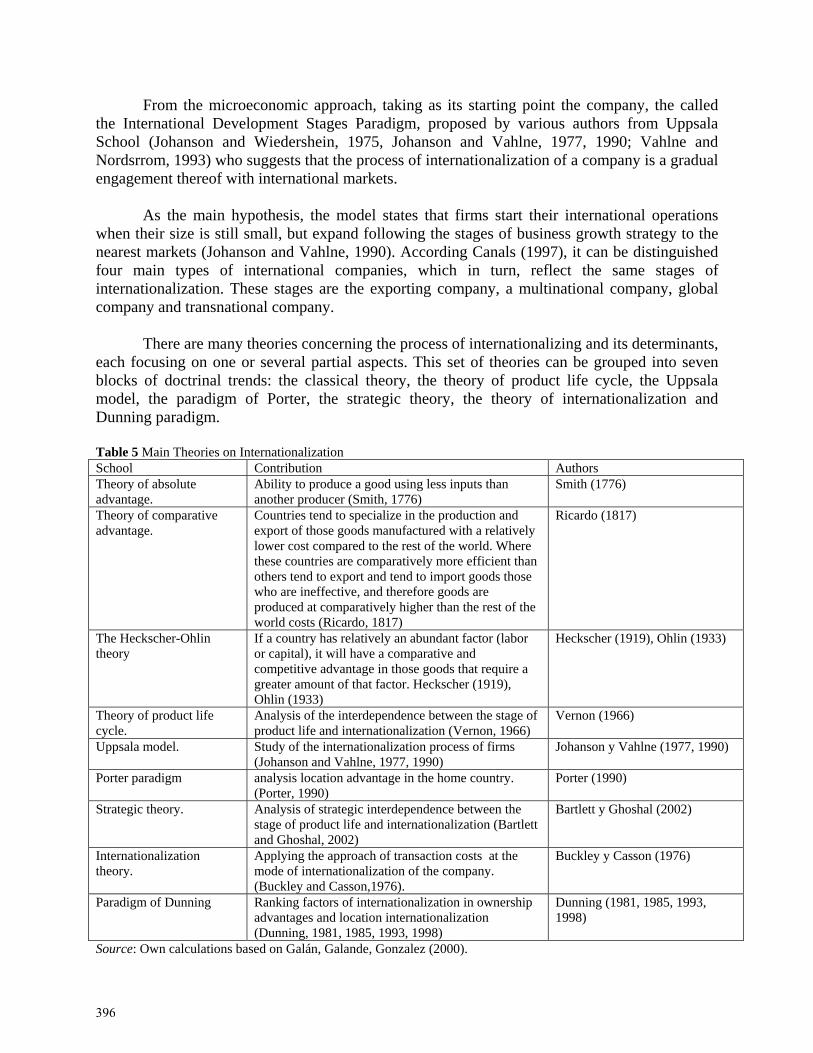
From the microeconomic approach, taking as its starting point the company, the called the International Development Stages Paradigm, proposed by various authors from Uppsala School (Johanson and Wiedershein, 1975, Johanson and Vahlne, 1977, 1990; Vahlne and Nordsrrom, 1993) who suggests that the process of internationalization of a company is a gradual engagement thereof with international markets.
As the main hypothesis, the model states that firms start their international operations when their size is still small, but expand following the stages of business growth strategy to the nearest markets (Johanson and Vahlne, 1990). According Canals (1997), it can be distinguished four main types of international companies, which in turn, reflect the same stages of internationalization. These stages are the exporting company, a multinational company, global company and transnational company.
There are many theories concerning the process of internationalizing and its determinants,
each focusing on one or several partial aspects. This set of theories can be grouped into seven blocks of doctrinal trends: the classical theory, the theory of product life cycle, the Uppsala model, the paradigm of Porter, the strategic theory, the theory of internationalization and Dunning paradigm. Table 5 Main Theories on Internationalization School Contribution Authors Theory of absolute advantage.
Ability to produce a good using less inputs than another producer (Smith, 1776)
Smith (1776)
Theory of comparative advantage.
Countries tend to specialize in the production and export of those goods manufactured with a relatively lower cost compared to the rest of the world. Where these countries are comparatively more efficient than others tend to export and tend to import goods those who are ineffective, and therefore goods are produced at comparatively higher than the rest of the world costs (Ricardo, 1817)
Ricardo (1817)
The Heckscher-Ohlin theory
If a country has relatively an abundant factor (labor or capital), it will have a comparative and competitive advantage in those goods that require a greater amount of that factor. Heckscher (1919), Ohlin (1933)
Heckscher (1919), Ohlin (1933)
Theory of product life cycle.
Analysis of the interdependence between the stage of product life and internationalization (Vernon, 1966)
Vernon (1966)
Uppsala model. Study of the internationalization process of firms (Johanson and Vahlne, 1977, 1990)
Johanson y Vahlne (1977, 1990)
Porter paradigm analysis location advantage in the home country. (Porter, 1990)
Porter (1990)
Strategic theory. Analysis of strategic interdependence between the stage of product life and internationalization (Bartlett and Ghoshal, 2002)
Bartlett y Ghoshal (2002)
Internationalization theory.
Applying the approach of transaction costs at the mode of internationalization of the company. (Buckley and Casson,1976).
Buckley y Casson (1976)
Paradigm of Dunning Ranking factors of internationalization in ownership advantages and location internationalization (Dunning, 1981, 1985, 1993, 1998)
Dunning (1981, 1985, 1993, 1998)
Source: Own calculations based on Galán, Galande, Gonzalez (2000).
396

2. Business Growth
It cannot be analyzed the internationalization without studying the growth of businesses. According to Penrose (1959), company’s growth is a cumulative process resulting from the interaction between external inducers such as market opportunities and productive services available in the company, derived from its own resources. The impact that foreign competition has in the country, has resulted in growth in Mexican companies while adapting to the needs of international markets. Chandler (1992) and Penrose highlight the existence of internal factors and external factors in the process of business expansion. External forces come from changes in markets, technology and population. A remarkable increase of Mexican companies is a result of regional integration which has been part of Mexico.
Integration can also help in the short term to the transmission of knowledge and
technology transfer to domestic producers brings new products and processes generated by trading partners (Grossman and Helpman, 1990). The competition from foreign companies and the transfer of technology and innovative production processes results in an increase in the internationalization of Mexican companies. Having a technological breakthrough opportunities and long-term growth, it would be advantageous for a country to be able to compete successfully in an industry, field or product whose markets offer good prospects for development that rely on key technologies (Arjona, 1995). The internationalization strategy is a growing commitment and involvement of its resources and capabilities to international markets requiring different levels of investment, risk and control.
According to Johanson and Vahlne (1977), internationalization as an evolutionary
dynamics nature´s phenomenon implies an increasing commitment of companies to human and financial resources in foreign markets. There are illustrative cases in the recent literature showing the importance that in the development of SMEs has had its participation as suppliers of large global companies with foreign capital. Issues such as geographic proximity or cognitive close relations established between local suppliers and global manufacturing companies (Asheim and Isaksen, 2003). Another view of the impacts of foreign direct investment (FDI) has to do with the role that transnational corporations can exert through direct operation on local businesses via its ownership of the latter (Blomström and Kokko, 1996 ).
It is for this reason that most Mexican companies with foreign capital comes mainly from
trading partners with which Mexico has signed trade agreements. Torres and Jasso (2009) state that business growth is related not only to the use of its initial resources, but with the development of skills and abilities that accumulates during productive operations and daily management, facing a number of adverse forces arising from the conditions of the economic context in which they operate. The authors note that there are factors that cause expansion or contraction of business, such as the decline in demand for products or the opportunity to create new markets, changes in demographics and the development of technological innovations.
There has been in recent years a growth in companies in various sectors. Some large
national companies have partnered with transnational counterparts to face international competition in domestic field, but also to expand into foreign markets, as it happens especially in cases of the cement, the brewing, chemical, glass and automotive industries (Vidal, 2000).
397

8. RESEARCH METHODS A. Table 6 Methodological Congruence
Variable Description Concept Indicators Research instruments
Operationalization of variables(ítems)
Data analysis
X Trade globalization
Economic, technological, social and cultural scale process,which involves increased communication and interdependence among countries in the world, unifying its markets, societies and cultures, through a series of social, economic transformations and policies that give them a global (concept of the author).
(X1) Multilateralism (X2) Regionalism
Databases Trade agreements signed by Mexico. Blocks and commercial international trade associations to which Mexico belongs.
Descriptive statistics that provide graphic Analysis of average Medium Media Inferential statistics Correlation of variables
Y Business Internationalization
Internationalization strategy of Mexican companies. Corporate strategy By growth by international geographic diversification through an evolutionary and dynamic long-term process that gradually affects the different activities of the value chain and the organizational structure of the company with a growing commitment and involvement of its resources and capabilities to the international environment, and based on an augmentative knowledge "Villarreal Larrinaga O. (2006).
Expansion in the global market. Growth rate companies abroad document analysis.
Documental analysis Data base IQOM
It is used APSS system to make graphs Descriptive statistics Research is longitudinal.
Source: Prepared.
398

9. FINAL THOUGHTS
Through the method of descriptive statistical research is to analyze the increasing internationalization of Mexican companies and the impact of foreign investors and major multinational derivative trade globalization, same as taking advantage of the openness trade policy in Mexico, through multilateralism and regionalism have increased their presence in international markets. Similarly, how globalization impacts the business, strategies for internationalization of Mexican companies when deciding to internationalize to a specific market.
In light of the foregoing, Mexican companies not only face fierce competition in international markets but facing international competitors in the domestic market, with standardized products, with better technology and above all, more economical; consumers initially had local preferences, today, are seduced by the low price.
A través del método de investigación estadístico descriptivo, se pretende analizar el aumento en la internacionalización de las empresas mexicanas así como el impacto de los inversionistas extranjeros y las principales multinacionales derivado de la globalización comercial, mismas que aprovechándose de la política comercial aperturista de México, a través del multilateralismo y regionalismo, han incrementado su presencia en los mercados internacionales.
De igual forma, de qué manera impacta la globalización comercial, en las estrategias de internacionalización de las empresas mexicanas, al momento de decidir internacionalizarse hacia un mercado en específico.
En virtud de lo anterior, las empresas mexicanas no solo se enfrentan a una feroz competencia en los mercados internacionales, sino que se enfrentan a competidores internacionales en el mercado nacional, con productos estandarizados, con mejor tecnología y sobre todo, mas económicos; los consumidores, inicialmente tenían preferencias locales, hoy en día, se ven seducidos por el precio bajo.
399
REFERENCES Andersen, O (1993). On the internationalisation process of firms; a critical analysis. Journal of
International Business Studies. Second quarter. P. 209-231 Arango Quintero, J.C. y Cardona Montoya, G. (2008). Multilateralismo, regionalismo abierto y
desviación de comercio: una relación dialéctica. Mercatec, 2008/No. 44, Colombia, Esumer, 1995-2011, pp. 25-32.
Arjona, L. (1995). La tecnología en la teoría del comercio: la perspectiva evolutiva, El Trimestre económico, vol. LXII , No. 248, México, D.F., Fondo de Cultura Económica (FCE).
Asheim, B. y A. Isaksen (2003), SMEs and the regional dimension of innovation, en Asheim, B. Isaksen, A. Nauwelaers, C. Tödtling, F. (editores), Regional Innovation Policy for Small-Medium Enterprises, Edwar Elgar Publishing, Reino Unido.
Bartlett C., Ghoshal S. (2002). Managing Across Borders. Harvard Business Press, 2002. 391 pp Blomström, M. y A. Kokko (1996). The Impact of Foreign Investment on Host Countries: A
Review of the Empirical Evidence. Working Paper 349, Stockholm School of Economics, NBER and CEPR.
Buckley, P.J., y Casson, M. (1976), The Future of the Multinational Enterprise, McMillan, Londres.
Bueno, E. (1996). Dirección estratégica de la empresa; metodología, técnicas y casos, Madrid: Pirámide.
Canals, J. (1994). La internacionalización de la Empresa. Madrid, Mcgraw-Hill. Chandler, A., (1992). Organizational Capabilities and the Economic History of the Industrial
Enterprise. Journal of Economic Perspectives, Vol. 6, Num. 3, pp.79-100 De La Dehesa, G. (2000). Comprender la globalización, Alianza Editorial, Madrid. Dunning, J.H. (1981). International Production and the Multinational Enterprise. London:
George Allen & Unwin. Dunning, J.H. (1985). Multinational Enterpireses Exonomic Structure and International
Competitiveness. New York; John Wiley & Sons. Dunning, J.H. (1993). The Globalization of Business. London: Routledge. Dunning, J.H. (1998). Location and the Multinational Enterprise: A Neglected Factor. Journal of
International Business Studies. 29 (1): 45-66 Dwyer R., Oh S. (1988). A transaction cost perspective on vertical contractual structure and
interchannel competitive strategies. The Journal of Marketing. Vol. 52, No. 2 pp 21-34 Eriksson, J.; Johanson, A.; Majkgard, A. y Sharma, D. (1997), Experiential Knowledge and Cost
in the Internationalisation Process, Journal of International Business Studies, vol.28 (2), págs. 337-360.
Fernández-Otheo, C. M. (2005): “Inversión directa extranjera”, en García Delgado, J.L. (dir.), Lecciones de Economía española, séptima edición, Thomson-Civitas, Madrid.
FMI (1997): World Economic Outlook, Washington, DC
400
Galán, J. Galande J., González J. (2000). Factores determinantes del proceso de internacionalización: El Caso Castilla y León comparado con la evidencia española. Revista Economía Industrial. No. 333.
Gómez, Arulfo R. (2006). Globalización, Competitividad y Comercio Exterior. Análisis Económico, segundo cuatrimestre, año/vol XXI, numero 047. Universidad Autónoma Metropolitcana – Azcapotzalco. Distrito Federal, Mexico. Pp. 131-178
Grossman, G. y E. Helpman,(1990). The new growwth theory. Trade, innovation and growth. The American Economic Review; Proquest social science Journals, mayo 1990, American Economic Association, vol. 80, num. 2, en http://www.jstor.org/pss/2006548, pp. 86/91
Hernández M., Soto, A., Vázquez M.A., (2008). Impacto subregional del TLCAN. Sonora en el contexto de la frontera norte. Frontera Norte, julio-diciembre, año/vol. 20, numero 040. El Colegio de la Frontera Norte. Tijuana, México. pp. 105-134.
Hymer, S. H. (1960/1976): The International Operations of National Firms: A Study of Direct Foreing Investment. MIT Press. Cambridge Jarillo, J. C. y Martínez, J. (1991): Estrategia Internacional. Más allá de la exportación. Mc Graw-Hill, Madrid. Jiménez Martínez J. (2007). Determinantes para la Internacionalización de las Pymes mexicanas.
Análisis Económico, primer cuatrimestre, año/vol. XXII, numero 049. Universidad Autónoma Metropolitana – Azcapotzalco, Distrito Federal, México. pp. 111-131
Johanson, J., Vahlne, J. (1977). The Internationalization Process of the Firm- A Model of Knowledge Development and Increasing Foreign Market Commitments. Almquist & Wiksell International. Estocolmo, Suecia.
Johanson, J., Vahlne, J. (1990) The mechanism of internaliosation. International Marketing Review. 7 (4): 11-24
Levitt T. (1983). Globalization of Markets. Harvard Business Review. Publicación de fecha 1 de mayo. Num. 83308-PDF-ENG.
López Duarte, C. y Ruiz Vega, A. V. (1996). Alternativas de penetración de los mercados exteriores. Aplicación al caso de la República de Cuba. Alta Dirección, 31(190), 91-99.
Luo, Y. (1999). Time Based Experience and International Expansion: The Case of an Emerging Economy. Journal of Mangement Studies, vol. 36(4), págs. 505-534.
Mcdougall, P., Shane, S. y Oviatt, B. (1994): «Explaining the Formation of International New Ventures: the Limits of the Theories From International Business Research»,
Journal of Business Venturing, vol. 9, pp. 469-487. Martínez Lagorreta O. (2002). La construcción de la región Asia Pacifico. El papel de los
organismos internacionales regionales. Comercio Exterior, Vol. 52, Núm. 9. Disponible en: http://revistas.bancomext.gob.mx/rce/magazines/6/2/RCE.pdf
Montaño Hirose, L. 2002. Estrategias empresariales de modernización frente al proceso de globalización económica: El caso de México. Gestión y Política Pública, primer
401

semestre, año/vol. XI, numero 001. Centro de Investigación y Docencia Económicas, A.C. D.F., México. pp. 67-83
Morgan, N. A.; Zou, S.; Vordhies, D. W. y Katsikeas, C. S. (2003). Experiential an Informational Knowledge, Architectural Marketing Capabilities, and the Adaptive Performance of Export Ventures: A Cross-National Study. Decisions Sciences, vol. 34 (2), págs. 287-321.
OCDE: Benchmark Definition. (2008). OECD Benchmark Definition of Foreign Direct Investment. Disponible en: http://www.oecd.org/daf/inv/investmentstatisticsandanalysis/40193734.pdf
Ohmae, K. (1991): El mundo sin fronteras, Ed. Mc Graw-Hill, Madrid. Penrose, E. (1994). Strategy/ Organisation and the Metamorphosis of the Firm. Unpublished
Paper for Prince Bertil Symposium, Papers for Session III, Stockholm, June 12-14. Pineda, O. (1998). Principales enfoques sobre la globalización: un análisis comparativo. Instituto
Politécnico Nacional. México D.F. ISBN: 978968700 1395 Pitelis, Ch. (2002). The Growth of the Firm. The Legacy of Edith Penrose. Oxford University
Press. Oxford, U.K Pla, J. y Cobos A. (2002). La Aceleracion del proceso de internacionalización de la empresa: el
caso de las new venures españolas. Información Comercial Española. 802:9-22. Pla, J. y Leon F. (2004). La internacionalización de la industria hotelera española: formas de
entrada y factores determinantes. Papeles de economía española no.102. Porter M. (1990). The Competitive advantage of Nations. New York. The Free Press. Porter, M. (1986). Competition in Global Industries. Boston: Harvard Business School Press. Rialp, A. (1997). Las fases iníciales del proceso de internacionalización de las empresas
industriales catalanas: una aproximación empírica. Tesis Doctoral. Universidad Autónoma de Barcelona.
Ruiz Nápoles. P. (2004). América Latina ante la Organización Mundial de Comercio: Lecciones de la reunión de Cancún. ISSN: 0188-7653
Ruggiero, R. (1995). Un reto mundial: oportunidades y opciones que se ofrecen en el sistema multilateral de comercio. Decimocuarta Conferencia Paul-Henri Spaak. Discurso pronunciado en la Universidad de Harvard. Disponible en:
http://www.wto.org/spanish/news_s/sprr_s/sprr_s.htm) Secretaria de Economía, Gobierno Federal (2011). Ficha Informativa del Tratado de Libre
Comercio entre México y Costa Rica, El Salvador, Guatemala, Honduras y Nicaragua. Secretaria de Economía.
Secretaria de Economía, Gobierno Federal (2014). Página Oficial. Consultada el 26 de mayo de 2014. Disponible en: http://www.economia.gob.mx/comunidad-negocios/comercio-exterior/tlc-acuerdos
Torres A. y Jasso J. (2009). Naturaleza y crecimiento de las empresas: la dinámica innovadora en las Pymes. Capítulo 4, en Dutrenit Gabriela (coordinación) Sistemas Regionales de
402

Innovación: un espacio para el desarrollo de las Pymes. El caso de la industria de maquinados industriales, UAM-Textual, ISBN: 978-9974-8180-9-5, Uruguay, pp. 55-80.
Trujillo Davila, Rodríguez Ospina (2006). Perspectivas teóricas sobre internacionalización de empresas. Documentos de Investigación, Facultad de Administración, Univ. del Rosario, Colombia.
Vahlne, J. y Nordstrom, K. (1993). The Internationalisation process: impact of competition and experience. Internacional Trade Journal, 7 (5): 529-548.
Van Klaveren A. (1997). Regionalismo y Multilateralismo: Una convergencia necesaria, en El futuro del libre comercio en el continente americano, Lopez Ayllón, S., coord., México, UNAM.
Vargas Hernandez J. (2011). Strategies and performance of new mexican emerging multinational enterprises. Global journal of management and business research. Vol. 11, No. 3. 2011. Capturado el día 9 de septiembre de 2012. http://journalofbusiness.org/index.php/GJMBR/article/view/468
Vernon. R. (1996). International Investment and International Trade in the Product Cycle. Quarterly Journal of Economics. 80 (1): 190-207.
Vidal, G. (2000). Grandes empresas, economía y poder en México. 2ª Edición, Plaza y Valdés Editores y Universidad Autónoma Metropolitana, México.
Villarreal Larrinaga O. (2005). La internacionalización de la empresa y la empresa multinacional: una revisión conceptual contemporánea. Cuadernos de Gestión Vol. 5. N.º 2 (Año 2005), pp. 55-73 ISSN: 1131 - 6837 58
Villarreal Larrinaga O. (2006). La estrategia de internacionalización de la empresa: un estudio de casos de multinacionales vascas. Tesis publicada por el Departamento de Economía Financiera. Universidad del País Vasco, Bilbao. Capitulo 4. Pp. 1082.
Whitelock, J. (2002). Theories of Internationalisation and their Impact on Market Entry, International Marketing Review, Vol. 19, Vol. 4.
Zaldo, J.M. (1997). Gestión Internacional de las PYMES. Ed. SPRI pp. 261. ISBN 8488940459, 9788488940452.
403
Econometric Modelling of the Variations and Structural Changes of Norway’s Import Trade across Continents and Over Time
YOHANNES YEBABE TESFAY1
Master of Statistics and Econometrics, Molde University College,
Britveien 2, Kvam, 6402 Molde, Norway
PER BJARTE SOLIBAKKE Professor, Molde University College,
Britveien 2, Kvam, 6402 Molde, Norway This paper proposes to apply a new econometric model to assess Norwegian imports over the world’s continents. The paper applies the two-stage non-full rank hierarchical linear econometric model for yearly import data ranging from 1988 2014 (26 years). The econometric model can give important information about the Norwegian import pattern without using other predictor variables. Furthermore, the model incorporates the Hecksher-Ohlin theory of international trade and can show: [1]. the overall trade pattern and [2]. the potential structural import trade changes. The results suggest first that the Norwegian import expenditure shows heterogeneity across world continents. The continent of Europe has a market share alone of 69.3 %. Moreover, more than 95% of Norwegian imports are dependent on imports from the three continents of Europe, Asia and Oceania, and North and Central America. Second, the results suggest potential structural changes over both continents and items for Norwegian imports. KEYWORDS import trade, continental variations, items of import, two-stage non-full rank hierarchical linear econometric model and Norway.
1 Address correspondence to Yohannes Yebabe Tesfay, Master of Statistics and Econometrics, Molde University College, Britveien 2, Kvam, 6402 Molde, Norway. E-mail: [email protected]
404
Sanitary and Phitosanitary Measures in Latin America: Evidence and Effects on Agricultural Trade1
ORLANDO MONTEIRO DA SILVA2
Professor, Department of Economics, Universidade Federal de Viçosa, Viçosa, Minas Gerais, Brazil
MARCELA OLEGÁRIO SANTOS
Graduate Student, Department of Economics, Universidade Federal de Viçosa, Viçosa, Minas Gerais, Brazil
This research analyzed all notifications issued by Latin American (LA) countries to the Agreement on Sanitary and Phitosanitary Measures (SPS) from the WTO, in the period between 1995 and 2014. They were described by country of origin, by their goals, their time distribution and by classification of goods. A model that relates the exports of major agricultural products from the Latin American countries with the SPS measures was also estimated. Results showed a large asymmetry in the emissions of regular notifications and that SPS measures have been acting as barriers to the exports of the analyzed products, with an effect larger than that of tariffs. KEYWORDS Latin America, sanitary and phytosanitary measures, notifications to the WTO JEL F13, F14, Q17
1Financed by FAPEMIG – Fundação de Amparo a Pesquisa do Estado de Minas Gerais. 2 Address correspondence to Professor, Department of Economics, Universidade Federal de Viçosa, Viçosa, Minas Gerais, Brazil. E-mail: [email protected]
405
1. INTRODUCTION
Over the years, multilateral and even bilateral agreements have helped to substantially reduce the trade tariffs, which, in the agricultural case, declined from an average level of 19.9% in 1995 to 7.4% in 2008. Basuet al. (2012) showed that the decline that occurred in the non-agricultural sector was even more significant, ranging from 6.7% to 2.4% over the same period. This decline has increased the importance of non-tariff measures, and its growth and dispersion are evident. A recent UNCTAD (2013) publication shows that 30% of all products commercialized in the international market are affected by non-tariff measures, with the sanitary and phytosanitary (SPS), alone, corresponding to 15% of the total.
Nonetheless, according to Musselli and Zarrilli (2004), most developing countries are
not able to effectively participate in the process of adoption of international standards related to SPS measures, and, therefore, face difficulties in adopting the requirements demanded by the importers. Usually, these countries do not have information on all measures affecting their exports, do not know if they are consistent with the WTO SPS Agreement and, still, do not know their impact on their exports, since SPS measures involve rules and regulations with various effects, such as labeling requirements, packaging, maximum residue limits, inspection and certification processes, etc.
The research of Bureau et al. (2007) and Disdier et al. (2008) analyzed the effects of
the barriers faced by the Latin American countries and by the Groups of African, Caribbean and Pacific (ACP) countries in the exports of tropical products, and showed that small and medium producers are those who have the greatest difficulties in adjusting to sanitary and phytosanitary requirements. Specifically in the case of eleven Latin American countries that are members of the WTO tropical products group, these authors showed that the combination of various preferential agreements, such as the European Union General System of Preferences (EU-GSP). The agreement between the United States and the Andean countries, regarding the application of the drug law (ATPDEA), and the Central American Free Trade Agreement resulted in the elimination of the tariffs for most products in the U.S. and European Union markets. However, nowadays, non-tariff barriers are the main hindrances to exports from Latin American countries. Using a gravity equation, it showed that both exports of ACP and Latin American countries are significantly affected by SPS measures.
The Latin America and the Caribbean share in the global cereal production reached a
historic record of 8.2% (LAIA, 2012). Regarding the food exports, there was an increase in the participation of these countries from 14.9% in the period 1990/99 to 17.8% in 2000/09. This study also showed the importance of intra-regional commerce that LAIA countries have in agricultural-food trade, considering that 40% of imports have their origin in members of these countries. However, it is argued that this trade is limited by the existence of many non-tariff barriers, particularly sanitary and phytosanitary requirements. ECLAC (2008) also recognizes this problem and suggests a harmonization of sanitary measures as one way to facilitate the intra-regional trade.
An important issue is that the adequacy of the countries to these requirements directly
affects production costs and varies according to their share in the international market. They can benefit the trade, if that harmonization of SPS measures stimulate the demand for products, but can also be protectionist when, in its different forms, it increases the costs or discriminates the trade among countries.
406

Therefore, a constant evaluation of sanitary and phytosanitary measures that affect the Latin American countries, and within the measures adopted by them, would allow not only to know if there is any relation between them, enabling inferences about their use as a protective measure or as a compliance to the international markets requirements, but also to evaluate its effect on trade flows.
This is the purpose of this study, which, apart from this Introduction, is divided into
three other sections. In the second one we present the methods used to analyze the SPS notifications. Section three presents a general description of all SPS notifications (regular and emergency) issued by the Latin American countries from 1995 to 2014 and the results of the estimated regression model, for the main agricultural products exported. Section four draws some final thoughts on the results of this study.
2. METHODOLOGY An SPS measure encompasses rules, controls, restrictions and procedures that countries impose in order to prevent the spread of pests and diseases and food contamination, and, therefore, protect human, animal and plant health, and food safety within their territory (Cozendey, 2010).
By creating an agreement that specifically takes care of sanitary and phytosanitary
measures (SPS), the WTO aimed to establish the criteria that should guide the governments actions in the adoption of sanitary and phytosanitary standards, preventing them from becoming a disguised restriction on international trade (WTO, 2012). Before the entry into force of the SPS Agreement in 1995, governments could resort to the Standards Code approved in the Tokyo Round (1973/79) or could invoke the Article XX (b) of GATT to adopt restrictive trade measures in order to protect health and life. However, the negotiators from the Uruguay Round understood that the legal framework defined by these standards was inaccurate and, therefore, insufficient to establish operating principles clear enough to guide the actions of governments in the adoption of standards or controlling measures (SILVA & SANTOS, 2013).
The SPS Agreement encourages, yet does not obliges its members to base their
measures on standards approved by relevant international organizations (FAO/WHO, Codex Alimentarius, the World Organization for Animal Health and the International Plant Protection Convention). If countries consider that these standards do not ensure an adequate level of health protection, they can set their own, which can be more demanding. The only condition imposed is that there should be a scientific assessment of the risk that justifies them. Also, countries should inform their partners through notifications to the WTO secretariat on their legislation and regulatory proposals regarding SPS, spreading the knowledge of their health requirements and allowing possible comments and/or objections regarding the measures to be imposed. The WTO maintains a database on SPS notifications (WTO, 2014) which identifies the number of notifications issued by each country, the issue dates, the goals or reasons for them and the most notified products, since 1995, when agreements became effective. The tabular and graphical methods are used herein for ease of presentation and analysis of those notifications.
To evaluate the effect of sanitary and phytosanitary notifications (SPS) regarding the
trade flows in Latin America, we chose to use the procedure by Fontagné et al. (2013) and
407
the information about the specific trade concerns, raised by the WTO Members, regarding the measures adopted by the trading partners. These specific trade concerns are raised at the Committee on Sanitary and Phytosanitary Measures and are available in WTO database (WTO, 2013). One advantage of their usage is that they represent a real concern of countries regarding their export trades: that the measures related to them represent barriers to the trading activity, since the use of every notification does not make a distinction between those measures that can benefit trade. Currently, the database contains more than three hundred specific trade concerns that have been raised since 1995. Each of them corresponds to a concern of one or more countries regarding a trading partner. To each specific trade concern, there is information on: the country or countries that raised concerns and the one that imposed the measure; the product code (HS-4) involved in the concern; the year in which the concern was raised; and the year in which it was resolved.
The information regarding specific trade concerns have allowed the creation of an
observation panel on the export trades of each product (meat, fruit and coffee), by the countries (Argentina, Brazil, Chile, Colombia, Mexico and Peru) to the main importers (European Union, United States and Japan) in the period of 1996 to 2011. On this panel, the relationship between the values of those exported agricultural products and the specific trade concerns with the SPS measures was estimated, also including some characteristics of the countries, such as their importance in total exports of those products and control variables, as well as the import tariffs and the share of each market on total exports. The proposed equation took the following form:
, , , ∗ , , ∗ , , ∗ , , ∗ , , , ,
where, , , , stands for the exports of product , from country to country , in the year .
, , is a dummy variable, which captures the existence of a specific trade concern from the exporting country , with an SPS measure adopted by the importing country in the year ; , , is the total exports of the product of the country in year ; , , is the share of
exports of product of the country in the total imports of country in the year ; , , is the tariff charged by country on imports of product in the year ; ∝ , and , represent fixed effects for products and exporting countries over the period. Trade data (values and quantities) of the various products are available on the UN website (UNCOMTRADE).
3. RESULTS
The results are presented in two subsections: In subsection 3.1, the notifications issued by Latin American countries over the period of analysis, are presented and characterized. In the following subsection (3.2), are presented and discussed the results obtained from the proposed statistical model. 3.1 The SPS Notifications in Latin American Countries It is important to say that all Latin American countries are members of the World Trade Organization and, therefore, signatories of the Agreement on Sanitary and Phytosanitary Measures (SPS) and related institutions: the International Organization for Animal Health
408
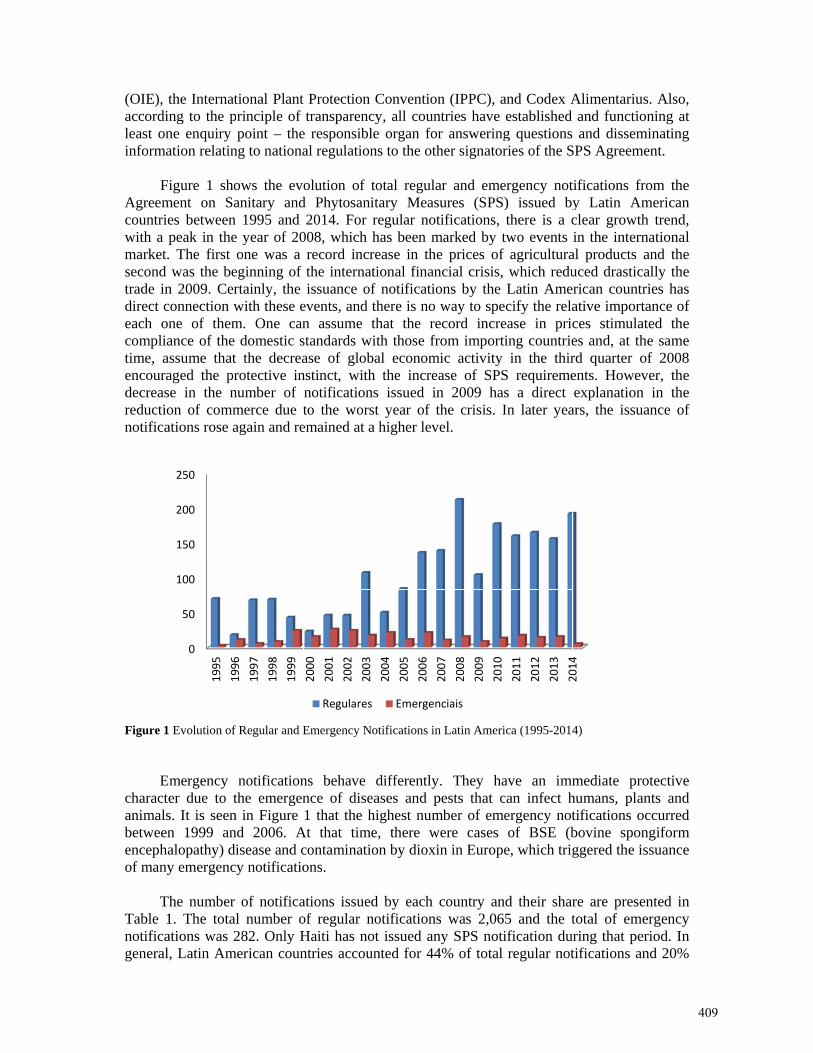
(OIE), taccordinleast oninforma
Fi
Agreemcountriewith a pmarket.second trade indirect ceach oncompliatime, aencouradecreasreductionotifica
Figure 1
Echaracteanimalsbetweenencephaof many
Th
Table 1notificageneral
the Internatng to the pne enquiry ation relatin
igure 1 shoment on Saes between peak in the The first was the be
n 2009. Cerconnection wne of themance of the ssume that aged the prse in the non of commations rose a
Evolution of
mergency er due to ts. It is seenn 1999 analopathy) diy emergenc
he number 1. The totalations was 2, Latin Am
0
50
100
150
200
250
1995
1996
tional Plant rinciple of point – the
ng to nationa
ows the evoanitary and
1995 and e year of 20one was a
eginning of rtainly, the with these em. One can
domestic sthe decrea
rotective innumber of merce due tagain and re
f Regular and E
notificationthe emergen
n in Figure nd 2006. Aisease and cy notificatio
of notifical number o282. Only H
merican coun
1996
1997
1998
1999
Protection transparenc
e responsiblal regulation
olution of d Phytosani2014. For
008, which record incrthe internaissuance o
events, and n assume standards wase of glob
nstinct, withnotificationto the wors
emained at a
Emergency N
ns behave nce of dise1 that the h
At that timcontaminations.
ations issueof regular nHaiti has nontries accou
2000
2001
2002
2003
Regulares
Conventioncy, all counle organ forns to the oth
total regulaitary Measregular nothas been mrease in the
ational finanf notificatiothere is nothat the re
with those frbal economh the increns issued inst year of ta higher lev
Notifications in
differentlyeases and phighest nume, there won by dioxi
d by each notificationsot issued anunted for 44
2004
2005
2006
2007
s Emergen
n (IPPC), antries have r answeringher signator
ar and emesures (SPS)tifications,
marked by te prices of ncial crisis, ons by the way to spe
ecord increrom importi
mic activity ase of SPSn 2009 hasthe crisis. I
vel.
n Latin Ameri
y. They hapests that cmber of emewere cases in in Europe
country ans was 2,065ny SPS noti4% of total
2007
2008
2009
2010
nciais
and Codex Aestablished g questionsries of the S
ergency not) issued bythere is a c
two events agriculturawhich reduLatin Amecify the rela
ease in pricing countriein the thir
S requiremes a direct In later yea
ca (1995-2014
ave an immcan infect hergency notof BSE (b
e, which trig
d their shar5 and the tification duregular not
2011
2012
2013
2014
Alimentariuand functio
and dissemSPS Agreem
tifications fy Latin Aclear growtin the inter
al products uced drasticrican countative imporces stimulaes and, at thrd quarter oents. Howeexplanation
ars, the issu
4)
mediate prhumans, platifications obovine spoggered the i
re are presetotal of em
uring that petifications a
2014
us. Also, oning at minating
ment.
from the American th trend, rnational and the
cally the tries has rtance of ated the he same of 2008
ever, the n in the uance of
rotective ants and occurred ongiform issuance
ented in mergency eriod. In and 20%
409
of emergency notifications issued by WTO member countries between 1995 and 2014. The country that issued the most SPS regular notifications was Peru (461), followed by Brazil 406), Chile (361), Mexico (158), Argentina (125) and Colombia (104). These countries are major agricultural-product exporters and account for 78% of all regular notifications issued in Latin America during the studied period altogether. There are some peculiarities related to the issuance of notifications by some of these countries. Mexico, for example, had to adapt its standards to those of the United States and Canada when NAFTA was created, and, therefore, the majority of notifications (70 out of 158) were issued in 1995. The case of Peru is similar, since most of their notifications were issued from 2010 on, after the free trade agreement signed with the United States. Peru is one of the Latin American countries that have signed more regional trade agreements. Besides the United States and the Andean Community, Peru has agreements with Canada, China, Singapore, Chile and South Korea.
Concerning emergency notifications, Colombia is highlighted with 24,11% of the total
notifications issued followed by Peru, with 20.92%, Chile (10,28%), Mexico (8,87%) and Argentina (6,74%). Haiti, Nicaragua, Dominican Republic and the Bolivarian Republic of Venezuela have not issued any emergency notification between 1995 and 2014.
410
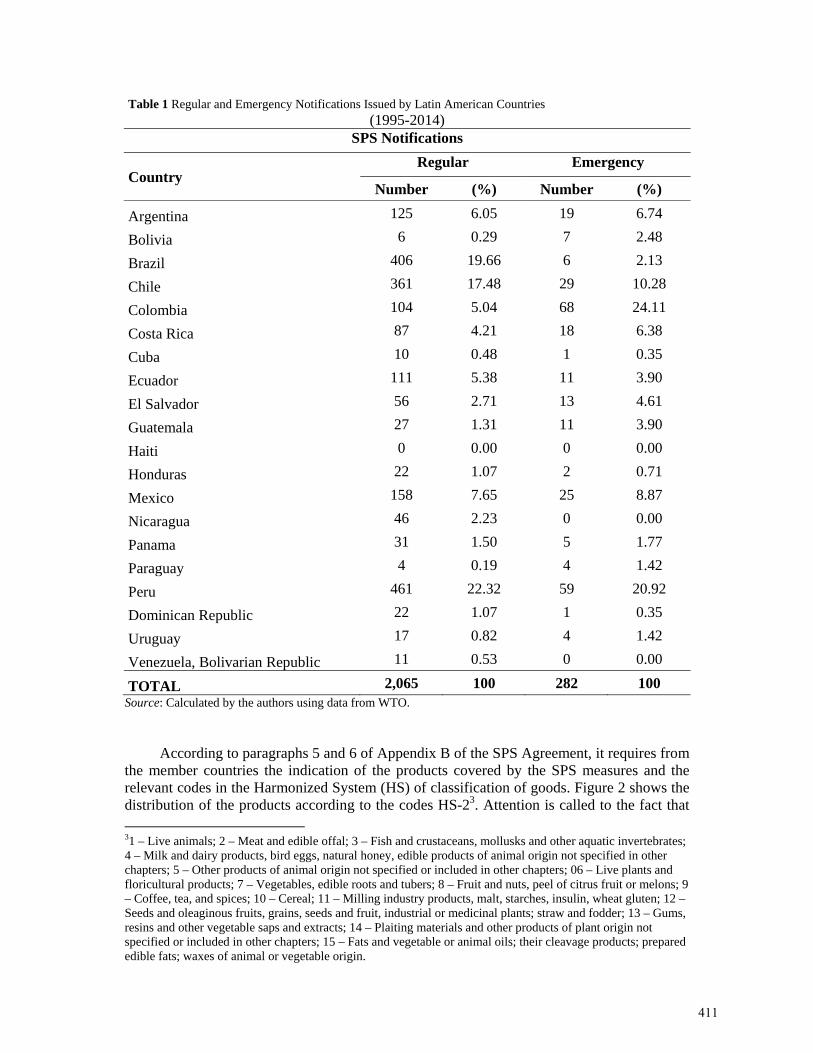
Table 1 Regular and Emergency Notifications Issued by Latin American Countries (1995-2014)
SPS Notifications
Country Regular Emergency
Number (%) Number (%)
Argentina 125 6.05 19 6.74
Bolivia 6 0.29 7 2.48
Brazil 406 19.66 6 2.13
Chile 361 17.48 29 10.28
Colombia 104 5.04 68 24.11
Costa Rica 87 4.21 18 6.38
Cuba 10 0.48 1 0.35
Ecuador 111 5.38 11 3.90
El Salvador 56 2.71 13 4.61
Guatemala 27 1.31 11 3.90
Haiti 0 0.00 0 0.00
Honduras 22 1.07 2 0.71
Mexico 158 7.65 25 8.87
Nicaragua 46 2.23 0 0.00
Panama 31 1.50 5 1.77
Paraguay 4 0.19 4 1.42
Peru 461 22.32 59 20.92
Dominican Republic 22 1.07 1 0.35
Uruguay 17 0.82 4 1.42
Venezuela, Bolivarian Republic 11 0.53 0 0.00
TOTAL 2,065 100 282 100 Source: Calculated by the authors using data from WTO.
According to paragraphs 5 and 6 of Appendix B of the SPS Agreement, it requires from the member countries the indication of the products covered by the SPS measures and the relevant codes in the Harmonized System (HS) of classification of goods. Figure 2 shows the distribution of the products according to the codes HS-23. Attention is called to the fact that 31 – Live animals; 2 – Meat and edible offal; 3 – Fish and crustaceans, mollusks and other aquatic invertebrates; 4 – Milk and dairy products, bird eggs, natural honey, edible products of animal origin not specified in other chapters; 5 – Other products of animal origin not specified or included in other chapters; 06 – Live plants and floricultural products; 7 – Vegetables, edible roots and tubers; 8 – Fruit and nuts, peel of citrus fruit or melons; 9 – Coffee, tea, and spices; 10 – Cereal; 11 – Milling industry products, malt, starches, insulin, wheat gluten; 12 – Seeds and oleaginous fruits, grains, seeds and fruit, industrial or medicinal plants; straw and fodder; 13 – Gums, resins and other vegetable saps and extracts; 14 – Plaiting materials and other products of plant origin not specified or included in other chapters; 15 – Fats and vegetable or animal oils; their cleavage products; prepared edible fats; waxes of animal or vegetable origin.
411
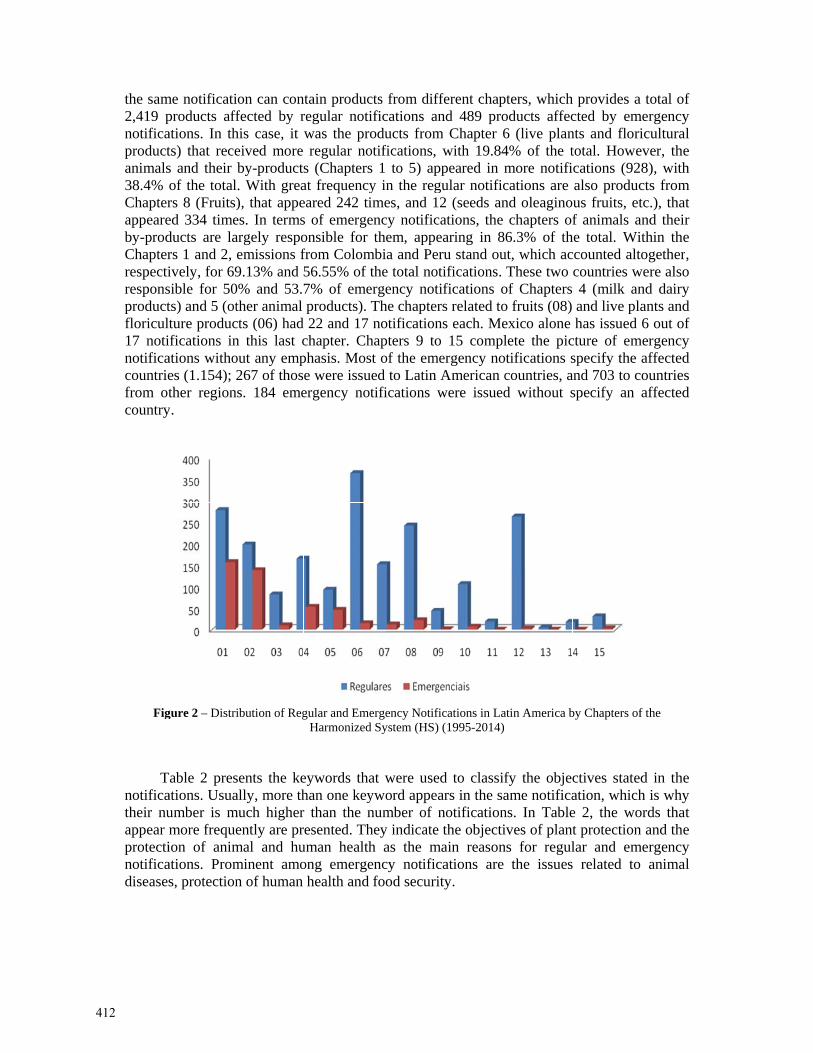
the sam2,419 pnotificaproductanimals38.4% Chapterappeareby-prodChapterrespectiresponsproductfloricult17 notinotificacountriefrom otcountry
Fig
Tnotificatheir nuappear mprotectinotificadiseases
me notificatiproducts affations. In thts) that reces and their of the totalrs 8 (Fruits)ed 334 timeducts are lars 1 and 2, ively, for 69sible for 50ts) and 5 (otture producifications inations withoes (1.154); 2ther region
y.
gure 2 – Distri
able 2 presations. Usuaumber is mmore frequeion of animations. Proms, protection
ion can conffected by rhis case, it eived more by-product
l. With grea), that appees. In termsargely respoemissions f9.13% and 5
0% and 53.7ther animal cts (06) hadn this last cout any emp267 of thos
ns. 184 eme
ibution of Reg
sents the keally, more th
much higherently are prmal and huminent amon of human
ntain producregular notiwas the proregular no
s (Chaptersat frequencyeared 242 tis of emergeonsible for from Colom56.55% of t7% of emeproducts).
d 22 and 17chapter. Chphasis. Mose were issuergency not
gular and EmeHarmonized
eywords thahan one keyr than the nresented. Thuman healthong emergehealth and
cts from dififications anoducts from
otifications, s 1 to 5) apy in the regimes, and 1ency notificthem, appe
mbia and Pethe total no
ergency notThe chapternotification
hapters 9 tost of the emed to Latin tifications w
ergency Notifd System (HS)
at were useyword appeanumber of nhey indicateh as the mency notificfood securi
fferent chapnd 489 pro
m Chapter 6with 19.84
ppeared in mgular notific2 (seeds an
cations, the earing in 8
eru stand outifications.
tifications ors related tons each. Meo 15 compl
mergency noAmerican cwere issued
fications in La) (1995-2014)
ed to classifars in the sanotification
e the objectimain reasoncations are ity.
pters, whichoducts affec6 (live plan4% of the tmore notifications are nd oleagino
chapters of6.3% of th
ut, which acThese two
of Chapters o fruits (08) exico alone lete the pictifications scountries, ad without s
atin America b
fy the objecame notificans. In Tableives of plantns for regul
the issues
h provides acted by emnts and floritotal. Howecations (92also producus fruits, etf animals a
he total. Wiccounted altcountries w4 (milk anand live plhas issued
cture of emspecify the
and 703 to cspecify an
by Chapters of
ctives stateation, whiche 2, the wot protectionlar and em related to
a total of mergency
icultural ever, the 28), with cts from tc.), that
and their ithin the together,
were also nd dairy ants and 6 out of
mergency affected
countries affected
f the
d in the h is why ords that n and the mergency o animal
412
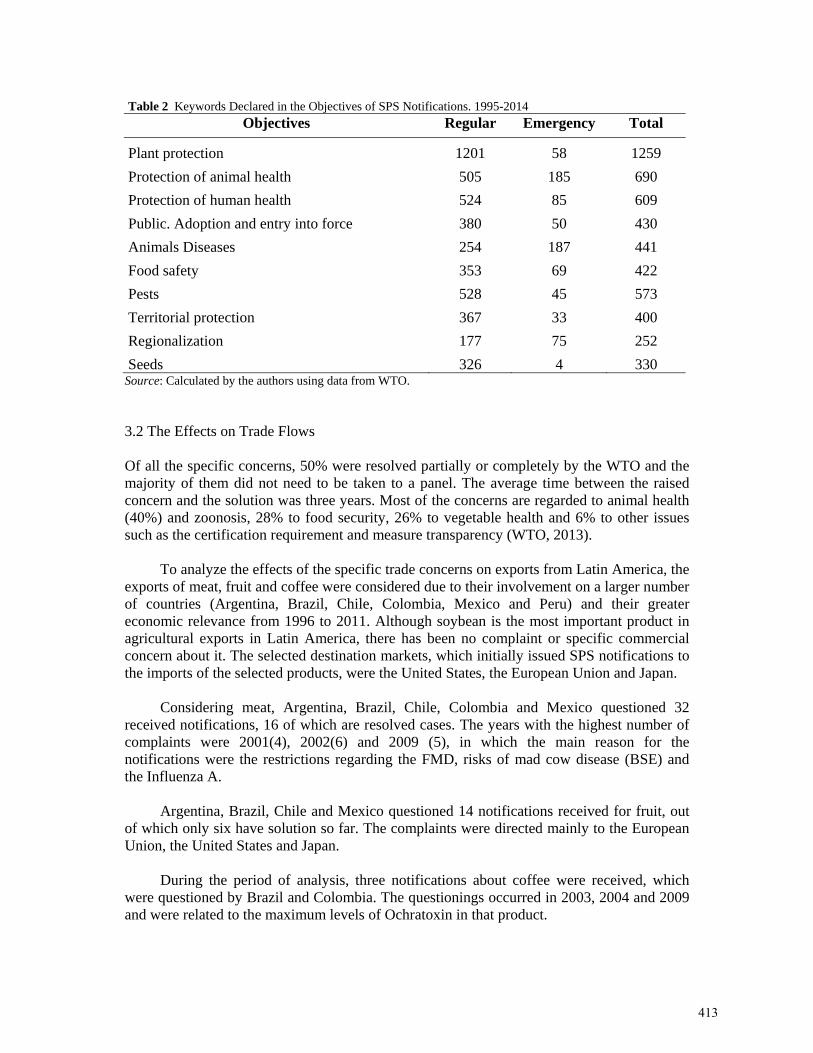
Table 2 Keywords Declared in the Objectives of SPS Notifications. 1995-2014
Objectives Regular Emergency Total
Plant protection 1201 58 1259
Protection of animal health 505 185 690
Protection of human health 524 85 609
Public. Adoption and entry into force 380 50 430
Animals Diseases 254 187 441
Food safety 353 69 422
Pests 528 45 573
Territorial protection 367 33 400
Regionalization 177 75 252
Seeds 326 4 330 Source: Calculated by the authors using data from WTO. 3.2 The Effects on Trade Flows Of all the specific concerns, 50% were resolved partially or completely by the WTO and the majority of them did not need to be taken to a panel. The average time between the raised concern and the solution was three years. Most of the concerns are regarded to animal health (40%) and zoonosis, 28% to food security, 26% to vegetable health and 6% to other issues such as the certification requirement and measure transparency (WTO, 2013).
To analyze the effects of the specific trade concerns on exports from Latin America, the
exports of meat, fruit and coffee were considered due to their involvement on a larger number of countries (Argentina, Brazil, Chile, Colombia, Mexico and Peru) and their greater economic relevance from 1996 to 2011. Although soybean is the most important product in agricultural exports in Latin America, there has been no complaint or specific commercial concern about it. The selected destination markets, which initially issued SPS notifications to the imports of the selected products, were the United States, the European Union and Japan.
Considering meat, Argentina, Brazil, Chile, Colombia and Mexico questioned 32
received notifications, 16 of which are resolved cases. The years with the highest number of complaints were 2001(4), 2002(6) and 2009 (5), in which the main reason for the notifications were the restrictions regarding the FMD, risks of mad cow disease (BSE) and the Influenza A.
Argentina, Brazil, Chile and Mexico questioned 14 notifications received for fruit, out
of which only six have solution so far. The complaints were directed mainly to the European Union, the United States and Japan.
During the period of analysis, three notifications about coffee were received, which
were questioned by Brazil and Colombia. The questionings occurred in 2003, 2004 and 2009 and were related to the maximum levels of Ochratoxin in that product.
413
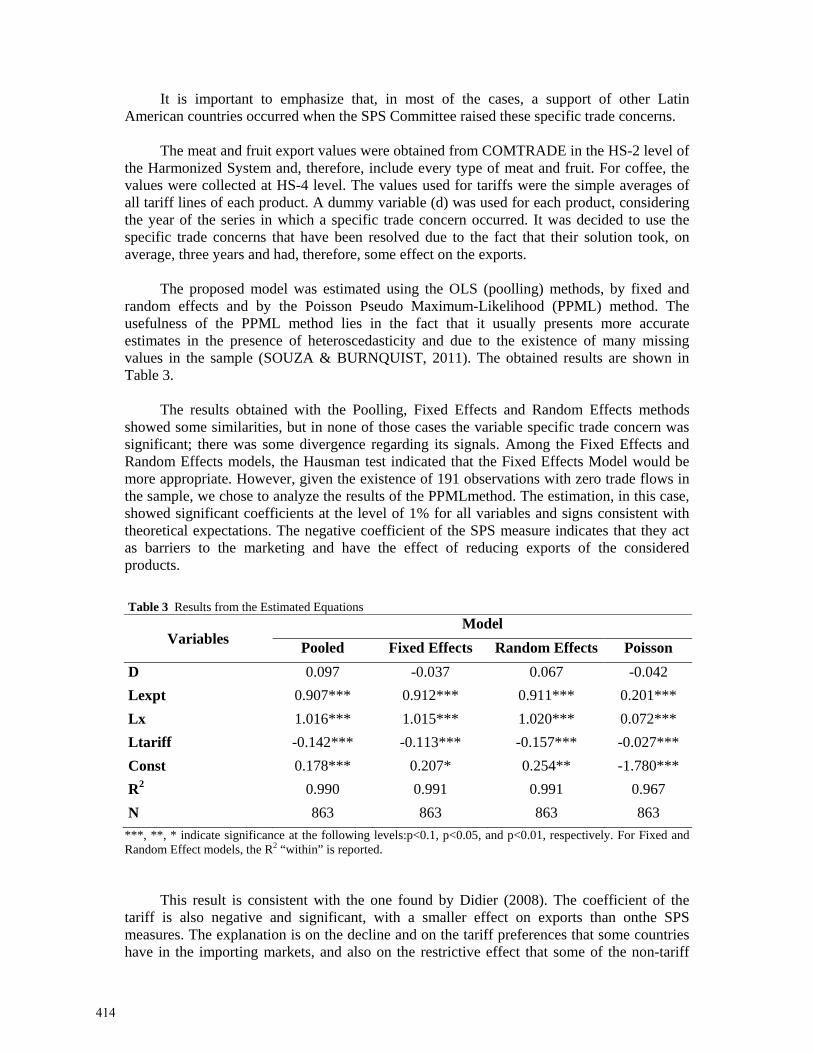
It is important to emphasize that, in most of the cases, a support of other Latin American countries occurred when the SPS Committee raised these specific trade concerns.
The meat and fruit export values were obtained from COMTRADE in the HS-2 level of
the Harmonized System and, therefore, include every type of meat and fruit. For coffee, the values were collected at HS-4 level. The values used for tariffs were the simple averages of all tariff lines of each product. A dummy variable (d) was used for each product, considering the year of the series in which a specific trade concern occurred. It was decided to use the specific trade concerns that have been resolved due to the fact that their solution took, on average, three years and had, therefore, some effect on the exports.
The proposed model was estimated using the OLS (poolling) methods, by fixed and
random effects and by the Poisson Pseudo Maximum-Likelihood (PPML) method. The usefulness of the PPML method lies in the fact that it usually presents more accurate estimates in the presence of heteroscedasticity and due to the existence of many missing values in the sample (SOUZA & BURNQUIST, 2011). The obtained results are shown in Table 3.
The results obtained with the Poolling, Fixed Effects and Random Effects methods
showed some similarities, but in none of those cases the variable specific trade concern was significant; there was some divergence regarding its signals. Among the Fixed Effects and Random Effects models, the Hausman test indicated that the Fixed Effects Model would be more appropriate. However, given the existence of 191 observations with zero trade flows in the sample, we chose to analyze the results of the PPMLmethod. The estimation, in this case, showed significant coefficients at the level of 1% for all variables and signs consistent with theoretical expectations. The negative coefficient of the SPS measure indicates that they act as barriers to the marketing and have the effect of reducing exports of the considered products.
Table 3 Results from the Estimated Equations
Variables Model
Pooled Fixed Effects Random Effects Poisson
D 0.097 -0.037 0.067 -0.042
Lexpt 0.907*** 0.912*** 0.911*** 0.201***
Lx 1.016*** 1.015*** 1.020*** 0.072***
Ltariff -0.142*** -0.113*** -0.157*** -0.027***
Const 0.178*** 0.207* 0.254** -1.780***
R2 0.990 0.991 0.991 0.967
N 863 863 863 863
***, **, * indicate significance at the following levels:p<0.1, p<0.05, and p<0.01, respectively. For Fixed and Random Effect models, the R2 “within” is reported.
This result is consistent with the one found by Didier (2008). The coefficient of the tariff is also negative and significant, with a smaller effect on exports than onthe SPS measures. The explanation is on the decline and on the tariff preferences that some countries have in the importing markets, and also on the restrictive effect that some of the non-tariff
414

measures have on the considered products. In the case of fruit, vegetables and meat, SPS barriers on the imports are too restrictive, given the high costs of retaining these products. The coffee exports, on the other hand, are less affected by the SPS measures, and they were not affected by any tariff in the analyzed markets. The coefficients of the variables that indicate the size of the exporting country (Expt) and the visibility that each country has in the importing country (lx) were positive, suggesting direct relationships to the exports.
4. CONCLUSIONS In this study, we carried out an analysis regarding the issue of SPS notifications in Latin America, characterizing them by countries and economic sectors. In the empirical analysis, we estimated the effects of specific trade concerns of the SPS measures taken to the WTO on the flows of export of meat, fruit and coffee.
The number of regular notifications issued showed an increasing trend over the period,
with a peak in 2008. In that year, there was a record increase on the prices of agricultural products, which may have stimulated the adequacy of domestic legislation to the international requirement. It is certain, however, that the decline in global economic activities encouraged the protective instinct and the increase of trade restrictions, including the SPS measures.
The same cannot be said about the SPS emergency notifications, which are the result of
the sporadic occurrence of diseases and pests, and do not show any regular pattern. The largest emitters of regular SPS notifications in Latin America were Peru, Brazil,
Chile, Mexico, Argentina and Colombia. The particularities of this situation are related to the adequacy of countries to external market conditions. In the case of Brazil, Argentina and Chile, which are major exporters of agricultural products, this adaptation seems to have occurred as a requirement to the standards of the largest import markets. In the case of Mexico, Peru and Colombia, the adequacy occurred as a condition for the accession of these countries to various regional trade agreements that have, as their members, countries with stricter sanitary requirements.
The most notified products were those with higher sanitary and phytosanitary
requirements internationally, such as meat, fruit and live plants, and they have great weight in the balance of trade of the countries that were studied. Thereafter, the analyses of specific trade concerns that the countries in Latin America have risen in the SPS Committee of WTO were mostly related to the notifications on these products.
The estimated model showed an inverse relationship of exports with SPS measures
adopted and with tariffs, which had a smaller restrictive effect than the ones on the SPS measures. Various preferential trade agreements and a continued reduction of tariffs have made non-tariff measures greater barriers to exports.
Non-tariff measures distort trade and increase costs, but their diversity makes it difficult
to measure the degree of protection. Overall, the SPS notifications in Latin American countries suggest more of an adequacy to international requirements than the imposition of trade restrictions, without dropping a concern for human, plant and animal safety. This is clear with the wide incidence between countries and economic sectors. However, it is in the
415

least developed countries, where compliance costs are relatively higher and where special attention and treatment should be given.
416
REFERENCES
ALADI. Seguridad alimentaria y comércio intraregional de alimentos en la ALADI. Joint Document. FAO-ALADI. October, 2012, 89p.
BASU, J.R.; KUWARARA, H.; DUMESNIL, F. Evolution of non-tariff measures: Emerging cases from selected developing countries. Policy Issues in International Trade and Commodities, Study Series No. 52.United Nations Conference on Trade and Development, 27p. 2012.
BUREAU, J.C.; DISDIER, A.C.; RAMOS, P. A comparison of the barriers faced by Latin American and ACP countries exports of tropical products. ICTSD, June 2007.113p.
COZENDEY, C. M. A participação do Brasil no comitê de medidas sanitárias e fitossanitárias da OMC. In: Notificações aos Acordos de Barreiras Técnicas (TBT) e Sanitárias (SPS) da OMC: Transparência Comercial ou Barreiras Não-Tarifárias? Silva, O.M. Editor.Viçosa, MG. 2010. 240p.
DISDIER, A.C.; FEKADU, B.; MURILLO, C.; WONG, S.A. Trade effects of SPS and TBT measures on tropical and diversification products. International Trade and Sustainable Development. Issue Paper No 12, May 2008.140p.
FONTAGNÉ, L.; OREFICE, G.; PIERMARTINI, R.: ROCHA, N. Product Standards and Margins of Trade: Firm Level Evidence, WTO Working Paper ERSD, No 04. 40 p. 2013.
NICITA, A.; GOURDON, J.A preliminary analysis on newly collected data on non-tariff measures. Policy Issues in International Trade and Commodities, Study Series no. 53.UNITED NATIONS CONFERENCE ON TRADE AND DEVELOPMENT, 20p. 2013.
SILVA, O.M. A Agricultura no Comércio Internacional. 2012. 20f, Apostila. Curso de Mestrado Profissional em Defesa Sanitária Vegetal. Universidade Federal de Viçosa. Viçosa, MG. 2012.
SILVA, O.M. e ALMEIDA, F.M. A incidência das notificações aos acordos sobre medidas SPS e TBT da OMC nas exportações Agrícolas do Brasil. In: Notificações aos Acordos de Barreiras Técnicas (TBT) e Sanitárias (SPS) da OMC: Transparência Comercial ou Barreiras Não-Tarifárias?.Cap. 5, pag. 77- 94. Silva, O.M. Editor. Viçosa, MG. 2010. 240p.
SOUZA, M.J.P.; BURNQUIST, H.L. Facilitação de comércio e impactos sobre o comércio bilateral. Revista Estudos Econômicos, v. 41, n. 1, 2011.
WORLD TRADE ORGANIZATION (WTO). World trade report 2012. Trade and public policies: A closer look at non-tariff measures in the 21st century, 2012. 247p.
WORLD TRADE ORGANIZATION (WTO). Committee on Sanitary and Phytosanitary Measures. Overview regarding the level of implementation of the transparency provisions of the SPS agreement. G/SPS/GEN/804/Rev.3. October 2010.14p.
WORLD TRADE ORGANIZATION (WTO).Revised Procedure to Monitor the Processs of International Harmonization. Doc. G/SPS/11.Rev.1. November 2004.
WORLD TRADE ORGANIZATION (WTO). Agreement on Sanitary and Phitosanitary Measures. Available in: <http://www.wto.org/english/docs_e/legal_e/15-sps.pdf>. Access in February 2013.
417

WORLD TRADE ORGANIZATION (WTO). Database: Available in: <http://www.wto.org/english/res e/publications e/wtr12datasete.htm>). Access in January 2014.
WORLD TRADE ORGANIZATION (WTO). Specific Trade Concerns. Doc. G/SPS/GEN/204/Rev.13. Access in February 2013. 91p.
ZARRILLI, S; MUSSELLI, I.The Sanitary and Phitosanitary Agreement, Food safety Policies, and Product Atributes. In: Agriculture and the WTO – Creating a trade System for Development. pag. 215-234. Ingco, M.D. and Nash, J.D. Editors. Washington, D.C. 2004. 387p.
418
Effect of Information and Communication Technologies on International Trade and Development
JOSEPH S. MOLLICK1
College of Business, Texas A&M University-Corpus Christi Corpus Christi, Texas, USA
Data on core indicators of access to and use of information and communication technologies (ICT) are used to classify countries of the world into three categories: low, medium and high. Comparisons are made to test the hypothesis that access to and use of ICT are related to performance of nations in the area of international trade and indicators of development used by the United Nations and the World Bank. Comparisons are made between countries in and outside the western hemisphere. Implications of developing infrastructures for access to and use of ICT on international trade and development of nations are discussed.
1 Address correspondence to Joseph S. Mollick, College of Business, Texas A&M University–Corpus Christi, Corpus Christi, Texas, USA. E-mail: [email protected]
419

Analysis of US Imports from China vs. US Imports from Mexico over the Past Decade
BALAJI JANAMANCHI, PHD1 Associate Professor of Management, A.R. Sanchez, Jr. School of Business,
Texas A&M International University, Laredo, Texas, USA Ever since US economy started to offshore jobs in large numbers in the first decade of twenty first century to overseas destinations, offshoring phenomena has attracted a lot of attention of researchers and policy makers. Consequently, some attention has been given to studies that contrasted offshoring (dealing with far off locations) with near-shoring (dealing with immediate neighboring nations) options. Quite a few researchers have contrasted the cost and benefits of offshoring vs. near-shoring by comparing the options for the US of dealing with China vs. Mexico respectively. One of the studies has developed an outsourcing model from a logistics point of view based on two main dimensions of a) product complexity and b) volume of the product to provide guidance to manufacturers in deciding between offshoring vs. near-shoring. Most of the costs and benefits considered in the offshoring vs. near-shoring decision model apply to import trade as well with some limitations and modifications. This study seeks to analyze the US imports from China and Mexico over a ten year period between the years of 2004 and 2013 to discern any possible patterns in the increases or decreases in volume of imports from either of the sources that seem to be influenced by the same type of dynamics as are applicable to the offshoring and near-shoring decisions. More particularly, the study will attempts to understand the preference of one country over the other in respect of products that appear to be available from both China and Mexico paying particular attention to see if either of them appear to cut into trade volume of the other. If so, for what underlying logic or dynamics. This an exploratory study and will be totally data driven with some qualitative analysis of attendant factors. Trade data of US imports from China and Mexico over the period 2004-2013 is obtained from International Trade Center (ITC) web portal who in turn secured the original data from United Nations (UN) Comtrade Database. Analysis of data is underway to discern any possible patterns in the increases or decreases in volume of imports from either of the sources as stated above.
1 Address correspondence to Balaji Janamanchi Ph.D., Associate Professor of Management, A.R. Sanchez, Jr. School of Business, Texas A&M International University, Laredo, Texas, USA. E-mail: [email protected]
420
Competitive and Comparative Advantage: Towards a Unified Theory of International Trade
BERNARD C. BEAUDREAU1
Department of Economics Universite Laval Quebec, Canada G1K 7P4
The field of international business/economics is largely dualistic in nature. On the one hand is the economics literature which has, for two centuries, focused on the notion of comparative advantage (technology, factor proportions) while on the other hand is the business literature which has recently developed the concept of competitive advantage. Attempts at reconciling the two have been few (Neary 2003, Dev Gupta 2009). This paper presents a reconciliation based on global value chain/supply chain analysis and the concept of vertical comparative advantage (Beaudreau 2011), comparing and contrasting these two approaches. It is shown that the theory of competitive advantage’s epistemological comparative advantage lies with its “how to” approach to developing an advantage, while the theory of comparative advantage’s epistemological comparative advantage lies with its account of “what is” and that both are complementary. However, it is also argued that the failure to recognize this complementarity as well as the shortcomings of each have prevented and continue to prevent the emergence of an integrated, empirically-consistent theory of international trade—in short, take advantage of the gains from epistemological trade. KEYWORDS Comparative Advantage, Competitive Advantage, Synthesis JEL Codes: D24, L60, O3, O4.
1Address correspondence to Bernard C. Beaudreau, Department of Economics, Universit´e Laval Quebec, Canada G1K 7P4. E-mail: [email protected]
421
Derecho Internacional y Comparado, Legislación y Tratados en Torno a la Migración Infantil
LICENCIADA GABRIELA ORTEGA CERVANTES Facultad de Comercio, Administración y Ciencias Sociales,
Universidad Autónoma de Tamaulipas
LICENCIADA SILVIA PATRICIA MUÑOZ CASTELLANOS1
Facultad de Comercio, Administración y Ciencias Sociales, Universidad Autónoma de Tamaulipas
LICENCIADO JESÚS CERDA CRUZ
Facultad de Comercio, Administración y Ciencias Sociales, Universidad Autónoma de Tamaulipas
No existe justificación de la discriminación de los migrantes, ni por motivos étnicos, nacionales o sociales, o por algún otro, debiéndose respetar los derechos humanos que las mismas normas protegen, cumpliendo con ello la Federación, los estados, el Distrito Federal y los municipios. En todas las decisiones y actuaciones del Estado se velará y cumplirá con ello, garantizando de manera plena los derechos. Esto guiará el diseño, ejecución, seguimiento y evaluación de las políticas públicas y de la población dirigida a la migración infantil. There is no justification to discriminate against migrants, not because of ethnic, national, social or other motives, whilst respecting the human rights standards that protect them, in compliance with the Federation, the states, the Federal District and the municipalities. In all decisions and actions of the State, there will be vigilance and fulfillment, fully guaranteeing these rights. This will guide the design, execution, tracking and evaluation of public policies and of the population oriented to child migration.
1 Address correspondence to Silvia Patricia Muñoz Castellanos, Facultad de Comercio, Administración y Ciencias Sociales, Universidad Autónoma de Tamaulipas. E-mail: [email protected]
422

INTRODUCCIÓN La ley federal para el reconocimiento y la protección de la migración infantil, establece en el primer párrafo de su artículo 16 que no deberá hacerse ningún tipo de discriminación en razón del origen étnico, nacional o social de las niñas, niños y adolescentes, con fundamento en los párrafos sexto y séptimo del artículo 4o. de la Constitución Política de México, incluyendo y garantizando por igual, la tutela y el respeto de los derechos humanos, debiendo cumplir con ello la Federación, los estados, el Distrito Federal y los municipios.
HALLAZGOS DE LA INVESTIGACIÓN La Convención Americana Sobre Derechos Humanos, en su artículo 19, preceptúa que todo niño tiene derecho a las medidas de protección que su condición de menor requieren, por parte de su familia, de la sociedad y del Estado.
La Convención Sobre los Derechos del Niño es el fundamento para que los Estados parte respeten los derechos enunciados en la misma Convención, y asegurarán su aplicación a cada niño sujeto a su jurisdicción, sin consideración de su origen nacional, étnico o social, asegurándoles protección y el ejercicio de sus derechos.
Otros tratados internacionales para la protección de los menores de edad -incluyendo a los que integran la migración infantil-, son la Convención Interamericana sobre restitución internacional de menores, la Convención sobre la Protección de Menores y la Cooperación en Materia de Adopción Internacional, la Convención sobre los Aspectos Civiles de la Sustracción Internacional de Menores, el Protocolo Facultativo de la Convención sobre los Derechos del Niño relativo a la Participación de Niños en los Conflictos Armados, el Protocolo Facultativo de la Convención sobre los Derechos del Niño relativo a la Venta de Niños, la Prostitución Infantil y la Utilización de los Niños en la Pornografía.
Los párrafos sexto y séptimo del artículo 4 de la Constitución Política de los Estados Unidos Mexicanos establecen que en todas las decisiones y actuaciones del Estado se velará y cumplirá con el principio del interés superior de la niñez, garantizando sus derechos. Este principio deberá guiar el diseño, ejecución, seguimiento y evaluación de las políticas públicas dirigidas a la niñez.
La Ley Para el Desarrollo Familiar del Estado de Tamaulipas, entre sus artículos relativos está el numeral 12: los principios que fundamentan la protección del menor, los derechos establecidos a su favor, desde la concepción hasta los dieciocho años de edad, y que gozarán de los derechos enunciados en este régimen, sin distinción de origen étnico o nacional (menores migrantes); su artículo 13 prescribe que es menor de edad toda persona desde la concepción hasta los dieciocho años cumplidos, y su artículo 14 establece que la protección del menor deberá ser integral en todos los períodos evolutivos de su vida, inclusive la etapa prenatal que comienza desde el momento de la concepción. Las disposiciones aquí expresadas incluyen a la totalidad de las personas que componen la migración infantil, en todas sus formas.
423
La ley federal prescribe que la protección a las niñas y niños es hasta 12 años incompletos, a los adolescentes entre los 12 años y los 18 años incumplidos, para asegurarles un desarrollo pleno e integral, para su formación física, mental, emocional, social y moral en condiciones de igualdad; son principios rectores a favor de los menores de edad:
El del interés superior de los niños, incluyendo a la migración infantil, el de la no-discriminación, el de igualdad, el de vivir en familia, una vida libre de violencia, el de corresponsabilidad de los miembros de la familia, Estado y sociedad, el de la tutela plena e igualitaria de los derechos humanos y de las garantías constitucionales.
ANÁLISIS DE DATOS Actualmente, cerca de 215 millones de niños trabajan en el mundo (Organización Internacional del Trabajo, OIT).1 En México hay 28.9 millones de niñas y niños entre cinco y 17 años de edad, y de ellos, laboran poco más de tres millones; de éstos, 882 mil tienen menos de 14 años. Se ocupan en los sectores agropecuario 29.5%, en el comercio 25.4% y en los servicios 26.7%.2
La Secretaría de Desarrollo Social, considera que en el país hay más de dos millones de personas que laboran como jornaleros agrícolas, de ellas, 762 mil son migrantes y de este universo 60.9% es población menor de 18 años. Hay 32 millones de jóvenes de 14 a 29 años que se están incorporando al mercado laboral.
METODOLOGÍA PARA EL DESARROLLO DE LOS MENORES DE EDAD Las estrategias y acciones del Plan Nacional de Desarrollo de 20 de mayo de 2013, previniendo y erradicando el trabajo infantil y protegiendo a menores trabajadores en edad permitida, instrumentando acciones de sensibilización y concientización a la población sobre la problemática del trabajo infantil, coordinando y promoviendo estrategias para prevenirlo y erradicarlo, promoviendo el trabajo decente y el respeto a los derechos humanos y laborales de los menores trabajadores en edad permitida, concertando con los sectores público, privado y social la adopción de políticas de protección, en sectores de mayor trabajo infantil.
No al trabajo infantil, incluyendo a los menores migrantes en esta y en las siguientes aseveraciones: no al trabajo forzado, compensación justa aún por encima de la ley, horario laboral conforme a la ley –justo-, no al acoso y a la violencia laboral, compromiso con la seguridad de empleados y colaboradores, cumplimiento legal con todas las leyes internacionales, nacionales, estatales y locales aplicables con respecto a los derechos humanos y a los de los trabajadores.
De acuerdo al interés superior de la infancia, las normas aplicables a los niños migrantes,
habrán de procurar para ellos un crecimiento y un desarrollo plenos en ambiente de bienestar familiar y social.
424
Por este principio, el ejercicio de los derechos de los adultos no podrá, en ningún momento, ni en ninguna circunstancia, condicionar el ejercicio de las personas menores de edad, incluyendo a los niños migrantes. Ningún abuso, ni violación de los derechos de niñas, niños y adolescentes -y la migración infantil incluida-, podrá considerarse válido ni justificarse por la exigencia del cumplimiento de deberes.
La aplicación de la ley atenderá al respeto de este principio, así como al de las garantías y los derechos fundamentales reconocidos en la Constitución Política de los Estados Unidos Mexicanos, para la protección de los derechos de las niñas, niños y adolescentes, y los menores migrantes inclusive.
Así se garantiza que el amargo proceso de repatriación y retorno por el que atraviesan los niños migrantes sea lo menos doloroso posible y que se respeten sus derechos en todo momento.
La Federación, los estados, el Distrito Federal y los municipios, impulsarán la cultura
protectora de los derechos de la infancia –sin exclusión de la infancia migrante-que con fundamento en el artículo 2 de la Convención Sobre los Derechos del Niño –en vigor desde el 2 de septiembre de 1990-, se establece que los Estados parte respetarán los derechos enunciados en la presente Convención y asegurarán su aplicación a cada niño sujeto a su jurisdicción, sin distinción alguna, independientemente de la raza, el color, el sexo, el idioma, la religión, la opinión política o de otra índole, el origen nacional, étnico o social, y basándose en los tratados internacionales, asegurarán a niñas, niños y adolescentes –y los menores migrantes-, la protección y el ejercicio de sus derechos. De igual manera, y atendiendo a lo anterior, es deber y obligación de la comunidad a la que pertenecen y, en general de todos los integrantes de la sociedad, el respeto y el auxilio en el ejercicio de tales derechos.
La Federación promoverá la adopción de un Programa Nacional Para la Atención de los
Derechos de la Infancia y Adolescencia migrante.
Se ha constituido en las fronteras norte y sur de México, un cuerpo de oficiales del Instituto Nacional de Migración especializado en la protección de los derechos de niñas, niños y adolescentes migrantes y repatriados no acompañados, extranjeros y mexicanos: los Oficiales de Protección a la Infancia (OPIs), los que deberán principalmente -desde el momento de la recepción en México-, detectar y atender de manera especial las necesidades más urgentes de los niños migrantes, manejar las herramientas necesarias para la intervención en situaciones de crisis, de solicitud de refugio y casos de trata, así como informarles a los niños, niñas y adolescentes, cuáles son sus derechos y responder a todas sus dudas sobre su procedimiento migratorio; deben canalizar a los niños y jóvenes a los albergues de la institución del Desarrollo Integral de la Familia (DIF), garantizando su protección en todo momento.
Desde 2001 hasta el año 2006 el Desarrollo Integral de la Familia Nacional, los DIFs
locales, el Instituto Nacional de Migración y organismos no Gubernamentales han establecido 23 albergues en la frontera norte que forman parte del Programa Interinstitucional de Atención a Menores Fronterizos, para garantizar los derechos de los niños migrantes no acompañados. En la frontera sur está en funcionamiento un albergue en Tapachula, Chiapas.
425

PLANTEAMIENTO DEL PROBLEMA
México es un país de origen, tránsito y destino de migrantes. Cada año, alrededor de 40 mil niños y niñas que emigran son repatriados desde Estados Unidos a México; de éstos, 18,000 niños migrantes viajan solos. En 2007, cinco mil setecientos setenta y uno niños centroamericanos fueron repatriados desde México a sus países de origen.
Desde el mes de octubre de 2013 hasta el presente mes de agosto de 2014, aproximadamente sesenta mil niños migrantes –la gran mayoría originaria del triángulo del norte de América Central (Guatemala, El Salvador y Honduras)-, ha ingresado sin documentación alguna al territorio de los Estados Unidos de América, teniendo a México como país de tránsito, y siendo que todos los niños migrantes son muy vulnerables a la explotación, a la trata y a ser víctimas de la delincuencia, por lo que proteger sus derechos es una prioridad en la República mexicana.
Estos niños, niñas y adolescentes han decidido emigrar para reunirse con sus familiares,
para mejorar su nivel de vida a través del desempeño de un trabajo, y para escapar de la violencia familiar y de su propio país, o de la explotación sexual.
Como los controles migratorios en la frontera norte se han recrudecido, para evadirlos,
los flujos migratorios a zonas más inseguras y la contratación de traficantes de personas hacen peligrar la vida de las niñas, niños y adolescentes migrantes. Al haber decidido cruzar la frontera sin compañía, los migrantes niños sufren graves violaciones a su integridad física y a sus derechos humanos. Sufren accidentes (asfixia, deshidratación, heridas, muerte por ahogamiento en ríos y arroyos); son enganchados por el crimen organizado, sometidos a explotación sexual o laboral, y a maltrato en el momento de la repatriación.
El ciclo migratorio y el procedimiento administrativo por el que atraviesan las niñas,
niños y adolescentes migrantes no acompañados es el siguiente: salen del lugar de origen, llegan a la frontera, la cruzan, son detenidos por la autoridad migratoria del lugar de destino, llevados a una estación migratoria, el Consulado del país de origen coordina la repatriación, es trasladado al puerto de entrada de su país, se queda en un albergue de tránsito (en caso de que exista), se localiza a los padres o familiares, y es trasladado de regreso a su país de origen.
Es por ello que el constituir cuerpos jurídicos, es para la protección de los derechos
humanos de las niñas, niños y los adolescentes migrantes que se encuentran en procesos migratorios, y la facultad que tienen quienes ejercen la patria potestad o la custodia de menores migrantes (y de todos los que intervienen en los procesos), no podrá atentar contra la integridad física o mental de los menores, ni actuar en menoscabo de su desarrollo.
Se ha activado un organismo estatal en Tapachula Chiapas, para proteger a las niñas, niños y adolescentes migrantes en la frontera sur, y se atiende el acuerdo suscrito entre los gobiernos de México y Guatemala, sobre la Repatriación Segura de Niños y Niñas entre los dos países, pues Guatemala es un país de tránsito para niños y niñas mexicanos repatriados desde El Salvador y Honduras.
426
En Honduras se realizó un acuerdo en abril de 2008, acerca de la instalación de una estación migratoria para la protección de la niñez hondureña migrante repatriada.
Honduras mejorará la recepción de niñas, niños y adolescentes migrantes, que llegan a
diario de los Estados Unidos. Por insistencia de Honduras, los Estados Unidos ya no envían a los niños conjuntamente con los adultos en los llamados "vuelos especiales", en los que todos viajaban esposados.
En Costa Rica, se ha establecido contacto para realizar y administrar visitas a la zona
fronteriza, preparándose actualmente una campaña contra la trata de personas. En la República de Nicaragua se está trabajando binacionalmente sobre la migración
infantil. La Federación, estados, Distrito Federal, y municipios, impulsan los servicios de
guardería, auxiliando y apoyando además a los ascendientes o tutores responsables que trabajan.
TESIS DE LA PRESENTE INVESTIGACIÓN Los movimientos migratorios infantiles aumentan considerablemente la vulnerabilidad de niñas, niños y adolescentes migrantes a la trata de personas y al tráfico de menores de edad, a caer víctimas en la prostitución y otras formas diversas de explotación sexual. Los menores de edad son usados como mano de obra barata, como sirvientes en trabajos domésticos o como mercancía vendidos en adopción ilegal. Las personas migrantes, menores de edad traficados, son victimizados al ser repatriados a sus países de origen en circunstancias de absoluta inseguridad jurídica, debido a la violencia organizada que contra ellos se ejerce en sus propias naciones.
Toda persona debe informar inmediatamente a las autoridades competentes, en el caso de que tenga conocimiento acerca de personas menores de edad migrantes que estén sufriendo la violación de sus derechos humanos, en cualquiera de sus formas.
En las escuelas o instituciones similares de educación, los dueños, directivos, educadores,
maestros o personal administrativo, y toda persona relacionada, serán responsables y culpables de cualquier maltrato, perjuicio, daño, agresión, abuso o explotación, en contra de menores de edad migrantes.
Las remesas contribuyen financieramente al desarrollo y para el pago de la instrucción de
las personas menores de edad, descendientes de migrantes y futuros migrantes, aún en la edad infantil, pero la ausencia de padres y madres que emigran, aumenta la probabilidad de que los mismos hijos no reciban la educación, el cuidado y la protección adecuados.
Niñas, niños y adolescentes migrantes, toda persona menor de edad migrante, tiene
derecho de prioridad en todo lo que les corresponde, y a que se les brinde protección y socorro en cualquier circunstancia y con la oportunidad necesaria, se les atienda antes que a los adultos en todos los servicios, con prioridad de condiciones, se diseñen y ejecuten las políticas públicas
427
necesarias para la protección de sus derechos, y se asignen mayores recursos a las instituciones encargadas de protegerlos. Ninguna razón o excusa puede ser superior al interés del menor de edad, que en todos los casos rebasa a cualquier motivo expuesto por persona moral o física, de Derecho público o de Derecho privado.
Niñas, niños –y en el vientre materno-, y adolescentes, migrantes o no migrantes, tienen
derecho a la vida, por lo que se les deberá garantizar en la máxima medida su supervivencia y su desarrollo.
Las medidas especiales tomadas en favor de niñas, niños y adolescentes migrantes, de
toda persona menor de edad migrante, privados de sus derechos, no deberán implicar ni entenderse como discriminación para las demás niñas, niños y adolescentes.
Deben reducirse las graves disparidades económicas y sociales en el mundo -pues el
derecho de hacer emigrar no existe-, y que obligan a las personas, incluyendo a los menores de edad, a emigrar en busca de mejores oportunidades; deben ofrecerse a cada persona las condiciones adecuadas para su pleno desarrollo en su propia nación de origen.
Las madres migrantes tienen derecho, mientras están embarazadas o lactando, a recibir la
atención médica y nutricional necesaria, de conformidad con el derecho a la salud integral de las mujeres y de sus hijos, en este caso también de sus hijos menores migrantes.
Las normas protegerán a niñas, niños y adolescentes migrantes, a toda persona menor de
edad migrante, de cualquier injerencia arbitraria o contraria a sus garantías constitucionales, a los derechos humanos, o a los derechos reconocidos en la ley y en los tratados internacionales.
Las normas establecerán las bases para asegurar a niñas, niños y adolescentes migrantes,
a todos los menores de edad migrantes, a que no sean sometidos a torturas ni a otros tratos o penas crueles, inhumanas o degradantes; que no sean privados de su libertad de manera ilegal o arbitraria, y de que en todos los casos exista siempre en su favor, en caso de detención, el debido proceso.
La detención o privación de la libertad del adolescente se llevará a cabo de conformidad
con la ley y respetando las garantías de audiencia, defensa y procesales que reconoce la Constitución, la legislación de la materia y los tratados internacionales; la privación de la libertad se aplicará cuando se haya comprobado que se infringió gravemente la ley penal, como último recurso, durante el período más breve, atendiendo al principio del interés superior de la infancia. Emigrar no es delito, sino que los que cometen el delito son los que obligan o fuerzan a emigrar.
Los adolescentes o menores de edad migrantes que infrinjan la ley penal, su tratamiento o
internamiento será distinto al de los adultos; deberán promoverse códigos o leyes en los que se establecerán procedimientos e instituciones y autoridades especializadas para el tratamiento de quienes se alegue han infringido las leyes penales; establecer Ministerios Públicos y Jueces Especializados, considerando la importancia de promover la reintegración o adaptación social del adolescente y/o menor de edad migrante; promover el establecimiento de Defensores de Oficio Especializados; cuando se presuma que se han infringido las leyes penales, se ha de respetar el
428

derecho a la presencia de las autoridades consulares de su país, los ascendientes, tutores, custodios o de quienes estén responsabilizados del cuidado de los menores.
Que a quienes se prive legalmente de su libertad, sean tratados respetando sus derechos
humanos y la dignidad inherente a toda persona; que tengan derecho a mantener contacto permanente y constante con las autoridades consulares de su país y de su familia, salvo en los casos que lo impida el interés superior de la infancia. No procederá la privación de la libertad en ningún caso cuando se trate de niñas, niños, y adolescentes, y de toda persona menor de edad migrante, que se encuentre en circunstancias extraordinarias, de abandono o de calle.
Los procedimientos a los que se someta a una o un adolescente migrante que
presuntamente haya infringido la ley penal, deberán respetar todas las garantías procesales dispuestas en la Constitución, particularmente: presunción de inocencia, celeridad de defensa; un defensor, que no se le obligue a declarar contra sí mismo, ni contra sus familiares; que no será obligado al careo judicial o ministerial; que esté presente en todas las diligencias judiciales que se realicen; que sea oído, aporte pruebas e interponga recursos; la garantía de contradicción y la de oralidad en el procedimiento, para que se escuche directamente al adolescente migrante implicado en el proceso.
Las instituciones públicas y privadas tendrán las facultades siguientes, de conformidad
con el principio de subsidiaridad establecido en nuestro artículo 124 constitucional: vigilar la observancia de las garantías constitucionales que salvaguardan los derechos de niñas, niños y adolescentes migrantes, las de los tratados internacionales y las previstas en la legislación; con la correspondiente intervención de las autoridades consulares, representar legalmente los intereses de niñas, niños y adolescentes migrantes ante las autoridades judiciales o administrativas.
Igualmente, deberán conciliar en conflictos en familia al vulnerarse los derechos y
garantías de niñas, niños y adolescentes migrantes; denunciar ante el Ministerio Público lo que se presuma constituye delito, coadyuvando en la averiguación previa; promover la planificación, ejecución y fortalecimiento de acciones en favor de la atención, defensa y protección de los derechos de niñas, niños y adolescentes migrantes; asesorar en lo relativo a la protección de tales derechos ante las autoridades y a los sectores social y privado para su incorporación en los programas respectivos.
Además, deberán definir, instrumentar y ejecutar políticas y mecanismos que garanticen
la protección de los derechos de niñas, niños y adolescentes migrantes, y el poder judicial especial deberá aplicar sanciones por incumplimiento, confiriéndole expresamente esta facultad las disposiciones legales aplicables.
La Federación, los estados, el Distrito Federal y los municipios, deberán celebrar
convenios de coordinación para conjuntamente procurar, proteger y defender los derechos de niñas, niños y adolescentes migrantes.
429
CONCLUSIONES
Los párrafos sexto y séptimo del artículo 4o. de nuestra Constitución Política, garantizan la tutela y el respeto de los derechos fundamentales de las niñas, niños y adolescentes migrantes que las mismas normas protegen, debiendo cumplir con ello la Federación, los estados, el Distrito Federal y los municipios, velando el Estado por que se cumpla con el principio del interés superior de la niñez.
El primer párrafo del artículo 16 de la ley federal para el reconocimiento y protección de los derechos de niñas, niños y adolescentes migrantes, prescribe que no debe hacerse en su contra ningún tipo de discriminación por su origen étnico, nacional o social.
El artículo 19 del Pacto de San José de Costa Rica, preceptúa que todo niño tiene derecho
a las medidas de protección que su condición de menor requieren por parte de su familia, de la sociedad y del Estado.
La Convención Sobre los Derechos del Niño, y todos los diversos tratados internacionales sobre esta materia, establecen que los Estados parte respetarán los derechos enunciados en las correspondientes convenciones, asegurarán su aplicación a cada niño sujeto a su jurisdicción, independientemente del origen nacional, étnico o social, y asegurarán a niñas, niños y adolescentes migrantes la protección y el ejercicio de sus derechos.
La Ley Para el Desarrollo Familiar del Estado de Tamaulipas establece en su artículo 12 los principios que protegen al menor y sus derechos, desde la concepción hasta los dieciocho años de edad, y que gozará de los derechos enunciados en este régimen, sin distinción de origen étnico o nacional (migrante); su artículo 13 prescribe que se es menor de edad desde la concepción hasta los dieciocho años cumplidos, y su artículo 14 que la protección del menor deberá ser integral en todos los períodos evolutivos de su vida, inclusive desde la concepción.
PROPUESTAS Que todos los Oficiales de Migración y Aduanas se capaciten en la protección de los derechos de las niñas, niños y adolescentes migrantes, estableciendo procedimientos migratorios claros y transparentes para el monitoreo de los flujos migratorios, previniendo la trata, el tráfico, y combatiendo la explotación laboral.
Establecer una red de albergues de tránsito para la protección de la infancia migrante, promoviendo programas organizados de migración temporal para trabajadores adolescentes migrantes de baja calificación, y garantizar el derecho a la reunificación familiar a los hijos de padres y madres migrantes.
Un sistema eficiente de registro, estableciendo las condiciones necesarias para garantizar
a niñas y niños el registro de nacimiento universal, gratuito y oportuno en todos los países.
430
Establecer e implementar programas de respuesta rápida para el presente caso grave de desplazamiento de sesenta mil infantes migrantes de América Central, cooperando y coordinando en las políticas migratorias entre países, abordando los temas sobre migración infantil en los acuerdos y tratados comerciales.
Establecer campañas de información, educación y acuerdos internacionales para proteger
a las víctimas infantiles, promoviendo la doble nacionalidad, el fortalecimiento de los lazos académicos, y las visitas temporales para involucrar a los migrantes menores de edad en el desarrollo de sus países de origen.
431

INDICE DE CITAS
1 OIT, http://www.ilo.org/global/topics/child-labour/lang--es/index. htm#a2 2 016 INEGI-STPS, “Módulo de Trabajo Infantil”, en ENOE, 2011
BIBLOGRAFIA Rossi Andrea (2006), The Protection of Migrant Children, UNICEF. CEPAL (2006), Migración Internacional, Derechos Humanos y Desarrollo en América Latina y
el Caribe.
432

Administración de Recursos Humanos: Desde de una perspectiva emocional.
PEDRO BAUTISTA SANTIAGO1
Universidad Autónoma de Tamaulipas, División de Estudios de Posgrado, Nuevo Laredo, Tamaulipas, México
LIONEL ANTONIO OLEA ONTIVEROS
Universidad Autónoma de Tamaulipas, División de Estudios de Posgrado, Nuevo Laredo, Tamaulipas, México
MIGUEL ÁNGEL SERRATO GARCÍA
Universidad Autónoma de Tamaulipas, División de Estudios de Posgrado, Nuevo Laredo, Tamaulipas, México
HERMENEGILDO MORENO MORALES
Universidad Autónoma de Tamaulipas, División de Estudios de Posgrado, Nuevo Laredo, Tamaulipas, México
1 Address correspondence to Pedro Bautista Santiago, División de Estudios de Posgrado, Universidad Autónoma de Tamaulipas, Nuevo Laredo, Tamaulipas, México. E-mail: [email protected]
433
La administración de los Recursos Humanos ha sido esencial para el buen funcionamiento de cualquier empresa. En las últimas décadas, poco a poco se ha incrementado el estudio a fondo de este tema, debido a los constantes cambios sociales que de alguna forma repercuten en las emociones del individuo, y que indirectamente, afecta el rendimiento y productividad de la persona.
Aspectos a considerar para lograr un mejor desempeño individual.
Cambio en el Trabajo: El cambio es toda alteración en el ambiente laboral y que afecta la operación esperada de los empleados. Estas modificaciones pueden ser planeadas o no, catastróficas o evolutivas, positivas o negativas, fuertes o débiles, lentas o rápidas, y estimularse interna o externamente. Sin importar su fuente, naturaleza, origen, velocidad o fuerza, los cambios producen profundos efectos en quienes los experimentan.
Respuestas al cambio: Las Actitudes individuales. El cambio laboral opera por conducto de las actitudes de cada empleado para producir una respuesta condicionada por los sentimientos hacia el cambio. Los individuos interpretan cada cambio de acuerdo con sus actitudes. La forma en que las personas se sienten con un cambio es un factor que determina cómo responderán a él.
Resistencia al cambio. Se refiere a los comportamientos de los empleados para desacreditar, retrasar o impedir la ejecución de un cambio laboral. Los empleados se resisten al cambio porque amenaza sus necesidades de seguridad, interacción social, estatus, competencia o autoestima. Sin importar la naturaleza del cambio, algunos empleados tratan de protegerse de sus efectos por medio de acciones que varían desde quejas, pereza y resistencia pasiva hasta argumentos apasionados, ausentismo, sabotaje y disminución en el ritmo de la actividad. Los empleados se resisten al cambio por tres razones principales: las personas no están de acuerdo con la naturaleza del cambio, les disgusta el método que se utilizó y tienen una o más razones personales para oponer resistencia. Una lección para la administración es que un cambio es un éxito o un problema según la destreza con que se maneje para reducir o vencer la resistencia.
PROBLEMAS EMOCIONALES: UN ENFOQUE AL ESTRÉS LABORAL PARA LOGRAR NIVELES DE
DESEMPEÑO INDIVIDUAL. Enseñar a los administradores a apoyar más a sus subordinados directos en los problemas de su vida laboral y personal es una ruta sencilla y eficaz para mejorar la salud y la satisfacción de los empleados. Estrés en los empleados. El estrés es el término general que se aplica a las presiones que las
personas sienten en la vida. Su presencia en el trabajo es casi inevitable en muchos puestos. Cuando aumenta la presión surge una tensión negativa en las emociones, procesos de pensamiento, conducta y condición física de una persona. Cuando la tensión alcanza niveles elevados, los empleados desarrollan diversos síntomas de estrés que perjudican su desempeño laboral y salud, e incluso amenazan su habilidad para manejar el ambiente.
434

Fisiológicos:
Úlceras
Problemas digestivos
Dolores de cabeza
Hipertensión
Trastornos del sueño
Psicológicos:
Inestabilidad emocional
Irritabilidad
Nerviosismo y angustia
Preocupación crónica
Depresión
Agotamiento
Conductuales:
Tabaquismo excesivo
Alcoholismo o drogadicción
Ausentismo
Agresión
Problemas de seguridad
Problemas de desempeño
E
S
T
R
É
S
Síntomas negativos comunes de estrés sin atender:
Causas comunes del estrés relacionado con el puesto: ‐ Sobrecarga de trabajo ‐ Presiones de tiempo ‐ Mala calidad de la supervisión ‐ Ambiente laboral inseguro ‐ Falta de control personal ‐ Autoridad inadecuada en relación con las responsabilidades ‐ Conflicto y ambigüedad de roles ‐ Diferencias entre los valores de la empresa y de los empleados ‐ Cambio de cualquier tipo, en especial cuando es importante o inusual ‐ Frustración ‐ Tecnología con capacitación o apoyo inadecuados
Casi cualquier condición laboral produce estrés, pero la reacción de cada empleado es
variable. Parte de la diferencia radica en las experiencias, perspectivas generales y expectativas de cada empleado, todas las cuales son factores internos. Sin embargo, algunas condiciones laborales a menudo producen estrés en los empleados.
435
Estrés y Desempeño Laboral. De acuerdo con su nivel, el estrés es útil o perjudicial para el desempeño laboral. Cuando no hay estrés, los retos laborales están ausentes y el desempeño tiende a ser bajo. A medida que aumenta el estrés el desempeño es mayor porque ayuda a una persona a buscar recursos para satisfacer las necesidades laborales.
El estrés constructivo es un estímulo beneficioso porque impulsa a los empleados a responder sus retos.
ENFOQUES DEL MANEJO DEL ESTRES.
Tanto las organizaciones como los individuos están muy interesados en el estrés y sus efectos. Para controlar la tensión, tiene tres opciones generales:
1. Prevenirla o controlarla 2. Escapar o 3. Adaptarse a ella (manejar sus síntomas)
Las organizaciones intentan mejorar las habilidades de comunicación de la
administración, facultar a los empleados con participación, rediseñar los puestos para que sean más satisfactorios o aplicar programas de desarrollo organizacional. Estos pasos se dirigen a reducir o eliminar los tensores que asechan a los empleados.
También existen varios enfoques para enfrentar el estrés, los cuales suelen implicar actividades de colaboración entre los empleados y la administración e incluyen: Apoyo social Actividades de relajación y Programas de bienestar personal.
a) APOYO SOCIAL. Es la red de actividades, interacciones y relaciones útiles que
satisfacen necesidades importantes de los empleados. Algunas personas experimentan estrés porque están desconectadas del mundo que las rodea; carecen de relaciones interpersonales cálidas. Su falta de relaciones sociales les genera ira, ansiedad y soledad, todo lo cual les produce estrés. El sufrimiento crea estrés y requiere apoyo social: Muchos empleados pasan por épocas de sufrimiento en algún momento de su vida laboral. El sufrimiento es el grupo complejo de respuestas emocionales, físicas y sociales a una perdida muy sensible en la vida.
b) Actividades de Relajación. Algunos empleados recurren a diversos medios de relajación mental para sobrellevar el estrés. Diseñada conforme a la práctica de la meditación, la respuesta de relajación implica un pensamiento interno y concentrado para que el cuerpo descanse física y emocionalmente. Ayuda a las personas a apartarse de un mundo lleno de presiones y reduce sus síntomas de estrés.
c) Bienestar personal. Los centros de bienestar corporativo incluyen centros de detección de enfermedades, educación para la salud, y acondicionamiento físico. Médicos especialistas recomiendan prácticas para fomentar cambios en el estilo de vida, como regulación de la
436
respiración, relajación muscular, imaginación positiva, manejo de la nutrición y ejercicio, que permiten a los empleados aprovechar todo su potencial.
CONCLUSIONES.
Un 75 por ciento de los trabajadores en México experimenta estrés laboral, cifra que rebasa los casos reportados en China y Estados Unidos, de acuerdo con cifras del Instituto Mexicano del Seguro Social (IMSS), lo cual no sólo implica un impacto en la salud de los empleados, sino que representa pérdidas de 0.5 y 3.5 por ciento del Producto Interno Bruto de un país, según la Organización Internacional del Trabajo (OIT).
Georgina Tepale Palma, psicóloga y parte del Programa de Atención Estudiantil de la
Universidad Iberoamericana señala que “el cansancio, tanto mental como físico, se relaciona con un vivir acelerado. Tenemos tiempos de entrega cortos, nos llenamos de actividades, pero también nos saturamos de estímulos, los cuales han incrementado gracias al avance de la tecnología”.
437

REFERENCIAS
Newstrom, John, Comportamiento Humano en el Trabajo, (New York, USA, Ed. McGraw Hill, 2011) Capitulo XV, Págs. 384-398.
http://prodigy.msn.com/es-mx/noticias/nacional/fatiga-mental-estr%c3%a9s-laboral-enemigo-de-la-productividad/ar-BBhQa0f
438
Inversion Extranjera en México
ALEJANDRA PALENCIA MÉNDEZ Facultad de Comercio Administración y Ciencias Sociales,
Universidad Autónoma de Tamaulipas
ANA MARÍA MEDINA TIZNADO1
Facultad de Comercio Administración y Ciencias Sociales, Universidad Autónoma de Tamaulipas
La inversión extranjera se ha convertido en una de las base fundamentales de la economía mexicana y es por esto que nuestro fin con este análisis es destacar algunos de los puntos atractivos con los cuenta México que lo hacen favorable para los inversionistas extranjeros con el fin de que ellos volteen a observar las oportunidades de iniciar operaciones en nuestro país. Inicialmente su ubicación geográfica, ya que México se encuentra ubicado a lado de la primera economía mundial lo cual es un punto estratégico para las negociaciones. México también cuenta con una gran variedad de recursos naturales, tierra y climas propicios, contando con petróleo, minerales, y productos agrícolas.
1 Address correspondence to Ana María Medina Tiznado, Facultad de Comercio Administración y Ciencias Sociales, Universidad Autónoma de Tamaulipas. E-mail: [email protected]
439

Operaciones de Exportación e Importación Una Oportunidad de Crecimiento para México
DEISSY EDITH NAVA PALOMO Universidad Autónoma de Tamaulipas
ILSE GUADALUPE REYES ESPARZA
Universidad Autónoma de Tamaulipas
CARLOS ALBERTO NISHIYAMA DIAZ1
Universidad Autónoma de Tamaulipas El Comercio exterior ha sido una parte importante para el crecimiento de las economias de los paises, Mexico no ha sido la excepcion. Derivado de los Tratados de Libre Comercio, la economia se ha dinamizado de forma importante, logrando que el pais ocupe un lugar destacado dentro de las principales economias emergentes. Por lo tanto, existe la necesidad de que el país sea capaz de explorar nuevos mercados, ya que se exporta principalmente a los Estados Unidos con un 80%, sin aprovechar los acuerdos y tratados firmados con distintas economías. De esta manera el comercio en México podría abrir paso a una apertura comercial que pueda darle un mayor crecimiento económico. PALABRAS CLAVE Comercio exterior, tratados de libre comercio, Apertura comercial Foreign trade has been an important part of the economic growth of countries; Mexico is not the exception. Derived from the FTAs, the economy has dynamized significantly, allowing the country to occupy a prominent position among the major emerging economies. Therefore, there is a need for the country to be able to explore new markets, since 80% of its exports are to the United States, without taking into account agreements and treaties signed with different economies. Thus, trade in Mexico can make way for a commercial opening that can provide greater economic growth. KEYWORDS Foreign trade, Foreign trade agreement, Commercial opening
1 Address correspondence to Carlos Alberto Nishiyama Diaz, Universidad Autónoma de Tamaulipas. E-mail: [email protected]
440
Servicio de Carga Terrestre Internacional
HÉCTOR ALBERTO GARCÍA GONZÁLEZ1
División de Estudios de Posgrado, Universidad Autónoma de Tamaulipas, Nuevo Laredo, Tamaulipas, Mexico
JORGE CARLOS PACHECO MORENO
División de Estudios de Posgrado, Universidad Autónoma de Tamaulipas, Nuevo Laredo, Tamaulipas, Mexico
El objeto del presente trabajo es ofrecer un análisis de un Negocio Estratégico Comercial bajo una metodología descriptiva, como lo es el servicio de carga terrestre internacional, se revisara la relación de dicho mercado y el área de influencia en grupos de interés como lo son los clientes, inversionistas, empleados y el gobierno. Actualmente las empresas de transporte cuentan con estrategias para expandirse más allá de sus fronteras de origen, es por ello que la oferta en el mercado puede ser amplia para los clientes, los inversores tienen una porción de mercado más para generar utilidades, los empleados tienen la oportunidad de desarrollarse en un entorno laboral transnacional y las dependencias gubernamentales tienen el reto de brindar el apoyo para que el ciclo comercial sea dinámico. En base a lo anterior se tratara de brindar una perspectiva actual del mercado y las condiciones a las que se enfrentan las empresas. PALABRAS CLAVE Transporte, Internacional, Grupos de Interés The object of the following document is to provide some analysis of a strategic commercial business under a descriptive methodology. In this case, the international freight service on the terrestrial mode will review the ratio of the market and who affects the stakeholders: customers, investors, employees and the government. Currently, the transportation companies have strategies to expand far beyond their borders; therefore, it is possible to have wide market options: the investors have another portion of business to generate revenues, employees have the chance to develop on a international job environment, and the government departments have the challenge to promote support so its commercial flux can be more dynamic. Based on the previous comments, the investigation will try to give an actual view of the industry and conditions that companies have to face on a daily basis. KEYWORDS Freight service, International, stakeholders
1 Address correspondence to Hector Alberto Garcia Gonzalez, Universidad Autónoma de Tamaulipas, Nuevo Laredo, Tamaulipas, Mexico. E-mail: [email protected]
441
Importancia de las Certificaciones C-TPAT y NEEC
MÓNICA NOHEMÍ MORENO ORTIZ Universidad Autonoma de Tamaulipas,
Nuevo Laredo, Tamaulipas, Mexico
TANYA OSSMARA REYES VÁZQUEZ1
Universidad Autonoma de Tamaulipas, Nuevo Laredo, Tamaulipas, Mexico
ÁNGEL EMMANUEL RAYO MARTÍNEZ
Universidad Autonoma de Tamaulipas, Nuevo Laredo, Tamaulipas, Mexico
La certificación CTPAT por sus siglas en ingles significa asociación estratégica aduana-industria contra terrorismo, se originó a partir de los atentados del 11 de septiembre del 2001 a las torres gemelas ciudad de New York. Este tiene el propósito y alcance de definir los lineamientos necesarios para reforzar la seguridad en la cadena de valor empresarial y la seguridad de la frontera de los Estados Unidos de América. En cuanto a la certificación de NEEC es un programa que busca fortalecer la seguridad de la cadena logística del comercio exterior, a través de establecer los estándares mínimos en materia de seguridad y que otorga beneficios a las empresas participantes mexicanas.
1 Address correspondence to Tanya Ossmara Reyes Vázquez, Universidad Autónoma de Tamaulipas, Nuevo Laredo, Tamaulipas, Mexico. E-mail: [email protected]
442
An Integrated-Dynamic Mode of Entry Model: An Extended Approach
BOLORTUYA ENKHTAIVAN1
Texas A&M International University, Laredo, Texas, USA
ZAGDBAZAR DAVAADORJ Texas A&M International University, Laredo, Texas, USA
This paper proposes a model with integrated features of different mode of entry theories with an extension of dynamic interactions between the host government and foreign firms. The integrated-dynamic model introduces eight propositions and enriches the literature by several different facets. First, it explicitly proposes optimal decision choices of the host country complementing one-sided decision making process in the previous literatures. Second, the new model adopts Economic Freedom Index from the Heritage Foundation that has an advantage of utilizing a single measurement for a country as well as potentially to be separated into different dimensions depending on the needs of prioritization by the foreign entrants’ strategic decisions. Moreover, direct use of the index is a desirable aspect of the model to be tested empirically and provides practical implications for global strategic decision makers. The model captures dynamic features of two-sided decision making processes where past performances of both the host government and foreign investors are taken into consideration. This feature fits well in long-term commitment practices of MNEs.
1 Address correspondence to Bolortuya Enkhtaivan, Texas A&M International University, Laredo, Texas, USA. E-mail: [email protected]
443
How Perceived China’s Market Oriented Economic Reform by Chinese Employees May Affect their Turnover Intention:
The Role of Quality of Human Resource Practices
WEI NING1
PhD Student, Texas A&M International University, Laredo, Texas, USA
In the past decades, economic reform has changed China and made it become the largest international trader in the world. It is interesting and important to understand the impact of economic reform on its key implementers. This research investigates the process of how perceived China’s market-oriented economic reform affects Chinese employee’s turnover intention. The management literature has consistently overlooked the influences of macro-level factors on employee’s turnover intention even though many scholars have stressed the importance of these factors in organizational life. In this study I hypothesize that perceived customer orientation may reduce employee’s job turnover intention. In addition, the employees with positive perception toward the economic reform may experience low turnover intention. I further suggest that the perceived quality of human resource practices strengthen the links of perceived customer orientation-turnover intention and perceived economic reform attitude-turnover intention.
1 Address correspondence to Wei Ning, PhD Student, Texas A&M International University, Laredo, Texas, USA. E-mail: [email protected]
444

Corporate Social Responsibility, Gender Diversity on the Board of Directors and Earnings Quality:
Does Gender Diversity really matter?
JAMES COX1,
Doctoral Student, Texas A&M International University, Laredo, Texas, USA
It has been argued that the presence of women on the board or firms leads to higher earnings quality, and that higher earnings quality leads to other desirable outcomes. In other words: firms with gender-diverse boards tend to have better earnings quality (EQ). While I do not argue this point, I hypothesize that the story is more complex: Firms that are more socially responsible (CSR) are more likely to have women on the board, and it is in this environment that the impact of a gender-diverse board is more strongly felt on EQ. My hypotheses are fully supported by my regression results: In my EQ regression model, the statistical significance of the Gender Diversity (GD) coefficient is subsumed by a statistically significant CSR coefficient, while the coefficient of the interaction term CSR*GD is also statistically significant.
1 Address correspondence to James Cox, Doctoral Student, Texas A&M International University, Laredo, Texas, USA. E-mail: [email protected]
445
The Influence of Marketing Corporate Social Responsibility via Social Media on Stakeholders’ Perceptions
ANDRÉE MARIE LÓPEZ-FERNÁNDEZ1
Doctoral Research Scholar, EGADE Business School, Tecnológico de Monterrey, México City, México
RAJAGOPAL, PHD
Professor and National Researcher, EGADE Business School, Tecnológico de Monterrey, México City, México
Corporate social responsibility (CSR) is a significant part of business dynamics, and stakeholders consider it to be an important trait. Stakeholders not only prefer to purchase products and/or services from socially responsible firms but also expect firms to promptly communicate their efforts. However, how are stakeholders’ decision making influenced by marketing CSR via social networking sites such as Facebook and Twitter? The general objective of the study is to determine stakeholders’ perceptions of CSR as well as its marketing via social media. This study contributes to the understanding of the advantages and disadvantages of marketing CSR via social media. KEYWORDS Corporate social responsibility; social networking sites; stakeholders; marketing; Mexico.
1 Address correspondence to Andree Marie Lopez-Fernandez, Doctoral Research Scholar, EGADE Business School, Tecnologico de Monterrey, Mexico City, Mexico. E-mail: [email protected]
446
INTRODUCTION
Corporate social responsibility (CSR) enables firms to address the social issues that permeate society. Corporate social responsibility implies recognizing the significance of economic performance, stakeholders’ needs and wants, and the balance of the latter with social responsibility factors (Mozes, Josman, and Yaniv, 2011). The European Foundation for the Improvement of Living and Working Conditions (2003), in the report Towards a sustainable corporate social responsibility, posited that firms are considered to be socially responsible when they engage in such actions voluntarily, beyond the requirements of regulatory measures; furthermore, social responsibility allows firms and society’s interests to be well aligned and a strong relationship is maintained with its stakeholders. Therefore, CSR is an elemental strategy because of its overall impact on both business and society (Ogola and Dreer, 2012).
Internet has revolutionized commerce as e-commerce, e-business, and company websites, amongst others, have resulted in substantial advancements (López Fernández, 2012) for business dynamics. Internet and, with it, social media allow firms to connect with mass audiences and the latter to interact by means of a common interest (Lee and Lee, 2010). Social media, specifically social networking sites have rapidly taken over as the number one preferred source of information, be it accurate or fabricated. That is, both current and potential stakeholders tend to be more inclined to obtain information via social media than traditional means of mass media. As such, social networking sites have gradually become an important platform for firms to communicate their efforts.
Marketing through social media is both considered to be a strong and effective strategy
and merely a trend or buzzword. Successfully marketing corporate social responsibility via social networking sites requires firms to adequately align their core objectives and strategies with those of stakeholders’ communication needs and wants. Then again, too frequently, firms disassociate their core strategies from their corporate social responsibility strategies, which include transparent communication, decreasing the impact of their socially responsible actions and overall influence on stakeholders’ perceptions, preferences, and decision making. Thus, marketing CSR requires the firm to integrate the latter’s strategies with those of the brand.
The study’s objectives are to (i) understand stakeholders’ perspectives of the use of social
media to obtain information on corporate social responsibility; (ii) determine whether the use of social media is a fruitful platform for firms to communicate their social responsibility; and (iii) determine the advantages and/or disadvantages of marketing CSR via social media. In order to evaluate said objectives, four hypotheses have been considered and evaluated with stakeholders in the Metropolitan Area of the Valley of Mexico (Greater Mexico City). The paper is sectioned as follows. Section two reviews previous literature on the subject matter, section three includes the study design, section four encompasses findings and discussion, and section five includes concluding remarks, the study’s limitations and directions for future research.
447

LITERATURE REVIEW
Corporate social responsibility (CSR) is seen as a firm’s constant commitment to behave in an ethical manner whilst providing substantial contribution to the firm’s economic development as well as society’s quality of life (Holme and Watts, 2000). It implies achieving competitive advantage by aligning societies’ interests with organizational performance by engaging in activities indirectly associated with firms’ core business operations (López-Fernández and Rajagopal, 2013). Therefore, corporate social responsibility is an important strategy that brings forth significant benefits for both business and society.
Firms’ engagement in corporate social responsibility is well associated with its reputation and is also a strong determinant in stakeholders’ behavior (Maden, Arıkan, Telci, and Kantur, 2012), as well as their perceptions of satisfaction. Stakeholders have increasingly demonstrated a preference for firms that engage in socially responsible practices, rather than those that are either not socially responsible or engage in questionable practices. Firms may enhance their image through the engagement of CSR and its transparent communication via social networking sites, and as the firm’s reputation is enhanced, a positive effect is witnessed on consumer satisfaction (Saeidi, Sofian, Saeidia, Saeidia, and Saaeidic, 2014). A positive effect on satisfaction directly influences stakeholders’ preference; thus,
H1: The more dynamic the firm in corporate social responsibility, the greater the stakeholder preference to purchase products and/or services from the firm.
Corporate social responsibility is a determinant for competitive posture as firms are not only involved in CSR practices but also promptly communicate their efforts and overall outcomes with their stakeholders. Thus, a significant element of corporate social responsibility is its transparent communication which provides stakeholders with accurate information regarding the firm’s engagement. Reporting on corporate social responsibility enables firms to set forth their initiatives, policies, practices and social outcomes and stakeholders to track the firm’s progress in the achievement of objectives. Moreover, firms with higher social transparency in implementing corporate social responsibility projects are able to achieve high social performance and social value.
Communicating CSR related actions prompts a satisfactory relationship with stakeholders
as they are more likely to respond to socially responsible firms when they are previously informed of their efforts and practices (Dolnicar and Pomering, 2007). Corporate social reporting enables firms to ensure that stakeholders are satisfied with their public behaviors through the practice of self-presentation (Snider, Hill, and Martin, 2003). Furthermore, such satisfaction is also a determinant for a firm’s success (Post et al; 2002). Thus, stakeholders’ perceptions of a firm may be positively influenced by reporting, disclosing CSR related information.
Firms may communicate their CSR efforts via annual descriptive reports, official
websites (Patten, 1991; UNCTAD, 2008), social media, mass media, posters, brochures, and via word-of-mouth (European Commission, 2013), among others. Thus, there are several platforms on which CSR agendas may be placed and recognized by an unrestricted number of current and potential stakeholders. Transparency of CSR is considered to be essential for stakeholders’
448
perceptions of a firm’s image and the firm’s overall performance (Maguire, 2011). The disclosure is achieved as a function by the society, of society, and for society (López-Fernández and Rajagopal, 2014). Firms plan social agendas to implement CSR projects taking society, its needs and values, into consideration. The way that firms communicate their CSR efforts reflects their overall commitment with society (Fernandez-Feijoo, Romero, and Ruiz, 2014). That is, transparent communication effectively leads to stakeholders’ acknowledgement of the firm’s accountability (UNCTAD, 2008).
Internet allows anyone with a connection to access information that has been privately
produced (Lüders, 2008). Thus, such access allows users to obtain information at any time in any given place (Snider, Hill, and Martin, 2003). Social media consists of social blogs, virtual gaming, and networking sites, among others (Kaplan and Haenlein, 2010). Social networks have the potential to connect people through a common interest and/or to reconnect people (Mejias, 2010) around the world. There are several social networking sites such as Facebook Twitter, LinkedIn, Instagram, Google+, YouTube, among many others, that may be utilized by firms to promote their practices.
Firms may position themselves on social networks and accelerate their business strategies
(López Fernández, 2012), including the promotion of their corporate social responsibility efforts to current and potential stakeholders. The two most common and utilized social networks are Facebook, with more than eight hundred million active users (Facebook, 2012), and Twitter, with more than one hundred million monthly active users worldwide (Twitter, 2012). Both services provide apps that enable users to access the platforms on their various mobile devices allowing firms to interact with millions in real time. Correspondingly, firms should be well aware that, especially today, media plays a very important role in stakeholders’ (current and potential) decision making.
The more dynamic the firm in corporate social responsibility, the more likely it is to
transparently disclose its actions via social networking sites (Reilly and Hynan, 2014), and stakeholders’ interests for obtaining CSR related information via social networking sites have significantly increased (Wang and Chaudhri, 2009). Therefore, firms can benefit from the use of social networking sites to communicate their socially responsible endeavors as they may maintain a simultaneous, real-time, connection with stakeholders. Hence,
H2: The greater the firm-to-stakeholder communication of corporate social responsibility via social networking sites, the greater the stakeholder responsiveness derived from trust and credibility towards the firm.
There are four main aspects that pose advantages as well as disadvantages to social networking sites, including number of users, dialogue tone and contents, trust and credibility. The foremost benefit of platforms, such as Facebook and Twitter, is the number of users, which are current and potential stakeholders. Since the number of users surpasses traditional expectations, the dialogue, word-of-mouth occurring on social networking sites is boundless (Stauss, 1997). Trust towards an organization depends on the latter’s behavior and the degree with which expectations of such behavior are met (Gefen, 2000). Credibility often depends on the preexisting prescribed trust. Thus, a certain degree of credibility is ascribed to those firms
449
that demonstrate that they are trustworthy; the latter is visible via the word-of-mouth accounted for on social networking sites. The information presented and the tone utilized regarding corporate social responsibility tends to be on the negative side (Tench, Bowd, and Jones, 2007) as users promptly articulate irresponsible actions and practices that firms have engaged in. Therefore, matters of trust should be carefully considered as a firm’s reputation could potentially be negatively impacted.
Word-of-mouth, therefore, has the potential to impact stakeholders’ perspectives
regarding a product and/or service, its brand and, for that matter, the firm. For instance, when stakeholders become aware that a firm is engaging in less than ethical or questionable practices, they tend to respond with sanctions. Depending on the severity and/or the perception of the severity of the action, stakeholders might badmouth the firm, boycott it, or even actively seek to revoke its right to operate (Godfrey et al; 2009); such sanctions can potentially interfere with the fulfillment of a firm’s strategic goals (Werther Jr. and Chandler, 2011). Hence, firms should be aware of the way they address issues such as CSR, as the repercussions of their actions are now placed on a boundless platform, and stakeholders around the world are 24/7 witnesses as well as proactive commentators.
Posts and reposts in the case of Facebook and Tweets and retweets, made by or related to
a firm, consequently, have the potential to alter stakeholders’ perspectives (Haigh, Brubaker, and Whiteside, 2013), influence purchase decision making, and, in turn, impact the firm in question. Positive word-of-mouth has the potential to improve stakeholders’ perceptions and reinforce preferences, and the same applies for negative word-of-mouth. The difference rests in that positive word-of-mouth may enhance reputation, attract new stakeholder, and create brand loyalty, whilst negative word-of-mouth may do the opposite, resulting in potential switching behavior and overall dissatisfaction.
The lack of firm-to-stakeholder communication (López-Fernández and Rajagopal, 2014)
regarding its engagement in corporate social responsibility may also prompt a lack of trust and credibility towards the firm. That is, stakeholders might consider that the firm in question has a hidden agenda or is ultimately engaging in questionable practices that they wish to not disclose. However, the proactive engagement in CSR may decrease negative word-of-mouth, avoiding boycotts (Epstein and Roy, 2001), and a negative impact on business growth and development. Hence, word-of-mouth through social networking sites is significantly more powerful than traditional media, and, therefore, should be taken into consideration to improve stakeholders’ perspectives and ultimate satisfaction. Thus,
H3: An increase in positive word-of-mouth (PWOM) regarding CSR witnessed via social networking sites positively influences stakeholders’ decision making. H4: An increase in negative word-of-mouth (NWOM) regarding CSR witnessed via social networking sites negatively influences stakeholders’ decision making.
The sources of recommendations, comments, information and/or opinions via social media, furthermore, should be strongly considered. That is, when information has been provided by close personal friends or even friends of friends, it is granted significant validity, legitimacy
450

and power, which is not obtained, for example, from traditional media. Firms, therefore, may profit by reproducing transparent communication of social performance through social networking sites if they cautiously consider the outcomes and properly address current and potential stakeholders’ replica in a timely fashion.
STUDY DESIGN This study aims to determine stakeholders’ perspective of corporate social responsibility, the impact of CSR communication and the potential for marketing CSR via social media. Figure 1 includes the hypotheses’ framework. The exploratory design model for the study has been developed by placing a large Mexican firm that is dynamic in CSR at the core of the study. A structured survey was administered with women and men eighteen and older residing in the Metropolitan Area of the Valley of Mexico (Greater Mexico City). The survey was first written in English and then translated into Spanish for its administration; careful attention was given in order to ensure consistency in both languages. A total of two hundred and fifty respondents participated resulting in a hundred percent response rate; forty eight percent of the surveys were successfully completed by women and fifty two percent by men, ranging from ages eighteen to sixty seven. The data was collected over a period of five months with consistency in responses throughout said period. Figure 1 Hypotheses Framework
The survey incorporated fifteen variables that were measured on a five point Likert scale ranging from complete agreement to complete disagreement. Table 1 includes the variables, their definitions and scales, and the resulting descriptive statistics (i.e. mean and standard deviation). The survey’s questions focused on stakeholders’ perception of corporate social responsibility, their preference to consume products and/or services from socially responsible firms, firm-to-stakeholder communication via social media, and the influence of word-of-mouth occurring on such platforms on stakeholders’ behavior.
Stakeholders
Communication
Firm
CSR
Preference Trust and credibility
H1 H2
NWOM
PWOM
H3
H4
451

Table 1 Variables’ Definition and Descriptive Statistics
Variable Definition and Scale Mean Standard deviation
V1 Importance IMP
Stakeholders’ perceived importance of CSR. [1) Completely agree; 2) agree; 3) neither agree or disagree; 4) disagree; 5) completely disagree]
1.244 .483
V2 Preference PRE
Stakeholders’ preference for products and services provided by a CSR firm. [1) Completely agree; 2) agree; 3) neither agree or disagree; 4) disagree; 5) completely disagree]
1.652 .778
V3 Perception of reputation
RER
Stakeholders’ prescribed reputation of a firm’s image based on their CSR engagement. [1) Completely agree; 2) agree; 3) neither agree or disagree; 4) disagree; 5) completely disagree]
1.924 .943
V4 Communication and transparency
COT
Stakeholders have received-retrieved the firm’s CSR information in the last year. [1) Completely agree; 2) agree; 3) neither agree or disagree; 4) disagree; 5) completely disagree]
3.752 1.106
V5 Facebook frequency of use
FUF
Stakeholders’ frequency of use of Facebook. [1) daily; 2) 4-6 times a week; 3) 1-3 times a week; 4) monthly; 5) once a semester or annually]
1.704 1.025
V6 Communication via Facebook
FBC
Stakeholders have received CSR information on Facebook. [1) Completely agree; 2) agree; 3) neither agree or disagree; 4) disagree; 5) completely disagree]
4.144 .966
V7 Preferred source Facebook
PSF
Stakeholders’ preference to receive CSR information on Facebook. [1) Completely agree; 2) agree; 3) neither agree or disagree; 4) disagree; 5) completely disagree]
2.304 1.142
V8 Facebook negative WOM
FNC
Stakeholders’ switching behavior based on negative comments/opinions posted on Facebook by friends. [1) Completely agree; 2) agree; 3) neither agree or disagree; 4) disagree; 5) completely disagree]
2.532 1.162
Continues
452

Continues
Variable Definition and Scale Mean Standard deviation
V9 Facebook positive WOM
FPC
Stakeholders’ switching behavior based on positive comments/opinions posted on Facebook by friends. [1) Completely agree; 2) agree; 3) neither agree or disagree; 4) disagree; 5) completely disagree]
2.640 1.136
V10 Twitter frequency of use
FUT
Stakeholders’ frequency of use of Twitter. [1) daily; 2) 4-6 times a week; 3) 1-3 times a week; 4) monthly; 5) once a semester or annually]
3.180 1.423
V11 Communication via Twitter
TWC
Stakeholders have received CSR information on Twitter. [1) Completely agree; 2) agree; 3) neither agree or disagree; 4) disagree; 5) completely disagree]
4.204 .970
V12 Preferred source Twitter
PST
Stakeholders’ preference to receive CSR information on Twitter. [1) Completely agree; 2) agree; 3) neither agree or disagree; 4) disagree; 5) completely disagree]
2.736 1.080
V13 Twitter negative WOM
TNC
Stakeholders’ switching behavior based on negative comments/opinions posted on Twitter by followers. [1) Completely agree; 2) agree; 3) neither agree or disagree; 4) disagree; 5) completely disagree]
2.740 1.112
V14 Twitter positive WOM
TPC
Stakeholders’ switching behavior based on positive comments/opinions posted on Twitter by followers. [1) Completely agree; 2) agree; 3) neither agree or disagree; 4) disagree; 5) completely disagree]
2.804 1.121
V15 Switching behavior
SWB
Stakeholders’ willingness to switch to other brands based on CSR. [1) Completely agree; 2) agree; 3) neither agree or disagree; 4) disagree; 5) completely disagree]
2.060 .973
453

FINDINGS AND DISCUSSION The results of the multivariate regression are exhibited in Table 2; findings show that the model well explains the deviations of the dependent variable; that is, sixty eight percent of the variable has been explained. As can be appreciated, the most significant variables were switching behavior and perception of reputation; moreover, the least significant variables were Facebook positive word-of-mouth, preference, and communication and transparency. Table 2 Regression Coefficients of the Study’s Variables
R2: .689 β ε Sig.
(Constant) .690 .278 .014
Var
iabl
es
IMP Importance .067 .074 .370 PRE Preference .008 .049 .863 REP Perception of reputation .090 .040 .026 SWB Switching behavior -.117 .038 .002 COT Communication and transparency -.010 .037 .797 FUF Facebook Frequency of use -.052 .036 .142 FBC Communication via Facebook .014 .043 .753 PSF Preferred source Facebook .024 .034 .484 FNC Facebook negative WOM .024 .054 .656 FPC Facebook positive WOM -.004 .054 .940 FUT Twitter frequency of use -.006 .026 .812 TWC Communication via Twitter -.012 .038 .764 PST Preferred source Twitter -.023 .038 .542 TNC Twitter negative WOM -.067 .068 .320 TPC Twitter positive WOM .047 .065 .470
Hypothesis (H1) suggests that stakeholders prefer to purchase products and/or services from firms that proactively engage in corporate social responsibility. Stakeholders were asked about the importance of corporate social responsibility and their purchase preferences. Results indicate that 78 percent completely agreed that CSR is an important trait and 53.2 percent completely agreed that they prefer to purchase products and/or services from socially responsible firms. Furthermore, 68.4 percent of the respondents completely agreed and agreed that they would switch brands if and when they became aware that a firm was not socially responsible or engaging in questionable practices.
The variables associated in (H1) were significantly correlated. Figure 2 illustrates the
correlation of attributes for variables importance, preference, and switching behavior. Importance is significantly correlated with both preference and switching behavior. Therefore, the greater the stakeholder importance prescribed to corporate social responsibility, the greater their preference to purchase products and/or services that are provided by socially responsible firms. Furthermore, the more importance that stakeholders prescribe to CSR, the more likely they are to switch brands if they become aware that a firm is not socially responsible or engaging in less than ethical practices. Hence, hypothesis (H1) is confirmed.
454

Figure 2 Variable Attribute Correlations (H1)
*Correlation is significant at 0.01 **Correlation is significant at 0.05
Hypothesis (H2) implies that stakeholders prescribe a certain degree of trust and credibility towards firms that not only engage in corporate social responsibility, but also make efforts to communicate their actions; further, stakeholders are responsive to firms that communicate their practices via social networking sites. Stakeholders were, then, asked about their perception of the reputation of a firm that engages in corporate social responsibility and the information they had retrieved on CSR during the last year. Findings show that 40 percent completely agreed that their perception of a firm’s reputation is well enhanced by its proactive engagement in corporate social responsibility. 78.8 percent of the respondents stated that they would prefer to obtain information regarding CSR via social networking sites; however, the majority of respondents (i.e. 32 percent) had not obtained information regarding the firm’s engagement in CSR in the past year.
All respondents have a Facebook page and only 3.2 percent do not have a Twitter
account. The majority of respondents, 62.4 percent, access their Facebook page daily; however, 35.6 percent visit their Twitter account on monthly basis. These results indicate that marketing CSR would be more fruitful via Facebook as stakeholders are constantly online, viewing their page. Respondents were then asked if they had received information regarding the firm’s engagement in corporate social responsibility via social networking sites (i.e. Facebook and Twitter). The vast majority of respondents had not retrieved such information via Facebook, 46 percent, or Twitter, 51.2 percent. This indicates that the firm in question has not adequately utilized said platforms to communicate and promote their socially responsible endeavors; thus, stakeholders are not obtaining essential information regarding the firm and the latter is not obtaining full-fledged benefits from their engagement.
The following questions required respondents to state their preference for obtaining
information regarding the firm’s engagement in corporate social responsibility via Facebook and/or Twitter. Findings show that the majority of respondents, 63.2 percent, completely agreed and agreed that they would like to receive information regarding CSR efforts via Facebook; only 13.2 percent disagreed and completely disagreed. Further, 43.2 percent agreed and completely agreed that they would like to obtain such information via Twitter and 18.8 percent disagreed and completely disagreed. However, the lack of communication of the firm’s CSR related endeavors has led respondents to distrust the firm and, therefore, little or no credibility is prescribed to the firm in question.
Importance
Switching behavior
Preference .319**
.408**
.250**
455

The variables associated in (H2) were significantly correlated. Communication via Facebook and Twitter has been significantly correlated (i.e. .473 at a 99 percent significance), indicating that the lack of communication of corporate social responsibility endeavors is equal in regards to both social networking sites. Meaning that, a lack of CSR firm-to-stakeholder communication via Facebook also reflects a lack of said communication via Twitter. The latter is understandable since respondents visit their Facebook page with more frequency than their Twitter account, therefore, if they have not obtained CSR related information via Facebook the probability of witnessing it via Twitter is reduced. Moreover, importance was correlated with communication via Facebook (i.e. .139 at 95 percent significance); therefore, respondents are responsive to CSR firm-to-stakeholder communication occurring via Facebook; as such, the greater the communication via Facebook, the greater the prescribed importance allocated towards corporate social responsibility. Further, an increase in CSR communication via Facebook increases stakeholders’ trust and credibility towards the firm. Hence, hypothesis (H2) is acceptable in reference to Facebook and not Twitter.
Hypothesis (H3) suggests that an increase in positive word-of-mouth witnessed via
social networking sites regarding CSR positively influences stakeholders’ perceptions of the firm, their preferences, and overall decision making. Table 3 illustrates the results of the influence of positive-word-of-mouth (PWOM) via social networking sites on stakeholders’ decision making. Results indicate that 14 percent of the respondents completely agreed and 38.8 percent (the majority) agreed that PWOM witnessed via Facebook regarding CSR positively influences their decision making. 10.8 percent completely agreed and 31.6 percent agreed that PWOM via Twitter positively influences them. Further, only 8 percent and 10.4 percent completely disagreed, for Facebook and Twitter respectively, on the influence of PWOM. Therefore, PWOM related to CSR via social networking sites, in fact, does positively influence stakeholders’ perceptions of the firm and, thus, their decision making. Table 3 Influence of Positive word-of-mouth on Stakeholders’ Decision Making (Figure in percent)
Facebook Twitter
Frequency Rate Frequency Rate
Completely agree 35 14.0 27 10.8 Agree 97 38.8 79 31.6
Neither agree nor disagree 61 24.4 86 34.4 Disagree 37 14.8 32 12.8
Completely disagree 20 8.0 26 10.4 Total 250 100 250 100
Hypothesis (H4) suggests that an increase in negative word-of-mouth witnessed via social networking sites regarding CSR negatively influences stakeholders’ perceptions of the firm, their preferences, and overall decision making. Table 4 illustrates the results of the influence of negative-word-of-mouth (NWOM) via social networking sites on stakeholders’ decision making. Findings suggest that 19.6 percent of the respondents completely agreed and 35.6 percent (the majority) agreed that NWOM witnessed via Facebook negatively influences their decision making, and only 7.2 percent completely disagreed. And, 11.2 percent completely agreed and
456
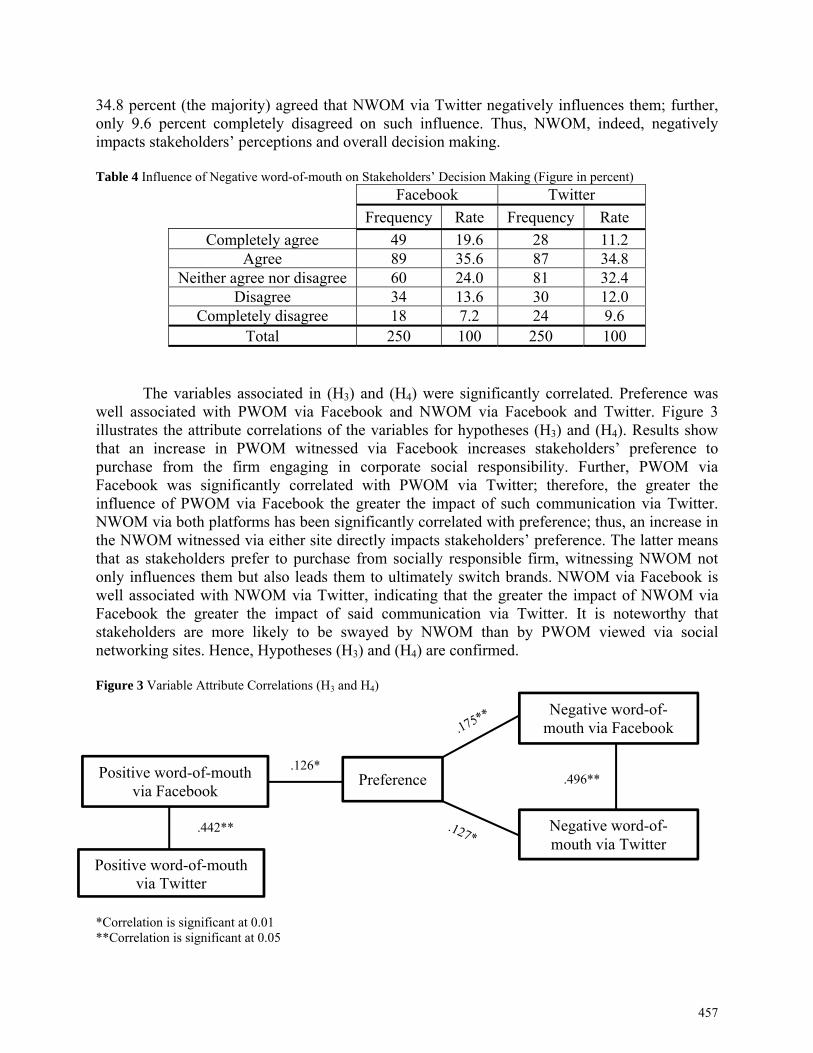
34.8 percent (the majority) agreed that NWOM via Twitter negatively influences them; further, only 9.6 percent completely disagreed on such influence. Thus, NWOM, indeed, negatively impacts stakeholders’ perceptions and overall decision making.
Table 4 Influence of Negative word-of-mouth on Stakeholders’ Decision Making (Figure in percent)
Facebook Twitter
Frequency Rate Frequency Rate
Completely agree 49 19.6 28 11.2 Agree 89 35.6 87 34.8
Neither agree nor disagree 60 24.0 81 32.4 Disagree 34 13.6 30 12.0
Completely disagree 18 7.2 24 9.6 Total 250 100 250 100
The variables associated in (H3) and (H4) were significantly correlated. Preference was
well associated with PWOM via Facebook and NWOM via Facebook and Twitter. Figure 3 illustrates the attribute correlations of the variables for hypotheses (H3) and (H4). Results show that an increase in PWOM witnessed via Facebook increases stakeholders’ preference to purchase from the firm engaging in corporate social responsibility. Further, PWOM via Facebook was significantly correlated with PWOM via Twitter; therefore, the greater the influence of PWOM via Facebook the greater the impact of such communication via Twitter. NWOM via both platforms has been significantly correlated with preference; thus, an increase in the NWOM witnessed via either site directly impacts stakeholders’ preference. The latter means that as stakeholders prefer to purchase from socially responsible firm, witnessing NWOM not only influences them but also leads them to ultimately switch brands. NWOM via Facebook is well associated with NWOM via Twitter, indicating that the greater the impact of NWOM via Facebook the greater the impact of said communication via Twitter. It is noteworthy that stakeholders are more likely to be swayed by NWOM than by PWOM viewed via social networking sites. Hence, Hypotheses (H3) and (H4) are confirmed. Figure 3 Variable Attribute Correlations (H3 and H4)
*Correlation is significant at 0.01 **Correlation is significant at 0.05
Preference
Negative word-of-mouth via Twitter
Negative word-of-mouth via Facebook
.496**
Positive word-of-mouth via Twitter
Positive word-of-mouth via Facebook
.126*
.442**
457

CONCLUSIONS
Corporate social responsibility has become a significant element in business dynamics. As such, firms have come to develop various strategies to communicate their practices, be it via annual formal reports, their official website and, although at a slower pace, via social media. The results of the study indicate that as stakeholders consider corporate social responsibility to be an important trait, they fully expect firms to not only proactively engage in CSR but also to effectively communicate their efforts. Social networking sites are ubiquitous, therefore, stakeholders–users are constantly “connected” with almost anything and everything happening on social media; thus, social networking sites are highly effective platforms for the communication and marketing of corporate social responsibility practices. Furthermore, stakeholders are significantly receptive to firm-to-stakeholder communication via social networking sites, thus, utilizing such platforms is a fruitful strategy for both brand and CSR marketing. Marketing CSR via social networking sites should, therefore, not solely be seen as a trend, rather, it should be treated as a strategy that should be effectively aligned with a firm’s business objectives and strategies. Firms should absolutely utilize social media to promote their CSR policies, actions and overall social outcomes as users are not only 24/7 witnesses and commentators, but are also both current and potential stakeholders. Marketing CSR, this way, will not only prompt a long-lasting relationship with stakeholders but will also, in turn, positively and directly impact business growth of the firm. However, marketing CSR through social networking sites requires vigilance as stakeholder word-of-mouth, both positive and negative, is particularly influential on their decision making. A lack of CSR related communication negatively impacts stakeholders’ decision making as does the negative word-of-mouth witnessed on such sites, and vice versa. Therefore, caution should also be taken when tackling CSR marketing strategies via social media. There are, therefore, many more advantages to marketing CSR via social media than disadvantages. For instance, the number of social networking sites’ users is massive, and thus, the promotion that stakeholders can produce for a firm is boundless. The effective communication of CSR policies, actions and results prompts positive word-of-mouth among users-stakeholders, which, as stated above, positively influences decision making. Therefore, firms may put forth their practices on such platforms while stakeholders may post, repost, and tweet and retweet the information, potentially, transforming it into viral information; that is, viral marketing.
LIMITATIONS AND FUTURE RESEARCH The study’s sample is a limitation as, although two hundred and fifty stakeholders participated in the study, findings are suggestive of the firm’s practices and the participants’ characteristics; as such, the results are not generalizable. Future research could focus on the impact of the contents of stakeholder-to-stakeholder word-of-mouth related to CSR practices witnessed via social networking sites. Further, future research could utilize a longitudinal study to analyze the impact of marketing corporate social responsibility via social media.
458
REFERENCES
Dolnicar, S., & Pomering, A. (2007). Consumer response to corporate social responsibility initiatives: an investigation of two necessary awareness states. In K. R. M. Thyne (Ed.), Australian and New Zealand Marketing Academy Conference (pp. 2825-2831). Dunedin, New Zealand: Australian and New Zealand Marketing Academy.
Epstein, M. J., & Roy, M.-J. (2001). Sustainability in action: Identifying and measuring the key performance drivers. Long Range Planning, 34(5), 585-604.
European Commission. (2013, March 19). A guide to communicating about CSR. Retrieved October 2013, from http://ec.europa.eu/enterprise/policies/sustainable-business/files/csr/campaign/documentation/download/guide_en.pdf
European Foundation for the Improvement of Living and Working Conditions. (2003). Towards a sustainable corporate social responsibility. Luxembourg: Philippe Bronchain.
Facebook. (2012). About Facebook . Retrieved February 20, 2012, from Mission: http://www.facebook.com/press/info.php?factsheet
Fernandez-Feijoo, B., Romero, S., & Ruiz, S. (2014, October). Commitment to Corporate social responsibility measured through global reporting initiative reporting: factors affecting the behavior of companies. Journal of Cleaner Production, 81(15), 244–254.
Gefen, D. (2000). E-commerce: the role of familiarity and trust. The International Journal of Management Science, 28, 725-737.
Godfrey, P. C., Merrill, C. B., & Hansen, J. M. (2009). The relationship between corporate social responsibility and shareholder value: An empirical test of the risk management hypothesis. Strategic Management Journal, 30(4), 425–445.
Haigh, M. M., Brubaker, P., & Whiteside, E. (2013). Facebook: examining the information presented and its impact on stakeholders. Corporate Communications: An International Journal, 18(1), 52-69.
Kaplan, A. M., & Haenlein, M. (2010, February). Users of the world, unite! The challenges and opportunities of Social Media. Business Horizons, 53(1), 59-68.
Lee, H., & Lee, J. (2010, May 4). The computer-mediated Communication Network: exploring the linkage between the online community and social capital. New Media & Society, 12(5), 711-727.
López Fernández, A. M. (2012). Social Networks as an approach to accelerate business strategy. Mexico City: Congreso Internacional de Contaduría, Administración e Informática.
López-Fernández, A. M., & Rajagopal. (2013). Influence of corporate social responsibility on consumers' shopping behavior and determining competitive posture of the firm. Journal of Marketing Analytics, 1(4), 222-233.
López-Fernández, A. M., & Rajagopal. (2014). Engaging stakeholders in co-creating corporate social responsibility: a study across industries in Mexico. International Journal of Business Competition and Growth, 3(3), 241-253.
Lüders, M. (2008). Conceptualizing personal media. New Media & Society, 10(5), 683–702.
459
Maden, C., Arıkan, E., Telci, E. E., & Kantur, D. (2012, October). Linking corporate social responsibility to corporate reputation: A study on understanding behavioral consequences. Procedia-Social and Behavioral Sciences, 58(12), 655-664.
Maguire, M. (2011, January ). The future of corporate social responsibility reporting. The Frederick S. Pardee center for the study of the longer-range future, 1-8.
Mejias, U. A. (2010). The limits of Networks as models for organizing the sociality. New Media & Society, 12(4), 603-617.
Mozes, M., Josman, Z., & Yaniv, E. (2011). Corporate social responsibility organizational identification and motivation. Social Responsibility Journal, 7(2), 311-314.
Ogola, F. O., & Dreer, T. (2012). Market share as an indicator for corporate social responsibility (CSR) spending: The study of Coca Cola’s market. African Journal of Business Management, 6(6), 2234-2247.
Patten, D. (1991). Exposure, legitimacy, and social disclosure. Journal of Acoounting and Public Policy, 10(4), 297-308.
Post, J. E., Preston , L. E., & Sachs, S. (2002). Managing the extended enterprise: the new stakeholder view. California Management Review, 45(1), 6–28.
Reilly, A. H., & Hynan, K. A. (2014, November-December). Corporate communication, sustainability, and social media: It's not easy (really) being green. Business Horizons, 57(6), 747-758.
Saeidi, S. P., Sofian, S., Saeidia, P., Saeidia, S. P., & Saaeidic, S. A. (2015). How does corporate social responsibility contribute to firm financial performance? The mediating role of competitive advantage, reputation, and customer satisfaction. Journal of Business Research, 68(2), 341-350.
Snider, J., Hill, R. P., & Martin, D. (2003). Corporate social responsibility in the 21st Century: A view from the world’s most successful firms. Journal of Business Ethics, 48(2), 175–187.
Stauss, B. (1997). Global Word of Mouth. Marketing Management, 6(3), 1-28. Tench, R., Bowd, R., & Jones, B. (2007). Perceptions and perspectives: Corporate social
responsibility and the media. Journal of Communication Management, 11(4), 348 – 370. Twitter. (2012). Tweetternet. Retrieved March 23, 2012, from Twitter explained:
http://tweeternet.com/ UNCTAD. (2008). Guidance on corporate responsibility indicators in annual reports. New
York & Geneva : United Nations Publication. Wang, J., & Chaudhri, V. (2009, September). Corporate social responsibility engagement and
communication by Chinese companies. Public Relations Review, 35(3), 247-250. Werther Jr., W. B., & Chandler, D. (2011). Part I. Strategic corporate social responsibility. In W.
B. Werther Jr., & D. Chandler, Corporate social responsibility. Stakeholders in a Global Environment (Second ed., pp. 1-19). California: SAGE Publications, Inc.
460
Disentangling the Real Effects of Corporate Social Responsibility Measures
SIDDHARTH SHANKAR1
Associate Professor of Finance, Texas A&M International University, Laredo, Texas, USA
This study examines the effect of corporate social responsibility (CSR) measures in terms of free cash flow, advertising expenditure and research and development expenditure. We separate the benefits of CSR measures for firms with serious real commitment towards CSR against firms with only the intention. We find that CSR firms with higher free cash flow available for these novel efforts perform better than firms with less available free cash flow. Our results show that when firms spend a significant amount of money out of free cash flow, it has a positive impact for the firms and when firms have negative or zero ratio of total advertising and R&D expenditure to free cash flow it impacts the CSR firm negatively.
1 Address correspondence for Siddharth Shankar, Associate Professor of Finance, Texas A&M International University, Laredo, Texas, USA. E-mail: [email protected]
461

Five-Stage Acculturation Process of Hispanic Consumers: Theory and Findings
ARTURO Z. VASQUEZ-PARRAGA1
Professor of Marketing and International Business, The University of Texas-Pan American, Edinburg, Texas, USA
HUMBERTO VALENCIA
Associate Professor of Marketing, Thunderbird School of Global Management, Glendale, Arizona, USA
This study seeks to explain the process of how consumers acculturate by validating a typology of five acculturation states, which includes four final states (assimilation, integration, separation and marginalization) and one transitional (resilience). Using U.S. Hispanic consumers as a cardinal example, and six coordinated samples of consumers, this study introduces continuous measures of cultural awareness and ethnic loyalty to learn how those two antithetical forces shape the acculturation process of immigrant consumers. Employing the CETSCALE, cultural awareness is measured by the degree of adoption of the host culture as represented by the adoption of American products, and ethnic loyalty is measured by the degree of retention of the culture of origin as represented by the retention of products from the country of origin. The results show that consumers who have more cultural awareness than ethnic identity are assimilated, whereas those who have more ethnic loyalty than cultural awareness are fundamentally separated or ethnic consumers. Consumers that have a high degree in both measures are integrated consumers. Conversely, consumers that have low levels of both traits are marginalized. A substantial number of consumers, however, are in a transitory path towards one of the four final states. The revision taken herein overcomes limitations of existing theories and models by emphasizing the process of acculturation, measuring two key forces shaping such process, and finding a transitional state of resilient consumers that previous studies had overlooked, thereby showing that the process of consumer acculturation can best be reflected in a typology of five states. KEYWORDS Consumer acculturation; assimilation; cultural awareness; ethnic loyalty; ethnocentrism; Hispanic consumers.
1 Address correspondence to Arturo Z. Vasquez-Parraga, Professor of Marketing and International Business, The University of Texas-Pan American, Edinburg, Texas, USA. E-mail: [email protected]
462
From Market Orientation to New Product Performance: The Moderating Role of Team-Based versus
Individual-Based Reward in China
JIANFEI LU Visiting PhD Student, A.R. Sanchez, Jr. School of Business, Texas A&M International University, Laredo, Texas, USA
YINGHONG SUSAN WEI
1 Associate Professor of Marketing, A.R. Sanchez, Jr. School of Business,
Texas A&M International University, Laredo, Texas, USA
As the world’s largest international trader, China has been continuously increasing its investment on R&D, because new product innovation is the powerhouse for international trade. While some marketing literature suggests that market orientation may enhance new product innovation, other research find a negative or no relationship between market orientation and new product performance. This unstable relationship has led many scholars to investigate potential moderators that may explain the inconsistent results. Appropriate reward system design is considered as a moderator to the relationship between market orientation and new product performance. While western literature suggests that team-based reward is needed in the new product development process in the western countries with individualism culture, we argue that in China, individual-based reward should be designed for the new product development process in the eastern countries with collectivism culture. In this research, we propose that team-based reward system may have negative impact on new product performance. Moreover, the effect of market orientation on new product performance may decrease when the firms design a team-based reward, while the effect of market orientation on new product performance may increase when the firms design an individual-based reward in China.
1 Address correspondence to Yinghong Susan Wei, Associate Professor of Marketing, A.R. Sanchez, Jr. School of Business, Texas A&M International University, Laredo, Texas, USA. E-mail: [email protected]
463
Explaining Purchase Intention for Imported Products by Way of the Adoption Process Followed by Consumers
MIGUEL ANGEL SAHAGUN1
Ph.D. Candidate, University of Texas Pan-American, Edinburg, Texas, USA
ARTURO Z. VASQUEZ-PARRAGA
Professor, University of Texas Pan-American, Edinburg, Texas, USA
When consumers adopt imported products, they may have to confront a different process than when adopting non-imported products. Mainly because imported products are developed under different positioning strategies and in foreign markets with different levels of development. Yet, how different such process is and how determinant it is in consumer purchase intention is little known. The adoption process of imported products, independently of the industry we refer to, has several factors of influence. The main goals of this research are 1) explaining the purchase intention for imported products among consumers, 2) examining the process consumers follow when adopting imported products that will eventually lead to their purchase intention, and 3) determining how market context (developed vs. emerging) influences both, the consumers’ purchase intention and the product adoption process they follow. Results suggested that attitude, behavioral intention, selection, evaluation, and acceptance, in this order, provide a powerful explanation of imported product purchase intention. Additionally there are various constructs moderating these relationships, however they yielded minimal additional understanding on purchase intention. Finally results showed variations on both, the adoption process of imported products (herein APIP) and the purchase intention depending on the market development consumers belong to (developed vs. emerging) as well as the market development to which the product is associated with (developed vs. emerging). KEYWORDS imported product, adoption process, attitude, behavioral intention, selection, evaluation, acceptance, purchase intention, social influence, prior product knowledge
1 Address correspondence to Miguel Angel Sahagun, Ph.D. Candidate, University of Texas Pan-American, Edinburg, Texas, USA. E-mail: [email protected]
464
Family Firms and Earnings Management in Taiwan: Influence of Board Independence
KEN HUNG1
A.R. Sanchez, Jr. School of Business, Texas A&M International University, Laredo, Texas, USA
This study examines the relationship between family firms and earnings management by considering the influence of board independence. Based on a sample of 379 listed high-technology firms over 7 years in Taiwan, we find that family firms are positively related to earnings management. Further, we find two interaction effects: (1) the proportion of independent directors interacted with family firms to reduce the earnings management, and (2) CEO duality interacted with family firms to increase the earnings management. Our findings suggest that board independence is important for an emerging market to mitigate the earnings management behavior carried out by family firms.
KEYWORDS family firms, earnings management, board independence, independent director, CEO duality JEL CLASSIFICATION: G32, G34
1 Address correspondence to Ken Hung, A.R. Sanchez, School of Business, Texas A&M International University, Laredo, Texas, USA. E-mail: [email protected]
465

The Impact of SOX Regulatory Provisions and SEC’s Enforcement Actions on Forced CEO/CFO
Turnover in Response to Financial Misrepresentation
JUI-CHIN CHANG1
Assistant Professor, A.R. Sanchez, Jr. School of Business, Texas A&M International University, Laredo, Texas, USA
This study examines the forced CEO/CFO turnover and its relationships with the regulatory provisions of the Sarbanes-Oxley Act (SOX) and SEC’s enforcement actions to provide empirical evidence on the effectiveness of SOX in disciplining financial reporting misconduct of CEOs/CFOs. We find that the forced CEO/CFO turnover is significantly related to CEOs/CFOs’ lying to auditors as well as the SEC’s enforcement actions of barring them from serving as an officer/a director. Also, although it is not pervasive, the SEC is able to use the SOX provisions to penalize culpable CEOs/CFOs to pay civil and criminal penalties. Furthermore, our findings suggest that CEOs/CFOs are less likely to resign involuntarily in the post-SOX than in the pre-SOX period. However, CEOs are more likely than CFOs to be terminated when they are accused for financial misrepresentation, especially in the post-SOX period. In contrast, CEOs who orchestrate the financial misrepresentation are less likely forced to resign than CFOs who carry out the same conduct.
1 Address correspondence to Jui-Chin Chang, Assistant Professor, A.R. Sanchez, Jr. School of Business, Texas A&M International University, Laredo, Texas, USA. E-mail: [email protected]
466
Differentiating between Reorganizable and Failed Bankruptcy Firms using CAPM and Non-Financial Performance Measures
CYNTHIA B. LLOYD, PHD, JD, CPA1 Assistant Professor, Division of International Banking & Finance Studies, A.R. Sanchez, Jr.
School of Business, Texas A&M International University, Laredo, Texas, USA
The apparent assumption among researchers, investors and regulators, that a firm is no longer economically viable, has been the underlying premise in the forecasting analysis of bankruptcy prediction models. Qualitative forces including change in auditors, board composition, management style, employees, litigation and other nonfinancial variables should be essential parts of this analysis. The motivation of this study is to show that there is a distinct overall difference in nonfinancial variables as well as the asset valuations of reorganizable (Chapter 11) versus failed (Chapter 7) bankruptcy firms. In this study, the research in bankruptcy prediction models and CAPM is reviewed. Utilizing a sample of reorganized and failed firms, we show that unlike conventional model analyses, which assume that all bankruptcy firms are “irreversibly failed,” under certain nonfinancial conditions, reorganizable firms will flourish. Thus, the firm holds its value, even after filing for bankruptcy. For comparison, using a separate portfolio for each type of bankruptcy, Chapter 11 and Chapter 7, and the S& P 500, this paper concludes that qualitative factors, rather than economic failure may be the driving force in the recovery of firms filing (or converting to) Chapter 11 bankruptcy. By comparison, we show that nonfinancial factors drive financial failure, which is indeed the underlying reason for a firm’s filing (or converting to) a Chapter 7 bankruptcy.
1 Address correspondence to Cynthia B. Lloyd, PhD, JD, CPA, Assistant Professor, Division of International Banking & Finance Studies, A.R. Sanchez, Jr. School of Business, Texas A&M International University, Laredo, Texas, USA. E-mail: [email protected] (pending further data collection and revisions)
467
Importación de Vehículos
ANA GABRIELA GARCIA BENAVIDEZ1
Universidad Autónoma de Tamaulipas
El TLCAN como sabemos un tratado internacional entre EU, Canadá y México con el fin de llegar de competitividad entre estos y promover la comercialización y la rentabilidad en el comercio internacional de los diferentes productos y servicios promoviendo con esto quitar las barreras arancelarias internacionales uno de los principales rubros está el comercio internacional de vehículos de los que en México por ser un país subdesarrollado fomentara la producción y el comercio de vehículos de transporte y de uso personal para la comercialización de unidades nuevas para exportación y para el transporte de productos y de uso personal. Este tratado nos servía también para la importación de vehículos pero ahora el gobierno está dificultando legalmente la importación de vehículos usados provenientes de EU y Canadá al subir demasiado los impuestos de las legalizadas, con el fin de promover sus vehículos de esta manera las empresas automotrices podrían tener mayores ventas.
CONCLUSIÓN
Por medio de la investigación realizada para llevar a cabo este trabajo se determinó que es necesario que el concesionario o empresas automotrices pongan costos más bajos o al menos más accesibles y atractivos para que las personas no dependan de un tratado de libre comercio para obtener un vehículo, se estableció en base a pruebas que la adquisición de los vehículos a un precio más bajo o con un enganche menor a los que nos ofrecen hoy en día haría más fácil y rápido la adquisición de los vehículos en dichas empresas automotrices.
Esta estrategia de costos más accesibles podrá proporcionarles más facilidades a los compradores, así crecerán las ventas de los concesionarios y no habrá necesidad de importar carros de EU y Canadá.
1 Address correspondence to Ana Gabriela Garcia Benavides, Universidad Autónoma de Tamaulipas. E-mail: [email protected]
468

El TLCAN y los Beneficios a la Exportación
LILIAN MICHELLE FLORES CASTELLANOS1
Universidad Autónoma de Tamaulipas
KEVIN ALEJANDRO ZAVALA PADILLA Universidad Autónoma de Tamaulipas
El TLC que tenemos con E.U.A. y Canadá nos brinda facilidades para poder exportar nuestra mercancía hacia un mercado más grande donde podemos introducir nuestros productos y servicios para aumentar la economía del país. La problemática es que la mayoría de la población no tiene el conocimiento de los beneficios que tenemos con este tratado, somos un país de empleados y no de emprendedores. Algunos de ellos están relacionados con la industria textil, azucarera, agrícola y telecomunicaciones. Necesitamos fomentar la creación de micro y pequeñas empresas, no solo para aumentar la economía sino para crear más empleos y gente emprendedora. Tenemos los recursos y materia prima para sobre salir en el mercado, y nosotros como alumnos de comercio exterior debemos ver la ventaja competitiva que tenemos con esos países y como podemos beneficiarnos con los TLC que tenemos.
1 Address correspondence to Lilian Michelle Flores Castellanos, Universidad Autónoma de Tamaulipas. E-mail: [email protected]
469

La Importancia de la Clasificación Arancelaria en los Negocios Internacionales
MELISSA MÁRQUEZ1
Universidad Autónoma de Tamaulipas
RAQUEL MUÑOZ Universidad Autónoma de Tamaulipas
FRANCISCO J. BURGOA
Universidad Autónoma de Tamaulipas
El sistema armonizado es una nomenclatura desarrollada por la Organización Mundial de Aduanas, es utilizado por más de 200 países y economías con base para sus aranceles aduaneros y para la recopilación de estadísticas del comercio internacional. Más del 98% de la mercancía en el comercio internacional se clasifica en términos del Sistema Armonizado, se usa por los gobiernos, las organizaciones internacionales y el sector privado para muchos otros propósitos. El sistema armonizado es un lenguaje universal económico y código de bienes, y una herramienta indispensable para el comercio internacional.
1 Address correspondence to Melissa Marquez, Universidad Autónoma de Tamaulipas. E-mail: [email protected]
470

Modelo de gestión de operaciones y suministro: Factores críticos de éxito en empresas maquiladoras
en la frontera noreste de México
ABIU GONZALEZ IXBA1
Facultad de Comercio, Administración, y Ciencias Sociales, División de Estudios de Posgrado e Investigación,
Universidad Autónoma de Tamaulipas El objetivo de este trabajo de investigación se enfoca en el análisis de los factores críticos de éxito de un modelo de gestión de operaciones y suministro de empresas de manufactura. Este estudio busca determinar el grado de éxito de las empresas de manufactura en base a los factores críticos que inciden en las ventajas competitivas en las organizaciones manufactureras las cuales generan valor agregado para los clientes y un impacto positivo en los márgenes de la empresa. La aportación más importante en esta investigación es la identificación de los factores determinantes que se traducen en ventajas competitivas dentro de la región fronteriza en el noreste de México. PALABRAS CLAVE Modelo de gestión, Operaciones, Suministro, Ventajas competitivas. The objective of this research focuses on the analysis of key factors of a model of operations management and supply chain in manufacturing companies. This study seeks to determine the degree of success of manufacturing companies based on the critical factors that impact the competitive advantages of manufacturing organizations which generate added value for the customers and provide a positive impact on the margins of the company. The main contribution in this research is the identification of the key factors that translate into competitive advantages within the border region in northeastern Mexico. KEYWORDS Model Management, Operations, Supply, Competitive Advantages.
1 Address correspondence to Abiu Gonzalez Ixba, Facultad de Comercio, Administracion, y Ciencias Sociales, Division de Estudios de Posgrado e Investigacion, Universidad Autonoma de Tamaulipas. E-mail: [email protected]
471

THIS PAGE INTENTIONALLY LEFT BLANK

THIS PAGE INTENTIONALLY LEFT BLANK

Texas A&M International University A.R. Sanchez, Jr. School of Business
Center for the Study of Western Hemispheric Trade 5201 University Boulevard
Laredo, TX 78041 (956) 326-2820
freetrade.tamiu.edu
Related Documents