Testosterone and aggression: A reanalysis of Book, Starzyk, and Quinsey’s (2001) study John Archer * , Nicola Graham-Kevan, Michelle Davies Department of Psychology, University of Central Lancashire, Preston, Lancashire PR1 2HE, UK Received 9 December 2002; received in revised form 22 July 2003; accepted 25 January 2004 Abstract A critique is presented of the meta-analysis of testosterone and aggression by Book, Starzyk, and Quinsey [Aggression and Violent Behaviour 6 (2001) 579], and the results of a reanalysis of their data are reported. We identified the following problems with their analysis: Secondary, rather than primary, sources were used in the initial literature review; 15 studies were included that should have been omitted; there were no decision rules for calculating effect sizes, leading to inaccuracies in most of these; the statistical test used to compare categories was of low power; the coding of study characteristics was inaccurate. A reanalysis that corrected these problems produced a lower mean weighted correlation (r =.08 instead of the reported r =.14). The conclusions from our categorical comparisons were different from those of Book et al.: Neither of their positive findings (a decline with age; lower correlations in morning than afternoon samples) were confirmed. We found significant differences for sex, age, offender status, and source of hormone measure, all of which are different from those in the original analysis. D 2004 Elsevier Ltd. All rights reserved. Keywords: Testosterone; Aggression; Book et al. Contents 1. Introduction ............................................. 242 2. Review of the literature ....................................... 242 3. Which studies should be included in the meta-analysis? ....................... 243 1359-1789/$ – see front matter D 2004 Elsevier Ltd. All rights reserved. doi:10.1016/j.avb.2004.01.001 * Corresponding author. E-mail address: [email protected] (J. Archer). Aggression and Violent Behavior 10 (2005) 241– 261

Welcome message from author
This document is posted to help you gain knowledge. Please leave a comment to let me know what you think about it! Share it to your friends and learn new things together.
Transcript
Aggression and Violent Behavior 10 (2005) 241–261
Testosterone and aggression: A reanalysis of Book,
Starzyk, and Quinsey’s (2001) study
John Archer*, Nicola Graham-Kevan, Michelle Davies
Department of Psychology, University of Central Lancashire, Preston, Lancashire PR1 2HE, UK
Received 9 December 2002; received in revised form 22 July 2003; accepted 25 January 2004
Abstract
A critique is presented of the meta-analysis of testosterone and aggression by Book, Starzyk, and
Quinsey [Aggression and Violent Behaviour 6 (2001) 579], and the results of a reanalysis of their data
are reported. We identified the following problems with their analysis: Secondary, rather than primary,
sources were used in the initial literature review; 15 studies were included that should have been
omitted; there were no decision rules for calculating effect sizes, leading to inaccuracies in most of
these; the statistical test used to compare categories was of low power; the coding of study
characteristics was inaccurate. A reanalysis that corrected these problems produced a lower mean
weighted correlation (r =.08 instead of the reported r =.14). The conclusions from our categorical
comparisons were different from those of Book et al.: Neither of their positive findings (a decline with
age; lower correlations in morning than afternoon samples) were confirmed. We found significant
differences for sex, age, offender status, and source of hormone measure, all of which are different
from those in the original analysis.
D 2004 Elsevier Ltd. All rights reserved.
Keywords: Testosterone; Aggression; Book et al.
Contents
1. Introduction . . . . . . . . . . . . . . . . . . . . . . . . . . . . . . . . . . . . . . . . . . . . . 242
2. Review of the literature . . . . . . . . . . . . . . . . . . . . . . . . . . . . . . . . . . . . . . . 242
3. Which studies should be included in the meta-analysis? . . . . . . . . . . . . . . . . . . . . . . . 243
1359-1789/$ – see front matter D 2004 Elsevier Ltd. All rights reserved.
doi:10.1016/j.avb.2004.01.001
* Corresponding author.
E-mail address: [email protected] (J. Archer).
J. Archer et al. / Aggression and Violent Behavior 10 (2005) 241–261242
4. Calculation of effect sizes . . . . . . . . . . . . . . . . . . . . . . . . . . . . . . . . . . . . . . 245
5. Statistical problems in comparing categories . . . . . . . . . . . . . . . . . . . . . . . . . . . . 247
6. Recoding and reanalysis of study characteristics . . . . . . . . . . . . . . . . . . . . . . . . . . 248
7. Conclusions . . . . . . . . . . . . . . . . . . . . . . . . . . . . . . . . . . . . . . . . . . . . . 250
Appendix A . . . . . . . . . . . . . . . . . . . . . . . . . . . . . . . . . . . . . . . . . . . . . . . . 252
References. . . . . . . . . . . . . . . . . . . . . . . . . . . . . . . . . . . . . . . . . . . . . . . . . 259
1. Introduction
Book, Starzyk, and Quinsey (2001) undertook a meta-analysis of studies linking testoster-
one and aggression. While such quantitative syntheses are important for advancing knowl-
edge in a particular area and are generally preferable to qualitative reviews (Cooper, 1984;
Schmidt, 1992), there are certain problems with undertaking a meta-analytic review that these
authors appear not to have addressed. As a consequence, some of their conclusions are likely
to be unsound. In this commentary, we outline these problems under the following headings:
(1) the derivation of hypotheses by qualitative reviews of secondary rather than primary
sources in the background literature; (2) the inclusion of studies that should have been
omitted, because they were duplicate entries from the same sample, were not concerned with
the association between testosterone and aggression, or did not involve a measure of
aggression; (3) ambiguity in the decision rules for calculating effect sizes for the association
between testosterone and measures of aggression, leading to inaccuracies in the majority of
their effect-size values; (4) statistical problems in comparing categories; (5) inaccuracies in
coding the study characteristics, leading to inaccuracies in the categorical analysis.
In addition to outlining these problems, we have examined all studies used by Book et
al. (2001) in their analysis, reassessed whether they should be included, recalculated the
effect sizes, recoded the categorical variables, and analyzed these values. We then
compared the conclusions from this reanalysis with those reached in the original analysis.
We conclude that there are sufficient grounds for questioning most of the conclusions in the
original analysis. Finally, we make some general observations about the utility of meta-
analytic reviews.
2. Review of the literature
It is important that research questions are accurately identified in the review of previous
literature. This requires accurate characterization of what is already established and separating
this from widely repeated but erroneous statements found in secondary sources and texts.
Book et al. (2001) relied on a few book chapters for most of their background review, leading
to the presentation of secondary sources as empirical studies and to some inaccurate
characterization of what is established in this field.
For example, they cited Turner (1994) as an empirical study investigating the relationship
between testosterone and aggression in two groups of boys, 12- and 13-year-olds and 15- and
J. Archer et al. / Aggression and Violent Behavior 10 (2005) 241–261 243
16-year-olds, stating that, ‘‘testosterone was positively correlated with norm-violating
(aggressive) behaviour in 12 and 13-year old boys, but not in 15 and 16-year old boys’’
(Turner, 1994, p. 581). Turner’s work is actually a book chapter reviewing research
concerning genetic and hormonal influences on male violence. One section (p. 244) reviews
research on the effects of hormones on human males at puberty. However, there are no details
of a study on the relationship between testosterone and aggression in boys of these ages. The
appropriate citation was probably Olweus (1986), who did measure aggression and testoster-
one from boys aged 13 years, and from the same boys when they were 15–17 years, and
reported comparisons between these age groups. However, these comparisons were not
reported in Turner’s chapter.
A second example of inaccurate reporting of secondary sources comes from Daly and
Wilson’s (1994) book chapter and concerns the peak ages for male violence. Book et al.
(2001) stated, ‘‘Daly and Wilson’s (1994) discussed what is known as the ‘Young Male
Syndrome,’ referring to the fact that males between the age of 12 and 25 are the principal
perpetrators and victims of violence’’ (p. 585). It is correct that they did state that young adult
males are more likely to be perpetrators and victims of violence. However, they did not state
that males between the ages of 12 and 25 are more likely to perpetrate violence or to suffer
victimization. Most studies of the distribution of violent crime and homicide by age identify
18–30 as peak years for perpetration (Campbell, 1995; Daly & Wilson, 1988, 1990; Quetelet,
1833/1984). This is an important distinction for a review of testosterone and aggression, since
it excludes the pubertal years when endogenous testosterone levels increase.
Book et al. (2001) went on to use a study by Mazur (1983) as further evidence that the
rapidly rising testosterone levels at puberty increased the likelihood that young males
between 12 and 25 years of age would be the principal perpetrators of violence. This is
again misleading. Mazur’s work is a book chapter reviewing research on hormones and
aggression. Within that chapter, there are indeed references to studies that investigated the
relationships between testosterone and aggression. However, Mazur did not empirically test
the relationship between the rise of testosterone at puberty and the perpetration of violence in
young adulthood, as Book et al. implied. The one study relevant to the substantive issue of
whether the pubertal increase in testosterone levels produces an increase in physical
aggression is that by Halpern, Udry, Campbell, and Suchindran (1994). They found no
evidence for either an increase in aggression or an association between testosterone levels and
aggression in a 3-year longitudinal study of 100 boys going through puberty. Book et al. only
mentioned this study in passing (p. 586) in relation to the low levels of testosterone prior to
puberty, although they did include it in their meta-analysis. They omitted its important finding
in relation to testosterone and aggression during puberty, which would have contradicted their
assertion that there is a link between aggression and the rise in testosterone at puberty.
3. Which studies should be included in the meta-analysis?
Inspection of Table 1 by Book et al. (2001) indicates several studies that should not have
been included in a meta-analysis of the association between testosterone and aggression.
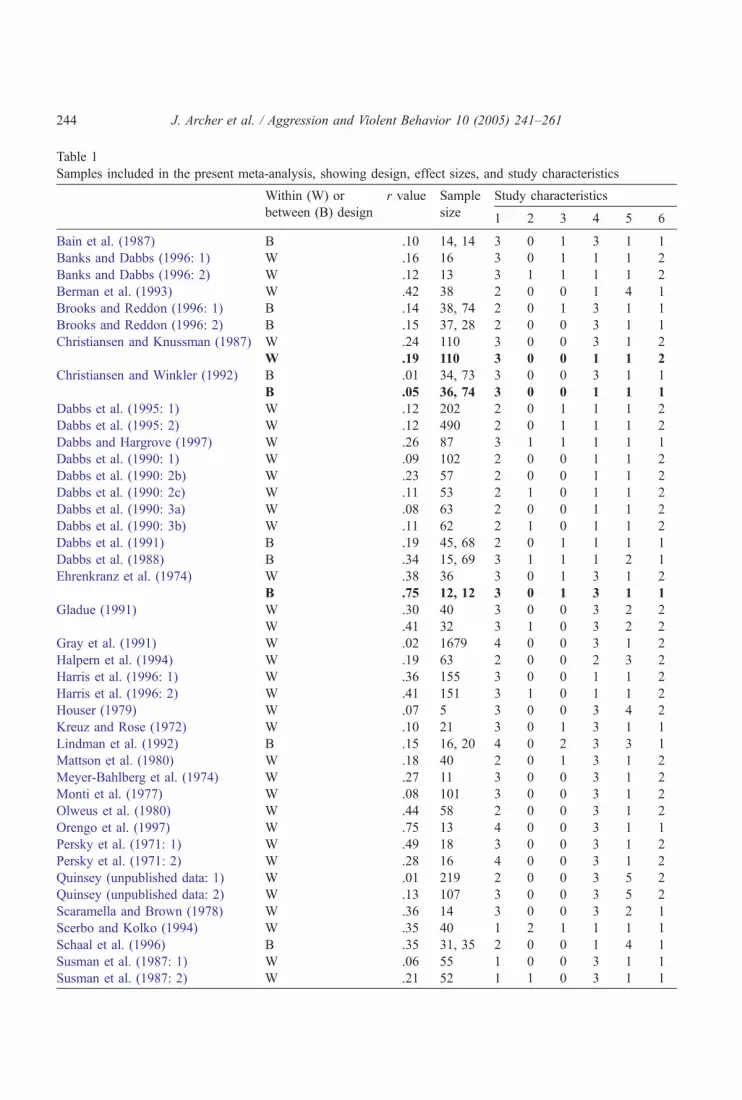
Table 1
Samples included in the present meta-analysis, showing design, effect sizes, and study characteristics
Within (W) or r value Sample Study characteristics
between (B) design size 1 2 3 4 5 6
Bain et al. (1987) B � .10 14, 14 3 0 1 3 1 1
Banks and Dabbs (1996: 1) W .16 16 3 0 1 1 1 2
Banks and Dabbs (1996: 2) W .12 13 3 1 1 1 1 2
Berman et al. (1993) W .42 38 2 0 0 1 4 1
Brooks and Reddon (1996: 1) B .14 38, 74 2 0 1 3 1 1
Brooks and Reddon (1996: 2) B .15 37, 28 2 0 0 3 1 1
Christiansen and Knussman (1987) W .24 110 3 0 0 3 1 2
W .19 110 3 0 0 1 1 2
Christiansen and Winkler (1992) B � .01 34, 73 3 0 0 3 1 1
B � .05 36, 74 3 0 0 1 1 1
Dabbs et al. (1995: 1) W .12 202 2 0 1 1 1 2
Dabbs et al. (1995: 2) W .12 490 2 0 1 1 1 2
Dabbs and Hargrove (1997) W .26 87 3 1 1 1 1 1
Dabbs et al. (1990: 1) W .09 102 2 0 0 1 1 2
Dabbs et al. (1990: 2b) W .23 57 2 0 0 1 1 2
Dabbs et al. (1990: 2c) W � .11 53 2 1 0 1 1 2
Dabbs et al. (1990: 3a) W � .08 63 2 0 0 1 1 2
Dabbs et al. (1990: 3b) W � .11 62 2 1 0 1 1 2
Dabbs et al. (1991) B .19 45, 68 2 0 1 1 1 1
Dabbs et al. (1988) B .34 15, 69 3 1 1 1 2 1
Ehrenkranz et al. (1974) W .38 36 3 0 1 3 1 2
B .75 12, 12 3 0 1 3 1 1
Gladue (1991) W .30 40 3 0 0 3 2 2
W � .41 32 3 1 0 3 2 2
Gray et al. (1991) W .02 1679 4 0 0 3 1 2
Halpern et al. (1994) W � .19 63 2 0 0 2 3 2
Harris et al. (1996: 1) W .36 155 3 0 0 1 1 2
Harris et al. (1996: 2) W .41 151 3 1 0 1 1 2
Houser (1979) W � .07 5 3 0 0 3 4 2
Kreuz and Rose (1972) W � .10 21 3 0 1 3 1 1
Lindman et al. (1992) B .15 16, 20 4 0 2 3 3 1
Mattson et al. (1980) W .18 40 2 0 1 3 1 2
Meyer-Bahlberg et al. (1974) W � .27 11 3 0 0 3 1 2
Monti et al. (1977) W � .08 101 3 0 0 3 1 2
Olweus et al. (1980) W .44 58 2 0 0 3 1 2
Orengo et al. (1997) W .75 13 4 0 0 3 1 1
Persky et al. (1971: 1) W .49 18 3 0 0 3 1 2
Persky et al. (1971: 2) W � .28 16 4 0 0 3 1 2
Quinsey (unpublished data: 1) W .01 219 2 0 0 3 5 2
Quinsey (unpublished data: 2) W � .13 107 3 0 0 3 5 2
Scaramella and Brown (1978) W .36 14 3 0 0 3 2 1
Scerbo and Kolko (1994) W .35 40 1 2 1 1 1 1
Schaal et al. (1996) B � .35 31, 35 2 0 0 1 4 1
Susman et al. (1987: 1) W .06 55 1 0 0 3 1 1
Susman et al. (1987: 2) W � .21 52 1 1 0 3 1 1
J. Archer et al. / Aggression and Violent Behavior 10 (2005) 241–261244
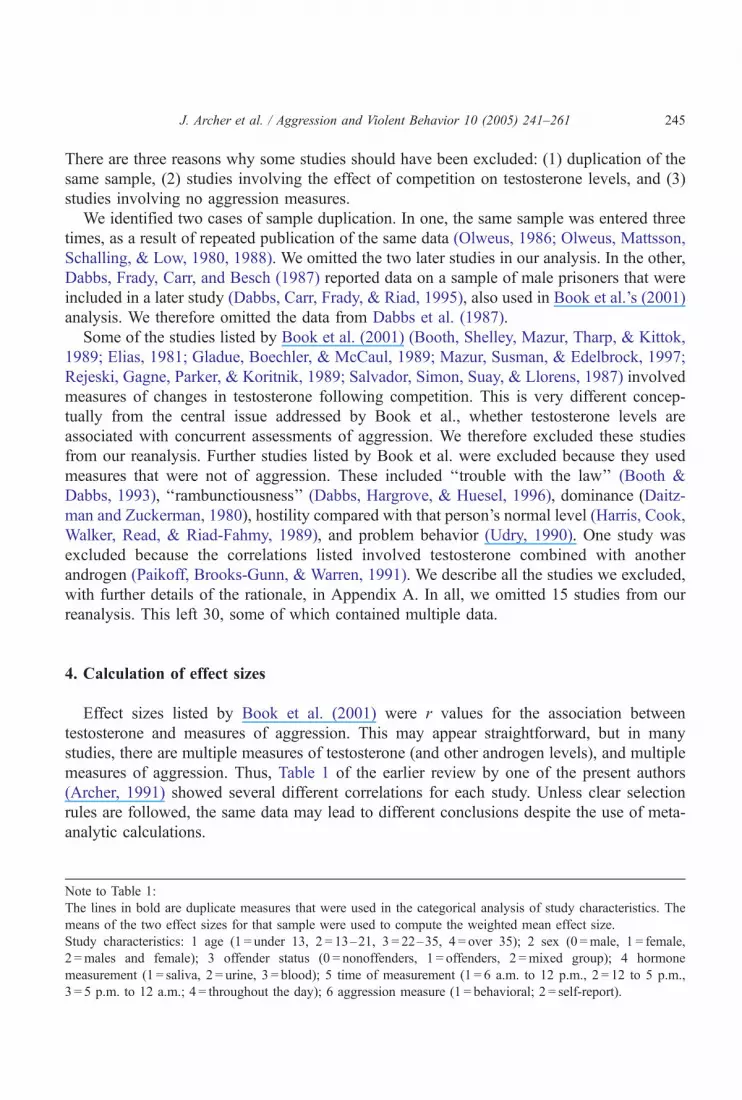
J. Archer et al. / Aggression and Violent Behavior 10 (2005) 241–261 245
There are three reasons why some studies should have been excluded: (1) duplication of the
same sample, (2) studies involving the effect of competition on testosterone levels, and (3)
studies involving no aggression measures.
We identified two cases of sample duplication. In one, the same sample was entered three
times, as a result of repeated publication of the same data (Olweus, 1986; Olweus, Mattsson,
Schalling, & Low, 1980, 1988). We omitted the two later studies in our analysis. In the other,
Dabbs, Frady, Carr, and Besch (1987) reported data on a sample of male prisoners that were
included in a later study (Dabbs, Carr, Frady, & Riad, 1995), also used in Book et al.’s (2001)
analysis. We therefore omitted the data from Dabbs et al. (1987).
Some of the studies listed by Book et al. (2001) (Booth, Shelley, Mazur, Tharp, & Kittok,
1989; Elias, 1981; Gladue, Boechler, & McCaul, 1989; Mazur, Susman, & Edelbrock, 1997;
Rejeski, Gagne, Parker, & Koritnik, 1989; Salvador, Simon, Suay, & Llorens, 1987) involved
measures of changes in testosterone following competition. This is very different concep-
tually from the central issue addressed by Book et al., whether testosterone levels are
associated with concurrent assessments of aggression. We therefore excluded these studies
from our reanalysis. Further studies listed by Book et al. were excluded because they used
measures that were not of aggression. These included ‘‘trouble with the law’’ (Booth &
Dabbs, 1993), ‘‘rambunctiousness’’ (Dabbs, Hargrove, & Huesel, 1996), dominance (Daitz-
man and Zuckerman, 1980), hostility compared with that person’s normal level (Harris, Cook,
Walker, Read, & Riad-Fahmy, 1989), and problem behavior (Udry, 1990). One study was
excluded because the correlations listed involved testosterone combined with another
androgen (Paikoff, Brooks-Gunn, & Warren, 1991). We describe all the studies we excluded,
with further details of the rationale, in Appendix A. In all, we omitted 15 studies from our
reanalysis. This left 30, some of which contained multiple data.
4. Calculation of effect sizes
Effect sizes listed by Book et al. (2001) were r values for the association between
testosterone and measures of aggression. This may appear straightforward, but in many
studies, there are multiple measures of testosterone (and other androgen levels), and multiple
measures of aggression. Thus, Table 1 of the earlier review by one of the present authors
(Archer, 1991) showed several different correlations for each study. Unless clear selection
rules are followed, the same data may lead to different conclusions despite the use of meta-
analytic calculations.
Note to Table 1:
The lines in bold are duplicate measures that were used in the categorical analysis of study characteristics. The
means of the two effect sizes for that sample were used to compute the weighted mean effect size.
Study characteristics: 1 age (1 = under 13, 2 = 13–21, 3 = 22–35, 4 = over 35); 2 sex (0 =male, 1 = female,
2 =males and female); 3 offender status (0 = nonoffenders, 1 = offenders, 2 =mixed group); 4 hormone
measurement (1 = saliva, 2 = urine, 3 = blood); 5 time of measurement (1 = 6 a.m. to 12 p.m., 2 = 12 to 5 p.m.,
3 = 5 p.m. to 12 a.m.; 4 = throughout the day); 6 aggression measure (1 = behavioral; 2 = self-report).
J. Archer et al. / Aggression and Violent Behavior 10 (2005) 241–261246
Measures of testosterone can be selected on the basis of using plasma, saliva, or urine
levels and stating which one refers to which. If several measures are listed in one study,
they can be averaged for the computation of a study-level effect size and then entered as
separate values for categorical comparisons. Although this may have been the approach
adopted by Book et al. (2001), there is an error in their coding (see below) that would
obscure it.
Multiple measures of aggression pose a more difficult problem for the meta-analyst.
In a previous limited meta-analysis of testosterone and aggression (Archer, Birring, &
Wu, 1998), this problem was recognized and selection rules set out. Measures of direct
aggression were used, and when separate values were used (e.g., for verbal and physical
aggression) these were combined. The purpose of this was to maintain consistency
across the measures from different studies, so that as far as possible these were
measures of direct aggression, rather than being contaminated by related variables.
Although Book et al. (2001) also recognized the problem posed by multiple measures
(their Section 7.3) and calculated averages, examination of individual cases indicates
that they included measures that reflected constructs other than direct aggression, such
as delinquency, dominance, and competitiveness. In addition, it is not clear which
measures were added together for any particular study, many of which contain multiple
measures.
Table 2 by Book et al. (2001) indicates that individual effect sizes have been checked
and produced an agreement of r =.96. However, our recalculated effect sizes (from 30 of
their 45 studies) agreed with, or was within .01 of, those listed by Book et al. in only
seven occasions, and we disagreed on 22 others (we could not check the unpublished
study of Quinsey). Table 1 shows our recalculated values for the samples in these 30
studies, and Appendix A sets out in detail the reasoning behind our calculations. We used
measures that were of direct aggression, and if there were more than one such value (for
example, verbal and physical aggression) we used the mean of the two. Where the values
were for correlations with testosterone, we entered the correlation and where there was a
comparison between two groups divided based on an aggression measure, we calculated
the associated r value from the between-group comparison. We distinguish between these
between- and within-subjects comparisons in Table 1.
There are 42 samples listed in Table 1, as a consequence of some studies yielding
values for more than one sample. These produced a mean weighted value of d = 0.16 (CI
0.12, 0.20), converting to an r =.08 (P < .0001), using D-STAT (Johnson, 1989): This
program weights each study by the reciprocal of the variance, which gives more weight to
values that are more reliably estimated (Hedges & Olkin, 1985). Our mean weighted
correlation contrasts with the larger value of r =.14 (weighted by sample size) in the
analysis by Book et al. (2001).
We assessed the heterogeneity between the studies in our analysis, computing the value for
Qw, which has an approximate v2 distribution (k� 1 degrees of freedom, k being the number
of effect sizes). The value was Qw = 259.3 (P< .0001), indicating considerable heterogeneity.
Outliers were progressively removed, until the Qw value was nonsignificant, and the resulting
d value recalculated. It required the removal 18 outliers to achieve a homogeneous sample:
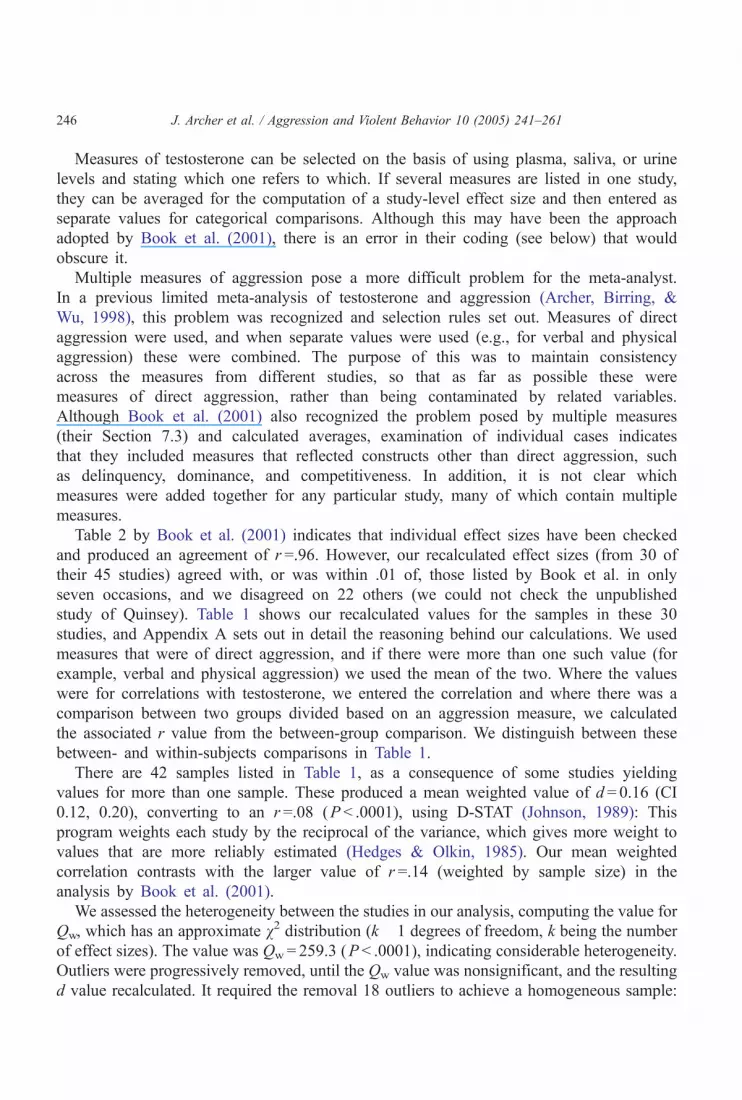
Table 2
Categorical model analysis of the moderating effects of age and time of day on the correlation between
testosterone and aggression using figures from Book et al. (2001)
r d CI Qw k QB
Ages 13–21 .11a 0.22 0.17/0.28 18.0 23 13.6**
Ages 22–35 .08 0.15 0.05/0.26 20.3 14
Ages over 35 .05a 0.10 0.06/0.14 9.1 5
6 a.m. to 12 p.m. .06 0.12 0.09/0.15 19.8 23 13.1*
12 p.m. to 5 p.m. .17 0.35 0.17/0.54 5.8 4
5 p.m. to 12 a.m. .17 0.35 0.18/0.52 0.3 3
Throughout day .11 0.23 0.07/0.39 .1 3
r =mean correlation weighed by sample size; d = effect size for correlation; CI = confidence interval associated
with d value; k = number of samples included in the analysis; Qw = homogeneity of effect sizes; QB = difference
between contrasted categories.a After the r values indicate that the post hoc P value for the Z2 comparison between these values was
significantly different (P < .05).
*P< .01.
**PV.001.
J. Archer et al. / Aggression and Violent Behavior 10 (2005) 241–261 247
The d value from the remaining studies was much reduced (d = 0.06; CI .01/.11; r =.03;
P=.02). The outliers were reinstated for subsequent categorical analyses.
5. Statistical problems in comparing categories
Meta-analysis is as important for identifying comparisons between subgroups as it is for
enabling an overall effect size to be calculated. The method adopted by Book et al. (2001) is
not entirely clear. It appeared to be a comparison of the numbers of expected and observed
correlations in different categories (p. 591), using v2. It is more usual to compare across
different categories using a categorical model test equivalent to a one-way analysis of
variance (Hedges & Olkin, 1985; Johnson, 1989). Alternatively, Z scores can be computed for
contrasts between two sets of effect sizes (Rosenthal, 1984, 4.27), and linear contrasts can be
calculated where a trend is expected, for example, with age differences.
We reanalyzed the two most important comparisons made by Book et al. (2001), using
their values for the correlations and for age and time of day. We entered these into a D-STAT
file to undertake categorical analyses using the procedures of Hedges and Olkin (1985). To be
consistent with Book et al. (2001), we only entered samples of males for age. The results are
shown in Table 2. There was a significant overall effect of both age and time of day on the
magnitude of the correlation between testosterone and aggression. In the case of age,
correlations were significantly higher in the 13- to 21-year-old group than in those over 35
years of age. For the other two age comparisons, the differences were nonsignificant, using a
post hoc test for simple contrasts.
For time of day, there was a significant overall difference between the categories (Table 2),
although a post hoc test for simple contrasts found no differences for the individual
J. Archer et al. / Aggression and Violent Behavior 10 (2005) 241–261248
comparisons. Since this may be a consequence of the small numbers in all the categories except
6 a.m. to 12 p.m. (i.e., morning), the afternoon and evening categories were combined (and that
throughout the day omitted), and the analysis repeated. We found that correlations were
significantly higher when the hormone was collected in the afternoon or evening than when it
was collected in the morning (weighted mean r values .17 and .06, QB = 11.8, P< .001).
Although the general direction of these findings is similar to those portrayed by Book et al.
(2001) in their Fig. 2 and 3, there were some puzzling discrepancies in the numbers of studies
in each category, between our analysis and theirs.1 Our reanalysis also led to more cautious
conclusions than theirs. We tested for differences between individual age categories and
found significant differences only between 13–21 and over 35 years. Book et al. tested for
age overall and found a much smaller P value (.03) using their v2 procedure (our overall valuefor age was P < .001). Our analysis of time-of-day broadly matches that by Book et al.,
although we had to combine the values for the afternoon and evening (which were almost
identical) to produce an overall significant difference with morning values. Thus, their
conclusion that ‘‘the observed relationship between testosterone and aggression is highest in
the afternoon’’ (p. 594) should be modified based on this reanalysis to ‘‘afternoon and
evening.’’ However, in view of the problems outlined in the next section, even these analyses
are likely to be unsound.
6. Recoding and reanalysis of study characteristics
Although we have presented a reanalysis of Book et al.’s (2001) comparisons between
categories, based on their figures, our discussion in Sections 2 and 3 showed that both the
selection of samples and the effect sizes they used were unsound. We therefore decided to
undertake a reanalysis of categorical variables with our revised figures. Although Book et al.
provided a table for the reliability of the coded variables, there are obvious errors in one of the
categories (hormone measurement). The key for this category showed the numbers 1, 2, and
3, whereas the values entered in the column were 0, 2, and 3.
We recoded the variables for each study that we used (i.e., omitting the 15 studies
described in Section 2) and computed new categorical analyses using these codings, which
were undertaken independently by the first two authors. Cohen’s kappas for intercoder
agreements were .91 (age), 1.0 (sex), .94 (offender status), .94 hormone measure, 1.0 (time),
and .89 (aggression measure). Disagreements were investigated and corrected. Cohen’s
kappas for the intercoder agreement between the first author and values listed in Table 1
of Book et al. (2001) were all considerably lower: .63 (age), .70 (sex), 71 (offender status),
.68 (time), and .44 (aggression measure). A value could not be computed for the hormone
measure as a result of the coding error mentioned above.
Table 1 shows the results of our recoding of the study characteristics and Table 3 shows the
results of our categorical analysis, using these codings, for the six categories used by Book et
1 These discrepancies persisted despite careful rechecking of the values.

Table 3
Categorical model analysis of the moderating effects on the correlation between testosterone and aggression using
recalculated data
r d CI Qw k QB
Ages under 13 .04 0.09 � 0.14/0.32 14.5 3 33.2***
Ages 13–21 .08a 0.17 0.17/0.28 69.2 16
Ages 22–35 .18a,b 0.36 0.05/0.26 132.2 22
Ages over 35 .02b 0.05 � 0.02/0.11 21.1 4
Males .08 0.15 0.11/0.20 185.0 36 8.3*
Females .13 0.26 0.13/0.39 77.1 8
Nonoffenders .06 0.12 0.07/0.17 222.2 30 16.9***
Offenders .16 0.32 0.24/0.41 31.1 14
Saliva .16 0.33 0.26/0.39 99.6 19 32.5***
Blood .04 0.08 0.03/0.13 128.7 25
6 a.m. to 12 p.m. .10 0.19 0.15/0.24 199.6 34 2.3
Other times .03 0.05 � 0.12/0.23 55.7 9
Behavioral .13 0.26 0.15/0.37 83.7 18 3.1
Self-report .08 0.15 0.11/0.20 183.5 27
r =mean correlation weighed by sample size; d = effect size for correlation; CI = confidence interval associated
with d value; k = number of samples included in the analysis; Qw = homogeneity of effect sizes; QB = difference
between contrasted categories.
The same superscript letter after the r values indicate that the post hoc P value for the Z2 comparison between
these values was significantly different (P< .05).
*P< .05.
***PV.001.
J. Archer et al. / Aggression and Violent Behavior 10 (2005) 241–261 249
al. (2001) We first consider the two categories highlighted by Book et al., age and time of day.
There are clear differences between the age categories for which there are most data points,
13–21 and 22–35, with the correlations for the 22–35 age category being over twice those
for the younger ages. This contrasts with the analysis shown in Fig. 2 of Book et al., which
showed higher correlations for the younger age group. It also contrasts with the values shown
in Table 2, which were from our reanalysis of Book et al.’s data using the procedures of
Hedges and Olkin (1985). These portrayed a slight decline from the younger to the older age
category, which was maintained in the over-35 category. Our reanalysis (Table 3) does at least
concur that the correlations are much smaller for the over 35 samples than for the 22–35
category, although there were only four older samples.
Since Book et al. (2001) only used samples from males for their analysis of age
differences, we also analyzed our data excluding samples of females. We found that ages
13–21 and 22–25 did not significantly differ from one another (r =.10 and r =.13,
QB = 0.74, P=.39). The value for the over-35 category (r =.02) was again significantly
smaller than for either of the other two categories (13–21: post hoc P=.01; 22–35: post hoc
P=.006).
Our analysis of time-of-day showed clearly that correlations did not differ when
morning samples were compared with those from other times combined. Again, this is
counter to the finding shown by Book et al. (2001, their Fig. 3), that afternoon and
evening samples yielded higher correlations. Since our reanalysis of their data also found
J. Archer et al. / Aggression and Violent Behavior 10 (2005) 241–261250
this, the discrepancy must have arisen from the selection of the samples, recalculation of
effect sizes, and/or recoding of the studies (rather than the different methods of
categorical analysis).
Table 3 also shows that the overall correlations were significantly higher in female
than male samples. This contradicts Book et al.’s (2001) analysis based on a v2
computed for the numbers of observed and expected significant correlations. Their Table
4 shows no sex difference. Our Table 3 also shows that correlations were significantly
higher in samples of offenders than in nonoffenders, again contradicting the non-
significant differences reported from the v2 analysis of Book et al. Correlations were
significantly higher when saliva rather than blood was the source of the testosterone
measure (Table 3), again different from the finding of no difference in Book et al.’s
analysis. We found no significant difference between the correlations derived from
behavioral or self-report methods (although the former tended to be higher). This finding
is consistent with Book et al.’s analysis.
Overall, it seems that we have found significant differences where Book et al. (2001) have
not. Although this might be expected from the greater power of the statistical tests we used, it
could have resulted from differences in the data sets, as suggested above for the age
differences.
7. Conclusions
The specific conclusions from our meta-analysis of the studies used by Book et al. (2001)
are that their analysis is unsound in several respects: the choice of studies to include, the
calculation of study-level effect sizes, and coding of the variables. Each of these has
repercussions for the conclusions we can draw from the analysis. Instead of a mean weighted
correlation of r =.14, reanalysis produced a considerable smaller value (r=.08), although this
was still significantly different from zero in the same direction.
Our categorical analysis contradicted that of Book et al. (2001) for five of the six
comparisons. Our conclusions are, therefore, different from theirs in several respects. They
concluded that there was a higher association between testosterone and aggression in the 13–
21 age category, than the 21–35 and over-35 categories. Book et al. linked this to the high
degree of mating effort at these ages. However, our reanalysis showed that the correlations
were much higher in the 22–35 age category than the younger category. Since Book et al.
only included males in their analysis, we recomputed the values, excluding female samples.
This analysis showed no significant differences between the 13–21 and 21–35 categories.
Again, this does not support a link with the rise in testosterone at puberty. This is consistent
with the findings of a longitudinal study of boys going through puberty (Halpern et al., 1994).
Most testosterone samples were obtained in the morning. In our reanalysis, there were few
samples from other times of the day, and these showed no significant difference from the
morning samples when they were aggregated. This contrasted with Book et al.’s (2001)
conclusion that correlations were significantly lower when taken in the morning. We did not
even find a trend in this direction. Therefore, their conclusion that researchers could obtain

J. Archer et al. / Aggression and Violent Behavior 10 (2005) 241–261 251
more reliable measures, and hence stronger correlations, by sampling in the afternoon rather
than the morning, was not supported by our reanalysis.
Book et al. (2001) concluded that offender status did not affect the correlation between
testosterone and aggression. We found that the correlation was much higher among offender
samples, a finding that is inconsistent with an earlier meta-analytic comparison of college
students with samples more likely to be aggressive, mainly offenders (Archer et al., 1998).
This analysis only involved 18 studies (15 that were included in the present analysis and 3
others). It is likely that the discrepancy is due mainly to the additional studies included in
Book et al.’s sample and that the present reanalysis is more reliable.
Book et al. (2001) found that correlations were of similar magnitude in males and females
and concluded that this showed that the testosterone–aggression correlation is one that occurs
whatever the level of testosterone, since these are much smaller in women than men. We
found higher correlations for females than males, a finding that has no obvious explanation.
The source of the testosterone (saliva or blood) did not affect the strength of the association
in Book et al.’s (2001) analysis. We found that it did, with values being considerably higher in
studies that had used saliva. This finding was consistent with the more limited meta-analysis
of Archer et al. (1998). It is, however, inconsistent with a study that compared various
methods of assaying testosterone. This study (Shirtcliff, Granger, & Likos, 2002) used
computer-generated values for hypothetical correlations between hormonal and behavioral
values to calculate estimates of the degree to which salivary assays underrepresented the
correlation obtained from serum. They found substantial underestimation in females for
radioimmunoassays of salivary testosterone. A second method, enzyme immunoassay, was
associated with underestimates of around 30% for both sexes. Our findings run counter to the
expectations from these results, in that we found higher associations for plasma than for
serum testosterone.
We can conclude that there are serious discrepancies between the conclusions drawn by
Book et al. (2001) from their meta-analysis, and the conclusions from the present reanalysis,
based on the same sample of studies, but with a complete reassessment, reanalysis, and
recoding of each study. Our analysis involved careful reading of each study. The decisions we
made concerning their inclusion or exclusion, and how we derived effect sizes, have been
explained in Appendix A, so that there is as little as possible ambiguity in how we derived our
data. We also used more powerful methods of analysis.
That our respective findings and conclusions are so different will, we hope, alert future
meta-analysts to the need to ensure that certain methodological safeguards are in place. First,
the decision rules for the inclusion and exclusion of studies should be clearly specified.
Second, the variables involved need to be defined unambiguously, and if there is not a
consensus over which ones should be used, meta-analysts should be very explicit about the
selection rules they have adopted. Third, effect-size calculations should involve standard
procedures and be checked independently. Fourth, the coding of study characteristics has to
be reliable, with discrepancies rectified by making coding categories more rigorous and by
identifying errors. Categorical comparisons should be derived from standard procedures,
rather than (as in the analysis of Book et al., 2001) applying chi-squared tests to the numbers
of studies showing a significant difference from zero.
J. Archer et al. / Aggression and Violent Behavior 10 (2005) 241–261252
Without such clarity in the decision rules, there will be scope for meta-analyses of the same
data to produce different outcomes and hence different conclusions. This negates the purpose
of a meta-analytic review, which is to provide a rigorous framework that avoids the subjective
assessments and decisions characteristic of the narrative review (Cooper, 1984; Schmidt,
1992; Wang & Bushman, 1999).
Appendix A. Notes on studies listed in Table 1 of Book et al. (2001) indicating why our
values for sample size and effect size were different from theirs, and the reasons for
excluding some studies from our analysis
Bain, Langevin, Dickey, and Ben-Aron (1987) provide hormone levels taken from
samples of inmates awaiting trial for murder (n = 13), assault (n= 14) or a nonviolent
offense (n = 14). From the n listed by Book et al. (2001), their r value seems to have
been obtained by comparing the means and standard deviations of the assault and
nonviolent groups. Using D-STAT we obtained a point-biserial correlation of r =� .10,
very near to that listed by Book et al.
Banks and Dabbs’ (1996) sample size was listed as 65 (both men and women). However,
self-report data (this was the coding in Book et al., 2001) was only collected from some of
these participants, from the deviant group, numbering 16 men and 13 women. Correlations
with self-reported aggression were r =.16 (males) and r =.12 (females). In our table, these
values and sample sizes are used, instead of the value of r =.53 from an n = 65 in Book et al.
(2001).
Berman, Gladue, and Taylor (1993) used a laboratory aggression paradigm to assess
aggressiveness and reported a correlation of r =.42 on p. 131. This is the value listed by Book
et al. (2001), although their sample size (n= 202) is incorrect.
Booth and Dabbs’ (1993) study reports analyses of the association between testosterone
and various measures of marital instability in a large sample of former servicemen. There are
measures of spouse abuse, but the analysis does not provide figures suitable for converting
these to effect sizes. Table 3 shows zero-order correlations between testosterone and other
variables including ‘‘trouble with the law.’’ The value for this (r =.13) is clearly the one used
by Book et al. (2001), although it is not a measure of aggression. For this reason, we have
excluded this study from our analysis.
Booth, Shelley, Mazur, Tharp, and Kittok’s (1989) was excluded because it involved
the impact of success or failure in tennis matches on testosterone levels. Such a study,
which measures the effects of competition on subsequent testosterone values, is different
from studies that measure associations between the hormone levels and concurrent
behavior or differences in hormone levels between groups divided based on their
aggressive behavior. Incidentally, the sample size for the study was 6, not 72 as listed
by Book et al. (2001).
Brooks and Reddon (1996): Our values agreed with those of Book et al. (2001).
Christiansen and Knussmann (1987) used two standard aggression questionnaires, and
therefore would appear to be self-report rather than behavioral data as coded by Book et al.

J. Archer et al. / Aggression and Violent Behavior 10 (2005) 241–261 253
(2001). Several measures from the self-reports were listed, including spontaneous aggression,
reactive aggression, irritability, autoaggression, restraint on aggression, dominance–submis-
siveness, and three forms of sexuality. Book et al. appear to have taken the mean from all
these measures, most of which are not measures of direct aggressiveness. We have chosen to
use just one of these measures, spontaneous aggression, which seems to capture a willingness
to aggress face to face. Book et al. coded the hormone measure as 2 (‘‘urine’’). In fact, both
saliva and blood levels of testosterone and other hormones were taken in this study and the
correlations with spontaneous aggression are listed on separate lines for the two methods. Our
values (r =.24 and r =.19) differ from that listed by Book et al. (r =.02).
Christiansen and Winkler (1992) carried out two types of analysis. The first was a
comparison between a group of !Kung San men (n= 107), who were classified as violent
(based on their scars and interviews about the source of these), and those who were classified
as nonviolent. The second involved only the violent subsample (n = 37) and provided
correlations between testosterone and the degree of physical aggression (assessed by the
number of scars). The first comparison produced values of r=� .01 (n= 107, blood) and
r=� .05 (n= 110, saliva). The second produced values of r =.12 (n = 34, blood) and r =.33
(n = 36, saliva). None of these correlations resembles the value of r =.25 listed by Book et al.
(2001). Nor do the sample sizes in these comparisons resemble the sample size of 11 listed for
this study by Book et al. We entered the values from the comparisons of the violent and
nonviolent groups, separately for blood and saliva measures, as the measures taken within the
violent group is from a specialized subsample of all the participants.
Dabbs et al. (1995) provided two data sets from prison inmates, which involved point-
biserial correlations between testosterone levels and whether they had committed a violent
crime. The values were r =.12 and r =.12. Values for the correlation between testosterone and
whether the inmate had a disciplinary report were also presented (r =.20 and r =.23). We used
the first of these values since disciplinary reports include a range of infringements of the
rules, some involving physical aggression and some not. The values presented by Book et al.
(2001) were r =.16 and r =.21.
Dabbs et al. (1987) reported a number of behavioral measures for a sample of male prison
inmates. One was peer ratings of toughness (but this had low reliabilities and the correlation
for the whole sample is not presented). Another was the number of disciplinary infractions
while in prison and the days of punishment per infraction (correlations were presented
separately for inmates who had committed infractions and for a subset of these who had
committed violent offences). Others involved measures taken from parole board decisions.
The only measure that was closely related to violence or aggression was whether the inmate
had been convicted of a crime of violence. This produced a t value of 2.5 (d= 0.54, r =.26),
which is different from the value of r =.19 in Book et al. (2001). There were in fact no values
of r =.19 in the original article. Dabbs et al. (1995) reported that this data set were used as part
of sample 1 in that article. For this reason, we have omitted Dabbs et al. (1987) to avoid using
the same sample more than once.
Dabbs and Hargrove (1997) studied 87 female prisoners, which involved two measures of
aggression, one involving rating the crime for which the participant was imprisoned along a
three-point scale (nonviolent, defensive–violent, or violent) and the other involving staff

J. Archer et al. / Aggression and Violent Behavior 10 (2005) 241–261254
ratings and prison records of rule infringements. Since the emphasis was on aggressive
responses in the second of these, it seemed reasonable to take the means of the correlations
between these two measures and testosterone levels (r =.18 and r =.34), producing a value of
r =.26. This is similar to the value of r =.27 listed by Book et al. (2001).
Dabbs et al.’s (1996) study was excluded because no measures of aggression were
involved. It was a study of college fraternities, which were classified as ‘‘rambunctious’’
or ‘‘well-behaved’’ based on a variety of sources.
Dabbs, Hopper, and Jurkovic’s (1990) study involved four samples of students who
provided testosterone measures, and completed self-report personality inventories, including
some measures of aggressiveness. In Study 1, there was only one aggression measure,
provoked aggression from the NEO-PI. The correlation (Table 1) was r =.09 (not � .03 as
listed by Book et al., 2001). In Study 2, separate values were presented for males and females
for active aggression and reactive aggression. We took the means for these two since they
both represent direct aggression. We regarded other behavioral categories (such as ‘‘wild
behavior,’’ ‘‘delinquent behavior,’’ and ‘‘passive aggression’’) as not being measures of direct
aggression and so these were not used. Our values were r =.23 (males) and r =� .11
(females). Book et al. listed r =.06 for the male sample only, although values for females
were also presented by Dabbs at al. Study 3 provided the same measures for another sample
of male and female students. Again, Book et al. only listed a value for males (r=� .09),
which was very similar to ours for males (r =� .08).
Dabbs, Jurkovic, and Frady’s (1991) behavioral measures were violence of the crime,
parole board decisions, and prison infractions (all categorical measures). Our value was taken
from the t value (2.06) for the comparison between inmates with violent and nonviolent
offences. This produced an r value of .19, very similar to that listed by Book et al. (2001)
(r =.20).
Dabbs, Ruback, Frady, Hopper, and Sgoutas’ (1988) study compared testosterone levels
among women prisoners convicted of five types of crime including what was categorized as
‘‘unprovoked attack’’ (to distinguish them from inmates categorized as ‘‘defensive violent,’’
i.e., those who had retaliated against someone who attacked them). A number of comparisons
were made in the article between subsamples arrested for different sorts of crime, but neither
standard deviations nor t values are provided in Table 1. It is, however, possible to derive an
effect size for the comparison between those inmates categorized as ‘‘unprovoked violent,’’
based on their offence and the others. This is achieved by using the overall sample standard
deviation provided in the text, and computing an overall mean for the ‘‘others’’ category from
the means listed in Table 1. This produced a point-biserial correlation of r =.34 (n= 84).
These values contrast with r =.58 and n= 20 listed by Book et al. (2001). These must have
been derived from the comparison between the ‘‘unprovoked violent’’ group (n = 15) and the
‘‘defensive violent’’ group (n = 5), which showed the lowest testosterone values of all the
subgroups. There is no justification for using these inmates as the less violent control group
when values can be computed for the much larger group of prisoners convicted of nonviolent
or reactively violent offenses.
Daitzman and Zuckerman’s (1980) study was excluded because there were no measures
of aggression. Correlations between measures of dominance on the Multiple Affect

J. Archer et al. / Aggression and Violent Behavior 10 (2005) 241–261 255
Adjective Check List and testosterone for men selected for high and low disinhibition are
shown in Table 2, and it is apparent that Book et al. (2001) used the value for dominance
listed there.
Ehrenkranz, Bliss, and Sheard (1974): Table 1 of this article shows the means and standard
deviations for three categories of prisoner, ‘‘nonaggressive,’’ ‘‘socially dominant,’’ and
‘‘aggressive,’’ based on their crimes. The value derived by Book et al. (2001) is presumably
the point-biserial correlation for testosterone and aggression/nonaggression category member-
ship. We calculated this as r =.75, not r =.51 as they listed. It was also possible to calculate a
correlation between testosterone and the composite score on the Buss–Durkee Hostility
Inventory (BDHI) for all 36 participants, from Fig. 2. This value was r =.38 and is listed in
our table. We used the mean of the two values for computing the overall mean weighted effect
size.
Elias’ (1981) study was excluded because it involved the impact of wrestling bouts on
testosterone levels.
Gladue’s (1991) sample sizes for this study were 40 for men and 32 for women (not 155
and 150 as listed by Book et al., 2001; these are the sample sizes for Study 1, which did not
involve testosterone measures). Effect sizes listed by Book et al. (r =.22 and r =� .28) appear
to be means for five subscales, only two of which are concerned with direct aggression (the
others being impulsiveness, impatience, and avoidance of aggression). We have taken the
means of the two direct aggression scales (physical and verbal).
Gladue et al.’s (1989) study was excluded because it involved the impact of competition in
a laboratory reaction-time task on testosterone levels. The rationale for this is the same as that
for excluding Booth et al. (1989).
Gray, Jackson, and McKinley’s (1991) study of a large sample of older men involved
measures of anger (the Spielberger Anger Expression scale) and dominance as a personality
trait (Jackson Personality Research Form E). The only measure that corresponds to direct
aggression is the Anger-Out subscale of the Spielberger Scale. Since Book et al. (2001) were
explicitly concerned with aggression, measures of dominance should have been disregarded.
Table 5 of Gray et al. shows a value of r =.02 for the correlation between testosterone and
anger-out (Book et al., 2001, list a value of r =.04).
Halpern et al.’s (1994) longitudinal study involved six data collection points on the same
sample, at 6-monthly intervals. Correlations between testosterone and self-reported aggres-
sion are presented in Table 2. We calculated the mean values for physical and for verbal
aggression across the six collection points and used the mean of these (r =� .19). Book et al.
(2001) listed a value of r =.40, which is impossible to understand since all the listed values are
negative (and so are those for two other measures, frustration, and provoked aggression). The
sample size is n= 63, not 127 as listed by Book et al. This is the initial number who
participated in the study, which was reduced to 100, and to 63 for those who provided
complete data at all six rounds.
Harris et al. (1989) studied the hormonal levels in 11 male marathon runners during the 3
days prior to the race. It included visual analogue measures of hostility (along a three-point
scale) but these were made in relation to what was ‘‘normal’’ for that person, rather than as an
individual difference measure. We therefore omitted this study.
J. Archer et al. / Aggression and Violent Behavior 10 (2005) 241–261256
Harris, Rushton, Hampson, and Jackson (1996): Our values agreed with those of Book et
al. (2001).
Houser (1979): We took our correlation coefficient (r=� .07) from Table 2, for the one
item of aggression listed there (from the Multiple Adjective Check List). It is not clear how
the value of r =.11 listed by Book et al. (2001) was obtained.
Kreuz and Rose (1972): Correlations of testosterone were presented for the following
behavioral measures, from the prison records: fighting (r =� .06), verbal aggression
(r=� .13), and other forms of aggression (r =.22). Self-reports were derived from the BDHI
(r=� .03). There was also a correlation for age at first conviction for the more violent crimes
(r=� .65). It is difficult to tell how the value of r =� .16 listed by Book et al. (2001) was
derived from these. Our value was taken from the mean of the two forms of direct aggression,
verbal and physical (r=� .10).
Lindman, von der Pahlen, Ost, and Ericksson (1992): This study compared testosterone
levels between (1) a sample of alcohol-intoxicated men taken into police custody following
incidents of spouse abuse and (2) a control sample of 20 men who were also bar patrons. A
second comparison was reported, between testosterone levels among the same 16 men when
sober and a different control sample recruited outside a shopping center. Book et al. (2001)
added all the three samples together to yield a value of n= 55. The separate comparisons
involved samples of 36 and 35, respectively. Assuming that the two values were used to
derive a point-biserial correlation by Book et al., we computed r =.17 for the first
comparison (intoxicated men) and r =.13 for the second (sober men) and calculated from
means and standard deviations using D-STAT. Since these were comparisons of the same
arrested men with control groups, the more conservative strategy would be to take the mean
value (r =.15) and to list the sample size as n= 36. Book et al. listed values of r =.16 and
n = 55.
Mattson, Schalling, Olweus, Low, and Svensson’s (1980) correlations presented in
Table 2 (p. 484) of their article were for all 40 participants—not for the 16 listed by
Book et al. (2001). Correlations were shown for four aggression-related self-report
measures, physical and verbal aggression, aggressive attitude and impulses, and aggres-
sion inhibition. The value shown by Book et al. (r =.07) appears to be the mean of these
four: However, only the first two are measures of direct aggression (the fourth is a
measure of aggression inhibition). We have therefore used the mean of the two direct
aggression measures (r =.18).
Mazur et al.’s (1997) study was excluded because it involved the impact of competition in
a video game contest on testosterone levels. The rationale for this is the same as that for
excluding other studies, such as that of Booth et al. (1989).
Meyer-Bahlberg, Nat, Boon, Sharma, and Edwards’ (1974) study involved a comparison
between samples of students screened for low and high aggression scores on the BDHI. Table
2 shows the t values for the comparison between plasma testosterone levels in the two groups:
It was t =� .90, values being higher in the low-testosterone group. This produces a point-
biserial correlation of r=� .27. Values were also provided in this table for testosterone
metabolic clearance rate, blood production rate, urinary testosterone, and urinary epitestos-
terone. For purposes of comparability with other studies, we used the value for plasma

J. Archer et al. / Aggression and Violent Behavior 10 (2005) 241–261 257
testosterone. Book et al. (2001) coded the hormone measure in this study as ‘‘urine’’: If this is
the value they used, the sample size should have been 9 (not 11) and the point-biserial
correlation r =.08, rather than their r =.04.
Monti, Brown, and Corriveau’s (1977) correlations between testosterone and a variety of
scores from the BDHI are listed. These include a value for the total (r=.06) and separate
correlations with assault, indirect, irritability, negativism, resentment, suspicion, and verbal
subscales (ranging from r=� .15 for resentment to r =.27 for the suspicion scale). The value
listed by Book et al. (2001) (r=� .01) is difficult to understand, since the obvious strategy of
taking the total score would have produced a value of r =.06, and a mean of all six scales
produced a value of r =.02. We used the mean of the assault and verbal scales, since these are
both direct aggression. This produced a value of r=� .08.
Olweus (1986) and Olweus et al. (1980, 1988) are listed as separate entries by Book et al.
(2001), but they all involved the same sample of adolescent boys. We used Olweus et al.’s
(1980) study. In this study, a number of correlations were listed for testosterone and measures
of aggression from the Olweus Aggression Inventory. We used the correlation for physical
and verbal aggression combined (r =.44) as this was the most complete measure of direct
aggression. The value of r =.22 listed by Book et al. must have been derived from a
composite of direct aggression with other measures.
Orengo, Kunnik, Ghusn, and Yudofsky’s (1997) Table 1 showed a number of correlations
between testosterone and ratings of aggressiveness and other behavior of elderly men. The
correlations vary widely, from r=� .36, for verbally agitated behavior, to r =.75, for the
aggressive behavior factor of the Cohen–Mansfield Agitation Inventory. Since the sample size
was only 13, correlations are likely to be unstable (i.e., to change with addition of new
participants). There is no obvious solution to the question of which value or values should be
used in a meta-analysis. Examining the numbers of items on the two scales used indicated that
the Overt Aggression Scale contained far fewer items (6) than the Cohen–Mansfield Agitation
Inventory (66), which could be divided into three factors, one of which was labeled ‘‘aggressive
behavior.’’ We used the correlation for this subscale, since it involved direct aggression and
contained a sufficient number of items (37). The value of r =.75 differs from that listed by Book
et al. (2001) (r =.33).
Paikoff et al. (1991) studied 72 girls ages 10–14 years, at Time 1 and then 1 year later. No
correlations between testosterone and aggression were presented. There was a multiple
regression involving aggression and values for dehydroepiandosterone sulfate and testoster-
one combined. However, such values were not suitable for calculating effect sizes. Therefore,
we omitted this study from our analysis.
Persky, Smith, and Basu (1971) presented the values for the correlations between testoster-
one and total BDHI scores (r =.49) andwith Factor 2 (aggressive feelings) of the BDHI (r =.52).
Book et al. (2001) used the second of these. However, Persky et al. also provided values for an
older sample in Table 4, but Book et al. omitted these. The values for this sample were very
different from the younger one (r =� .28 for the total BDHI score). We have included both
values and for comparability have used the total BDHI scores in both cases.
Quinsey (unpublished data): Since we were unable to check these data, we have entered
the values from Book et al. (2001).
J. Archer et al. / Aggression and Violent Behavior 10 (2005) 241–261258
Rejeski et al.’s (1989) study involved the influence of trait measures of dominance on
subsequent testosterone responses to a task designed to challenge a person’s dominance. It
therefore involved the influence of a competitive situation on subsequent testosterone and did
not contain any measure of aggression. Either of these considerations would be a reason for
excluding the study, and it is therefore not included in the present analysis.
Salvador et al.’s (1987) study was excluded because it involved the impact of judo bouts
on testosterone levels.
Scaramella and Brown’s (1978) behavioral measures were coach’s ratings of hockey players.
Table 1 provides seven measures that include competitiveness, offensive play, frustration
tolerance, and leadership, which should be distinguished from aggression. The final item is
global aggressiveness, the measure we used (r =.36). The value of r =.28 used by Book et al.
(2001) appears to be derived from an aggregation of this and other items, but it is not clear which
ones. We obtained a value of r =.20 from all seven items, r =.26 if leadership and offensive play
were excluded, and r =.29 if these two and competitiveness were excluded).
Scerbo and Kolko’s (1994) study involved a sample of children referred to a clinic for
disruptive behavior. Correlations between testosterone and three aggression measures
involving standard rating scales are shown in their Table 2. These were derived from parents’
reports (Child Behavior Check List), teachers’ reports (Teacher Report Form), and reports by
staff at the clinic (Overt Aggression Scale). Values were r =.14, r =.47, and r =.45,
respectively. The mean of these (r =.35) was used in the present analysis (the value listed
by Book et al., 2001, was r =.40).
Schaal et al.’s (1996) study involved measures of toughness and leadership (by peers)
among 13-year-old boys. Leadership and toughness scores were dichotomized to form high
and low groups, and testosterone was used as the dependent variable in a repeated measures
(time of day of sampling) ANOVA. The total sample for this analysis was 171 (p. 1324).
Boys in the high-toughness group showed higher testosterone levels than did low-toughness
boys. There was no main effect for leadership category, but a significant interaction showing
that boys who were high in both the toughness and leadership categories had higher
testosterone levels than other categories, at three of the four sampling times. We should
note that boys in the high tough-leader category were not rated highest in aggression by
classmates (Schall et al., 1996, p. 1326): It was the boys who were high in toughness and low
in leadership who were rated highest in aggression. Yet, their testosterone levels were similar
to those of boys from the other two categories. A subsequent analysis was based on the
children’s history of fighting from ages 6 to 12 years, rated by teachers. The total sample size
for this analysis was 66. Controlling for the influence of pubertal stage, there was a main
effect of a history of high versus low fighting, with high fighters showing lower testosterone
levels than low fighters at 13 years of age. We used the F value to calculate an effect size for
the association between prior aggressiveness and testosterone levels at 13 years. This
produced a value of r=� .35. The value listed by Book et al. (2001) (r =.22) is positive,
and is therefore probably based on the association between testosterone with toughness (they
list a sample size of 178, which is the original total sample, higher than those used for the
subsequent analyses).
Susman et al. (1987): Our values agreed with those of Book et al. (2001).
J. Archer et al. / Aggression and Violent Behavior 10 (2005) 241–261 259
Udry’s (1990) study involved measurements of ‘‘problem behavior’’ among a sample
of adolescent boys. There were no separate measures of aggression reported, and the
examples of the problem behavior measure included getting drunk, having sex,
smoking marijuana, and smoking tobacco—but not aggression. Analysis involved
multiple regressions, and no separate correlations were reported. We therefore omitted
this study.
References
Archer, J. (1991). The influence of testosterone on human aggression. British Journal of Psychology,
82, 1–28.
Archer, J., Birring, S. S., & Wu, F. C. W. (1998). The association between testosterone and aggression among
young men: Empirical findings and a meta-analysis. Aggressive Behavior, 24, 411–420.
Bain, J., Langevin, R., Dickey, R., & Ben-Aron, M. (1987). Sex hormones in murderers and assaulters. Behavioral
Science and the Law, 5, 95–101.
Banks, T., & Dabbs Jr., J. M. (1996). Salivary testosterone and cortisol in a delinquent and violent urban subculture.
Journal of Social Psychology, 136, 49–56.
Berman, M., Gladue, B., & Taylor, S. (1993). The effects of hormones, Type A behavior pattern, and provocation
on aggression in men. Motivation and Emotion, 17, 125–138.
Book, A. S., Starzyk, K. B., & Quinsey, V. L. (2001). The relationship between testosterone and aggression:
A meta-analysis. Aggression and Violent Behavior, 6, 579–599.
Booth, A., & Dabbs Jr., J. M. (1993). Testosterone and men’s marriages. Social Forces, 72, 463–477.
Booth, A., Shelley, G., Mazur, A., Tharp, G., & Kittok, R. (1989). Testosterone, and winning and losing in human
competition. Hormones and Behavior, 23, 556–571.
Brooks, J. H., & Reddon, J. R. (1996). Serum testosterone in violent and nonviolent young offenders. Journal of
Clinical Psychology, 52, 475–483.
Campbell, A. (1995). A few good men: Evolutionary psychology and female adolescent aggression. Ethology and
Sociobiology, 16, 99–123.
Christiansen, K., & Knussmann, R. (1987). Androgen levels and components of aggressive behavior in men.
Hormones and Behavior, 21, 170–180.
Christiansen, K., & Winkler, E.-M. (1992). Hormonal, anthropometrical, and behavioral correlates of physical
aggression in !Kung San men of Namibia. Aggressive Behavior, 18, 271–280.
Cooper, H. M. (1984). The integrative research review. Beverly Hills, CA: Sage.
Dabbs Jr., J. M., Carr, T. S., Frady, R. L., & Riad, J. K. (1995). Testosterone, crime, and misbehavior among 692
male prison inmates. Personality and Individual Differences, 18, 627–633.
Dabbs Jr., J. M., Frady, R. L., Carr, T. S., & Besch, N. F. (1987). Saliva testosterone and criminal violence in
young adult prison inmates. Psychosomatic Medicine, 49, 174–182.
Dabbs Jr., J. M., & Hargrove, M. F. (1997). Age, testosterone, and behavior among female prison inmates.
Psychosomatic Medicine, 59, 477–480.
Dabbs Jr., J. M., Hargrove, M. F., & Huesel, C. (1996). Testosterone differences among college fraternities: Well-
behaved vs rambunctious. Personality and Individual Differences, 20, 157–161.
Dabbs Jr., J. M., Hopper, C. H., & Jurkovic, G. (1990). Testosterone and personality among college students and
military veterans. Personality and Individual Differences, 11, 1263–1269.
Dabbs Jr., J. M., Jurkovic, G., & Frady, R. L. (1991). Salivary testosterone and cortisol among late adolescent mal
offenders. Journal of Abnormal Child Psychology, 19, 469–478.
Dabbs Jr., J. M., Ruback, R. B., Frady, R. L., Hopper, C. H., & Sgoutas, D. S. (1988). Saliva testosterone and
criminal violence among women. Personality and Individual Differences, 9, 269–275.
J. Archer et al. / Aggression and Violent Behavior 10 (2005) 241–261260
Daitzman, R., & Zuckerman, M. (1980). Disinhibitory sensation seeking, personality and gonadal hormones.
Personality and Individual Differences, 1, 103–110.
Daly, M., & Wilson, M. (1988). Homicide. New York: Aldine de Gruyter.
Daly, M., &Wilson, M. (1990). Killing the competition: Female/female and male/male homicide.Human Nature, 1,
81–107.
Daly, M., & Wilson, M. (1994). Evolutionary psychology of male violence. In J. Archer (Ed.), Male violence
(pp. 253–288). New York: Routledge.
Ehrenkranz, J., Bliss, E., & Sheard, M. H. (1974). Plasma testosterone: Correlation with aggressive behavior and
social dominance in man. Psychosomatic Medicine, 36, 469–475.
Elias, M. (1981). Serum cortisol, testosterone, and testosterone-binding globulin responses to competitive fighting
in human males. Aggressive Behavior, 7, 215–224.
Gladue, B. A. (1991). Aggressive behavioral characteristics, hormones, and sexual orientation in men and women.
Aggressive Behavior, 17, 313–326.
Gladue, B. A., Boechler, M., & McCaul, K. D. (1989). Hormonal responses to competition in human males.
Aggressive Behavior, 15, 409–422.
Gray, A., Jackson, D. N., & McKinley, J. B. (1991). The relation between dominance, anger, and hormones
in normally aging men: Results from the Massachusetts male aging study. Psychosomatic Medicine, 53,
375–385.
Halpern, C. T., Udry, J. R., Campbell, B., & Suchindran, C. (1994). Relationships between aggression and
pubertal increases in testosterone: A panel analysis of adolescent males. Social Biology, 40, 8–24.
Harris, B., Cook, N. J., Walker, R. F., Read, G. F., & Riad-Fahmy, D. (1989). Salivary steroids and psychometric
parameters in male marathon runners. British Journal of Sport Medicine, 23, 89–93.
Harris, J. A., Rushton, J. P., Hampson, E., & Jackson, D. N. (1996). Salivary testosterone and self-report
aggressive and pro-social personality characteristics in men and women. Aggressive Behavior, 22, 321–331.
Hedges, L. V., & Olkin, I. (1985). Statistical methods for meta-analysis. San Diego, CA: Academic Press.
Houser, B. B. (1979). An investigation of the correlation between hormonal levels in males and mood, behavior
and physical discomfort. Hormones and Behavior, 12, 179–185.
Johnson, B. T. (1989). Software for the meta-analytic review of research literatures. Hillsdale, NJ: Erlbaum.
Kreuz, L. E., & Rose, R. M. (1972). Assessment of aggressive behavior and plasma testosterone in a young
criminal population. Psychosomatic Medicine, 34, 321–332.
Lindman, R., von der Pahlen, B., Ost, B., & Ericksson, C. J. P. (1992). Serum testosterone, cortisol, glucose, and
ethanol in males arrested for spouse abuse. Aggressive Behavior, 18, 393–400.
Mattson, A., Schalling, D., Olweus, D., Low, H., & Svensson, J. (1980). Plasma testosterone, aggressive behavior,
and personality dimensions in young male delinquents. Journal of the American Academy of Child Psychiatry,
19, 476–490.
Mazur, A. (1983). Hormones, aggression and dominance in humans. In B. Svare (Ed.), Hormones and aggressive
behavior (pp. 563–576). New York: Plenum.
Mazur, A., Susman, E. J., & Edelbrock, S. (1997). Sex differences in testosterone response to a video game.
Evolution and Human Behavior, 18, 317–326.
Meyer-Bahlburg, H. F. L., Nat, R., Boon, D. A., Sharma, M., & Edwards, J. A. (1974). Aggressiveness and
testosterone in man. Psychosomatic Medicine, 36, 269–274.
Monti, P. M., Brown, W. A., & Corriveau, D. P. (1977). Testosterone and components of aggressive and sexual
behavior in man. American Journal of Psychiatry, 134, 692–694.
Olweus, D. (1986). Aggression and hormones: Behavioral relationship with testosterone and adrenaline. In: D.
Block, J. Block, & M. Radke-Yarrow (Eds.), Development of antisocial and prosocial behavior (pp. 51–72).
Orlando, FL: Academic Press.
Olweus, D., Mattsson, A., Schalling, D., & Low, H. (1980). Testosterone, aggression, physical, and personality
dimensions in normal adolescent males. Psychosomatic Medicine, 42, 253–269.
Olweus, D., Mattsson, A., Schalling, D., & Low, H. (1988). Circulating testosterone levels and aggression in
adolescent males: A causal analysis. Psychosomatic Medicine, 50, 261–272.
J. Archer et al. / Aggression and Violent Behavior 10 (2005) 241–261 261
Orengo, C. A., Kunik, M. E., Ghusn, H., & Yudofsky, S. C. (1997). Correlation of testosterone with aggression in
demented elderly men. Journal of Nervous and Mental Diseases, 185, 349–351.
Paikoff, R. L., Brooks-Gunn, J., & Warren, M. P. (1991). Effects of girls’ hormonal status on depressive and
aggressive symptoms over the course of one year. Journal of Youth and Adolescence, 20, 191–215.
Persky, H., Smith, K. D., & Basu, G. K. (1971). Relation of psychologic measures of aggression and hostility to
testosterone production in man. Psychosomatic Medicine, 33, 265–277.
Quetelet, A. (1984). Research on the propensity for crime at different ages. (S.F. Sylvester, Trans.). Cincinnati,
OH: Anderson ((Original work published 1833)).
Quinsey, V. L. (unpublished data).Mating effort, antisociality, and testosterone (cited in ‘‘The relationship between
testosterone and aggression: A meta-analysis,’’ by Book et al., 2001, Aggression and Violent Behavior, 6).
Rejeski, W. J., Gagne, M., Parker, P. R., & Koritnik, D. R. (1989). Acute stress reactivity from contested
dominance in dominant and submissive males. Behavioral Medicine, 15, 118–124.
Rosenthal, R. (1984). Meta-analytic procedures for social research. Beverly Hills, CA: Sage.
Salvador, A., Simon, V., Suay, F., & Llorens, L. (1987). Testosterone and cortisol responses to competitive
fighting: A pilot study. Aggressive Behavior, 13, 9–13.
Scaramella, T. J., & Brown, W. A. (1978). Serum testosterone and aggressiveness in hockey players. Psychoso-
matic Medicine, 40, 262–265.
Scerbo, A. S., & Kolko, D. J. (1994). Salivary testosterone and cortisol in disruptive children: Relationship to
aggressive, hyperactive, and internalizing behaviors. Journal of the American Academy of Child and Adoles-
cent Psychiatry, 33, 1174–1184.
Schaal, N., Tremblay, R. E., Soussignan, R., & Susman, E. J. (1996). Male testosterone linked to high social
dominance but low physical aggression in early adolescence. Journal of the American Academy of Child and
Adolescent Psychiatry, 34, 1322–1330.
Schmidt, F. L. (1992). What do data really mean? Research findings, meta-analysis and cumulative knowledge in
psychology. American Psychologist, 47, 1173–1181.
Shirtcliff, E. A., Granger, D. A., & Likos, A. (2002). Gender differences in the validity of testosterone measured in
aliva by immunoassay. Hormones and Behavior, 42, 62–69.
Susman, E. J., Inoff-Germain, G., Nottelmann, E. D., Loriaux, D. L., Cutler Jr., G. B., & Chrousos, G. P. (1987).
Hormones, emotional dispositions, and aggressive attributes in young adolescents. Child Development, 58,
1114–1134.
Turner, A. K. (1994). Genetic and hormonal influences on male violence. In J. Archer (Ed.), Male violence
(pp. 233–252). New York: Routledge.
Udry, J. R. (1990). Biosocial models of adolescent problem behaviors. Social Biology, 37, 1–10.
Wang, M. C., & Bushman, B. J. (1999). Integrating results through meta-analytic review using SAS software.
Cary, NC: SAS Institute.
Related Documents