1 Testing times for international tourism As expected, the negative trend in international tourism that emerged during the second half of 2008 intensified in 2009. International tourist arrivals have suffered a sharp drop since January – of -8% overall for the first four months of the year. Moreover, this decline is expected to have continued through to the end of June, due to the sector’s strong first half-year performance in 2008. International Tourist Arrivals, monthly evolution World (million) Source: World Tourism Organization (UNWTO) © 40 50 60 70 80 90 100 110 Jan Feb Mar Apr May Jun Jul Aug Sep Oct Nov Dec 2006 2007 2008 2009* In absolute terms, the number of international tourist arrivals is estimated to have reached 247 million between January and April, down from 269 million in 2008 and close to the 254 million of 2007. So far the number of international tourist arrivals is 22 million short of last year’s volume. The first four months generally account for some 28% of the total annual number. Results reflect the severe impact of the global economic crisis and all the associated causes and effects, exacerbated in some regions by concerns about the outbreak of the influenza A(H1N1) virus. But the effect on tourism demand has been different from one region to another until now. With the exception of Africa, which is estimated to have seen a 3% growth, all regions recorded declines in arrivals from January through April, with the worst hit being Europe (-10%) and the Middle East (-18%). Asia and the Pacific was down an estimated 6% and the Americas 5%. And outside Africa, only one subregion, South America, bucked the general downward trend, registering a flat +0.2%. (Continued on page 5) Contents Quick overview of key trends 3 International Tourism Receipts 2008 5 World’s Top Tourism Destinations 2008 9 Outbound Tourism: International Tourism Expenditure 2008 12 Inbound Tourism: short-term tourism data 2009 14 World 14 Trends and Prospects 15 UNWTO Forecasts for 2009 18 Evaluation by UNWTO’s Panel of Tourism Experts 20 Regions 23 Europe 23 Asia and the Pacific 28 The Americas 32 Africa and the Middle East 37 In focus 40 UNWTO Affiliate Members 41 Transport 42 Hospitality 46 Meetings industry 49 The economic environment 50 UNWTO Panel of Tourism Experts Confidence hits rock bottom, but signs of a modest upturn Reflecting the dramatic fall in both consumer and business confidence since the middle of 2008 – and the resulting negative trend in international tourism performance almost all over the world so far in 2009 – the more than 300 specialists from over 100 countries and territories who constitute UNWTO’s Panel of Tourism Experts gave a rating of only 57 to their evaluation of world tourism during the first four months of this year. (Continued on page 20) UNWTO Panel of Tourism Experts Source: World Tourism Organization (UNWTO) © 25 50 75 100 125 150 175 T1 T2 '03 T3T1 T2 '04 T3T1 T2 '05 T3T1 T2 '06 T3T1 T2 '07 T3T1 T2 '08 T3T1 T2 '09 T3 Prospects Evaluation Much better Better Equal Worse Much worse Volume 7 • No. 2 • June 2009

Welcome message from author
This document is posted to help you gain knowledge. Please leave a comment to let me know what you think about it! Share it to your friends and learn new things together.
Transcript

1
Testing times for international tourism As expected, the negative trend in international tourism that emerged during the second half of 2008 intensified in 2009. International tourist arrivals have suffered a sharp drop since January – of -8% overall for the first four months of the year. Moreover, this decline is expected to have continued through to the end of June, due to the sector’s strong first half-year performance in 2008.
International Tourist Arrivals, monthly evolution World (million)
Source: World Tourism Organization (UNWTO) ©
40
50
60
70
80
90
100
110
Jan Feb Mar Apr May Jun Jul Aug Sep Oct Nov Dec
2006200720082009*
In absolute terms, the number of international tourist arrivals is estimated to have reached 247 million between January and April, down from 269 million in 2008 and close to the 254 million of 2007. So far the number of international tourist arrivals is 22 million short of last year’s volume. The first four months generally account for some 28% of the total annual number. Results reflect the severe impact of the global economic crisis and all the associated causes and effects, exacerbated in some regions by concerns about the outbreak of the influenza A(H1N1) virus. But the effect on tourism demand has been different from one region to another until now. With the exception of Africa, which is estimated to have seen a 3% growth, all regions recorded declines in arrivals from January through April, with the worst hit being Europe (-10%) and the Middle East (-18%). Asia and the Pacific was down an estimated 6% and the Americas 5%. And outside Africa, only one subregion, South America, bucked the general downward trend, registering a flat +0.2%. (Continued on page 5)
Contents Quick overview of key trends 3 International Tourism Receipts 2008 5 World’s Top Tourism Destinations 2008 9 Outbound Tourism: International Tourism Expenditure 2008 12 Inbound Tourism: short-term tourism data 2009 14 World 14 Trends and Prospects 15 UNWTO Forecasts for 2009 18 Evaluation by UNWTO’s Panel of Tourism Experts 20 Regions 23
Europe 23 Asia and the Pacific 28 The Americas 32 Africa and the Middle East 37
In focus 40 UNWTO Affiliate Members 41 Transport 42 Hospitality 46 Meetings industry 49
The economic environment 50
UNWTO Panel of Tourism Experts Confidence hits rock bottom, but signs of a modest upturn
Reflecting the dramatic fall in both consumer and business confidence since the middle of 2008 – and the resulting negative trend in international tourism performance almost all over the world so far in 2009 – the more than 300 specialists from over 100 countries and territories who constitute UNWTO’s Panel of Tourism Experts gave a rating of only 57 to their evaluation of world tourism during the first four months of this year. (Continued on page 20)
UNWTO Panel of Tourism Experts
Source: World Tourism Organization (UNWTO) ©
25
50
75
100
125
150
175
T1 T2'03
T3 T1 T2'04
T3 T1 T2'05
T3 T1 T2'06
T3 T1 T2'07
T3 T1 T2'08
T3 T1 T2'09
T3
Prospects
Evaluation
Muchbetter
Better
Equal
Worse
Muchworse
Volume 7 • No. 2 • June 2009
2
Volume 7 • No. 2 • June 2009
The UNWTO World Tourism Barometer is a publication of the World Tourism Organization (UNWTO). By monitoring short-term tourism trends on a regular basis, UNWTO aims to provide all those involved directly or indirectly in tourism with adequate up-to-date statistics and analysis in a timely fashion. The UNWTO World Tourism Barometer is published three times a year (in January, June and October). Each issue contains three regular sections: an overview of short-term tourism data from destination and generating countries and air transport; the results of the latest survey among the UNWTO Panel of Tourism Experts, providing an evaluation of and prospects for short-term tourism performance; and selected economic data relevant for tourism. The objective for future editions of the UNWTO World Tourism Barometer will be to broaden its scope and improve coverage gradually over time. The UNWTO World Tourism Barometer is prepared by UNWTO’s Market Trends, Competitiveness and Trade in Tourism Services Section, with the collaboration of consultants, Nancy Cockerell and David Stevens. The UNWTO Secretariat wishes to express its sincere gratitude to all those who have participated in the elaboration of the UNWTO World Tourism Barometer, in particular all institutions that supplied data, and to the members of the UNWTO Panel of Tourism Experts for their valuable contributions. For more information on the UNWTO World Tourism Barometer, including copies of previous issues, please refer to the Facts & Figures section on the UNWTO website at <www.unwto.org/facts/menu.html>. We welcome your comments and suggestions at <[email protected]>, tel +34 915678206 / fax +34 915678217.
Explanation of abbreviations and signs used * = provisional figure or data .. = figure or data not (yet) available | : change of series mn: million (1,000,000) bn: billion (1,000,000,000) Q1: January, February, March Q2: April, May, June Q3: July, August, September Q4: October, November, December T1: January, February, March, April T2: May, June, July, August T3: September, October, November, December YTD: Year to date, variation of months with data available compared with the same period of the previous year. The (sub)regional totals are approximations for the whole (sub)region based on trends for the countries with data available. Series International Tourist Arrivals TF: International tourist arrivals at frontiers (excluding same-day visitors); VF: International visitor arrivals at frontiers (tourists and same-day visitors); THS: International tourist arrivals at hotels and similar establishments; TCE: International tourist arrivals at collective tourism establishments; NHS: Nights of international tourists in hotels and similar establishments; NCE: Nights of international tourists in collective tourism establishments. Series International Tourism Receipts and Expenditure All percentages are derived from non-seasonally adjusted series in local currencies, unless otherwise indicated: $: US$; €: euro; sa: seasonally adjusted series.
The World Tourism Organization is a specialized agency of the United Nations and the leading international organization in the field of tourism. It serves as a global forum for tourism policy issues and a practical source of tourism know-how. Its membership includes 161 countries and territories and more than 350 Affiliate Members representing local governments, tourism associations and private sector companies including airlines, hotel groups and tour operators. Copyright © 2009 World Tourism Organization Calle Capitán Haya, 42, 28020 Madrid, Spain UNWTO World Tourism Barometer ISSN: 1728-9246 Published and printed by the World Tourism Organization, Madrid, Spain - First printing: 2009 (version 13/07/09) All rights reserved The designations employed and the presentation of material in this publication do not imply the expression of any opinions whatsoever on the part of the Secretariat of the World Tourism Organization concerning the legal status of any country, territory, city or area, or of its authorities, or concerning the delimitation of its frontiers or boundaries. All UNWTO publications are protected by copyright. Therefore and unless otherwise specified, no part of an UNWTO publication may be reproduced, stored in a retrieval system or utilized in any form or by any means, electronic or mechanical, including photocopying, microfilm, scanning, without prior permission in writing. UNWTO encourages dissemination of its work and is pleased to consider permissions, licensing, and translation requests related to UNWTO publications. For permission to photocopy UNWTO material, refer to the UNWTO website at www.unwto.org/pub/rights.htm. The contents of this issue may be quoted provided the source is given accurately and clearly. Distribution or reproduction in full is permitted for own or internal use only. Please do not post electronic copies on publicly accessible websites, UNWTO encourages you to include a link to the Facts & Figures section of the UNWTO website instead at <www.unwto.org/facts/menu.html>. World Tourism Organization Capitán Haya 42, 28020 Madrid, Spain Tel (34) 91 567 81 00 / Fax (34) 91 571 37 33 [email protected] www.unwto.org
Data collection for this issue was closed on 30 June. The next full issue of the UNWTO World Tourism Barometer will be published at the end of October 2009, and an Interim Update of tables is planned for mid September.

3
Volume 7 • No. 2 • June 2009
UNWTO World Tourism Barometer, June 2009 Quick overview of key trends International tourism 2008 • International tourist arrivals reached 922 million in 2008, up
1.9% on 2007 (updated). • International tourism receipts grew to US$ 944 billion (euro
642 billion) in 2008, corresponding to an increase in real terms of 1.8% on 2007, surprisingly close to the growth in arrivals.
• Receipts from international passenger transport are estimated at US$ 165 billion, bringing the total of international tourism receipts including international passenger transport (i.e. visitor exports) to US$ 1.1 trillion, or over US$ 3 billion a day.
• In 2008, there were only slight changes in the ranking of top tourism destinations by both international tourist arrivals and international tourism receipts. France continues to lead the ranking for arrivals, but ranks third in receipts. The USA ranks first in receipts and it regained its second position in arrivals from Spain that was lost after 11 September 2001. Spain now ranks third in arrivals but has firmly maintained its position as the second biggest earner worldwide and the first in Europe. China, fourth in arrivals, is fifth in terms of receipts, while the reverse is true for Italy.
• The top 10 ranking by international tourism spenders showed no major changes in 2008 apart from the fact that the Netherlands overtook the Republic of Korea, and now ranks 10th. The first nine places remain unchanged with Germany leading, followed by the USA, the UK, France and China.
International tourism January-April 2009 • Worldwide, international tourist arrivals declined by 8%
between January and April, thus continuing the downward trend that emerged in the second half of 2008.
• Growth was negative in all world regions, except for Africa (+5%), which bucked the global trend. Europe (-10%) and the Middle East (-18%) were the hardest hit regions. - In Europe (-10%), Central and Eastern destinations
were the most affected (-13%), but results for all other subregions were close to the average.
- Asia and the Pacific (-6%) lagged well behind its previous growth levels. By subregions, only Oceania (-4%) declined at below average rate while South Asia (-12%) shows the sharpest drop.
World Inbound Tourism: International Tourist Arrivals, 2008*
Source: World T ourism Organization (UNWTO) ©
Europe, 488 mn, 53%
Africa, 47 mn, 5%
Middle East, 56 mn, 6%
Americas, 147 mn, 16%Asia and the
Pacific, 184 mn, 20%
International tourist arrivals and receipts (% change 2008/2007)(local currencies, constant prices)
Source: World T ourism Organization (UNWTO) ©
1.90.1 1.2
3.0 4.1
18.2
1.8
-1.1
3.44.9
-2.0
16.8
-5
0
5
10
15
20
World Europe Asia andthe Pacific
Americas Africa Middle East
International Tourist ArrivalsInternational Tourism Receipts
World: Inbound TourismInternational Tourism Receipts, 2008 (US$ billion)
Source: World T ourism Organization (UNWTO) ©
Europe, 435 (51%)
Africa, 29 (3%)
Middle East, 35 (4%)
Americas, 171 (20%)
Asia and the Pacific, 187
(22%)

4
Volume 7 • No. 2 • June 2009
- Results for the Americas (-5%) were more mixed. Destinations in North America (-7%), the Caribbean (-6%) and Central America (-4%) have been more impacted by declining traffic from the USA and Europe, while South America (+0.2%) held up comparatively well, and was one of the few subregions, together with North and Subsaharan Africa, to show positive results.
- The Middle East (-18%) reports a sharp reversal of trends (data is still limited and very volatile though, and it is likely that this estimate will be revised) due in most part to the very strong decline for Saudi Arabia.
- Africa’s growth (+3%) was very positive compared with the world's performance overall. Results reflect the good performance of North African destinations as well as of some Sub-Saharan countries.
• Despite this overall decline, several destinations around the world still reported encouraging results for the first four months of 2009, notably Morocco, Tunisia, Kenya (which recovered the losses of previous years), Mexico, Cuba, Jamaica, several Central and South American destinations – Guatemala, Honduras, Nicaragua, Panama, Chile, Colombia, Paraguay and Uruguay – the Republic of Korea, Taiwan (Pr. of China), Malaysia, FYR of Macedonia, Serbia, Jordan, Lebanon and Syria.
• The slowdown in traffic through the first part of the year is confirmed by the air transport data reported by IATA and various regional air transport associations. According to IATA, there was an 8% decline in worldwide passenger traffic through May. Capacity was down by 4% while load factors declined to 72% from 76% for full year 2008.
• Hotel performance data for the first four months as reported by Deloitte also confirms these declining trends. Overall occupancy was down in all regions, and particularly in Asia Pacific (-10 percentage points). As consumers trade down, other indicators such as revenue per available room (revPAR) and average room rates show even more negative results. RevPAR (in US dollars) was down by double-digit rates in all world regions, and Asia destinations were again the most affected (-30%).
• The UNWTO Confidence Index is at the lowest level since its creation in 2003. The over 300 members of the UNWTO Panel of Experts gave the period January-April 2009 an overall ‘Evaluation’ of 57 – 20 points down from the previous period, September through December 2008.
Prospects • The volatile economic conditions, combined with additional uncertainties brought by the influenza A(H1N1), are expected
to continue taking their toll on demand for tourism – at least in the short term. • The UNWTO Panel of Experts is slightly less pessimistic for the current period May through August, at 69 – two points up
on the rating given for ‘prospects’ for the first four months at the beginning of the year – well after the start of the economic recession, but before the influenza A(H1N1) outbreak.
• As the economic environment has rapidly deteriorated since the January issue of the UNWTO World Tourism Barometer, UNWTO has revised its forecast for the full year of 2009. Prospects have been adjusted downwards and UNWTO now expects international tourism to decline by between -6% and -4% during this year. Africa is the only bright spot on the horizon with arrivals forecast to grow by 1% to 5%. For all other regions, growth is projected to be negative: Asia and the Pacific (-4% to -1%), Americas (-6% and -3%), Europe (-8% to -5%) and the Middle East (-10% to -5%).
• As at the beginning of the year, the situation continues to be exceptionally volatile. There are possibilities of a moderate recovery, but much will depend on the evolving economic conditions and of the restoration of consumer and business confidence. Additional uncertainty has been added by the influenza A(H1N1) outbreak and its uncertain development. UNWTO will continue to closely monitor developments to provide the most accurate analysis possible.
• For comprehensive information on UNWTO Tourism Resilience Committee and related activities, see www.unwto.org/trc.
International Tourist Arrivals, World(% change over same period of the previous year)
Source: World Tourism Organization (UNWTO) ©
6.2
4.5
2.83.9
7.9
0.0
2.9
-1.5
10.1
5.46.0 6.1
1.9
-6-4-202468
1012
96/95
97/96 98/97
99/98
00/99
01/00
02/01
03/02 04/03
05/04
06/05 07/06
08*/07
Forecast 2
009
Long-term average Tourism 2020 Vision

5
Volume 7 • No. 2 • June 2009
International Tourism Receipts 2008 International Tourism Receipts rose by 1.8% in 2008, virtually equalling the growth in arrivals With the large majority of destination countries having reported full year receipts data for 2008, UNWTO estimates that worldwide receipts from international tourism reached US$ 944 billion last year, up from US$ 857 billion in 2007. Last year’s substantial increase in absolute terms is, of course, to some degree a reflection of the further weakening of the US dollar which boosted receipts expressed in dollar terms (in 2008 the US dollar lost 7% against the euro, see further box and table below). Expressed in euro, receipts increased to 642 billion, up from 625 billion in 2007. In real terms, i.e. adjusted for exchange rate fluctuations and inflation, growth in international tourism receipts reached 1.8%. After the substantial growth in 2006 and 2007 – of over 5% in both years – this represents a considerable slowdown.
Growth of receipts versus arrivals As in previous years, the growth in International Tourism Receipts followed closely the growth in International Tourist Arrivals. After including revised and additional data, as well as a few revisions of series, the latest data is only marginally different from the preliminary results for arrivals reported in the January issue of the UNWTO World Tourism Barometer. According to the data currently available, international tourist arrivals rose by 1.9% in 2008 to 922 million. At 1.8%, the growth in international tourism receipts in 2008 measured in real terms was just one decimal percentage point below that of arrivals compared with a difference of one full percentage point the previous year. Over a longer period, there is a fairly close correlation between the growth in international arrivals and that of receipts. Receipts tend to follow the growth in international arrivals, but at only a slightly lesser pace of on average about one percentage point lower (see graph on next page).
World: Inbound TourismInternational Tourism Receipts (billion)
Source: World Tourism Organization (UNWTO) ©
405 439 443 445 458 475 464 482529
633680
744857 944
310 346 391 397 430515 518 509 468 509 547
593 625 642
0100200300400500600700800900
1000
1995
1996 1997 1998
1999
2000 2001 2002
2003
2004 2005 2006
2007 2008
US$euro
International passenger transport receipts What is reported by UNWTO as international tourism receipts refers to the earnings in destination countries from expenditure by international visitors on accommodation, food and drink, local transport, entertainment, shopping, etc. It does not include, however, earnings from inter-national passenger transport, which are reported separately. In simple terms, the latter category refers to receipts from international passenger transport services by companies registered in the reporting country rendered to residents of another country. It should be realised that it does not relate to all receipts from international passenger transport, but only to their export value, as many people travel with transport companies registered in their own country of residence (which is not included). (See box on page 7) Although the availability of comparable international data broken down at this level has its limitations, the export value of international passenger transport has in recent years been estimated at some 16% of the sum of international tourism and international passenger transport receipts. For 2008, this corresponds to some US$ 184 billion, as against US$ 164 billion in 2007. This takes total receipts from international tourism, including international passenger transport, to over US$ 1.1 trillion in 2008. In other words, over US$ 3 billion a day is earned by international tourism.
International Tourism Receipts, WorldInternational Tourism Receipts Change Change
current prices constant prices(billion) (%) (%)
1990 1995 2000 2001 2002 2003 2004 2005 2006 2007 2008* 05/04 06/05 07/06 08*/07 05/04 06/05 07/06 08*/07
Local currencies 6.3 8.8 8.9 6.9 3.1 5.3 5.4 1.8
US$ 264 405 475 464 482 529 633 680 744 857 944 7.4 9.5 15.1 10.2 3.9 6.1 11.9 6.2
Euro 207 310 515 518 509 468 509 547 593 625 642 7.4 8.5 5.5 2.7 5.1 6.1 3.2 -0.6
Source: World Tourism Organization (UNWTO) © (Data as collected by UNWTO June 2009)

6
Volume 7 • No. 2 • June 2009
In economic terms, both receipts from international tourism and from international passenger transport count as services exports and for many destinations they are a very important pillar of their economy, creating much needed
employment and opportunities for development. World-wide, as an export category, tourism ranks fourth after fuels, chemicals and automotive products, while for many developing countries it is the number one export category.
International tourist arrivals and receipts (local currencies, constant prices)World (% change over previous year)
Source: World Tourism Organization (UNWTO) ©
-6-4-202468
1012
1980 1982 1984 1986 1988 1990 1992 1994 1996 1998 2000 2002 2004 2006 2008*
Arrivals Receipts
International Tourism by (Sub)region
International Tourism Receipts International Tourist Arrivals
Change US$ euro Share abs. Change ShareLocal currencies, Receipts Receipts
constant prices (%) (billion) per arrival (billion) per arrival (%) (million) (%) (%)06/05 07/06 08*/07 2007 2008* 2008 2007 2008* 2008 2008* 2007 2008* 06/05 07/06 08*/07 2008*
World 5.3 5.4 1.8 857 944 1,020 625 642 700 100 904 922 6.0 6.1 1.9 100
Europe 4.2 2.7 -1.1 435.1 473.5 970 317.5 322.0 660 50.1 487.3 487.9 5.9 4.2 0.1 52.9
Northern Europe 9.3 3.9 -2.4 70.7 69.9 1,230 51.6 47.5 830 7.4 58.1 57.0 6.9 2.8 -1.9 6.2Western Europe 4.0 2.3 -2.5 149.6 162.0 1,060 109.2 110.2 720 17.2 154.9 153.2 4.9 3.5 -1.1 16.6
Central/Eastern Europe 8.3 8.8 2.7 48.4 58.0 590 35.4 39.4 400 6.1 96.5 98.9 4.6 5.5 2.5 10.7Southern/Mediter. Eu. 1.6 1.0 -0.5 166.3 183.7 1,030 121.4 124.9 700 19.4 177.9 178.9 7.2 4.6 0.6 19.4
Asia and the Pacific 11.1 9.9 3.4 187.0 207.6 1,130 136.4 141.1 770 22.0 181.9 184.1 8.0 9.7 1.2 20.0
North-East Asia 12.1 8.5 5.0 85.8 97.5 970 62.6 66.3 660 10.3 100.9 101.0 7.0 9.8 0.1 11.0South-East Asia 15.9 14.9 0.9 55.4 60.8 990 40.4 41.4 670 6.4 59.7 61.6 9.4 12.3 3.3 6.7
Oceania 1.3 8.1 2.5 32.0 34.1 3,070 23.4 23.2 2,090 3.6 11.2 11.1 0.2 1.7 -1.0 1.2South Asia 13.9 5.2 6.1 13.8 15.1 1,450 10.1 10.3 990 1.6 10.1 10.4 20.8 2.6 3.3 1.1
Americas 2.1 6.3 4.9 171.3 188.1 1,280 125.0 127.9 870 19.9 142.9 147.2 1.9 5.2 3.0 16.0
North America 0.8 7.2 7.0 124.9 138.5 1,420 91.1 94.2 960 14.7 95.3 97.8 0.8 5.2 2.6 10.6Caribbean 4.3 0.5 -3.2 23.2 23.5 1,160 16.9 16.0 790 2.5 19.8 20.3 3.4 1.6 2.4 2.2
Central America 10.5 8.9 -0.6 6.2 6.8 820 4.5 4.6 560 0.7 7.8 8.3 9.8 12.0 7.2 0.9South America 6.6 6.8 2.6 16.9 19.3 920 12.4 13.1 630 2.0 20.0 20.8 2.7 6.5 3.9 2.3
Africa 11.3 9.0 -2.0 29.0 30.2 640 21.2 20.5 440 3.2 45.1 47.0 11.1 8.9 4.1 5.1
North Africa 19.1 7.6 -5.1 10.2 10.6 620 7.5 7.2 420 1.1 16.3 17.2 8.4 8.5 5.4 1.9Subsaharan Africa 7.6 9.8 -0.3 18.8 19.6 660 13.7 13.3 450 2.1 28.8 29.7 12.8 9.1 3.4 3.2
Middle East 3.3 7.8 16.8 34.7 45.0 810 25.3 30.6 550 4.8 47.0 55.6 8.4 14.6 18.2 6.0
Source: World Tourism Organization (UNWTO) © (Data as collected by UNWTO June 2009)

7
Volume 7 • No. 2 • June 2009
World: Inbound Tourism, 2008Receipts from international tourism and passenger transport (US$ billion)
Source: World Tourism Organization (UNWTO) ©
International passenger transport
receipts: 184
International Tourism
Receipts: 944
Regional results In absolute terms, international tourism receipts increased by US$ 87 billion in 2008 (only 17 billion euro, though). In dollar terms, this amount is equal to the sum of the world’s fourth and fifth biggest tourism earners, Italy and China. All regions shared in this increase in absolute terms, though in some cases growth was negative in real terms (i.e. computed in local currencies at constant prices). Asia and the Pacific improved results by US$ 21 billion, to US$ 208 billion (a 22% market share), and the Americas added US$ 17 billion to US$ 188 billion, taking its share of global receipts to 20%. Europe increased receipts by US$ 38 billion to US$ 473 billion (in euro only by 4 billion to 322 billion) (50% of the world total), but suffered a negative growth of 1% in real terms. The Middle East increased receipts by US$ 10 billion, to US$ 45 billion (5% share), corresponding to a double-digit growth of 17% in real terms. Africa’s growth in receipts was US$ 1 billion to US$ 30 billion (a 3% share), but they declined by 2% in real terms. Except for the Middle East, the relative growth in real terms in all regions was weaker in 2008 than the year before. In terms of subregions, the strongest increases came from North America (+7%), South Asia (+6%) and North-East Asia (+5%). In Northern and Western Europe, North and Subsaharan Africa, the Caribbean and Central America, receipts declined in real terms in 2008. In the case of North Africa, Subsaharan Africa, and Central America, the decline followed previous strong growth years. Also among subregions, there is a reasonable correlation between growth in international arrivals and in receipts. Growth in receipts surpassed that of arrivals in Central and Eastern Europe, North-East Asia, Oceania, South Asia and North America, however. In North-East Asia, the case of China is interesting, as arrivals suffered a decline of 3%, while receipts grew by 10%. This might be attributable to the Olympics, as large events often boost
receipts rather more than arrivals. In North America, an attractive US dollar vis-a-vis strong currencies such as the euro could have led to an increase of expenditure, as international tourism receipts grew by 14% with only a 3% increase in arrivals. Central America, North Africa and Subsaharan Africa are exceptions at the other end of the spectrum, as receipts growth in real terms lagged somewhat behind arrivals growth.
About receipts and expenditure data For destination countries, receipts from international tourism count as exports and cover all transactions related to the consumption by international visitors of, for example, accommodation, food and drink, fuel, domestic transport, entertainment, shopping, etc. They include transactions generated by same-day as well as overnight visitors. Receipts from same-day visitors can be substantial, especially in the case of neighbouring countries where a lot of shopping for goods and services is carried out by cross-border, same-day visitors. However, the values reported as international tourism receipts do not include receipts from international passenger transport contracted from companies outside the travellers’ countries of residence, which are reported in a separate category. With financial data measured in different currencies it is fairly complicated to accurately determine variations in relative terms, as receipts have to be expressed in a common currency like the US dollar or the euro and generally are also reported at current prices, thus not taking account of exchange rate fluctuations and inflation. In 2008 the dollar depreciated 7% against the euro and in 2007 8%, while over the two years 2005 and 2006, the US dollar and the euro maintained a fairly steady exchange rate, although both currencies did fluctuate against a range of other currencies. On average for the year, in 2008 one euro exchanged at US$ 1.4708, in 2007 at 1.3705 in 2006 at 1.2556 and in 2005 at 1.2441 (or 1 US$ to 0.6799 euro on average for 2008, 0.7297 euro in 2007, 0.7964 euro in 2006 and 0.8038 euro in 2005). In order to account for exchange rate changes and inflation, international tourism receipts in US dollar values were computed back to the local currencies of each destination, weighted by the share in the total, and deflated by the corresponding rate of inflation. Although in this way data are made comparable, care should nevertheless be taken in interpreting the trends, as statistics, in most cases, are still provisional and subject to revision. For the totals, an assessment is made by UNWTO for countries that have not yet reported results, based on the previous year’s value and the trend for the (sub)region. Unlike arrivals, where revisions generally more or less balance out, receipts data tends to be revised upwards.

8
Volume 7 • No. 2 • June 2009
International tourist arrivals and receipts (local currencies, constant prices)World and subregions (% change 2008/2007)
Source: World Tourism Organization (UNWTO) ©
-6-4-202468
1012141618
World
Northern Europe
Western E
urope
Central/
Eastern E
urope
Souther
n/Medit
er. Eu.
North-East
Asia
South-East
AsiaOcea
nia
South A
sia
North Americ
a
Caribbean
Central A
merica
South A
merica
North Afric
a
Subsaha
ran Africa
Middle East
International Tourist ArrivalsInternational Tourism Receipts
World and regions: Inbound tourismInternational Tourist Arrivals (million) International Tourism Receipts (US$ billion)
WorldWorld
Europe Europe
Asia and the PacificAsia and the Pacific Americas
Americas
Middle East Middle EastAfrica Africa
Source: World Tourism Organization (UNWTO) © Source: World Tourism Organization (UNWTO) ©
0
100
200
300
400
500
600
700
800
900
1000
1995 1996 1997 1998 1999 2000 2001 2002 2003 2004 2005 2006 20072008*0
100
200
300
400
500
600
700
800
900
1000
1995 1996 1997 1998 1999 2000 2001 2002 2003 2004 2005 2006 20072008*

9
Volume 7 • No. 2 • June 2009
World’s Top Tourism Destinations 2008 When ranking destinations for international tourism, it is always preferable to take more than just one indicator into account. Ranked according to the two key tourism indicators – international tourist arrivals and international tourism receipts – it is interesting to note that eight of the top ten destinations appear in both lists, even though they show marked differences in terms of the type of tourists they attract, as well as their average length of stay and their spending per trip and per night. In 2008, there have been only slight changes in the ranking by both international tourist arrivals and international tourism receipts. The first three places are still occupied by the USA, Spain and France, albeit in a different order. France continues to lead the ranking of the world’s major tourism destinations for arrivals (79 million tourists), but ranks third in receipts. The USA ranks first in receipts with US$ 110 billion and it regained the second position in arrivals from Spain that was lost after 11 September 2001. Spain now ranks third in arrivals but has
firmly maintained its position as the second biggest earner worldwide and the first in Europe. China, fourth in arrivals, is still fifth in terms of receipts, while the reverse is true for Italy. The UK ranks sixth in arrivals and seventh in receipts, in which it was surpassed by Germany, which now ranks sixth (ninth in arrivals). Turkey has moved up one rank in both arrivals, to eight, and receipts, to ninth. In arrivals, the top ten ranking is completed by Ukraine (7) and Mexico (10) and in receipts by Australia (8) and Austria (10). The top ten tourism earners last year accounted for 49% of the total estimated US$ 944 billion of international tourism receipts. Their respective share of international tourist arrivals was slightly lower, at 45%. The tables in this section list the first 50 destinations in terms of arrivals and receipts. For values of other countries with data available, see the tables on the regions on pages 23-40.
International Tourist Arrivals (million) International Tourism Receipts (US$ billion)
France United States
United StatesSpain
China
Spain
Italy France
ItalyChina
United Kingdom GermanyUkraine United KingdomTurkeyGermanyMexico Australia
TurkeyAustria
Source: World Tourism Organization (UNWTO) © Source: World Tourism Organization (UNWTO) ©
0
10
20
30
40
50
60
70
80
90
'95 '96 '97 '98 '99 '00 '01 '02 '03 '04 '05 '06 '07 '080
20
40
60
80
100
120
'95 '96 '97 '98 '99 '00 '01 '02 '03 '04 '05 '06 '07 '08

10
Volume 7 • No. 2 • June 2009
International Tourist Arrivals by Country of DestinationMonthly or quarterly data series
Full year (% change over same period of the previous year)Series 1995 2000 2005 2006 2007 2008* 06/05 07/06 08*/07 Series 2009* 2008*
(million) (%) YTD Q1 Jan Feb Mar Apr May Q1 Q2 Q3 Q4
World 534 684 804 852 904 922 6.0 6.1 1.9 -8.4 -10.6 -7.8 -10.3 -13.3 -2.3 8.6 3.9 -0.6 -2.4
1 France TF 60.0 77.2 75.9 78.9 81.9 79.3 3.9 3.8 -3.2 THS -12.6 -5.9 -18.1 6.1 -3.7 -6.3 -5.22 United States TF 43.5 51.2 49.2 51.0 56.0 58.0 3.6 9.8 3.6 TF(1) -14.3 -14.3 -9.1 -11.5 -19.9 15.4 7.6 3.2 -6.03 Spain TF 34.9 46.4 55.9 58.0 58.7 57.3 3.7 1.1 -2.3 TF -11.8 -16.3 -9.8 -15.9 -20.8 -1.7 -11.7 5.2 1.3 -5.1 -9.04 China TF 20.0 31.2 46.8 49.9 54.7 53.0 6.6 9.6 -3.1 TF -9.0 -11.3 -10.8 -7.9 -14.6 -3.2 -8.2 9.6 -3.0 -9.3 -7.75 Italy TF 31.1 41.2 36.5 41.1 43.7 42.7 12.4 6.3 -2.1 TF -5.4 -5.4 -6.5 -3.3 -6.3 -2.6 2.6 -3.7 -5.16 United Kingdom TF 21.7 23.2 28.0 30.7 30.9 30.2 9.3 0.7 -2.2 VF -10.0 -12.7 -9.1 -20.1 -9.7 -2.6 6.8 -1.0 -1.9 -13.17 Ukraine TF 3.7 6.4 17.6 18.9 23.1 25.4 7.4 22.1 9.8 TF -19.9 -19.9 12.3 12.3 12.3 1.18 Turkey TF 7.1 9.6 20.3 18.9 22.2 25.0 -6.7 17.6 12.3 TF -1.5 -4.5 -4.0 0.5 -8.2 4.5 -1.8 14.6 17.4 9.4 10.09 Germany TCE 14.8 19.0 21.5 23.6 24.4 24.9 9.6 3.6 1.9 TCE -8.6 -8.8 -9.0 -9.9 -7.5 -8.1 5.4 4.3 0.8 -2.1
10 Mexico TF 20.2 20.6 21.9 21.4 21.4 22.6 -2.6 0.1 5.9 TF 5.9 7.7 14.3 10.8 -0.6 0.2 5.4 2.9 6.5 9.111 Malaysia TF 7.5 10.2 16.4 17.5 21.0 22.1 6.8 19.5 5.1 TF 3.4 2.2 5.1 -7.4 8.6 7.0 1.2 3.9 8.2 7.512 Austria TCE 17.2 18.0 20.0 20.3 20.8 21.9 1.6 2.5 5.6 TCE -2.6 -8.7 12.8 -5.8 -29.5 42.2 13.7 -0.6 2.6 4.213 Russian Federation TF .. .. 19.9 20.2 .. .. 1.3 .. .. VF -10.8 -10.8 3.4 6.2 8.8 -6.314 Hong Kong (China) TF .. 8.8 14.8 15.8 17.2 17.3 7.1 8.4 1.0 TF -2.5 0.6 7.0 -9.1 3.4 1.5 -16.0 5.3 4.1 -2.2 -2.315 Canada TF 16.9 19.6 18.8 18.3 17.9 17.1 -2.7 -1.8 -4.5 TF -4.7 -8.2 -3.0 -7.6 -12.8 4.0 -1.9 -4.9 -4.6 -5.616 Greece TF 10.1 13.1 14.8 16.0 17.5 .. 8.6 9.2 .. TCE -26.3 -25.8 -26.8 5.7 -5.4 -5.0 -9.417 Saudi Arabia TF 3.3 6.6 8.0 8.6 11.5 14.8 7.3 33.8 28.0 TF -60.1 -60.1 -79.5 -49.0 -20.6 53.6 75.1 -21.8 27.018 Thailand TF 7.0 9.6 11.6 13.8 14.5 14.6 19.5 4.6 0.8 TF -14.8 -15.8 -11.9 -23.2 -12.1 -11.2 12.9 13.6 -3.4 -18.019 Poland TF 19.2 17.4 15.2 15.7 15.0 13.0 3.1 -4.4 -13.5 TF -18.6 -18.6 -8.6 -11.2 -15.9 -17.320 Portugal TF 9.5 12.1 10.6 11.3 12.3 .. 6.3 9.2 .. TCE -13.6 -21.3 -13.3 -21.4 -25.4 2.0 21.1 3.8 1.4 -8.421 Egypt TF 2.9 5.1 8.2 8.6 10.6 12.3 4.9 22.7 15.9 VF -9.5 -13.4 -12.4 -13.2 -14.3 -2.4 -6.0 25.1 22.6 15.1 3.722 Macao (China) TF 4.2 5.2 9.0 10.7 9.6 10.6 18.5 -9.9 10.2 TF -9.1 -8.3 1.0 -17.0 -8.3 0.5 -21.1 17.3 16.7 7.4 1.023 Netherlands TCE 6.6 10.0 10.0 10.7 11.0 10.1 7.3 2.5 -8.2 TCE -14.8 -14.8 -8.6 -12.1 -21.3 0.8 -11.8 -9.0 -10.124 South Africa TF 4.5 5.9 7.4 8.4 9.1 9.6 13.9 8.3 5.5 VF -2.2 -2.2 5.8 -2.9 -9.6 12.0 3.8 1.1 5.725 Croatia TCE 1.5 5.8 8.5 8.7 9.3 9.4 2.3 7.5 1.2 TCE -4.1 -20.0 10.2 -12.2 -33.9 8.1 29.9 0.4 0.6 -0.826 Hungary TF 2.9 .. 10.0 9.3 8.6 8.8 -7.2 -6.7 2.0 TF 0.4 0.4 4.6 1.4 -1.1 5.927 Switzerland THS 6.9 7.8 7.2 7.9 8.4 8.6 8.8 7.4 1.9 THS -8.3 -9.7 -3.3 -11.1 -13.4 -3.6 9.2 2.7 0.4 -4.328 Japan VF 3.3 4.8 6.7 7.3 8.3 8.4 9.0 13.8 0.0 VF -27.0 -27.2 -18.4 -41.3 -22.3 -19.7 -34.0 10.6 9.3 -2.0 -16.029 Ireland TF 4.8 6.6 7.3 8.0 8.3 8.0 9.1 4.1 -3.7 TF -6.3 -9.1 -2.9 -5.5 -16.0 0.6 4.3 1.3 -6.6 -5.230 Morocco TF 2.6 4.3 5.8 6.6 7.4 7.9 12.2 12.9 6.4 TF 9.8 4.4 7.9 7.6 -0.5 23.9 14.4 10.5 1.2 5.431 Singapore TF 6.1 6.1 7.1 7.6 8.0 7.8 7.2 4.9 -2.2 VF -12.1 -13.6 -12.8 -15.1 -13.1 -6.1 -13.0 6.8 -0.2 -4.5 -7.832 Untd Arab Emirates THS 2.3 3.9 7.1 .. .. .. .. .. .. THS(2) 3.0 3.0 5.7 9.7 2.2 14.533 Belgium TCE 5.6 6.5 6.7 7.0 7.0 7.1 3.7 0.7 0.6 TCE -8.0 -6.0 -9.6 1.8 2.4 -0.3 -1.534 Tunisia TF 4.1 5.1 6.4 6.5 6.8 7.0 2.7 3.2 4.2 TF 1.3 -0.9 1.9 2.1 -5.0 8.8 -1.1 6.2 4.8 0.6 9.535 Korea, Republic of VF 3.8 5.3 6.0 6.2 6.4 6.9 2.2 4.8 6.9 VF 18.7 24.3 25.3 25.7 22.2 20.8 0.8 12.0 6.3 4.0 5.936 Czech Rep TCE 3.4 4.8 6.3 6.4 6.7 6.6 1.6 3.8 -0.5 TCE -17.1 -17.1 -8.8 -20.6 -20.3 6.8 -0.4 -0.4 -6.337 Indonesia TF 4.3 5.1 5.0 4.9 5.5 6.2 -2.6 13.0 13.2 TF(1) -2.4 0.0 8.0 -9.4 1.8 -10.0 15.7 8.1 13.1 16.238 Sweden TCE 2.3 3.8 4.9 4.7 5.2 .. -3.2 10.5 .. THS(3) -7.1 -9.7 -10.7 -14.3 -4.4 0.3 10.5 5.0 -7.9 -2.739 Bulgaria TF 3.5 2.8 4.8 5.2 5.2 5.8 6.6 -0.1 12.2 TF -4.4 -6.6 -7.6 -5.2 -6.8 -0.1 15.5 17.9 12.3 -0.140 Australia VF 3.7 4.9 5.5 5.5 5.6 5.6 0.6 2.0 -1.1 VF -1.1 -3.5 2.7 -7.3 -4.9 7.4 0.4 -1.7 -0.4 -2.741 India TF 2.1 2.6 3.9 4.4 5.1 5.4 13.5 14.3 5.6 TF -10.6 -13.8 -17.6 -10.6 -12.8 -3.4 -1.9 12.2 9.3 8.6 -4.942 Brazil TF 2.0 5.3 5.4 5.0 5.0 5.1 -6.4 0.2 0.5 TF43 Denmark TCE .. 3.5 4.7 4.7 4.7 .. -1.0 0.6 .. NCE(1) -12.5 -35.6 -20.0 -19.0 -48.5 37.6 25.1 -7.9 -8.8 -1.744 Argentina TF 2.3 2.9 3.8 4.2 4.6 4.7 9.2 9.3 2.3 TF -8.9 -8.9 5.2 3.1 5.6 -4.345 Bahrain TF 1.4 2.4 3.9 4.5 4.9 .. 15.5 9.2 .. VF 10.5 77.5 3.5 1.246 Norway TF 2.9 3.1 3.8 4.1 4.4 4.4 6.4 7.5 1.4 THS -10.5 -9.3 -4.0 -9.2 -13.6 -14.1 -1.3 -0.5 -10.7 -3.947 Vietnam VF 1.4 2.1 3.5 3.6 4.2 4.2 3.0 18.0 0.2 VF -18.8 -16.1 -17.7 -1.4 -26.8 -16.8 -28.5 6.4 10.0 -1.5 -13.848 Dominican Rp TF 1.8 3.0 3.7 4.0 4.0 4.0 7.4 0.4 0.0 TF -3.7 -5.2 -2.4 -6.4 -6.8 -3.2 2.4 6.8 3.2 -4.5 -7.349 Puerto Rico TF 3.1 3.3 3.7 3.7 3.7 3.9 1.0 -0.9 5.6 THS(3) -10.0 -10.0 -4.1 -12.3 -12.9 -0.5 -4.6 -0.2 -4.850 Taiwan (pr. of China) VF 2.3 2.6 3.4 3.5 3.7 3.8 4.2 5.6 3.5 VF 13.9 2.2 -6.9 -3.8 15.5 48.1 16.4 8.3 2.9 4.2 -0.8
Source: World Tourism Organization (UNWTO) © (Data as collected by UNWTO June 2009)See box at page 2 for explanation of abbreviations and signs used

11
Volume 7 • No. 2 • June 2009
International Tourism ReceiptsMonthly or quarterly data series
US$ Local currencies, current prices (% on previous year)1995 2000 2005 2006 2007 2008* Series 06/05 07/06 08*/07 2009* 2008*
(billion) YTD Q1 Jan Feb Mar Apr May Q1 Q2 Q3 Q4
World 405 475 680 744 857 944
1 United States 63.4 82.4 81.8 85.7 96.7 110.1 sa 4.8 12.8 13.8 -13.2 -11.9 -6.7 -9.8 -18.9 -17.1 24.2 21.7 13.9 -2.82 Spain 25.4 30.0 48.0 51.1 57.6 61.6 5.6 3.3 -0.4 -17.2 -17.2 -13.3 -17.8 -20.4 5.4 1.3 0.2 -8.03 France 27.4 30.8 44.0 46.3 54.3 55.6 4.3 7.3 -4.6 -3.5 -3.1 3.8 -0.2 -11.3 -4.4 1.8 1.4 -11.4 -3.54 Italy 28.7 27.5 35.4 38.1 42.7 45.7 6.7 2.5 -0.1 -8.9 -8.9 -6.2 -11.4 -9.2 1.8 1.2 2.0 -7.75 China 8.7 16.2 29.3 33.9 37.2 40.8 $ 15.9 9.7 9.7 -12.9 -15.4 -19.0 -9.2 -17.2 -10.0 -8.7 13.1 -3.7 -12.9 -4.16 Germany 18.0 18.7 29.2 32.8 36.0 40.0 11.4 0.7 3.5 -8.9 -8.1 -2.8 -10.8 -10.5 -10.9 2.1 3.8 2.5 5.57 United Kingdom 20.5 21.9 30.7 34.6 38.6 36.0 sa 11.5 2.6 1.6 -4.6 -4.6 2.5 9.5 -1.8 -3.48 Australia 8.1 9.3 16.9 17.8 22.3 24.7 7.3 12.5 10.3 11.0 10.3 13.6 7.4 10.4 12.9 11.4 13.2 7.4 9.69 Turkey 5.0 7.6 18.2 16.9 18.5 22.0 $ -7.2 9.7 18.7 -6.0 -11.1 -9.7 -9.9 -13.2 7.7 28.4 25.9 14.4 16.3
10 Austria 12.9 9.8 16.1 16.6 18.9 21.8 2.7 4.0 7.5 -10.5 -10.5 14.7 1.0 3.0 4.811 Thailand 8.0 7.5 9.6 13.4 16.7 17.7 31.8 13.3 2.2 -19.0 -19.0 17.2 17.3 0.4 -21.212 Greece 4.1 9.2 13.7 14.3 15.5 17.1 2.9 -0.3 2.8 -11.6 -18.2 -16.7 -24.1 -15.1 -2.2 7.8 8.5 1.5 -4.713 Hong Kong (China) 7.8 5.9 10.3 11.6 13.8 15.3 12.9 18.7 11.0 2.3 2.3 13.9 14.2 14.0 4.014 Malaysia 4.0 5.0 8.8 10.4 14.0 15.3 14.1 26.3 5.5 0.6 0.6 1.3 4.0 8.2 8.815 Canada 7.9 10.8 13.8 14.6 15.3 15.1 -0.4 -0.8 -2.1 -2.2 -2.2 0.8 -3.4 -3.5 -0.616 Switzerland 8.3 6.6 10.0 10.8 12.2 14.4 8.6 8.0 6.3 -0.9 -0.9 8.7 7.9 5.4 3.317 Macao (China) 3.1 3.2 8.0 9.8 13.6 .. 23.0 39.118 Netherlands 6.6 7.2 10.5 11.3 13.3 13.4 7.3 7.4 -6.3 -18.9 -18.9 11.6 -11.4 -8.8 -13.119 Mexico 6.2 8.3 11.8 12.2 12.9 13.3 $ 3.2 5.5 3.4 -7.6 -8.5 -7.5 -7.5 -10.5 -4.1 5.7 6.8 4.8 -3.820 Sweden 3.5 4.1 7.4 9.1 12.0 12.5 21.1 21.0 1.4 14.4 14.4 -1.9 -10.8 8.6 10.821 Belgium 4.5 6.6 9.9 10.3 10.9 12.4 3.4 -3.0 6.0 -21.2 -21.2 1.9 -33.3 -30.5 1.9 16.8 4.5 -0.722 Russian Federation 4.3 3.4 5.9 7.6 9.6 11.9 $ 30.0 25.9 24.3 45.6 32.0 25.1 1.123 India 2.6 3.5 7.5 8.6 10.7 11.8 18.4 13.4 16.0 -6.8 -13.2 -15.4 -12.3 -11.9 7.6 8.7 18.2 18.1 16.8 6.524 Poland 6.6 5.7 6.3 7.2 10.5 11.7 10.2 29.8 -3.5 3.1 3.1 -6.3 3.1 -8.9 -0.625 Egypt 2.7 4.3 6.9 7.6 9.3 11.0 $ 10.8 22.6 18.1 -17.2 -17.2 39.3 42.6 15.2 -10.026 Croatia 1.3 2.8 7.5 7.9 9.3 11.0 € 4.9 7.3 10.5 -6.0 -6.0 17.3 15.8 6.9 19.927 Portugal 4.8 5.2 7.7 8.4 10.1 10.9 7.6 10.9 0.5 -10.6 -15.0 -9.6 -15.4 -18.9 0.1 8.7 1.2 -0.7 -4.228 Japan 3.2 3.4 6.6 8.5 9.3 10.8 34.8 11.6 1.8 -20.5 -22.1 -14.7 -34.2 -17.7 -16.2 10.9 8.3 -1.2 -9.629 Singapore 7.6 5.1 6.2 7.5 9.2 10.6 15.8 15.3 8.4 0.8 0.8 23.7 7.9 5.1 -0.330 Saudi Arabia .. .. 5.4 5.0 5.2 9.7 -8.6 5.4 86.1 -39.9 -39.9 -72.3 14.7 12.2 34.1 170 29.8 27531 Korea, Republic of 5.2 6.8 5.8 5.8 6.1 9.1 $ -0.3 6.1 47.9 43.1 49.9 63.0 98.6 9.2 22.4 38.7 30.4 28.6 85.932 Czech Rep 2.9 3.0 4.7 5.5 6.6 7.7 11.7 7.5 -2.0 -7.1 -7.1 10.0 -1.9 -10.8 -4.133 South Africa 2.1 2.7 7.3 7.9 8.4 7.6 sa 14.4 11.2 6.0 3.1 3.1 7.6 6.9 6.5 3.034 Indonesia 5.2 5.0 4.5 4.4 5.3 7.4 $ -1.6 20.2 38.0 -14.5 -14.5 40.9 31.7 37.8 41.635 Morocco 1.3 2.0 4.6 6.0 7.2 7.1 28.1 11.8 -5.6 -18.7 -21.0 -19.5 -24.3 -19.8 -12.3 -0.9 9.3 -8.5 -17.636 Denmark 3.7 3.7 5.3 5.6 6.2 6.7 4.5 2.4 0.7 -8.8 -8.8 7.8 -0.1 -3.1 3.137 Ireland 2.3 2.6 4.8 5.3 6.1 6.3 10.2 3.9 -3.3 -13.4 -13.4 -0.3 1.0 -3.6 -10.638 Untd Arab Emirates 0.6 1.1 3.2 5.0 6.1 .. 54.5 21.939 Hungary 3.0 3.8 4.1 4.2 4.7 6.0 € 2.0 2.3 18.9 10.9 10.9 10.4 12.9 25.2 23.040 Brazil 1.0 1.8 3.9 4.3 5.0 5.8 $ 11.8 31.9 16.8 -12.5 -11.5 -16.7 -12.5 -4.7 -11.6 -17.0 20.7 17.0 22.4 7.941 Ukraine 0.2 0.4 3.1 3.5 4.6 5.8 $ 11.5 31.9 -0.6 -32.4 -32.4 36.9 37.8 28.2 -8.942 Taiwan (pr. of China) 3.3 3.7 5.0 5.1 5.2 5.2 $ 3.2 1.5 -0.6 17.5 17.5 -2.7 -1.0 -1.7 2.843 Lebanon .. .. 5.5 5.0 5.0 .. $ -10.2 0.6 ..44 New Zealand 2.3 2.3 5.2 4.7 5.4 4.9 -0.5 0.6 -4.9 -1.5 -1.5 -4.1 -1.0 -6.2 -8.345 Norway 2.4 2.2 3.5 3.8 4.5 4.7 7.5 7.8 0.8 -13.5 -13.5 5.8 6.6 -0.9 -1.746 Argentina 2.2 2.9 2.7 3.3 4.3 4.6 $ 22.5 29.0 7.4 -11.5 -11.5 3.0 17.1 27.3 -4.947 Luxembourg 1.7 1.8 3.6 3.6 4.0 4.5 -0.9 1.9 4.0 1.1 1.1 8.6 5.1 4.0 -0.848 Philippines 1.1 2.2 2.3 3.5 4.9 4.4 $ 54.6 40.8 -11.0 -35.6 -35.6 -31.5 -38.4 -36.8 -0.5 0.7 -18.7 -22.749 Dominican Rp 1.6 2.9 3.5 3.9 4.1 4.2 $ 11.3 3.8 2.8 -7.9 -7.9 3.3 6.3 1.8 -1.050 Bulgaria 0.8 1.1 2.4 2.6 3.1 3.8 7.3 9.8 13.7 -3.1 -8.8 -8.9 -8.4 -8.9 12.0 12.8 13.6 11.7 -0.1
Source: World Tourism Organization (UNWTO) © (Data as collected by UNWTO June 2009)See box at page 2 for explanation of abbreviations and signs used

12
Volume 7 • No. 2 • June 2009
Outbound Tourism International tourism expenditure 2008 Emerging source markets go from strength to strength In spite of the overall cooling of tourism growth in the second half of last year, emerging source markets again turned in some of the best performances (measured in local currencies, at current prices) during 2008, with many registering growth rates of over 20% – Brazil (+34% in US dollar terms), Hungary (+28%), South Africa (+27%), India (+23%), Bulgaria and Ukraine (both +22%) and China and Saudi Arabia (+21%).
International Tourism Expenditure (US$ billion)
Germany
United States
United Kingdom
France
China
ItalyJapanCanadaRussian FederationNetherlands
Source: World Tourism Organization (UNWTO) ©
0
10
20
30
40
50
60
70
80
90
100
'95 '96 '97 '98 '99 '00 '01 '02 '03 '04 '05 '06 '07 '08
Among the world’s top ten spenders, apart from China, the Russian Federation did particularly well (+12%), as did France (+10%) and Canada (+8%). Only one market, Japan, recorded negative growth (-8%) – and for the second consecutive year. Among the other source countries in the top ten, Germany, the world’s top spender, turned in the weakest performance (+2%), with the remainder achieving increases of between 4% and 6% for
the year. By contrast, one of the most dynamic source markets in recent years lost strength in 2008 – expenditure in international travel by the Republic of Korea declined by as much as 22% and the country now ranks 13th, down from tenth position in 2007. No major changes in the top ten The ranking of international tourism spenders shows no major changes in 2008 apart from the fact that the Netherlands overtook the Republic of Korea and now ranks 10th instead of 12th. The first nine places remain unchanged with Germany leading (US$ 91 billion), followed by the USA (US$ 80 bn), the UK (US$ 69 bn), France (US$ 43 bn) and China (US$ 36 bn). As usual, it should be noted that, while the absolute volumes of international tourism expenditure are expressed in US dollars to facilitate comparative analysis, the year-to-date changes are expressed in local currencies at current prices – so exchange rate fluctuations are accounted for but inflation is not. Exchange rate fluctuations – particularly between the US dollar and euro – render comparisons in US dollars rather misleading. Attention should be paid to the fact that due to the continued depreciation of the US currency during 2008, expenditure from European source markets in particular has been magnified in dollar terms. International tourism expenditure 2009 YTD Shrinking demand evident in expenditure figures Some 50 countries around the world each generate at least US$ 2 billion in international tourism spending annually. From those, among the 43 countries that have so far reported data on international tourism expenditure for the first three to five months of 2009, there is, as is the case with international tourist arrivals, a clear downward trend. Of those that have reported trends, only ten have managed to accomplish any growth, while 13 source markets recorded double-digit drops in expenditure on tourism abroad (as expressed in local currencies). And, some by 20% or more – Spain, the Republic of Korea, Brazil, Taiwan (Pr. of China) and Israel. Caution must used in interpreting the trends as results for Korea, Brazil and Taiwan (pr. of China) are reported in US dollars, and so the percentage change is exacerbated by the depreciation of the respective currencies. Among the top spenders, Germany (-2%) and Italy (-2%) performed comparatively better than the USA (-9%), France (-10%), Japan (-5%) and Canada (-6%). It is noteworthy that expenditure on international tourism by residents of the Netherlands was up by 4%, one of the best performances among countries with data available.

13
Volume 7 • No. 2 • June 2009
International Tourism ExpenditureMonthly or quarterly data series
US$ Local currencies, current prices (% on previous year)1995 2000 2005 2006 2007 2008* Series 06/05 07/06 08/07 2009*
(billion) YTD Q1 Jan Feb Mar Apr May Q1 Q2 Q3 Q4
World 405 475 680 744 857 944
1 Germany 60.2 53.0 74.4 73.9 83.1 91.2 -1.5 2.9 2.3 -2.4 -5.1 -5.1 -4.5 -5.6 5.6 6.4 2.7 0.7 1.02 United States 44.9 64.7 69.0 72.1 76.4 79.7 sa 4.5 5.9 4.4 -8.7 -7.9 -6.1 -7.3 -10.4 -11.1 9.3 7.0 3.0 -1.13 United Kingdom 24.9 38.4 59.6 63.1 71.4 68.5 sa 4.6 4.1 4.4 -13.0 -13.0 13.6 4.2 4.6 -4.34 France 16.3 17.8 30.5 31.2 36.7 43.1 1.1 7.9 9.6 -9.9 -14.7 -11.4 -21.4 -11.2 0.0 13.5 16.5 0.1 12.95 China 3.7 13.1 21.8 24.3 29.8 36.2 $ 11.8 22.5 21.4 20.9 20.9 21.9 21.96 Italy 14.8 15.7 22.4 23.1 27.3 30.8 2.2 8.4 4.9 -1.6 -1.6 0.8 -3.6 -2.3 4.7 7.8 1.1 9.27 Japan 36.8 31.9 27.3 26.9 26.5 27.9 3.8 -0.2 -7.6 -5.1 -6.6 -13.7 -2.5 -3.8 -0.1 -3.9 -6.8 -9.5 -10.18 Canada 10.3 12.4 18.0 20.6 24.7 26.9 7.0 13.3 8.4 -5.5 -5.5 18.5 14.0 4.9 -5.39 Russian Federation 11.6 8.8 17.4 18.2 22.3 24.9 $ 4.6 22.1 11.8 19.5 19.1 10.3 0.8
10 Netherlands 11.7 12.2 16.2 17.0 19.1 21.7 4.3 2.6 6.2 4.1 4.1 2.9 8.5 7.4 4.311 Spain 4.5 6.0 15.1 16.7 19.7 20.3 9.4 8.3 -3.7 -19.7 -19.7 -15.6 -21.0 -22.7 6.0 -2.1 -5.8 -10.812 Belgium 8.1 9.4 15.0 15.5 17.3 19.0 2.7 2.1 2.1 -5.2 -5.2 1.3 -0.4 -13.5 0.0 -2.0 7.6 0.513 Korea, Republic of 6.3 7.1 15.4 18.9 22.0 17.1 $ 22.4 16.6 -22.1 -47.1 -51.8 -54.7 -55.6 -43.6 -31.6 -4.2 -11.7 -17.8 -53.314 Hong Kong (China) 10.5 12.5 13.3 14.0 15.0 16.1 5.4 7.6 6.5 -13.7 -13.7 22.8 6.6 6.6 -7.715 Norway 4.2 4.6 10.5 11.7 13.7 16.0 11.3 6.9 12.2 -9.4 -9.4 20.2 11.8 13.5 11.916 Australia 5.2 6.4 11.3 11.7 14.2 15.7 5.2 9.0 10.8 0.7 -1.3 -1.8 -3.5 1.2 6.6 18.7 14.6 8.8 2.817 Sweden 5.4 8.0 10.8 11.5 13.9 15.2 5.4 11.1 6.5 -8.3 -8.3 16.9 4.9 7.9 -2.418 Singapore 4.7 4.5 10.1 11.0 12.5 14.2 4.2 7.5 7.0 0.4 0.4 13.8 8.0 4.8 2.619 Untd Arab Emirates .. 3.0 6.2 8.8 11.3 .. 42.7 27.620 Austria 7.6 6.3 9.3 9.6 10.6 11.3 1.8 0.8 0.1 -2.3 -2.3 7.1 -8.8 2.9 0.921 Brazil 3.4 3.9 4.7 5.8 8.2 11.0 $ 22.1 42.5 33.5 -22.7 -24.5 -23.5 -31.8 -17.7 -18.0 -23 59.2 57.5 56.5 -21.322 Switzerland 6.3 5.4 8.8 9.2 10.2 10.8 5.3 6.4 -4.5 -9.5 -9.5 0.8 -7.6 -4.6 -4.723 Ireland 2.1 2.5 6.1 6.8 8.6 10.4 11.2 15.7 12.0 -10.1 -10.1 26.7 6.5 12.8 4.824 Denmark 4.4 4.7 6.9 7.5 8.8 9.7 7.9 7.7 3.1 -7.2 -7.2 15.4 -0.6 -8.1 9.825 India 1.0 2.7 6.2 6.8 8.2 9.6 13.7 9.6 22.9 11.0 11.0 51.7 14.7 42.7 -4.226 Poland 5.5 3.3 5.6 7.2 7.7 9.3 24.2 -4.5 5.1 -8.9 -8.9 8.2 10.5 -1.4 6.727 Mexico 3.2 5.5 7.6 8.1 8.4 8.5 $ 6.7 3.3 1.8 -13.6 -12.7 -6.4 -12.9 -18.6 -16.0 6.2 0.3 4.8 -2.828 Taiwan (pr. of China) 8.5 8.1 8.7 8.7 9.1 8.5 $ 0.7 3.7 -6.8 -32.5 -32.5 3.2 2.5 -9.4 -23.029 Kuwait 2.2 2.5 4.5 5.6 6.6 7.6 22.2 16.6 7.930 Malaysia 2.3 2.1 3.7 4.0 5.6 6.7 4.9 30.1 17.1 -1.3 -1.3 14.8 8.8 23.9 19.831 Iran 0.2 0.7 4.2 5.3 6.0 .. $ 26.5 12.9 .. 12.9 12.9 13.032 Saudi Arabia .. .. 3.8 1.8 4.9 5.9 -52.2 170 21.0 -15.9 -15.9 -52.9 -14.7 49.7 154 -13.6 11.9 -4.733 Indonesia 2.2 3.2 3.6 4.0 4.9 5.4 $ 12.4 21.7 10.1 -11.8 -11.8 5.1 14.8 13.6 7.834 Thailand 4.3 2.8 3.8 4.6 5.1 5.2 13.9 1.9 -2.0 -6.1 -6.1 5.4 1.5 -0.9 -10.835 Czech Rep 1.6 1.3 2.4 2.8 3.6 4.6 8.4 18.3 5.9 2.8 2.8 30.0 11.2 -5.4 -3.536 Argentina 3.3 4.4 2.8 3.1 3.9 4.5 $ 11.1 26.5 14.9 -5.4 -5.4 18.6 17.9 27.9 2.237 Finland 2.3 1.9 3.1 3.4 4.0 4.4 10.7 6.8 2.1 3.7 3.7 -1.0 0.6 5.3 3.338 Portugal 2.1 2.2 3.1 3.3 3.9 4.3 8.3 7.9 2.4 -3.2 -7.4 -5.6 -5.4 -10.5 9.4 8.0 4.0 2.0 -3.639 South Africa 1.9 2.1 3.4 3.4 3.9 4.2 sa 6.6 20.7 26.8 6.1 6.1 20.7 39.7 34.0 13.240 Hungary 1.5 1.7 2.4 2.1 2.9 4.0 € -11.7 27.4 27.5 12.0 12.0 21.5 36.1 28.2 23.241 Ukraine 0.2 0.5 2.8 2.8 3.3 4.0 $ 1.0 16.2 22.2 -19.4 -19.4 27.8 38.7 27.1 -6.942 Greece 1.3 4.6 3.0 3.0 3.4 3.9 -2.6 4.3 7.8 -9.7 -16.7 -14.2 -28.3 -7.9 10.2 26.8 2.7 15.5 -7.043 Luxembourg 1.1 1.3 3.0 3.1 3.5 3.9 3.9 3.8 2.0 -4.7 -4.7 7.2 -1.7 2.1 0.744 Qatar .. 0.3 1.8 3.8 .. .. 113 ..45 Turkey 0.9 1.7 2.9 2.7 3.3 3.5 $ -4.5 18.8 7.5 4.4 11.4 2.9 13.4 18.1 -14.8 19.8 11.5 -2.0 2.946 Israel 2.1 2.8 2.9 3.0 3.3 3.4 $ 3.0 9.3 5.5 -24.4 -24.4 1.0 15.2 1.7 2.547 Lebanon .. .. 2.9 3.0 3.1 .. $ 3.4 3.6 ..48 New Zealand 1.3 1.5 2.7 2.5 3.1 3.0 2.9 6.8 0.8 -4.1 -4.1 5.9 0.3 -0.5 -1.249 Egypt 1.3 1.1 1.6 1.8 2.4 2.9 $ 9.5 37.1 19.2 0.0 0.0 55.6 40.6 29.7 -18.250 Bulgaria 0.5 0.5 1.3 1.5 1.8 2.4 11.8 13.3 22.0 -17.6 -19.1 -21.9 -20.3 -14.9 -12.9 30.1 28.8 20.5 8.4
Source: World Tourism Organization (UNWTO) © (Data as collected by UNWTO June 2009)See box at page 2 for explanation of abbreviations and signs used

14
Volume 7 • No. 2 • June 2009
Inbound Tourism: short-term data 2009 World (Continued from page 1) April was the best of the first four months of 2009 – boosted by the fact that the Easter holidays fell in April rather than March this year – but it was still negative in terms of growth (-2%). However, it is worth remembering that these declines are calculated on very strong base figures – the first part of 2008 represented the climax of the boom in world tourism. Care must of course be taken in interpreting the data available so far for 2009, since a num-ber of countries have not yet filed results for April, and there are major gaps in coverage for the whole period in some regions and subregions. In addition, preliminary trends are often based on measures other than international tourist arrivals (e.g. hotel stays or bednights). It is difficult to generalise with regard to global trends over the first four months of 2009. But cost clearly seems to have been the main driver of trends in all regions. Business travellers – the ones that have still been travelling – have generally been trading down and changing their habits. Instead of three trips, for example, they are combining everything into one extended trip, thereby spending more time away in one go – which means lower costs. A recently published report by the Economist Intelligence Unit, commissioned by Amadeus, points to a
new age of austerity for business travellers, which says that executives will make fewer, shorter and cheaper business trips in 2009 and switch from luxury extras in favour of basic efficiency and good service. Some 20% of the 354 executives who responded to the survey in Europe, North America and Asia said they thought an internet connection was more critical than a quiet room. A big question now is: “Will changes like this drive fundamental changes in the corporate travel sector of tomorrow?” As far as the leisure travel market is concerned, secondary short breaks appear to have been hit more than main vacations, and long-haul travel has fallen more than short-haul trips. But there are signs that this could be
International Tourist Arrivals, monthly evolution World (% change)
Source: World Tourism Organization (UNWTO) ©
-15
-10
-5
0
5
10
15
2008 2009*
International Tourist Arrivals by (Sub)regionFull year Share Change Monthly or quarterly data series (% change over same period of the previous year)
2000 2005 2007 2008* 2008* 07/06 08*/07 2009* 2008* 2007
(million) (%) (%) YTD Q1 Jan Feb Mar Apr May J.-J. J.-D. Q1 Q2 Q3 Q4 J.-J. J.-D.
World 684 804 904 922 100 6.1 1.9 -8.4 -10.6 -7.8 -10.3 -13.3 -2.3 6.0 -1.3 8.6 3.9 -0.6 -2.4 5.4 6.8
Europe 392.5 441.6 487.3 487.9 52.9 4.2 0.1 -10.4 -13.4 -7.4 -13.2 -18.1 -3.3 3.4 -2.5 6.3 1.6 -1.4 -4.7 3.5 4.8Northern Europe 43.7 52.8 58.1 57.0 6.2 2.8 -1.9 -9.3 -12.5 -7.9 -16.5 -12.9 -0.9 3.3 -5.9 7.5 0.4 -4.1 -8.9 4.4 1.6Western Europe 139.7 142.6 154.9 153.2 16.6 3.5 -1.1 -10.3 -14.0 -1.9 -12.6 -23.8 0.1 1.8 -3.6 7.3 -2.1 -3.6 -3.5 2.2 4.7Central/Eastern Europe 69.4 87.5 96.5 98.9 10.7 5.5 2.5 -13.2 -14.4 -13.4 -15.0 -14.9 -10.3 4.6 0.3 4.6 4.6 3.6 -4.6 4.7 6.1Southern/Mediter. Eu. 139.8 158.7 177.9 178.9 19.4 4.6 0.6 -9.2 -12.3 -8.5 -11.2 -15.6 -2.6 4.4 -2.1 5.8 3.6 -1.2 -4.3 3.8 5.1
Asia and the Pacific 110.1 153.6 181.9 184.1 20.0 9.7 1.2 -6.1 -7.7 -5.2 -10.9 -7.1 -1.2 5.9 -3.1 8.4 3.4 -1.8 -4.3 9.8 9.5North-East Asia 58.3 85.9 100.9 101.0 11.0 9.8 0.1 -5.6 -7.5 -4.7 -9.7 -8.2 -0.2 -11.6 5.7 -5.0 9.8 1.8 -4.5 -5.4 9.1 10.4South-East Asia 36.1 48.5 59.7 61.6 6.7 12.3 3.3 -6.3 -7.1 -4.3 -13.0 -4.3 -3.6 7.0 -0.3 7.2 6.6 2.6 -3.0 13.6 11.2Oceania 9.6 11.0 11.2 11.1 1.2 1.7 -1.0 -3.7 -5.8 -2.0 -8.7 -6.5 4.0 0.4 -2.3 1.6 -1.2 -1.8 -2.7 2.7 0.8South Asia 6.1 8.1 10.1 10.4 1.1 2.6 3.3 -11.8 -14.1 -17.3 -11.3 -13.5 -2.7 -5.4 7.8 -1.0 9.4 5.6 2.0 -3.3 2.5 2.7
Americas 128.2 133.3 142.9 147.2 16.0 5.2 3.0 -5.4 -6.4 -1.0 -4.9 -12.4 -2.0 6.7 0.0 9.8 3.7 2.0 -2.2 3.3 6.9North America 91.5 89.9 95.3 97.8 10.6 5.2 2.6 -6.8 -7.7 -1.9 -4.8 -14.4 -4.1 6.4 -0.5 9.9 3.6 1.3 -2.8 3.7 6.4Caribbean 17.1 18.8 19.8 20.3 2.2 1.6 2.4 -6.5 -7.5 -2.6 -7.9 -11.2 -3.5 6.1 -2.1 8.9 2.9 -0.5 -3.7 -1.4 5.1Central America 4.3 6.3 7.8 8.3 0.9 12.0 7.2 -3.7 -4.5 4.5 -6.3 -11.6 -1.1 11.5 3.0 14.0 8.8 4.3 1.8 8.9 15.2South America 15.3 18.3 20.0 20.8 2.3 6.5 3.9 0.2 -2.1 0.5 -2.1 -5.6 10.8 7.0 3.5 9.3 3.6 7.5 0.0 4.7 8.3
Africa 27.9 37.3 45.1 47.0 5.1 8.9 4.1 3.1 1.1 5.9 2.3 -4.5 9.0 5.1 3.3 6.7 3.6 1.0 6.2 10.3 7.7North Africa 10.2 13.9 16.3 17.2 1.9 8.5 5.4 6.4 2.2 5.3 5.2 -2.5 16.6 8.8 3.1 10.6 7.5 1.0 7.3 6.6 9.7Subsaharan Africa 17.6 23.4 28.8 29.7 3.2 9.1 3.4 1.7 0.7 6.1 1.2 -5.4 5.0 3.3 3.4 5.2 1.3 1.0 5.8 12.1 6.5
Middle East 24.9 37.9 47.0 55.6 6.0 14.6 18.2 -18.1 -22.4 -39.5 -12.9 -10.0 -6.6 29.7 9.8 24.3 35.8 4.8 15.5 10.7 18.3Source: World Tourism Organization (UNWTO) © (Data as collected by UNWTO June 2009)

15
Volume 7 • No. 2 • June 2009
changing as potential travellers – particularly Europeans – realise that, despite higher airfares, long-haul destinations are often more attractive in terms of overall prices than destinations closer to home. Moreover, the advent of low-cost, long-haul airlines such as AirAsia X, is also helping to bring long-haul airfares down. Detailed results for arrivals and receipts by country are included in the ‘Regions’ section (pages 23-40).
Trends and Prospects The current four-month period includes the high season for leisure tourism in the northern hemisphere, which contains some of the world’s leading outbound travel markets and destinations. But the advance booking situation, coupled with the reduction in airline capacity, shows that it is too much to hope for a recovery by the end of August. Indeed, few major players are expecting to see a recovery before the end of the year. Trends suggest that the full-year results for 2009 will be worse than initially predicted (see revised forecast on page 18). Although some industry analysts say that, given some small signs of recovery in the global economy, the outlook for the remainder of the year has improved – especially since the second half of last year was in negative growth – many believe the worst is still to come. Unemployment is still increasing rapidly in key tourism source markets, exchange rates have been fluctuating, adding to the uncertainties, and business and consumer confidence is not yet really recovering. An additional uncertainty has been added by the influenza A(H1N1) outbreak and its uncertain future progression. It is important to stress though that, despite of the move to the phase 6 or pandemic status on June 11, the World Health Organization (WHO) has explicitly stated that it does not recommend any restrictions on travel. The
move to phase 6 is based on the geographic spread of the influenza A(H1N1) virus and is not related to its severity. The WHO has pointed out that limiting travel and imposing travel restrictions would have very little effect on stopping the disease, but would be highly disruptive to the global community. As the economic environment has rapidly changed, prospects for the full year have been adjusted downwards. International tourism is now expected to decline by between -6% and -4% in 2009. But, as in January, the situation continues to be exceptionally volatile. There are possibilities of a moderate recovery, but much will depend on the evolving economic conditions and of the restoration of consumer and business confidence. Nevertheless, some believe that there are good sides to the current crisis. The boom of the last few years resulted in excessive construction and huge speculation with regard to property prices. So, it was difficult to keep prime locations sustainable with developers often ignoring carrying capacity limits. This could now start to change. In addition, some stress that crisis brings opportunities, such as the possibility of diversifying products or moving into new markets, and extra time can be spent in rethinking longer-term strategies. The crisis has also resulted in an increased focus on the important role of governments. As an example, global hotel investment has fallen to a fraction of what it was a year ago, with investment in the first quarter of this year down 80% on a year ago, according to Jones Lang LaSalle. As a result, tourism development is more reliant than ever on government funding and guarantees. Whether this continues beyond the short term is too difficult to predict at this stage. Meanwhile, just under a year after oil prices peaked, the price of a barrel of oil is currently around US$ 70 – about half its July 2008 peak. Yet, air transport is still front-page news with the industry set to make around US$ 9 billion in losses this year.
International Tourist Arrivals (% change over same period of the previous year)
Source: World Tourism Organization (UNWTO) ©
3 25 4 6 7
0
8 6 6
12
79
3
30
-6-4
0
-2-5
0-2 -1 0 -2
3 3 3 3
10
-9 -10-13
-9-6 -6
-4
-12
-7 -7-4
0
6
2
-18
-25
-20
-15
-10
-5
0
5
10
15
20
25
30
35
North
ern E
urope
Wes
tern E
urop
e
Centr
al/Ea
stern
Europ
e
South
ern/M
edite
r.Eu
.
North
-Eas
t Asia
Sout
h-Eas
t Asia
Ocea
nia
South
Asia
North
Ame
rica
Carib
bean
Centr
al Am
erica
Sout
h Ame
rica
North
Afric
a
Subs
ahara
nAf
rica
Midd
le Ea
st
2008 Jan.-June
2008 July-Dec.
2009* Jan.-April

16
Volume 7 • No. 2 • June 2009
Global Economic Crisis: UNWTO’s Response Tourism & Travel is a primary vehicle for job creation and economic regeneration Against a progressively more difficult environment, UNWTO has been increasing its efforts to provide the sector, and its Members in particular, with the necessary support to face these challenging times. UNWTO has been focusing on three interrelated initiatives: o Resilience – supporting the sector’s immediate
response through its Tourism Resilience Committee (TRC) to strengthen market intelligence and best practice sharing (see www.unwto.org/trc).
o Stimulus – advocating tourism’s priority inclusion in general economic stimulus packages and its capacity to contribute significantly to the global objectives of job creation and economic recovery (see UNWTO G20 message at www.unwto.org/G20).
o Green Economy – advancing tourism in the new Green Economy as a sector that can deliver on smart growth, intelligent infrastructure and clean energy jobs.
As world leaders grapple with today’s unprecedented global economic conditions, UNWTO stresses the potential for tourism and travel to support short-term stimulus actions, namely those aimed at creating and sustaining jobs, as well as the transformation to a green economy. Tourism is one of the largest employment sectors in most countries and a fast entry vehicle into the workforce for young people and women in urban and rural communities, directly, or through its strong multiplier effect on related services, manufacturing or agriculture. Actions are needed to boost trade promotion, simplify regulation, build infrastructure and rationalise taxes, which in turn incite companies to invest, innovate and stimulate demand. This kind of public-private sector collaboration should be strongly advanced within and between all states – it will help build resilience and recovery across economies (for more information on Tourism and Economic Stimulus see UNWTO’s initial assessment at www.unwto.org/trc/response/response.php?lang=E). After the announcement of the Roadmap for Recovery (see www.unwto.org/pdf/brochure_TRC_roadmap.pdf) at ITB Berlin last March, an intensive work programme has been carried out by the Tourism Resilience Committee and its Core Group. UNWTO is formulating a unique position paper on tourism in face of the global crisis, the stimulus programmes and recovery, which presupposes collaborative multi-stakeholder engagement. This will be officially presented at the UNWTO General Assembly in Kazakhstan (2-9 October2009) and will continue to be promoted within the G20 initiative.
Influenza A(H1N1): UNWTO’s Response As part of the preparedness efforts for a possible pandemic situation, UNWTO established some three years ago regular and active contacts within the United Nations system, in particular with the World Health Organization (WHO), the United Nations System Influenza Coordination (UNSIC), the International Civil Aviation Organization (ICAO) and the Department of Public Information of the UN (UNDPI). Internally, UNWTO reinforced its preparedness work with the establishment of a Risk and Crisis Management Section, which is the focal point for the coordination with the UN on pandemics. Since the onset of the outbreak of the novel influenza A(H1N1) in April 2009 UNWTO has been actively involved in the coordination and communication efforts for the travel and tourism sector. The overall objectives of our activities were: o Facilitating fast and targeted communications and
providing relevant real-time information; o Promoting consistent messages throughout the travel
and tourism sector; o Minimising the impacts of the pandemic on the sector
through coordination and close cooperation with Member States, WHO, UNSIC and TERN; and
o Providing guidance and assistance to Member States. To meet those objectives, UNWTO engaged at three levels: o Inside the UN-system, UNWTO actively participated in
the top-level coordination effort with WHO, ICAO and UNSIC to ensure that views and concerns of the travel and tourism sector were taken into account in the decision making process.
o At the Member States’ level, UNWTO immediately activated the Influenza Focal Point structure, which had been put in place as part of the Avian Flu preparedness. UNWTO provided the Influenza Focal Points with regular information updates, guidelines and common messages, and shared lessons learned from previous pandemic simulation exercises.
o With respect to the industry, UNWTO was in close contact and coordinated frequent meetings with the Tourism Emergency Response Network (TERN) and WHO. TERN consists of key global travel and tourism network associations, both public and private, across all sectors. The active coordination and communication between UNWTO, TERN and WHO provided an insight into the needs, views and concerns of the travel and tourism sector.
At this particular stage, it is important to highlight that despite the declaration of the pandemic alert Phase 6 on 11 June 2009, travel restrictions are not recommended by WHO. The designation of this phase is based on the geographic spread of the virus and not its severity. Limiting travel and imposing travel restrictions would have

17
Volume 7 • No. 2 • June 2009
very little effect on stopping the spread of the influenza A(H1N1) virus but would be highly disruptive to the global community. The severity of the virus is currently considered moderate by WHO and measures recommended are prevention practices that apply in daily life, such as hand-washing and normal cough ‘etiquette’. However, WHO has also pointed out that influenza viruses are well known for their instability. The further development of the influenza A(H1N1) virus remains uncertain and the severity of the pandemic can change considerably over time and differ by location and population. Staying informed is therefore important. Travellers should regularly check with www.SOS.travel or other reliable resources for the latest updates and information issued by health and travel authorities as the situation evolves. It is important to keep in mind that the current influenza pandemic is the first one for which the global community has extensively prepared. These preparedness efforts were reflected in the global response to the challenges of the influenza outbreak over the last weeks. Although the development of the virus remains uncertain, we are confident that our joint work will help us avoid unnecessary repercussions on the travel and tourism sector. For more information see www.SOS.travel and www.unwto.org The institutions currently collaborating to face and deal with the challenges of the influenza A(H1N1) are: AAPA Association of Asia and Pacific Airlines, ACI Airport Council International, AEA Association of European Airlines, AHLA American Hotel and Lodging Association, ALTA Asociación Latinoamericana de Transporte Aéreo, ASTA American Society of Travel Agents, ATTA African Travel and Tourism Association, CHTA Caribbean Hotel and Tourism Association, CLIA Cruise lines International Association, CTC Canadian Tourism Commission, CTO Caribbean Tourism Organization, ETC European Travel Commission, FIA Federation Internationale de l’Automobile, IAAPA International Association of Amusement Parks and Attractions, IATA International Air Transport Association, ICAO International Civil Aviation Organization, IFTO International Federa-tion of Tour Operators, IH&RA International Hotel and Restaurant Association, IH&RA International Hotel and Restaurant Association, ISF International Shipping Federation, MPI Meeting Professionals International, NTA National Tour Association, PATA Pacific Asia Travel Association, TOI Tour Operators Initiative, UFTAA United Federation of Travel Agents’ Associations, UNWTO World Tourism Organization, UST US Travel, WHO World Health Organization, WTTC World Travel & Tourism Council, WYSETC World Youth Student and Educational Travel Confederation

18
Volume 7 • No. 2 • June 2009
UNWTO forecast for 2009 2009 forecast revised downwards and marked by uncertainty As the whole environment for international tourism has rapidly changed since the last full issue of the UNWTO World Tourism Barometer, a revised forecast for the full year 2009 is included in this issue, taking account of the results for the first four months of the year and current conditions. International tourism is now forecast to decline by -6% to -4% in 2009. In view of the rapidly deteriorating global economic situation, growth prospects have repeatedly been adjusted downwards over the past six months. While at the time of the previous UNWTO forecast in January, the International Monetary Fund was still counting on a 2.2% growth in the world economy in 2009, a decline of 1.3% is now expected. Tourism is also severely impacted, given the sharp reduction in business activity, decreasing disposable income and associated increased unemployment.
Forecast International Tourist Arrivals, 2009(% change over same period of the previous year)
Source: World Tourism Organization (UNWTO) ©
-12
-10
-8
-6
-4
-2
0
2
4
6
World Europe Asia andthe Pacific
Americas Africa Middle East
After considering the latest available data, worldwide growth in international tourist arrivals is expected to end up between -6% and -4% for the full year, down from the initial -2% to 0% growth forecast at the beginning of 2009. Following the negative growth of -8% recorded in the period January-April, the pace of decline is expected to soften in the remainder of the year, with the months May-August projected at between -6% and -4%, and September-December between -5% and -3%. This is broadly in line with the prospects for May-August as expressed by the UNWTO Panel of Experts, which are somewhat less pessimistic than they were for the period January-April, in particular in the case of Asia and the Pacific, Africa and the Middle East. As at the beginning of the year, the situation is still exceptionally volatile. Much will depend on the evolving economic conditions and on the restoration of consumer and business confidence. Is the worst already behind us? Many expect the recession to bottom out and some even see green shoots appearing on the horizon. An additional uncertainty has been added by the influenza A(H1N1) virus the outbreak and its likely future progression. According to the US Conference Board “While it is too early to determine the ultimate scope of the influenza A(H1N1) pandemic, a comparison to the 2003 SARS outbreak, (…) shows the economic impact may be short-lived and will not significantly alter long-term trends in global macro economic activity. But only time, and the final course of the current pandemic, will determine the depth of any economic damage.” Broken down by region, Europe (-8% to -5%) will be among the most negatively impacted, as the majority of its source markets have been struggling with recession since end 2008. In addition, outbound tourism from Europe’s second largest market, the UK, has been strongly affected by the depreciation of the pound sterling. International tourist arrivals in the Americas are forecast to decline by between -6% and -3%, mainly as a result of the slowdown in the USA both as a source market and as a destination. In Asia and the Pacific (-4% to -1%), the situation has deteriorated faster than expected as most emerging economies have been far from immune to the global economic trade and investment contraction. This
Forecast of growth in International Tourist Arrivals2007 2008 2009real real real Full year projectionyear year Jan.-June July-Dec. Jan.-April between
World 6.1% 1.9% 6.0% -1.3% -8.4% -6% and -4%Europe 4.2% 0.1% 3.4% -2.5% -10.4% -8% and -5%Asia and the Pacific 9.7% 1.2% 5.9% -3.1% -6.1% -4% and -1%Americas 5.2% 3.0% 6.7% 0.0% -5.4% -6% and -3%Africa 8.9% 4.1% 5.1% 3.3% 3.1% 1% and 5%Middle East 14.6% 18.2% 29.7% 9.8% -18.1% -10% and -5%Source: World Tourism Organization (UNWTO) ©

19
Volume 7 • No. 2 • June 2009
slowdown is particularly severe when compared with the region’s performance in recent years. The same applies to the Middle East, where international tourist arrivals are expected to decline by between 10% and 5% as regional income drops following sliding oil prices and a decline in demand for long-haul travel – particularly business trips. Though the Middle East will not be able to consolidate its bumper growth of 2008 (+17%), the region is still projected to record arrivals well above the level of 2007. Africa is the only bright spot on the horizon. Arrivals in the region are forecast to grow by 1% to 5%. Still, there is a large margin for both regions, and specifically for the Middle East, as the underlying data is comparatively limited and not very stable. This forecast has been prepared by UNWTO in cooperation with the Fundación Premio Arce of the Universidad Politécnica de Madrid. In order to allow for the uncertainty related to the evolution of the economic situation and of the influenza A(H1N1), outcomes of the econometric model applied have been adjusted downwards and include a margin with variable width depending on the stability of the underlying data series. It should be realised that in this extremely volatile environment, forecasting is a far more complicated exercise than in the relative stable situation of the past years. UNWTO will continue to closely monitor developments and adjust its forecast when considered necessary to provide the most accurate analysis possible.
About these forecasts These forecasts are developed for UNWTO by the Fundación Premio Arce of the Universidad Politécnica de Madrid and are based on econometric modelling using the series of monthly data on international tourist arrivals available for the five regions. The aim of the model is to analyse the underlying trend in the data and extrapolate this to the short-term future. The model has been tested by comparing forecasts for previous years with actual results for those years. Of course, as with any model, the forecast growth rates assume that the current conditions will not suddenly change as a result of external factors. They also include a margin of error depending on the stability of the underlying data series. These forecasts need to be read with a certain level of caution, not only because of the above mentioned, but also because the underlying data is not perfect: – monthly data series are not available for all countries,
although the countries with monthly series included represent roughly 90% of worldwide arrivals. Coverage is in particular comparatively limited for the Middle East and Africa, and a considerable margin should be taken into account;
– monthly data is typically preliminary and many countries are expected to revise their statistics at a later date;
– the monthly series is often based on a proxy that is not the same as the indicator used for the yearly data, e.g. for France a monthly series is used on international nights in hotels and similar accommodation instead of tourist arrivals at frontiers, while for the USA the monthly series does not include arrivals from Mexico in the border areas, etc.

20
Volume 7 • No. 2 • June 2009
Evaluation by UNWTO’s Panel of Tourism Experts
Looking for the green shoots of recovery
(Continued from page 1) On a scale of 0 to 200, on which 100 implies ‘equal’ or ‘no change’, tourism experts from around the world gave an average score of just 57 to their evaluation of tourism performance in the first four months of 2009, with a slightly more positive assessment from representatives of the public sector (62) than of the private sector (54). In the context of UNWTO’s World Tourism Barometer Confidence Index, the score is the lowest ever recorded, implying ‘a worse’ or even ‘much worse’ performance – 20 points down – than in the previous period, September through December 2008. The decline in confidence is even more evident when considering that the 57 score is less than half that given 12 months ago for the period January to April 2008 (119). Expectations for the current May through August period, meanwhile, are slightly less pessimistic, at 69 – three points up on the rating given for ‘prospects’ for the first four months’ at the beginning of the year – well after the start of the economic recession, but before the influenza A(H1N1) outbreak.
UNWTO Panel of Tourism Expertsabs. number, 2009, (n=308)
Source: World Tourism Organization (UNWTO) ©
70
162
39 361
36
155
86
292
0255075
100125150175
[0] Much worse [50] Worse [100] Equal [150] Better [200] Muchbetter
Evaluation Jan.-AprilProspects May-Aug.
Both the ratings and the comments from the UNWTO’s Panel of Experts are unsurprising given the challenging operating environment in the first four months of 2009. But the (temporary?) sign of a modest upturn in consumer and business confidence – no doubt influenced by the impending peak period for the world’s leading tourism destinations in the northern hemisphere – perhaps belies the challenges ahead. While demand for tourism has already fallen sharply in some regions, many in the industry believe the worst is still to come. The scores accurately reflect the sharp downturn in international tourism demand in most parts of the world due to the economic crisis and a whole range of associated factors, such as increased unemployment, the reduced availability of credit, and uncertainties as to the short- to medium-term outlook for disposable incomes and jobs. Down 20 points since the previous period (September-
December 2008) and 62 points since the first four months of 2008, industry confidence has clearly taken a beating. As might be expected, the averages nevertheless mask some fairly significant variations from one region and one sector to another, as highlighted by the following overview of responses.
UNWTO Panel of Tourism Experts
Source: World Tourism Organization (UNWTO) ©
25
50
75
100
125
150
175
T1 T2'03
T3 T1 T2'04
T3 T1 T2'05
T3 T1 T2'06
T3 T1 T2'07
T3 T1 T2'08
T3 T1 T2'09
T3
Prospects
Evaluation
Muchbetter
Better
Equal
Worse
Muchworse
Evaluation January-April 2009 Tourism experts in all regions rated the first four months of this year as considerably worse than the final four-month period of 2008. The difference in scores was most marked among experts from the Middle East (a score of 63, down from 104) and Africa (79, down from 109), although Africa achieved by far the best rating of all regions – almost 30 points above that for Europe (51), for example. Experts in the Americas and Asia and the Pacific came out slightly above average for the world overall – with scores of 62 and 59 respectively. (See graphs in the section on the regions.) In terms of the evaluation by activity, Global Operators (those operating in all, or more than one, regions of the world) were the most negative by a very wide margin, evaluating global tourism performance in January-April 2009 at a mere 40, down from 44 in the previous period (when they were also the most negative) and well below the world average of 57. Not surprisingly, perhaps, given the terrible few months suffered by the airline industry, the Transport sector proved especially pessimistic, evaluating the months of January through April 2009 at 47 (down sharply from the previous period’s score of 86). The least pessimistic sector was that of Tour Operators and Travel Agents (63), followed by Destinations (60). Scores from the other sectors ranged from 59 among experts representing Consultancy, Research & Media to 55 for the Accommodation and Catering sector and 51 for General Industry Bodies & Other.

21
Volume 7 • No. 2 • June 2009
UNWTO Panel of Tourism Experts Public Private
Source: W or ld Tour ism O rganization (UNW TO) © Source: World Tourism Organization (UNWTO ) ©
Destinations Transport
Source: W or ld Tour ism O rganization (UNW TO) © Source: World Tourism Organization (UNWTO ) ©
Accommodation & Catering Tour Operators & Travel Agencies
Source: W or ld Tour ism O rganization (UNW TO) © Source: World Tourism Organization (UNWTO ) ©
General Industry Bodies & Other Consultancy, Research & Media
Source: W or ld Tour ism O rganization (UNW TO) © Source: World Tourism Organization (UNWTO ) ©
25
50
75
100
125
150
175
T1 T2'03
T3 T1 T2'04
T3 T1 T2'05
T3 T1 T2'06
T3 T1 T2'07
T3 T1 T2'08
T3 T1 T2'09
T3
ProspectsEvaluation
Muchbetter
Better
Equal
Worse
Muchworse 25
50
75
100
125
150
175
T1 T2'03
T3 T1 T2'04
T3 T1 T2'05
T3 T1 T2'06
T3 T1 T2'07
T3 T1 T2'08
T3 T1 T2'09
T3
ProspectsEvaluation
Muchbetter
Better
Equal
Worse
Muchworse 25
50
75
100
125
150
175
T1 T2'03
T3 T1 T2'04
T3 T1 T2'05
T3 T1 T2'06
T3 T1 T2'07
T3 T1 T2'08
T3 T1 T2'09
T3
ProspectsEvaluation
25
50
75
100
125
150
175
T1 T2'03
T3 T1 T2'04
T3 T1 T2'05
T3 T1 T2'06
T3 T1 T2'07
T3 T1 T2'08
T3 T1 T2'09
T3
ProspectsEvaluation
Muchbetter
Better
Equal
Worse
Muchworse 25
50
75
100
125
150
175
T1 T2'03
T3 T1 T2'04
T3 T1 T2'05
T3 T1 T2'06
T3 T1 T2'07
T3 T1 T2'08
T3 T1 T2'09
T3
ProspectsEvaluation
25
50
75
100
125
150
175
T1 T2'03
T3 T1 T2'04
T3 T1 T2'05
T3 T1 T2'06
T3 T1 T2'07
T3 T1 T2'08
T3 T1 T2'09
T3
ProspectsEvaluation
25
50
75
100
125
150
175
T1 T2'03
T3 T1 T2'04
T3 T1 T2'05
T3 T1 T2'06
T3 T1 T2'07
T3 T1 T2'08
T3 T1 T2'09
T3
ProspectsEvaluation
Muchbetter
Better
Equal
Worse
Muchworse 25
50
75
100
125
150
175
T1 T2'03
T3 T1 T2'04
T3 T1 T2'05
T3 T1 T2'06
T3 T1 T2'07
T3 T1 T2'08
T3 T1 T2'09
T3
ProspectsEvaluation
For this edition responses have been received from experts based in Albania, Algeria, Andorra, Argentina, Australia, Austria, Bahamas, Belgium, Belgium, Belize, Bermuda, Bhutan, Bolivia, Brazil, Bulgaria, Burkina Faso, Cambodia, Cameroon, Canada, Chile, China, Colombia, Costa Rica, Côte d'Ivoire, Croatia, Cuba, Cyprus, Czech Republic, Denmark, Dominica, Dominican Republic, Ecuador, Egypt, El Salvador, Estonia, Ethiopia, Finland, France, Germany, Greece, Guatemala, Honduras, Hong Kong (China), Hungary, Iceland, India, Indonesia, Iran (Islamic Republic of), Ireland, Israel, Italy, Jamaica, Japan, Jordan, Kenya, Lebanon, Lesotho, Liechtenstein, Lithuania, Macao (China), Malta, Marshall Islands, Mauritius, Mexico, Morocco, Mozambique, Namibia, Netherlands, New Zealand, Nicaragua, Norway, Panama, Peru, Philippines, Poland, Portugal, Puerto Rico, Republic of Korea, Reunion, Romania, Russian Federation, Senegal, Serbia, Singapore, Slovakia, Slovenia, South Africa, Spain, Swaziland, Sweden, Switzerland, Tanzania, Thailand, Tunisia, Turkey, United Arab Emirates, United Kingdom, United States, Uruguay, Uzbekistan, Venezuela, Vietnam and Zimbabwe.

22
Volume 7 • No. 2 • June 2009
Prospects May-August 2009 For the current four-month period, May-August 2009 (as already indicated, the peak tourism season for the world’s leading regions in the northern hemisphere), prospects are pretty gloomy, if better than at the start of this year, by all experts except those from Africa (104). However, although the Panel of Experts in other regions all expect the months of May through August to be worse than could be expected for that period, their pessimism is tempered. Higher scores are given by experts from the Middle East (83, up from 63 for the first four months of 2009), Asia and the Pacific (76, up from 59) and the Americas (70, up from 62) than by those from Europe (59, and only slightly up from 51 for the period January-April), who seem to be predicting a very dismal summer. By activity, the ratings for prospects are mixed. Worse scores are given for the current four months by representatives of the Transportation sector (50 as against 47), Accommodation and Catering (62 compared with 55) and General Industry Bodies (63 as against 52 for January through April). But experts representing Tour Operators/Travel Agents (78), Destinations (77) and Consultancy, Research and Media (65) are all slightly more optimistic. However, the Global Operators (53) are once again the most bearish. How one should interpret this is not obvious as yet, but it would seem that those industry players who have a global view of the current situation see doom and gloom all around them. Clearly, the economic crisis has been transformed into a crisis of confidence, exacerbated now by the outbreak of the influenza A(H1N1).
The UNWTO Tourism Confidence Index The UNWTO Tourism Confidence Index is based on the results of an email survey conducted by the UNWTO Secretariat among selected representatives of public and private sector organizations participating in the UNWTO Panel of Tourism Experts. The survey has been repeated every four months since May 2003 in order to keep track of actual performance, as well as perceived short-term prospects, of the tourism sector. This allows performance and prospects to be compared over time, as well as providing a comparison of the actual performance of the past four months with prospects forecast for the same period four months earlier. Results are also broken down by region and by sector of activity. These breakdowns should, however, be interpreted with caution as they may in some cases be based only on a relatively small number of responses. The UNWTO Secretariat’s aim is to continuously expand and improve the Panel sample. Experts interested in participating in the survey, in particular from countries still not included in the listing below, are kindly invited to send an email to <[email protected]>. How to read this data For the UNWTO Tourism Confidence Index members of the UNWTO Panel of Tourism Experts are asked once every four months by email to answer the following two simple questions: - What is your assessment of tourism performance in your destination or business for the four months just ended (or about to end) as against what you would reasonably expect for this time of year? - What are the tourism prospects of your destination or business in the coming four months compared with what you would reasonably expect for this time of year? Participants should select one of the following five options: much worse [0]; worse [50], equal [100]; better [150], much better [200]. Results are averaged and broken down by region and by activity. A value above 100 means that the number of participants who evaluate the situation as '“better” or “much better”, outnumber the participants who reply “worse” or “much worse”. In addition, participants are also invited to include a qualitative assessment in their own words. The analysis contained in the UNWTO World Tourism Barometer is in large part based on their comments.

23
Volume 7 • No. 2 • June 2009
Regions
Europe Results The decline in tourism in Europe associated with the economic downturn has been every bit as bad as had been feared. Overall arrivals in the region in the first four months of 2009 are estimated to have fallen 10% below the levels of the same period last year, with many countries reporting double-digit declines and very few reporting increases. Little wonder that UNWTO’s Panel of Experts in Europe proved the most negative of all regions with their evaluation of the January through April period at just 51, down from 72 in the previous period – and less than half the rating for the first four months of 2008.
International Tourist Arrivals, monthly evolutionEurope (million)
Source: World Tourism Organization (UNWTO) ©
0
10
20
30
40
50
60
70
Jan Feb Mar Apr May Jun Jul Aug Sep Oct Nov Dec
200720082009*
There have been large, and sometimes wild, fluctuations in the monthly figures for individual destinations. These can be partly attributed to the fact that Easter fell in March in 2008 and in April in 2009. Overall monthly figures for Europe are more even: there were estimated declines of 7% in January, 13% in February, 18% in March and 3% in April, calculated on the same months of 2008. The decline in international arrivals was spread relatively evenly across all the subregions of Europe as most of the destinations depend heavily on regional source markets, all of which are hard hit by the crisis. In Northern Europe (-9%), only Iceland (+1.5%), with a dramatically cheaper currency, showed an increase, and only Ireland (-6%) showed a more moderate decline, and that followed an already weak performance in 2008. Despite sterling’s weakness, the UK suffered a 10% drop, although it should be noted that the respective decline from the EU15 countries (the 15 members of the European Union before the 2004 enlargement) was just 4%, and monthly figures show a progressive improvement through the first four months.
In Western Europe (-10%), only France (-13% for the first two months only) and Austria (-3%) departed by more than 2 percentage points from the average. Austria also had by far the best figures in the subregion in 2009, thanks to a strong January and an impressive April, sustained by the nearby German market. Most of the winter sports resorts (including those in Switzerland, Austria, Finland and Sweden) report an excellent season, which is partly attributed to good snow conditions and partly to the late Easter, which allowed the season to be extended through much of April. But it also provides support for the idea that consumers are prepared to sacrifice their secondary holidays, but not their main holidays (since so many skiers regard their ski trip as their main annual holiday). The overall decline for Central and Eastern Europe (-13%) included double-digit declines for most of the destinations – Slovakia (-28%), Ukraine (-20%), Poland (-19% in Q1), Romania (-19%), the Czech Republic (-17%), Lithuania (-12%) and Russia (-11%). Hungary bucked the trend and managed to maintain last year’s figures. (Data for several countries is not yet available.) In Southern/Mediterranean Europe (-9%), there were heavy declines for Portugal (-14%), Spain (-12% through May), Slovenia (-13%), Malta (-13%) and Cyprus (-9%). In many cases, the poor performances were primarily due to the sharp fall in demand from the UK. Destinations appear to be losing out – and expect to continue to lose out – to ‘non-euro’ destinations, especially Turkey, Egypt and Tunisia.
International Tourist Arrivals, monthly evolutionEurope (% change)
Source: World Tourism Organization (UNWTO) ©
-20
-15
-10
-5
0
5
10
2008 2009*
Italy (-5% in Q1) did less badly, as did some countries in the western Balkans. Increases were reported by Serbia (+2.5%), FYR of Macedonia (+8%) and, reportedly, Albania. However, the numbers involved are still small. Serbia’s increase is calculated on a very negative period last year. Because of its status as a major destination, the most successful destination was Turkey, which confined its decline to slightly over 1% – and that is calculated on a very strong base figure. Turkey was unable to match 2008 figures over Q1 but performance has picked up since April, notably with regard to last-minute bookings. Greece suffered a 26% decline in arrivals in the first two months.

24
Volume 7 • No. 2 • June 2009
International Tourist Arrivals by Country of DestinationChange Monthly or quarterly data series
(% change over same period of the previous year)Series 2000 2005 2007 2008* 06/05 07/06 08*/07 Series 2009* 2008*
(1000) (%) YTD Q1 Jan Feb Mar Apr May Q1 Q2 Q3 Q4
Europe 392,528 441,550 487,303 487,935 5.9 4.2 0.1 -10.4 -13.4 -7.4 -13.2 -18.1 -3.3 6.3 1.6 -1.4 -4.7Northern Europe 43,673 52,790 58,058 56,980 6.9 2.8 -1.9 -9.3 -12.5 -7.9 -16.5 -12.9 -0.9 7.5 0.4 -4.1 -8.9
Denmark TCE 3,535 4,699 4,681 .. -1.0 0.6 .. NCE(1) -12.5 -35.6 -20.0 -19.0 -48.5 37.6 25.1 -7.9 -8.8 -1.7Finland TF 2,714 3,140 3,519 3,583 7.5 4.3 1.8 TCE -11.8 -10.0 -2.5 -17.9 -11.0 -18.1 8.9 4.6 -3.9 -2.5Iceland TCE 634 871 1,054 1,102 11.4 8.6 4.6 THS(2) 1.5 -3.4 0.8 -0.3 -8.6 12.2 1.6 1.5 4.8 9.2Ireland TF 6,646 7,333 8,332 8,026 9.1 4.1 -3.7 TF -6.3 -9.1 -2.9 -5.5 -16.0 0.6 4.3 1.3 -6.6 -5.2Norway TF 3,104 3,824 4,377 4,440 6.4 7.5 1.4 THS -10.5 -9.3 -4.0 -9.2 -13.6 -14.1 -1.3 -0.5 -10.7 -3.9Sweden TCE 3,828 4,883 5,224 .. -3.2 10.5 .. THS -7.1 -9.7 -10.7 -14.3 -4.4 0.3 10.5 5.0 -7.9 -2.7United Kingdom TF 23,212 28,039 30,871 30,190 9.3 0.7 -2.2 VF -10.0 -12.7 -9.1 -20.1 -9.7 -2.6 6.8 -1.0 -1.9 -13.1
Western Europe 139,658 142,596 154,897 153,154 4.9 3.5 -1.1 -10.3 -14.0 -1.9 -12.6 -23.8 0.1 7.3 -2.1 -3.6 -3.5Austria TCE 17,982 19,952 20,773 21,933 1.6 2.5 5.6 TCE -2.6 -8.7 12.8 -5.8 -29.5 42.2 13.7 -0.6 2.6 4.2Belgium TCE 6,457 6,747 7,045 7,086 3.7 0.7 0.6 TCE -8.0 -6.0 -9.6 1.8 2.4 -0.3 -1.5France TF 77,190 75,908 81,900 79,300 3.9 3.8 -3.2 THS -12.6 -5.9 -18.1 6.1 -3.7 -6.3 -5.2Germany TCE 18,992 21,499 24,420 24,886 9.6 3.6 1.9 TCE -8.6 -8.8 -9.0 -9.9 -7.5 -8.1 5.4 4.3 0.8 -2.1Liechtenstein THS 62 50 58 58 10.2 6.2 0.3 THS -9.4 -7.7 -10.9 5.0 -1.8 4.2 -7.6Netherlands TCE 10,003 10,012 11,008 10,104 7.3 2.5 -8.2 TCE -14.8 -14.8 -8.6 -12.1 -21.3 0.8 -11.8 -9.0 -10.1Switzerland THS 7,821 7,229 8,448 8,608 8.8 7.4 1.9 THS -8.3 -9.7 -3.3 -11.1 -13.4 -3.6 9.2 2.7 0.4 -4.3
Central/Eastern Europe 69,351 87,453 96,476 98,858 4.6 5.5 2.5 -13.2 -14.4 -13.4 -15.0 -14.9 -10.3 4.6 4.6 3.6 -4.6Bulgaria TF 2,785 4,837 5,151 5,780 6.6 -0.1 12.2 TF -4.4 -6.6 -7.6 -5.2 -6.8 -0.1 15.5 17.9 12.3 -0.1Czech Rep TCE 4,773 6,336 6,680 6,649 1.6 3.8 -0.5 TCE -17.1 -17.1 -8.8 -20.6 -20.3 6.8 -0.4 -0.4 -6.3Estonia TF 1,220 1,917 1,900 .. 1.2 -2.1 .. TCE -5.3 -8.2 8.4 -11.4 -16.9 0.8 5.9 5.0 2.5 3.1Georgia VF 387 560 1,052 1,290 75.5 7.0 22.6 TFHungary TF .. 9,979 8,638 8,814 -7.2 -6.7 2.0 TF 0.4 0.4 4.6 1.4 -1.1 5.9Lithuania TF 1,083 2,000 1,486 .. 9.0 -31.8 .. TCE -12.1 -12.1 -4.3 -17.3 -14.5 10.2 9.2 9.0 -2.1Poland TF 17,400 15,200 14,975 12,960 3.1 -4.4 -13.5 TF -18.6 -18.6 -8.6 -11.2 -15.9 -17.3Rep Moldova TF 18 23 13 7 -43.5 0.0 -46.2 TFRomania TCE 867 1,430 1,551 1,466 -3.5 12.4 -5.5 TCE -18.7 -17.8 -18.4 -18.9 -16.3 -21.0 8.1 -2.9 -11.1 -10.1Russian Federation TF 19,940 .. .. 1.3 .. .. VF -10.8 -10.8 3.4 6.2 8.8 -6.3Slovakia TCE 1,053 1,498 1,665 1,740 6.4 4.5 4.5 TCE -28.4 -28.4 -22.5 -34.7 -27.3 9.8 16.7 -0.6 -5.5Ukraine TF 6,431 17,631 23,122 25,392 7.4 22.1 9.8 TF -19.9 -19.9 12.3 12.3 12.3 1.1
Southern/Mediter. Eu. 139,846 158,712 177,872 178,943 7.2 4.6 0.6 -9.2 -12.3 -8.5 -11.2 -15.6 -2.6 5.8 3.6 -1.2 -4.3Albania TF .. 2,205 2,724 .. .. 23.5 VF 25.1 26.2 23.2 20.3Andorra TF 2,946 2,418 2,189 2,059 -7.9 -1.7 -5.9 TF -18.4 -20.9 -12.0 -24.3 -24.4 -8.3 -21.3 -0.2 -10.6 -6.5 -8.0Bosnia & Herzg TCE 171 217 306 322 17.7 19.8 4.9 TCE -5.2 -5.0 -10.4 -6.5 1.3 -5.5 8.9 11.5 1.0 -1.3Croatia TCE 5,831 8,467 9,307 9,415 2.3 7.5 1.2 TCE -4.1 -20.0 10.2 -12.2 -33.9 8.1 29.9 0.4 0.6 -0.8Cyprus TF 2,686 2,470 2,416 2,404 -2.8 0.6 -0.5 TF -8.9 -15.2 -7.1 -19.3 -16.4 -0.4 -9.2 4.4 2.2 -3.2 -1.3F.Yug.Rp.Macedonia TCE 224 197 230 255 2.6 13.7 10.8 TCE 8.4 6.7 8.2 8.0 4.5 12.6 15.5 7.7 12.3 9.1Greece TF 13,096 14,765 17,518 .. 8.6 9.2 .. TCE -26.3 -25.8 -26.8 5.7 -5.4 -5.0 -9.4Israel TF 2,417 1,903 2,068 2,572 -4.1 13.3 24.4 TF -19.2 -21.7 -21.7 -19.5 -23.3 -12.8 -20.1 31.5 36.4 18.7 13.6Italy TF 41,181 36,513 43,654 42,734 12.4 6.3 -2.1 TF -5.4 -5.4 -6.5 -3.3 -6.3 -2.6 2.6 -3.7 -5.1Malta TF 1,216 1,171 1,244 1,291 -4.0 10.6 3.8 TF -12.9 -17.8 -19.1 -10.6 -21.4 -3.1 22.0 11.4 0.0 -10.3Montenegro TCE 74 272 984 1,047 38.9 160 6.4 TCE(3) -5.1 -10.1 -6.4 -16.1 -6.2 -22.4 7.6 32.4 8.6 2.6 4.2Portugal TF 12,097 10,612 12,321 .. 6.3 9.2 .. TCE -13.6 -21.3 -13.3 -21.4 -25.4 2.0 21.1 3.8 1.4 -8.4San Marino THS 43 50 69 .. 0.0 38.0 .. VF -9.6 -17.5 -11.6 -14.6 -22.2 1.4 10.9 -3.6 -4.4 -3.3Serbia TCE 453 696 646 3.6 48.5 -7.1 TCE(3) 2.5 -0.4 -15.2 -3.0 19.3 10.1 -3.7 -6.4 -7.0 -10.5Slovenia TCE 1,090 1,555 1,751 1,771 4.0 8.3 1.1 TCE -12.5 -14.2 1.4 -25.3 -18.2 1.2 -19.0 5.6 2.2 -0.2 -1.1Spain TF 46,403 55,914 58,666 57,316 3.7 1.1 -2.3 TF -11.8 -16.3 -9.8 -15.9 -20.8 -1.7 -11.7 5.2 1.3 -5.1 -9.0Turkey TF 9,586 20,273 22,248 24,994 -6.7 17.6 12.3 TF -1.5 -4.5 -4.0 0.5 -8.2 4.5 -1.8 14.6 17.4 9.4 10.0
Source: World Tourism Organization (UNWTO) © (Data as collected by UNWTO June 2009)See box at page 2 for explanation of abbreviations and signs used (1) Including holiday dwellings(2) Hotels only(3) From 2007 on, arrivals from Montenegro / Serbia are included as foreign

25
Volume 7 • No. 2 • June 2009
As broad generalisations, it seems that business travel is more heavily affected than leisure, that domestic and short-haul travel is holding up better than long-haul, that length of stay and spending are down more than arrivals, that secondary holidays (short stays, etc) seem to have been sacrificed more often than main holidays, and that the cruise market is performing better than average. In terms of forward bookings, especially, cruise numbers have brought some solace to destinations such as Turkey, Greece and Malta. However, consumers are tending to leave bookings until the last moment, partly because of their lack of confidence in their employment prospects and financial situations, and partly in the hope of picking up last-minute special offers and bargains. But, for varying reasons, there are plenty of exceptions among the individual destinations. As for individual business travel and the meetings industry, many corporations (especially in the USA and UK) are ‘banning’ travel and meetings. The UK, France, Germany, Netherlands, Spain and Austria, among others, report heavy declines in business travel and events. But Brussels reports that its business travel and meetings sectors are being sustained by demand related to the European Commission and to multinationals based in Brussels. On the other hand, Romania reports a decline in corporate team-building expeditions. Another common observation is that domestic and short-haul leisure tourism is holding up better than long-haul. This has several dimensions and complications. Firstly, Europe’s major long-haul markets, including those in North America and Asia Pacific, are themselves in recession and, for various reasons, preferring destinations closer to home. But in Spain and Portugal, for whom the prosperous segments of some Latin American markets are relatively important, long-haul may be doing better than short-haul, partly because they are euro-denominated destinations which are finding it difficult to compete in the European mass market with lower-cost destinations like Turkey, Croatia and Egypt. And some European destina-tions are still seeing increases from ‘emerging’ long-haul markets, such as India, China and several countries in the Middle East and South-East Asia. Secondly, European travellers are themselves choos-ing to travel closer to home. In most European countries, this is benefiting both the domestic market and the closest neighbours. In the UK, taking domestic holidays is defi-nitely in fashion but France also reports that the British are coming across the Channel in roughly their usual numbers. In France, international hotel nights were down 15% through April, and domestic down only 4%. By way of evidence of the ‘closer to home’ trend, Croatia reports that Germans, Austrians, Swiss and Italians arriving by car are preferring Istrian resorts in the north to Dalmatian resorts further south. Greece reports a slackening in demand from most of its traditional European markets, but continued growth from neighbouring countries in the Balkans. Other Balkan countries report similar trends. But in some of the Central and Eastern European countries with the most severe economic crises,
consumers are so constrained that even domestic tourism is suffering.
The monthly or quarterly statistics included in this issue have been compiled by the UNWTO Secretariat based on preliminary data as disseminated by the institutions (e.g. National Tourism Authorities, Statistics Offices, Central Banks) of the various countries and territories through websites, news releases, and bulletins, or provided through direct contacts with officials or through international organisations such as the Caribbean Tourism Organization (CTO), the European Travel Commission (ETC), Eurostat, the Pacific Asia Travel Association (PATA) or the South Pacific Tourism Organization (SPTO). Information in this issue reflects data available at the time of preparing the UNWTO World Tourism Barometer. Whenever necessary, updated data will be included over time as it becomes available and without further notice. In the tables on International Tourist Arrivals for the various UNWTO regions, series are chosen that can serve as an indicator of trends in tourism development to selected destinations. The monthly series represented do not coincide in all cases with the annual series usually reported for the various countries (e.g. visitor arrivals or nights instead of tourist arrivals) and sometimes only relate to a part of the total tourism flow (e.g. air traffic, specific entry points). Please refer to the notes on page 2 for further explanations. The (sub)regional totals are approximations for the whole (sub)region prepared by UNWTO based on trends in the countries with data available. The data on International Tourism Receipts offers additional information on the development of inbound tourism, while the data on International Tourism Expenditure serves as an indicator of trends in outbound tourism. Both series correspond to the respective Travel Credit and Travel Debit items in the Services section of the Balance of Payments. And both cover all transactions related to the consumption by international visitors of, for instance, accommodation, food and drinks, fuel, transport in the country of destination, entertainment, shopping, etc. Data includes transactions generated by tourists (overnight/same-day visitors) as well as by same-day visitors (excursionists, including cruise passengers). It does not cover expenditure on international transport contracted outside the traveller’s country of residence, which is included in the Balance of Payments under the separate item ‘Transportation, passenger services’. The institutions responsible for the Balance of Payments generally estimate travel expenditure from a visitor survey or outbound survey and/or bank records of international transactions (exchange of foreign currencies in and outside the country, credit card payments, transactions between tourism businesses, etc). So as not to be influenced by exchange rate fluctuations, the percentages included in the tables are based on values in local currencies, except where otherwise indicated.
Countries that are not included in this overview, but which have monthly data at their disposal, are kindly requested to contact the UNWTO Secretariat at [email protected].

26
Volume 7 • No. 2 • June 2009
International Tourism Receipts
US$ Local currencies, current prices (% on previous year)2000 2005 2006 2007 2008* Series 06/05 07/06 08/07 2009* 2008*
(million) YTD Q1 Jan Feb Mar Apr May Q1 Q2 Q3 Q4
Europe 231,326 350,307 378,273 435,087 473,526
Northern Europe 36,051 54,254 61,181 70,720 69,855Denmark 3,694 5,278 5,562 6,220 6,687 4.5 2.4 0.7 -8.8 -8.8 7.8 -0.1 -3.1 3.1Finland 1,411 2,186 2,375 2,837 3,118 7.6 9.5 2.4 0.9 0.9 4.6 3.0 -1.3 5.7Iceland 229 409 443 539 583 20.7 11.2 48.5 104.0 104 14.8 22.0 31.2 149Ireland 2,633 4,806 5,346 6,066 6,294 10.2 3.9 -3.3 -13.4 -13.4 -0.3 1.0 -3.6 -10.6Norway 2,163 3,495 3,774 4,453 4,663 7.5 7.8 0.8 -13.5 -13.5 5.8 6.6 -0.9 -1.7Sweden 4,064 7,405 9,084 12,002 12,482 21.1 21.0 1.4 14.4 14.4 -1.9 -10.8 8.6 10.8United Kingdom 21,857 30,675 34,597 38,602 36,028 sa 11.5 2.6 1.6 -4.6 -4.6 2.5 9.5 -1.8 -3.4
Western Europe 81,495 123,221 131,849 149,603 162,018Austria 9,784 16,054 16,643 18,885 21,791 2.7 4.0 7.5 -10.5 -10.5 14.7 1.0 3.0 4.8Belgium 6,592 9,868 10,295 10,898 12,396 3.4 -3.0 6.0 -21.2 -21.2 1.9 -33.3 -30.5 1.9 16.8 4.5 -0.7France 30,757 44,018 46,345 54,273 55,595 4.3 7.3 -4.6 -3.5 -3.1 3.8 -0.2 -11.3 -4.4 1.8 1.4 -11.4 -3.5Germany 18,693 29,173 32,801 36,038 40,018 11.4 0.7 3.5 -8.9 -8.1 -2.8 -10.8 -10.5 -10.9 2.1 3.8 2.5 5.5Luxembourg 1,806 3,613 3,614 4,021 4,490 -0.9 1.9 4.0 1.1 1.1 8.6 5.1 4.0 -0.8Netherlands 7,217 10,475 11,348 13,305 13,375 7.3 7.4 -6.3 -18.9 -18.9 11.6 -11.4 -8.8 -13.1Switzerland 6,645 10,020 10,802 12,182 14,352 8.6 8.0 6.3 -0.9 -0.9 8.7 7.9 5.4 3.3
Central/Eastern Europe 20,371 32,687 38,222 48,450 57,996Azerbaijan 63 78 117 178 190 $ 49.9 52.0 7.0 5.0 9.4 5.7 8.0Belarus 93 253 286 325 365 $ 13.0 13.5 12.5 10.9 15.2 15.8 7.0Bulgaria 1,074 2,412 2,612 3,130 3,804 7.3 9.8 13.7 -3.1 -8.8 -8.9 -8.4 -8.9 12.0 12.8 13.6 11.7 -0.1Czech Rep 2,972 4,677 5,541 6,632 7,722 11.7 7.5 -2.0 -7.1 -7.1 10.0 -1.9 -10.8 -4.1Estonia 508 971 1,024 1,035 1,214 4.5 -7.3 9.7 -4.4 -4.4 32.4 6.9 4.0 2.7Georgia 97 241 313 384 447 $ 29.5 22.7 16.4 33.7 46.9 -2.5 2.3Hungary 3,757 4,111 4,233 4,728 6,032 € 2.0 2.3 18.9 10.9 10.9 10.4 12.9 25.2 23.0Kazakhstan 356 701 838 1,013 1,012 $ 19.6 20.9 -0.2 4.8 5.1 -2.1 -6.7Kyrgyzstan 15 73 167 346 .. $ 128.5 106.9 .. 61 64.8 20.8Latvia 131 341 480 671 803 39.5 28.3 11.9 13.2 13.2 24.8 8.9 7.1 13.7Lithuania 391 921 1,038 1,153 1,338 11.8 1.8 8.4 -14.7 -14.7 12.4 7.3 9.5 0.9Poland 5,702 6,287 7,221 10,506 11,653 10.2 29.8 -3.5 3.1 3.1 -6.3 3.1 -8.9 -0.6Rep Moldova 39 103 112 164 202 $ 8.3 47.0 23.2 26.3 42.4 34.4 -5.0Romania 359 1,061 1,298 1,608 2,002 € 21.2 13.4 16.0 -28.9 -30.0 -41.6 -33.7 -13.8 -26.0 25.3 15.7 9.0 17.5Russian Federation 3,429 5,870 7,628 9,607 11,943 $ 30.0 25.9 24.3 45.6 32.0 25.1 1.1Slovakia 433 1,210 1,513 2,013 2,584 19.8 10.6 11.0 -19.9 -17.4 -22.4 8.8 10.5 6.3 17.6Ukraine 394 3,125 3,485 4,597 5,768 $ 11.5 31.9 25.5 -32.4 -32.4 36.9 37.8 28.2 -8.9
Southern/Mediter. Eu. 93,409 140,145 147,021 166,314 183,657Albania 389 860 1,010 1,373 1,782 € 16.3 24.5 21.0 -4.1 -4.1 29.7 11.8 19.0 26.1Bosnia & Herzg 233 520 604 728 816 15.1 10.4 4.7 9.4 6.0 3.0 2.1Croatia 2,782 7,463 7,902 9,254 10,971 € 4.9 7.3 10.5 -6.0 -6.0 17.3 15.8 6.9 19.9Cyprus 1,941 2,331 2,400 2,685 2,737 1.8 3.9 -4.8 -7.5 -12.8 -11.6 -10.8 -14.8 -0.3 1.8 -1.3 -6.8 -0.9F.Yug.Rp.Macedonia 38 90 129 185 228 € 41.5 31.8 15.6 25.0 15.8 18.2 3.5Greece 9,219 13,731 14,259 15,513 17,114 2.9 -0.3 2.8 -11.6 -18.2 -16.7 -24.1 -15.1 -2.2 7.8 8.5 1.5 -4.7Israel 4,114 2,783 2,755 3,095 4,057 $ -1.0 12.4 31.1 -17.5 -17.5 33.3 42.9 31.6 17.3Italy 27,493 35,398 38,130 42,651 45,727 6.7 2.5 -0.1 -8.9 -8.9 -6.2 -11.4 -9.2 1.8 1.2 2.0 -7.7Malta 587 755 767 910 950 0.7 8.7 -2.7 4.7 -1.1 -2.0 -11.1Montenegro .. 268 362 630 .. 34.0 59.4 -12.7 90.9 3.8 10.7Portugal 5,243 7,712 8,377 10,145 10,943 7.6 10.9 0.5 -10.6 -15.0 -9.6 -15.4 -18.9 0.1 8.7 1.2 -0.7 -4.2Serbia .. 308 398 531 944 $ 29.3 33.5 77.7 -26.1 -26 -30.0 -26.2 -21.6 103 89.4 92.0 36.5Slovenia 965 1,805 1,953 2,483 3,059 7.2 16.5 14.8 -8.5 -8.5 -1.0 -13.0 -11.8 15.9 15.2 11.4 19.5Spain 29,967 47,970 51,122 57,645 61,628 5.6 3.3 -0.4 -17.2 -17.2 -13.3 -17.8 -20.4 5.4 1.3 0.2 -8.0Turkey 7,636 18,152 16,853 18,487 21,951 $ -7.2 9.7 18.7 -6.0 -11.1 -9.7 -9.9 -13.2 7.7 28.4 25.9 14.4 16.3
Source: World Tourism Organization (UNWTO) © (Data as collected by UNWTO January 2009)See box at page 2 for explanation of abbreviations and signs used

27
Volume 7 • No. 2 • June 2009
Although the numbers of domestic and short-haul leisure trips may be holding up relatively well (which may mean moderate increases or declines), spending is falling. People are choosing cheaper accommodation, restaurants and attractions. Self-catering holidays and visits to friends and relatives (VFR) are popular. Camping and caravanning in the Netherlands and Denmark are reported to be increasing. Individual destinations report strong interest in all-inclusive packages, fully independent travel and internet searches and bookings, but this probably reflects intense interest in finding bargains rather than a trend in favour of any one of these (mutually somewhat conflicting) options. City breaks and other short trips, as secondary holidays, are often reported to be heavily down. In Belgium, new and renovated museums in Brussels and Wallonia were not sufficient to halt this trend. But some experts note the emergence of the ‘nano-trip’ – a one-night short break.
UNWTO Panel of Tourism Experts Europe
Source: World Tourism Organization (UNWTO) ©
Muchbetter
Better
Equal
Worse
Muchworse 25
50
75
100
125
150
175
T1 T2 '03 T3 T1
T2 '04 T3 T1
T2 '05 T3 T1
T2 '06 T3 T1
T2 '07 T3 T1
T2 '08 T3 T1 T2
'09 T3
EvaluationProspects
Muchbetter
Better
Equal
Worse
Muchworse 25
50
75
100
125
150
175
T1 T2'03
T3 T1 T2'04
T3 T1 T2'05
T3 T1 T2'06
T3 T1 T2'07
T3 T1 T2'08
T3 T1 T2'09
T3
ProspectsEvaluation
Prospects The strong fluctuations in monthly arrivals figures, the uncertainties about economic trends and the tendency, in current conditions, for consumers to postpone their bookings until the last moment (especially in some key markets like the UK) make it very difficult to assess prospects for the all-important summer season. But it seems that consumers were a little more confident in April and May than they had been earlier in the year. Coupled with the idea that, however willing they have been to postpone or cancel their secondary holidays, they will be determined to protect their principal summer holidays, this is allowing the optimists in the tourism and travel industry to hope that the arrivals figures over the next four months will be only slightly lower than those in the same period of 2008. However, there is general agreement that consumers will be economising: length of stay will be shorter and spending lower. A frequent observation is the importance of relative exchange rates, and especially the strength of the euro against the US dollar, pound sterling and the floating cur-rencies of some countries in Scandinavia and Eastern
Europe – to the direction of tourism flows. But it should be noted that the extravagant shifts in relative exchange rates that took place in September-October 2008 have since been gradually and erratically unwound, partly if not com-pletely. This is not to deny that some euro-denominated destinations (including Greece, Spain and Portugal) are suffering from a persistent disadvantage in pricing, but the factor is not as powerful as once seemed likely. Many destinations are reporting reductions in capac-ity, with bankruptcies among accommodation and service providers and reductions in employment. Tour operators have seen a big cut-back in advance bookings. If last-minute bookings for summer holidays prove as good as the optimists hope, some of this capacity can presumably be restored reasonably quickly – and many destinations still have excess capacity, as investments begun during the boom come on stream. But airline capacity has also been reduced significantly, especially on less intensive (often, recently introduced) routes. And this capacity will be clearly more difficult to restore at short notice. Destinations which had been diversifying into new, smaller markets in Europe may find themselves relying more heavily on their traditional markets again, and new smaller destinations in Europe may find themselves short of airlift capacity. Destinations voicing such fears include Malta, Estonia, Latvia and Lithuania (where the national carrier, Flylal, has ceased operations) and, in Spain, the Canaries and Balearic Islands. Most of the responses from the Panel of Experts in Europe were written in the lull between the first reports of the outbreak of the influenza A(H1N1) and the recent surge in the numbers of reported cases in many countries. Nevertheless, several experts mention the problem as a threat of unpredictable dimensions. Time will tell whether the optimism about the summer season in Europe is fulfilled. But analysts are warning that the apparent revival in European economies is limited in scope: business activity is still declining and disposable incomes are set to fall. Most countries in Europe are undergoing a fundamental shift towards government spending, at the expense of private spending. However this shift is financed by increases in taxation, by inflation or by declines in real incomes – and it suggests that, beyond the summer season, any recovery in tourism generated within Europe will be modest. As for individual destinations, Austria hopes to benefit from Linz being this year’s European Capital of Culture, and of the 200th anniversary of Haydn's death to attract the European market. Despite worsening economic conditions, the Austrian Government has decided that the budget for tourism will not be reduced in 2009. On the contrary – an additional budget of 4 million euro has been allocated for promotion. Some 3 million will go to domestic tourism and the rest to countries with borders with Austria, a trend common to many European destinations (for complete information on stimulus measures by country see www.unwto.org/trc - Response Actions).

28
Volume 7 • No. 2 • June 2009
Asia and the Pacific Results Experts in Asia and the Pacific were among the most negative in terms of their evaluation of tourism’s performance in the first four months of 2009. But, while their rating of prospects for the next four-month period remains modest (at 76), some now seem to believe that recovery is in sight – if not yet around the corner. The region suffered a 6% decline in arrivals from January to April and the industry generally expects the decline to continue through the first half of 2009, at least. Oceania has turned in the best performance of all subregions in Asia and the Pacific this year so far, recording a drop in arrivals of 4% through April. This compares with estimated declines of 6% for North-East and South-East Asia and 12% for South Asia. The first part of the year has been significantly affected by the economic conditions as growth slowed considerably in Asia and consumer and business confidence started to stall. In the short term, much will also depend on developments with regard to the influenza A(H1N1) virus. While the media in Asia have been relatively quiet on the subject, even after WHO raised its alert level to phase 6, or pandemic status, the effects of SARS in 2003 is still vivid in both consumers’ and the industry’s memories. But any impact will only show up in arrivals for the months of May and June.
International Tourist Arrivals, monthly evolution Asia and the Pacific (million)
Source: World T ourism Organization (UNW TO) ©
0
2
4
6
8
10
12
14
16
18
20
Jan Feb Mar Apr May Jun Jul Aug Sep Oct Nov Dec
200720082009*
In the past few months, Asian source markets like China and India have been among the few worldwide showing growth, with most of this for intra-regional destinations. But demand has definitely been dampened by the influenza A(H1N1) outbreak as many people fear not only the virus while travelling but being put in quarantine, either in the destination or once back in their countries. And there are lingering fears surrounding the possible mutation of the virus. Meanwhile, other factors have also played a significant role in influencing tourism demand in Asia since the beginning of the year. The global economic
situation, which has resulted in a decline in air traffic to/from and within the region, has led to a number of airlines reducing capacity (and parking aircraft) – IATA reports an 8% decline in capacity through May. Tourism demand has also been negatively affected by factors such as the residual effects of the Mumbai terrorist attacks in late November 2008 and the civil unrest leading to airport closures in Thailand at the end of the year, with some of that activity spilling over into 2009. Leading destinations in Oceania, Australia (-1%) and New Zealand (-4%) contributed to limiting the overall decline. In New Zealand’s case, all major long-haul markets were down, but Australia continued to show positive growth. Experts in Australia say that all sectors have been affected by the global financial crisis and the influenza A(H1N1) outbreak.
International Tourist Arrivals, monthly evolution Asia and the Pacific (% change)
Source: World Tourism Organization (UNWTO) ©
-15
-10
-5
0
5
10
2008 2009*
Although data is missing for many destinations in the subregion, few Pacific islands recorded positive growth in the first three to four months of 2009. The exceptions were the Cook Islands (+2.5%), Kiribati (+87%), Samoa (+10%) and Vanuatu (+33%). Among those suffering declines, French Polynesia was down 27% (to April) and the Marshall Islands 30%. Since most countries in North-East Asia achieved double-digit growth in the first few months of 2008, the declines seen for the January through April period this year seem even more dramatic. Nevertheless, two destinations – the Republic of Korea and Taiwan (pr. of China) – bucked the trend with increases in arrivals of 19% and 14%, respectively. In both cases, this was due to strong demand from China, although the Republic of Korea also benefited from increases in other markets, notably Japan and South-East Asia, because of the weak Korean won. Taiwan (prov. of China) has seen numbers from mainland China soar since the market was officially opened up in July 2008. Elsewhere in the subregion, tourism performance was not so good, with Hong Kong (China) recording a 2% decline, and China and Macao (China) a drop of 9%. Although most experts cite the global economic crisis as the main reason for the drop in arrivals, some of the blame lays with the influenza A(H1N1) outbreak, which has

29
Volume 7 • No. 2 • June 2009
dampened demand from leading Asian markets since end-April – the main sources of business for these destinations. The Japanese school excursion segment has been particularly hard hit, affecting longer-haul destinations like Australia and New Zealand as well. And data shows it also caused a sharp drop in travel to Hong Kong (China) in May (-16%), reversing the still positive trend in the first four months. Macao’s tourist arrivals have fallen due to a drop in casino business (as a result of the credit crunch) and Beijing’s curb on mainland Chinese travelling to the city. Nevertheless, more than 50% of visitors are day-trippers
and these seem to have been the most affected, although the opening of new hotel capacity must have seriously impacted average occupancy and hotel revenues. South-East Asia’s 6% decline is largely attributed to the estimated 15% drop in arrivals in Thailand in the first four months. The Tourism Authority of Thailand (TAT’s) recently reduced its forecast to 12 million foreign arrivals in 2009 (compared with 14 million forecast at the start of the year and 14.6 million achieved in 2008). The Thai Hotels Association (THA) says that average hotel occupancy in the first five months of 2009 plunged to 50%, compared with 70% in a ‘normal’ period.
International Tourist Arrivals by Country of DestinationChange Monthly or quarterly data series
(% change over same period of the previous year)Series 2000 2005 2007 2008* 06/05 07/06 08*/07 Series 2009* 2008*
(1000) (%) YTD Q1 Jan Feb Mar Apr May Q1 Q2 Q3 Q4 Asia and the Pacific 110,142 153,551 181,890 184,123 8.0 9.7 1.2 -6.1 -7.7 -5.2 -10.9 -7.1 -1.2 8.4 3.4 -1.8 -4.3
North-East Asia 58,349 85,875 100,926 100,981 7.0 9.8 0.1 -5.6 -7.5 -4.7 -9.7 -8.2 -0.2 -11.6 9.8 1.8 -4.5 -5.4China TF 31,229 46,809 54,720 53,049 6.6 9.6 -3.1 TF -9.0 -11.3 -10.8 -7.9 -14.6 -3.2 -8.2 9.6 -3.0 -9.3 -7.7Hong Kong (China) TF 8,814 14,773 17,154 17,320 7.1 8.4 1.0 TF -2.5 0.6 7.0 -9.1 3.4 1.5 -16.0 5.3 4.1 -2.2 -2.3Japan VF 4,757 6,728 8,347 8,351 9.0 13.8 0.0 VF -27.0 -27.2 -18.4 -41.3 -22.3 -19.7 -34.0 10.6 9.3 -2.0 -16.0Korea, Republic of VF 5,322 6,023 6,448 6,891 2.2 4.8 6.9 VF 18.7 24.3 25.3 25.7 22.2 20.8 0.8 12.0 6.3 4.0 5.9Macao (China) TF 5,197 9,014 9,621 10,605 18.5 -9.9 10.2 TF -9.1 -8.3 1.0 -17.0 -8.3 0.5 -21.1 17.3 16.7 7.4 1.0Taiwan (pr. of China) VF 2,624 3,378 3,716 3,845 4.2 5.6 3.5 VF 13.9 2.2 -6.9 -3.8 15.5 48.1 16.4 8.3 2.9 4.2 -0.8
South-East Asia 36,076 48,543 59,662 61,617 9.4 12.3 3.3 -6.3 -7.1 -4.3 -13.0 -4.3 -3.6 7.2 6.6 2.6 -3.0Cambodia TF 1,333 1,873 2,001 19.4 17.7 6.8 TF -4.4 -5.5 -3.8 -9.2 -3.5 -0.1 16.2 9.2 7.4 -4.6Indonesia TF 5,064 5,002 5,506 6,234 -2.6 13.0 13.2 TF(1) -2.4 0.0 8.0 -9.4 1.8 -10.0 15.7 8.1 13.1 16.2Malaysia TF 10,222 16,431 20,973 22,052 6.8 19.5 5.1 TF 3.4 2.2 5.1 -7.4 8.6 7.0 1.2 3.9 8.2 7.5Myanmar TF 208 232 248 193 13.5 -5.9 -22.1 TF -1.1 -0.4 6.6 1.7 -8.1 -3.8 -30.6 -27.4 -39.4 24.0Philippines TF 1,992 2,623 3,092 3,139 8.4 8.7 1.5 TF 8.5 5.2 -0.8 -6.3Singapore TF 6,062 7,079 7,957 7,778 7.2 4.9 -2.2 VF -12.1 -13.6 -12.8 -15.1 -13.1 -6.1 -13.0 6.8 -0.2 -4.5 -7.8Thailand TF 9,579 11,567 14,464 14,584 19.5 4.6 0.8 TF -14.8 -15.8 -11.9 -23.2 -12.1 -11.2 12.9 13.6 -3.4 -18.0Vietnam VF 2,140 3,478 4,229 4,236 3.0 18.0 0.2 VF -18.8 -16.1 -17.7 -1.4 -26.8 -16.8 -28.5 6.4 10.0 -1.5 -13.8
Oceania 9,631 10,985 11,202 11,089 0.2 1.7 -1.0 -3.7 -5.8 -2.0 -8.7 -6.5 4.0 1.6 -1.2 -1.8 -2.7Australia VF 4,931 5,499 5,644 5,582 0.6 2.0 -1.1 VF -1.1 -3.5 2.7 -7.3 -4.9 7.4 0.4 -1.7 -0.4 -2.7Cook Is TF 73 88 97 94 4.4 5.1 -3.0 TF 2.5 1.8 -0.5 4.3 2.0 4.2 0.3 -6.1 -2.8 -2.6Fiji TF 294 550 539 583 -0.9 -1.1 8.2 TF -24.8 -27.6 -21.7 19.3 7.6 6.8 1.5French Polynesia TF 252 208 218 196 6.5 -1.5 -10.0 TF -27.4 -26.6 -23.7 -29.8 -26.2 -29.6 -9.4 -7.2 -8.3 -15.1Guam TF 1,287 1,228 1,225 1,140 -1.3 1.1 -6.9 TF -10.5 -9.1 -9.4 -10.8 -7.1 -4.0 -21.5 -1.8 -1.0 -11.3 -13.3Kiribati TF 5 3 5 .. 45.1 6.9 .. VF 87.0 87.0 23.5 62.0 212.0 -19.5 -40.5 -4.4 4.9Marshall Is TF 5 9 7 6 -36.8 24.1 -16.7 TF -29.7 -20.4 8.8 -44.7 -14.8 -60.9 -26.3 -29.9 14.0 -6.6N.Mariana Is TF 517 498 385 388 -13.9 -10.3 0.8 VF -5.1 -2.9 2.1 -11.5 1.7 -12.5 1.0 10.0 -2.5 0.8New Caledonia TF 110 101 103 104 -0.2 2.9 0.3 TF -6.2 -11.3 -5.5 -10.1 -17.4 10.9 3.8 4.6 -5.4 -0.4New Zealand VF 1,787 2,383 2,466 2,459 1.6 1.8 -0.3 VF -3.6 -7.4 -3.7 -8.5 -9.7 9.2 1.0 4.2 -3.6 -2.1 -1.5Palau TF 58 86 93 .. 0.3 7.7 .. TF -13.5 -11.8 -9.6 -20.2 -4.7 -19.5 2.9 -15.4 -19.7 -4.0Papua New Guinea TF 58 69 104 120 12.2 34.0 15.4 TF 0.7 9.1 -9.1 -1.2 15.7 13.4 10.2Samoa TF 88 102 122 122 13.8 5.6 -0.5 TF 10.1 7.7 3.4 14.1 6.9 16.7 -2.5 0.4 -2.9 2.5Vanuatu TF 58 62 81 91 9.7 18.8 12.3 VF 32.8 32.8 32.5 26.0 42.0 15.8 -6.2 24.2 55.4
South Asia 6,085 8,147 10,100 10,436 20.8 2.6 3.3 -11.8 -14.1 -17.3 -11.3 -13.5 -2.7 -5.4 9.4 5.6 2.0 -3.3Bhutan TF 8 14 21 28 27.3 21.6 31.2 TF -7.1 -31.7 25.4 -38.0 -38.0 34.4 41.4 37.6 5.0 37.9India TF 2,649 3,919 5,082 5,367 13.5 14.3 5.6 TF -10.6 -13.8 -17.6 -10.6 -12.8 -3.4 -1.9 12.2 9.3 8.6 -4.9Maldives TF 467 395 676 683 52.3 12.3 1.1 TF -10.3 -10.8 -4.8 -13.9 -13.3 -8.8 5.1 2.4 -1.6 -2.1Nepal TF 464 375 527 .. 2.3 37.2 .. VF(2) -7.8 -16.7 -15.8 -16.2 -17.6 15.8 -5.0 16.0 -3.9 -6.2 8.8Pakistan TF 557 798 840 823 12.5 -6.6 -2.0 TF -10.5 -12.8 -14.3 -7.2 -15.5 -3.5 -5.7 -1.0 -7.0 5.9Sri Lanka TF 400 549 494 438 1.9 -11.7 -11.2 TF -19.8 -21.3 -32.4 -15.7 -10.5 -12.4 -20.6 0.7 -1.5 -26 -15.6
Source: World Tourism Organization (UNWTO) © (Data as collected by UNWTO June 2009)See box at page 2 for explanation of abbreviations and signs used (1) Foreign arrivals through thirteen selected Ports of Entry (2) Air arrivals only

30
Volume 7 • No. 2 • June 2009
Apart from Vietnam (-19%) – highly affected by events in Thailand as a significant part of long-haul travellers uses this country as a gateway to enter Vietnam and other Mekong destinations – and Singapore (-12%), other South-East Asian destinations have all managed to contain their losses, resulting in relatively modest declines in arrivals. For Indonesia (-2%), this was due to positive growth for Bali, now fully recovered from the tragic terrorist attacks in 2002 and 2005. And Malaysia even recorded an increase (+3%) in the first four months. But the general consensus seems to be that demand is well down and not expected to recover in the short term. Hoteliers in Singapore are taking the opportunity of
reducing room inventory so they can remodel and upgrade their room stock in preparation for better times. South Asia’s 12% drop in arrivals is partly attributable to the dramatic 20% decline for Sri Lanka (through May) as the county struggled to limit the damage wrought by the continued unrest and violence. But in terms of overall numbers, India’s 11% drop has had a far greater impact. And all other destinations in the subregion recorded negative performances in the first three or four months of this year, some in double digits. Both the Maldives (-10%) and Bhutan (-7%) say their declines are due to a drop in demand from Western markets, notably the UK, Germany, and Italy, as well as Japan in Bhutan’s case.
International Tourism Receipts
US$ Local currencies, current prices (% on previous year)2000 2005 2006 2007 2008* Series 06/05 07/06 08/07 2009* 2008*
(million) YTD Q1 Jan Feb Mar Apr May Q1 Q2 Q3 Q4
Asia and the Pacific 85,349 135,316 156,948 186,962 207,557
North-East Asia 39,427 65,340 75,235 85,775 97,507China 16,231 29,296 33,949 37,233 40,843 $ 15.9 9.7 9.7 -12.9 -15.4 -19.0 -9.2 -17.2 -10.0 -8.7 13.1 -3.7 -12.9 -4.1Hong Kong (China) 5,907 10,294 11,638 13,754 15,300 12.9 18.7 11.0 2.3 2.3 13.9 14.2 14.0 4.0Japan 3,373 6,630 8,469 9,334 10,821 34.8 11.6 1.8 -20.5 -22.1 -14.7 -34.2 -17.7 -16.2 10.9 8.3 -1.2 -9.6Korea, Republic of 6,834 5,806 5,788 6,138 9,078 $ -0.3 6.1 47.9 43.1 49.9 63.0 98.6 9.2 22.4 38.7 30.4 28.6 85.9Taiwan (pr. of China) 3,738 4,977 5,136 5,213 5,182 $ 3.2 1.5 -0.6 17.5 17.5 -2.7 -1.0 -1.7 2.8
South-East Asia 26,830 34,546 43,915 55,355 60,831Cambodia 304 840 963 1,135 1,221 $ 14.7 17.8 7.6Indonesia 4,975 4,522 4,448 5,346 7,375 $ -1.6 20.2 38.0 -14.5 -14.5 40.9 31.7 37.8 41.6Malaysia 5,011 8,847 10,424 14,047 15,277 14.1 26.3 5.5 0.6 0.6 1.3 4.0 8.2 8.8Philippines 2,156 2,265 3,501 4,931 4,388 $ 54.6 40.8 -11.0 -35.6 -35.6 -31.5 -38.4 -36.8 -0.5 0.7 -18.7 -22.7Singapore 5,142 6,211 7,535 9,162 10,575 15.8 15.3 8.4 0.8 0.8 23.7 7.9 5.1 -0.3Thailand 7,489 9,576 13,401 16,669 17,651 31.8 13.3 2.2 -19.0 -19.0 17.2 17.3 0.4 -21.2
Oceania 14,295 25,745 26,296 32,041 34,095Australia 9,274 16,866 17,840 22,298 24,660 7.3 12.5 10.3 11.0 10.3 13.6 7.4 10.4 12.9 11.4 13.2 7.4 9.6Marshall Is 3 6 7 5 3New Zealand 2,272 5,169 4,738 5,400 4,912 -0.5 0.6 -4.9 -1.5 -1.5 -4.1 -1.0 -6.2 -8.3Solomon Is 4 3 4 4 4 26.8 -14.4 1.6 -4.6 -18.3 34.2 -6.5Tonga 7 15 16 15 .. 11.2 -8.8 196 22.8
South Asia 4,797 9,685 11,502 13,790 15,125Bangladesh 50 70 80 76 .. 22.8 -4.8 12.5 25.3Bhutan 10 19 24 30 39 $ 29.4 24.4 30.1 37.3 29.0 11.2 36.3India 3,460 7,493 8,634 10,729 11,832 18.4 13.4 16.0 -6.8 -13.2 -15.4 -12.3 -11.9 7.6 8.7 18.2 18.1 16.8 6.5Iran 467 1,069 1,452 1,486 .. $ 35.9 2.3 .. 2.2 2.5 2.3Maldives 321 287 512 602 636 $ 78.8 17.6 5.6Nepal 158 132 128 198 336 -1.1 41.8 77.9 24.8 25 111 90.5 38.7 82.4Pakistan 81 182 255 276 245 $ 40.1 8.2 -11.2 -25.0 -25.0 -16.7 -30.4 -28.0 -7.7 -9.0 -10.8 -18.2Sri Lanka 248 429 410 385 342 -1.2 0.0 -13.0 -0.1 -3.7 -29.0 -16.0
Source: World Tourism Organization (UNWTO) © (Data as collected by UNWTO January 2009)See box at page 2 for explanation of abbreviations and signs used Prospects Uncertainty reigns. This is clear from the wide range of comments – many conflicting – regarding Asia and the Pacific’s tourism prospects over the next four months. The Pacific Asia Travel Association (PATA), a reliable sounding board, believes that the current four-month
period will be “worse than it was last year [when arrivals showed a very modest increase], but better (perhaps) than from January through April 2009”. But this is a marginal call, PATA says, as the signs of some easing in the rate of decline in visitor numbers are very patchy and numbers could still plummet again. This next period also has to factor in the lingering impacts of the influenza A(H1N1) outbreak.

31
Volume 7 • No. 2 • June 2009
UNWTO Panel of Tourism Experts Asia and the Pacific
Source: World Tourism Organization (UNWTO) ©
25
50
75
100
125
150
175
T1 T2'03
T3 T1 T2'04
T3 T1 T2'05
T3 T1 T2'06
T3 T1 T2'07
T3 T1 T2'08
T3 T1 T2'09
T3
ProspectsEvaluation
Muchbetter
Better
Equal
Worse
Muchworse
Muchbetter
Better
Equal
Worse
Muchworse
Among the positive developments reported by experts in the region, several stimulus measures aimed at increasing demand have been implemented, and a lot of additional financial resources have been pumped into the marketplace, and this period might see some of those actually pay off. The lifting of restrictions on foreign ownership of travel agencies and tour operators in China should also result in more competitive package tour rates in the future, boosting demand. Hong Kong (China) has lifted visa restrictions for Russians in an effort to stimulate arrivals from that market and the Macao Government, as part of its overall economic stimulus package, is allocating US$ 12.5 million in subsidies for the tourism industry, including airlines, over a six-month period. Cambodia’s Ministry of Tourism has embarked on a major new promotional strategy, involving cross-border cooperation with its neighbours and improved airline access. Singapore is counting on its usually successful annual event, the Great Singapore Sale in June, to stimulate demand in neighbouring markets, and aggressive marketing by the government of the Republic of Korea, together with a weak won, is expected to continue to generate increased arrivals. At the same time, eight Asian visitor bureaus have united to boost the continent’s market share in the growing global business events industry by relaunching the Asian Association of Convention and Visitor Bureaus (AACVB). A new agenda is being implemented and will be driven by the eight CVBs from China, Hong Kong (China), the Republic of Korea, Macao (China), Malaysia, Philippines, Singapore and Thailand.
Preannouncement
3rd UNWTO/PATA Forum on Tourism Trends and Outlook 15 – 17 November, 2009
Guilin, China This 3rd edition of the Forum is jointly organised by the World Tourism Organization (UNWTO) and Pacific Asia Travel Association (PATA), hosted by Guilin Municipal People’s Government and in collaboration with Hong Kong Polytechnic University. The forum will provide a platform for governments, industry and academics to analyze the current economic situation and its impact on tourism, with a focus on sharing market intelligence and strategies on response and the way forward. Against this background, the forum will: • Analyze the current economic situation and its impact on the tourism sector with a special focus on Asia and the Pacific • Debate the short-term prospects for international tourism, focusing on major source markets’ behaviour and changes • Identify and explore the long-term key tourism trends that will shape the future of the sector, focusing on the Asia Pacific region. The two-day Conference will be divided into two sessions: • The technical session (first day) is aimed at a select audience of practitioners and will provide a platform to exchange views, experiences and practises with regard to the current tourism trends resulting from the on-going economic crisis. • The plenary session (second day) is open to a broader audience and will focus on practices and recovery strategies adopted by Asia Pacific destinations and the industry at times of adverse economic situations, short- and long-term prospects and benefits, and strategies for future tourism development in the Asia Pacific region. The forum is aimed at participants from the following areas: • Senior management and research officials from National Tourism Administrations and National Tourism Organizations • Practitioners from tourism industries (tour operators, hotels, transport services, telecommunications, financial bodies, consultancy firms, etc) • Research institutes and universities
For more information: www.unwto.org/asia/activities/en/upcoming.php
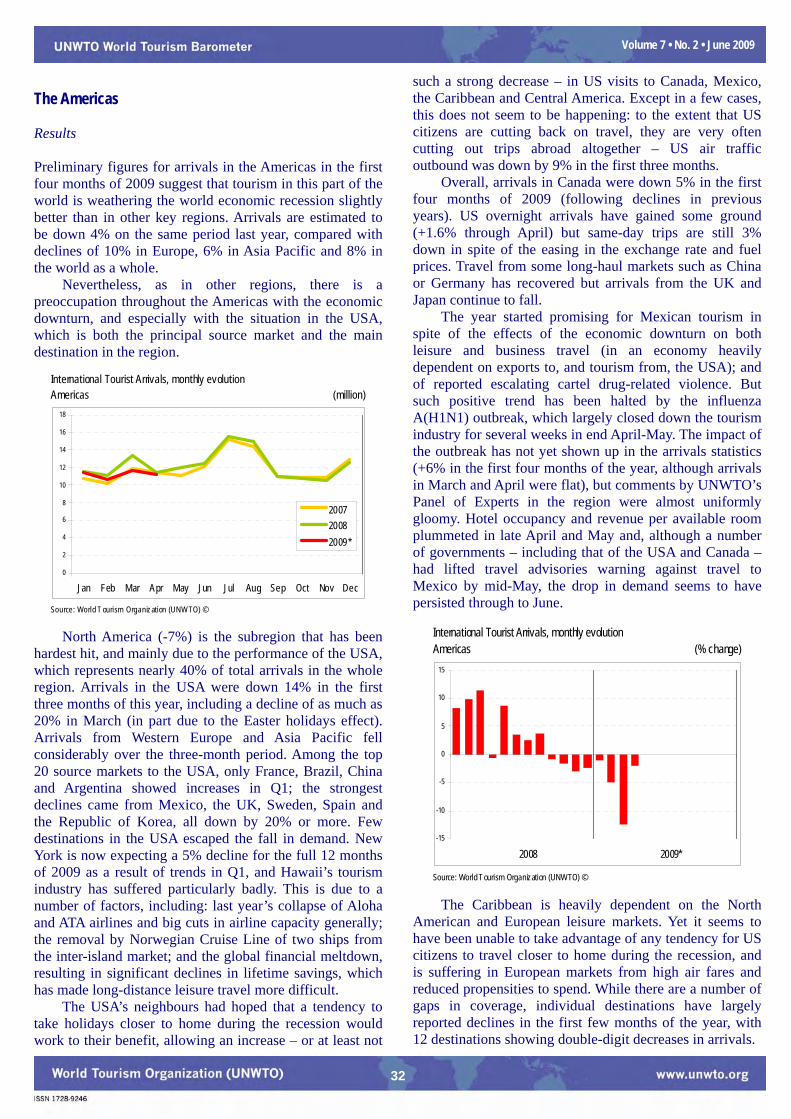
32
Volume 7 • No. 2 • June 2009
The Americas Results Preliminary figures for arrivals in the Americas in the first four months of 2009 suggest that tourism in this part of the world is weathering the world economic recession slightly better than in other key regions. Arrivals are estimated to be down 4% on the same period last year, compared with declines of 10% in Europe, 6% in Asia Pacific and 8% in the world as a whole. Nevertheless, as in other regions, there is a preoccupation throughout the Americas with the economic downturn, and especially with the situation in the USA, which is both the principal source market and the main destination in the region.
International Tourist Arrivals, monthly evolutionAmericas (million)
Source: World T ourism Organization (UNW TO) ©
0
2
4
6
8
10
12
14
16
18
Jan Feb Mar Apr May Jun Jul Aug Sep Oct Nov Dec
200720082009*
North America (-7%) is the subregion that has been hardest hit, and mainly due to the performance of the USA, which represents nearly 40% of total arrivals in the whole region. Arrivals in the USA were down 14% in the first three months of this year, including a decline of as much as 20% in March (in part due to the Easter holidays effect). Arrivals from Western Europe and Asia Pacific fell considerably over the three-month period. Among the top 20 source markets to the USA, only France, Brazil, China and Argentina showed increases in Q1; the strongest declines came from Mexico, the UK, Sweden, Spain and the Republic of Korea, all down by 20% or more. Few destinations in the USA escaped the fall in demand. New York is now expecting a 5% decline for the full 12 months of 2009 as a result of trends in Q1, and Hawaii’s tourism industry has suffered particularly badly. This is due to a number of factors, including: last year’s collapse of Aloha and ATA airlines and big cuts in airline capacity generally; the removal by Norwegian Cruise Line of two ships from the inter-island market; and the global financial meltdown, resulting in significant declines in lifetime savings, which has made long-distance leisure travel more difficult. The USA’s neighbours had hoped that a tendency to take holidays closer to home during the recession would work to their benefit, allowing an increase – or at least not
such a strong decrease – in US visits to Canada, Mexico, the Caribbean and Central America. Except in a few cases, this does not seem to be happening: to the extent that US citizens are cutting back on travel, they are very often cutting out trips abroad altogether – US air traffic outbound was down by 9% in the first three months. Overall, arrivals in Canada were down 5% in the first four months of 2009 (following declines in previous years). US overnight arrivals have gained some ground (+1.6% through April) but same-day trips are still 3% down in spite of the easing in the exchange rate and fuel prices. Travel from some long-haul markets such as China or Germany has recovered but arrivals from the UK and Japan continue to fall. The year started promising for Mexican tourism in spite of the effects of the economic downturn on both leisure and business travel (in an economy heavily dependent on exports to, and tourism from, the USA); and of reported escalating cartel drug-related violence. But such positive trend has been halted by the influenza A(H1N1) outbreak, which largely closed down the tourism industry for several weeks in end April-May. The impact of the outbreak has not yet shown up in the arrivals statistics (+6% in the first four months of the year, although arrivals in March and April were flat), but comments by UNWTO’s Panel of Experts in the region were almost uniformly gloomy. Hotel occupancy and revenue per available room plummeted in late April and May and, although a number of governments – including that of the USA and Canada – had lifted travel advisories warning against travel to Mexico by mid-May, the drop in demand seems to have persisted through to June.
International Tourist Arrivals, monthly evolutionAmericas (% change)
Source: World Tourism Organization (UNWTO) ©
-15
-10
-5
0
5
10
15
2008 2009*
The Caribbean is heavily dependent on the North American and European leisure markets. Yet it seems to have been unable to take advantage of any tendency for US citizens to travel closer to home during the recession, and is suffering in European markets from high air fares and reduced propensities to spend. While there are a number of gaps in coverage, individual destinations have largely reported declines in the first few months of the year, with 12 destinations showing double-digit decreases in arrivals.

33
Volume 7 • No. 2 • June 2009
International Tourist Arrivals by Country of DestinationChange Monthly or quarterly data series
(% change over same period of the previous year)Series 2000 2005 2007 2008* 06/05 07/06 08*/07 Series 2009* 2008*
(1000) (%) YTD Q1 Jan Feb Mar Apr May Q1 Q2 Q3 Q4
Americas 128,193 133,335 142,851 147,187 1.9 5.2 3.0 -5.4 -6.4 -1.0 -4.9 -12.4 -2.0 9.8 3.7 2.0 -2.2North America 91,507 89,892 95,287 97,795 0.8 5.2 2.6 -6.8 -7.7 -1.9 -4.8 -14.4 -4.1 9.9 3.6 1.3 -2.8
Canada TF 19,627 18,771 17,931 17,128 -2.7 -1.8 -4.5 TF -4.7 -8.2 -3.0 -7.6 -12.8 4.0 -1.9 -4.9 -4.6 -5.6Mexico TF 20,641 21,915 21,370 22,637 -2.6 0.1 5.9 TF 5.9 7.7 14.3 10.8 -0.6 0.2 5.4 2.9 6.5 9.1United States TF 51,238 49,206 55,986 58,030 3.6 9.8 3.6 TF(1) -14.3 -14.3 -9.1 -11.5 -19.9 15.4 7.6 3.2 -6.0
Caribbean 17,086 18,821 19,770 20,251 3.4 1.6 2.4 -6.5 -7.5 -2.6 -7.9 -11.2 -3.5 8.9 2.9 -0.5 -3.7Anguilla TF 44 62 78 68 17.5 6.4 -12.1 TF -21.4 -18.8 -23.5 -13.0 -13.2 -4.3 -16.8Antigua,Barb TF 207 267 262 266 2.2 -4.0 1.4 TF(2) -14.2 -14.1 -9.8 -14.5 -17.6 -11.3 -18.4 8.8 7.6 -1.8 -9.2Aruba TF 721 733 772 827 -5.2 11.2 7.1 TF -8.0 -8.0 -2.3 -7.7 -13.3 20.6 9.2 2.0 -2.1Bahamas TF 1,544 1,608 1,528 1,463 -0.5 -4.6 -4.2 TF(2) -15.2 -16.2 -15.2 -14.7 -17.9 -12.4 3.4 -2.1 -8.9 -11.6Barbados TF 545 548 575 568 2.7 2.1 -1.2 TF -8.6 -8.6 -7.2 -8.1 -10.3 10.8 -11.1 0.4 -4.2Bermuda TF 332 270 306 264 10.9 2.2 -13.7 TF -22.4 -17.3 -26.0 -8.9 -12.2 -13.7 -19.7Bonaire TF 51 63 74 74 1.6 16.9 0.0 TF 5.1 12.2 -3.5 -12.2Br.Virgin Is TF 272 337 358 346 5.7 0.5 -3.4 TF -25.1 -13.8 -36.2 3.6 -3.4 -3.1 -13.3Cayman Islands TF 354 168 292 303 59.3 9.1 3.9 TF -12.5 -14.3 -9.4 -12.8 -18.8 -6.7 9.0 9.7 7.1 -11.3Cuba TF 1,741 2,261 2,119 2,316 -4.9 -1.4 9.3 VF 2.1 2.0 7.9 1.2 -2.4 1.6 3.7 15.2 14.3 2.9 1.8Curaçao TF 191 222 300 409 5.5 27.9 36.4 TF 47.8 29.8 16.3Dominica TF 70 86 88 .. 7.7 -5.3 .. TF -3.1 6.7 32.5 -37.8 20.4 -6.3 -10.9 -10.2 -2.0Dominican Rp TF 2,978 3,691 3,980 3,980 7.4 0.4 0.0 TF -3.7 -5.2 -2.4 -6.4 -6.8 -3.2 2.4 6.8 3.2 -4.5 -7.3Grenada TF 129 99 129 124 20.4 8.8 -4.1 TF -4.6 -4.6 11.9 -9.2 -16.9 -0.4 -7.9 -1.5 -7.4Jamaica TF 1,323 1,479 1,701 1,767 13.5 1.3 3.9 TF 2.0 0.2 4.2 2.2 -4.5 7.8 13.3 3.7 -0.4 -1.2Martinique TF 526 484 503 480 4.0 -0.1 -4.6 TF -11.1 -11.1 -5.6 -6.5 -20.0 -2.4 -4.3 -7.5 -4.5Montserrat TF 10 10 8 7 -17.8 -2.7 -5.0 TF -11.4 -12.6 -9.3 -13.6 -14.2 -7.1 -5.7 -7.9 -2.9 -3.8Puerto Rico TF 3,341 3,686 3,687 3,894 1.0 -0.9 5.6 THS(3) -10.0 -10.0 -4.1 -12.3 -12.9 -0.5 -4.6 -0.2 -4.8Saba TF 9 11 12 12 -3.9 6.0 3.2 TF 1.4 1.9 7.0 -1.1 0.0 0.1 1.9 10.4 4.4 -4.3Saint Lucia TF 270 318 287 296 -4.9 -5.0 2.9 TF -8.8 -13.7 -7.6 -13.2 -18.9 8.8 -9.0 17.7 0.6 -0.7 -6.6St.Maarten TF 432 468 469 475 0.0 0.3 1.3 TF(2) -16.1 -16.1 -8.3 -14.1 -24.7 7.6 2.2 5.6 -11.2St.Vincent,Grenadines TF 73 96 90 .. 2.0 -8.0 .. TF -12.9 1.2 -24.2 -16.1 -4.8 -5.3 5.5US.Virgin Is TF 546 582 510 .. -2.1 -10.5 .. VF(2) -10.1 -12.7 -5.8 -6.2 -23.4 -2.1 6.4 2.4 -5.8 -14.4
Central America 4,346 6,301 7,752 8,310 9.8 12.0 7.2 -3.7 -4.5 4.5 -6.3 -11.6 -1.1 14.0 8.8 4.3 1.8Belize TF 196 237 252 244 4.5 1.8 -3.1 TF -7.7 -2.4 -12.4 1.7 -3.2 -4.5 -6.3Costa Rica TF 1,088 1,679 1,980 2,089 2.7 14.8 5.5 TF -12.0 -12.0 0.0 -17.5 -18.9 18.7 4.7 4.0 -6.7El Salvador TF 795 1,127 1,339 1,385 13.5 4.7 3.5 TF -22.1 -18.9 -4.6 -18.6 -30.9 -20.6 -33.6 8.8 15.0 -5.6 -1.9Guatemala TF .. 1,448 1,527 .. .. 5.4 VF 4.1 3.9 4.6 5.7 1.6 4.6 6.2 3.1 5.8 6.1Honduras TF 471 673 831 899 9.8 12.6 8.2 TF 2.5 2.5 5.8 5.8 -3.8 17.7 5.4 3.5 5.7Nicaragua TF 486 712 800 858 5.2 6.8 7.2 TF 10.8 4.5 13.3 8.3 -6.5 37.3 7.0 9.0 6.5 4.2 9.4Panama TF 484 702 1,103 1,308 20.1 30.8 18.6 TF 2.7 3.3 17.2 -4.2 -2.4 0.7 25.8 23.6 17.4 8.5
South America 15,255 18,322 20,041 20,832 2.7 6.5 3.9 0.2 -2.1 0.5 -2.1 -5.6 10.8 9.3 3.6 7.5 0.0Argentina TF 2,909 3,823 4,562 4,665 9.2 9.3 2.3 TF -8.9 -8.9 5.2 3.1 5.6 -4.3Brazil TF 5,313 5,358 5,026 5,050 -6.4 0.2 0.5 TFChile TF 1,742 2,027 2,507 2,699 11.1 11.3 7.7 TF 4.4 0.5 9.8 1.1 -13.6 20.2 12.4 14.7 -1.5 6.9 5.6Colombia VF 557 933 1,195 1,222 12.9 13.5 2.2 VF 11.2 7.5 9.6 5.6 7.3 24.2 3.4 2.6 6.9 -3.7Ecuador VF 627 860 937 1,005 -2.2 11.5 7.2 VF -1.2 -3.7 -5.0 -0.1 -5.4 10.4 -3.8 7.0 4.2 8.5 8.9Guyana TF 105 117 131 133 -2.7 15.9 1.0 TF -0.3 -7.1 -10.3 -5.5 -5.9 11.3 7.9 6.0 -15.9 -2.9 23.3Paraguay TF 289 341 416 428 14.0 7.0 3.0 TF 5.6 3.7 1.2 1.9 9.5 12.5 -12.0 1.4 17.1 2.4Peru TF 828 1,571 1,916 2,058 9.6 11.4 7.4 TF 1.5 0.2 0.7 -1.8 1.9 6.0 12.5 13.2 9.1 -4.4Uruguay TF 1,968 1,808 1,752 1,921 -3.2 0.2 9.7 TF 7.3 1.4 1.4 2.6 -0.6 47.6 18.0 3.3 12.9 2.0
Source: World Tourism Organization (UNWTO) © (Data as collected by UNWTO June 2009)See box at page 2 for explanation of abbreviations and signs used (1) Excluding Mexican visitors not travelling beyond the 25 miles U.S. border zone(2) Non-resident air arrivals only(3) Non-resident hotel registrations only

34
Volume 7 • No. 2 • June 2009
International Tourism Receipts
US$ Local currencies, current prices (% on previous year)2000 2005 2006 2007 2008* Series 06/05 07/06 08/07 2009* 2008*
(million) YTD Q1 Jan Feb Mar Apr May Q1 Q2 Q3 Q4
Americas 130,801 145,241 154,506 171,286 188,067
North America 101,472 107,363 112,538 124,897 138,485Canada 10,778 13,760 14,642 15,333 15,106 -0.4 -0.8 -2.1 -2.2 -2.2 0.8 -3.4 -3.5 -0.6Mexico 8,294 11,803 12,177 12,852 13,289 $ 3.2 5.5 3.4 -7.6 -8.5 -7.5 -7.5 -10.5 -4.1 5.7 6.8 4.8 -3.8United States 82,400 81,799 85,720 96,712 110,090 sa 4.8 12.8 13.8 -13.2 -11.9 -6.7 -9.8 -18.9 -17.1 24.2 21.7 13.9 -2.8
Caribbean 17,156 20,811 22,224 23,226 23,516Anguilla 56 86 107 109 .. 25.0 1.9 -4.0 -13.3 2.6Antigua,Barb 291 335 327 338 .. -2.5 3.4 8.6 4.7 -2.3Aruba 815 1,094 1,080 1,255 1,412 -1.3 16.3 12.5 22.9 21.4 9.8 -2.2Bahamas 1,734 2,069 2,056 2,187 2,153 -0.6 6.4 -1.6 4.9 -4.0 -2.4 -5.0Barbados 723 897 1,057 1,199 1,192 17.8 13.5 -0.6 7.4 7.4 -5.7 -11.5Bermuda 431 429 494 568 431 15.2 -15.1 -20.0 -28.1 -29.8Bonaire 59 87 91 110 121 4.6 20.5 10.5 30.6 9.1 -2.7 2.3Cayman Islands 559 356 513 479 353 44.1Cuba 1,737 2,150 2,127 2,141 2,267 -13.7 -13.7 23.6 15.8 6.9 -5.9Curaçao 189 244 277 327 378 13.6 18.1 15.6 33.6 18.7 19.0 -3.0Dominica 48 56 72 74 .. 28.9 3.9 10.4 -0.6 5.5Dominican Rp 2,860 3,518 3,917 4,064 4,176 $ 11.3 3.8 2.8 -7.9 -7.9 3.3 6.3 1.8 -1.0Grenada 93 71 94 110 .. 31.4 17.3 5.5 -12.3 -8.4Jamaica 1,333 1,545 1,873 1,897 1,872 $ 21.2 1.3 -1.3 0.4 -12.3 -3.2 -1.6Montserrat 9 9 8 7 .. -16.5 -0.8 -5.8 -9.6 -4.5Puerto Rico 2,388 3,239 3,369 3,414 3,645 $ 4.0 1.3 6.8Saint Lucia 281 356 294 317 .. -17.4 8.0 15.6 4.9 2.8St.Kitts-Nev 58 110 132 126 .. 19.4 -4.2 17.1 3.6 -6.8St.Maarten 512 659 651 662 663 -1.1 1.6 0.3 4.8 -4.3 3.6 -3.3St.Vincent,Grenadines 82 105 113 111 .. 7.8 -1.8 -33.3 -34.3 -22.3
Central America 2,958 4,668 5,383 6,217 6,798Belize 111 214 260 291 281 21.7 11.7 -3.3 -2.0 -2.9Costa Rica 1,302 1,671 1,732 2,029 2,250 $ 3.7 17.1 10.9 25.0 10.8 10.1 -2.2El Salvador 217 543 793 847 894 $ 46.0 6.8 5.6 18.0 30.3 8.1 -28.9Guatemala 482 791 919 1,055 1,068 $ 16.1 14.8 1.3 1.9 -2.8 2.4 3.3Honduras 260 463 488 557 621 $ 5.4 14.0 11.5 16.4 1.0 15.6 14.0Nicaragua 129 206 231 255 276 $ 11.8 10.6 8.3 16.1 16.1 16.9 6.0 5.0 5.2Panama 458 780 960 1,185 1,408 23.1 23.4 18.8 7.2 7.2 17.0 22.6 21.3 15.3
South America 9,215 12,400 14,361 16,946 19,268Argentina 2,904 2,729 3,344 4,314 4,633 $ 22.5 29.0 7.4 -11.5 -11.5 3.0 17.1 27.3 -4.9Bolivia 68 239 244 292 275 $ 2.3 19.6 -5.9 5.7 5.7 -15.1 -15.1Brazil 1,810 3,861 4,316 4,953 5,785 $ 11.8 14.8 16.8 -12.5 -11.5 -16.7 -12.5 -4.7 -11.6 -17.0 20.7 17.0 22.4 7.9Chile 819 1,109 1,213 1,478 1,757 $ 9.4 21.8 18.9 2.6 2.6 33.6 33.9 11.9 3.8Colombia 1,030 1,222 1,554 1,669 1,844 $ 27.2 7.4 10.5 10.1 10.0 16.7 5.5Ecuador 402 486 490 623 763 $ 0.8 27.3 22.4 22.0 20.0 22.5 24.9Paraguay 73 78 92 102 105 $ 17.9 11.3 3.1 1.2 9.6 -12.3 16.3Peru 837 1,308 1,570 1,723 1,991 $ 20.0 9.7 15.6 3.5 3.5 20.1 18.6 15.3 9.1Uruguay 713 594 598 809 1,042 $ 0.6 35.3 28.9 23.7 5.1 48.2 37.4Venezuela 423 650 768 817 895 $ 18.2 6.4 9.5
Source: World Tourism Organization (UNWTO) © (Data as collected by UNWTO January 2009)See box at page 2 for explanation of abbreviations and signs used

35
Volume 7 • No. 2 • June 2009
Overall arrivals in the Caribbean are estimated to have fallen by 6%. The main reasons given are sharp falls in airline capacity as well as in cruise visits. The most popular destinations have fared slightly better, with Cuba and Jamaica even recording a 2% growth from January to April and May respectively. Among the other big destinations, arrivals in the Dominican Republic fell 4% through May and those in Puerto Rico fell by 10% in the first three months of this year. Tourism in Central America through 2008 was riding high on the world economic boom and the regional integration associated with the formation of the Central American Free Trade Area (DR-CAFTA). But with the economic downturn and political and social unrest in some countries, trends in the first months of this year have been very mixed, resulting in an overall 4% decline through April. There were sharp declines in two of the most visited destinations, Costa Rica (-12%) and El Salvador (-22%) –impacted by a strong decline of arrivals from nationals residing abroad – but modest increases in the other countries except Belize. Nicaragua bucked the trend with an 11% growth through May benefiting from the elimination of visa requirements for nationals from neighbouring Costa Rica and currency depreciation. South America is the only subregion in the Americas –and the only subregion in the world apart from North and Subsaharan Africa– to resist the downward trend. Arrivals were flat in the first four months of the year, with a marked acceleration in April (+11%) that can partly be ascribed to the incidence of Easter in April this year. But this average disguises some marked variations. Given the easing of their exchange rates, many of the leading destinations might have expected a recovery in long-haul arrivals in recent months, but this has been prevented by the caution of consumers in North America and Europe about committing themselves to long-haul, and therefore more expensive destinations. Most countries are reporting that it is domestic and intra-regional demand that is sustaining growth. This applies particularly to Brazil, whose economy seems to be coming through the recession relatively better than others. The increasingly popular North-East region of the country for example is reporting a continued increase in domestic demand. Chile (+4% through May), which has achieved notable success in recent years with nature- and adventure-based attractions for long-haul visitors, has seen a decline in the long-haul market. However, this has been more than balanced by Chileans choosing to take their holidays within Chile this year, and by the continued growth in intra-regional travel (including a reversal in the previous decline in arrivals from Argentina). Uruguay (+7%) and Paraguay (+6%) have also seen a continued increase in arrivals from Brazil and a recovery in arrivals from Argentina. Bolivia has been less favoured, with social and political tensions and reports of dengue fever in the west of the country. Peru (+1.5%) and Ecuador (-1%) also report diminishing interest from North America and Europe, but arrivals in Colombia have continued to
grow (+11%), with notable success in adventure and cruise products. The only destination in South America which has so far reported a significant decline is Argentina (-9% in Q1) mostly due to the important drop in arrivals from North America and Europe. Argentina had sustained an extended increase in arrivals based on the regional prosperity and an extraordinarily favourable exchange rate, but these factors have been somehow eroded. Prospects The decline in spending power in mature North American and European markets has inevitably undermined growth for the Americas region overall, even for countries more dependent on business from neighbouring markets such as Central and South America. And this has been compounded by political and security unrest. Still South America has one of the best performances. Positive developments also include new and refreshed hotel capacity in many Caribbean destinations such as Jamaica and the permission given by the US Administration for unlimited travel to Cuba by Cuban Americans.
UNWTO Panel of Tourism Experts Americas
Source: World Tourism Organization (UNWTO) ©
25
50
75
100
125
150
175
T1 T2'03
T3 T1 T2'04
T3 T1 T2'05
T3 T1 T2'06
T3 T1 T2'07
T3 T1 T2'08
T3 T1 T2'09
T3
ProspectsEvaluation
Muchbetter
Better
Equal
Worse
Muchworse
In contrast to the situation in most of the region, there is a general sense of optimism in much of South America, which hopes to come out of a relatively shallow recession fairly quickly – an idea which is encouraged by the recent improvement in the commodities prices on which so many countries in the area depend. Consumer spending in many of these countries is still rising. But given the risk that the recession in North America and Europe might be more prolonged, continued growth will have to come mostly from domestic and short-haul markets, as it has in recent months. Countries on the west coast of South America are also looking for a possible recovery in the prospects for travel from Asia, with which they have growing economic relations. This seems unlikely in the short term as most outbound travel growth from key Asian sources has been to Asian destinations this year. But it is worth noting that China has overtaken the USA as Brazil’s most important export market which will surely fuel business traffic between the two countries.

36
Volume 7 • No. 2 • June 2009
There has been a good deal of media attention on the upturn in consumer confidence in the USA in recent months, related to the popularity of President Obama and optimism about his team’s economic policies. This contrasts sharply with the warnings from many economists and industry leaders that, whatever the latest figures for GDP, asset prices and industrial production, the pressures on consumers will continue to intensify. In May, the US Travel Association (UST) said that Americans are expected to take 322 million domestic leisure person-trips during June, July and August 2009. This represents a decline of only 2.2% on the 329 million trips taken in the same period in 2008, which suggests that the recovery in consumer confidence mentioned above may sustain leisure travel through the peak summer season, at least domestically. However, coupled with the recent monthly arrivals trends in neighbouring countries, it also suggests that Americans, cautious about their employment and earnings prospects, will tend to take their holidays within the USA. Seemingly, not even neighbouring countries, let alone long-haul destinations, will benefit. The introduction of the latest phase of the Western Hemisphere Travel Initiative (WHTI) might also discourage outbound travel to neighbouring destinations. It means that Americans who want to cross back over the border after trips to Mexico and Canada must now show passports or specially issued identification cards. Air travellers have had to show passports when returning from bordering nations since 2006, but complaints from the travel industry – and a backlog of passport applications – prompted a delay in the requirement for those arriving by land or sea. On the positive side, however, is the news that the US House of Representatives has passed legislation that will help the USA attract more international visitors with an improved visa programme. The legislation, HR 2410 – the ‘Foreign Relations Authorization Act’ – includes a provision that will allow the secretary of state to conduct a two-year pilot programme that uses secure, remote video-conferencing technology to conduct tourist visa interviews. The result, proponents argue, will be a visa process that is more convenient for foreign travellers. Also good news is the fact that the Senate recently agreed to create a tourism bill based on a proposed measure that would create a private organisation to promote the USA as a tourism destination abroad. The company would be funded by private contributions matched by up to US$ 100 million a year from the federal government. The bill also would establish assessments, including a US$ 10 per-trip fee on foreign travellers, to help pay for the government’s matching funds. It should be noted that, while generally in favour of the proposal, many in the industry are against the plan to create yet another organisation to manage the process. Canada, for now, expects no significant improvement in arrivals in the next few months, and is particularly worried about the effects of the US Government’s implementation of the final phase of the WHTI on cross-
border traffic from the USA. Meanwhile, the Mexican tourism authorities and inbound travel trade are making great efforts to allay fears and promote the destination in the aftermath of the initial A(H1N1) panic but, given the poor immediate prospects for a recovery in travel from the USA and Europe, they face an uphill struggle. Many Panel experts throughout the region – indeed, the whole world – share Mexico’s concerns about the possible evolution of influenza A(H1N1).

37
Volume 7 • No. 2 • June 2009
Africa and the Middle East Results As is often the case, there are a large number of gaps in arrivals data for Africa and the Middle East for the four months under review, so this means that current trends are somewhat approximate and may well change over time. For the moment, Africa is the only region in the world to record an increase in arrivals this year to date (+3% through April), with North Africa up 6% as against a 2% rise for Subsaharan Africa. At the other extreme, the Middle East is showing a decline so far of 18%.
International Tourist Arrivals, monthly evolutionAfrica (million)
Source: World Tourism Organization (UNWTO) ©
0
1
2
3
4
5
6
Jan Feb Mar Apr May Jun Jul Aug Sep Oct Nov Dec
200720082009*
The much better-than-average performance of Africa is reflected in the relatively positive evaluation given by UNWTO’s Panel of Experts in the region – the second time this year that they have rated the previous period’s performance more enthusiastically than experts in any other region. And, while still negative, they are relatively bullish about prospects for the months of May through August, perhaps suggesting that they feel less concerned by either the global economic crisis or the influenza A(H1N1) outbreak than industry players in other parts of the world. Middle East experts, on the other hand, are a lot less enthusiastic about the region’s tourism performance so far this year, yet they remain more optimistic (or rather, less pessimistic) than experts in any other region except Africa about the outlook for the current four-month period. North Africa’s strong performance is attributable to Morocco’s 10% increase from January to April, with the Easter holidays in Europe boosting arrivals in April by 24%. Morocco’s appeal as a short-break and main holiday destinations has been sustained due to new resort development, attractive prices (at least, in comparison to those in eurozone destinations) and strong government support of the industry. As an example, the government has set aside more than US$ 37 million for promotions and to help attract new airlines to the country. Morocco saw growth in arrivals from all markets, except the UK, and a
significant 25% increase in arrivals of Moroccans residing abroad. Tunisia enjoyed 1% growth in the first five months, and 9% in April (also thanks to Easter). The government is focusing on a long-term tourism strategy aimed at a higher degree of diversification of the country’s tourism products and markets.
International Tourist Arrivals, monthly evolution Middle East (million)
Source: World Tourism Organization (UNWTO) ©
0
1
2
3
4
5
6
Jan Feb Mar Apr May Jun Jul Aug Sep Oct Nov Dec
200720082009*
Subsaharan Africa’s 2% increase through the month of April is an estimate based on trends from only a few countries. There is a lack of full data for the four months for all the leading destinations with the exception of Kenya, whose arrivals count (+59%) reflects the strong bounce-back from the low levels to which they plummeted last year as a result of post-election unrest. For South Africa (+2%), 2009 data is only available for January and February. Experts nonetheless report that the weakening of the rand has made it easier to sell the destination, although it is more expensive for marketing abroad. And increased competition is being felt from other countries in the region and elsewhere.
International Tourist Arrivals, monthly evolutionAfrica (% change)
Source: World Tourism Organization (UNWTO) ©
-6
-4
-2
0
2
4
6
8
10
12
2008 2009*
Among the scant news available for other destinations in the subregion, Swaziland reports a drop from long-haul markets but sustained demand from regional sources. Senegal says that business travel continues to be good but that leisure travel demand is down. And Mauritius

38
Volume 7 • No. 2 • June 2009
highlights the fact that its 10% drop in arrivals to March masks widely differing performances from one market to another. Number one source France was only down 2%, for example – much less than for other European source markets – while Asian arrivals fell by 21%. The leading destinations in the Middle East both report declines: Egypt’s arrivals fell by 10% through the month of May, while Saudi Arabia’s were down as much as 60% in Q1. Sun and beach tourism is the sector that has been hit hardest in Egypt, with Red Sea resorts such as Sharm-el-Sheikh suffering declines in occupancy rates of more than 10 percentage points. In sharp contrast, Lebanon’s tourism is continuing to recover strongly. After a 31% increase in arrivals in 2008, they continued to rise through the month of May this year, by more than 69%. In addition to the development of new tourism products and stepped-up promotions, the country is benefiting from a huge rise in demand from the Lebanese Diaspora and
regional Arab markets, which has particularly boosted rural tourism.
International Tourist Arrivals, monthly evolution Middle East (% change)
Source: World Tourism Organization (UNWTO) ©
-50
-40
-30
-20
-10
0
10
20
30
40
50
60
2008 2009*
International Tourist Arrivals by Country of DestinationChange Monthly or quarterly data series
(% change over same period of the previous year)Series 2000 2005 2007 2008* 06/05 07/06 08*/07 Series 2009* 2008*
(1000) (%) YTD Q1 Jan Feb Mar Apr May Q1 Q2 Q3 Q4
Africa 27,886 37,279 45,107 46,960 11.1 8.9 4.1 3.1 1.1 5.9 2.3 -4.5 9.0 6.7 3.6 1.0 6.2North Africa 10,240 13,911 16,349 17,223 8.4 8.5 5.4 6.4 2.2 5.3 5.2 -2.5 16.6 10.6 7.5 1.0 7.3
Morocco TF 4,278 5,843 7,408 7,879 12.2 12.9 6.4 TF 9.8 4.4 7.9 7.6 -0.5 23.9 14.4 10.5 1.2 5.4Tunisia TF 5,058 6,378 6,762 7,049 2.7 3.2 4.2 TF 1.3 -0.9 1.9 2.1 -5.0 8.8 -1.1 6.2 4.8 0.6 9.5
Subsaharan Africa 17,646 23,368 28,758 29,737 12.8 9.1 3.4 1.7 0.7 6.1 1.2 -5.4 5.0 5.2 1.3 1.0 5.8Angola TF 51 210 195 294 -42.2 60.4 51.0 TF 77.4 30.1 59.7 39.3Cape Verde TF 115 198 267 285 22.2 10.4 6.7 TFGambia TF 79 108 143 147 15.7 14.3 2.9 TF -32.4 -32.4 -29.7 -49.5 -6.8 32.2 -8.6 -8.6 -22.8Guinea-Bissau TF 5 30 38 133 159 26.4 TF 65.8 43.9 10.2 -13.8Kenya TF 899 1,536 .. .. 7.0 .. .. VF(1) 59.3 65.5 41.7 113.8 55.2 39.1 -49.2 -33.2 -28.6 -13.5Lesotho TF .. 292 285 .. -15.7 -2.5 VF -5.8 -16.1 -15.6 28.5Mali TF 86 143 164 190 6.9 7.4 15.9 THSMauritius TF 656 761 907 930 3.6 15.1 2.6 TF -9.9 -9.9 -3.7 -13.5 -13.3 7.2 3.2 2.7 -2.2Senegal THS/TF 389 769 875 .. 12.6 1.0 .. TF -6.8 -8.1 -8.0 -11.6 -4.5 -2.5 0.7 -0.6 -3.5 -0.8Seychelles TF 130 129 161 159 9.3 14.7 -1.4 TF -9.0 -14.2 -12.1 -15.5 -14.7 -4.1 4.9 7.0 2.3 -4.1 -9.7Sierra Leone TF 16 40 32 36 -15.8 -5.1 12.5 TFSouth Africa TF 5,872 7,369 9,091 9,592 13.9 8.3 5.5 VF -2.2 -2.2 5.8 -2.9 -9.6 12.0 3.8 1.1 5.7Swaziland THS 281 839 870 .. 4.1 -0.4 .. VF -0.8 -0.8 7.8 0.3 -9.9 -3.7 -8.0 -4.4 1.7Togo THS 60 81 86 74 16.5 -8.6 -14.0 THS
Middle East 24,866 37,856 47,048 55,609 8.4 14.6 18.2 -18.1 -22.4 -39.5 -12.9 -10.0 -6.6 24.3 35.8 4.8 15.5Egypt TF 5,116 8,244 10,610 12,296 4.9 22.7 15.9 VF -9.5 -13.4 -12.4 -13.2 -14.3 -2.4 -6.0 25.1 22.6 15.1 3.7Jordan TF 1,580 2,987 3,430 3,729 8.0 6.4 8.7 TF 2.7 -0.5 -2.6 -0.8 1.7 10.0 -14.9 2.4 19.1 26.3Lebanon TF 742 1,140 1,017 1,333 -6.7 -4.3 31.0 TF 69.2 53.6 22.7 84.9 57.5 64.2 126.8 7.3 20.9 43.8 39.4Oman THS/TF 571 1,114 1,124 1,273 19.9 -15.9 13.3 THSPalestine THS 310 88 264 370 39.8 115 40.0 THS -10.4 -10.4 29.9 13.0 -44.8 75.2 77.4 -4.7 41.8Saudi Arabia TF 6,585 8,037 11,531 14,757 7.3 33.8 28.0 TF -60.1 -60.1 -79.5 -49.0 -20.6 53.6 75.1 -21.8 27.0Syrian Arab Republic TF 2,100 3,571 4,158 5,430 18.5 -1.7 30.6 VF 2.1 2.1 11.2 23.6 41.7 29.2Untd Arab Emirates THS 3,907 7,126 .. .. .. .. .. THS(2) 3.0 3.0 5.7 9.7 2.2 14.5Yemen THS 73 336 379 404 13.8 -0.8 6.6 THS 12.9 -12.3 6.1 20.6
Source: World Tourism Organization (UNWTO) © (Data as collected by UNWTO June 2009)See box at page 2 for explanation of abbreviations and signs used (1) Tourist arrivals in the International Airports of Jomo Kenyatta, Mobassa and Moi, as well as by Cruise Ships(2) Dubai only

39
Volume 7 • No. 2 • June 2009
Jordan’s 3% increase masks a drop in demand for corporate meetings and conferences. But this gap has been filled to some degree by new leisure markets, including religious/pilgrimage tourism. There is no data available for the United Arab Emirates but Dubai reports a 3% increase in Q1 – hoteliers account for a drop in corporate travel business, while leisure package tours are reportedly doing quite well as a result of low rates and big discounts. Cruise arrivals in Dubai are also reported to be up 25% on 2008. Prospects If the sentiment of the experts from the Middle East/Africa is an accurate reflection of things to come, prospects for both regions over the period May through August are better than for other parts of the world. However, there are a number of uncertainties, not least due to the fact that Ramadan falls much earlier this year, starting on 20 August, which will undoubtedly impact negatively on demand before the end of the current review period on the Middle East and North Africa – particularly for destinations depending heavily on intra-regional markets.
UNWTO Panel of Tourism Experts Middle East
Source: World Tourism Organization (UNWTO) ©
25
50
75
100
125
150
175
T1 T2'03
T3 T1 T2'04
T3 T1 T2'05
T3 T1 T2'06
T3 T1 T2'07
T3 T1 T2'08
T3 T1 T2'09
T3
ProspectsEvaluation
Muchbetter
Better
Equal
Worse
Muchworse
International Tourism Receipts
US$ Local currencies, current prices (% on previous year)2000 2005 2006 2007 2008* Series 06/05 07/06 08/07 2009* 2008*
(million) YTD Q1 Jan Feb Mar Apr May Q1 Q2 Q3 Q4
Africa 10,440 21,843 24,833 29,002 30,194
North Africa 3,822 7,037 8,710 10,218 10,640Morocco 2,039 4,621 5,967 7,162 7,148 28.1 11.8 -5.6 -18.7 -21.0 -19.5 -24.3 -19.8 -12.3 -0.9 9.3 -8.5 -17.6Sudan 5 89 252 262 331 $ 183 3.7 26.3 8.6 22.5 67.4 12.0Tunisia 1,682 2,143 2,275 2,575 2,932 8.9 9.0 9.5 2.9 2.9 16.3 3.3 10.1 10.7
Subsaharan Africa 6,618 14,807 16,123 18,784 19,554Botswana 222 562 537 546 553 9.2 6.9 12.6Cape Verde 41 127 228 303 350 77.5 21.6 8.0 -21.8 -21.8 18.7 18.3 4.6 -7.1Ethiopia 57 168 162 176 .. $ -3.6 8.8 .. 87.1 212 194Kenya 283 579 687 917 752 $ 18.7 33.3 -17.9 -6.5 -6.5 -34.2 -19.2 -3.2 -11.2Lesotho 23 31 36 43 33 24.7 23.5 -10.0Mauritius 542 871 1,007 1,299 1,449 24.3 27.4 1.3 -15.6 -14.1 -18.9 -12.3 -9.8 -20.3 10.7 14.0 -0.2 -15.2Mozambique 74 130 140 163 190 $ 7.8 17.0 16.3 39.3 33.7 38.8Namibia 160 348 384 434 378 17.6 17.6 2.1 -15.0 9.2 19.1 1.0Reunion 296 442 335 447 .. € -24.9 22.1 6.1 6.1Seychelles 139 192 228 285 258 19.0 51.7 28.1 96.7 49.0Sierra Leone 10 64 23 22 65 -63.2 -3.6 195.0South Africa 2,675 7,327 7,875 8,418 7,609 sa 14.4 11.2 6.0 3.1 3.1 7.6 6.9 6.5 3.0
Middle East 17,405 27,375 29,923 34,661 45,027Egypt 4,345 6,851 7,591 9,303 10,985 $ 10.8 22.6 18.1 -17.2 -17.2 39.3 42.6 15.2 -10.0Jordan 723 1,441 2,060 2,311 2,943 43.0 12.2 27.5 2.5 2.5 -3.9 19.1 41.2 49.4Kuwait 98 164 203 222 257 22.9 6.8 9.5Saudi Arabia .. 5,424 4,961 5,228 9,720 -8.6 5.4 86.1 -39.9 -39.9 -72.3 14.7 12.2 34.1 170 29.8 275
Source: World Tourism Organization (UNWTO) © (Data as collected by UNWTO January 2009)See box at page 2 for explanation of abbreviations and signs used

40
Volume 7 • No. 2 • June 2009
As in other parts of the world, airline performance is a major concern. Until now, the Middle East has been the only world region to report, according to IATA, an increase in air capacity (+11% through May) which has strongly eroded load factors. Nonetheless, there are no major indications of future capacity cuts – Emirates for example is reported to be adding 18% seat capacity this year. So some subregions may benefit. In a recently published report on Middle East Aviation, the Centre for Asia Pacific Aviation shows it is also fairly bullish about the region’s recovery prospects, maintaining that the aviation sector remains vibrant. In addition, hotel groups say they are still firmly committed to the region. However, in Africa, Namibia expects a 20% drop in arrivals as a result of Air Namibia’s announced closure of its direct service to London from May.
UNWTO Panel of Tourism Experts Africa
Source: World Tourism Organization (UNWTO) ©
25
50
75
100
125
150
175
T1 T2'03
T3 T1 T2'04
T3 T1 T2'05
T3 T1 T2'06
T3 T1 T2'07
T3 T1 T2'08
T3 T1 T2'09
T3
ProspectsEvaluation
Muchbetter
Better
Equal
Worse
Muchworse
As the northern hemisphere summer approaches booking trends suggest that the next few months could prove slightly more successful. New excavations in Egypt, especially the discovery of what is now believed to be the tomb of Cleopatra and Mark Anthony, are also generating a lot of interest. The June 2009 Confederations Cup, seen as the pre-FIFA World Football Cup event in South Africa, should boost arrivals for the destination, as should the British Lions’ Rugby Tour, and Algeria is counting on the positive impact of the Pan-African Cultural Festival it is hosting in Algiers, for which visitors from 48 countries have already registered.
In focus Industry trends This section covers issues related to different clusters of the tourism sector such as transport and accommodation. For that purpose, the UNWTO World Tourism Barometer counts on the regular collaboration of UNWTO’s Affiliate Members. Comprising private sector representatives, educational institutions, tourism associations and local tourism authorities, the Affiliate Members are key players in the promotion of public-private partnerships that support UNWTO’s overall aims – promoting responsible, sustain-able and universally accessible tourism and contributing to economic development and international understanding, with particular attention paid to the interests of developing countries (for further information see the UNWTO website at www.unwto.org/afiliados). The Secretariat is also pleased to count on the participation of Deloitte in the section dedicated to the hospitality industry. The objective for future editions is to broaden the scope of the In focus section and expand the collaboration to other organisations and sectors, such the meetings industry, the cruise sector, etc.
UNWTO is the only UN agency which groups the public and private sector among its Members. The Affiliate Members provide: • A unique networking with ministers and senior decision-
makers. • Specialized events dealing with priority areas of today
presented by leading industry experts. • Extensive and unique documents and research reports
free of charge for our Affiliates through our world class e-library.
• Valuable intangible benefits associated with the UNWTO brand as a hallmark of quality and ethics in tourism.
• Value for money: membership at € 2,400 (US$ 3,600) per year.

41
Volume 7 • No. 2 • June 2009
UNWTO Affiliate Members Gregory Duffell President and CEO Pacific Asia Travel Association (PATA) <www.pata.org>
The Pacific Asia Travel Association (PATA) is the leading authority on Pacific Asia travel and tourism. The PATA mission is to contribute to the growth, value and quality of travel and tourism within the Pacific Asia area on behalf of PATA members. 1. What has been the impact of the current financial and economic crisis on tourism (domestic and inter-national) in Asia and the Pacific? What markets and segments have been most affected?
The bad news is that the entire region, with one or two notable exceptions (Republic of Korea and Bali), is feeling the pinch. The good news is that the travel and tourism industry in the Asia Pacific region has an enviable track record in bouncing back from adversity. We’ve seen this on a number of occasions over the past 25 years, most notably following the Asian financial crisis of 1997 and the SARS outbreak in 2003. The economic downturn is providing fantastic travel deals for consumers but it is creating massive bottom line problems for the aviation and hospitality sectors. 2. How are PATA members acting in face of the crisis and what actions/initiatives is PATA undertaking to support them?
Destinations across the region are investing huge sums to attract business from the leisure and MICE markets. We’re providing advice and counsel on a daily basis and, importantly, creating opportunities for networking and business development. PATA has launched a series of webinars focussing on business opportunities, such as healthcare tourism. We’ve just returned from Pakistan where we held seminars attended by leading public and private sector operators. Our recent annual meeting in Macao (China) featured a one-day Business Forum on ‘Discovering Opportunities in Tough Times’. 3. Tourism in the Asia Pacific region has shown strong growth but has also suffered from severe setbacks over the past decade, with most notoriously the Asian financial crisis in the late 1990s and the SARS outbreak in 2003. How does the current economic crisis compare?
It’s right up there at the top of the league table! One leading hotelier in Thailand described the current situation as the worst in 20 years and it’s true that the five star hotels
are hurting. That’s partly because we’re seeing changes in travel trends. Leisure travellers are choosing destinations closer to home and staying in less expensive accommodation. LCCs such as Air Asia are bucking the trend and making money. But the drop in arrivals numbers across the region is a worry. 4. How do you see the sector after this crisis? What do you consider are the major challenges for the tourism industry in Asia?
The industry will recover –there’s no doubt about that. Leisure travel is no longer a luxury item– it’s an essential ingredient in the equation to establish a sensible work-life balance. The MICE industry is set to become increasingly competitive as more destinations create purpose-built venues. That’s good news for event organisers and meetings planners. What worries us all at PATA is the heavy discounting in the hospitality sector. The desire to slash room rates to attract business is understandable but we would prefer to see consumers being offered added-value incentives such as free nights (stay four nights, pay for three etc), breakfast, internet access, tours and spa treatments. We think it’s better to maintain room rates at a level which does not undermine the property’s fundamental financial stability and offer attractive add-ons to entice consumers. 5. Besides supporting members at this time of uncer-tainty, what are the current priorities in PATA’s agenda?
PATA is entirely about its members. We have a fantastic heritage stretching back over 58 years but it’s important that our Association is seen as being ‘fit for purpose’ in the 21st century. We must be relevant to the needs of our mem-bers, be they a global airline or a small boutique hotel. We’re now reshaping PATA, through a fundamental restruc-turing of our governance, to ensure that we do, indeed, meet the needs of our members. We’re building a new website that will provide opportunities for online networking and business transactions. We’re also, importantly, looking to strengthen our relationships with travel and tourism organisations around the world. I’m looking forward, in particular, to working closely with UNWTO’s Secretary General Taleb Rifai and his team in a number of areas. 6. What would you identify as key areas for collaboration in the near future between PATA and UNWTO?
There’s no doubt that we can do much together - our knowledge and expertise in this region can be of very great benefit to the UNWTO. We’re active in the core group of the UNWTO Tourism Resilience Committee and working very closely together on the UNWTO conference in Hangzhou this September, which immediately precedes the PATA Travel Mart in the same city. We’re also partner in the annual UNWTO/PATA Forum on Tourism Trends and Outlook in Guilin (China) scheduled for November (see announcement page 31).

42
Volume 7 • No. 2 • June 2009
Transport Airlines IATA’s Monthly International Statistics (MIS) Following a 1.8% increase in 2008 (an average that was dragged down in the second half of the year), members of the International Air Transport Association (IATA) in all regions of the world except the Middle East (including Israel and Iran) saw declines in international passenger traffic, measured in revenue passenger-km (RPK), from January through May. The worldwide traffic trend was -8%, with average passenger load factor at 72% (down from 76% in the full year 2008). The best-performing region by airline registration, the Middle East, recorded a 6% increase in RPK, while the worst was Asia Pacific (down 12%). It is important to note that these figures relate only to IATA member airlines that report monthly data, and the growth pattern of other carriers, especially low-cost carriers (LCCs) might be different. In Europe, in particular, LCCs have enjoyed growth rates well above average in recent years.
International traffic of IATA reporting carriers by region of airline registration(% change)
Source: compiled by UNWTO from IATA
-15
-10
-5
0
5
10
15
Overall North America Latin America Europe Africa Middle East Asia and Pacific
08/07 09*/08 YTD
According to IATA, international passenger demand weakened from the -3% recorded in April to -9% in May. But both the past two months have been slightly stronger than the 11% decline reached in March, even after adjusting for the distortions caused by the timing of Easter. This indicates that a floor may now have been reached, IATA says. However, the capacity adjustment of -5% in May did not keep pace with the fall in demand during the same month. Moreover, although the impact of the recession appears to be stabilising, strong headwinds from debt and low asset prices are expected to weaken and delay any significant recovery. “We may have hit bottom, but we are a long way from recovery,” said Giovanni Bisignani, IATA’s Director General and CEO, announcing the latest results. “After a 20% fall in international passenger revenue in the first quarter, we estimate that the drop accelerated to as much as -30% in May.”
As expected, May was the first full month to feel the impact of the influenza A(H1N1) virus outbreak on air travel, with Mexican carriers seeing their traffic fall almost 40% and Latin American airlines suffering a decline of 9% in May compared to the previous year. Airports The performance of IATA’s reporting carriers correlates fairly well with the results of the world’s airports, compiled by Airports Council International (ACI). The latter uses number of passengers handled as its base measure. ACI data for the months of January through April 2009 points to a 8% decline year-on-year in international passenger throughput. The Middle East was the only region showing growth (+5%), while Europe recorded the sharpest decline (-9%) followed by Asia Pacific (-8%). (ACI airport results are not yet available for the month of May). Air transport data The air transport data presented here refers to IATA members’ scheduled international passenger traffic, according to region of airline registration, as well as to the traffic of the member airlines of the major regional airline associations broken down by routes operated. It should be taken into account that this data reflects the vast majority of, but not all air traffic, as the carriers included are mostly full-service airlines and the traffic operated by charter and low-cost airlines is only reflected to a rather limited extent. Airline data is a particularly good indicator of short-term trends in medium- and long-haul traffic. For short-haul traffic, however, air transport is in competition with alternative modes of transport (in particular land-based, but also over water), and might be subject to shifts between different means of transport (depending on relative price, perception of safety, etc.). Furthermore, traffic is not expressed here in numbers of passengers carried, but rather measured in terms of revenue passenger-kilometres (RPK), with one RPK representing one paying passenger transported over one kilometre. This means that each long-haul passenger contributes more to total traffic measured in RPK than each short-haul passenger does.

43
Volume 7 • No. 2 • June 2009
Preliminary Air Transport StatisticsRevenue Passenger-Km (RPK) Capacity Load factor Passengers
2008 07/06 08/07 09*/08 Monthly data 08/07 09*/08 08/07 09*/08 08/07 09*/08
YTD Jan Feb Mar Apr May YTD YTD YTD
(bil lion) (%) (% on previous year) (%) (%) (%)
International Air Transport Association (IATA), Monthly International Statistics (MIS)Scheduled international traffic of IATA reporting carriers by region of airline registration
Overall 2,436 ¹ 7.4 1.8 -7.7 -5.6 -10.6 -10.5 -2.6 -9.3 3.7 -3.9 75.8 72.1 1.6 ¹North America 430 5.5 2.9 -9.4 -6.2 -12.2 -13.4 -4.1 -10.9 4.1 -5.2 79.9 75.2 1.0Latin America 101 8.1 10.2 -2.6 -1.4 -3.8 -6.5 7.5 -9.2 9.2 1.3 74.0 70.6 9.8Europe 857 6.3 2.2 -7.8 -5.3 -10.1 -11.5 -2.5 -9.4 3.8 -4.8 76.9 72.7 1.4Africa (incl. Egypt) 73 9.2 -4.0 -8.8 -5.3 -13.2 -13.5 -6.4 -6.0 -8.8 -6.4 70.2 70.0 4.2Middle East (incl. Israel, Iran) 240 18.1 7.1 6.0 2.9 0.4 5.1 11.5 9.5 8.7 11.8 74.9 70.6 9.3Asia and Pacif ic 735 6.8 -1.2 -11.8 -8.7 -14.4 -13.0 -7.6 -14.3 2.1 -7.5 73.4 70.7 -2.2
Air Transport Association of America (ATA) - Scheduled Passenger Traffic Statistics ATA US Member Airl ines
Scheduled mainline service 1,142 2.1 3.7 -9.6 -8.9 -12.8 -11.4 -5.5 1.0 -8.3 80.2 77.3 -0.2 -10.1
Domestic (incl. USA-Canada) 777 0.5 2.4 -10.1 -10.5 -13.2 -10.8 -6.3 -0.8 -10.4 80.5 79.0 -0.7 -10.6International 365 5.9 6.7 -8.5 -5.7 -12.1 -12.7 -3.7 5.0 -3.9 79.5 73.9 2.8 -6.5
Atlantic 181 9.7 11.2 -7.3 -4.8 -12.2 -12.4 -1.0 10.0 -2.2 79.3 71.5 6.3 -8.3Latin 90 5.6 7.6 -5.0 -2.9 -7.8 -9.0 0.4 2.4 0.0 79.0 75.5 3.1 -3.5Pacific 94 0.2 -0.7 -14.2 -9.9 -16.5 -17.2 -13.1 -1.3 -10.7 80.5 76.5 -4.4 -11.7
Asociación Latinoamericana de Transporte Aéreo (ALTA) - Member Airlines Traffic Data
Total 169 7.8 9.1 0.7 3.2 -1.7 -2.1 3.3 8.6 3.7 71.2 69.1 6.0 0.1
Domestic 66 8.1 5.6 2.7 8.5 0.6 1.0 0.1 7.3 6.1 67.4 65.5 3.1 0.5International 102 7.6 11.5 -0.6 -0.1 -3.2 -4.0 5.6 9.5 2.0 73.9 71.6 12.0 -0.7
Latin America 39 22.2 15.5 -2.3 5.1 -2.6 2.0 -13.0 15.0 4.1 71.8 67.8 15.7 2.5Extra Latin America 63 0.6 9.3 0.5 -3.0 -3.6 -7.4 20.6 6.4 0.6 75.3 74.2 6.8 -4.9
North America 34 6.2 3.1 5.7 0.8 0.3 -7.9 39.8 -0.4 6.7 74.1 73.8 3.0 -2.5Europe 23 -6.3 19.5 -2.8 -6.2 -5.4 -3.7 4.7 17.3 -6.0 76.1 74.5 23.0 -0.8Asia and the Pacific 3 26.4 10.2 -5.2 -8.5 -7.0 -4.2 -0.7 14.6 5.2 78.7 75.6 7.9 -5.5Charter 3 -26.8 11.3 -25.5 -15.7 -28.1 -35.0 -27.0 6.7 -22.9 79.9 76.3 9.4 -26.1
Association of European Airl ines (AEA) - Passenger Traffic of AEA Member Airlines
Total scheduled 792 5.4 1.2 -6.0 -3.9 -9.1 -9.1 -2.4 3.0 -3.5 76.0 72.7 -1.5 -8.2
Domestic 57 1.4 -7.4 -11.2 -15.2 -8.7 -8.4 -8.4 -4.6 -8.6 66.2 63.7 -7.8 -12.4
Total International 735 5.8 1.9 -5.7 -3.2 -9.1 -9.1 -2.0 3.7 -3.1 76.9 73.3 1.2 -6.8Cross-border Europe 185 7.2 2.0 -6.6 -6.3 -10.2 -10.2 -0.8 3.4 -3.8 68.7 63.1 0.6 -8.0North Africa 9 6.8 6.4 0.4 -4.8 -3.0 -3.0 12.6 3.3 -0.2 70.6 68.0 4.8 -0.4Middle East 29 10.2 8.2 4.7 2.9 0.5 0.5 15.1 9.3 8.8 73.7 69.3 11.5 5.9
Total long-haul 513 5.1 1.5 -6.0 -2.6 -9.4 -9.4 -3.6 3.5 -3.7 80.8 77.8 1.4 -5.8among which:
North Atlantic 199 5.4 0.0 -8.1 -4.4 -12.6 -12.6 -4.2 1.0 -6.0 81.4 75.8 -0.6 -8.2Mid At lantic 51 0.7 2.8 -4.7 -0.7 -8.2 -8.2 -3.0 3.9 -1.4 83.1 82.6 3.6 -4.8South At lantic 52 15.7 7.5 -5.0 -0.6 -8.8 -8.8 -2.6 12.9 -3.3 81.1 78.4 6.1 -5.6Far East/Australasia 154 3.3 0.6 -6.7 -3.6 -8.7 -8.7 -6.0 3.3 -3.1 80.5 78.7 1.0 -6.4Sub Saharan Africa 56 4.8 2.9 0.2 1.8 -3.0 -3.0 3.9 4.7 -0.2 77.2 76.9 3.6 2.1
Association of Asia Pacific Airlines (AAPA) - Consolidated Passenger Traffic
International operations 592 4.2 -1.4 -11.8 -9.3 -14.1 -13.2 -7.4 -15.0 1.4 -6.1 75.0 71.3 -2.1 -10.5
Arab Air Carriers Organization (AACO) - AACO members' scheduled operations
Total 255 27.1 12.9 4.6 4.6 1.8 1.9 9.7 13.1 11.0 73.6 70.5 7.5
Source: compiled by UNWTO from IATA, ATA, ALTA, AEA, AAPA and AACO¹ All IATA carriers

44
Volume 7 • No. 2 • June 2009
Air traffic on international routes by month (RPKs)(% change over same month previous year)
2007 2008 2009Source: compiled by UNWTO from IATA, AACO, AAPA, AEA, ATA and ALTA
-20
-15
-10
-5
0
5
10
15
20
25
1 2 3 4 5 6 7 8 9 10 11 12 1 2 3 4 5 6 7 8 9 10 11 12 1 2 3 4 5 6 7 8 9 10 11 12
IATAAACOAAPA
AEAATAALT A
North America Weak demand on domestic as well as international routes resulted in a 10% decline in traffic systemwide in the first four months of 2009 for the member airlines of the Air Transport Association of America (ATA), which account for some 90% of revenue passenger-miles (RPM) of US airline traffic. International services recorded an 9% decrease as against a 10% drop in demand for domestic flights. Routes to/from Latin America were the least affected (-5%), while traffic fell by 14% on Pacific routes. The number of passengers travelling on US airlines fell by 10% in April (or by 6% on international services alone). Preliminary figures suggest that May showed a very similar pattern. Meanwhile, ATA airlines’ passenger revenues fell 26% in May 2009 versus the same month in 2008 – the seventh consecutive month in which passenger revenue has fallen over the previous year. Revenue declines extended beyond the mainland USA to the transAtlantic, transPacific and Latin American markets. And, as for IATA, May results also reflect the impact of the influenza A(H1N1) outbreak.
ATA: Air traffic on selected routes by month (RPKs)(% change over same month previous year)
2007 2008 2009
Source: compiled by UNWTO from ALTA
-20
-15
-10
-5
0
5
10
15
20
1 2 3 4 5 6 7 8 9 10 11 12 1 2 3 4 5 6 7 8 9 10 11 12 1 2 3 4 5 6 7 8 9 10 11 12
DomesticLatinAtlanticPacific
Latin America The Asociación Latinoamericana de Transporte Aéreo (ALTA) reports a growth of 1% in the total traffic of its member airlines, thanks to a 3% increase on domestic routes. International traffic, meanwhile, fell by 1% – a very modest decline compared with the performance of most other airline associations. North America was the best performing route network for ALTA (+6%), but the trend for all other routes to/from points outside Latin America was negative. The number of passengers carried by ALTA members from January through April 2009 remained unchanged over the previous year but seat load factor fell by two percentage points to 69%.
ALTA: Air traffic on selected routes by month (RPKs)(% change over same month previous year)
2007 2008 2009Source: compiled by UNWTO from ALTA
-40
-30
-20
-10
0
10
20
30
40
50
1 2 3 4 5 6 7 8 9 10 11 12 1 2 3 4 5 6 7 8 9 10 11 12 1 2 3 4 5 6 7 8 9 10 11 12
DomesticLatin AmericaNorth AmericaEurope
Europe The Association of European Airlines (AEA) has reported a decline of 6% in total scheduled traffic over the first four months of 2009, with international traffic down by a similar percentage and domestic traffic falling at almost twice that level. For the month of April alone, the decline was 2%, which compared with -9% in March and -6% (adjusted for the 2008 leap year) in February. While at first sight a distinct improvement, AEA warned that the shift of the Easter traffic peak from March 2008 to April 2009 had distorted the growth rates in each of these months. The month of May is estimated to have been worse, according to AEA’s preliminary weekly figures for the last four weeks of the month and the first week of June. In response to shrinking demand airlines have been moving and reducing capacity. While the capacity adjustment is not yet in line with the unprecedented drop in demand (overall capacity is down 3% through April), AEA says it is nevertheless contributing to a cost reduction in the face of severely depressed revenues. In the four-month period, AEA members (like IATA and ATA) achieved their best traffic performance on Middle Eastern routes (+5%), with traffic flat on routes to/from North and Subsaharan Africa. The North Atlantic (-8%) and Far East/Australasia (-7%) routes suffered the sharpest declines.

45
Volume 7 • No. 2 • June 2009
AEA: Air traffic on selected routes by month (RPKs)(% change over same month previous year)
2007 2008 2009
Source: compiled by UNWTO from AACO
-20
-15
-10
-5
0
5
10
15
1 2 3 4 5 6 7 8 9 10 11 12 1 2 3 4 5 6 7 8 9 10 11 12 1 2 3 4 5 6 7 8 9 10 11 12
Domestic
Geographical Europe
North Atlantic
Far East/Australasia
Asia and the Pacific In the first five months of 2009, member airlines of the Association of Asia Pacific Airlines (AAPA) recorded an 12% drop in traffic on international operations with a concomitant fall (-11%) in passengers, resulting in a 4 percentage point drop in seat load factor to 71%. The month of May was the worst over the period (-15%). Moreover, May’s 15% fall in passenger numbers undermines any optimism that a recovery is underway. Market conditions are still clearly deteriorating. Middle East and North Africa Data from the Arab Air Carriers Organization (AACO) provides added weight to the argument that the Middle East is the only region whose air transport has remained in positive growth figures this year. Expansion of capacity continued at a rate of 11% between January and April 2009, while traffic increased by 5%. As a result the load factor was some 3 percentage points down, to 71% from 74% in full year 2008.
AACO: Air traffic on selected routes by month (RPKs)(% change over same month previous year)
2007 2008 2009
Source: compiled by UNWTO from AACO
-15
-10
-5
0
5
10
15
20
25
1 2 3 4 5 6 7 8 9 10 11 12 1 2 3 4 5 6 7 8 9 10 11 12 1 2 3 4 5 6 7 8 9 10 11 12
Total
within the Arab Wor ld
inter-regional
Prospects for 2009 Short-term forecast ICAO According to projections released by the International Civil Aviation Organization (ICAO) at the beginning of June, global air traffic, expressed in terms of passenger-kilometres performed, is now projected to decline by approximately 4% in 2009. This bleak forecast reflects the worsening of economic prospects with shrinking worldwide GDP. After steep declines in traffic in the first months of the year, signs of stabilisation have emerged and further improvements in traffic results are expected for the remaining months of the year. The markets of North America and Asia and the Pacific will be the most adversely affected as the recession in the United States and Japan, and the downturn in China, take their toll. European airlines are also expected to suffer limited traffic declines due to the relatively good performance of low-cost carriers. While the traffic of African airlines is also projected to decline, the Middle Eastern and Latin American markets will register a positive growth, due to aggressive airlines and airports strategies and strong domestic demand. As the economy improves, a moderate recovery is forecast for 2010 with a positive growth rate of about 3.3% and the momentum will continue in 2011 with a growth of 5.5%. The regional breakdown of these forecasts is provided in the table below.
Re gional Growth in Passenger Kilometres Performed (PKPs) (%)2009 2010 2011
Re gion Preliminary Forecast ForecastWor ld -3.8 3.3 5.5No rth Am erica -7.2 1.3 2.6
Latin Am erica & Ca ribbean 5.3 7.5 8.0Europe -3.0 2.9 5.5Asia and Pa cific -4.5 3.6 6.5Africa -4.2 6.5 7.0Middle East 8.0 9.5 12.0Source: Inte rnational Civil Aviation Organization (ICAO)
Percent age change over p revious year
OAG airline capacity outlook for the next 6 months According to the airline capacity outlook for the second half of 2009 released at the end of June by OAG, a global aviation data company, the world’s airlines will offer 3.7% fewer flights and 2.6% fewer seats than they did a year ago. The total number of flights (14.1 million) will be at the lowest level since the second half of 2005. The decline in flights is a little larger than the decline in seats, reflecting the trend towards larger aircraft particularly in the regional market. The numbers highlight the airline industry’s attempts to adjust to a weak economic climate. However, capacity still remains almost 20% higher than the levels of the early 2000s.
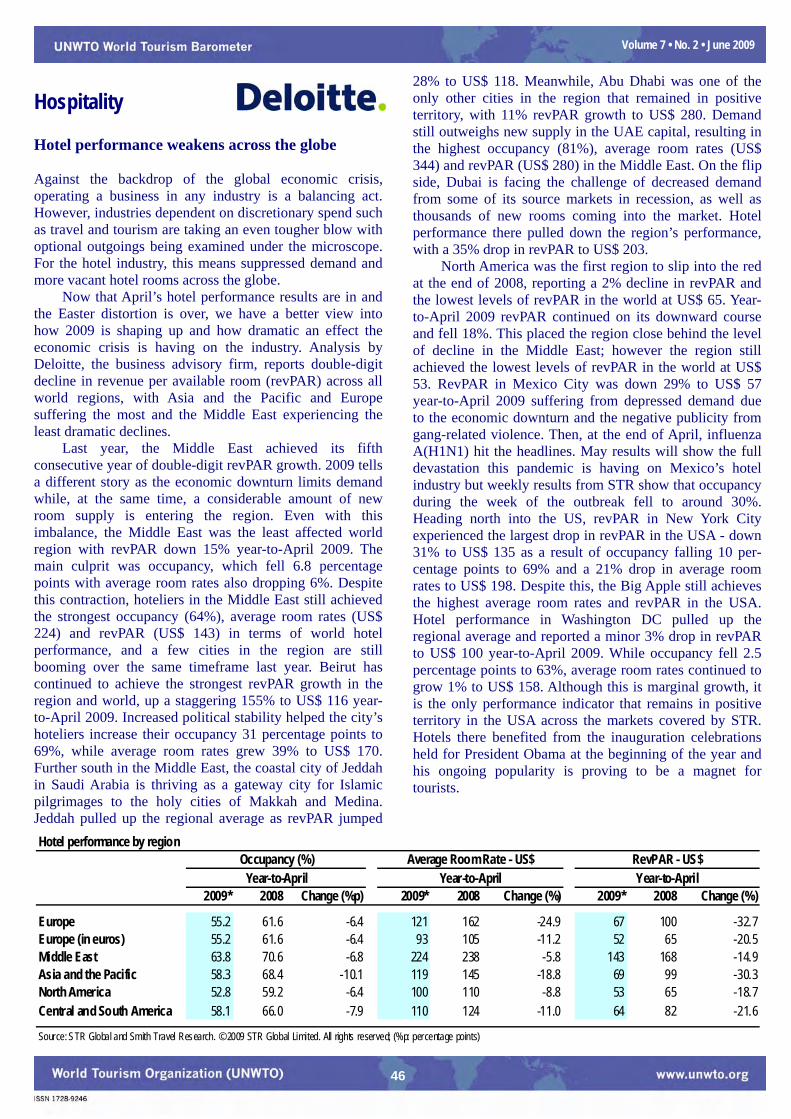
46
Volume 7 • No. 2 • June 2009
Hospitality Hotel performance weakens across the globe Against the backdrop of the global economic crisis, operating a business in any industry is a balancing act. However, industries dependent on discretionary spend such as travel and tourism are taking an even tougher blow with optional outgoings being examined under the microscope. For the hotel industry, this means suppressed demand and more vacant hotel rooms across the globe. Now that April’s hotel performance results are in and the Easter distortion is over, we have a better view into how 2009 is shaping up and how dramatic an effect the economic crisis is having on the industry. Analysis by Deloitte, the business advisory firm, reports double-digit decline in revenue per available room (revPAR) across all world regions, with Asia and the Pacific and Europe suffering the most and the Middle East experiencing the least dramatic declines. Last year, the Middle East achieved its fifth consecutive year of double-digit revPAR growth. 2009 tells a different story as the economic downturn limits demand while, at the same time, a considerable amount of new room supply is entering the region. Even with this imbalance, the Middle East was the least affected world region with revPAR down 15% year-to-April 2009. The main culprit was occupancy, which fell 6.8 percentage points with average room rates also dropping 6%. Despite this contraction, hoteliers in the Middle East still achieved the strongest occupancy (64%), average room rates (US$ 224) and revPAR (US$ 143) in terms of world hotel performance, and a few cities in the region are still booming over the same timeframe last year. Beirut has continued to achieve the strongest revPAR growth in the region and world, up a staggering 155% to US$ 116 year-to-April 2009. Increased political stability helped the city’s hoteliers increase their occupancy 31 percentage points to 69%, while average room rates grew 39% to US$ 170. Further south in the Middle East, the coastal city of Jeddah in Saudi Arabia is thriving as a gateway city for Islamic pilgrimages to the holy cities of Makkah and Medina. Jeddah pulled up the regional average as revPAR jumped
28% to US$ 118. Meanwhile, Abu Dhabi was one of the only other cities in the region that remained in positive territory, with 11% revPAR growth to US$ 280. Demand still outweighs new supply in the UAE capital, resulting in the highest occupancy (81%), average room rates (US$ 344) and revPAR (US$ 280) in the Middle East. On the flip side, Dubai is facing the challenge of decreased demand from some of its source markets in recession, as well as thousands of new rooms coming into the market. Hotel performance there pulled down the region’s performance, with a 35% drop in revPAR to US$ 203. North America was the first region to slip into the red at the end of 2008, reporting a 2% decline in revPAR and the lowest levels of revPAR in the world at US$ 65. Year-to-April 2009 revPAR continued on its downward course and fell 18%. This placed the region close behind the level of decline in the Middle East; however the region still achieved the lowest levels of revPAR in the world at US$ 53. RevPAR in Mexico City was down 29% to US$ 57 year-to-April 2009 suffering from depressed demand due to the economic downturn and the negative publicity from gang-related violence. Then, at the end of April, influenza A(H1N1) hit the headlines. May results will show the full devastation this pandemic is having on Mexico’s hotel industry but weekly results from STR show that occupancy during the week of the outbreak fell to around 30%. Heading north into the US, revPAR in New York City experienced the largest drop in revPAR in the USA - down 31% to US$ 135 as a result of occupancy falling 10 per-centage points to 69% and a 21% drop in average room rates to US$ 198. Despite this, the Big Apple still achieves the highest average room rates and revPAR in the USA. Hotel performance in Washington DC pulled up the regional average and reported a minor 3% drop in revPAR to US$ 100 year-to-April 2009. While occupancy fell 2.5 percentage points to 63%, average room rates continued to grow 1% to US$ 158. Although this is marginal growth, it is the only performance indicator that remains in positive territory in the USA across the markets covered by STR. Hotels there benefited from the inauguration celebrations held for President Obama at the beginning of the year and his ongoing popularity is proving to be a magnet for tourists.
Hotel performance by regionOccupancy (%) Average Room Rate - US$ RevPAR - US$
Year-to-April Year-to-April Year-to-April2009* 2008 Change (%p) 2009* 2008 Change (%) 2009* 2008 Change (%)
Europe 55.2 61.6 -6.4 121 162 -24.9 67 100 -32.7Europe (in euros) 55.2 61.6 -6.4 93 105 -11.2 52 65 -20.5Middle East 63.8 70.6 -6.8 224 238 -5.8 143 168 -14.9Asia and the Pacific 58.3 68.4 -10.1 119 145 -18.8 69 99 -30.3North America 52.8 59.2 -6.4 100 110 -8.8 53 65 -18.7Central and South America 58.1 66.0 -7.9 110 124 -11.0 64 82 -21.6
Source: STR Global and Smith Travel Research. © 2009 STR Global Limited. All rights reserved; (%p: percentage points)

47
Volume 7 • No. 2 • June 2009
Hotels in Central and South America reported a 22% drop in revPAR in the year to April 2009 placing the region in third position behind the Middle East and North America. Occupancy was down 8 percentage points to 58%, while average room rates dropped US$ 14 to US$ 110. The least affected cities were Santiago and San Juan, with revPAR drops of 14% and 17% respectively. São Paulo was not as fortunate and revPAR declined by just over 25% to US$ 42, mainly as a result of average room rates declining 20% to US$ 77. The second most affected region was Asia Pacific with revPAR down US$ 30 (or 30%) to US$ 69 year-to-April 2009. This drop was mainly due to average room rates contracting 19% to US$ 119 but occupancy also fell 10 percentage points to 58%. The terrorist attacks in Mumbai at the end of last year have not helped performance in India and revPAR in the city dropped 53% to US$ 108. This decline was mainly due to hoteliers slashing their average room rates 41% to make up for the 15.3 percentage point decline in occupancy. Elsewhere in India, revPAR in New Delhi is suffering to exactly the same degree - down 53%. Meanwhile, in Thailand, the political protests in Bangkok have contributed to a revPAR decline of 42% to US$ 50 while revPAR in Phuket also suffered, down 43% to US$ 81. Beijing is also experiencing the post-Olympic and Paralympic Games slump, with revPAR down 42% to US$ 42. The best performing cities in the region were those that were able to grow average room rates resulting in revPAR contractions of under 5% including Bali (-3%), Osaka (-2%) and Tokyo (-2%). When measured in US currency, the slowdown in the global economy has affected Europe the most, down 33% or US$ 33 to US$ 67. A 25% decrease in average room rates was mostly to blame for the drop but occupancy also fell 6 percentage points to 55%. However, in euro per-formance was not as bad, down just 21% to euro 52 year-to-April 2009. But the strength of the euro is keeping many tourists away (especially from the UK and the USA), as the region is becoming much more expensive than in the past few years. Within the eurozone, the worst affected cities in-clude Düsseldorf (-43%), Barcelona (-43%), Venice (-42%) and Amsterdam (-41%). Outside the eurozone, revPAR in Geneva fell 31% but despite this, Switzerland’s financial capital achieved the strongest average room rates and revPAR in Europe at US$ 290 and US$ 160 consecutively. The strongest occupancy in Europe was in London, down only 2.3 percentage points to 74%. Meanwhile, Moscow pulled down the regional average, with a US$ 121 deduc-tion from the Russian capital’s revPAR reaching US$ 129.
Hotel performance by region (Year-to-April)Occupancy (%)
2009* 2008Change
(%p)
North AmericaCanada Montreal 50.9 53.4 -2.5
Toronto 55.7 61.1 -5.3Vancouver 57.8 63.9 -6.1
United States Atlanta 53.0 62.1 -9.2Boston 50.9 59.1 -8.1Chicago 48.3 57.3 -9.1Dallas 52.6 60.4 -7.8Denver 52.3 59.4 -7.1Houston 61.8 66.7 -4.9Los Angeles 62.3 72.4 -10.1Miami 71.2 80.5 -9.3New Orleans 61.4 70.0 -8.6New York 68.5 78.4 -9.9Orlando 65.8 74.0 -8.1Philadelphia 56.6 62.1 -5.6Phoenix 61.9 72.8 -10.9San Diego 60.6 69.9 -9.3San Francisco 62.7 70.2 -7.5Seattle 54.0 63.3 -9.3St Louis 49.4 53.8 -4.4Washington DC 63.3 65.7 -2.5
Mexico Cancun 69.4 71.7 -2.3Mexico City 50.5 61.9 -11.4
Central and Southern AmericaCosta Rica San Jose 57.0 69.7 -12.7Peru Lima 53.8 59.1 -5.3Brazil Rio de Janeiro 68.5 65.6 2.9
Sao Paulo 54.1 61.6 -7.5Argentina Buenos Aires 57.6 72.3 -14.7Chile Santiago 64.0 77.9 -13.9 Asia and the PacificChina Beijing 43.8 62.6 -18.8
Shanghai 44.8 56.6 -11.8Hong Kong (China) Hong Kong 72.8 82.2 -9.4Taiwan (pr. of China) Taipei 67.5 71.3 -3.8Japan Osaka 73.3 78.9 -5.6
Tokyo 67.8 76.5 -8.7Korea, Republic of Seoul 81.5 72.4 9.1Vietnam Hanoi 56.8 71.0 -14.3Thailand Bangkok 52.1 74.1 -22.0
Phuket 61.3 80.4 -19.1Malaysia Kuala Lumpur 59.8 68.3 -8.5Singapore Singapore 66.9 79.0 -12.1Indonesia Jakarta 60.4 67.5 -7.1
Bali Island 64.2 74.9 -10.7Philippines Manila 67.9 76.0 -8.1India Mumbai 60.9 76.2 -15.3
New Delhi 65.1 82.1 -17.0Australia Sydney 78.0 82.7 -4.7New Zealand Auckland 72.8 78.8 -6.0 Source: STR Global = up © 2009 STR Global Limited. All rights reserved = downData for North America sourced Smith Travel Research.© 2009 Smith Travel Research Inc. All rights reserved

48
Volume 7 • No. 2 • June 2009
Lower consumer and business confidence as a result of the global economic downturn has suppressed travel demand and hoteliers are increasingly feeling the pinch. The remainder of 2009 will be a challenging time for hoteliers as travel patterns are postponed, shortened or cancelled altogether. With close links to the strength of the economy, the hoteliers are eagerly waiting improvements in the key economies around the world. Analysis has been provided by Deloitte & Touche LLP using data from STR Global and Smith Travel Research. This commentary has been written by Marvin Rust – Global Managing Partner of Hospitality at Deloitte and Laura Baxter – Assistant Manager in the Tourism, Hospitality and Leisure team at Deloitte. For further information please call the team at Deloitte on +44 (0) 20 7007 1099 or visit www.deloitte.co.uk/tourismhospitalityleisure.
Hotel performance by region (Year-to-April)
Occupancy (%)
2009* 2008Change
(%p)
EuropeIceland Reykjavik 43.4 47.3 -4.0Norway Oslo 57.3 63.5 -6.2Sweden Stockholm 57.6 62.2 -4.6Denmark Copenhagen 50.5 57.5 -6.9Ireland Dublin 54.6 63.9 -9.4United Kingdom London 74.4 76.7 -2.3Netherlands Amsterdam 59.7 72.4 -12.7Belgium Brussels 60.6 67.9 -7.2Luxembourg Luxembourg 61.0 67.4 -6.4Germany Frankfurt am Main 56.5 63.0 -6.4
Berlin 58.7 61.5 -2.8France Paris 69.6 75.4 -5.8Austria Vienna 54.6 63.6 -8.9Switzerland Geneva 55.2 66.9 -11.8
Zurich 60.8 68.8 -7.9Czech Rep Prague 45.9 57.2 -11.3Slovakia Bratislava 38.2 56.8 -18.6Hungary Budapest 41.8 55.5 -13.7Poland Warsaw 55.3 63.8 -8.5Russian Federation Moscow 57.1 63.9 -6.7Portugal Lisbon 50.9 60.2 -9.2Spain Madrid 55.2 65.6 -10.4
Barcelona 54.7 64.7 -10.0Italy Milan 58.3 68.2 -9.9
Rome 53.7 60.3 -6.6Greece Athens 48.6 60.8 -12.2Turkey Istanbul 59.3 68.8 -9.6Israel Tel Aviv 49.7 75.6 -25.9 Middle-East & AfricaEgypt Cairo 67.6 81.4 -13.8
Sharm El-Sheikh 70.9 84.2 -13.3Jordan Amman 57.3 69.8 -12.5Lebanon Beirut 68.6 37.4 31.2Kuwait Kuwait City 61.8 64.5 -2.8Qatar Doha 70.5 79.4 -8.8Untd Arab Emirates Dubai 72.3 86.2 -13.8
Abu Dhabi 81.3 87.1 -5.9Saudi Arabia Riyadh 68.2 82.7 -14.5Oman Muscat 64.1 80.1 -15.9Kenya Nairobi 62.3 38.3 24.0South Africa Greater Cape Town 64.7 75.5 -10.8
Greater Johannesburg 54.3 72.8 -18.5 Source: STR Global = up © 2009 STR Global Limited. All rights reserved = down

49
Volume 7 • No. 2 • June 2009
Meetings industry ICCA - Country and city rankings of international meetings organised in 2008 The International Congress and Convention Association (ICCA) publishes a yearly country and city ranking by number of meetings organised. The ICCA rankings cover meetings organised by international associations which take place on a regular basis and which rotate between a minimum of three countries. The data represents a ‘snapshot’ of qualifying events in the ICCA Association Database as sampled in early May 2009. The ICCA Data department has been monitoring and analysing trends in international association meetings for the past 30 years. The ICCA Database has identified 7,475 events which took place in 2008, a rise of approximately 800 over 2007, partly reflecting the strength of the market. “That represents more than 10% growth in our database of such events,” said Martin Sirk, ICCA CEO, “and reflects the extraordinary dynamism of this market segment. Many of these events have been created as offshoots of established larger association events to service regional or precise subject-specific needs, generating new competition in the marketplace and tremendous opportunities for new business development in all regions of the world.” As has been the case since 2004, the USA and Ger-many are first and second in the ranking measured by the number of international meetings organised in 2008. The numbers 3 and 4, Spain and France, had a considerable increase in the number of meetings compared to 2007. The United Kingdom moves from 4th place in 2007 to 5th in 2008. The Netherlands is a newcomer in the top 10, replacing Austria. Asian countries also have their stake in the international meetings market: China and the Republic of Korea are among the top 20 ICCA countries. Brazil, which occupies the 7th position, is the only country from Latin America to appear in the ranking. For the first time in three years, Vienna shares the top place with Paris as the most popular city. Barcelona, in third place, had an increase of 30 meetings over 2007. Remarkable newcomers in the top 20 are Athens, Buenos Aires, São Paulo and Tokyo. Stockholm and Seoul both climb in the rankings to 8th and 9th positions. The results for 2008 have been remarkable as ICCA’s researchers have never before identified so many international association meetings taking place in a single year. Due to the current global turbulence,
there will be some reductions in average attendance in 2009, following marginal declines in 2008, but there are almost no event cancellations and postponements taking place, and the overall mood of international association meeting planners is unmistakably positive. ICCA claims that destinations with a healthy mix of inter-governmental association, and corporate meetings are best positioned to do well during periods of economic crisis, but that the international association sector provides the foundation stone. Long decision-making lead times enable destinations and venues to plan the rest of their business mix around a strong portfolio of association events, which can be targeted to fill ‘soft’ periods in the diary. In the era of knowledge, data and specialist information are the key currencies that drive today's global economy, and international associations and their major meetings are primary players in the creation, development and dissemination of this knowledge. Thus, association meetings are going to become even more important: for scientific and medical progress; to find solutions to societal and environmental challenges; to provide top level elite education; as tools for national and regional economic development; and to share ideas on quality control, accreditation, and new ways of learning. Each year, ICCA produces two statistics reports on the international association meetings market: the full ICCA statistics report for 2008 is released in June. The 10 year statistics report covering 1999-2008 will be published late July. For further information please visit www.iccaworld.com.
ICCA country and city ranking measured by number of meetings organised in 2008Rank Country # Meetings Rank City # Meetings
1 United States 507 1 Paris 1392 Germany 402 Vienna 1393 Spain 347 3 Barcelona 1364 France 334 4 Singapore 1185 United Kingdom 322 5 Berlin 1006 Italy 296 6 Budapest 957 Brazil 254 7 Amsterdam 898 Japan 247 8 Stockholm 879 Canada 231 9 Seoul 84
10 Netherlands 227 10 Lisbon 8311 China-P.R. 223 11 Copenhagen 8212 Austria 196 12 Sao Paulo 7513 Switzerland 194 13 Prague 7414 Australia 182 14 Beijing 7315 Portugal 177 15 Athens 7216 Republic of Korea 169 Buenos Aires 7217 Sweden 163 Istanbul 7218 Finland 142 18 Bangkok 7119 Greece 123 19 London 6820 Belgium 122 Tokyo 68
Source: International Congress and Convention Association (ICCA)

50
Volume 7 • No. 2 • June 2009
The economic environment Unprecedented decline in economic growth The global economy is undergoing its most severe recession of the post second world war period inflicted by a massive financial crisis and acute loss of confidence. Since the September 2008 financial blow-up, economies around the world have been suffering a rapid deterioration with a sharp drop in industrial production, trade and employment. According to the International Monetary Fund (IMF), advanced economies experienced an unprecedented 7.5% decline in real GDP during the fourth quarter of 2008, and output is estimated to have continued to fall almost as fast during the first quarter of 2009. Emerging and developing economies have been seriously hit as well by the global economic crisis. As a result, IMF forecast the world economy to decline by 1.3% in 2009. Despite the unparalleled stimuli response put in place, the recovery is expected to be slow and weak. Much will depend on coordinated action to heal the financial sector, while continuing to support demand with monetary and fiscal easing. Since the publication of the latest UNWTO World Tourism Barometer two major pieces of comprehensive analysis on the world economy have become available. The International Monetary Fund (IMF) published its April 2009 edition of the World Economic Outlook (WEO), while the United Nations Department of Economic and Social Affairs (DESA) issued in May a mid-year update on its World Economic Situation and Prospects 2009 (WESP). United Nations World Economic Situation and Prospects 2009, Update as of mid-2009 According to the mid-2009 update of the World Economic Situation and Prospects 2009 (WESP), “The world economy is deeply mired in the most severe financial and economic crisis since World War II. With its increasing impact both in scope and depth worldwide, the crisis poses a significant threat to world economic and social development, including to the fulfilment of the Millennium Development Goals (MDGs) and other internationally agreed development goals.” The UN baseline forecast for the world economy has been revised downwards compared with the pessimistic scenario of the WESP 2009 published in January – which pointed to a contraction of 0.4% in 2009. In the baseline scenario, the world economy, which registered an expansion of 2.1% in 2008, is expected to shrink by 2.6% in 2009 and to grow by 1.6% in 2010, or from 3.3% in 2008 to -1.0% in 2009 and 2.7% in 2010 using purchasing power parity weighting (see box for the methodological note).
Even if a mild recovery is expected in 2010, the report warns that risks remain on the downside. A more prolonged recession in most countries is possible if financial markets do not unclog soon and if the fiscal stimuli do not gain sufficient traction. In addition, the fragile situation could be exacerbated if the influenza A(H1N1) virus outbreak becomes much more serious. In a more optimistic scenario – although an increasingly less likely scenario for the UN – world economic recovery would begin in the second half of 2009, resulting in an expansion of 2.3% in 2010. But this scenario would require problems in financial markets to be resolved in the first half of 2009 with fiscal stimulus measures having a visible effect during the year. The report points out that, by May 2009, such conditions were far from present. Developing countries are being hit hard by the crisis that originated in the developed countries, through capital reversals, rising borrowing costs, collapsing world trade and commodity prices, and subsiding remittance flows. According to the WESP update report, at least 60 developing countries are expected to suffer declining per capita incomes. Bearing in mind that the global policy response has been unprecedented, the UN recommends further actions in four major areas: 1. further decisive and cooperative action is needed to
restore the financial health of banks, especially in developed countries;
2. the fiscal stimulus measures should be better coordinated and aligned with global sustainable development objectives;
3. fundamental reforms of the international financial system are needed to overcome the systemic flaws that caused this crisis in the first place, and in order to guard against future crises;
4. a new framework for global economic governance in line with early 21st century realities needs to be created.
The full United Nations World Economic Situation and Prospects, Update as at mid-2009 is available for download at www.un.org/esa/policy/wess/wesp.html.
GDP growth measurement, methodological note World aggregated growth of Gross Domestic Product (GDP) as reported by the UN is calculated as a weighted average of individual country GDP growth rates, where weights are based on GDP in 2000 prices and exchange rates (i.e. at 2000 market value). IMF estimates growth rates on the basis of GDP in purchasing power parity (PPP). This is done because the purchasing power of a US dollar varies from one economy to another. As a US dollar usually buys quite a lot more goods and services in emerging economies, their GDP is more strongly weighted in the aggregate, in general resulting in a higher growth rate as emerging economies tend to grow faster. For instance, at market value the weight of the USA is 25% and of China 6%, while at PPP their weights are respectively 21% and 11%
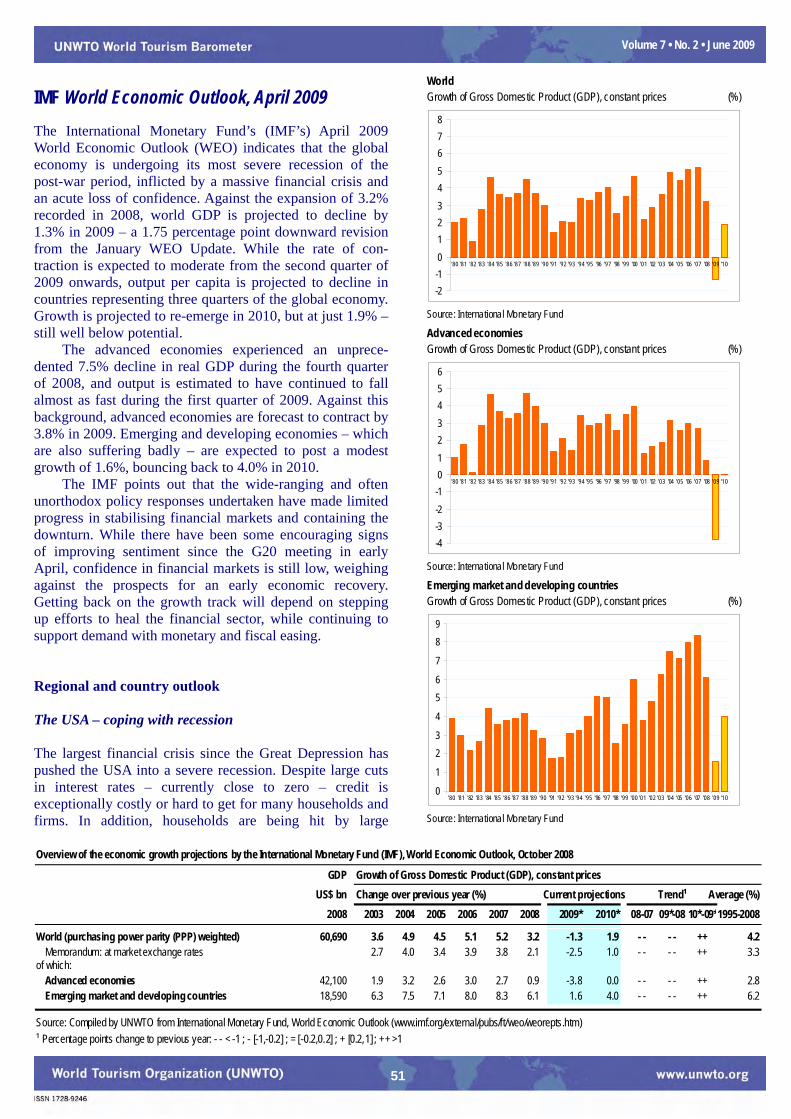
51
Volume 7 • No. 2 • June 2009
IMF World Economic Outlook, April 2009 The International Monetary Fund’s (IMF’s) April 2009 World Economic Outlook (WEO) indicates that the global economy is undergoing its most severe recession of the post-war period, inflicted by a massive financial crisis and an acute loss of confidence. Against the expansion of 3.2% recorded in 2008, world GDP is projected to decline by 1.3% in 2009 – a 1.75 percentage point downward revision from the January WEO Update. While the rate of con-traction is expected to moderate from the second quarter of 2009 onwards, output per capita is projected to decline in countries representing three quarters of the global economy. Growth is projected to re-emerge in 2010, but at just 1.9% – still well below potential. The advanced economies experienced an unprece-dented 7.5% decline in real GDP during the fourth quarter of 2008, and output is estimated to have continued to fall almost as fast during the first quarter of 2009. Against this background, advanced economies are forecast to contract by 3.8% in 2009. Emerging and developing economies – which are also suffering badly – are expected to post a modest growth of 1.6%, bouncing back to 4.0% in 2010. The IMF points out that the wide-ranging and often unorthodox policy responses undertaken have made limited progress in stabilising financial markets and containing the downturn. While there have been some encouraging signs of improving sentiment since the G20 meeting in early April, confidence in financial markets is still low, weighing against the prospects for an early economic recovery. Getting back on the growth track will depend on stepping up efforts to heal the financial sector, while continuing to support demand with monetary and fiscal easing. Regional and country outlook The USA – coping with recession The largest financial crisis since the Great Depression has pushed the USA into a severe recession. Despite large cuts in interest rates – currently close to zero – credit is exceptionally costly or hard to get for many households and firms. In addition, households are being hit by large
WorldGrowth of Gross Domestic Product (GDP), constant prices (%)
Source: International Monetary Fund
-2-1012345678
'80 '81 '82 '83 '84 '85 '86 '87 '88 '89 '90 '91 '92 '93 '94 '95 '96 '97 '98 '99 '00 '01 '02 '03 '04 '05 '06 '07 '08 '09 '10
Advanced economiesGrowth of Gross Domestic Product (GDP), constant prices (%)
Source: International Monetary Fund
-4-3-2-10123456
'80 '81 '82 '83 '84 '85 '86 '87 '88 '89 '90 '91 '92 '93 '94 '95 '96 '97 '98 '99 '00 '01 '02 '03 '04 '05 '06 '07 '08 '09 '10
Emerging market and developing countriesGrowth of Gross Domestic Product (GDP), constant prices (%)
Source: International Monetary Fund
0
1
23
4
56
7
89
'80 '81 '82 '83 '84 '85 '86 '87 '88 '89 '90 '91 '92 '93 '94 '95 '96 '97 '98 '99 '00 '01 '02 '03 '04 '05 '06 '07 '08 '09 '10
Overview of the economic growth projections by the International Monetary Fund (IMF), World Economic Outlook, October 2008
GDP Growth of Gross Domestic Product (GDP), constant pricesUS$ bn Change over previous year (%) Current projections Trend¹ Average (%)
2008 2003 2004 2005 2006 2007 2008 2009* 2010* 08-07 09*-08 10*-09*1995-2008
World (purchasing power parity (PPP) weighted) 60,690 3.6 4.9 4.5 5.1 5.2 3.2 -1.3 1.9 - - - - ++ 4.2Memorandum: at market exchange rates 2.7 4.0 3.4 3.9 3.8 2.1 -2.5 1.0 - - - - ++ 3.3
of which:Advanced economies 42,100 1.9 3.2 2.6 3.0 2.7 0.9 -3.8 0.0 - - - - ++ 2.8Emerging market and developing countries 18,590 6.3 7.5 7.1 8.0 8.3 6.1 1.6 4.0 - - - - ++ 6.2
Source: Compiled by UNWTO from International Monetary Fund, World Economic Outlook (www.imf.org/external/pubs/ft/weo/weorepts.htm)¹ Percentage points change to previous year: - - < -1 ; - [-1,-0.2] ; = [-0.2,0.2] ; + [0.2,1] ; ++ >1
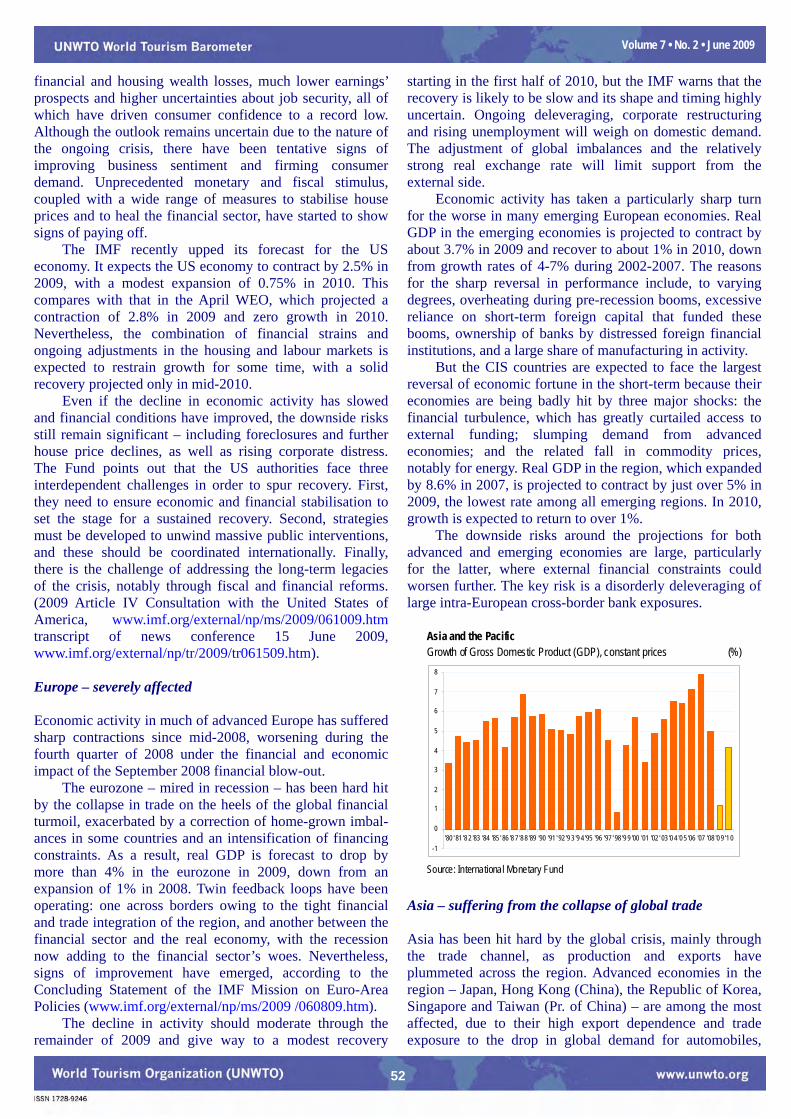
52
Volume 7 • No. 2 • June 2009
financial and housing wealth losses, much lower earnings’ prospects and higher uncertainties about job security, all of which have driven consumer confidence to a record low. Although the outlook remains uncertain due to the nature of the ongoing crisis, there have been tentative signs of improving business sentiment and firming consumer demand. Unprecedented monetary and fiscal stimulus, coupled with a wide range of measures to stabilise house prices and to heal the financial sector, have started to show signs of paying off. The IMF recently upped its forecast for the US economy. It expects the US economy to contract by 2.5% in 2009, with a modest expansion of 0.75% in 2010. This compares with that in the April WEO, which projected a contraction of 2.8% in 2009 and zero growth in 2010. Nevertheless, the combination of financial strains and ongoing adjustments in the housing and labour markets is expected to restrain growth for some time, with a solid recovery projected only in mid-2010. Even if the decline in economic activity has slowed and financial conditions have improved, the downside risks still remain significant – including foreclosures and further house price declines, as well as rising corporate distress. The Fund points out that the US authorities face three interdependent challenges in order to spur recovery. First, they need to ensure economic and financial stabilisation to set the stage for a sustained recovery. Second, strategies must be developed to unwind massive public interventions, and these should be coordinated internationally. Finally, there is the challenge of addressing the long-term legacies of the crisis, notably through fiscal and financial reforms. (2009 Article IV Consultation with the United States of America, www.imf.org/external/np/ms/2009/061009.htm transcript of news conference 15 June 2009, www.imf.org/external/np/tr/2009/tr061509.htm). Europe – severely affected Economic activity in much of advanced Europe has suffered sharp contractions since mid-2008, worsening during the fourth quarter of 2008 under the financial and economic impact of the September 2008 financial blow-out. The eurozone – mired in recession – has been hard hit by the collapse in trade on the heels of the global financial turmoil, exacerbated by a correction of home-grown imbal-ances in some countries and an intensification of financing constraints. As a result, real GDP is forecast to drop by more than 4% in the eurozone in 2009, down from an expansion of 1% in 2008. Twin feedback loops have been operating: one across borders owing to the tight financial and trade integration of the region, and another between the financial sector and the real economy, with the recession now adding to the financial sector’s woes. Nevertheless, signs of improvement have emerged, according to the Concluding Statement of the IMF Mission on Euro-Area Policies (www.imf.org/external/np/ms/2009 /060809.htm). The decline in activity should moderate through the remainder of 2009 and give way to a modest recovery
starting in the first half of 2010, but the IMF warns that the recovery is likely to be slow and its shape and timing highly uncertain. Ongoing deleveraging, corporate restructuring and rising unemployment will weigh on domestic demand. The adjustment of global imbalances and the relatively strong real exchange rate will limit support from the external side. Economic activity has taken a particularly sharp turn for the worse in many emerging European economies. Real GDP in the emerging economies is projected to contract by about 3.7% in 2009 and recover to about 1% in 2010, down from growth rates of 4-7% during 2002-2007. The reasons for the sharp reversal in performance include, to varying degrees, overheating during pre-recession booms, excessive reliance on short-term foreign capital that funded these booms, ownership of banks by distressed foreign financial institutions, and a large share of manufacturing in activity. But the CIS countries are expected to face the largest reversal of economic fortune in the short-term because their economies are being badly hit by three major shocks: the financial turbulence, which has greatly curtailed access to external funding; slumping demand from advanced economies; and the related fall in commodity prices, notably for energy. Real GDP in the region, which expanded by 8.6% in 2007, is projected to contract by just over 5% in 2009, the lowest rate among all emerging regions. In 2010, growth is expected to return to over 1%. The downside risks around the projections for both advanced and emerging economies are large, particularly for the latter, where external financial constraints could worsen further. The key risk is a disorderly deleveraging of large intra-European cross-border bank exposures.
Asia and the PacificGrowth of Gross Domestic Product (GDP), constant prices (%)
Source: International Monetary Fund
-1
0
1
2
3
4
5
6
7
8
'80 ' 81 '8 2 '83 '84 '85 ' 86 '8 7 '8 8 '89 '90 '91 ' 92 '9 3 '9 4 '95 '96 '97 ' 98 '9 9 '00 '01 '02 ' 03 '0 4 '0 5 '06 '07 '08 '0 9 '1 0
Asia – suffering from the collapse of global trade Asia has been hit hard by the global crisis, mainly through the trade channel, as production and exports have plummeted across the region. Advanced economies in the region – Japan, Hong Kong (China), the Republic of Korea, Singapore and Taiwan (Pr. of China) – are among the most affected, due to their high export dependence and trade exposure to the drop in global demand for automobiles,

53
Volume 7 • No. 2 • June 2009
Overview of the economic growth projections by the International Monetary Fund (IMF), World Economic Outlook, October 2008
GDP Growth of Gross Domestic Product (GDP), constant pricesUS$ bn Change over previous year (%) Current projections Trend¹ Average (%)
2008 2003 2004 2005 2006 2007 2008 2009* 2010* 08-07 09*-08 10*-09*1995-2008
By UNWTO regions:Europe 22,566 2.5 3.7 3.1 4.3 4.0 1.9 -4.1 0.0 - - - - ++ 3.2
Euro area 13,633 0.8 2.2 1.7 2.9 2.7 0.9 -4.2 -0.4 - - - - ++ 2.3Germany 3,668 -0.2 1.2 0.8 3.0 2.5 1.3 -5.6 -1.0 - - - - ++ 1.6France 2,866 1.1 2.2 1.9 2.4 2.1 0.7 -3.0 0.4 - - - - ++ 2.3Italy 2,314 0.0 1.5 0.7 2.0 1.6 -1.0 -4.5 -0.4 - - - - ++ 1.4Spain 1,612 3.1 3.3 3.6 3.9 3.7 1.2 -3.0 -0.7 - - - - ++ 3.8Netherlands 869 0.3 2.2 2.0 3.4 3.5 2.0 -4.8 -0.7 - - - - ++ 3.0Belgium 506 1.0 2.8 2.2 3.0 2.6 1.1 -3.8 0.3 - - - - ++ 2.4Austria 415 0.8 2.5 2.9 3.4 3.1 1.8 -3.0 0.2 - - - - ++ 2.6Greece 358 5.6 4.9 2.9 4.5 4.0 2.9 -0.2 -0.6 - - - - – 4.1Ireland 273 4.5 4.7 6.4 5.7 6.0 -2.3 -8.0 -3.0 - - - - ++ 7.1Finland 274 1.8 3.7 2.8 4.9 4.2 0.9 -5.2 -1.2 - - - - ++ 3.9Portugal 244 -0.8 1.5 0.9 1.4 1.9 0.0 -4.1 -0.5 - - - - ++ 2.3
United Kingdom 2,674 2.8 2.8 2.1 2.8 3.0 0.7 -4.1 -0.4 - - - - ++ 3.0Sweden 485 1.9 4.1 3.3 4.2 2.6 -0.2 -4.3 0.2 - - - - ++ 3.0Norway 456 1.0 3.9 2.7 2.3 3.1 2.0 -1.7 0.3 - - - - ++ 3.1Denmark 343 0.4 2.3 2.4 3.3 1.6 -1.1 -4.0 0.4 - - - - ++ 2.0Switzerland 493 -0.2 2.5 2.5 3.4 3.3 1.6 -3.0 -0.3 - - - - ++ 2.1Poland 526 3.9 5.3 3.6 6.2 6.7 4.8 -0.7 1.3 - - - - ++ 5.0Russian Federation 1,677 7.3 7.2 6.4 7.7 8.1 5.6 -6.0 0.5 - - - - ++ 5.0Turkey 729 5.3 9.4 8.4 6.9 4.7 1.1 -5.1 1.5 - - - - ++ 4.7
Americas 19,986 2.4 4.2 3.4 3.6 3.1 1.9 -2.4 0.5 - - - - ++ 3.3United States 14,265 2.5 3.6 2.9 2.8 2.0 1.1 -2.8 0.0 – - - ++ 3.1Canada 1,511 1.9 3.1 2.9 3.1 2.7 0.5 -2.5 1.2 - - - - ++ 3.3Latin America and Caribbean 4,210 2.2 6.0 4.7 5.7 5.7 4.2 -1.5 1.6 - - - - ++ 3.8
Brazil 1,573 1.1 5.7 3.2 4.0 5.7 5.1 -1.3 2.2 – - - ++ 3.2Mexico 1,088 1.7 4.0 3.2 5.1 3.3 1.3 -3.7 1.0 - - - - ++ 3.9Argentina 326 8.8 9.0 9.2 8.5 8.7 7.0 -1.5 0.7 - - - - ++ 3.9Venezuela 319 -7.8 18.3 10.3 10.3 8.4 4.8 -2.2 -0.5 - - - - ++ 3.3Colombia 241 4.6 4.7 5.7 6.9 7.5 2.5 0.0 1.3 - - - - ++ 3.4Chile 170 4.0 6.0 5.6 4.6 4.7 3.2 0.1 3.0 - - - - ++ 4.6Peru 128 4.0 5.0 6.8 7.7 8.9 9.8 3.5 4.5 + - - + 5.0
Asia and the Pacific 15,416 5.7 6.6 6.5 7.3 8.0 5.1 1.4 4.2 - - - - ++ 5.8Japan 4,924 1.4 2.7 1.9 2.0 2.4 -0.6 -6.2 0.5 - - - - ++ 1.3Australia 1,011 3.0 3.8 2.8 2.8 4.0 2.1 -1.4 0.6 - - - - ++ 3.8New Zealand 128 4.1 4.5 2.8 1.9 3.2 0.3 -2.0 0.5 - - - - ++ 3.2Newly Industrialized Asian Economies 1,737 3.1 5.9 4.7 5.6 5.7 1.6 -5.6 0.8 - - - - ++ 4.8
Korea, Republic of 947 2.8 4.6 4.0 5.2 5.1 2.2 -4.0 1.5 - - - - ++ 4.7Taiwan (pr. of China) 393 3.5 6.2 4.2 4.8 5.7 0.1 -7.5 0.0 - - - - ++ 4.6Hong Kong (China) 216 3.0 8.5 7.1 7.0 6.4 2.5 -4.5 0.5 - - - - ++ 4.1Singapore 182 3.8 9.3 7.3 8.4 7.8 1.1 -10.0 -0.1 - - - - ++ 5.9
Developing Asia 7,239 8.2 8.6 9.0 9.8 10.6 7.7 4.8 6.1 - - - - ++ 8.2China 4,402 10.0 10.1 10.4 11.6 13.0 9.0 6.5 7.5 - - - - + 10.4India 1,210 6.9 7.9 9.2 9.8 9.3 7.3 4.5 5.6 - - - - ++ 7.5Pakistan 168 4.8 7.4 7.7 6.2 6.0 6.0 2.5 3.5 = - - + 5.0Indonesia, Malaysia, Philippines, Thailand 1,176 5.6 5.9 5.2 5.5 6.1 4.7 -0.3 2.1 - - - - ++ 4.1
Iran 345 7.2 5.1 4.7 5.8 7.8 4.5 3.2 3.0 - - - - = 5.5Africa 1,280 5.5 6.7 5.8 6.1 6.2 5.2 2.0 3.9 - - - - ++ 5.5
South Africa 277 3.1 4.9 5.0 5.3 5.1 3.1 -0.3 1.9 - - - - ++ 3.9Algeria, Morocco, Tunisia 286 6.5 5.2 4.3 4.3 3.5 4.0 3.0 4.0 + – ++ 4.6Nigeria 214 10.3 10.6 5.4 6.2 6.5 5.3 2.9 2.6 - - - - – 7.4
Middle East 1,560 6.9 6.4 6.3 5.7 5.6 6.5 2.1 3.8 + - - ++ 5.1Saudi Arabia 482 7.7 5.3 5.6 3.0 3.5 4.6 -0.9 2.9 ++ - - ++ 3.6Untd Arab Emirates 260 11.9 9.7 8.2 9.4 6.3 7.4 -0.6 1.6 ++ - - ++ 7.1Egypt 162 3.2 4.1 4.5 6.8 7.1 7.2 3.6 3.0 = - - – 5.8
Source: Compiled by UNWTO from International Monetary Fund, World Economic Outlook (www.imf.org/external/pubs/ft/weo/weorepts.htm)¹ Percentage points change to previous year: - - < -1 ; - [-1,-0.2] ; = [-0.2,0.2] ; + [0.2,1] ; ++ >1

54
Volume 7 • No. 2 • June 2009
electronics, and other consumer goods. Growth for Japan is projected to decline by 6.2% in 2009, exacerbated by the yen’s strength and tighter credit conditions. Activity in advanced Asia as a whole is expected to drop sharply, and some economies could even experience deflation. Also constrained by lower capital inflows and tighter credit conditions, real activity in emerging Asia is slowing sharply, too. Emerging Asia is expected to continue to grow in 2009 (3.3%) at a much lower pace, led by China and India. Growth in China is forecast to slow to about 6.5% in 2009, or less than half the 13% growth rate recorded pre-crisis in 2007, but still a strong performance given the global context. The growth of India is expected to slow further to 4.5% in 2009, down from 7.3% in 2008. The risks to the outlook for the region remain tilted squarely to the downside. A key concern is that a deeper or longer recession in advanced economies outside Asia will reduce external demand even further, with negative repercussions for exports, investment and growth. Latin America and the Caribbean –growing pressures As in other emerging regions, financial sector stress and deleveraging in advanced economies are raising borrowing costs and reducing capital inflows across Latin America and the Caribbean. In addition, the decline in commodity prices is pounding large economies in the region. The collapse in growth in advanced economies, particularly in the USA, has lowered demand for exports, weakened tourism, and lowered workers remittances – key supports in the Caribbean and Central America. Real GDP is forecast to contract by 1.5% in 2009, before staging a modest recovery in 2010 of 1.6%. Considering the very challenging external environment, most countries are weathering the storm well relative to earlier experiences with global turbulence, thanks to improvements in policy frameworks and balance sheet positions. Middle East – hit by lower oil prices The extremely large fall in the price of oil is hitting the region hard. The deterioration in external financing conditions and reversal of capital inflows are also taking a toll. Although highly expansionary policies are set to mitigate their impact, these adverse shocks are expected to have severe negative effects on economic activity. In the region as a whole, growth is projected to decline from 6.5% in 2008 to 2.1% in 2009. The current account balance of the region is expected to swing into a small deficit. With dwindling surpluses in oil-producing countries, fiscal balances are set to deteriorate substantially, as revenues decline and governments use the buffers accumulated during the recent boom to sustain domestic demand by maintaining ongoing investment projects.
Middle EastGrowth of Gross Domestic Product (GDP), constant prices (%)
Source: International Monetary Fund
-8-7-6-5-4-3-2-101234567
'80 ' 81 '8 2 '83 '84 '85 ' 86 '8 7 '8 8 '89 '90 '91 ' 92 '9 3 '9 4 '95 '96 '97 ' 98 '9 9 '00 '01 '02 ' 03 '0 4 '0 5 '06 '07 '08 '0 9 '1 0
AfricaGrowth of Gross Domestic Product (GDP), constant prices (%)
Source: International Monetary Fund
-2
-1
0
1
2
3
4
5
6
7
'80 ' 81 '8 2 '83 '84 '85 ' 86 '8 7 '8 8 '89 '90 '91 ' 92 '9 3 '9 4 '95 '96 '97 ' 98 '9 9 '00 '01 '02 ' 03 '0 4 '0 5 '06 '07 '08 '0 9 '1 0
Africa – hard-won gains at risk Relatively weak financial linkages with advanced economies have not shielded African countries from the global economic storm. The main shock buffeting the continent is severe deterioration in external growth, which is reducing demand for African exports and curtailing workers’ remittances. The sharp fall of commodity prices is also hitting the resource-rich countries hard and the tightening of global credit is reducing capital inflows. For the region as a whole, growth is projected to decline from 5.2% in 2008 to 2% in 2009. On average, the downturn is most pronounced in oil-exporting countries and in key emerging and frontier markets.
Full World Economic Outlook reports of the International Monetary Fund (IMF) are available for download at www.imf.org/external/pubs/ft/weo.

55
Volume 7 • No. 2 • June 2009
Unemployment – the real challenge The deepening of the global financial and economic crisis is taking a heavy toll on employment worldwide. Following a period of continuing job creation in advanced economies, there has been a rapid rise in unemployment since mid-2008 and this is expected to become worse in 2009 and 2010. To a lesser or greater extent, unemploy-ment rates will increase in all advanced economies. According to the IMF’s April 2009 projections, unem-ployment rates in advanced economies are expected to reach 8.1% in 2009 (up from 5.8% in 2008), with rates of 8.9% in the USA (up from 5.8% in 2008) and 10.1% in the eurozone (up from 7.6% in 2008). Most eurozone economies will record unemployment rates above 8%, but Spain (17.7%) and Ireland (12.0%) will be the most affected, posting double-digit rates. Spain and Ireland are suffering mounting job losses driven by the downturn in construction. Outside the euro area, the UK and Sweden are expected to reach unemployment rates of 7.4% and 8.4% respectively in 2009. Iceland will suffer a dramatic increase in unemployment (from 1.7% in 2008 to 9.7% in 2009) following the collapse of its financial sector. In Asia, the most significant deterioration in employment rates is expected in the ‘new industrialised economies’ (NIEs), with unemployment rising to 10.1%, and in Australia and New Zealand (6.8% and 6.5% respectively). The IMF’s unemployment projections for advanced economies in 2010 are even worse (9.2%), in line with the zero real GDP growth expected the same year for these economies. As long as growth is below its normal rate, unemployment will continue to increase. Therefore, the IMF’s forecast implies that unemployment will peak only at the end of 2010 and then decrease slowly over time after 2010. The International Labour Office (ILO) highlights the unprecedented increase in unemployment and in the num-ber of workers at risk of falling into poverty around the world in 2009. In its Global Employment Trends Update, May 2009, the ILO revised upwards its unemployment projections to levels ranging from 210 million to 239 million unemployed worldwide in 2009, corresponding to global unemployment rates of 6.5% and 7.4% respectively. According to the UN World Economic Situation and Prospects 2009, Update at mid-2009, “Lessons from past financial crises indicate that it typically takes four to five years for unemployment rates to return to pre-crisis levels after economic recovery has set in. Since global recovery should not be expected before the end of 2009, and will be weak at best in 2010, most countries will need to achieve strong growth acceleration during 2011-2015 to offset the job destruction and displacement of workers caused by the crisis.”
The full ILO Global Employment Trends Update, May 2009 is available for download at www.ilo.org/global/lang--en/docName--WCMS_106504/index.htm.
Unemployment rateAdvanced economies (%)
Source: International Monetary Fund
0123456789
101112
90 91 92 93 94 95 96 97 98 99 00 01 02 03 04 05 06 07 08* 09* 10*
United States (%)
Source: International Monetary Fund
0123456789
101112
80 81 82 83 84 85 86 87 88 89 90 91 92 93 94 95 96 97 98 99 00 01 02 03 04 05 06 07 08 09 10
Euro area (%)
Source: International Monetary Fund
0123456789
10111213
91 92 93 94 95 96 97 98 99 00 01 02 03 04 05 06 07 08* 09* 10*
Japan (%)
Source: International Monetary Fund
0123456789
101112
80 81 82 83 84 85 86 87 88 89 90 91 92 93 94 95 96 97 98 99 00 01 02 03 04 05 06 07 08 09 10

56
Volume 7 • No. 2 • June 2009
United Kingdom (%)
Source: International Monetary Fund
0123456789
101112
80 81 82 83 84 85 86 87 88 89 90 91 92 93 94 95 96 97 98 99 00 01 02 03 04 05 06 07 08 09 10
Spain (%)
Source: International Monetary Fund
02468
1012141618202224
80 81 82 83 84 85 86 87 88 89 90 91 92 93 94 95 96 97 98 99 00 01 02 03 04 05 06 07 08 09 10
Overview of the unemployment projections by the International Monetary Fund (IMF), World Economic Outlook, April 2009Unemployment rate (%)
Current projections Average
1995 2000 2001 2002 2003 2004 2005 2006 2007 2008 2009* 2010* 07-06 08-07 09*-08 10*-09*1995-2008
Advanced economies 7.1 5.9 5.9 6.5 6.7 6.4 6.2 5.8 5.4 5.8 8.1 9.2 + – - - - - 6.4
EuropeEuro area 10.5 8.1 7.8 8.2 8.7 8.8 8.6 8.4 7.5 7.6 10.1 11.5 ++ = - - - - 8.9
Austria 3.9 3.6 3.6 4.2 4.3 4.8 5.2 4.8 4.4 3.8 5.4 6.2 + ++ - - - - 4.3Belgium 9.7 6.9 6.6 7.5 8.2 8.4 8.5 8.3 7.5 6.8 9.5 10.5 ++ ++ - - - - 8.2Finland 15.4 9.8 9.1 9.1 9.0 8.8 8.4 7.7 6.8 6.4 8.5 9.3 ++ + - - - - 10.0France 11.2 9.1 8.4 8.9 9.0 9.2 9.3 9.2 8.3 7.8 9.6 10.3 ++ + - - - - 9.6Germany 8.0 7.5 7.6 8.4 9.3 9.8 10.6 9.8 8.4 7.3 9.0 10.8 ++ ++ - - - - 8.7Greece 9.1 11.4 10.8 10.3 9.7 10.5 9.9 8.9 8.3 7.6 9.0 10.5 ++ ++ - - - - 10.0Ireland 12.2 4.3 3.9 4.4 4.7 4.5 4.4 4.4 4.5 6.1 12.0 13.0 = - - - - - - 6.3Italy 11.2 10.2 9.1 8.6 8.5 8.1 7.7 6.8 6.1 6.8 8.9 10.5 ++ - - - - - - 9.1Luxembourg 3.0 2.5 2.3 2.6 3.5 3.9 4.3 4.5 4.4 4.4 6.8 6.0 = = - - ++ 3.4Netherlands 6.6 2.8 2.2 2.8 3.7 4.6 4.7 3.9 3.2 2.8 4.1 5.0 ++ + - - - - 3.9Portugal 7.2 4.0 4.0 5.0 6.3 6.7 7.6 7.7 8.0 7.8 9.6 11.0 – + - - - - 6.2Spain 22.9 13.9 10.6 11.5 11.5 11.0 9.2 8.5 8.3 11.3 17.7 19.3 + - - - - - - 14.0
Denmark 10.4 5.4 4.7 4.8 5.7 5.8 5.1 3.9 2.7 1.7 3.2 4.5 ++ ++ - - - - 5.7Sweden 8.8 5.6 4.9 4.9 5.6 6.3 7.6 7.0 6.1 6.2 8.4 9.6 ++ = - - - - 7.0United Kingdom 8.7 5.5 5.1 5.2 5.0 4.8 4.8 5.4 5.4 5.5 7.4 9.2 = – - - - - 5.9
Cyprus 2.6 3.4 3.0 3.3 4.1 4.7 5.3 4.6 3.9 3.7 4.6 4.3 ++ + - - + 3.7Iceland 5.0 1.3 1.4 2.5 3.4 3.1 2.1 1.3 1.0 1.7 9.7 9.3 + - - - - + 2.5Israel 6.9 8.8 9.3 10.3 10.8 10.4 9.0 8.4 7.3 6.0 7.5 7.7 ++ ++ - - – 8.5Norway 4.9 3.4 3.5 3.9 4.5 4.5 4.6 3.4 2.5 2.6 3.7 4.7 ++ = - - - - 3.8Switzerland 3.7 1.7 1.6 2.3 3.4 3.5 3.4 3.0 2.5 2.7 3.9 4.6 ++ – - - - - 3.0
AmericasCanada 9.5 6.8 7.2 7.6 7.6 7.2 6.8 6.3 6.0 6.2 8.4 8.8 + – - - – 7.6United States 5.6 4.0 4.7 5.8 6.0 5.5 5.1 4.6 4.6 5.8 8.9 10.1 = - - - - - - 5.1
Asia and the PacificAustralia 8.2 6.3 6.8 6.4 5.9 5.4 5.1 4.8 4.4 4.3 6.8 7.8 + + - - - - 6.3Japan 3.2 4.7 5.0 5.4 5.3 4.7 4.4 4.1 3.8 4.0 4.6 5.6 + – - - - - 4.3New Zealand 6.3 6.0 5.3 5.2 4.6 3.9 3.7 3.8 3.6 4.1 6.5 7.5 + - - - - - - 5.2Newly Industrialized Asian Economies 10.5 8.1 7.8 8.2 8.7 8.8 8.6 8.4 7.5 7.6 10.1 11.5 ++ = - - - - 8.9
Hong Kong (China) 3.2 4.9 5.1 7.3 7.9 6.8 5.6 4.8 4.0 3.5 6.3 7.5 ++ + - - - - 4.9Korea, Republic of 2.1 4.4 4.0 3.3 3.6 3.7 3.7 3.5 3.3 3.2 3.8 3.6 + = - - + 3.8Singapore 1.8 2.7 2.7 3.6 4.0 3.4 3.1 2.7 2.1 3.1 7.5 8.6 ++ - - - - - - 2.7Taiwan (pr. of China) 1.8 3.0 4.6 5.2 5.0 4.4 4.1 3.9 3.9 4.1 6.3 6.1 = – - - + 3.6
Source: Compiled by UNWTO from International Monetary Fund, World Economic Outlook (www.imf.org/external/pubs/ft/weo/weorepts.htm)¹ percentage points change to previous year: ++ < -0.5; + [-0.5,-0.1]; = [-0.1,0.1]; - [0.1,0.5]; - - > 0.5

57
Volume 7 • No. 2 • June 2009
Commodities, inflation, interest rates The intensification of the global financial and economic crisis has led to a sharp decline in commodity prices, including oil, food and metals. The IMF’s WEO of April 2009 points out that the decline in global oil demand was entirely attributable to sharply decelerating demand in advanced economies. After peaking at an all-time record high (in both nominal and real terms) of US$ 143 a barrel on 11 July 2008, oil prices collapsed to about US$ 38 by end-December. Since then, prices have broadly stabilised in the US$ 40–50 range, with some recent upticks beyond that range. In effect, according to the International Energy Agency (IEA) in the June 2009 Oil Market Report (www.oilmarketreport.org), crude futures averaged US$ 60 a barrel in May 2009 and reached US$ 10 a barrel higher by early June. The IAE has adjusted its global oil demand forecast for 2009 – moving it slightly upwards – following stronger-than-expected early-year OECD demand, although these revisions do not necessarily imply economic recovery, but may reflect a slowing in previously sharp decline. Global oil demand is projected to decline 2.9% in 2009. As oil and food prices have plummeted and demand is slumping, inflation pressures are subsiding fast. According to the IMF, inflation in 2009 and 2010 is expected to be negative or close to zero in most advanced economies, with rising risks of deflation. This is down from 3-4% growth rates in 2008. In emerging and developing economies, inflation rates are also projected to drop markedly, from 9.3% in 2008 to 5.7% in 2009. As a result, monetary policy has been eased. The Federal Reserve lowered its benchmark interest rate virtually to zero in December 2008 and brought the USA to the zero rate policy implemented by Japan. The Bank of England cut policy rates in successive steps from 5.75% in 2007 to 0.5% in 2009. The European Central Bank has lowered interest rates seven times from 4.25% in October 2008 to the current 1%. Despite these strong cuts, credit to the private sector remains constrained. In advanced economies, the IMF warns that scope for easing monetary policy further should be used aggressively to counter deflationary risks and support demand. Although policy rates are already near the zero floor in many countries, whatever policy room remains should be used quickly. Emerging economies also need to ease monetary conditions to respond to the deteriorating outlook. For many of those economies, the task of central banks is further complicated by the need to sustain external stability in the face of highly fragile financing flows and balance sheet mismatches because of domestic borrowing in foreign currencies. Thus, while most central banks in these economies have lowered interest rates in the face of the global downturn, they have been appropriately cautious in doing so to maintain incentives for capital inflows and to avoid disorderly exchange rates moves.
Crude Oil Spot Price Brent (daily) (US$ per barrel)
Source: US Department of Energy, Energy Information Administration
0
20
40
60
80
100
120
140
160
1989 1991 1993 1995 1997 1999 2001 2003 2005 2007 2009 2011
InflationAdvanced economies (%)
Source: International Monetary Fund
-1.0
0.0
1.0
2.0
3.0
4.0
96 97 98 99 00 01 02 03 04 05 06 07 08* 09* 10*
Interest rate Federal Reserve and ECB (%)
Source: Federal Reserve and European Central Bank (ECB)
0.00.51.01.52.02.53.03.54.04.55.05.56.06.57.07.58.0
1999 2000 2001 2002 2003 2004 2005 2006 2007 2008 2009 2010
United StatesEuro area
Interest rates on international markets (%)
So urce: Ba nco de Españ a b ased on Euro pea n Ba nkin g Fed eration an d Ag encia R euters
0.00.51.01.52.02.53.03.54.04.55.05.56.06.57.07.5
1998 1999 2000 2002 2003 2004 2005 2006 2007 2008 2009 2010
United States 3 months
Euribor 3 months

58
Volume 7 • No. 2 • June 2009
Exchange rates During the period January-May 2009 the US dollar lost 3% against the euro. The euro exchanged at US$ 1.37 in May (1 US$ =€ 0.73) compared to US$ 1.32 in January. The US dollar has weakened versus most major European currencies, with significant losses against the Norwegian krone (-8%) and the Pound sterling (-7%). The US dollar also lost ground to various currencies in the Americas region, most notably the Brazil real (-10%), the Chilean peso (-9%), the Canadian dollar (-6%) and the Mexican peso (-5%). Furthermore, the US dollar has weakened against the South African rand (-15%), the Australian dollar (-12%), the New Zealand dollar (-9%). the Korean won (-8%) and the Indonesia rupiah (-7%).
Exchange rate euro to US dollar (US$ per €)
Source: De Nederlandse Bank
0.70.80.91.01.11.21.31.41.51.61.7
2002 2003 2004 20052006 2007
2008 20092009
A relief for the US dollar was that there was only little change during these first five months with respect to its rate versus the Polish zloty, the Russian Rouble, the Hong Kong dollar, the Indian rupee, the Philippine peso, the Tunisian dinar and the UAE dirham. The US dollar has also kept its value against the Chinese yuan renmibi since January 2009, which may be sign of a slowdown in the Chinese currency’s appreciation. Some currencies were weaker than the US dollar. The US dollar gained 7% against the Japanese yen. In the Americas, the US dollar appreciated against the Jamaican dollar (+10%) and the Argentine peso (+7%). On the other side of the coin, the euro gained 3% against the US dollar. The appreciation by 10% of the euro to the Japanese yen is particularly significant.
Exchange rate British pound
Source: De Nederlandse Bank
0.45
0.55
0.65
0.75
0.85
0.95
1.05
2002 2003 2004 2005 2006 2007 2008 2009
per US dollarper euro
Exchange rate Japanese yen (100)
Source: De Nederlandse Bank
8090
100110120130140150160170180
2002 2003 2004 2005 2006 2007 2008 2009
per US dollarper euro
Exchange rate Chinese yuan renminbi
Source: De Nederlandse Bank
6
7
8
9
10
11
12
2002 2003 2004 2005 2006 2007 2008 2009
per US dollarper euro
Exchange rate Russian rouble
Source: De Nederlandse Bank
20
25
30
35
40
45
50
2002 2003 2004 2005 2006 2007 2008 2009
per US dollarper euro
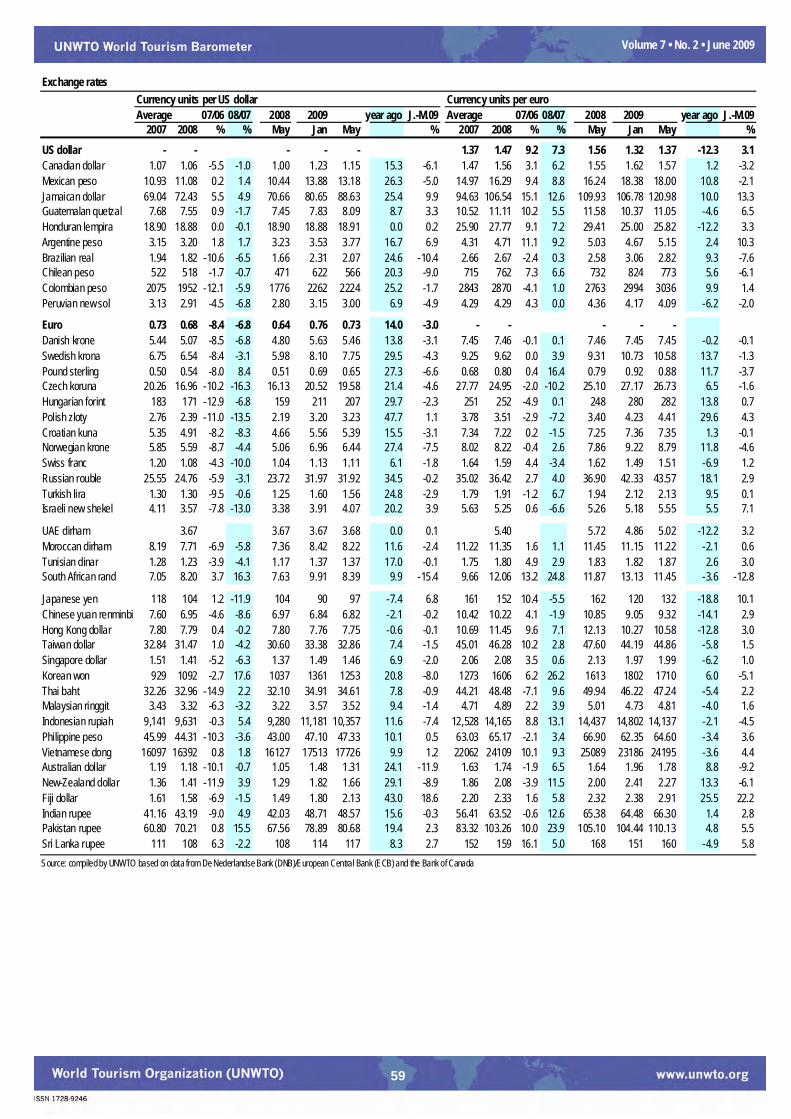
59
Volume 7 • No. 2 • June 2009
Exchange ratesCurrency units per US dollar Currency units per euroAverage 07/06 08/07 2008 2009 year ago J.-M.09 Average 07/06 08/07 2008 2009 year ago J.-M.09
2007 2008 % % May Jan May % 2007 2008 % % May Jan May %US dollar - - - - - 1.37 1.47 9.2 7.3 1.56 1.32 1.37 -12.3 3.1Canadian dollar 1.07 1.06 -5.5 -1.0 1.00 1.23 1.15 15.3 -6.1 1.47 1.56 3.1 6.2 1.55 1.62 1.57 1.2 -3.2Mexican peso 10.93 11.08 0.2 1.4 10.44 13.88 13.18 26.3 -5.0 14.97 16.29 9.4 8.8 16.24 18.38 18.00 10.8 -2.1Jamaican dollar 69.04 72.43 5.5 4.9 70.66 80.65 88.63 25.4 9.9 94.63 106.54 15.1 12.6 109.93 106.78 120.98 10.0 13.3Guatemalan quetzal 7.68 7.55 0.9 -1.7 7.45 7.83 8.09 8.7 3.3 10.52 11.11 10.2 5.5 11.58 10.37 11.05 -4.6 6.5Honduran lempira 18.90 18.88 0.0 -0.1 18.90 18.88 18.91 0.0 0.2 25.90 27.77 9.1 7.2 29.41 25.00 25.82 -12.2 3.3Argentine peso 3.15 3.20 1.8 1.7 3.23 3.53 3.77 16.7 6.9 4.31 4.71 11.1 9.2 5.03 4.67 5.15 2.4 10.3Brazilian real 1.94 1.82 -10.6 -6.5 1.66 2.31 2.07 24.6 -10.4 2.66 2.67 -2.4 0.3 2.58 3.06 2.82 9.3 -7.6Chilean peso 522 518 -1.7 -0.7 471 622 566 20.3 -9.0 715 762 7.3 6.6 732 824 773 5.6 -6.1Colombian peso 2075 1952 -12.1 -5.9 1776 2262 2224 25.2 -1.7 2843 2870 -4.1 1.0 2763 2994 3036 9.9 1.4Peruvian new sol 3.13 2.91 -4.5 -6.8 2.80 3.15 3.00 6.9 -4.9 4.29 4.29 4.3 0.0 4.36 4.17 4.09 -6.2 -2.0
Euro 0.73 0.68 -8.4 -6.8 0.64 0.76 0.73 14.0 -3.0 - - - - -Danish krone 5.44 5.07 -8.5 -6.8 4.80 5.63 5.46 13.8 -3.1 7.45 7.46 -0.1 0.1 7.46 7.45 7.45 -0.2 -0.1Swedish krona 6.75 6.54 -8.4 -3.1 5.98 8.10 7.75 29.5 -4.3 9.25 9.62 0.0 3.9 9.31 10.73 10.58 13.7 -1.3Pound sterling 0.50 0.54 -8.0 8.4 0.51 0.69 0.65 27.3 -6.6 0.68 0.80 0.4 16.4 0.79 0.92 0.88 11.7 -3.7Czech koruna 20.26 16.96 -10.2 -16.3 16.13 20.52 19.58 21.4 -4.6 27.77 24.95 -2.0 -10.2 25.10 27.17 26.73 6.5 -1.6Hungarian forint 183 171 -12.9 -6.8 159 211 207 29.7 -2.3 251 252 -4.9 0.1 248 280 282 13.8 0.7Polish zloty 2.76 2.39 -11.0 -13.5 2.19 3.20 3.23 47.7 1.1 3.78 3.51 -2.9 -7.2 3.40 4.23 4.41 29.6 4.3Croatian kuna 5.35 4.91 -8.2 -8.3 4.66 5.56 5.39 15.5 -3.1 7.34 7.22 0.2 -1.5 7.25 7.36 7.35 1.3 -0.1Norwegian krone 5.85 5.59 -8.7 -4.4 5.06 6.96 6.44 27.4 -7.5 8.02 8.22 -0.4 2.6 7.86 9.22 8.79 11.8 -4.6Swiss franc 1.20 1.08 -4.3 -10.0 1.04 1.13 1.11 6.1 -1.8 1.64 1.59 4.4 -3.4 1.62 1.49 1.51 -6.9 1.2Russian rouble 25.55 24.76 -5.9 -3.1 23.72 31.97 31.92 34.5 -0.2 35.02 36.42 2.7 4.0 36.90 42.33 43.57 18.1 2.9Turkish lira 1.30 1.30 -9.5 -0.6 1.25 1.60 1.56 24.8 -2.9 1.79 1.91 -1.2 6.7 1.94 2.12 2.13 9.5 0.1Israeli new shekel 4.11 3.57 -7.8 -13.0 3.38 3.91 4.07 20.2 3.9 5.63 5.25 0.6 -6.6 5.26 5.18 5.55 5.5 7.1
UAE dirham 3.67 3.67 3.67 3.68 0.0 0.1 5.40 5.72 4.86 5.02 -12.2 3.2Moroccan dirham 8.19 7.71 -6.9 -5.8 7.36 8.42 8.22 11.6 -2.4 11.22 11.35 1.6 1.1 11.45 11.15 11.22 -2.1 0.6Tunisian dinar 1.28 1.23 -3.9 -4.1 1.17 1.37 1.37 17.0 -0.1 1.75 1.80 4.9 2.9 1.83 1.82 1.87 2.6 3.0South African rand 7.05 8.20 3.7 16.3 7.63 9.91 8.39 9.9 -15.4 9.66 12.06 13.2 24.8 11.87 13.13 11.45 -3.6 -12.8
Japanese yen 118 104 1.2 -11.9 104 90 97 -7.4 6.8 161 152 10.4 -5.5 162 120 132 -18.8 10.1Chinese yuan renminbi 7.60 6.95 -4.6 -8.6 6.97 6.84 6.82 -2.1 -0.2 10.42 10.22 4.1 -1.9 10.85 9.05 9.32 -14.1 2.9Hong Kong dollar 7.80 7.79 0.4 -0.2 7.80 7.76 7.75 -0.6 -0.1 10.69 11.45 9.6 7.1 12.13 10.27 10.58 -12.8 3.0Taiwan dollar 32.84 31.47 1.0 -4.2 30.60 33.38 32.86 7.4 -1.5 45.01 46.28 10.2 2.8 47.60 44.19 44.86 -5.8 1.5Singapore dollar 1.51 1.41 -5.2 -6.3 1.37 1.49 1.46 6.9 -2.0 2.06 2.08 3.5 0.6 2.13 1.97 1.99 -6.2 1.0Korean won 929 1092 -2.7 17.6 1037 1361 1253 20.8 -8.0 1273 1606 6.2 26.2 1613 1802 1710 6.0 -5.1Thai baht 32.26 32.96 -14.9 2.2 32.10 34.91 34.61 7.8 -0.9 44.21 48.48 -7.1 9.6 49.94 46.22 47.24 -5.4 2.2Malaysian ringgit 3.43 3.32 -6.3 -3.2 3.22 3.57 3.52 9.4 -1.4 4.71 4.89 2.2 3.9 5.01 4.73 4.81 -4.0 1.6Indonesian rupiah 9,141 9,631 -0.3 5.4 9,280 11,181 10,357 11.6 -7.4 12,528 14,165 8.8 13.1 14,437 14,802 14,137 -2.1 -4.5Philippine peso 45.99 44.31 -10.3 -3.6 43.00 47.10 47.33 10.1 0.5 63.03 65.17 -2.1 3.4 66.90 62.35 64.60 -3.4 3.6Vietnamese dong 16097 16392 0.8 1.8 16127 17513 17726 9.9 1.2 22062 24109 10.1 9.3 25089 23186 24195 -3.6 4.4Australian dollar 1.19 1.18 -10.1 -0.7 1.05 1.48 1.31 24.1 -11.9 1.63 1.74 -1.9 6.5 1.64 1.96 1.78 8.8 -9.2New-Zealand dollar 1.36 1.41 -11.9 3.9 1.29 1.82 1.66 29.1 -8.9 1.86 2.08 -3.9 11.5 2.00 2.41 2.27 13.3 -6.1Fiji dollar 1.61 1.58 -6.9 -1.5 1.49 1.80 2.13 43.0 18.6 2.20 2.33 1.6 5.8 2.32 2.38 2.91 25.5 22.2Indian rupee 41.16 43.19 -9.0 4.9 42.03 48.71 48.57 15.6 -0.3 56.41 63.52 -0.6 12.6 65.38 64.48 66.30 1.4 2.8Pakistan rupee 60.80 70.21 0.8 15.5 67.56 78.89 80.68 19.4 2.3 83.32 103.26 10.0 23.9 105.10 104.44 110.13 4.8 5.5Sri Lanka rupee 111 108 6.3 -2.2 108 114 117 8.3 2.7 152 159 16.1 5.0 168 151 160 -4.9 5.8Source: compiled by UNWTO based on data from De Nederlandse Bank (DNB)/European Central Bank (ECB) and the Bank of Canada

UNWTO World Tourism BarometerThe UNWTO World Tourism Barometer offers a unique overview ofshort-term international tourism trends. It is developed by UNWTOwith the aim to provide all those directly or indirectly involved intourism with adequate up-to-date statistics and analysis in a timelyfashion. Each issue contains three regular sections: an overview ofshort-term tourism trends including data on international touristarrivals, tourism receipts and expenditure for over 100 countriesworldwide and data on air transport on major routes; a retrospectiveand prospective evaluation of current tourism performance by themembers of the UNWTO Panel of Tourism Experts; and selectedeconomic data relevant for tourism. The UNWTO World TourismBarometer is updated in January, June and October.
Available in English, French and Spanish in print and PDF version
The World Tourism Organization is a specialized agency of the United
Nations and the leading international organization in the field of tourism. It
serves as a global forum for tourism policy issues and a practical source of
tourism know-how. Its membership includes 161 countries and territories and
more than 350 Affiliate Members representing local governments, tourism
associations and private sector companies including airlines, hotel groups and
tour operators.
The easy way to order UNWTO publications:
www.unwto.org/infoshop
For further information, please contact:UNWTO Publications Department
Tel. (34) 91 567 8100 - Fax: (34) 91 571 3733e-mail: [email protected]
Cruise Tourism – Current Situation and Trends
Over the past years, worldwide demand for cruise tourism has postedsome of the biggest gains within the tourism sector. The constantdynamism in cruise activity, as well as the increasing number ofcountries that include cruises as a key product for their tourismdevelopment, has led to update and expand the first edition of theUNWTO study of 2003. This new study discusses subjects like thecurrent supply and demand for cruises as well as its characteristicsand trends. A new element includes the relationship betweendestinations and cruise lines, analysing key factors such aslegislation, promotion and the economic impact of cruises throughreference cases. It presents current trends in this industry in terms ofinnovation, safety and security, and sustainability, and identifies themajor lines that will shape the sector.
Available in Spanish, only
Price: € 70, 3 issues(PDF version)
€ 100 (PDF and
print version)
Published: 2008Price: € 80
The Chinese Outbound Travel Market with Special Insight into the Image of Europe as aDestination
China is one of the fastest growing outbound markets in the world.Rising incomes and relaxation of restrictions on foreign travel led toa growth of 22% a year in trips abroad since 2000 (34.5 million in2006). China ranks 5th worldwide in terms of spending oninternational tourism (US$ 30 billion in 2007). In 1995, the WorldTourism Organization (UNWTO) predicted that China wouldgenerate 100 million arrivals worldwide by 2020, making it thefourth largest market in the world (Tourism 2020 Vision). In view ofrecent trends, China may reach that target well before 2020. To betterunderstand the structure and trends of this market is the aim of thenew ETC/UNWTO report The Chinese Outbound Travel Market withSpecial Insight into the Image of Europe as a Destination.
Available in English
Published: 2008Price: € 75
Handbook on E-marketing for TourismDestinationsThis handbook is the first of its kind for tourism destinations. It is apractical ‘how-to’ manual designed to help staff at national, regionaland city tourism organisations, to improve their e-marketing skillsand manage new projects. It covers all the basics such as web design,search engine optimisation, social networking and e-commerce, andadvices among others on how to build better content, get distributionof it, use CRM, succeed with online PR and get into mobilemarketing. Web analytics, online research methods, and performancemeasurement get full treatment and new areas like digital televisionare covered. Also, it includes over 30 examples of e-marketing inaction.
Available in English
Published: 2008Price: € 75
Handbook on Tourism ForecastingMethodologiesTourism demand is a complex phenomenon which can be affected byan incredible number of different exogenous factors – economy, fuelprices, infrastructure, natural disasters, the image of a destination,etc. Therefore, tourism demand, in all of its different forms, is one ofthe most difficult variables to foresee. Nonetheless, it gets more andmore important for destinations and private sector alike to anticipatedemand trends and use such knowledge as a basis of managementdecisions and planning. This Handbook on Tourism ForecastingMethodologies aims to be a simple guide to the complex world oftourism forecasting. It presents the basic forecasting techniques,their advantages and disadvantages as well as some practicalexamples of such methodologies in action. It also includes a CDwhere the methodologies are further explained and exemplified in anexcel file.
Available in English
Published: 2008Price: € 45
The Indian Outbound Travel Market with SpecialInsight into the Image of Europe as a Destination
India is one of the fastest-growing outbound travel markets in theworld. Trips abroad have grown from 3.7 (1997) to 9.8 million (2007)and international tourism expenditure has increased from US$ 1.3(1997) to US$ 8.2 billion (2008). With more than 1.1 billioninhabitants and GDP increasing by more than 8% every year, thecountry offers enormous potential for future growth in outboundtravel. Recognizing the importance of this market, the ETC and theUNWTO have undertaken detailed research on the Indian outboundmarket. This publication covers issues such as travellers’ behaviourand patterns – destination choice, purpose of travel, spending,holiday activities and market segmentation, as well as the media orinternet use trends. The report also sets out recommendations onhow to best promote a destination in the Indian market.
Available in English
Published: 2009Price: € 75
Handbook on Tourism Destination Branding All over, governments have become aware of tourism’s power toboost their nation’s development and prosperity. As more tourismdestinations emerge and competition for visitors becomes moreintense, a destination’s ability to project itself on the world stage anddifferentiate itself from others is ever more important. Recognizingthe value of successfully building and managing a destination’sbrand, the ETC and the UNWTO provide a useful and practicalhandbook for both marketing novices and experienced destinationmanagers. Introduced by Simon Anholt, it offers a step-by-step guideto the branding process accompanied by strategies for brandmanagement. Case studies illustrate the various concepts, presentbest practices from around the world and provide fresh insight intodestination branding. It concludes with a section on evaluating brandimpact and a set of practical recommendations.
Available in English
Published: 2009Price: € 75
The Russian Outbound Travel Market with SpecialInsight into the Image of Europe as a Destination
Russia is the 9th biggest outbound travel market in the world,generating in 2007 US$ 22 billion in spending abroad. To betterunderstand the structure and trends of this growing market is the aimof this ETC/UNWTO report, which identifies key trends in theRussian outbound travel – among others, the market size and value,growth in trip volume and spending, purpose of trip, destinationchoice, the role of the travel trade and online distribution. In addition,the publication provides information on government policy affectingoutbound travel, notably visa issues and traffic rights for foreignairlines operating to/from the country. All this information is criticalto helping destinations and commercial operators plan ahead withgreater foresight, providing guidance on the short-term opportunitiesand the longer-term potential for investment in this market.
Available in English
Published: 2009Price: € 75
Related Documents