Testing the Relationship between Trade and Migration flows: Case Study of Egypt with European Union and Arab Countries by Ahmed F. Ghoneim 1 and Heba El-Deken 2 1 Professor of Economics, Faculty of Economics & Political Science, Cairo University. Email address: [email protected] The paper benefited from the financial support of FEMISE, project No. FEM 34-01 The authors would like to thank Andres Artal, Chair Zaki, and Racha Ramadan on comments on an earlier version of this paper 2 Economic researcher, Cairo University. Email address: [email protected]

Welcome message from author
This document is posted to help you gain knowledge. Please leave a comment to let me know what you think about it! Share it to your friends and learn new things together.
Transcript

Testing the Relationship between Trade and Migration
flows: Case Study of Egypt with European Union and Arab
Countries
by
Ahmed F. Ghoneim1 and Heba El-Deken
2
1 Professor of Economics, Faculty of Economics & Political Science, Cairo University. Email address:
The paper benefited from the financial support of FEMISE, project No. FEM 34-01
The authors would like to thank Andres Artal, Chair Zaki, and Racha Ramadan on comments on an earlier version
of this paper 2 Economic researcher, Cairo University. Email address: [email protected]

Table of Contents
Introduction
Selected literature review
Overview of trade and migration flows for Egypt
Gravity model estimation
Conclusion and policy implications

Introduction
The relationship between trade and migration has attracted the attention of academics and policy
makers extensively. The complexity of the relationship and the desire to understand whether
there is a trade creating effect for migrants has recently attracted a lot of attention. This study
aims at investigating the relationship between trade and migration for Egypt. The study tries to
answer a number of questions including the main question which is whether there are trade
creation effects for Egyptian emigrants or not? And whether such effects differ when the
destination of emigrants changes (EU or Arab countries). Further, the study analyses the trade-
migration relationship and tests whether the type of product traded affects the magnitude of trade
creation, showing whether network or preference effects are the main drivers of this relationship.
The main question that this study tries to focus on, and where there is lack of consensus in the
empirical literature that have dealt with, is what kind of relationship, if any, exists between the
migration and trade patterns: are they complements or they substitute one another? We focus on
the relationship between Egypt and its main migration destinations and trading partners.
According to the knowledge of the authors, the studies undertaken to answer this question for the
Egyptian case were rather absent with the exception of a few studies that dealt with such issue as
Shafik (1992), and Nassar and Ghoneim (2003). We apply a gravity model to test for this
relationship using pooled and panel data for the period 2001-2010. We also use some descriptive
measures to elaborate on the trend and type of trade and migration that have prevailed between
Egypt and its main partners in migration and trade in the first part of the investigation.
The study is divided into three sections following this introduction, where in Section One we
start with a selected literature review on the relationship between trade and migration. In Section
Two we provide an overview on the relationship between trade and migration in Egypt. In
Section Three we run the gravity model and analyze its results. We then conclude and provide
some policy implications.

Section One: Selected literature review
On the theoretical level, the relationship between trade and migration, though deeply
investigated, has remained ambiguous. The conventional theoretical Heckscher-Ohlin-
Samuelson model (factor-price-equalization theorem) identified a substitution type of
relationship between trade and migration3 (Mundell, 1957). Changing the assumptions of the
model, and especially imposing imperfect competition and increasing returns to scale instead of
perfect competition and constant returns to scale or incorporating migration costs and financing
constraint features, might alternate the substitution type relationship into a complementary one.
The Heckscher-Ohlin model, coupled with the assumptions of the North being abundant in
capital and the South abundant in labor, provides a useful analytical framework for explaining
the North-South trade. Adding international labor mobility, substitution between migration and
trade is attained since trade liberalization in either the North or the South leads to more trade and
through the mechanism of reducing the North-South wage differential it leads to less migration.
Developments based on the Heckscher-Ohlin-Samuelson theorem showed that if some of the
assumptions underlying the Heckscher-Ohlin model are changed, trade and migration may be
complements. This issue was examined, for example, by Markusen (1983) and Wong (1983).
Markusen (1983) showed that complementarity between migration and trade is achieved if one
imposes identical factor endowments in both countries but relaxes one of the following
assumptions of the Heckscher-Ohlin model: (a) constant returns to scale, (b) identical
technologies, (c) perfect competition, and (d) no domestic distortions. Then, free trade does not
result in factor-price equalization. By relaxing the different assumptions and especially perfect
competition and constant returns to scale different results are obtained. Moreover, whether trade
and migration are substitutes or complements under economies of scale and imperfect
competition depends on the specific model used (see for example Schiff, 2010 and references
therein), and on the variables considered including the level of tariffs applied, migration costs,
skills of migrants, etc. (Schiff, 2006).
3 According to the neoclassical model, international trade will bring about equalization in the relative and absolute
returns to homogenous factors across nations. In that way, international trade is a substitute of the international
mobility of labor. The original proof of the factor-price equalization theorem is found in Samuelson (1948) and
Samuelson (1949).

On the empirical level, economic research did not reach a concrete relationship between the two
variables. The problem is mainly embedded in the large number of variables that affect such type
of relationship and cannot be controlled for either because of the absence of data or given the
inability of the researcher(s) to quantify them. Among such variables we can find the
technological and communication revolution which has facilitated the flows of people and goods
all over the world. Other factors include the protectionist type of policies against trade and/or
migration flows. Starting in the 1990s, several studies have been devoted to discuss the
relationship between trade and migration, especially after the pioneering work of Gould (1994)
that studied the link between migration and trade using American trade data from 1970 to 1986.
The work of Gould (1994) was followed by other influential studies on other countries and
migrants, including Canada and Chinese migrants as in Head and Reis (1998), Rauch (2001), and
Rauch and Trindade (2002). Those studies concluded that migration leads to a trade creation
effect. The positive impact of migration on trade is either due to the preference channel (of
immigrants for domestic products, mainly in food stuff and differentiated final products), or
through the network channel which operates by reducing transaction trade costs (communication
barriers due to host and home countries language proficiency; better understanding of market
information of home country; and trust developed between immigrants community and traders at
home, as well as through the identification of business opportunities both in origin and
destination markets of the immigrants). The literature has not been clear on which of both effects
is the most important in driving pro-trade effects of immigrants, with different studies applying
different approaches to the issue.
In empirical terms, there are several studies that have found a significant positive impact for
migration on trade. The majority of them have applied the extended gravity equation approach in
capturing such effects, and most of the studies have found that migration has a more substantial
positive impact on imports of the host country than on exports. Some of the most recent
contributions in this literature have tried to better understand such positive relationship, where
for example Foad (2010) identified that there are certain threshold for such positive impact of
migration on trade to appear in data. So, if the level of migration is lower, then trade might not
be profitable until a certain stock of migrants is available in the receiving country. Alternatively,
if an immigrant community becomes large enough, production in the receiving country might
substitute for imports, given a higher assimilation of immigrants to local culture and life style,
hence observing a substitution effects on trade. This implies that the relationship between trade
and migration is not so linear and that the failure to account for these potential non-linearities in
the existing literature has led to biased estimates of the true migration-trade elasticity. The same
was identified by Egger et. al (2011) that have shown the existence of an upper threshold, after
which the trade creation effect of immigrants stops to function. Morgenroth and O’Brien (2008)
identified also that the positive trade creation effect of migration is conditional on a number of
variables including, as they have shown in the case of US as a host country, the level of
immigrants and their origin. Foad (2010) investigated the relationship between migration and
trade within the context of Middle East North Africa (MENA) migrants to both Europe and
North America. Using a gravity model, he identified that the migration-trade link is stronger for
migrants to Europe, with the strongest effect for imports. Moreover, his analysis showed that the
migration-trade link is stronger for differentiated goods than for homogenous and reference price
goods, which is evident more in the case of Europe. He concluded that preference effect is more
evident than the network effect, which is still there but mild (as trade creation effect is much
higher on the exports side of MENA to Europe and North America than the imports side).
Cesi (2011) applied a gravity model analysis to a set of 17 EU countries as host countries and 10
migrant sending countries with a time span from 1997 to 2006. Cesi (2011), contrary to Foad
(2009b) showed that the network effect is rather strong, especially on the immigrants trade with
their home countries, increasing the exports from host country to their home country. She found
little evidence for the network effect in the other direction, and for the preference effect. Murat
and Psitoresi (2009) investigated the case of Italy over the period 1990-2005 for immigrants
from 51 countries using a gravity model and found that migration (both emigrants and
immigrants) help to enhance imports, but immigrants have no significant impact on exports.
Moreover, trade volume of Italy with its historical trading partners (US and rest of EU) despite
being larger, tends to be slower in terms of growth when compared with Italian trade with new
trading partners. Tai (2009) applied a gravity model to the relationship between trade and
migration for Switzerland over the period 1995-2000. Tai (2009) applied a multisector analysis
interacting migration with the elasticity of substitution, as his analysis focused on the role of
market structure arguing that it has a determinal effect on how migration affects trade. His

findings show that Switzerland’s imports are more affected by migration than its exports, and
that migration is found to influence preferences more in differentiated products and impact costs
in an inverted U-shape, being more intense in products with an elasticity of substitution close to
6 and less intense as this elasticity approaches 1 or 7. Ivanon (2008), using detailed data on
migration and trade, identified that the different classes of immigrants have different impacts on
trade and that different classes of goods are affected differently by migrants (blue collars, white
collars, self employed). Requena and Serrano (2011) tested both the trade effects of immigrants
and emigrants and showed that both are of equal importance and that there is no difference
between differentiated and homogenous goods. Bacarreza et. al (2006) tested the impact of
Bolivian migrants on Bolivian trade over the period 1990-2003 and found a significant positive
impact of Bolivian migrants on Bolivian exports and imports. Qian (2007) investigated the
impact of New Zealand immigrants from 190 countries between 1980 and 2005. Qian (2007)
results identified a significant trade creation effects for immigrants on trade , however the
empirical results suggest that immigrants from low-income countries tend to create more trade
than other groups. The same positive trade creation effect of immigrants was found by Bowen
and Wu (2011) who investigated a panel data for immigration in 27 OECD countries over the
period 1980-2009.
However, such positive relationship, which mainly operates through preference and network
effects, has not been pervasive, as some studies have suggested that migration-trade link tends to
decline over time and may not exist universally, since the pro-trade effect of immigration varies
across both countries and commodities. Girma and Yu (2002) investigated the impact of
Commonwealth and non-Commonwealth immigrants in the UK on trade over the period 1981-
1993. They found a robust trade (both exports and imports) creating effect of non-
Commonwealth migrants in the UK, a negative impact for Commonwealth migrants on imports,
and failed to find any significant effect for Commonwealth migrants on exports. Ramon-Munoz
(2009) provided several explanations for this fading effect of migration on trade including the
failure of migrants to overcome trade barriers and have better understanding of market
information (network effect) or change of food and diet habits of immigrants preference effect),
or adoption by immigrants for an import substitution type of policy hence replacing imports by
domestic production in host countries. Other recent studies as Bettin and Lo Turco (2009),

applying a gravity model and using panel data for three year (1995, 2000, and 2005) and bilateral
data for OECD countries with 212 trading partners, reached similar conclusions. They classified
trade data following the Broad Economic Categories (BEC) that arranges commodities according
to "end-use" classes: final consumption, intermediate consumption, and capital formation. They
then aggregated the data in 2 SITC digit level. Bettin and Lo Turco (2009) reached the
conclusion that migration does not have trade creation effect whether on exports or imports, and
if there is any sort of trace creation effect it is mild and only existing in Northern exports to the
South. Moreover, Bettin and Lo Turco (2009) reached the conclusion that migration could have a
negative impact on trade by reducing it when investigating a large dataset of pool data on
immigration in OECD countries. Bruder (2004), who studied the case of immigration in
Germany over the period 1970-1998, found that immigration does not have a significant impact
on trade. The same is true in the study of Clarke and Hillbery (2009) who conducted an analysis
of the impact of immigration on trade in Australia over the period 1981-2006 using a generalized
method of moments estimator that allows to estimate the elasticity of trade to migration, while at
the same time allowing country level fixed effects and persistence to affect the level of bilateral
trade. Clarke and Hillbery (2009) found no significant effect for immigration on trade.
Other studies used alternative methods than gravity equations where Hassan (1998) showed
using an Ordinary Least Squares (OLS) model and covariance analysis that migration has had a
positive impact on the exports trade of Bangladesh. Hassan (1998) identified that there exists a
number of determinants that affect such relationship including the level, concentration, and
composition of migrants, as well as the duration of the process of migration. His analysis, though
not using the same terms, pointed out that both network and preference effects exist where the
complementarity relationship was high in specific products (e.g. food products and live animals).
Nassar and Ghoneim (2003) applied covariance analysis for four MENA countries (Egypt,
Morocco, Tunisia, and Jordan) in terms of their trade and migration relationship with the EU as
well as Gulf countries and used data available on workers’ remittances as a crude proxy for the
number of migrants. A correlation index for the four countries under study has been calculated
between such crude proxy and their exports to the world over the period 1992-1999. The results
failed to reveal any clear trend: the correlation coefficient for Egyptian workers’ remittances
between 1992 and 1998 and its total exports was -0.7 , whereas that of Morocco was -0.15 and

that of Jordan and Tunisia was 0.9. In other words, it was highly negative in one case suggesting
substituibility, neutrality in another, and highly positive suggesting complementarity in two other
cases. On a rather dissagreagted and a more accurate level where some data were available from
SOEPMI on the number of net foreign population in one country by their nationality a
correlation index between exports of a specific country (Morocco) to another country (France
and the Netherlands) and net population flows from the former country to the latter was
calculated. The results obtained were as follows: -0.2 in the case of France and 0.05 in the case
of the Netherlands suggesting a rather neutral relationship between trade and migration which is
compared to the neutral case obtained in the aggregated crude version of the correlation index.
Insel et. al (2010) tested the relationship between Turkish migrants in a number of European
countries and their impact on trade using Least Squares estimation technique under the
assumption of the presence of cross section heteroskedasticity and the robust standard errors for
the period 1980 to 2007. They found a significant positive impact of migration on trade through
preference and network effects.
In general, there is growing empirical evidence in the literature pointing towards the existence of
trade creation effect of migration that is mainly channeled through network effect of migrants.
The network effect is highly associated with reduction of costs concerning trade that arise either
due to weak legal systems governing trade or lack of information on foreign markets and
different social institutions between origin and destination countries of immigrants.

Section Two: An Overview on Migration, Remittances and Trade Trends of Egypt
Migration
Migration in Egypt has always played a paramount role in its economic development. Egypt is
one of the largest emigrating countries in the world and is one of the top 10 remittances receiving
countries all over the world (World Bank, 2011). The existing figures of migrants abroad might
be underestimated due to under registration of Egyptian migrants abroad especially in Europe as
reported by some studies (de Hass, 2007), hence implying the existence of high tendency of
irregular migration. Emigration has not followed a smooth increasing trend where the trend of
emigration has experienced several fluctuations and set-backs, especially in the 1990s, as a result
of external economic and political reasons. Egyptian emigration could be perceived as a long
lasting phenomenon. Several phases of this phenomenon could be distinguished. Before 1971,
emigration from Egypt was subject to many legal restrictions; this fact has limited the number of
emigrants where only professionals, could migrate permanently to the US, Canada, Australia and
Western European countries. Starting 1971, both “permanent” and “temporary” emigration was
authorized. This step, accompanied by the soaring oil prices and increasing demand for migrant
labor in Gulf countries, triggered massive emigration from Egypt to Saudi Arabia, Iraq and the
other Gulf states as well as to Libya. The statistics4 reveal that the number of Egyptian emigrants
was around 70 thousand after 1973 war, and this number continued to follow an upward trend to
reach 1.4 million in 1976, increasing to 3.28 million in 1983. However during the second half of
4 It is worth noting that data on Egyptian migration could be drawn from different sources; among these are the
Central Agency for Public Mobilization and Statistics (CAPMAS), Ministry of Manpower and Emigration, Ministry
of Interior, and consular offices. Discrepancies of data from these different sources are a result of a number of
factors; CAPMAS data on migration are actually estimates that are driven based on CAPMAS census data, hence
they include a margin of error. Concerning consular records, the main limitation of data provided by these records is
that they are of voluntary nature where individual migrants are free to register their arrival and cancel their
registration upon departure; therefore, many migrants don’t simply register themselves. In addition, many migrants
do not inform the consular offices of any subsequent migration, so that, migrants may move to a third country
without notifying their consulates. Also, irregular migrants refrain from registering themselves in consulates (Zohry,
2009). Other sources for migration data include international sources such as registers of immigrants in destination
countries, as well as a number of international institutions databases which includes World Bank, International
Migration Organization, and Organization for Economic Cooperation and Development (OECD). However, none of
the aforementioned sources converge with the other; each database reveals different estimates.

the 1980s, several factors have influenced the emigration trends in Egypt, including the end of
the first Gulf war, decrease in oil prices, and adopting the policy of substituting foreign labor
with nationals in the Gulf countries. Those factors have led to a significant decrease in
emigrants’ number to record 2.25 million in 1986 (Ministry of Manpower and Emigration,
2009). In the beginnings of the 1990s, most of the Egyptian emigrants in both Kuwait and Iraq
have returned back to Egypt due to the second Gulf war; however, after the end of these
circumstances, the emigrants’ number increased again to reach 2.8 million in 1996, remaining
relatively constant since this date till 2000, to represent around 3.9% of the Egyptian population
(Ministry of Manpower and Emigration, 2009). In the meantime, Egypt is witnessing the
permanence of temporary migration whereby migration towards Arab countries is becoming less
temporary (and more permanent) and outnumbers permanent (long term) migration to Europe
and North America. Recently a rise in migration to Europe - mostly irregular - especially to Italy
and France, has been recorded Consortium for Applied Research on International Migration
(2010). There is a high concentration of both temporary and permanent emigrants in few
countries with Saudi Arabia being on top of receiving countries as shown in Figure 1. (IOM,
2003; Wahba, 2007).
Figure 1: Overseas Destinations of Current Migrants
Source: Wahba, Jackline (2007), “An Overview of Internal and International Migration in Egypt”, ERF Working
Paper No. 703, Cairo: Economic Research Forum.
37%
1%14%0%11%
2%
12%
2%
16%1% 2% 2%
Saudi Arabia Lebanon Libya Iraq
UAE Qatar Kuwait Other Arab Countries
Jordan South Africa/Sudan Western Europe Canada & USA

0
200000
400000
600000
800000
1000000
1200000
2000 2001 2002 2003 2004 2005 2006 2007 2008 2009
Temporary Migration
According to the Central Agency for Public Mobilization and Statistics (CAPMAS), the number
of temporary migrants5 in 2009 recorded 1.12 million compared to 1.10 million in 2008 with an
increase of 1.82% (figure 2). It is worth noting that this number has witnessed a significant
increase over the period 2000-2009; increasing from 0.6 million in 2000 to 1.12 in 2009. The
Arab countries are considered the most attracting destination for this kind of migrants all over
the highlighted period of time, comprising more than 95% of migrants. Egypt is the largest
country of origin of the migrant workers to Arab countries. In some years 10% of Egyptian labor
force migrated to Arab countries (Wahba, 2005). In 2009, the Arab countries were the
destination for one million emigrants representing 96.25% of total temporary migration in 2009,
of whom 50.2% are located in Saudi Arabia, and 16.69% in Kuwait. Migrants to European
countries represented 3.03% out of total migrants for the same year, of whom 72.2% headed for
Italy, and 17.39% for Greece. Males account for 97.1% of total migrants and only 29.9% of total
migrants are tertiary educated, where the majority are either graduates of vocational schools or
low level education.6
Figure 2: Number of Egyptian Temporary Migrants over the Period 2000-2009:
Source: CAPMAS, Bulletin on Temporary Migration, 2010.
5 It is worth noting that the Title of “Bulletin on Temporary Migration” issued by CAPMAS changed in 2005 to be
“Bulletin on Number of Contracts and Work Permissions Granted for Egyptians Abroad”. 6 Central Agency for Public Mobilization and Statistics (2010), Bulletin on Temporary Migration.

Permanent Migration
Regarding permanent migration, CAPMAS statistics differentiate between two types of
permanent migrants; those who migrated to a foreign country with the intention of fully and
permanently accommodating in that country by acquiring this foreign nationality and has applied
for migration before traveling through the formal channels, and those who moved to a foreign
country and turned into migrants after a period of accommodation in that country. The following
statistics will treat the two types equally as permanent migrants. According to CPAMAS, these
migrants have reached 4761 over the period 2000-2009, of whom 4272 resided in only three
countries; namely, United States (1945), Canada (1327), and Italy (1000). This comprises more
than 89% of Egyptian permanent migrants (table 1). Nevertheless, there is no common pattern
for Egyptian permanent migration over the abovementioned period; number of migrants has been
fluctuating to various destinations all over the world. However, number of migrants reached its
peak in 2001 with a record of 764 migrants; where in 2003 this number decreased to reach only
310 migrants.
Table 1: Number of Permanent Migrants by Destination over the Period 2000-2009 Destination Country 2000 2001 2002 2003 2004 2005 2006 2007 2008 2009 Total
USA 257 226 174 133 196 240 205 210 175 129 1945
Canada 152 185 137 104 118 141 126 97 126 141 1327
Italy 113 308 323 39 19 22 25 33 60 58 1000
Australia 26 22 20 19 35 49 30 36 49 40 326
New Zealand 14 10 8 6 1 .. 2 3 .. 4 48
Other Countries 11 .. .. .. 2 .. 3 3 10 1 30
United Kingdom 4 3 4 4 .. 1 2 3 .. 3 24
France 5 3 3 2 2 1 2 2 .. 3 23
Germany 4 2 7 3 2 1 1 .. .. .. 20
Netherlands 4 3 5 .. 2 1 .. .. .. .. 15
Austria .. 2 .. .. 1 .. .. .. .. .. 3
Total 590 764 681 310 378 456 396 387 420 379 4761
Source: Central Agency for Public Mobilization and Statistics, Bulletin on Permanent Migration, 2010.
Unlike temporary migration, the majority of permanent migrants are educationally qualified;
those who have completed tertiary education represent around 50% of permanent migrants over
the same period. In the second rank comes the segment of vocational schools graduates which
comprises 40.5% of those migrants (table 2).

Table 2: Educational Status of Permanent Migrants over the Period 2000-2009
Year Higher Education Tertiary Education Vocational Schools Not qualified Educationally Total
2000 28 243 233 32 536
2001 31 322 334 31 718
2002 31 274 323 24 652
2003 8 167 104 14 293
2004 28 200 115 14 357
2005 29 196 180 20 425
2006 23 210 124 11 368
2007 23 198 145 7 373
2008 26 213 148 21 408
2009 28 213 117 11 369
Total 255 2236 1823 185 4499
Source: CAPMAS, Bulletin on Permanent Migration, 2009.
Regarding the occupational profile of Egyptian migration, the data from CAPMAS reveals that
graduates of business faculties represented more than 29% of total migrants over the period
2000-2009; 42% of them headed for the United States, and 31% in Canada. Followed by the
business school graduates, came the graduates of faculty of engineering which comprised 23.8%,
of whom 33% resided in the United States, and 53.7% in Canada over the same period 2000-
2009.
In 2009, the total number of permanent migrants reached 379 migrants; this number comprises
around 270 migrants residing in US and Canada. Highlighting the characteristics of this type of
migrants reveals that 36% of them fall in the age category 30-39 years; 57.72% of them were
highly educated; 68.8% of them are married (CAPMAS, 2010) (for data discrepancy issue see
Annex 1).
What is evident is that during the governments under the presidency of Mubarak irregular
migration increased due to several political and economic reasons that have affected both Egypt
and the world in general. The prospects for increasing the level of migration do not look
promising from the demand side, where several Arab countries as well as many EU countries
have adopted more restrictions on international migration. Security and cultural problems,
besides the conventional political and economic problems of immigrants have created a lot of
concern and lowered the expectations on high migrant flows from Egypt among other migrant

origin countries (de Silva and Silva-Jáuregui, 2004). As asserted by Girgis (2002), the
replacement of Arab workers by Asian ones and the open unemployment among Gulf nationals
have acted as major reasons behind the lessening of migration flows from Egypt, among other
Arab countries to the Gulf. Moreover, the cyclical changes in world oil prices have a significant
impact on the demand for Egyptian migrants especially in the Gulf countries. Such prospects of
changing migration trends should be taken into consideration by the GOE and its partners when
designing its migration policies (Ghoneim, 2010).
Remittances
The role played by remittances and returned migrants has always been significant in the context
of economic development in Egypt. Remittances represented around 4% of Egypt’s GDP in 2009
(World Bank, 2011). Egypt is considered the 13th
largest receiver of remittances in the world and
the second in MENA region. It comes directly after Lebanon with a slight difference. A sharp
increase could be observed in 1992, where remittances increased by more than 50% over one
year due to the first Gulf war, as most of the Egyptians working in both Kuwait and Iraq have
left their jobs and returned back to Egypt (figure 3).
Figure 3: Egypt Inward Remittances Flow over the Period 1977-2010
Source: World Bank (2011), Migration and Remittances Factbook Data, 2011, available online at
http://data.worldbank.org/data-catalog/migration-and-remittances
-
1 000
2 000
3 000
4 000
5 000
6 000
7 000
8 000
9 000
10 000
19
77
19
78
19
79
19
80
19
81
19
82
19
83
19
84
19
85
19
86
19
87
19
88
19
89
19
90
19
91
19
92
19
93
19
94
19
95
19
96
19
97
19
98
19
99
20
00
20
01
20
02
20
03
20
04
20
05
20
06
20
07
20
08
20
09
20
10e
Million US$

It is worth noting that remittances data, just like migration data, differs according to different
sources. For example, according to the Central Bank of Egypt (CBE), remittances in 2008/2009
and 2009/2010 were US$ 7805.7 million and US$ 9753.4 million, respectively (table 3);
however according to World Bank data remittances in 2009 and 2010 was US$ 7150 million and
US$ 7681 million. The US ranked top among the countries from which Egyptians abroad send
their remittances followed by Kuwait, United Arab Emirates and Saudi Arabia.
Table 3: Egypt Inward Remittances over the Period 2001/02-2009/10:
Fiscal Year Remittances in Million US$
2001/2002 3029.5
2002/2003 2976.8
2003/2004 2999.6
2004/2005 4329.5
2005/2006 5034.2
2006/2007 6321.0
2007/2008 8559.2
2008/2009 7805.7
2009/2010 9753.4
Source: Central Bank of Egypt, Annual Report, Various Issues.
The rules and regulations dealing with remittances have experienced a lot of changes. The
Government of Egypt (GOE) in the 1960s used to ask emigrants to repatriate part of their
earnings to the government (whereby migrants had to transfer 25% of their income for single
migrant households and 10% for family households into their own bank account), a policy that
proved to be unsuccessful (Collyer, 2004). The end of 1960s changed exchange rates and the
beginning of 1970s to encourage remittances and the government started issuing special bonds
for emigrants to attract their remittances. In fact Egypt was one of the very few countries that has
liberalized its capital account in its balance of payments (even before attempts to liberalize its
current account) to attract remittances. None of these policies led to significant change of pattern
in using remittances in productive investments7 (ESCWA, 2006; Roman, 2006). The government
changed its policy in the 1980s and induced migrants to send money to a foreign currency
account in Egypt by offering favorable exchange rates. Also bonds for Egyptian migrants were
7 By productive investment it is meant in that context establishing manufacturing or services projects that yield
income and create employment. Since the majority of remittances is spent on buying or constructing houses or
consumption, it is argued that this does not represent productive investment from the economy's point of view.

introduced. Law 111/1983 recognized some rights for Egyptians abroad, such as tax exemptions
on the bank deposits of emigrants in banks operating in Egypt and the capital contributed by an
Egyptian emigrant shall be treated on the basis of their enjoyment of all privileges prescribed for
the foreign capital working in the same field. Since that date remittances have not been regulated
by any means neither through obligations to repatriate part of the remittances back to Egypt, nor
through provision of incentives for emigrants and Diaspora to send their remittances back home.
An idea of taxing remittances was raised in the 1990s, but was soon abandoned as it was found
to be an irrational decision (Ghoneim, 2010).
Trade Flows
According to the aforementioned major countries of destinations for Egyptian emigrants, the
selected countries that have been chosen to trace their commodity exports to Egypt include three
regions: i) Arab countries, mainly Saudi Arabia, Libya, Kuwait and Jordan; and ii) European
countries, mainly Italy, France and Germany, and iii) US and Canada as benchmarks. However,
due to data unavailability, within Arab region, Saudi Arabia and Jordan are the only available
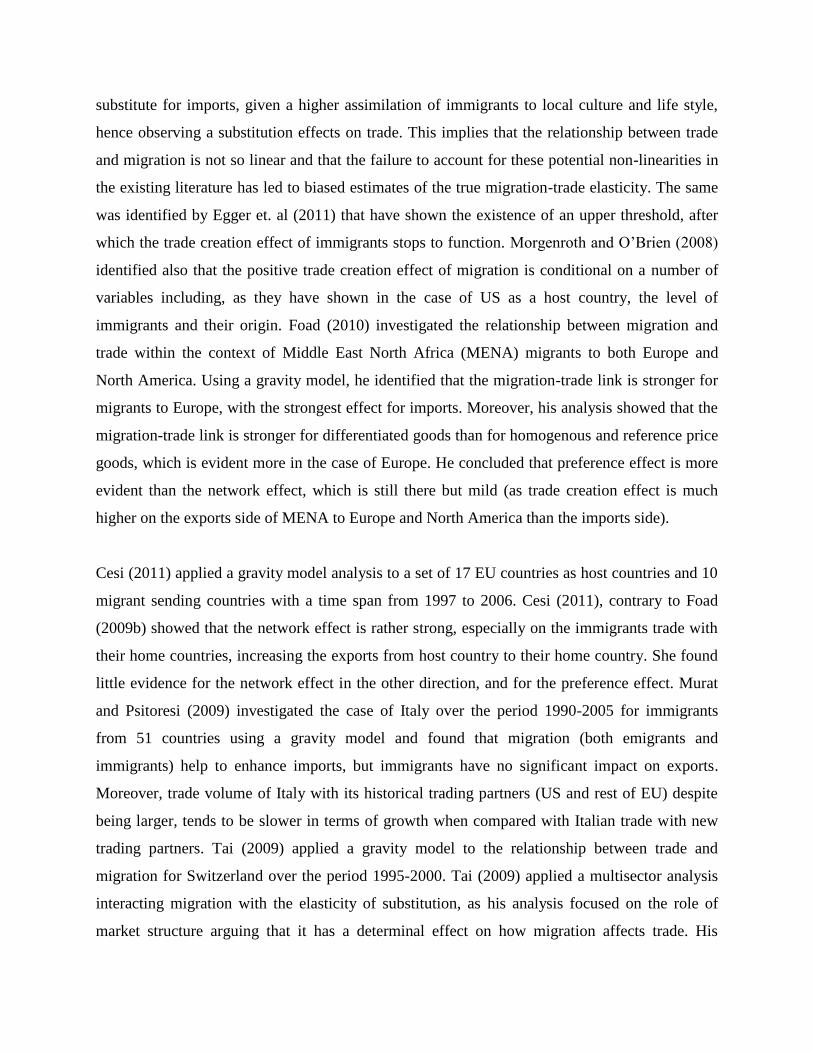
countries from COMTrade database as reporters exporting to the Egyptian market. The top 10
commodity groups Saudi Arabia exports to Egypt are shown in figure 4. It is clear that mineral
fuels, mineral oils and products of their distillation commodity group is the most important
import group Egypt receives from Saudi Arabia; it accounts for about 59% of total Saudi
Arabian exports to Egypt (figure 4). Hence, there is a high concentration of commodity reference
price imports from Saudi Arabia. We use the COMTrade database where we classify exports and
imports using HS 2 digit level. Yet for the sake of analysis that will follow in section three we
categorize products into homogenous, reference priced, and differentiated products8.
8 Rauch (1999) divides goods into three groups: (i) those traded on an organized exchange, (ii) those with a
reference price in industry journals, and (iii) those that fail to enter the first two categories.
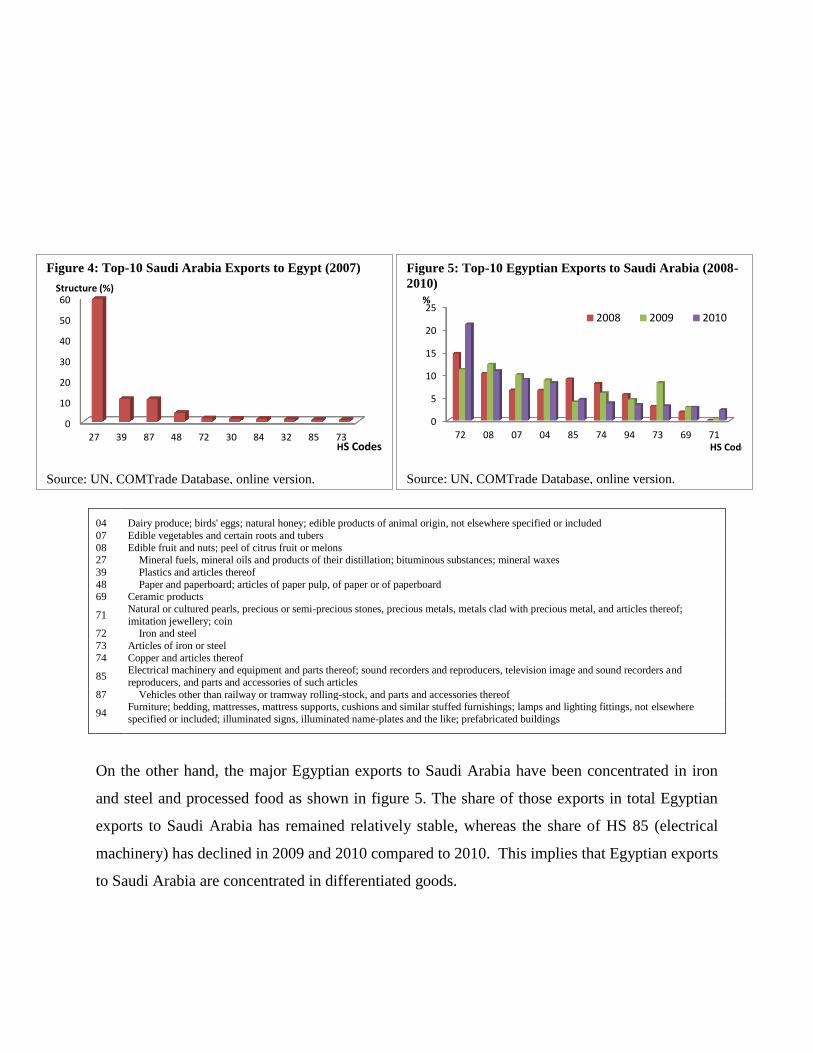
Figure 4: Top-10 Saudi Arabia Exports to Egypt (2007)
Source: UN, COMTrade Database, online version.
0
10
20
30
40
50
60
27 39 87 48 72 30 84 32 85 73HS Codes
Structure (%)
Figure 5: Top-10 Egyptian Exports to Saudi Arabia (2008-
2010)
Source: UN, COMTrade Database, online version.
0
5
10
15
20
25
72 08 07 04 85 74 94 73 69 71
%
HS Code
2008 2009 2010
04 Dairy produce; birds' eggs; natural honey; edible products of animal origin, not elsewhere specified or included
07 Edible vegetables and certain roots and tubers
08 Edible fruit and nuts; peel of citrus fruit or melons 27 Mineral fuels, mineral oils and products of their distillation; bituminous substances; mineral waxes
39 Plastics and articles thereof
48 Paper and paperboard; articles of paper pulp, of paper or of paperboard 69 Ceramic products
71 Natural or cultured pearls, precious or semi-precious stones, precious metals, metals clad with precious metal, and articles thereof;
imitation jewellery; coin 72 Iron and steel
73 Articles of iron or steel
74 Copper and articles thereof
85 Electrical machinery and equipment and parts thereof; sound recorders and reproducers, television image and sound recorders and
reproducers, and parts and accessories of such articles
87 Vehicles other than railway or tramway rolling-stock, and parts and accessories thereof
94 Furniture; bedding, mattresses, mattress supports, cushions and similar stuffed furnishings; lamps and lighting fittings, not elsewhere
specified or included; illuminated signs, illuminated name-plates and the like; prefabricated buildings
On the other hand, the major Egyptian exports to Saudi Arabia have been concentrated in iron
and steel and processed food as shown in figure 5. The share of those exports in total Egyptian
exports to Saudi Arabia has remained relatively stable, whereas the share of HS 85 (electrical
machinery) has declined in 2009 and 2010 compared to 2010. This implies that Egyptian exports
to Saudi Arabia are concentrated in differentiated goods.

Figure 6: Top-10 Jordanian Exports to Egypt (2007-2010)
Source: UN, COMTrade Database, online version.
0
5
10
15
20
25
31 48 30 84 60 39 38 01 63 32
%
HS Code
2007 2008 2009 2010
Figure 7: Top-10 Egyptian Exports to Jordan (2008-2010)
Source: UN, COMTrade Database, online version.
0
10
20
30
40
50
27 71 74 28 85 69 04 07 72 48
%
HS Code
2008 2009 2010
Jordanian exports to Egypt are relatively more diversified than the Saudi Arabian exports. Figure
6 shows that fertilizers account for the highest share among the Egyptian imports from Jordan.
Paper and paperboard, articles of paper pulp, paper, and paperboard recently represents the
second group of Jordanian exports to Egypt. Apart from its historical low ratio, the share of such
products has witnessed a significant increase during the last two years. The share of
pharmaceutical products has fluctuated however it still remained higher than other group of
commodity products other than fertilizers and paper products. Hence, Jordanian exports to Egypt
are more of homogenous and differentiated products.
01 Live animals; animal products
04 Dairy produce; birds' eggs; natural honey; edible products of animal origin, not elsewhere specified or included 07 Edible vegetables and certain roots and tubers
27 Mineral fuels, mineral oils and products of their distillation; bituminous substances; mineral waxes
28 Inorganic chemicals; organic or inorganic compounds of precious metals, of rare-earth metals, of radioactive elements or of isotopes 30 Pharmaceutical products
31 Fertilisers
32 Tanning or dyeing extracts; tannins and their derivatives; dyes, pigments and other colouring matter; paints and varnishes; putty and other mastics; inks
38 Miscellaneous chemical products 39 Plastics and articles thereof
48 Paper and paperboard; articles of paper pulp, of paper or of paperboard
60 Knitted or crocheted fabrics 63 Other made up textile articles; sets; worn clothing and worn textile articles; rags
69 Ceramic products
71 Natural or cultured pearls, precious or semi-precious stones, precious metals, metals cladwith precious metal, and articles thereof; imitation jewellery; coin
72 Iron and steel
74 Copper and articles thereof 84 Nuclear reactors, boilers, machinery and mechanical appliances; parts thereof
85 Electrical machinery and equipment and parts thereof; sound recorders and reproducers, television image and sound recorders and
reproducers, and parts and accessories of such articles

Regarding Egyptian exports to Jordan there is high concentration when compared to Egyptian
imports from Jordan and when compared to Egyptian exports to Saudi Arabia. The high
concentration of HS 27 has declined where its share went down from 50% in 2008 to less than
40% in 2009 (figure 7). However, this decerase in the share of HS 27 could be a result of lower
oil prices. Other major exports to Jordan are relatively diversified (comprising iron and steel,
processed food, machinery, and chemicals). Yet, the shares of such other main products
remained relatively stable. Hence, there is a tendency for Egyptian exports directed to Arab
countries to be more concentrated in diffrentiated products, with no clear characteristics for
imports from Arab countries as they include refernce priced, homogensnous and diffrentiated
products.
Regarding European countries, we observe that as shown in figure 8, Italy and Germany have the
highest trade values with Egypt; however, the in last two years the German exports to Egypt
have exceeded those of Italy. The UK has the lowest export value among the selected group of
countries.
Figure 8: Egyptian Imports form some selected European Countries (2007-2010)
Source: UN, COMTrade Database, online version.
Figures 9, 11, and 13 reveal the most important Italian, German, and French exports to Egypt
where there is high concentration in HS 84 (machinery, etc.) representing the major exports from
those there countries to Egypt. Other major exports of those countries to Egypt constitute of HS
0
500
1000
1500
2000
2500
3000
3500
4000
4500
2007 2008 2009 2010
Million US$
France Germany Italy United Kingdom

Figure 9: Top-10 Italian Exports to Egypt (2007-2010)
Source: UN, COMTrade Database, online version.
0
10
20
30
40
50
84 27 85 29 72 87 73 39 38 32
%
HS Code
2007200820092010
Figure 10: Top-10 Egyptian Exports to Italy (2008-2010)
Source: UN, COMTrade Database, online version
0
10
20
30
40
50
27 76 31 52 72 07 38 63 62 41
%
HS Code
2008 2009 2010
87. France major exports to Egypt constitute of cereals. Moreover, France exports to Egypt are
more diversified and less concentrated compared to those of Germany and Italy. This implies
that Egypt's imports from European countries are more concentrated in differentiated products.
On the other hand figures 10, 12 and 14 reveal major Egyptian exports to Italy, Germany and
France where the export structure is highly similar and HS 27 (mineral fuels) is the major export.
Other major exports include fertilizers, edible vegetables, and iron and steel. Hence, there is high
concentration of Egyptian exports to European countries in homogenous and reference priced
products.
07 Edible vegetables and certain roots and tubers
27 Mineral fuels, mineral oils and products of their distillation; bituminous substances; mineral waxes
29 Organic chemicals 31 Fertilisers
32 Tanning or dyeing extracts; tannins and their derivatives; dyes, pigments and other colouring matter; paints and varnishes; putty and other
mastics; inks 38 Miscellaneous chemical products
39 Plastics and articles thereof
41 Raw hides and skins(other than furskins) and leather 52 Cotton
62 Articles of apparel and clothing accessories, not knitted or crocheted
63 Other made up textile articles; sets; worn clothing and worn textile articles; rags 72 Iron and steel
73 Articles of iron or steel
76 Aluminum and articles thereof 84 Nuclear reactors, boilers, machinery and mechanical appliances; parts thereof
87 Vehicles other than railway or tramway rolling-stock, and parts and accessories thereof

Figure 11: Top-10 German Exports to Egypt (2007-2010)
Source: UN, COMTrade Database, online version
0
5
10
15
20
25
30
84 87 85 99 90 30 39 38 29 72
%
HS Code
2007
2008
2009
2010
Figure 12: Top-10 Egyptian Exports to Germany (2008-
2010)
Source: UN, COMTrade Database, online version
0
5
10
15
20
27 62 76 39 07 61 57 31 85 12
%
HS Code
2008 2009 2010
07 Edible vegetables and certain roots and tubers
12 Oil seeds and oleaginous fruits; miscellaneous grains, seeds and fruit; industrial or medicinal plants; straw and fodder
27 Mineral fuels, mineral oils and products of their distillation; bituminous substances; mineral waxes
29 Organic chemicals
30 Pharmaceutical products 31 Fertilisers
38 Miscellaneous chemical products
39 Plastics and articles thereof 57 Carpets and other textile floor coverings
61 Articles of apparel and clothing accessories, knitted or crocheted
62 Articles of apparel and clothing accessories, not knitted or crocheted 72 Iron and steel
76 Aluminum and articles thereof
84 Nuclear reactors, boilers, machinery and mechanical appliances; parts thereof
85 Electrical machinery and equipment and parts thereof; sound recorders and reproducers, television image and sound recorders and
reproducers, and parts and accessories of such articles
87 Vehicles other than railway or tramway rolling-stock, and parts and accessories thereof
90 Optical, photographic, cinematographic, measuring, checking, precision, medical or surgical instruments and apparatus; parts and
accessories thereof
99 Commodities not specified according to kind

Figure 13: Top-10 French Exports to Egypt (2007-2010)
Source: UN, COMTrade Database, online version
0
5
10
15
20
25
10 88 84 30 85 29 07 38 87 90
%
HS Code
2007200820092010
Figure 14: Top-10 Egyptian Exports to France (2008-2010)
Source: UN, COMTrade Database, online version
0
10
20
30
40
50
31 27 28 39 85 61 63 07 38 62
%
HS Code
2008 2009 2010
07 Edible vegetables and certain roots and tubers
10 Cereals
27 Mineral fuels, mineral oils and products of their distillation; bituminous substances; mineral waxes
28 Inorganic chemicals; organic or inorganic compounds of precious metals, of rare-earth metals, of radioactive elements or of isotopes
29 Organic chemicals
30 Pharmaceutical products 31 Fertilisers
38 Miscellaneous chemical products
39 Plastics and articles thereof 61 Articles of apparel and clothing accessories, knitted or crocheted
62 Articles of apparel and clothing accessories, not knitted or crocheted
63 Other made up textile articles; sets; worn clothing and worn textile articles; rags 84 Nuclear reactors, boilers, machinery and mechanical appliances; parts thereof
85 Electrical machinery and equipment and parts thereof; sound recorders and reproducers, television image and sound recorders and
reproducers, and parts and accessories of such articles 87 Vehicles other than railway or tramway rolling-stock, and parts and accessories thereof
88 Aircraft, spacecraft, and parts thereof
90 Optical, photographic, cinematographic, measuring, checking, precision, medical or surgical instruments and apparatus; parts and accessories thereof
The trends of trade between Egypt and Arab countries on the one hand (at this level of
aggregation) shows that that trade is more of a mixture of inter-industry and intra-industry trade,
whereas on the other hand the trade with European countries (at this level of aggregation) shows
that trade is of inter-industry type. Moreover, the structure of Egyptian exports to European
countries is highly similar to the structure of Egyptian imports from Arab countries (reference
priced and homogenous) whereas the structure of Egyptian exports to Arab countries is highly
similar to Egyptian imports from European countries (differentiated products).

Figure 15: Top-10 Canadian Exports to Egypt (2008-2010)
Source: UN, COMTrade Database, online version.
0
20
40
60
80
100
120
72 10 48 07 26 12 84 04 73 47
%
Mill
ion
s U
S$
HS Code
2008 2009 2010
Figure 16: Top-10 Egyptian Exports to Canada (2008-
2010)
Source: UN, COMTrade Database, online version.
0
20
40
60
80
100
71 57 31 62 20 63 07 61 55 28
%
Mill
ion
s U
S$
HS Code
2008 2009 2010
Figure 17: Top-10 US Exports to Egypt (2008-2010)
Source: UN, COMTrade Database, online version.
0
200
400
600
800
1000
1200
10 73 84 12 85 39 27 72 23 38
%
Mill
ion
s U
S$
HS Code
2008 2009 2010
Figure 18: Top-10 Egyptian Exports to USA (2008-2010)
Source: UN, COMTrade Database, online version.
0
100
200
300
400
500
600
700
62 27 61 57 58 31 28 63 20 12
%
Mill
ion
s U
S$
HS Code
2008 2009 2010
Figures 15, 16, 17, and 18 shows the main Egyptian exports and imports to and from the US and
Canada revealing that type of trade with those two countries is highly similar to the one existing
between Egypt and the EU countries.
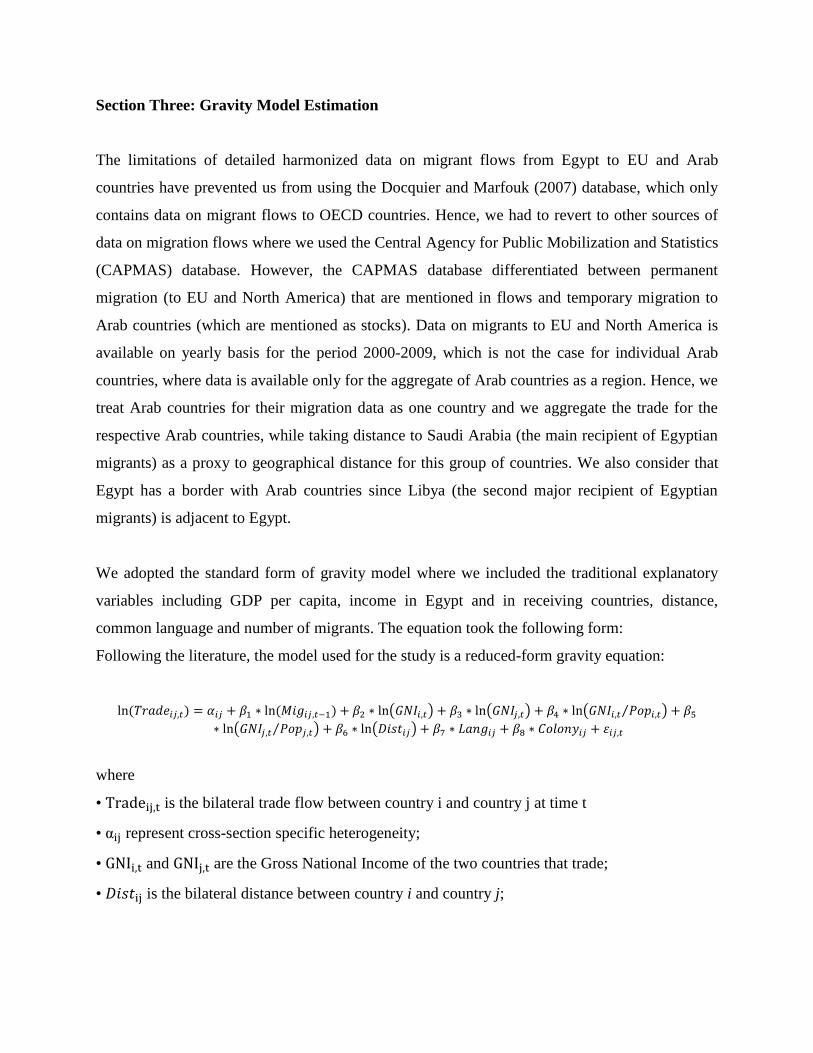
Section Three: Gravity Model Estimation
The limitations of detailed harmonized data on migrant flows from Egypt to EU and Arab
countries have prevented us from using the Docquier and Marfouk (2007) database, which only
contains data on migrant flows to OECD countries. Hence, we had to revert to other sources of
data on migration flows where we used the Central Agency for Public Mobilization and Statistics
(CAPMAS) database. However, the CAPMAS database differentiated between permanent
migration (to EU and North America) that are mentioned in flows and temporary migration to
Arab countries (which are mentioned as stocks). Data on migrants to EU and North America is
available on yearly basis for the period 2000-2009, which is not the case for individual Arab
countries, where data is available only for the aggregate of Arab countries as a region. Hence, we
treat Arab countries for their migration data as one country and we aggregate the trade for the
respective Arab countries, while taking distance to Saudi Arabia (the main recipient of Egyptian
migrants) as a proxy to geographical distance for this group of countries. We also consider that
Egypt has a border with Arab countries since Libya (the second major recipient of Egyptian
migrants) is adjacent to Egypt.
We adopted the standard form of gravity model where we included the traditional explanatory
variables including GDP per capita, income in Egypt and in receiving countries, distance,
common language and number of migrants. The equation took the following form:
Following the literature, the model used for the study is a reduced-form gravity equation:
( ) ( ) ( ⁄ )
( ⁄ ) ( )
where
• is the bilateral trade flow between country i and country j at time t
• represent cross-section specific heterogeneity;
• and are the Gross National Income of the two countries that trade;
• is the bilateral distance between country i and country j;
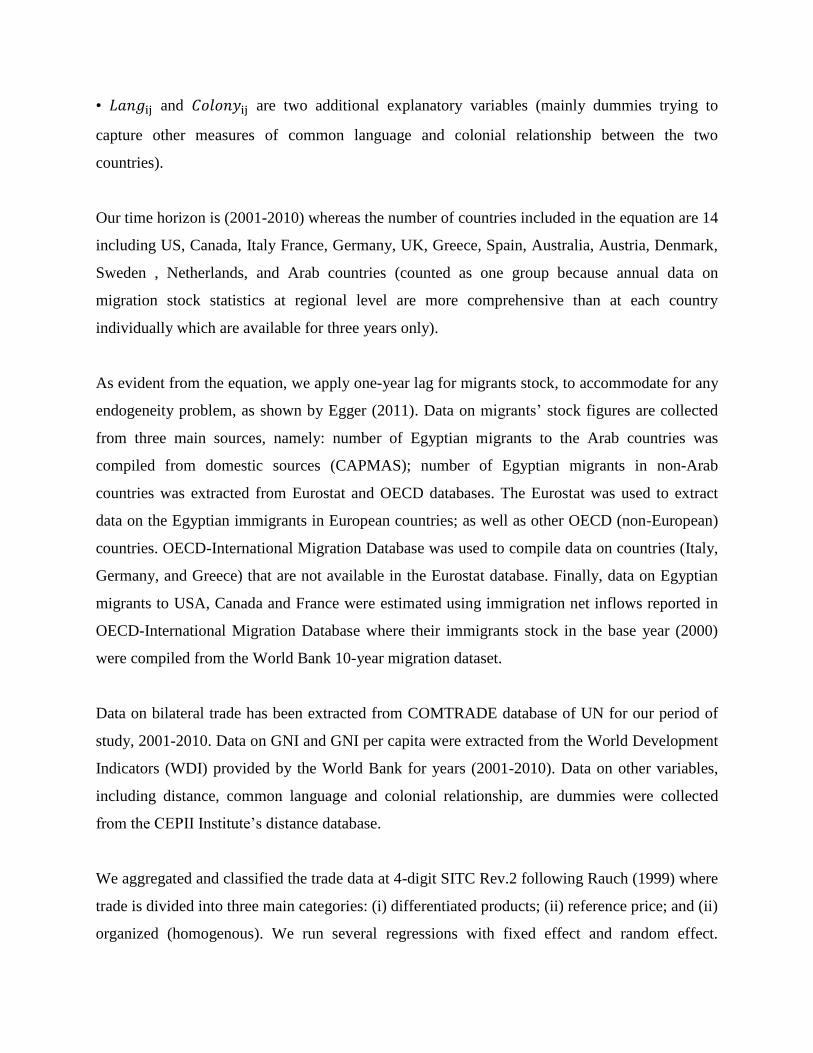
• and are two additional explanatory variables (mainly dummies trying to
capture other measures of common language and colonial relationship between the two
countries).
Our time horizon is (2001-2010) whereas the number of countries included in the equation are 14
including US, Canada, Italy France, Germany, UK, Greece, Spain, Australia, Austria, Denmark,
Sweden , Netherlands, and Arab countries (counted as one group because annual data on
migration stock statistics at regional level are more comprehensive than at each country
individually which are available for three years only).
As evident from the equation, we apply one-year lag for migrants stock, to accommodate for any
endogeneity problem, as shown by Egger (2011). Data on migrants’ stock figures are collected
from three main sources, namely: number of Egyptian migrants to the Arab countries was
compiled from domestic sources (CAPMAS); number of Egyptian migrants in non-Arab
countries was extracted from Eurostat and OECD databases. The Eurostat was used to extract
data on the Egyptian immigrants in European countries; as well as other OECD (non-European)
countries. OECD-International Migration Database was used to compile data on countries (Italy,
Germany, and Greece) that are not available in the Eurostat database. Finally, data on Egyptian
migrants to USA, Canada and France were estimated using immigration net inflows reported in
OECD-International Migration Database where their immigrants stock in the base year (2000)
were compiled from the World Bank 10-year migration dataset.
Data on bilateral trade has been extracted from COMTRADE database of UN for our period of
study, 2001-2010. Data on GNI and GNI per capita were extracted from the World Development
Indicators (WDI) provided by the World Bank for years (2001-2010). Data on other variables,
including distance, common language and colonial relationship, are dummies were collected
from the CEPII Institute’s distance database.
We aggregated and classified the trade data at 4-digit SITC Rev.2 following Rauch (1999) where
trade is divided into three main categories: (i) differentiated products; (ii) reference price; and (ii)
organized (homogenous). We run several regressions with fixed effect and random effect.

Testing for multicolinearity identified that the income and per capita income suffer from
multicolinearity, so we decided to drop the per capita income variable.
We run several types of regressions including pooled, pooled with dummies, pooled sectoral,
panel fixed effect (sectoral and country specific), and panel random. We report a number of such
regressions below (regressions 1 to 8). We do not report regression with fixed effects as
following Hausman test we rejected the null hypothesis and hence random effect regressions
were the most appropriate9. Our results showed that Egyptian migrants do have a pro-trade
effect, yet not on all types of product categories, which differs in the exporting and importing
vectors. The pro-trade effect of migrants is clear and significant in the case of Egyptian exports
and imports, suggesting the presence of mixed preference and network effects. By types of
products, Egyptian migrants do show a trade creation effect on Egyptian homogenous and
exports (preference+network) and on Egyptian imports (network on net) on reference priced
products. Differentiated products show some network effect on net, with increasing imports
arriving to Egypt from the country of destination of Egyptian emigrants (growth in Egyptian
imports), while homogenous goods show a clear and enormous preference effect in Egyptian
exports to those receiving countries. The magnitude of the coefficient in terms of migrants
creating trade of such organized exports is much higher than in other studies in the literature
showing some elasticity estimates (0.98 for homogenous exports and 0.44 for reference price
imports) that are considered to be extremely high when compared to the average values in the
literature, that range between 0.15 and 0.50 (Genç et al., 2011), 0.10 to 0.16 (Requena and
Serrano, 2011) and even lower estimates as in (Casi, 2010). Hence, when we corrected for
heteroscedasticity the coefficient of general trade decreased to 0.128 (down from 0.241 in pooled
regression) and that of exports to 0.285 (down from 0.251 in pooled regression) which is in line
with the estimates found in the literature. This has also been the case with homogenous exports
whose coefficient decreased to 0.8 and for reference price imports which decreased to 0.124. The
coefficient of homogenous exports remains extremely high when compared with similar
estimates in the literature, and hence in this case we should only focus on the trend of the results
9When undertaking the Hausman test for specific types of exports and imports we observe that fixed effect
regression were the more suitable in some cases as we did not reject the null hypothesis. However, comparing the
results of random and fixed effects regressions did not reveal any differences in significance and only minute
differences in coefficients, hence for the sake of simplicity we reported only the random effect results.

and not the magnitude. Correcting for heteroscedasticity resulted also in making some other
specific imports and exports statistically significant, where we observe that the migration effect
on differentiated exports become significant with a reasonable coefficient of 0.109. This has also
been the case with differentiated imports which had a coefficient of -0.336 implying a negative
relationship between migration and imports and a coefficient of 0.398 for homogenous imports.
The results differ when digging into details where we find that the export creation effect of
migrants holds only in a specific set of countries when the regression is run on country specific
with fixed effects where it holds only for three countries namely Australia, Canada and Sweden.
This could be a result of the type of migrants (skills or income) implying that there are threshold
effects (based on skill level (education) or income), yet our data do not allow us to investigate it.
Notwithstanding, all these giant elasticities found in the country analysis warns us from taking
them with their values where we should take them just as an indication, given the important bias
in estimation shown by other studies when employing these type of disaggregated data (e.g.
Bandyopadhyay et al., 2008).
The overall result for our case study is that the pro-trade effect of Egyptian migrants is evident in
the case of Egypt for imports, through network effects, as well as in the case of Egyptian exports
to destination countries of emigrants, in a more clear preference driven effect. Generally, we also
observe that the trade enhancement effect is country and product specific and evident in the case
of homogenous and differentiated exports (implying a preference effect endowed in Egyptian
exports). The country specific effect is in line with results of Foad (2010) who highlights the
relevance of such preference channel for MENA emigrants going to EU countries in leading pro-
trade effects of migrants, as we have found. The trade creation effect of migrants on Egyptian
imports is highly evident in homogenous and reference priced commodities implying a network
effect.
Finally, the lack of significance of migrants’ trade effect in the case of Arab countries observed
in country specific table of results could be implying two tentative explanations. The first one is
that given cultural similarity between Egypt and those countries, migrant networks would not be
playing an important role, neither for the network channel, nor for the preference one. Given
similarities in foodstuff supply in Arab countries, the products that Egyptians usually employ at

home are readily available in the Arab foreign markets, and hence there is no specific preference
effect. Also, and due to the similar language, culture and other traditions, no network effect is
neither significant, which is not the case of Egyptian emigrants to EU or North America. The
second interpretation become more related to the type of migration found in Egypt, where
country specific regressions point out towards positive impact for permanent migrants on trade,
but not in the case of temporary migrants, the ones characterizing the Diaspora to Arab countries
of Egyptians.

Regression One: Pooled
Variable Ln(Trade) Ln(Exp) Ln(Imp)
Ln(Migration) 0.241*** 0.251** 0.151
(0.0899) (0.114) (0.113)
Ln(Dist) -0.839*** -2.276*** -0.560***
(0.168) (0.212) (0.210)
Ln(GDP_EGY) 1.328*** 0.818*** 1.433***
(0.232) (0.294) (0.291)
Ln(GDP_PRT) 0.935*** 1.512*** 0.857***
(0.079) (0.099) (0.0989)
Language 0.166 0.367 0.473
(0.359) (0.454) (0.450)
Colony -0.922** -0.875* -0.857*
(0.389) (0.492) (0.537)
Constant 3.567* 11.697*** 1.558
(1.987) (2.512) (2.491)
Observations 396 396 396
R-squared 0.580 0.666 0.4236
Standard errors in parentheses
*** p<0.01, ** p<0.05,p<0.1
Regression Two: Pooled Sectoral
Variable Differentiated Homogeneous Reference Priced
Ln(Exp) Ln(Imp) Ln(Exp) Ln(Imp) Ln(Exp) Ln(Imp)
Ln(Migration) -0.091 0.152* 0.987*** -0.142 -0.143 0.443***
(0.119) (0.083) (0.206) (0.215) (0.168) (0.084)
Ln(Dist) -2.299*** -0.363** -1.833*** -1.097*** -2.695*** -0.221
(0.222) (0.155) (0.383) (0.401) (0.312) (0.156)
Ln(GDP_EGY) 1.544*** 1.261*** -0.323 1.574*** 1.233*** 1.465***
(0.308) (0.215) (0.531) (0.556) (0.433) (0.216)
Ln(GDP_PRT) 1.465*** 1.082*** 1.192*** 1.108*** 1.878*** 0.381***
(0.105) (0.073) (0.180) (0.189) (0.147) (0.073)
Language 1.935*** -1.534*** -2.075** 3.134*** 1.243* -0.179
(0.476) (0.332) (0.821) (0.859) (0.669) (0.334)
Colony -1.327** 0.684* 0.562 -3.061*** -1.861** -0.193
(0.516) (0.361) (0.890) (0.932) (0.797) (0.362)
Constant 12.035*** 0.578 8.427* 4.561 14.63*** -0.463
(2.634) (1.839) (4.541) (4.753) (3.702) (1.846)
Observations 132 132 132 132 132 132
R-squared 0.820 0.827 0.708 0.553 0.758 0.753
Standard errors in parentheses
*** p<0.01, ** p<0.05, *p<0.1

Regression Three: Panel with Random Effect
Variable Ln(Trade) Ln(Exp) Ln(Imp)
Ln(Migration) 0.247** 0.424*** 0.088
(0.116) (0.156) (0.148)
Ln(GDP_EGY) 1.479*** 1.126*** 1.573***
(0.130) (0.182) (0.167)
Ln(GDP_PRT) 0.760*** 1.036*** 0.733***
(0.122) (0.165) (0.155)
Ln(Dist) -0.572*
(0.295) -1.897***
(0.360) -0.079
(0.367)
Language 0.751
(0.894) 0.056
(1.124) 1.499
(1.121)
Colony -0.605
(0.683) -.321
(0.829) -0.269
0.849
Constant 1.803 8.822*** -1.549
(2.326) (2.835) (2.896)
Observations 396 396 396
R-squared 0.581 0.652 0.432
Number of Cross-Section Observations 42 42 42
Standard errors in parentheses
*** p<0.01, ** p<0.05, * p<0.1
Regression Four: Hausman-Taylor Estimate
Variable Ln(Trade) Ln(Exp) Ln(Imp)
Ln(Migration) 0.299** 0.550*** 0.102
(0.131) (0.185) (0.168)
Ln(GDP_EGY) 1.471*** 1.140*** 1.567
(0.130) (0.184) (0.167)
Ln(GDP_PRT) 0.739*** 0.938*** 0.732***
(0.125) (0.176) (0.159)
Ln(Dist) -0.615**
(0.292) -1.963***
(0.398) -0.096
(0.360)
Language 0.502
(0.925) -0.501
(1.278) 1.429
(1.157)
Colony -0.638
(0.669) -0.359
(0.910) -0.283
(0.822)
Constant 1.851 8.782*** -1.509
(2.277) (3.100) (2.801)
Observations 396 396 396
Standard errors in parentheses
*** p<0.01, ** p<0.05, * p<0.1

Regression Four: Regression with AR(1) Disturbance
Variable Ln(Trade) Ln(Exp) Ln(Imp)
Ln(Migration) 0.169 0.344** 0.042
(0.121) (0.162) (0.155)
Ln(GDP_EGY) 1.416*** 1.088*** 1.498***
(0.154) (0.212) (0.200)
Ln(GDP_PRT) 0.855*** 1.195*** 0.811***
(0.135) (0.179) (0.173)
Ln(Dist) -0.553**
(0.277) -1.932***
(0.345) -0.083
(0.349)
Language 1.038
(0.864) 0.316
(1.101) 1.626
(1.093)
Colony -0.624
(0.638) -0.381
(0.792) -0.313
(0.803)
Constant 2.031 8.970*** -1.249
(2.193) (2.737) (2.764)
Observations 396 396 396
R-Squared 0.588 0.660 0.435
Autocorrelation Coefficient 0.357 0.317 0.371
Standard errors in parentheses
*** p<0.01, ** p<0.05, * p<0.1
Regression Five: Regression with Panel-Corrected Standard Errors (Heteroscedastic)
Variable Ln(Trade) Ln(Exp) Ln(Imp)
Ln(Migration) 0.127*** 0.285*** 0.062**
(0.026) (0.046) (0.025)
Ln(GDP_EGY) 1.355*** 0.815*** 1.458***
(0.117) (0.166) (0.144)
Ln(GDP_PRT) 0.992*** 1.495*** 0.901***
(0.029) (0.054) (0.029)
Ln(Dist) -0.616***
(0.064) -2.085***
(0.065) -0.174***
(0.046)
Language 1.156***
(0.166) 0.360**
(0.182) 1.486***
(0.212)
Colony -0.695***
(0.042) -0.599***
(0.054) -0.395
(0.088)
Constant 2.303*** 10.025*** -1.121
(0.657) (0.971) (0.722)
Observations 396 396 396
R-Squared 0.5895 0.666 0.436
Standard errors in parentheses
*** p<0.01, ** p<0.05, * p<0.1

Regression Six: Panel Sectoral with Random Effect
Variable Differentiated Homogeneous Reference Priced
Ln(Trade)1/ Ln(Exp) Ln(Imp) 1/ Ln(Trade) Ln(Exp) 1/ Ln(Imp) Ln(Trade) Ln(Exp) Ln(Imp)
Ln(Migration) -0.067 0.135 -0.187 0.506* 1.000*** 0.326 0.266* 0.155 0.141
(0.108) (0.184) (0.124) (0.273) (0.324) (0.368) (0.153) (0.254) (0.119)
Ln(GDP_EGY) 1.593*** 1.818*** 1.688*** 1.429*** 0.529 1.399*** 1.409*** 1.079*** 1.632***
(0.122) (0.209) (0.136) (0.315) (0.372) (0.435) (0.180) (0.289) (0.154)
Ln(GDP_PRT) 0.816*** 0.997*** 0.743*** 0.693** 0.072 1.047*** 0.801*** 1.965*** 0.399***
(0.113) (0.193) (0.129) (0.288) (0.341) (0.389) (0.162) (0.267) (0.127)
Ln(Dist) -0.817***
(0.267)
-1.074**
(0.451)
-0.555*
(0.334)
-0.296
(0.648)
-2.294***
(0.767)
0.219
(0.828)
-0.590*
(0.348)
-2.291***
(0.615)
0.089
(0.242)
Language 1.208
(0.814)
1.935
(1.381)
0.885
(0.997)
0.261
(2.005)
-2.252
(2.373)
1.366
(2.602)
0.931
(1.089)
0.457
(1.889)
2.179***
(0.788)
Colony 0.024**
(0.617)
0.421
(1.042)
0.181
(0.777)
-1.128
(1.494)
-0.120
(1.769)
-1.018
(1.899)
-0.703
(0.798)
-1.215
(1.419)
0.023**
(0.552)
Constant 6.391*** 2.184 5.182** -3.015 15.189** -8.611 2.053 8.939* -1.217
(2.102) (3.555) (2.643) (5.102) (6.042) (6.508) (2.734) (4.845) (1.912)
Observations 132 132 132 132 132 132 132 132 132
R-squared 0.841 0.797 0.757 0.634 0.576 0.508 0.754 0.753 0.814
Standard errors in parentheses
*** p<0.01, ** p<0.05, * p<0.1 1/ The results showed significant Hausman statistics in those cases, however, the random effect estimates were reported for the standardization
of presenting estimation results.
Regression Seven: Sectoral Regression with Panel-Corrected Standard Errors (Heteroscedastic)
Variable Differentiated Homogeneous Reference Priced
Ln(Trade) Ln(Exp) Ln(Imp) Ln(Trade) Ln(Exp) Ln(Imp) Ln(Trade) Ln(Exp) Ln(Imp)
Ln(Migration) -0.262*** 0.109*** -0.336*** 0.571*** 0.862*** 0.398*** 0.071** -0.115 0.124***
(0.032) (0.033) (0.029) (0.048) (0.110) (0.079) (0.031) (0.083) (0.030)
Ln(GDP_EGY) 1.344*** 1.523*** 1.350*** 1.250*** -0.320 1.493*** 1.471*** 1.241*** 1.532***
(0.191) (0.148) (0.239) (0.177) (0.542) (0.231) (0.186) (0.270) (0.167)
Ln(GDP_PRT) 1.296*** 1.366*** 1.326*** 0.857*** 1.254*** 0.839*** 0.824*** 1.864*** 0.540***
(0.026) (0.033) (0.026) (0.037) (0.088) (0.060) (0.077) (0.109) (0.035)
Ln(Dist) -0.940***
(0.037)
-1.316***
(0.075)
-0.795***
(0.055)
-0.497***
(0.119)
-2.983***
(0.143)
0.268***
(0.102)
-0.413***
(0.122)
-1.957***
(0.059)
0.004
(0.104)
Language 1.796***
(0.089)
1.748***
(0.210)
1.153***
(0.123)
-0.218
(0.362)
-2.557***
(0.409)
1.161*
(0.641)
1.888***
(0.179)
1.890***
(0.337)
2.145***
(0.201)
Colony -0.211***
(0.078)
0.111
(0.088)
-0.193**
(0.083)
-1.344***
(0.147)
-1.050***
(0.208)
-0.906***
(0.213)
-0.529***
(0.094)
-0.858***
(0.149)
-0.087
(0.114)
Constant 7.158*** 3.303*** 6.198*** -2.228** 18.144*** -8.722*** 1.979 8.627*** -0.838
(1.011) (0.845) (1.279) (1.147) (2.840) (1.373) (1.220) (1.426) (0.994)
Observations 132 132 132 132 132 132 132 132 132
R-squared 0.8797 0.8131 0.8113 0.6388 0.7126 0.5106 0.7684 0.7642 0.8227
Standard errors in parentheses
*** p<0.01, ** p<0.05, * p<0.1
Regression Eight: Country Specific Effect

Ln(Exp) Ln(Imp)
Country/Region Fixed
Effect Ln(Migrants)
Ln(GDP
_PRT)
Ln(GDP
_EGY)
Fixed
Effect Ln(Migrants)
Ln(GDP
_PRT)
Ln(GDP
_EGY)
Arab World -50.76 5.56 -1.32 -0.37 53.00 -6.80 7.02** 0.54
(6.416) (3.625) (1.362) (5.067) (2.867) (1.070)
Austria -9.16 0.38 1.97* 0.33 -1.42 0.01 1.59* 0.28
(0.975) (1.050) (0.480) (0.771) (0.832) (0.382)
Australia -565.23 56.88*** -3.10* -0.87 79.55 -6.99 0.44 0.45
(19.027) (1.594) (0.700) (15.040) (1.263) (0.551)
Canada -100.23 13.05** -5.81*** 2.00*** 160.23 -21.92*** 8.64*** 5.14***
(5.076) (1.889) (0.633) (3.998) (1.492) (0.498)
Denmark -69.58 11.74 -1.78* 0.29 89.18 -13.41** 1.15 2.26***
(7.337) (1.050) (0.400) (5.811) (0.834) (0.316)
France 2.98 -2.13 2.36* 1.86*** 2.17 0.56 -0.28 1.51***
(1.645) (1.214) (0.593) 1.289 (0.956) (0.465)
Germany -21.12 1.53 1.52 1.17** -13.16 1.04 0.80 1.92***
(1.194) (0.945) (0.501) 0.945 (0.746) (0.397)
Greece 0.38 0.27* 0.70** 0.85** -0.01 -0.16 0.65** 1.74***
(0.160) (0.332) (0.411) 0.127 (0.262) (0.326)
Italy -3.66 -3.64* 6.36** 1.77** 0.51 -1.91 2.91 2.21***
(2.125) (2.489) (0.766) 1.682 (1.969) (0.606)
Spain -2.50 -1.60 2.85*** 1.50*** 6.74 -2.39** 1.99*** 1.96***
(1.183) (0.934) (0.408) 0.933 (0.740) (0.325)
Sweden -50.33 8.73** -2.15** 0.50 -93.85 15.91*** -1.54** -2.30***
(3.508) (0.905) (1.027) 2.771 (0.717) (0.809)
United Kingdom 28.33 -1.05 0.27 -2.07 -15.97 2.23 1.18 -1.01
(4.697) (1.426) (5.443) 3.728 (1.147) (4.294)
United States -58.73 8.11* -2.47 -0.44 55.79 -8.45** 4.28** 3.64***
(4.581) (2.320) (1.024) 3.614 (1.836) (0.806)
AR(1) -0.67***
(0.046)
-0.80***
(0.034)
AR(2) -0.67***
(0.046)
-0.80***
(0.033)
Observations 340 340
Number of
Cross-Section
Observations
30 30
R-squared 0.908 0.880
Standard errors in parentheses
*** p<0.01, ** p<0.05, * p<0.1
Conclusion and Policy Implications
Policy prescriptions, especially in the South-North context do not seem to have the uncertainty in
the type of relationship between migration and trade mentioned in the study so far. Policy makers

of the North seem to have rather a firm belief in the substitution type relationship between trade
and migration, which contradicts with the results of the emerging literature and results of this
study. This opens opportunities for a new approach of policies from the trade and migration side,
with migrant networks promoting trade exchanges.
The study revealed that Egyptian migrants are able to create trade with major immigrants
receiving countries in the EU. However, this is only in specific type of products and not with all
countries. Hence, the study revealed that migration enhances trade between Egypt and EU
countries through both preference and network effects, but with a predominant role of the former
over the later channel. The type of trade enhanced by Egyptian migrants differs on the exports
and imports side, where Egyptian emigrants help to enhance Egyptian homogenous and
differentiated exports in the EU (clear preference channel) and European homogenous and
reference price imports in Egypt (more closer to network effects and market opportunities in
Egypt). This is an important finding for policy makers on both ends of the Mediterranean as it
concedes an important role for migrants that has been often neglected.
To overcome the chronic economic problems faced by most of the countries in the MENA
region, including Egypt, especially those related to the labor market and the unemployment
problem and to make use of the trade creation effect of migration several policies need to be
adopted on the local and regional levels. Such issues need to be dealt with in a comprehensive
way where for example, the low rate of return on education implies that dealing with migration
requires tackling other areas as education and not only employment, emphasizing that migration
has many roots in the society. On the regional level, the Egyptian government should link its
education and training efforts to the migrants' countries needs. For example, the readmission
agreement that was signed with Italy in 2006 was accompanied by an agreement that regulates
legal migrant flows to Italy, specifying a certain quota of Egyptian labor to migrate to Italy on
annual basis based on the demands of the Italian labor market. Fulfilling the quota remained a
challenge for the Egyptian government as finding the labor with the skills needed in the Italian
market remained a problem (Ghoneim, 2010; Zohry 2009). This is in line with the results of the
study which based on country specific regressions it was found that trade creation effects of

Egyptian migrants is only available in some countries implying the possibility of presence of
specific skills or income threshold effects.
Digging further, on the local level, the EU and Arab migrant receiving countries need to
implement a number of pivotal changes in their policies. Given the protectionist attitude towards
immigrants and trade flows, the solution lies in domestic development. Hence a first step would
consist of smoothing out the mismatch between job seeker profiles and market needs. Upgrading
programs must be introduced to achieve the necessary competitive retraining of labor. Sectoral
changes are also a must. Overvaluation of domestic currencies that resulted in misallocation of
resources by favoring capital-intensive projects rather labor intensive ones should be redirected.
In other words, the structure of incentives should be revised to provide the right environment for
allocating resources. Finally, strengthening the entrepreneurial spirit in the educational system is
needed to allow the shift toward a more diversified specialized labor force. Achieving such goals
is capable of producing a labor force that is capable of meeting the challenges faced domestically
to produce the right type of products that can be exported and at the same time creates the right
skills needed by the hosting countries in case of migration.
On the regional level, a better coordination of migration policies and industrial planning is
needed within the MENA region. This will help to achieve a better allocation of resources.
Hence, the Pan Arab Free trade Area (PAFTA) project should address the migration issues and
industrial planning which according to the knowledge of the authors is not included under its
context or any other context. In the case of the North-South trade and migration relations,
Southern countries should exert pressure to enact the movement of temporary labor to capitalize
on their comparative advantage in trade in services issues even if on a temporary GATS style.
The future research agenda should address issues like the impact of national policies toward
immigration and its role as an impediment to trade in services in the receiving countries. There is
also more to be known about the indirect effects of migrant-importing strategies on the
subsequent economic trends and trade position of these countries in selected industries. For
sending areas, there is little documentation of the economic and trade consequences in countries

that have followed an explicit or implicit policy of training skilled workers for international
export (e.g. the Philippines, Sri Lanka, Barbados).
Migration should be dealt with in a wider context to count for its spillovers on trade. For
example, the low rate of return on education implies that dealing with migration requires tackling
other areas as education and not only employment, emphasizing that migration has many roots in
the society. There is also a need to establish programs that make use of returned migrants in
terms of the experience they have accumulated over years, and this can further enhance trade. As
argued before Wahba (2003) identified that there is a need to benefit from return migrants
experience as they have positive impact on the Egyptian economy, while networks still
remaining and fostering trade exchanges. Specific programs in terms of selected job
opportunities and use of remittances can be established aiming at benefiting from skills of certain
migrants acquired abroad. Designed programs to link Diaspora with their home community
through investment and trade should be enhanced, with important bilateral gains to be exploited.
There are several programs that have been designed in countries that are less developed than
Egypt in this regard and have proved to be a success. The case of Diaspora from Ghana residing
in Europe and how successful they were in exporting fruits from Ghana to Italy is worth
following (Pandya, 2007). Role of NGOs and cooperatives is highly appreciated in this regard
whether on initiated in collaboration with the government or as self-established programs.

References
Anderson, James and Douglas Marcouiller (2000), “Insecurity and the Pattern of Trade: An
Empirical Investigation” NBER Working Paper No. 7000.
Bacarreza, Canavire, Gustavo Javier and Ehrlich, Laura (2006), “ The Impact of Migration on
Foreign Trade: A Developing Country Approach”, MPRA Paper No. 1090, available at
http://mpra.ub.uni-muenchen.de/1090/
Bandyopadhyay S, C C Coughlin, H J Wall (2008), "Ethnic Networks and US Exports", Review
of International Economics, 16(1), 199–213.
Bettin, Giulia and Alessia Lo Turco (2009), A Cross Country View On South-North Migration
And Trade, University of Hamburg, mimeo.
Bowen, Harry and Jennifer P. Wu (2011), “Immigrant Specificity and the Relationship between
Trade and Immigration: Theory and Evidence”, Discussion Paper No. 2011-01, McColl School
of Business , Queens University of Charlotte.
Bruder, Jana (2004), “Are Trade and Migration Substitutes or Complements? - The Case of
Germany, 1970-1998”, University of Rostock, mimeo.
Casi, Laura (2011), "Enhancing Trade Through Migration: A Gravity Model of the Network
Effect", ISLA-Bocconi, mimeo.
Central Bank of Egypt, Annual Report 2009/2010, available online at
http://www.cbe.org.eg/public/Annual_2009-2010.pdf
Clarke, Andrew J. and Russell H. Hillberry (2009), “Immigration and Trade in Recent Australian
History”, University of Melbourne, mimeo.
Collyer, Michael (2004), “The Development Impact of Temporary International Labour
Migration on Southern Mediterranean Sending Countries: Contrasting Examples of Morocco and
Egypt”, Working paper No. T6, issued by the Development Research Centre on Migration,
Globalisation and Poverty.
Consortium for Applied Research on International Migration (2010), Egypt-Migration Profile.
De Haas, Hein (2007), "North African Migration Systems: Evolution, transformation, and
development linkages", IMI Working Paper No. 6, Oxford: International Migration Institute.
de Silva, Sara Johansson and Carlos Silva-Jáuregui (2004), “Migration and Trade in MENA:
Problems or Solutions?”, Middle East and North Africa Working Paper Series No. 40,
Washington D.C: World Bank.

Docquier, F. and A. Marfouk (2007), "The Brain Drain in Developing Countries", World Bank
Economic Review, 21:193‐218, 2007.
Egger, Peter H., Maximilian von Ehrlich, and Douglas R. Nelson (2011), “ Migration and
Trade”, CESIFO WORKING PAPER NO. 3467, available at http://www.cesifo-
group.de/portal/pls/portal/docs/1/1200786.PDF
ESCWA Economic and Social Commission for Western Asia (2006), “International Migration in
the Arab Region”, Report of the Expert Group Meeting on International Migration and
Development in the Arab region: Challenges and Opportunities”, Beirut, Lebanon,
UN/POP/EGM/2006/14.
Foad, Hisham (2010) “Assimilation and Trade between the Middle East, Europe, and North
America”, Review of Middle East Economics and Finance, 6(2).
Genc, Masood Gheasi, Peter Nijkamp, Jacques Poot (2011), "The Impact of Immigration on
International Trade: A Meta-Analysis", IZA DP 6145, Germany.
Ghoneim, Ahmed Farouk (2010), "Labour Migration for Decent Work, Economic Growth and
Development in Egypt", International Migration Papers No. 106, International Labour
Organization (ILO), Geneva.
Girgis, Maurice (2002), “Would Nationals and Asians replace Arab Workers in the GCC?”,
paper presented at the Fourth Mediterranean Development Forum, Amman, October, 2002.
Girma, S. and Z. Yu (2002), “The Link between Immigration and Trade: Evidence from the
UK”, Review of World Economics Weltwirtschaftliches Archiv, 138, 1, 115-30.
Gould, David M. (1994), "Immigrant Links to the Home Country: Empirical Implications for
U.S. Bilateral Trade Flows", Review of Economics and Statistics, no. 76 (2), pp. 302-316.
Hassan, Munir (1998), "Complemntarity between International Migration and Trade: A Case
Study of Bangladesh", Southwestern College, Kansas, mimeo
Head, Keith and Ries, John (1998), “Immigration and trade creation: econometric evidence from
Canada”, in Canadian Journal of Economics, vol. XXXI, n. 1, pp. 47-62.
Insel, Aysu, Nesrin Sungur Cakmak and, Alptug Okten (2010), “The Link between Turkish
Emigrants and the Turkish Trade in Europe”, paper presented at the 30th Annual Meeting of the
MEEA in conjunction with the Annual Meeting of the ASSA, January 3-6, 2010 Atlanta, USA.
International Organization of Migration (IOM) (2003), Contemporary Egyptian Migration,
Report undertaken jointly with Emigration Sector, Ministry of Manpower and Emigration and
COOPERAZIONE ITALIANA.

Markusen, J.R. (1983), “Free Movements and Commodity Trade as Complements”, Journal of
International Economics, No. 14, pp. 341-356.
Ministry of Labor Force and Migration (2009), History and Statistics of Egyptian Migration
Bulletin.
Morgenroth, Edgar and Martin O’Brien (2008), “Some Further Results on the Impact of
Migrants on Trade”, Working Paper 26/2008, DYNREG
Pandya, Jemini (2007), "When Investment is not just about Economics-Migrants making a
difference in the development equation" available at
http://www.iom.int/jahia/jahia/featureArticleAF/cache/offonce?entryld=14589#
Ivanov, Andrey V. (2008), “Informational effects of migration on trade”, Center for
Development Studies in Economics (CDSE) Discussion Paper No. 42, University of Manheim,
CDSE.
Mundell, R. 1957. "International Trade and Factor Mobility," American Economic Review
XLVII (June):321-335.
Murat, Marina and Barbara Pistoresi (2009), “Migrant Networks: Empirical Implications for the
Italian Bilateral Trade”, International Economic Journal, 23 (3), 371- 390.
Nassar, Heba and Ahmed F. Ghoneim (2003), “Trade and Migration, Are They Complements or
Substitutes: A Review of Four MENA Countries”, ERF Working Paper No. 0207, Cairo:
Economic Research Forum.
Qian, Mingming (2007), "Economic Relationship between Trade and Immigration in New
Zealand", 178.799 Research Report, Massey University, Albany November 2007.
Ramon-Muñoz, Ramon (2009), "Migration and Trade: The Case of Southern European
Immigration and Olive Oil Importers in the Americas (1875-1930), Paper presented at the
Eighth Conference of the European Historical Economics Society (EHES)Graduate Institute of
International and Development Studies, Geneva, September 4-5, 2009.
Rauch, James E. (2001) “Business and Social Networks in International Trade”, Journal of
Economic Literature, v. XXXIX, pp. 1177-1203.
Rauch, James E. (1999), “Networks versus Markets in International Trade,” Journal of
International Economics, volume 48, pp 7–35.
Rauch, James E. and Trindade, Vitor (2002) “Ethnic Chinese Networks in International Trade.”
The Review of Economics and Statistics, v. 84, pp. 116–130.
Requena, Francisco and Guadalupe Serrano (2011), "The Migration-Trade Link: Immigrants or
Emigrants?", University of Valencia, mimeo.

Roman, Howaida (2006), “Emigration Policy in Egypt”, Analytical and Synthetic Notes 2006/12
- Political and Social Module, Cooperation project on the social integration of immigrants,
migration, and the movement of persons, Florence: European University Institute in cooperation
with European Commission.
Samuelson, P. A. (1948), “International Trade and the Equalization of Factor Prices”, Economic
Journal, June 1948, pp. 165-184.
Samuelson, P. A. (1949), “International Factor-Price Equalization Once again”, Economic
Journal, June 1949, pp. 181-197
Schiff, Maurice (2006), “Migration, Investment and Trade: Substitutes or Complements?”,
available at:
http://www.ffem.net/webdav/site/afd/shared/PORTAILS/PUBLICATIONS/EUDN/EUDN2006/
Schiff.pdf
Schiff, Maurice (2010), "Small State Regional Cooperation, South-South and South-North
Migration, and International Trade", World Bank Research Working Paper No. 5297,
Washington D.C.: World Bank.
Shafik, Nemat (1992), “Has Labor Migration Promoted Economic Integration in the Middle
East?”, paper prepared for the seventeenth annual symposium of the Center of Contemporary
Arab Studies on Arab Integration: A Critical Evaluation held at the Georgetown University,
April 9-10, 1992.
Tai, Silvio H. T. (2009), “Market structure and the link between migration and trade”, Review of
World Economics (Weltwirtschaftliches Archiv), 145(2), 225-249.
Wahba, Jackline (2003), " Does International Migration Matter? A Study of Egyptian Return
Migrants", Paper presented at the Conference on “Arab Migration in a Globalised World”, by
IOM and Arab League of Nations, Cairo 2-4 September, 2003.
Wahba, Jackline (2005), " International Migration, Education and Market Failure in MENA",
Background Paper for the World Bank’s MENA Regional Report on Education.
Wahba, Jackline (2007), “An Overview of Internal and International Migration in Egypt”, ERF
Working Paper no. 703, Cairo: Economic research Forum.
Wong, K-Y. (1983), “On Choosing Among Trade in Goods and International Capital and Labor
Mobility: A Theoretical Analysis”, Journal of International Economics, No. 14, pp. 223-250.
World Bank (2011), Migration and Remittances Fact Book Data, 2011, available online at
http://data.worldbank.org/data-catalog/migration-and-remittances
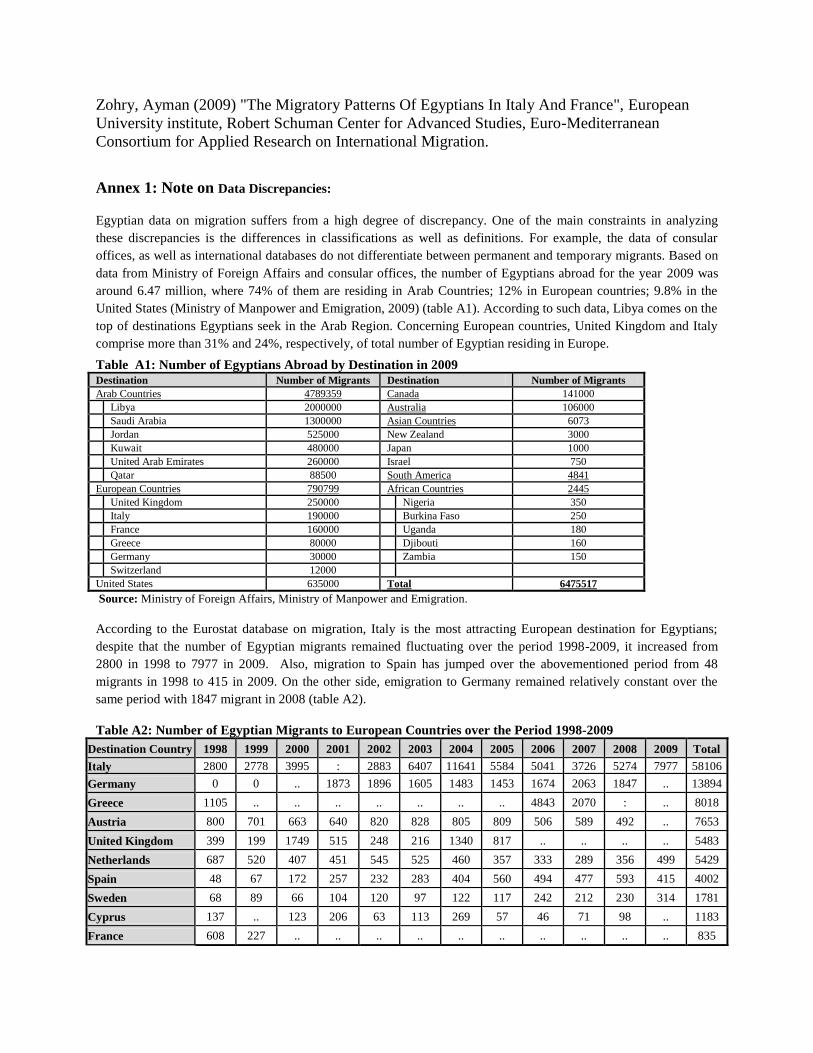
Zohry, Ayman (2009) "The Migratory Patterns Of Egyptians In Italy And France", European
University institute, Robert Schuman Center for Advanced Studies, Euro-Mediterranean
Consortium for Applied Research on International Migration.
Annex 1: Note on Data Discrepancies:
Egyptian data on migration suffers from a high degree of discrepancy. One of the main constraints in analyzing
these discrepancies is the differences in classifications as well as definitions. For example, the data of consular
offices, as well as international databases do not differentiate between permanent and temporary migrants. Based on
data from Ministry of Foreign Affairs and consular offices, the number of Egyptians abroad for the year 2009 was
around 6.47 million, where 74% of them are residing in Arab Countries; 12% in European countries; 9.8% in the
United States (Ministry of Manpower and Emigration, 2009) (table A1). According to such data, Libya comes on the
top of destinations Egyptians seek in the Arab Region. Concerning European countries, United Kingdom and Italy
comprise more than 31% and 24%, respectively, of total number of Egyptian residing in Europe.
Table A1: Number of Egyptians Abroad by Destination in 2009 Destination Number of Migrants Destination Number of Migrants
Arab Countries 4789359 Canada 141000
Libya 2000000 Australia 106000
Saudi Arabia 1300000 Asian Countries 6073
Jordan 525000 New Zealand 3000
Kuwait 480000 Japan 1000
United Arab Emirates 260000 Israel 750
Qatar 88500 South America 4841
European Countries 790799 African Countries 2445
United Kingdom 250000 Nigeria 350
Italy 190000 Burkina Faso 250
France 160000 Uganda 180
Greece 80000 Djibouti 160
Germany 30000 Zambia 150
Switzerland 12000
United States 635000 Total 6475517
Source: Ministry of Foreign Affairs, Ministry of Manpower and Emigration.
According to the Eurostat database on migration, Italy is the most attracting European destination for Egyptians;
despite that the number of Egyptian migrants remained fluctuating over the period 1998-2009, it increased from
2800 in 1998 to 7977 in 2009. Also, migration to Spain has jumped over the abovementioned period from 48
migrants in 1998 to 415 in 2009. On the other side, emigration to Germany remained relatively constant over the
same period with 1847 migrant in 2008 (table A2).
Table A2: Number of Egyptian Migrants to European Countries over the Period 1998-2009
Destination Country 1998 1999 2000 2001 2002 2003 2004 2005 2006 2007 2008 2009 Total
Italy 2800 2778 3995 : 2883 6407 11641 5584 5041 3726 5274 7977 58106
Germany 0 0 .. 1873 1896 1605 1483 1453 1674 2063 1847 .. 13894
Greece 1105 .. .. .. .. .. .. .. 4843 2070 : .. 8018
Austria 800 701 663 640 820 828 805 809 506 589 492 .. 7653
United Kingdom 399 199 1749 515 248 216 1340 817 .. .. .. .. 5483
Netherlands 687 520 407 451 545 525 460 357 333 289 356 499 5429
Spain 48 67 172 257 232 283 404 560 494 477 593 415 4002
Sweden 68 89 66 104 120 97 122 117 242 212 230 314 1781
Cyprus 137 .. 123 206 63 113 269 57 46 71 98 .. 1183
France 608 227 .. .. .. .. .. .. .. .. .. .. 835

Denmark 66 66 61 71 58 52 51 56 45 58 47 69 700
Hungary 27 21 26 38 36 36 47 37 70 48 96 .. 482
Czech Republic .. 7 5 : 41 40 48 51 67 110 97 .. 466
Finland 21 10 10 25 14 27 22 40 49 50 50 67 385
Slovakia .. .. .. 1 3 13 16 20 20 23 37 .. 133
Poland .. .. .. .. .. .. .. .. 6 8 82 .. 96
Slovenia 2 0 1 1 4 3 4 10 4 2 12 13 56
Luxembourg 3 4 0 0 1 5 1 0 3 5 15 9 46
Lithuania 0 1 0 2 3 3 3 2 6 4 7 .. 31
Latvia 0 1 2 1 1 3 1 0 0 3 4 .. 16
Source: European Commission, Eurostat, Migration and Migrant Population Statistics, 2011. Available online at:
http://epp.eurostat.ec.europa.eu/statistics_explained/index.php/Migration_and_migrant_population_statistics
Related Documents


