Testing the Profitability of Technical Trading Rules across Market Cycles: Evidence from India S. Muruganandan a a Department of PG Studies in Commerce, Sri Dharmasthala Manjunatheshwara College, India Abstract This study examines the economic feasibility of technical analysis, such as relative strength index, moving average convergence and divergence in Indian context. Bombay Stock Exchange Sensex Index historical data were collected from BSE data base for the period from February, 2000 to May, 2018. The selected data were further categorised into Bull and Bear markets to test the technical tools performance across market cycle. The results exhibited that relative strength index trading rule failed to deliver the positive return even before deducting transaction cost. However, moving average convergence and divergence trading rules’ sell signal outperformed the unconditional mean return and buy signal mean return, during the Bear market period before deducting transaction cost. However, in accordance with the Sharpe ratio, returns generated were not at the level of risk associated in technical trading rules. The findings question the possibility for traders to consistently earn abnormal return with technical analysis. Keywords: Indian Stock Market, Market Cycle, Moving Average Convergence and Divergence, Relative Strength Index, Technical Analysis Received: 05 November 2019 Accepted revised version: 17 March 2020 Published: 30 June 2020 Suggested citation: Muruganandan, S. (2020). Testing the profitability of technical trading rules across market cycles: Evidence from India. Colombo Business Journal. 11(1), 24-46. DOI: http://doi.org/10.4038/cbj.v11i1.56 ©2020 The Authors. This work is licenced under a Creative Commons Attribution 4.0 International Licence which permits unrestricted use, distribution, and reproduction in any medium, provided the original work is properly cited. [email protected]: https://orcid.org/0000-0002-9239-3571 Faculty of Management & Finance University of Colombo Colombo Business Journal International Journal of Theory & Practice Vol. 11, No. 01, June, 2020

Welcome message from author
This document is posted to help you gain knowledge. Please leave a comment to let me know what you think about it! Share it to your friends and learn new things together.
Transcript

Testing the Profitability of Technical Trading Rules across Market
Cycles Evidence from India
S Muruganandana
aDepartment of PG Studies in Commerce Sri Dharmasthala Manjunatheshwara College
India
Abstract
This study examines the economic feasibility of technical analysis such as relative
strength index moving average convergence and divergence in Indian context Bombay
Stock Exchange Sensex Index historical data were collected from BSE data base for the
period from February 2000 to May 2018 The selected data were further categorised into
Bull and Bear markets to test the technical tools performance across market cycle The
results exhibited that relative strength index trading rule failed to deliver the positive return
even before deducting transaction cost However moving average convergence and
divergence trading rulesrsquo sell signal outperformed the unconditional mean return and buy
signal mean return during the Bear market period before deducting transaction cost
However in accordance with the Sharpe ratio returns generated were not at the level of risk
associated in technical trading rules The findings question the possibility for traders to
consistently earn abnormal return with technical analysis
Keywords Indian Stock Market Market Cycle Moving Average Convergence and
Divergence Relative Strength Index Technical Analysis
Received
05 November 2019
Accepted revised version
17 March 2020
Published
30 June 2020
Suggested citation Muruganandan S (2020) Testing the profitability of technical trading
rules across market cycles Evidence from India Colombo Business Journal 11(1) 24-46
DOI httpdoiorg104038cbjv11i156
copy2020 The Authors This work is licenced under a Creative Commons Attribution 40
International Licence which permits unrestricted use distribution and reproduction in any
medium provided the original work is properly cited
achieveranandgmailcom httpsorcidorg0000-0002-9239-3571
Faculty of
Management amp Finance
University of Colombo
Colombo
Business
Journal
International Journal of
Theory amp Practice
Vol 11 No 01 June 2020
Muruganandan
25
Introduction
In investment arena technical analysis is a separate discipline which attempt to
consistently earn abnormal returns by exploiting past price patterns and trading
volume of financial assets Hence technical analysts play a vital role in day-to-day
stock price movement and provide a higher degree of liquidity for equity investors
The notable pioneers who contributed significantly to the modern technical analysis
are the Japanese rice trader Homma Munehisa (candlestick charting) Charles Dow
(the founder of Wall Street Journal and Dow Theory) and Elliot (the developer of
the Elliot wave principle) (Metghalchi et al 2016) In the world of technical
analysis it is strongly believed that a stock price follows a trend and market
participants react in a similar way to the same event in the future This assumption
is valid in the application of technical analysis to predict the future price based on
historical price and volume data
In contrast Efficient Market Hypothesis (EMH) strongly argues that historical
price patterns and volume information are already incorporated in the current
security price The stock price movement depends on new piece of information
appearing in the market which is purely random Therefore the future price of the
security follows a random walk and it is almost impossible to be predicted at least in
weak-form efficient markets Hence in finance the acceptance of EMH and
technical trading rules is mutually exclusive (Fama 1970)
The preponderance of literature on technical trading tools and EMH in different
markets under different circumstance were contradictory to each other For example
studies like Chiang et al (2012) Chong and Ng (2008) Krausz et al (2009)
Metghalchi et al (2019) and Wong et al (2003) supported the technical analysis
whereas the results of Atanasova and Hudson (2010) Balsara et al (2009) and
Chang et al (2004) supported the efficient market hypothesis Hence even after
many decades of research academicians and investorstraders are still in confusion
whether to hire or fire technical analysis Specifically in a country like India
information is not a commodity for perfect competition due to lack of infrastructure
inefficient capital market regulators and domination of markets by few investors
ie only less than 3 of the total population investing in the Indian equity market
On the other hand significant information asymmetries may damage the overall
development and inclusive growth of capital markets Hence intervention of a
capital market supervisory body into this information asymmetry is highly solicited
in the absence of EMH Therefore research on profitability of technical analysis
with most recent data catch the attention of academicians investors and market
regulators to a larger extent
Colombo Business Journal 11(1) 2020
26
In this background the main objective of this study is to examine the
profitability of Relative Strength Index (RSI) and Moving Average Convergence
and Divergence (MACD) technical trading tools in the Indian stock market In
addition this research also aims to test the risk adjusted performance of selected
technical trading tools across market cycle
The remainder of this research article is organised as follows The next section
briefly highlights the outcome of earlier literature on technical analysis Following
that methodology used in this study is elaborated in data and methodology section
This is followed by results of data analysis explained in the result and discussion
section and conclusions are presented in the last section of the paper
Review of Literature
The existing research on profitability of trading rules and EMH exhibits mixed
results For instance Brock et al (1992) examined the profitability of moving
average for Dow Jones Index and favour technical trading rules whereas Hudson et
al (1996) applied moving average trading rules for United Kingdom (UK) data and
concluded that after deducting trading cost investors are not able to earn more
excess return than excess returns associated with buy-and-hold strategy Gencay
(1998) support the technical trading rules to predict the future stock price but have a
doubt on profitability of technical trading rules after deducting the trading cost
Ming-Ming et al (2002) applied moving average trading rules to predict the Kuala
Lumpur Stock Exchange Composite Index for the period of January 1997 to
December 1999 and found technical trading rules being able to generate abnormal
return even after deducting trading cost Jensen and Benington (1970) Neftccedili
(1991) and Allen and Karjalainen (1999) registered the evidence against technical
trading rules in making consistent abnormal return and accept the efficient market
hypothesis in the US market Balsara et al (2007) applied the moving average
crossover rule the channel breakout rule and Bollinger band trading rule to class A
and class B shares traded in Shanghai and Shenzhen stock exchanges and ended
with profit even after deducting the trading cost of 05 This is in stark contrast to
weak-form efficiency of the market Almujamed et al (2013) concluded that the
profitability of trading rules mainly comes from the slow adjustment to private
information when there is information asymmetry Zhu et al (2015) found that
Trading Rang Break rules outperform Moving Average (MA) rules and short-term
Variable Moving Average (VMA) rules outperform long-term VMA rules
However after deducting the trading cost profits from technical trading rules
disappeared in the Chinese market and this suggests that simple trading rules like
Muruganandan
27
Moving Average (MA) and Trading Range Breakout (TRB) cannot beat the
standard buy-and-hold strategy for the Chinese stock exchange indexes
Metghalchi et al (2016) examined the profitability of Moving Average (MA)
RSI and MACD technical trading rules for NASDAQ Composite index from 1972
to 2015 and concluded that trading rules have strong predictive power However
the predictability of trading rules reduced in the recent past sub-sample period from
2005 to 2015 and generated negative return after deducting transaction cost
Metghalchi et al (2019) examined the profitability of Technical Analysis (TA) for
the Morgan Stanly Capital International (MSCI) Emerging Market Index (EMI)
over the period of November 1988 to January 2018 They found strong empirical
evidence for TA even after considering risk and transaction cost using technical
tools like Moving Average RSI MACD and Rate of Change Chong and Ng (2008)
examine the strength of MACD and RSI using 60 years data of the London Stock
Exchange FT30 Index and concluded that trading rules generate higher return than
simple buy-and-hold strategy Atanasova and Hudson (2010) identified the
interaction between technical trading rules and calendar anomalies for Dow Jones
Index from 1897 to 2009 and concluded that the predictability of trading rule
reduced to a greater extent after removing the calendar anomalies
Krausz et al (2009) concluded that nullifying the profits from technical trading
rules is merely impossible as long as stock information is asymmetric Balsara et al
(2009) found that the moving average crossover rule the channel breakout rule and
the Bollinger band breakout rule underperform the buy-and-hold strategy between
1990 and 2007 However they observe significant positive returns on trades
generated by the contrarian version of these three technical trading rules even after
considering a 05 transaction costs on all trades Wong et al (2003) studied the
profitability of MACD and RSI technical indicators in Singapore stock market and
found that technical indicators offered significant positive returns
Marshall Young and Cahan (2008) concluded that candlestick technical trading
strategies for Japanese stock market failed to add value in both Bull or Bear
markets Wang and Chan (2007) empirical results indicate that the technical trading
rules correctly predict the direction of changes in the NASDAQ and Taiwan
Weighted Index (TWI) Nor and Wickremasinghe (2014) investigated the
profitability of MACD and RSI and concluded that Australian investors can make
consistent abnormal return with technical trading rules Chiang et al (2012) found
that the technical analysis helped to earn profits even after deducting transaction
Colombo Business Journal 11(1) 2020
28
costs in Taiwan Cohen and Cabiri (2015) employed DJI FTSE NK225 and TA100
index data for the period from 2007 to 2012 and found RSI and MACD
outperformed the indices in Bear market and delivered negative return during Bull
market
Anghel (2015) tested the profitability of Moving Average Convergence and
Divergence (MACD) with 1336 stocks of 75 countries with temporal data from 1st
of January 2001 to 31st of December 2012 The study found that certain companies
delivered risk adjusted abnormal return even after deducting trading cost and
rejected the random walk hypothesis for many countries Tian et al (2002) found
that technical trading rules have less power in the US stock market to earn profit
whereas the Chinese market gives profit even after deducting trading cost Chang et
al (2004) examined the power of simple Moving average trading rules in 11
emerging and developed markets (US and Japan) and suggested that emerging
equity indices exhibit the scope to earn abnormal return with technical trading rules
whereas developed countriesrsquo stock indices (US and Japan) do not reject the EMH
Sobreiro et al (2016) studied the profitability of MACD RSI and algorithm trading
rules in Brazil Russia India China and South Africa (BRICS) and emerging
markets and concluded that moving averages outperformed the buy-and-hold
strategy in most of the emerging markets except Brazil Russia and Argentina Yu et
al (2013) examined the profitability of technical trading rules in seven Asian
markets including Indonesia Malaysia Singapore The Philippines Thailand Hong
Kong and Japan Fixed and variable moving average and trading range breakout
rules were employed and concluded that technical trading tools were more powerful
in emerging markets than in developed markets However profits from technical
analysis disappeared after transaction costs Similarly Heng and Niblock (2014)
examined the predictive power of technical analysis for stock index futures of
Indonesia Malaysia Thailand and The Philippines They employed EMA and
MACD and found emerging markets were slowly reaching its informational
efficiency after considering the transaction cost In contrast Ming-Ming and Siok-
Hwa (2006) found that Fixed Moving Averages (FMAs) in China Thailand
Taiwan Malaysian Singaporean Hong Kong Korean and Indonesian stock
markets were profitable
From a contextual perspective research on profitability of technical trading
analyses is limited in the Indian context Sehgal and Gupta (2007) evaluated the
economic feasibility of technical analysis using individual stock data and found the
technical trading strategy failed to outperform the passive strategy irrespective of
Muruganandan
29
market cycle conditions They used the daily closing price and volume information
of 65 companies constituted in BSE 100 index for the period from January 1999 to
December 2004 They concluded that past price and volume information of large
size companies were immediately incorporated in current price as these stocks were
tracked by several investors and fund managers Gunasekarage and Power (2001)
applied variable length moving average and fixed length moving average in South
Asian stock markets and generated excess returns in Colombo Stock Exchange
(CSE) Dhaka Stock Exchange (DSE) and Karachi Stock Exchange (KSE) whereas
Bombay Stock Exchange (BSE) supported the EMH Sehgal and Garhyan (2002)
examined the On Balance Volume (OBV) technical analysis with transaction cost
using daily data of 21 companies listed in BSE for the period from April 1996 to
March 1998 The result supports the technical analysis and rejects the EMH Mitra
(2011) analysed the profitability of moving average in Indian stock index for the
period from 1998 to 2008 He predicted the direction of index movement using
moving average but failed to deliver positive return after transaction costs Kulkarni
and Mode (2014) and Khatua (2016) examined the MACDrsquos prediction ability of
individual stocks and supported the technical analysis However these studies
considered limited data with a small number of companies and ignored the risk
adjusted return in Indian context
Significant earlier studies support the EMH and reject the technical analysis in
developed markets at least in weak form (Allen amp Karjalainen 1999 Chang et al
2004 Hudson et al 1996 Gencay 1998 Neftci 1991 Tian et al 2002) On the
contrary studies in emerging markets concluded that technical analysts in emerging
markets were able to make profit than their counterparts in developed markets
(Balsara et al 2007 Chang et al 2004 Chiang et al 2012 Ming-Ming et al
2002 Metghalchi et al 2019 Ni et al 2020) This may be due to the inherent
characteristics of emerging markets such as weak competition inefficient legal
systems absence of strong supervising institutions less market participants and lack
of infrastructure for information dissemination On the other hand the most recent
studies question the profitability of technical trading rules in emerging markets after
considering transaction costs (Heng amp Niblock 2014 Sehga amp Gupta 2007
Tharavanji et al 2015 Yu et al 2013 Zhu et al 2015) Nazario et al (2017)
consolidated the outcome of 85 research papers in a scientific way and concluded
that a considerable number of research papers favour weak form of market
efficiency without considering the risk adjusted return However Marshall Cahan
and Cahan (2008) survey of market participants indicates that stock traders and
investors place more emphasis on technical analysis than fundamental factors
Colombo Business Journal 11(1) 2020
30
This existing discrepancy in literature demands research on emerging marketsrsquo
information efficiency in the recent past Further the ability of technical trading
rules to predict stock returns is inadequately researched in emerging markets
Hence this study attempts to analyse the profitability of technical trading rules in
economically dynamic and rapidly growing emerging markets such as India
Further the total study period was classified as Bull and Bear market and employed
risk adjusted performance measures like Sharpe ratio ratio of average profit to
average loss and percentage of profitable trade to have a microscopic view on the
performance of technical analysis in the Indian context
Data and Methodology
This empirical study covers the period from February 2000 to May 2018 and the
total study period is categorised into Bull and Bear market as per Lokeshwarri
(2017) which is shown in Table 1 and supported by Figure1
Table 1 Cyclical Bull and Bear Phases in Sensex
Start Date End Date Change in
percentage Category
Time in
Months
Feb ndash 2000 Sep ndash 2001 -5781 Bear ndash 1 19
Sep ndash 2001 May ndash 2003 1310 Sideway ndash 1 20
May ndash 2003 Jan ndash 2008 62263 Bull ndash 1 56
Jan ndash 2008 Mar ndash 2009 -6205 Bear ndash 2 13
Mar ndash 2009 Nov ndash 2010 16231 Bull ndash 2 20
Nov ndash 2010 Aug ndash 2013 -1734 Sideway ndash 2 33
Aug ndash 2013 Mar ndash 2015 7208 Bull ndash 3 19
Mar ndash 2015 Feb ndash 2016 -2508 Bear ndash 3 11
Feb ndash 2016 May ndash 2018 5560 Bull ndash 4 27
Source Lokeshwarri (2017)
The daily opening closing high and low values for BSE Sensex were extracted
from BSE data base The widely used trading rules such as Relative Strength Index
(RSI) and Moving Average Convergence and Divergence (MACD) are employed to
generate Buy Hold and Sell signals which are explained below
Figure 1 Bull and Bear Phases of BSE Sensex during the Study Period
112002112001112000
6000
4500
3000
112003112002
3500
3000
2500
112008112006112004
20000
1700015000
10000
5000
2000
112009712008112008
20000
15000
10000
112011112010112009
20000
15000
10000
112014112013112012112011
20000
17500
15000
112015112014
30000
25000
20000
112016912015512015112015
30000
27500
25000
112018112017112016
35000
30000
25000
Bear 1 Sideway 1 Bull 1
Bear 2 Bull 2 Sideway 2
Bull 3 Bear 3 Bull 4
Mu
rug
an
and
an
31
Colombo Business Journal 11(1) 2020
32
Relative Strength Index (RSI)
RSI is a technical indicator which used to identify the overbought and oversold
condition of financial securities First relative strength is calculated by dividing the
simple average of closing values on up days by the average of closing values on
down days over a given period of time which is 14 days in this study The step-by-
step trading decision based on RSI is demonstrated as follows
Steps in generating Buy Hold and Sell Signals
1 Input Closing (119862119905) and Opening (119874119905) value of the Index on day t
2 Up Days (119880119905) 119862119905 119894119891 (119862119905 minus 119862119905minus1) gt 0 119890119897119904119890 0
3 Down Days (119863119905) 119862119905 119894119891 (119862119905 minus 119862119905minus1) lt 0 119890119897119904119890 0
4 Relative Strength (119877119878)
119877119878119905 =
sum 119880119905 119894=119905minus(119899minus1)119894=119905
119899
sum 119863119905 119894=119905minus(119899minus1)119894=119905
119899
5 Relative Strength Index (119877119878119868119905)
119877119878119868119905 = 100 minus (100
1 + 119877119878119905)
6 Trading Decision1 119861119906119910 119874119905+1
119894119891119877119878119868119905 gt 30 amp 119877119878119868119905minus1 le 30
Else
119878119886119897119890 119874119905+1
119894119891 119877119878119868119905 gt 70 amp 119877119878119868119905minus1 le 70
Or
Hold
7 Output Calculation of Return
119894119891 119887119906119910 119874119905+1 =
(119897119900119892(119862119905+1) minus 119897119900119892(119874119905+1))
119894119891 119878119886119897119890 119874119905+1 =
(119897119900119892(119874119905+1) minus 119897119900119892(119862119905+1))
1 The trading rules were applied as per Welles (1978) Henderson (2002) and Rosillo et al
(2013) Unlike previous studies in order to imitate the real time stock trading scenario
opening and closing values were considered for executing the trading signals and calculation
of return
Muruganandan
33
Moving Average Convergence and Divergence (MACD)
MACD is constructed based on historical exponential moving average of
closing value of index to identify the trend changes in its value It is computed
based on the difference between longer exponential moving averages (26 days)
from a shorter exponential moving average (12 days) In addition nine days simple
moving average of MACD is used as a sign to generate buy and sell signals Step-
by-step trading decision is presented as follows
Steps in generating Buy Hold and Sell Signals
1 Input Closing (119862119905) and Opening (119874119905) value of the Index on day t
2 Exponential Moving Average
119899 = 12 119886119899119889 26 119889119886119910119904 119891119900119903 119904ℎ119900119903119905 119886119899119889 119897119900119899119892 119864119872119860 119903119890119904119901119890119888119905119894119907119890119897119910
119864119872119860119905(119899) = sum (2
1+119899)
119894=119905minus(119899minus1)119894=119905 times 119862119905 + (1 minus
2
1+119899) times 119864119872119860119905minus1(119899)
3 119872119860119862119863 119864119872119860119905(119878ℎ119900119903119905119890119903) minus 119864119872119860119905(119871119900119899119892119890119903)
4 Signal Line 119878119894119892119899119905 = 1198781198721198609(119872119860119862119863)
5 Trading Decision2 119861119906119910 119874119905+1
119894119891119872119860119862119863119905 lt 0 119878119894119892119899119905 lt 0 amp 119878119894119892119899119905 gt 119872119860119862119863119905
Else
119878119886119897119890 119874119905+1
119894119891119872119860119862119863119905 gt 0 119878119894119892119899119905 gt 0 amp 119878119894119892119899119905 lt 119872119860119862119863119905
Or
Hold
6 Output Calculation of Return
119894119891 119887119906119910 119874119905+1 =
(119897119900119892(119862119905+1) minus 119897119900119892(119874119905+1))
119894119891 119878119886119897119890 119874119905+1 =
(119897119900119892(119874119905+1) minus 119897119900119892(119862119905+1))
Further the following hypotheses were framed to test whether returns of buy or
sell signals are different from the unconditional mean return and also whether the
mean buy signal return is different from mean sell signal return The null and
alternative hypotheses of the study are stated in Table 2
2 The trading rules were applied as per Rosillo et al (2013) Unlike previous studies in
order to imitate the real time stock trading scenario opening and closing values were
considered for executing the trading signals and calculation of return
Colombo Business Journal 11(1) 2020
34
Table2 Hypotheses of the Study
Buy-Unconditional
Return
Sell-Unconditional
Return
Buy ndash Sell
Return
Ho 120583119861 minus 120583119880 = 0 120583119878 minus 120583119880 = 0 120583119861 minus 120583119878 = 0
Ha 120583119861 minus 120583119880 ne 0 120583119878 minus 120583119880 ne 0 120583119861 minus 120583119878 ne 0
After the formulation of hypotheses t-statistics were used to test the null
hypothesis of equality between unconditional mean return (120583) and mean return of
trading rules (120583119903) which is specified in Equation 1
119905119903 = 120583119887119906119910 (119904119890119897119897)minus120583
radic120590119887119906119910( 119904119890119897119897)
2
119873119887119906119910(119904119890119897119897)+
1205902
119873
(1)
where 120583119887119906119910 (119904119890119897119897) is the mean technical trading return of buy or sell 119873119887119906119910(119904119890119897119897) is the
number of trades for the buy or sell signal 120583 and N are the unconditional mean
return and number of observations respectively and 1205902 is the estimated sample
variance In testing long-short strategies (buy-sell) t-statistics is computed as
follows
119905119887119906119910minus119904119890119897119897 = 120583119887119906119910minus120583119904119890119897119897
radic120590119861119906119910
2
119873119861119906119910+
1205901198781198901198971198972
119873119878119890119897119897
(2)
where 120583119887119906119910 and 120583119904119890119897119897 are the mean returns of buy signal and sell signals 120590119861119906119910 and
120590119878119890119897119897 are the estimated sample standard deviations of buy and sell signals
respectively 119873119861119906119910 and 119873119878119890119897119897 are the number of buy and sell signals respectively
Performance Measures
Sharpe Ratio
Reward to total risk is calculated using Sharpe Ratio which measures the
expected return to per unit of total risk taken In the perspective of trading the
standard Sharpe ratio is modified by excluding the risk free rate by assuming that
the trader needs to maintain the liquidity and not investing in risk free rate Hence
Sharpe ratio is calculated as per Equation 3
119878ℎ119886119903119901119890 119877119886119905119894119900 (119878119877) =
120590119877 (3)
Muruganandan
35
where and 120590119877 are respectively the expected return and the total risk of a trading
rule in a given period Higher the ratio superior the performance indicated by it
Ratio of Average Profit to Average Loss (APAL)
This ratio is calculated by dividing the average profit from profitable trade by
average loss from the unprofitable trade The ratio of more than one indicates on
average the trading system correctly predicts the price movement than misleading
the traders Hence a higher ratio indicates the superior ability of the technical
trading rules to predict the future price movement The absolute value of this ratio is
calculated as per Equation 4
119860119875
119860119871= |
119860119907119890119903119886119892119890 119875119903119900119891119894119905
119860119907119890119903119886119892119890 119897119900119904119904| (4)
Percentage of Profitable Trade ( of PT)
This ratio indicates the proportion of profitable trade to total trade signal High
percentage indicates that the trading system identifies price change more accurately
This ratio considers the number of profitable trade to total trading signals and
ignores the value of profit (loss) earned (incurred) This performance metric is
calculated as per Equation 5
119900119891 119875119879 = 119873119906119898119887119890119903 119900119891 119875119903119900119891119894119905119886119887119897119890 119879119903119886119889119894119899119892
119879119900119905119886119897 119873119906119898119887119890119903 119900119891 119879119903119886119889119894119899119892 119904119894119892119899119886119897119904 (5)
Results and Discussion
The summary statistics for the unconditional intraday return for the entire
sample period and the nine non-overlapping sub-periods are presented in Table 3
The intraday mean returns for the entire sample period and for the sub-periods are
negative except for the period Bull-2 Bear-2 period exhibits the highest standard
deviation of 001009 Both highest (0030) and lowest (-0047) daily return for the
entire study period recorded in Bull-1 period The high value of Kurtosis indicates
that the intraday return of BSE Sensex is not normally distributed and there are
outliers However when the market is moving in the Sideway the intraday returns
become more or less normally distributed as evidenced from the low Kurtosis The
evidence of excessive Kurtosis in Bull period indicates that the unconditional
intraday returns were leptokurtic with thicker tails than the Bear and Sideway
markets Hence the variance during Bull periods results from the outliers The
Colombo Business Journal 11(1) 2020
36
negative skewness indicates that the unconditional daily returns were moderately
negatively skewed except for Sideway-1
Table 3 Descriptive Statistics for Unconditional Intraday Return
Cycle Mean Standard
deviation Kurtosis Skew Min Max Count
Overall -000041 000576 48482 -0531 -0047 0030 4545
Bear ndash 1 -000119 000855 12148 -0286 -0035 0026 437
Sideway ndash 1 -000042 000451 06693 0028 -0018 0015 411
Bull ndash 1 -000015 000605 5415 -0785 -0047 0030 1165
Bear ndash 2 -000093 001009 09469 -0359 -0038 0024 280
Bull ndash 2 000025 000583 22848 0049 -0028 0025 411
Sideway ndash 2 -000049 000423 0568 -0217 -0016 0011 679
Bull ndash 3 -000032 000349 22438 -0127 -0018 0012 381
Bear ndash 3 -000098 000406 09085 -0630 -0016 0009 225
Bull ndash 4 -000028 000279 3073 0332 -0009 0016 556
Note Unconditional intraday return defined as the log difference of closing value to opening value by
assuming that the trader buys at the opening value and sells at the closing value
The result of RSI trading rule for BSE Sensex is presented in Table 4 The first
two columns exhibit the number of buy (119873119861) and sell (119873119878) signals generated using
RSI trading rules for the overall period and non-overlapping sub-sample periods
Third and fourth column show the average buy (120583119861) and sell (120583119878) returns along
with t-test in parenthesis The basic assumption of t-test is that the observations are
normally distributed However Table 1 reveals that the returns were not normally
distributed which may question the validity of t-test results and its interpretations In
order to overcome this phenomenon Brock et al (1992) suggested the bootstrap
method developed by Efron (1979) Hence this paper employs the bootstrap
method adopted by McKenzie (2007) which mimics the procedure followed by
Brock et al (1992) Bootstrap process was repeated for 500 times and the resultant t
values and corresponding p values are reported in parentheses and square brackets
respectively However the acceptance and rejection of hypothesis were similar both
in bootstrap p values and t-test In addition standard deviation of buy and sell
signals and the mean difference between buy and sell signals are also presented in
the column five six and seven respectively
Muruganandan
37
Table 4 Statistical Results for RSI Trading Rule
Category NB NS microB microS σB σS microB - microS
Overall 116 178
-000065
(-0352)
[0739]
000003
(1308)
[0232]
000729 000434
-000068
(-0905)
[0367]
Bear ndash 1 15 13
-000002
(0489)
[0645]
00025
(2150)
[0066]
000908 000601
-000252
(-0876)
[0401]
Sideway ndash 1 14 16
-000051
(-0084)
[0946]
000065
(0859)
[0419]
000406 00049
-000116
(-0711)
[0499]
Bull ndash 1 15 54
-000199
(-0801)
[0445]
-00009
(-1273)
[0186]
000892 000414
-00011
(-0464)
[0617]
Bear ndash 2 17 7
000031
(0439)
[0661]
00009
(0488)
[0631]
001134 000979
-000059
(-0128)
[0876]
Bull ndash 2 5 21
000486
(1624)
[0076]
-000039
(-0601)
[0599]
00063 000474
000525
(1749)
[0071]
Sideway ndash 2 26 19
-000165
(-0969)
[0325]
-000009
(0831)
[0411]
0006 000205
-000156
(-1231)
[0246]
Bull ndash 3 4 16
-000121
(-0949)
[0355]
-000037
(-0063)
[0952]
000184 000294
-000084
(-0713)
[0476]
Bear ndash 3 13 5
-000149
(0415)
[0681]
000214
(1296)
[0124]
000373 000279
-00036
(-1357)
[0185]
Bull ndash 4 7 27
00000032
(0334)
[0729]
000037
(1533)
[0162]
000218 000208
-000037
(-0395)
[0691]
Notes 1 NB and NS denote the number of buy and sell signals during the period respectively microB and
microS denote the average return of buy and sell signals respectively σB and σS denote the
standard deviation of buy and sell signal returns respectively
2 Numbers in parentheses are t values and numbers in square brackets are the bootstrap p
values
Colombo Business Journal 11(1) 2020
38
RSI generates more sell signals than buy signals during the Bull market On the
contrary during the Bear and Sideway market RSI produced higher number of buy
signals than sell signals Since RSI has the upper band of 100 if the stock price goes
up continuously RSI remains in the overbought regime and produce more number
of sell signals than buy signals In this case a trader shorting the opportunity based
on RSI sell signals may not make profit as the price will move to the differentother
orbit On the other hand if the stock price goes down continuously the RSI
generates more number of buy signals than the sell signals as opposed to the current
price movement Hence the application of RSI during the long Bull and Bear
markets may not help the trader to make profit even before adjusting the transaction
cost From the result of t-test and bootstrap p values it can be concluded that buy
and sell signals does not reject the null hypothesis that the mean return of buy or sell
signals is not significantly different from the unconditional mean return Moreover
averages of buy signal returns and sell signal returns are not significantly different
from each other These results provide evidence of the existence of weak form
efficiency across the market cycle Hence it can be concluded that traders cannot
outperform the market using the RSI signals during the upward or downward
movement of the market
Table 5 Performance of RSI Trading Signal
Category
Buy Signal Performance Sell Signal Performance
SR APAL of
PT SR APAL
of
PT
Overall -00892 1007 4397 00069 10669 4888
Bear ndash 1 -00022 1489 4000 04160 14933 6923
Sideway ndash 1 -01256 0529 5714 01327 13950 5000
Bull ndash 1 -02242 0896 4000 -02174 10832 3519
Bear ndash 2 00273 1203 4706 00919 09491 5714
Bull ndash 2 07714 1766 8000 -00823 07273 5238
Sideway ndash 2 -02750 0781 3846 -00439 09970 4737
Bull ndash 3 -06576 0298 2500 -01259 07136 5000
Bear ndash 3 -02601 0742 4000 02294 13570 5938
Bull ndash 4 00014 1338 4286 01779 10837 5926
Note SR denotes the Sharpe Ratio APAL denotes the ratio of average profit to average loss
of PT denotes the percentage of profitable trade to total trading signal
Muruganandan
39
Table 5 exhibits the results of Sharpe Ratio (SR) average profit to average loss
ratio (APAL) and percentage of profitable trade to total trading signals For the
overall study period and almost all sub-samples periods buy signal underperforms
the sell signal as per the modified Sharpe ratio The absolute value of average profit
to average loss more than one indicates that the average of profitable trade is more
than the average of unprofitable trade However percentage of profitable trade less
than 50 indicates that RSI generate a higher number of unprofitable trades than
profitable trade Hence average return on buy signal is negative for the overall
study period and for six out of nine sub-sample periods On the other hand RSI sell
signal generated the positive Sharpe ratio for overall period and five out of nine sub-
sample periods Profitable trade to total trade signal indicates sell signal produced
more profitable trade in all sub-sample period except Bull-1 and Sidway-1 market
Though percentage of profitable trade to total trade for overall period is less than
50 (ie 4888) which indicate that the number of unprofitable trades is higher
than the profitable trades the profit per profitable trade is sufficiently enough to
compensate the loss in unprofitable trade The sell signal trading strategy makes
money not only from correctly predicting the market movement but also minimising
the loss quickly and allows the profit to run
The Table 6 exhibits the statistical results for the MACD trading rules During
the study period MACD generated 1522 sell signals and 858 buy signals with the
average return of 000861 and -000128 respectively The standard deviations of buy
signal returns (00179) and sell signal returns (001068) are also presented along
with mean return difference between buy and sell signals (-00021) Buy signal
produced the average negative return for all the sub-sample periods and they were
also not significantly different from the average unconditional mean return Hence
the null hypothesis was accepted and it can be concluded that buy signal produced a
return similar to that of unconditional intraday return However the sell signal
generated positive average return for the overall period and all sub-sample periods
except Bull-2 period In contrast the sell signal returns were significantly different
for the overall period and five out of nine sub-sample periods
Table 6 Statistical Results for MACD Trading Rule
Category NB NS microB microS σB σS microB -microS
Overall 858 1522
-000128
(-142)
[0170]
0000861
(443)
[0002]
0017908 0010686
-000215
(-3203)
[0008]
Colombo Business Journal 11(1) 2020
40
Category NB NS microB microS σB σS microB -microS
Bear ndash 1 141 59
-000021
(0494)
[0631]
0006379
(317)
[0002]
0023008 0018028
-000659
(-2165)
[0036]
Sideway ndash 1 131 71
-000226
(-1524)
[0142]
0000543
(0623)
[0509]
0013614 001285
-000281
(-1452)
[0162]
Bull ndash 1 85 581
-000004
(0043)
[0962]
0000196
(0703)
[0483]
0023623 0011
-000023
(-0090)
[0908]
Bear ndash 2 109 33
-000350
(-0989)
[0337]
0004699
(231)
[0036]
0026444 0013532
-00082
(-2371)
[002]
Bull ndash 2 39 192
-000031
(-0224)
[0816]
-000085
(-1066)
[0311]
0015615 0013721
0000532
(0198)
[0838]
Sideway ndash 2 166 171
-000035
(0171)
[0852]
000195
(375)
[0002]
0011182 0008263
-00023
(-2141)
[0032]
Bull ndash 3 32 165
-000171
(-0514)
[0591]
0000902
(220)
[0028]
0015215 0006737
-000261
(-0952)
[0291]
Bear ndash 3 88 25
-000146
(-0457)
[0643]
0004442
(341)
[0002]
0009516 0007832
-000591
(-3164)
[0004]
Bull ndash 4 67 225
-000205
(-1306)
[0188]
0000871
(2905)
[0008]
0011064 0005643
-000292
(-2080)
[004]
Notes 1 NB and NS denote the number of buy and sell signals during the period respectively microB
and microS denote the average return of buy and sell signals respectively σB and σS denote the
standard deviation of buy and sell signal returns respectively
2 Numbers in parenthesis are t-values and numbers in square brackets are the bootstrap p
values
3 denotes p lt 05
The risk measured by standard deviation is higher in buy signal than sell signal
trading rules for the entire study period and for all the sub-sample periods This
clearly indicates that the trading on buy signal is riskier than the sell signal
Moreover the sell signal average returns were significantly different from the
Muruganandan
41
average buy signal returns in all the Bear market periods and for the overall study
period This result supports the sell signal over buy signal specifically during the
Bear market phases This result sharply contradicts to Tharavanij et al (2015) who
found buy signals outperform the sell signals in Southeast Asian markets
Sharpe ratio average profit to average loss ratio and percentage of profitable
trade to total trade signal for MACD trading rule are presented in Table 7 For the
buy signals percentage of profitable trade to total trade has more than 50 in four
out of nine sub-sample periods but average profit to average loss is less than one
which implies that the profit from correctly predicting market direction is not
sufficient enough to cut down the loss from the failure to predict market direction
Hence Sharpe ratios for all sub-sample periods and the entire study period were
negative However the sell signals correctly predict the market with highest
percentage of profitable trade to total trade of 80 in Bear-3 period Moreover
with less ability to predict market direction in Sideway-1 (4789) and Bull-1
(4905) periods sell signal generated profit to cut down the loss from unprofitable
trade which results in average profit to average loss ratio of more than one for
Sideway-1 (122) and Bull-1 (109) period Overall the result supports the sell
signals over buy signals before considering the transaction costs in the Indian
context
Table 7 Performance of MACD Trading Signal
Category
Buy Signal Performance Sell Signal Performance
SR APAL of
PT SR APAL
of
PT
Overall -0072 0897 47669 008 106 5414
Bear ndash 1 -0009 1110 46809 035 219 5763
Sideway ndash 1 -0166 0701 47328 004 122 4789
Bull ndash 1 -0002 0805 55294 002 109 4905
Bear ndash 2 -0133 0940 43119 035 115 6667
Bull ndash 2 -0020 0734 56410 -006 084 5000
Sideway ndash 2 -0031 1122 45181 024 108 6374
Bull ndash 3 -0112 0563 56250 013 100 5879
Bear ndash 3 -0154 0682 50000 057 108 8000
Bull ndash 4 -0185 0827 41791 015 116 5644
Note SR denotes the Sharpe Ratio APAL denotes the ratio of average profit to average loss
of PT denotes the percentage of profitable trade to total trading signal
Colombo Business Journal 11(1) 2020
42
Conclusion
This paper examines the profitability of RSI and MACD technical trading rules
in the Indian market across market cycles BSE Sensex data for the period from
February 2000 to May 2018 were collected from BSE data base and classified into
nine non-overlapping periods as Bull and Bear markets based on the index
movement The t-tests were applied to test the hypothesis that returns from technical
trading rules were not significantly different from the unconditional daily returns In
addition Sharpe ratio average profit to average loss ratio and percentage of
profitable trade to total trade signal were also employed to have a microscopic view
on technical trading rules
Results support the weak-form efficient theory as RSI failed to deliver the
positive returns even before deducting the transaction costs RSI buy and sell signal
returns were not significantly different from the unconditional intraday return In
terms of market timing RSI wrongly predict the market movement and delivered
the percentage of profitable trade to total trade less than 50 Moreover profitable
trades were insufficient to overcome the loss from unprofitable trade Hence buy
signal generated a negative average return and sell signal posted a low positive
average return before deducting transaction costs Therefore after deducting
transaction costs RSI may not leave any profit in the hands of traders
MACD sell signal produced significant positive returns compared to buy signal
and unconditional intraday return However as per Sharpe ratio MACD sell signal
failed to produce the return in line with risk taken Sharpe ratio of less than one
indicates that risk associated with the technical trading rule is more than the return
generated by RSI and MACD In addition even profitable MACD sell signal does
not help in market timing It makes money from higher average profit from
profitable trade than average loss from unprofitable trade However MACD does
not help to reduce the unprofitable trade Hence the study concludes that the trader
cannot earn abnormal return consistently with the help of RSI and MACD across
market cycle in the Indian context RSI and MACD are very old and yet still widely
used as technical tools in real time stock price prediction On the other hand latest
development in information technology and changes in legal systems may have
helped the market to absorb RSI and MACD signals in current price with no time
and cost However in order to empirically validate this assumption a future study
may be extended using a proxy for information technology development and its
impact on trading rules across industries and individual stocks in emerging markets
Muruganandan
43
Declaration of Conflict of Interest
The author declared no potential conflict of interest with respect to the research
authorship and publication of this article
Acknowledgement
I would like to thank anonymous reviewers for their valuable suggestions
References
Allen F amp Karjalainen R (1999) Using genetic algorithms to find technical
trading rules Journal of Financial Economics 51(2) 245ndash271
httpsdoiorg101016S0304-405X(98)00052-X
Almujamed H I Fifield S amp Power D (2013) An investigation of the role of
technical analysis in Kuwait Qualitative Research in Financial Markets 5(1)
43ndash64 httpsdoiorg10110817554171311308959
Anghel G D I (2015) Stock market efficiency and the MACD Evidence from
countries around the world Procedia Economics and Finance 32 1414ndash1431
httpsdoiorg101016S2212-5671(15)01518-X
Atanasova C V amp Hudson R S (2010) Technical trading rules and calendar
anomalies mdash Are they the same phenomena Economics Letters 106(2) 128ndash
130 httpsdoiorg101016jeconlet200911001
Balsara N J Chen G amp Zheng L (2007) The Chinese stock market An
examination of the random walk model and technical trading rules Quarterly
Journal of Business amp Economics 46(2) 43ndash63 httpswwwjstororgstable
40473435
Balsara N Chen J amp Zheng L (2009) Profiting from a contrarian application of
technical trading rules in the US stock market Journal of Asset Management
10(2) 97ndash123 httpsdoiorg101057jam200844
Brock W Lakonishok J amp LeBaron B (1992) Simple technical trading rules
and stochastic properties of stock returns The Journal of Finance 47(5) 1731ndash
1764 httpsdoiorg101111j1540-62611992tb04681x
Chang E J Lima E J A amp Tabak B M (2004) Testing for predictability in
emerging equity markets Emerging Markets Review 5(3) 295ndash316
httpsdoi101016jememar200403005
Chiang Y-C Ke M-C Liao T L amp Wang C D (2012) Are technical trading
strategies still profitable - Evidence from the Taiwan Stock Index Futures
Market Applied Financial Economics 22(12) 955ndash965 httpsdoiorg
101080096031072011631893
Chong T T-L amp Ng W-K (2008) Technical analysis and the London stock
exchange Testing the MACD and RSI rules using the FT30 Applied
Colombo Business Journal 11(1) 2020
44
Economics Letters 15(14) 1111ndash1114 httpsdoiorg10108013504850600
993598
Cohen G amp Cabiri E (2015) Can technical oscillators outperform the buy and
hold strategy Applied Economics 47(30) 3189ndash3197 httpsdoiorg101080
0003684620151013609
Efron B (1979) Bootstrap methods Another look at the Jackknife The Annals of
Statistics 7(1)1ndash26 httpsprojecteuclidorgeuclidaos 1176344552
Fama (1970) Efficient capital markets a review of theory and empirical work
Journal of Finance 25(2) 383-417 httpswwwjstororgstable2325486
Gencay R (1998) The predictability of security returns with simple technical
trading rules Journal of Empirical Finance 5(4) 347ndash359 httpsdoiorg
101016S0927-5398(97)00022-4
Gunasekarage A amp Power D M (2001) The profitability of moving average
trading rules in South Asian stock markets Emerging Markets Review 2(1)
17ndash33 httpsdoiorg101016S1566-0141(00)00017-0
Henderson C (2002) Currency strategy The practitionerrsquos guide to currency
investing hedging and forecasting John Willy amp Sons
Heng P amp Niblock S J (2014) Trading with tigers A technical analysis of
Southeast Asian stock index futures International Economic Journal 28(4)
679ndash692 httpsdoiorg101080101687372014928895
Hudson R Dempsey M amp Keasey K (1996) A note on weak form efficiency of
capital markets The application of simple technical trading rules to UK stock
prices- 1935-1994 Journal of Banking and Finance 20(6) 1121ndash1132
httpsdoiorg1010160378-4266(95)00043-7
Jensen M C amp Benington G A (1970) Random walk and technical theories
Some additional evidence Journal of Finance 25 469ndash482
httpswwwjstororgstable2325495
Krausz J Lee S-Y amp Nam K (2009) Profitability of nonlinear dynamics
under technical trading rules Evidence from Pacific basin stock markets
Emerging Markets Finance amp Trade 45(4) 13ndash35 httpsdoiorg102753
REE1540-496X450402
Khatua A (2016) An application of moving average convergence and divergence
(MACD) indicator on selected stocks listed on National Stock Exchange (NSE)
httpdxdoiorg102139ssrn2872665
Kulkarni A D amp More A (2014) An application of moving average convergence
divergence (MACD) indicator on selected stocks listed on Bombay Stock
Exchange (BSE) Oriental Journal of Computer Science and Technology 7(3)
396ndash400 httpwwwcomputerscijournalorgp=1500
Lokeshwarri S K (2017 April 07) The big story ndash Sit back go passive The Hindu
Business Line (Coimbatore Edition) p 2
Muruganandan
45
Marshall B R Cahan R H amp Cahan J M (2008) Does intraday technical
analysis in the US equity market have value Journal of Empirical Finance
15(2) 199ndash210 httpsdoiorg101016jjempfin200605003
Marshall B R Young M R amp Cahan R (2008) Are candlestick technical
trading strategies profitable in the Japanese equity market Review of
Quantitative Finance and Accounting 31(2) 191ndash207 httpsdoiorg101007
s11156-007-0068-1
Metghalchi M Chen C-P Hajilee M (2016) Moving average trading rules for
NASDAQ composite index Applied Finance Letters 5(2) 45ndash57
httpsdoiorg1024135aflv5i254
Metghalchi M amp Hayes L A Niroomand F (2019) A technical approach to
equity investing in emerging markets Review of Financial Economics 37(3)
389ndash403 httpsdoiorg101002rfe1041
McKenzie M D (2007) Technical trading rules in emerging market and the 1997
Asian currency crises Emerging Market Finance and Trade 43(4) 46ndash73
httpsdoiorg102753REE1540-496X430403
Ming-Ming L Balachandher K G amp Nor F M (2002) An examination of the
random walk model and technical trading rules in the Malaysian stock market
Quarterly Journal of Business amp Economics 41(1) 81ndash104
httpswwwjstororgstable40473346
Ming-Ming L amp Siok-Hwa L (2006) The profitability of the simple moving
averages and trading range breakout in the Asian stock markets Journal of
Asian Economics 17(1) 144ndash170 httpsdoiorg101016jasieco200512001
Mitra S K (2011) How rewarding is technical analysis in Indian stock market
Quantitative Finance 11(2) 287ndash297 httpsdoiorg101080
14697680903493581
Nazario R T F Silva J L amp Sobrero V A (2017) A literature review of
technical analysis on stock markets The Quarterly Review of Economics and
Finance 66 115ndash126 httpsdoiorg101016jqref201701014
Neftccedili S N (1991) Naiumlve trading rules in financial markets and Wiener-
Kolmogorov prediction theory A study of ldquotechnical analysisrdquo Journal of
Business 64(4) 549ndash571
Ni Y Day M-Y Huang P ampYu S-R (2020) The profitability of Bollinger
Bamps Evidence from the constituent stocks of Taiwan 50 Physica A Statistical
Mechanics and Its Applications Advance online publication httpsdoiorg
101016jphysa2020124144
Nor S M amp Wickremasinghe G (2014) The profitability of MACD and RSI
trading rules in the Australian stock market Investment Management and
Financial Innovation 11(4) 194ndash199
Colombo Business Journal 11(1) 2020
46
Rosillo R de La Fuente D amp Brugos J A L (2013) Technical analysis and the
Spanish stock market Testing the RSI and MACD momentum and stochastic
rule using Spanish market companies Applied Economics 45(12) 1541ndash1550
httpsdoiorg101080000368462011631894
Sehgal S amp Garhyan A (2002) Abnormal returns using technical returns The
Indian experience Finance India 16(1) 181ndash203
Sehgal S amp Gupta M (2007) Tests of technical analysis in India Vision The
Journal of Business Perspective 11(3) 11ndash23 httpsdoiorg101177
097226290701100303
Sobreiro V A da Costa T R C C Nazaacuterio R T F e Silva J L Moreira E
A Filho M C L Kimura H amp Zambrano J C A (2016) The profitability
of moving average trading rules in BRICS and emerging stock markets North
American Journal of Economics and Finance 38 86ndash101 httpsdoiorg
101016jnajef201608003
Tian G G Wan G H amp Guo M (2002) Market efficiency and the returns to
simple technical trading rules New evidence from US equity market and
Chinese equity markets Asia-Pacific Financial Markets 9(3) 241ndash258
httpsdoiorg101023A1024181515265
Tharavanij P Siraprapasiri V amp Rajchamaha K (2015) Performance of
technical trading rules Evidence from Southeast Asian Stock Market
Springerplus 4552 httpsdoiorg101186s40064-015-1334-7
Wang J-L amp Chan S-H (2007) Stock market trading rule discovery using
pattern recognition and technical analysis Expert Systems with Applications
33(2) 304ndash315 httpsdoiorg101016jeswa200605002
Welles J Jr (1978) New concepts in technical trading systems Hunter Publishing
Company
Wong W-K Manzur M amp Chew B-K (2003) How rewarding is technical
analysis Evidence from Singapore stock market Journal of Applied Financial
Economics 13(7) 543ndash551 httpsdoiorg1010800960310022000020906
Yu H Nartea G V Gan C amp Yao L J (2013) Predictive ability and
profitability of simple technical trading rules Recent evidence from Southeast
Asian stock markets International Review of Economics and Finance 25 356ndash
371 httpsdoiorg101016jiref201207016
Zhu H Jiang Z-Q Li S-P amp Zhou W-X (2015) Profitability of simple
technical trading rules of Chinese stock exchange indexes Physica A
Statistical Mechanics and Its Applications 439 75ndash84 httpsdoiorg101016
jphysa201507032

Muruganandan
25
Introduction
In investment arena technical analysis is a separate discipline which attempt to
consistently earn abnormal returns by exploiting past price patterns and trading
volume of financial assets Hence technical analysts play a vital role in day-to-day
stock price movement and provide a higher degree of liquidity for equity investors
The notable pioneers who contributed significantly to the modern technical analysis
are the Japanese rice trader Homma Munehisa (candlestick charting) Charles Dow
(the founder of Wall Street Journal and Dow Theory) and Elliot (the developer of
the Elliot wave principle) (Metghalchi et al 2016) In the world of technical
analysis it is strongly believed that a stock price follows a trend and market
participants react in a similar way to the same event in the future This assumption
is valid in the application of technical analysis to predict the future price based on
historical price and volume data
In contrast Efficient Market Hypothesis (EMH) strongly argues that historical
price patterns and volume information are already incorporated in the current
security price The stock price movement depends on new piece of information
appearing in the market which is purely random Therefore the future price of the
security follows a random walk and it is almost impossible to be predicted at least in
weak-form efficient markets Hence in finance the acceptance of EMH and
technical trading rules is mutually exclusive (Fama 1970)
The preponderance of literature on technical trading tools and EMH in different
markets under different circumstance were contradictory to each other For example
studies like Chiang et al (2012) Chong and Ng (2008) Krausz et al (2009)
Metghalchi et al (2019) and Wong et al (2003) supported the technical analysis
whereas the results of Atanasova and Hudson (2010) Balsara et al (2009) and
Chang et al (2004) supported the efficient market hypothesis Hence even after
many decades of research academicians and investorstraders are still in confusion
whether to hire or fire technical analysis Specifically in a country like India
information is not a commodity for perfect competition due to lack of infrastructure
inefficient capital market regulators and domination of markets by few investors
ie only less than 3 of the total population investing in the Indian equity market
On the other hand significant information asymmetries may damage the overall
development and inclusive growth of capital markets Hence intervention of a
capital market supervisory body into this information asymmetry is highly solicited
in the absence of EMH Therefore research on profitability of technical analysis
with most recent data catch the attention of academicians investors and market
regulators to a larger extent
Colombo Business Journal 11(1) 2020
26
In this background the main objective of this study is to examine the
profitability of Relative Strength Index (RSI) and Moving Average Convergence
and Divergence (MACD) technical trading tools in the Indian stock market In
addition this research also aims to test the risk adjusted performance of selected
technical trading tools across market cycle
The remainder of this research article is organised as follows The next section
briefly highlights the outcome of earlier literature on technical analysis Following
that methodology used in this study is elaborated in data and methodology section
This is followed by results of data analysis explained in the result and discussion
section and conclusions are presented in the last section of the paper
Review of Literature
The existing research on profitability of trading rules and EMH exhibits mixed
results For instance Brock et al (1992) examined the profitability of moving
average for Dow Jones Index and favour technical trading rules whereas Hudson et
al (1996) applied moving average trading rules for United Kingdom (UK) data and
concluded that after deducting trading cost investors are not able to earn more
excess return than excess returns associated with buy-and-hold strategy Gencay
(1998) support the technical trading rules to predict the future stock price but have a
doubt on profitability of technical trading rules after deducting the trading cost
Ming-Ming et al (2002) applied moving average trading rules to predict the Kuala
Lumpur Stock Exchange Composite Index for the period of January 1997 to
December 1999 and found technical trading rules being able to generate abnormal
return even after deducting trading cost Jensen and Benington (1970) Neftccedili
(1991) and Allen and Karjalainen (1999) registered the evidence against technical
trading rules in making consistent abnormal return and accept the efficient market
hypothesis in the US market Balsara et al (2007) applied the moving average
crossover rule the channel breakout rule and Bollinger band trading rule to class A
and class B shares traded in Shanghai and Shenzhen stock exchanges and ended
with profit even after deducting the trading cost of 05 This is in stark contrast to
weak-form efficiency of the market Almujamed et al (2013) concluded that the
profitability of trading rules mainly comes from the slow adjustment to private
information when there is information asymmetry Zhu et al (2015) found that
Trading Rang Break rules outperform Moving Average (MA) rules and short-term
Variable Moving Average (VMA) rules outperform long-term VMA rules
However after deducting the trading cost profits from technical trading rules
disappeared in the Chinese market and this suggests that simple trading rules like
Muruganandan
27
Moving Average (MA) and Trading Range Breakout (TRB) cannot beat the
standard buy-and-hold strategy for the Chinese stock exchange indexes
Metghalchi et al (2016) examined the profitability of Moving Average (MA)
RSI and MACD technical trading rules for NASDAQ Composite index from 1972
to 2015 and concluded that trading rules have strong predictive power However
the predictability of trading rules reduced in the recent past sub-sample period from
2005 to 2015 and generated negative return after deducting transaction cost
Metghalchi et al (2019) examined the profitability of Technical Analysis (TA) for
the Morgan Stanly Capital International (MSCI) Emerging Market Index (EMI)
over the period of November 1988 to January 2018 They found strong empirical
evidence for TA even after considering risk and transaction cost using technical
tools like Moving Average RSI MACD and Rate of Change Chong and Ng (2008)
examine the strength of MACD and RSI using 60 years data of the London Stock
Exchange FT30 Index and concluded that trading rules generate higher return than
simple buy-and-hold strategy Atanasova and Hudson (2010) identified the
interaction between technical trading rules and calendar anomalies for Dow Jones
Index from 1897 to 2009 and concluded that the predictability of trading rule
reduced to a greater extent after removing the calendar anomalies
Krausz et al (2009) concluded that nullifying the profits from technical trading
rules is merely impossible as long as stock information is asymmetric Balsara et al
(2009) found that the moving average crossover rule the channel breakout rule and
the Bollinger band breakout rule underperform the buy-and-hold strategy between
1990 and 2007 However they observe significant positive returns on trades
generated by the contrarian version of these three technical trading rules even after
considering a 05 transaction costs on all trades Wong et al (2003) studied the
profitability of MACD and RSI technical indicators in Singapore stock market and
found that technical indicators offered significant positive returns
Marshall Young and Cahan (2008) concluded that candlestick technical trading
strategies for Japanese stock market failed to add value in both Bull or Bear
markets Wang and Chan (2007) empirical results indicate that the technical trading
rules correctly predict the direction of changes in the NASDAQ and Taiwan
Weighted Index (TWI) Nor and Wickremasinghe (2014) investigated the
profitability of MACD and RSI and concluded that Australian investors can make
consistent abnormal return with technical trading rules Chiang et al (2012) found
that the technical analysis helped to earn profits even after deducting transaction
Colombo Business Journal 11(1) 2020
28
costs in Taiwan Cohen and Cabiri (2015) employed DJI FTSE NK225 and TA100
index data for the period from 2007 to 2012 and found RSI and MACD
outperformed the indices in Bear market and delivered negative return during Bull
market
Anghel (2015) tested the profitability of Moving Average Convergence and
Divergence (MACD) with 1336 stocks of 75 countries with temporal data from 1st
of January 2001 to 31st of December 2012 The study found that certain companies
delivered risk adjusted abnormal return even after deducting trading cost and
rejected the random walk hypothesis for many countries Tian et al (2002) found
that technical trading rules have less power in the US stock market to earn profit
whereas the Chinese market gives profit even after deducting trading cost Chang et
al (2004) examined the power of simple Moving average trading rules in 11
emerging and developed markets (US and Japan) and suggested that emerging
equity indices exhibit the scope to earn abnormal return with technical trading rules
whereas developed countriesrsquo stock indices (US and Japan) do not reject the EMH
Sobreiro et al (2016) studied the profitability of MACD RSI and algorithm trading
rules in Brazil Russia India China and South Africa (BRICS) and emerging
markets and concluded that moving averages outperformed the buy-and-hold
strategy in most of the emerging markets except Brazil Russia and Argentina Yu et
al (2013) examined the profitability of technical trading rules in seven Asian
markets including Indonesia Malaysia Singapore The Philippines Thailand Hong
Kong and Japan Fixed and variable moving average and trading range breakout
rules were employed and concluded that technical trading tools were more powerful
in emerging markets than in developed markets However profits from technical
analysis disappeared after transaction costs Similarly Heng and Niblock (2014)
examined the predictive power of technical analysis for stock index futures of
Indonesia Malaysia Thailand and The Philippines They employed EMA and
MACD and found emerging markets were slowly reaching its informational
efficiency after considering the transaction cost In contrast Ming-Ming and Siok-
Hwa (2006) found that Fixed Moving Averages (FMAs) in China Thailand
Taiwan Malaysian Singaporean Hong Kong Korean and Indonesian stock
markets were profitable
From a contextual perspective research on profitability of technical trading
analyses is limited in the Indian context Sehgal and Gupta (2007) evaluated the
economic feasibility of technical analysis using individual stock data and found the
technical trading strategy failed to outperform the passive strategy irrespective of
Muruganandan
29
market cycle conditions They used the daily closing price and volume information
of 65 companies constituted in BSE 100 index for the period from January 1999 to
December 2004 They concluded that past price and volume information of large
size companies were immediately incorporated in current price as these stocks were
tracked by several investors and fund managers Gunasekarage and Power (2001)
applied variable length moving average and fixed length moving average in South
Asian stock markets and generated excess returns in Colombo Stock Exchange
(CSE) Dhaka Stock Exchange (DSE) and Karachi Stock Exchange (KSE) whereas
Bombay Stock Exchange (BSE) supported the EMH Sehgal and Garhyan (2002)
examined the On Balance Volume (OBV) technical analysis with transaction cost
using daily data of 21 companies listed in BSE for the period from April 1996 to
March 1998 The result supports the technical analysis and rejects the EMH Mitra
(2011) analysed the profitability of moving average in Indian stock index for the
period from 1998 to 2008 He predicted the direction of index movement using
moving average but failed to deliver positive return after transaction costs Kulkarni
and Mode (2014) and Khatua (2016) examined the MACDrsquos prediction ability of
individual stocks and supported the technical analysis However these studies
considered limited data with a small number of companies and ignored the risk
adjusted return in Indian context
Significant earlier studies support the EMH and reject the technical analysis in
developed markets at least in weak form (Allen amp Karjalainen 1999 Chang et al
2004 Hudson et al 1996 Gencay 1998 Neftci 1991 Tian et al 2002) On the
contrary studies in emerging markets concluded that technical analysts in emerging
markets were able to make profit than their counterparts in developed markets
(Balsara et al 2007 Chang et al 2004 Chiang et al 2012 Ming-Ming et al
2002 Metghalchi et al 2019 Ni et al 2020) This may be due to the inherent
characteristics of emerging markets such as weak competition inefficient legal
systems absence of strong supervising institutions less market participants and lack
of infrastructure for information dissemination On the other hand the most recent
studies question the profitability of technical trading rules in emerging markets after
considering transaction costs (Heng amp Niblock 2014 Sehga amp Gupta 2007
Tharavanji et al 2015 Yu et al 2013 Zhu et al 2015) Nazario et al (2017)
consolidated the outcome of 85 research papers in a scientific way and concluded
that a considerable number of research papers favour weak form of market
efficiency without considering the risk adjusted return However Marshall Cahan
and Cahan (2008) survey of market participants indicates that stock traders and
investors place more emphasis on technical analysis than fundamental factors
Colombo Business Journal 11(1) 2020
30
This existing discrepancy in literature demands research on emerging marketsrsquo
information efficiency in the recent past Further the ability of technical trading
rules to predict stock returns is inadequately researched in emerging markets
Hence this study attempts to analyse the profitability of technical trading rules in
economically dynamic and rapidly growing emerging markets such as India
Further the total study period was classified as Bull and Bear market and employed
risk adjusted performance measures like Sharpe ratio ratio of average profit to
average loss and percentage of profitable trade to have a microscopic view on the
performance of technical analysis in the Indian context
Data and Methodology
This empirical study covers the period from February 2000 to May 2018 and the
total study period is categorised into Bull and Bear market as per Lokeshwarri
(2017) which is shown in Table 1 and supported by Figure1
Table 1 Cyclical Bull and Bear Phases in Sensex
Start Date End Date Change in
percentage Category
Time in
Months
Feb ndash 2000 Sep ndash 2001 -5781 Bear ndash 1 19
Sep ndash 2001 May ndash 2003 1310 Sideway ndash 1 20
May ndash 2003 Jan ndash 2008 62263 Bull ndash 1 56
Jan ndash 2008 Mar ndash 2009 -6205 Bear ndash 2 13
Mar ndash 2009 Nov ndash 2010 16231 Bull ndash 2 20
Nov ndash 2010 Aug ndash 2013 -1734 Sideway ndash 2 33
Aug ndash 2013 Mar ndash 2015 7208 Bull ndash 3 19
Mar ndash 2015 Feb ndash 2016 -2508 Bear ndash 3 11
Feb ndash 2016 May ndash 2018 5560 Bull ndash 4 27
Source Lokeshwarri (2017)
The daily opening closing high and low values for BSE Sensex were extracted
from BSE data base The widely used trading rules such as Relative Strength Index
(RSI) and Moving Average Convergence and Divergence (MACD) are employed to
generate Buy Hold and Sell signals which are explained below
Figure 1 Bull and Bear Phases of BSE Sensex during the Study Period
112002112001112000
6000
4500
3000
112003112002
3500
3000
2500
112008112006112004
20000
1700015000
10000
5000
2000
112009712008112008
20000
15000
10000
112011112010112009
20000
15000
10000
112014112013112012112011
20000
17500
15000
112015112014
30000
25000
20000
112016912015512015112015
30000
27500
25000
112018112017112016
35000
30000
25000
Bear 1 Sideway 1 Bull 1
Bear 2 Bull 2 Sideway 2
Bull 3 Bear 3 Bull 4
Mu
rug
an
and
an
31
Colombo Business Journal 11(1) 2020
32
Relative Strength Index (RSI)
RSI is a technical indicator which used to identify the overbought and oversold
condition of financial securities First relative strength is calculated by dividing the
simple average of closing values on up days by the average of closing values on
down days over a given period of time which is 14 days in this study The step-by-
step trading decision based on RSI is demonstrated as follows
Steps in generating Buy Hold and Sell Signals
1 Input Closing (119862119905) and Opening (119874119905) value of the Index on day t
2 Up Days (119880119905) 119862119905 119894119891 (119862119905 minus 119862119905minus1) gt 0 119890119897119904119890 0
3 Down Days (119863119905) 119862119905 119894119891 (119862119905 minus 119862119905minus1) lt 0 119890119897119904119890 0
4 Relative Strength (119877119878)
119877119878119905 =
sum 119880119905 119894=119905minus(119899minus1)119894=119905
119899
sum 119863119905 119894=119905minus(119899minus1)119894=119905
119899
5 Relative Strength Index (119877119878119868119905)
119877119878119868119905 = 100 minus (100
1 + 119877119878119905)
6 Trading Decision1 119861119906119910 119874119905+1
119894119891119877119878119868119905 gt 30 amp 119877119878119868119905minus1 le 30
Else
119878119886119897119890 119874119905+1
119894119891 119877119878119868119905 gt 70 amp 119877119878119868119905minus1 le 70
Or
Hold
7 Output Calculation of Return
119894119891 119887119906119910 119874119905+1 =
(119897119900119892(119862119905+1) minus 119897119900119892(119874119905+1))
119894119891 119878119886119897119890 119874119905+1 =
(119897119900119892(119874119905+1) minus 119897119900119892(119862119905+1))
1 The trading rules were applied as per Welles (1978) Henderson (2002) and Rosillo et al
(2013) Unlike previous studies in order to imitate the real time stock trading scenario
opening and closing values were considered for executing the trading signals and calculation
of return
Muruganandan
33
Moving Average Convergence and Divergence (MACD)
MACD is constructed based on historical exponential moving average of
closing value of index to identify the trend changes in its value It is computed
based on the difference between longer exponential moving averages (26 days)
from a shorter exponential moving average (12 days) In addition nine days simple
moving average of MACD is used as a sign to generate buy and sell signals Step-
by-step trading decision is presented as follows
Steps in generating Buy Hold and Sell Signals
1 Input Closing (119862119905) and Opening (119874119905) value of the Index on day t
2 Exponential Moving Average
119899 = 12 119886119899119889 26 119889119886119910119904 119891119900119903 119904ℎ119900119903119905 119886119899119889 119897119900119899119892 119864119872119860 119903119890119904119901119890119888119905119894119907119890119897119910
119864119872119860119905(119899) = sum (2
1+119899)
119894=119905minus(119899minus1)119894=119905 times 119862119905 + (1 minus
2
1+119899) times 119864119872119860119905minus1(119899)
3 119872119860119862119863 119864119872119860119905(119878ℎ119900119903119905119890119903) minus 119864119872119860119905(119871119900119899119892119890119903)
4 Signal Line 119878119894119892119899119905 = 1198781198721198609(119872119860119862119863)
5 Trading Decision2 119861119906119910 119874119905+1
119894119891119872119860119862119863119905 lt 0 119878119894119892119899119905 lt 0 amp 119878119894119892119899119905 gt 119872119860119862119863119905
Else
119878119886119897119890 119874119905+1
119894119891119872119860119862119863119905 gt 0 119878119894119892119899119905 gt 0 amp 119878119894119892119899119905 lt 119872119860119862119863119905
Or
Hold
6 Output Calculation of Return
119894119891 119887119906119910 119874119905+1 =
(119897119900119892(119862119905+1) minus 119897119900119892(119874119905+1))
119894119891 119878119886119897119890 119874119905+1 =
(119897119900119892(119874119905+1) minus 119897119900119892(119862119905+1))
Further the following hypotheses were framed to test whether returns of buy or
sell signals are different from the unconditional mean return and also whether the
mean buy signal return is different from mean sell signal return The null and
alternative hypotheses of the study are stated in Table 2
2 The trading rules were applied as per Rosillo et al (2013) Unlike previous studies in
order to imitate the real time stock trading scenario opening and closing values were
considered for executing the trading signals and calculation of return
Colombo Business Journal 11(1) 2020
34
Table2 Hypotheses of the Study
Buy-Unconditional
Return
Sell-Unconditional
Return
Buy ndash Sell
Return
Ho 120583119861 minus 120583119880 = 0 120583119878 minus 120583119880 = 0 120583119861 minus 120583119878 = 0
Ha 120583119861 minus 120583119880 ne 0 120583119878 minus 120583119880 ne 0 120583119861 minus 120583119878 ne 0
After the formulation of hypotheses t-statistics were used to test the null
hypothesis of equality between unconditional mean return (120583) and mean return of
trading rules (120583119903) which is specified in Equation 1
119905119903 = 120583119887119906119910 (119904119890119897119897)minus120583
radic120590119887119906119910( 119904119890119897119897)
2
119873119887119906119910(119904119890119897119897)+
1205902
119873
(1)
where 120583119887119906119910 (119904119890119897119897) is the mean technical trading return of buy or sell 119873119887119906119910(119904119890119897119897) is the
number of trades for the buy or sell signal 120583 and N are the unconditional mean
return and number of observations respectively and 1205902 is the estimated sample
variance In testing long-short strategies (buy-sell) t-statistics is computed as
follows
119905119887119906119910minus119904119890119897119897 = 120583119887119906119910minus120583119904119890119897119897
radic120590119861119906119910
2
119873119861119906119910+
1205901198781198901198971198972
119873119878119890119897119897
(2)
where 120583119887119906119910 and 120583119904119890119897119897 are the mean returns of buy signal and sell signals 120590119861119906119910 and
120590119878119890119897119897 are the estimated sample standard deviations of buy and sell signals
respectively 119873119861119906119910 and 119873119878119890119897119897 are the number of buy and sell signals respectively
Performance Measures
Sharpe Ratio
Reward to total risk is calculated using Sharpe Ratio which measures the
expected return to per unit of total risk taken In the perspective of trading the
standard Sharpe ratio is modified by excluding the risk free rate by assuming that
the trader needs to maintain the liquidity and not investing in risk free rate Hence
Sharpe ratio is calculated as per Equation 3
119878ℎ119886119903119901119890 119877119886119905119894119900 (119878119877) =
120590119877 (3)
Muruganandan
35
where and 120590119877 are respectively the expected return and the total risk of a trading
rule in a given period Higher the ratio superior the performance indicated by it
Ratio of Average Profit to Average Loss (APAL)
This ratio is calculated by dividing the average profit from profitable trade by
average loss from the unprofitable trade The ratio of more than one indicates on
average the trading system correctly predicts the price movement than misleading
the traders Hence a higher ratio indicates the superior ability of the technical
trading rules to predict the future price movement The absolute value of this ratio is
calculated as per Equation 4
119860119875
119860119871= |
119860119907119890119903119886119892119890 119875119903119900119891119894119905
119860119907119890119903119886119892119890 119897119900119904119904| (4)
Percentage of Profitable Trade ( of PT)
This ratio indicates the proportion of profitable trade to total trade signal High
percentage indicates that the trading system identifies price change more accurately
This ratio considers the number of profitable trade to total trading signals and
ignores the value of profit (loss) earned (incurred) This performance metric is
calculated as per Equation 5
119900119891 119875119879 = 119873119906119898119887119890119903 119900119891 119875119903119900119891119894119905119886119887119897119890 119879119903119886119889119894119899119892
119879119900119905119886119897 119873119906119898119887119890119903 119900119891 119879119903119886119889119894119899119892 119904119894119892119899119886119897119904 (5)
Results and Discussion
The summary statistics for the unconditional intraday return for the entire
sample period and the nine non-overlapping sub-periods are presented in Table 3
The intraday mean returns for the entire sample period and for the sub-periods are
negative except for the period Bull-2 Bear-2 period exhibits the highest standard
deviation of 001009 Both highest (0030) and lowest (-0047) daily return for the
entire study period recorded in Bull-1 period The high value of Kurtosis indicates
that the intraday return of BSE Sensex is not normally distributed and there are
outliers However when the market is moving in the Sideway the intraday returns
become more or less normally distributed as evidenced from the low Kurtosis The
evidence of excessive Kurtosis in Bull period indicates that the unconditional
intraday returns were leptokurtic with thicker tails than the Bear and Sideway
markets Hence the variance during Bull periods results from the outliers The
Colombo Business Journal 11(1) 2020
36
negative skewness indicates that the unconditional daily returns were moderately
negatively skewed except for Sideway-1
Table 3 Descriptive Statistics for Unconditional Intraday Return
Cycle Mean Standard
deviation Kurtosis Skew Min Max Count
Overall -000041 000576 48482 -0531 -0047 0030 4545
Bear ndash 1 -000119 000855 12148 -0286 -0035 0026 437
Sideway ndash 1 -000042 000451 06693 0028 -0018 0015 411
Bull ndash 1 -000015 000605 5415 -0785 -0047 0030 1165
Bear ndash 2 -000093 001009 09469 -0359 -0038 0024 280
Bull ndash 2 000025 000583 22848 0049 -0028 0025 411
Sideway ndash 2 -000049 000423 0568 -0217 -0016 0011 679
Bull ndash 3 -000032 000349 22438 -0127 -0018 0012 381
Bear ndash 3 -000098 000406 09085 -0630 -0016 0009 225
Bull ndash 4 -000028 000279 3073 0332 -0009 0016 556
Note Unconditional intraday return defined as the log difference of closing value to opening value by
assuming that the trader buys at the opening value and sells at the closing value
The result of RSI trading rule for BSE Sensex is presented in Table 4 The first
two columns exhibit the number of buy (119873119861) and sell (119873119878) signals generated using
RSI trading rules for the overall period and non-overlapping sub-sample periods
Third and fourth column show the average buy (120583119861) and sell (120583119878) returns along
with t-test in parenthesis The basic assumption of t-test is that the observations are
normally distributed However Table 1 reveals that the returns were not normally
distributed which may question the validity of t-test results and its interpretations In
order to overcome this phenomenon Brock et al (1992) suggested the bootstrap
method developed by Efron (1979) Hence this paper employs the bootstrap
method adopted by McKenzie (2007) which mimics the procedure followed by
Brock et al (1992) Bootstrap process was repeated for 500 times and the resultant t
values and corresponding p values are reported in parentheses and square brackets
respectively However the acceptance and rejection of hypothesis were similar both
in bootstrap p values and t-test In addition standard deviation of buy and sell
signals and the mean difference between buy and sell signals are also presented in
the column five six and seven respectively
Muruganandan
37
Table 4 Statistical Results for RSI Trading Rule
Category NB NS microB microS σB σS microB - microS
Overall 116 178
-000065
(-0352)
[0739]
000003
(1308)
[0232]
000729 000434
-000068
(-0905)
[0367]
Bear ndash 1 15 13
-000002
(0489)
[0645]
00025
(2150)
[0066]
000908 000601
-000252
(-0876)
[0401]
Sideway ndash 1 14 16
-000051
(-0084)
[0946]
000065
(0859)
[0419]
000406 00049
-000116
(-0711)
[0499]
Bull ndash 1 15 54
-000199
(-0801)
[0445]
-00009
(-1273)
[0186]
000892 000414
-00011
(-0464)
[0617]
Bear ndash 2 17 7
000031
(0439)
[0661]
00009
(0488)
[0631]
001134 000979
-000059
(-0128)
[0876]
Bull ndash 2 5 21
000486
(1624)
[0076]
-000039
(-0601)
[0599]
00063 000474
000525
(1749)
[0071]
Sideway ndash 2 26 19
-000165
(-0969)
[0325]
-000009
(0831)
[0411]
0006 000205
-000156
(-1231)
[0246]
Bull ndash 3 4 16
-000121
(-0949)
[0355]
-000037
(-0063)
[0952]
000184 000294
-000084
(-0713)
[0476]
Bear ndash 3 13 5
-000149
(0415)
[0681]
000214
(1296)
[0124]
000373 000279
-00036
(-1357)
[0185]
Bull ndash 4 7 27
00000032
(0334)
[0729]
000037
(1533)
[0162]
000218 000208
-000037
(-0395)
[0691]
Notes 1 NB and NS denote the number of buy and sell signals during the period respectively microB and
microS denote the average return of buy and sell signals respectively σB and σS denote the
standard deviation of buy and sell signal returns respectively
2 Numbers in parentheses are t values and numbers in square brackets are the bootstrap p
values
Colombo Business Journal 11(1) 2020
38
RSI generates more sell signals than buy signals during the Bull market On the
contrary during the Bear and Sideway market RSI produced higher number of buy
signals than sell signals Since RSI has the upper band of 100 if the stock price goes
up continuously RSI remains in the overbought regime and produce more number
of sell signals than buy signals In this case a trader shorting the opportunity based
on RSI sell signals may not make profit as the price will move to the differentother
orbit On the other hand if the stock price goes down continuously the RSI
generates more number of buy signals than the sell signals as opposed to the current
price movement Hence the application of RSI during the long Bull and Bear
markets may not help the trader to make profit even before adjusting the transaction
cost From the result of t-test and bootstrap p values it can be concluded that buy
and sell signals does not reject the null hypothesis that the mean return of buy or sell
signals is not significantly different from the unconditional mean return Moreover
averages of buy signal returns and sell signal returns are not significantly different
from each other These results provide evidence of the existence of weak form
efficiency across the market cycle Hence it can be concluded that traders cannot
outperform the market using the RSI signals during the upward or downward
movement of the market
Table 5 Performance of RSI Trading Signal
Category
Buy Signal Performance Sell Signal Performance
SR APAL of
PT SR APAL
of
PT
Overall -00892 1007 4397 00069 10669 4888
Bear ndash 1 -00022 1489 4000 04160 14933 6923
Sideway ndash 1 -01256 0529 5714 01327 13950 5000
Bull ndash 1 -02242 0896 4000 -02174 10832 3519
Bear ndash 2 00273 1203 4706 00919 09491 5714
Bull ndash 2 07714 1766 8000 -00823 07273 5238
Sideway ndash 2 -02750 0781 3846 -00439 09970 4737
Bull ndash 3 -06576 0298 2500 -01259 07136 5000
Bear ndash 3 -02601 0742 4000 02294 13570 5938
Bull ndash 4 00014 1338 4286 01779 10837 5926
Note SR denotes the Sharpe Ratio APAL denotes the ratio of average profit to average loss
of PT denotes the percentage of profitable trade to total trading signal
Muruganandan
39
Table 5 exhibits the results of Sharpe Ratio (SR) average profit to average loss
ratio (APAL) and percentage of profitable trade to total trading signals For the
overall study period and almost all sub-samples periods buy signal underperforms
the sell signal as per the modified Sharpe ratio The absolute value of average profit
to average loss more than one indicates that the average of profitable trade is more
than the average of unprofitable trade However percentage of profitable trade less
than 50 indicates that RSI generate a higher number of unprofitable trades than
profitable trade Hence average return on buy signal is negative for the overall
study period and for six out of nine sub-sample periods On the other hand RSI sell
signal generated the positive Sharpe ratio for overall period and five out of nine sub-
sample periods Profitable trade to total trade signal indicates sell signal produced
more profitable trade in all sub-sample period except Bull-1 and Sidway-1 market
Though percentage of profitable trade to total trade for overall period is less than
50 (ie 4888) which indicate that the number of unprofitable trades is higher
than the profitable trades the profit per profitable trade is sufficiently enough to
compensate the loss in unprofitable trade The sell signal trading strategy makes
money not only from correctly predicting the market movement but also minimising
the loss quickly and allows the profit to run
The Table 6 exhibits the statistical results for the MACD trading rules During
the study period MACD generated 1522 sell signals and 858 buy signals with the
average return of 000861 and -000128 respectively The standard deviations of buy
signal returns (00179) and sell signal returns (001068) are also presented along
with mean return difference between buy and sell signals (-00021) Buy signal
produced the average negative return for all the sub-sample periods and they were
also not significantly different from the average unconditional mean return Hence
the null hypothesis was accepted and it can be concluded that buy signal produced a
return similar to that of unconditional intraday return However the sell signal
generated positive average return for the overall period and all sub-sample periods
except Bull-2 period In contrast the sell signal returns were significantly different
for the overall period and five out of nine sub-sample periods
Table 6 Statistical Results for MACD Trading Rule
Category NB NS microB microS σB σS microB -microS
Overall 858 1522
-000128
(-142)
[0170]
0000861
(443)
[0002]
0017908 0010686
-000215
(-3203)
[0008]
Colombo Business Journal 11(1) 2020
40
Category NB NS microB microS σB σS microB -microS
Bear ndash 1 141 59
-000021
(0494)
[0631]
0006379
(317)
[0002]
0023008 0018028
-000659
(-2165)
[0036]
Sideway ndash 1 131 71
-000226
(-1524)
[0142]
0000543
(0623)
[0509]
0013614 001285
-000281
(-1452)
[0162]
Bull ndash 1 85 581
-000004
(0043)
[0962]
0000196
(0703)
[0483]
0023623 0011
-000023
(-0090)
[0908]
Bear ndash 2 109 33
-000350
(-0989)
[0337]
0004699
(231)
[0036]
0026444 0013532
-00082
(-2371)
[002]
Bull ndash 2 39 192
-000031
(-0224)
[0816]
-000085
(-1066)
[0311]
0015615 0013721
0000532
(0198)
[0838]
Sideway ndash 2 166 171
-000035
(0171)
[0852]
000195
(375)
[0002]
0011182 0008263
-00023
(-2141)
[0032]
Bull ndash 3 32 165
-000171
(-0514)
[0591]
0000902
(220)
[0028]
0015215 0006737
-000261
(-0952)
[0291]
Bear ndash 3 88 25
-000146
(-0457)
[0643]
0004442
(341)
[0002]
0009516 0007832
-000591
(-3164)
[0004]
Bull ndash 4 67 225
-000205
(-1306)
[0188]
0000871
(2905)
[0008]
0011064 0005643
-000292
(-2080)
[004]
Notes 1 NB and NS denote the number of buy and sell signals during the period respectively microB
and microS denote the average return of buy and sell signals respectively σB and σS denote the
standard deviation of buy and sell signal returns respectively
2 Numbers in parenthesis are t-values and numbers in square brackets are the bootstrap p
values
3 denotes p lt 05
The risk measured by standard deviation is higher in buy signal than sell signal
trading rules for the entire study period and for all the sub-sample periods This
clearly indicates that the trading on buy signal is riskier than the sell signal
Moreover the sell signal average returns were significantly different from the
Muruganandan
41
average buy signal returns in all the Bear market periods and for the overall study
period This result supports the sell signal over buy signal specifically during the
Bear market phases This result sharply contradicts to Tharavanij et al (2015) who
found buy signals outperform the sell signals in Southeast Asian markets
Sharpe ratio average profit to average loss ratio and percentage of profitable
trade to total trade signal for MACD trading rule are presented in Table 7 For the
buy signals percentage of profitable trade to total trade has more than 50 in four
out of nine sub-sample periods but average profit to average loss is less than one
which implies that the profit from correctly predicting market direction is not
sufficient enough to cut down the loss from the failure to predict market direction
Hence Sharpe ratios for all sub-sample periods and the entire study period were
negative However the sell signals correctly predict the market with highest
percentage of profitable trade to total trade of 80 in Bear-3 period Moreover
with less ability to predict market direction in Sideway-1 (4789) and Bull-1
(4905) periods sell signal generated profit to cut down the loss from unprofitable
trade which results in average profit to average loss ratio of more than one for
Sideway-1 (122) and Bull-1 (109) period Overall the result supports the sell
signals over buy signals before considering the transaction costs in the Indian
context
Table 7 Performance of MACD Trading Signal
Category
Buy Signal Performance Sell Signal Performance
SR APAL of
PT SR APAL
of
PT
Overall -0072 0897 47669 008 106 5414
Bear ndash 1 -0009 1110 46809 035 219 5763
Sideway ndash 1 -0166 0701 47328 004 122 4789
Bull ndash 1 -0002 0805 55294 002 109 4905
Bear ndash 2 -0133 0940 43119 035 115 6667
Bull ndash 2 -0020 0734 56410 -006 084 5000
Sideway ndash 2 -0031 1122 45181 024 108 6374
Bull ndash 3 -0112 0563 56250 013 100 5879
Bear ndash 3 -0154 0682 50000 057 108 8000
Bull ndash 4 -0185 0827 41791 015 116 5644
Note SR denotes the Sharpe Ratio APAL denotes the ratio of average profit to average loss
of PT denotes the percentage of profitable trade to total trading signal
Colombo Business Journal 11(1) 2020
42
Conclusion
This paper examines the profitability of RSI and MACD technical trading rules
in the Indian market across market cycles BSE Sensex data for the period from
February 2000 to May 2018 were collected from BSE data base and classified into
nine non-overlapping periods as Bull and Bear markets based on the index
movement The t-tests were applied to test the hypothesis that returns from technical
trading rules were not significantly different from the unconditional daily returns In
addition Sharpe ratio average profit to average loss ratio and percentage of
profitable trade to total trade signal were also employed to have a microscopic view
on technical trading rules
Results support the weak-form efficient theory as RSI failed to deliver the
positive returns even before deducting the transaction costs RSI buy and sell signal
returns were not significantly different from the unconditional intraday return In
terms of market timing RSI wrongly predict the market movement and delivered
the percentage of profitable trade to total trade less than 50 Moreover profitable
trades were insufficient to overcome the loss from unprofitable trade Hence buy
signal generated a negative average return and sell signal posted a low positive
average return before deducting transaction costs Therefore after deducting
transaction costs RSI may not leave any profit in the hands of traders
MACD sell signal produced significant positive returns compared to buy signal
and unconditional intraday return However as per Sharpe ratio MACD sell signal
failed to produce the return in line with risk taken Sharpe ratio of less than one
indicates that risk associated with the technical trading rule is more than the return
generated by RSI and MACD In addition even profitable MACD sell signal does
not help in market timing It makes money from higher average profit from
profitable trade than average loss from unprofitable trade However MACD does
not help to reduce the unprofitable trade Hence the study concludes that the trader
cannot earn abnormal return consistently with the help of RSI and MACD across
market cycle in the Indian context RSI and MACD are very old and yet still widely
used as technical tools in real time stock price prediction On the other hand latest
development in information technology and changes in legal systems may have
helped the market to absorb RSI and MACD signals in current price with no time
and cost However in order to empirically validate this assumption a future study
may be extended using a proxy for information technology development and its
impact on trading rules across industries and individual stocks in emerging markets
Muruganandan
43
Declaration of Conflict of Interest
The author declared no potential conflict of interest with respect to the research
authorship and publication of this article
Acknowledgement
I would like to thank anonymous reviewers for their valuable suggestions
References
Allen F amp Karjalainen R (1999) Using genetic algorithms to find technical
trading rules Journal of Financial Economics 51(2) 245ndash271
httpsdoiorg101016S0304-405X(98)00052-X
Almujamed H I Fifield S amp Power D (2013) An investigation of the role of
technical analysis in Kuwait Qualitative Research in Financial Markets 5(1)
43ndash64 httpsdoiorg10110817554171311308959
Anghel G D I (2015) Stock market efficiency and the MACD Evidence from
countries around the world Procedia Economics and Finance 32 1414ndash1431
httpsdoiorg101016S2212-5671(15)01518-X
Atanasova C V amp Hudson R S (2010) Technical trading rules and calendar
anomalies mdash Are they the same phenomena Economics Letters 106(2) 128ndash
130 httpsdoiorg101016jeconlet200911001
Balsara N J Chen G amp Zheng L (2007) The Chinese stock market An
examination of the random walk model and technical trading rules Quarterly
Journal of Business amp Economics 46(2) 43ndash63 httpswwwjstororgstable
40473435
Balsara N Chen J amp Zheng L (2009) Profiting from a contrarian application of
technical trading rules in the US stock market Journal of Asset Management
10(2) 97ndash123 httpsdoiorg101057jam200844
Brock W Lakonishok J amp LeBaron B (1992) Simple technical trading rules
and stochastic properties of stock returns The Journal of Finance 47(5) 1731ndash
1764 httpsdoiorg101111j1540-62611992tb04681x
Chang E J Lima E J A amp Tabak B M (2004) Testing for predictability in
emerging equity markets Emerging Markets Review 5(3) 295ndash316
httpsdoi101016jememar200403005
Chiang Y-C Ke M-C Liao T L amp Wang C D (2012) Are technical trading
strategies still profitable - Evidence from the Taiwan Stock Index Futures
Market Applied Financial Economics 22(12) 955ndash965 httpsdoiorg
101080096031072011631893
Chong T T-L amp Ng W-K (2008) Technical analysis and the London stock
exchange Testing the MACD and RSI rules using the FT30 Applied
Colombo Business Journal 11(1) 2020
44
Economics Letters 15(14) 1111ndash1114 httpsdoiorg10108013504850600
993598
Cohen G amp Cabiri E (2015) Can technical oscillators outperform the buy and
hold strategy Applied Economics 47(30) 3189ndash3197 httpsdoiorg101080
0003684620151013609
Efron B (1979) Bootstrap methods Another look at the Jackknife The Annals of
Statistics 7(1)1ndash26 httpsprojecteuclidorgeuclidaos 1176344552
Fama (1970) Efficient capital markets a review of theory and empirical work
Journal of Finance 25(2) 383-417 httpswwwjstororgstable2325486
Gencay R (1998) The predictability of security returns with simple technical
trading rules Journal of Empirical Finance 5(4) 347ndash359 httpsdoiorg
101016S0927-5398(97)00022-4
Gunasekarage A amp Power D M (2001) The profitability of moving average
trading rules in South Asian stock markets Emerging Markets Review 2(1)
17ndash33 httpsdoiorg101016S1566-0141(00)00017-0
Henderson C (2002) Currency strategy The practitionerrsquos guide to currency
investing hedging and forecasting John Willy amp Sons
Heng P amp Niblock S J (2014) Trading with tigers A technical analysis of
Southeast Asian stock index futures International Economic Journal 28(4)
679ndash692 httpsdoiorg101080101687372014928895
Hudson R Dempsey M amp Keasey K (1996) A note on weak form efficiency of
capital markets The application of simple technical trading rules to UK stock
prices- 1935-1994 Journal of Banking and Finance 20(6) 1121ndash1132
httpsdoiorg1010160378-4266(95)00043-7
Jensen M C amp Benington G A (1970) Random walk and technical theories
Some additional evidence Journal of Finance 25 469ndash482
httpswwwjstororgstable2325495
Krausz J Lee S-Y amp Nam K (2009) Profitability of nonlinear dynamics
under technical trading rules Evidence from Pacific basin stock markets
Emerging Markets Finance amp Trade 45(4) 13ndash35 httpsdoiorg102753
REE1540-496X450402
Khatua A (2016) An application of moving average convergence and divergence
(MACD) indicator on selected stocks listed on National Stock Exchange (NSE)
httpdxdoiorg102139ssrn2872665
Kulkarni A D amp More A (2014) An application of moving average convergence
divergence (MACD) indicator on selected stocks listed on Bombay Stock
Exchange (BSE) Oriental Journal of Computer Science and Technology 7(3)
396ndash400 httpwwwcomputerscijournalorgp=1500
Lokeshwarri S K (2017 April 07) The big story ndash Sit back go passive The Hindu
Business Line (Coimbatore Edition) p 2
Muruganandan
45
Marshall B R Cahan R H amp Cahan J M (2008) Does intraday technical
analysis in the US equity market have value Journal of Empirical Finance
15(2) 199ndash210 httpsdoiorg101016jjempfin200605003
Marshall B R Young M R amp Cahan R (2008) Are candlestick technical
trading strategies profitable in the Japanese equity market Review of
Quantitative Finance and Accounting 31(2) 191ndash207 httpsdoiorg101007
s11156-007-0068-1
Metghalchi M Chen C-P Hajilee M (2016) Moving average trading rules for
NASDAQ composite index Applied Finance Letters 5(2) 45ndash57
httpsdoiorg1024135aflv5i254
Metghalchi M amp Hayes L A Niroomand F (2019) A technical approach to
equity investing in emerging markets Review of Financial Economics 37(3)
389ndash403 httpsdoiorg101002rfe1041
McKenzie M D (2007) Technical trading rules in emerging market and the 1997
Asian currency crises Emerging Market Finance and Trade 43(4) 46ndash73
httpsdoiorg102753REE1540-496X430403
Ming-Ming L Balachandher K G amp Nor F M (2002) An examination of the
random walk model and technical trading rules in the Malaysian stock market
Quarterly Journal of Business amp Economics 41(1) 81ndash104
httpswwwjstororgstable40473346
Ming-Ming L amp Siok-Hwa L (2006) The profitability of the simple moving
averages and trading range breakout in the Asian stock markets Journal of
Asian Economics 17(1) 144ndash170 httpsdoiorg101016jasieco200512001
Mitra S K (2011) How rewarding is technical analysis in Indian stock market
Quantitative Finance 11(2) 287ndash297 httpsdoiorg101080
14697680903493581
Nazario R T F Silva J L amp Sobrero V A (2017) A literature review of
technical analysis on stock markets The Quarterly Review of Economics and
Finance 66 115ndash126 httpsdoiorg101016jqref201701014
Neftccedili S N (1991) Naiumlve trading rules in financial markets and Wiener-
Kolmogorov prediction theory A study of ldquotechnical analysisrdquo Journal of
Business 64(4) 549ndash571
Ni Y Day M-Y Huang P ampYu S-R (2020) The profitability of Bollinger
Bamps Evidence from the constituent stocks of Taiwan 50 Physica A Statistical
Mechanics and Its Applications Advance online publication httpsdoiorg
101016jphysa2020124144
Nor S M amp Wickremasinghe G (2014) The profitability of MACD and RSI
trading rules in the Australian stock market Investment Management and
Financial Innovation 11(4) 194ndash199
Colombo Business Journal 11(1) 2020
46
Rosillo R de La Fuente D amp Brugos J A L (2013) Technical analysis and the
Spanish stock market Testing the RSI and MACD momentum and stochastic
rule using Spanish market companies Applied Economics 45(12) 1541ndash1550
httpsdoiorg101080000368462011631894
Sehgal S amp Garhyan A (2002) Abnormal returns using technical returns The
Indian experience Finance India 16(1) 181ndash203
Sehgal S amp Gupta M (2007) Tests of technical analysis in India Vision The
Journal of Business Perspective 11(3) 11ndash23 httpsdoiorg101177
097226290701100303
Sobreiro V A da Costa T R C C Nazaacuterio R T F e Silva J L Moreira E
A Filho M C L Kimura H amp Zambrano J C A (2016) The profitability
of moving average trading rules in BRICS and emerging stock markets North
American Journal of Economics and Finance 38 86ndash101 httpsdoiorg
101016jnajef201608003
Tian G G Wan G H amp Guo M (2002) Market efficiency and the returns to
simple technical trading rules New evidence from US equity market and
Chinese equity markets Asia-Pacific Financial Markets 9(3) 241ndash258
httpsdoiorg101023A1024181515265
Tharavanij P Siraprapasiri V amp Rajchamaha K (2015) Performance of
technical trading rules Evidence from Southeast Asian Stock Market
Springerplus 4552 httpsdoiorg101186s40064-015-1334-7
Wang J-L amp Chan S-H (2007) Stock market trading rule discovery using
pattern recognition and technical analysis Expert Systems with Applications
33(2) 304ndash315 httpsdoiorg101016jeswa200605002
Welles J Jr (1978) New concepts in technical trading systems Hunter Publishing
Company
Wong W-K Manzur M amp Chew B-K (2003) How rewarding is technical
analysis Evidence from Singapore stock market Journal of Applied Financial
Economics 13(7) 543ndash551 httpsdoiorg1010800960310022000020906
Yu H Nartea G V Gan C amp Yao L J (2013) Predictive ability and
profitability of simple technical trading rules Recent evidence from Southeast
Asian stock markets International Review of Economics and Finance 25 356ndash
371 httpsdoiorg101016jiref201207016
Zhu H Jiang Z-Q Li S-P amp Zhou W-X (2015) Profitability of simple
technical trading rules of Chinese stock exchange indexes Physica A
Statistical Mechanics and Its Applications 439 75ndash84 httpsdoiorg101016
jphysa201507032
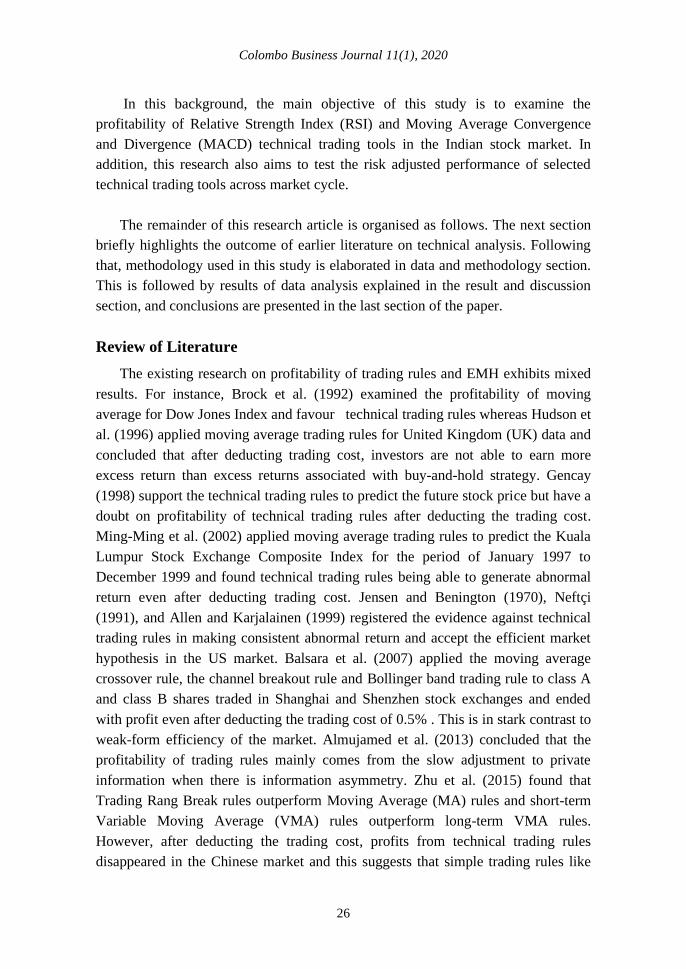
Colombo Business Journal 11(1) 2020
26
In this background the main objective of this study is to examine the
profitability of Relative Strength Index (RSI) and Moving Average Convergence
and Divergence (MACD) technical trading tools in the Indian stock market In
addition this research also aims to test the risk adjusted performance of selected
technical trading tools across market cycle
The remainder of this research article is organised as follows The next section
briefly highlights the outcome of earlier literature on technical analysis Following
that methodology used in this study is elaborated in data and methodology section
This is followed by results of data analysis explained in the result and discussion
section and conclusions are presented in the last section of the paper
Review of Literature
The existing research on profitability of trading rules and EMH exhibits mixed
results For instance Brock et al (1992) examined the profitability of moving
average for Dow Jones Index and favour technical trading rules whereas Hudson et
al (1996) applied moving average trading rules for United Kingdom (UK) data and
concluded that after deducting trading cost investors are not able to earn more
excess return than excess returns associated with buy-and-hold strategy Gencay
(1998) support the technical trading rules to predict the future stock price but have a
doubt on profitability of technical trading rules after deducting the trading cost
Ming-Ming et al (2002) applied moving average trading rules to predict the Kuala
Lumpur Stock Exchange Composite Index for the period of January 1997 to
December 1999 and found technical trading rules being able to generate abnormal
return even after deducting trading cost Jensen and Benington (1970) Neftccedili
(1991) and Allen and Karjalainen (1999) registered the evidence against technical
trading rules in making consistent abnormal return and accept the efficient market
hypothesis in the US market Balsara et al (2007) applied the moving average
crossover rule the channel breakout rule and Bollinger band trading rule to class A
and class B shares traded in Shanghai and Shenzhen stock exchanges and ended
with profit even after deducting the trading cost of 05 This is in stark contrast to
weak-form efficiency of the market Almujamed et al (2013) concluded that the
profitability of trading rules mainly comes from the slow adjustment to private
information when there is information asymmetry Zhu et al (2015) found that
Trading Rang Break rules outperform Moving Average (MA) rules and short-term
Variable Moving Average (VMA) rules outperform long-term VMA rules
However after deducting the trading cost profits from technical trading rules
disappeared in the Chinese market and this suggests that simple trading rules like
Muruganandan
27
Moving Average (MA) and Trading Range Breakout (TRB) cannot beat the
standard buy-and-hold strategy for the Chinese stock exchange indexes
Metghalchi et al (2016) examined the profitability of Moving Average (MA)
RSI and MACD technical trading rules for NASDAQ Composite index from 1972
to 2015 and concluded that trading rules have strong predictive power However
the predictability of trading rules reduced in the recent past sub-sample period from
2005 to 2015 and generated negative return after deducting transaction cost
Metghalchi et al (2019) examined the profitability of Technical Analysis (TA) for
the Morgan Stanly Capital International (MSCI) Emerging Market Index (EMI)
over the period of November 1988 to January 2018 They found strong empirical
evidence for TA even after considering risk and transaction cost using technical
tools like Moving Average RSI MACD and Rate of Change Chong and Ng (2008)
examine the strength of MACD and RSI using 60 years data of the London Stock
Exchange FT30 Index and concluded that trading rules generate higher return than
simple buy-and-hold strategy Atanasova and Hudson (2010) identified the
interaction between technical trading rules and calendar anomalies for Dow Jones
Index from 1897 to 2009 and concluded that the predictability of trading rule
reduced to a greater extent after removing the calendar anomalies
Krausz et al (2009) concluded that nullifying the profits from technical trading
rules is merely impossible as long as stock information is asymmetric Balsara et al
(2009) found that the moving average crossover rule the channel breakout rule and
the Bollinger band breakout rule underperform the buy-and-hold strategy between
1990 and 2007 However they observe significant positive returns on trades
generated by the contrarian version of these three technical trading rules even after
considering a 05 transaction costs on all trades Wong et al (2003) studied the
profitability of MACD and RSI technical indicators in Singapore stock market and
found that technical indicators offered significant positive returns
Marshall Young and Cahan (2008) concluded that candlestick technical trading
strategies for Japanese stock market failed to add value in both Bull or Bear
markets Wang and Chan (2007) empirical results indicate that the technical trading
rules correctly predict the direction of changes in the NASDAQ and Taiwan
Weighted Index (TWI) Nor and Wickremasinghe (2014) investigated the
profitability of MACD and RSI and concluded that Australian investors can make
consistent abnormal return with technical trading rules Chiang et al (2012) found
that the technical analysis helped to earn profits even after deducting transaction
Colombo Business Journal 11(1) 2020
28
costs in Taiwan Cohen and Cabiri (2015) employed DJI FTSE NK225 and TA100
index data for the period from 2007 to 2012 and found RSI and MACD
outperformed the indices in Bear market and delivered negative return during Bull
market
Anghel (2015) tested the profitability of Moving Average Convergence and
Divergence (MACD) with 1336 stocks of 75 countries with temporal data from 1st
of January 2001 to 31st of December 2012 The study found that certain companies
delivered risk adjusted abnormal return even after deducting trading cost and
rejected the random walk hypothesis for many countries Tian et al (2002) found
that technical trading rules have less power in the US stock market to earn profit
whereas the Chinese market gives profit even after deducting trading cost Chang et
al (2004) examined the power of simple Moving average trading rules in 11
emerging and developed markets (US and Japan) and suggested that emerging
equity indices exhibit the scope to earn abnormal return with technical trading rules
whereas developed countriesrsquo stock indices (US and Japan) do not reject the EMH
Sobreiro et al (2016) studied the profitability of MACD RSI and algorithm trading
rules in Brazil Russia India China and South Africa (BRICS) and emerging
markets and concluded that moving averages outperformed the buy-and-hold
strategy in most of the emerging markets except Brazil Russia and Argentina Yu et
al (2013) examined the profitability of technical trading rules in seven Asian
markets including Indonesia Malaysia Singapore The Philippines Thailand Hong
Kong and Japan Fixed and variable moving average and trading range breakout
rules were employed and concluded that technical trading tools were more powerful
in emerging markets than in developed markets However profits from technical
analysis disappeared after transaction costs Similarly Heng and Niblock (2014)
examined the predictive power of technical analysis for stock index futures of
Indonesia Malaysia Thailand and The Philippines They employed EMA and
MACD and found emerging markets were slowly reaching its informational
efficiency after considering the transaction cost In contrast Ming-Ming and Siok-
Hwa (2006) found that Fixed Moving Averages (FMAs) in China Thailand
Taiwan Malaysian Singaporean Hong Kong Korean and Indonesian stock
markets were profitable
From a contextual perspective research on profitability of technical trading
analyses is limited in the Indian context Sehgal and Gupta (2007) evaluated the
economic feasibility of technical analysis using individual stock data and found the
technical trading strategy failed to outperform the passive strategy irrespective of
Muruganandan
29
market cycle conditions They used the daily closing price and volume information
of 65 companies constituted in BSE 100 index for the period from January 1999 to
December 2004 They concluded that past price and volume information of large
size companies were immediately incorporated in current price as these stocks were
tracked by several investors and fund managers Gunasekarage and Power (2001)
applied variable length moving average and fixed length moving average in South
Asian stock markets and generated excess returns in Colombo Stock Exchange
(CSE) Dhaka Stock Exchange (DSE) and Karachi Stock Exchange (KSE) whereas
Bombay Stock Exchange (BSE) supported the EMH Sehgal and Garhyan (2002)
examined the On Balance Volume (OBV) technical analysis with transaction cost
using daily data of 21 companies listed in BSE for the period from April 1996 to
March 1998 The result supports the technical analysis and rejects the EMH Mitra
(2011) analysed the profitability of moving average in Indian stock index for the
period from 1998 to 2008 He predicted the direction of index movement using
moving average but failed to deliver positive return after transaction costs Kulkarni
and Mode (2014) and Khatua (2016) examined the MACDrsquos prediction ability of
individual stocks and supported the technical analysis However these studies
considered limited data with a small number of companies and ignored the risk
adjusted return in Indian context
Significant earlier studies support the EMH and reject the technical analysis in
developed markets at least in weak form (Allen amp Karjalainen 1999 Chang et al
2004 Hudson et al 1996 Gencay 1998 Neftci 1991 Tian et al 2002) On the
contrary studies in emerging markets concluded that technical analysts in emerging
markets were able to make profit than their counterparts in developed markets
(Balsara et al 2007 Chang et al 2004 Chiang et al 2012 Ming-Ming et al
2002 Metghalchi et al 2019 Ni et al 2020) This may be due to the inherent
characteristics of emerging markets such as weak competition inefficient legal
systems absence of strong supervising institutions less market participants and lack
of infrastructure for information dissemination On the other hand the most recent
studies question the profitability of technical trading rules in emerging markets after
considering transaction costs (Heng amp Niblock 2014 Sehga amp Gupta 2007
Tharavanji et al 2015 Yu et al 2013 Zhu et al 2015) Nazario et al (2017)
consolidated the outcome of 85 research papers in a scientific way and concluded
that a considerable number of research papers favour weak form of market
efficiency without considering the risk adjusted return However Marshall Cahan
and Cahan (2008) survey of market participants indicates that stock traders and
investors place more emphasis on technical analysis than fundamental factors
Colombo Business Journal 11(1) 2020
30
This existing discrepancy in literature demands research on emerging marketsrsquo
information efficiency in the recent past Further the ability of technical trading
rules to predict stock returns is inadequately researched in emerging markets
Hence this study attempts to analyse the profitability of technical trading rules in
economically dynamic and rapidly growing emerging markets such as India
Further the total study period was classified as Bull and Bear market and employed
risk adjusted performance measures like Sharpe ratio ratio of average profit to
average loss and percentage of profitable trade to have a microscopic view on the
performance of technical analysis in the Indian context
Data and Methodology
This empirical study covers the period from February 2000 to May 2018 and the
total study period is categorised into Bull and Bear market as per Lokeshwarri
(2017) which is shown in Table 1 and supported by Figure1
Table 1 Cyclical Bull and Bear Phases in Sensex
Start Date End Date Change in
percentage Category
Time in
Months
Feb ndash 2000 Sep ndash 2001 -5781 Bear ndash 1 19
Sep ndash 2001 May ndash 2003 1310 Sideway ndash 1 20
May ndash 2003 Jan ndash 2008 62263 Bull ndash 1 56
Jan ndash 2008 Mar ndash 2009 -6205 Bear ndash 2 13
Mar ndash 2009 Nov ndash 2010 16231 Bull ndash 2 20
Nov ndash 2010 Aug ndash 2013 -1734 Sideway ndash 2 33
Aug ndash 2013 Mar ndash 2015 7208 Bull ndash 3 19
Mar ndash 2015 Feb ndash 2016 -2508 Bear ndash 3 11
Feb ndash 2016 May ndash 2018 5560 Bull ndash 4 27
Source Lokeshwarri (2017)
The daily opening closing high and low values for BSE Sensex were extracted
from BSE data base The widely used trading rules such as Relative Strength Index
(RSI) and Moving Average Convergence and Divergence (MACD) are employed to
generate Buy Hold and Sell signals which are explained below
Figure 1 Bull and Bear Phases of BSE Sensex during the Study Period
112002112001112000
6000
4500
3000
112003112002
3500
3000
2500
112008112006112004
20000
1700015000
10000
5000
2000
112009712008112008
20000
15000
10000
112011112010112009
20000
15000
10000
112014112013112012112011
20000
17500
15000
112015112014
30000
25000
20000
112016912015512015112015
30000
27500
25000
112018112017112016
35000
30000
25000
Bear 1 Sideway 1 Bull 1
Bear 2 Bull 2 Sideway 2
Bull 3 Bear 3 Bull 4
Mu
rug
an
and
an
31
Colombo Business Journal 11(1) 2020
32
Relative Strength Index (RSI)
RSI is a technical indicator which used to identify the overbought and oversold
condition of financial securities First relative strength is calculated by dividing the
simple average of closing values on up days by the average of closing values on
down days over a given period of time which is 14 days in this study The step-by-
step trading decision based on RSI is demonstrated as follows
Steps in generating Buy Hold and Sell Signals
1 Input Closing (119862119905) and Opening (119874119905) value of the Index on day t
2 Up Days (119880119905) 119862119905 119894119891 (119862119905 minus 119862119905minus1) gt 0 119890119897119904119890 0
3 Down Days (119863119905) 119862119905 119894119891 (119862119905 minus 119862119905minus1) lt 0 119890119897119904119890 0
4 Relative Strength (119877119878)
119877119878119905 =
sum 119880119905 119894=119905minus(119899minus1)119894=119905
119899
sum 119863119905 119894=119905minus(119899minus1)119894=119905
119899
5 Relative Strength Index (119877119878119868119905)
119877119878119868119905 = 100 minus (100
1 + 119877119878119905)
6 Trading Decision1 119861119906119910 119874119905+1
119894119891119877119878119868119905 gt 30 amp 119877119878119868119905minus1 le 30
Else
119878119886119897119890 119874119905+1
119894119891 119877119878119868119905 gt 70 amp 119877119878119868119905minus1 le 70
Or
Hold
7 Output Calculation of Return
119894119891 119887119906119910 119874119905+1 =
(119897119900119892(119862119905+1) minus 119897119900119892(119874119905+1))
119894119891 119878119886119897119890 119874119905+1 =
(119897119900119892(119874119905+1) minus 119897119900119892(119862119905+1))
1 The trading rules were applied as per Welles (1978) Henderson (2002) and Rosillo et al
(2013) Unlike previous studies in order to imitate the real time stock trading scenario
opening and closing values were considered for executing the trading signals and calculation
of return
Muruganandan
33
Moving Average Convergence and Divergence (MACD)
MACD is constructed based on historical exponential moving average of
closing value of index to identify the trend changes in its value It is computed
based on the difference between longer exponential moving averages (26 days)
from a shorter exponential moving average (12 days) In addition nine days simple
moving average of MACD is used as a sign to generate buy and sell signals Step-
by-step trading decision is presented as follows
Steps in generating Buy Hold and Sell Signals
1 Input Closing (119862119905) and Opening (119874119905) value of the Index on day t
2 Exponential Moving Average
119899 = 12 119886119899119889 26 119889119886119910119904 119891119900119903 119904ℎ119900119903119905 119886119899119889 119897119900119899119892 119864119872119860 119903119890119904119901119890119888119905119894119907119890119897119910
119864119872119860119905(119899) = sum (2
1+119899)
119894=119905minus(119899minus1)119894=119905 times 119862119905 + (1 minus
2
1+119899) times 119864119872119860119905minus1(119899)
3 119872119860119862119863 119864119872119860119905(119878ℎ119900119903119905119890119903) minus 119864119872119860119905(119871119900119899119892119890119903)
4 Signal Line 119878119894119892119899119905 = 1198781198721198609(119872119860119862119863)
5 Trading Decision2 119861119906119910 119874119905+1
119894119891119872119860119862119863119905 lt 0 119878119894119892119899119905 lt 0 amp 119878119894119892119899119905 gt 119872119860119862119863119905
Else
119878119886119897119890 119874119905+1
119894119891119872119860119862119863119905 gt 0 119878119894119892119899119905 gt 0 amp 119878119894119892119899119905 lt 119872119860119862119863119905
Or
Hold
6 Output Calculation of Return
119894119891 119887119906119910 119874119905+1 =
(119897119900119892(119862119905+1) minus 119897119900119892(119874119905+1))
119894119891 119878119886119897119890 119874119905+1 =
(119897119900119892(119874119905+1) minus 119897119900119892(119862119905+1))
Further the following hypotheses were framed to test whether returns of buy or
sell signals are different from the unconditional mean return and also whether the
mean buy signal return is different from mean sell signal return The null and
alternative hypotheses of the study are stated in Table 2
2 The trading rules were applied as per Rosillo et al (2013) Unlike previous studies in
order to imitate the real time stock trading scenario opening and closing values were
considered for executing the trading signals and calculation of return
Colombo Business Journal 11(1) 2020
34
Table2 Hypotheses of the Study
Buy-Unconditional
Return
Sell-Unconditional
Return
Buy ndash Sell
Return
Ho 120583119861 minus 120583119880 = 0 120583119878 minus 120583119880 = 0 120583119861 minus 120583119878 = 0
Ha 120583119861 minus 120583119880 ne 0 120583119878 minus 120583119880 ne 0 120583119861 minus 120583119878 ne 0
After the formulation of hypotheses t-statistics were used to test the null
hypothesis of equality between unconditional mean return (120583) and mean return of
trading rules (120583119903) which is specified in Equation 1
119905119903 = 120583119887119906119910 (119904119890119897119897)minus120583
radic120590119887119906119910( 119904119890119897119897)
2
119873119887119906119910(119904119890119897119897)+
1205902
119873
(1)
where 120583119887119906119910 (119904119890119897119897) is the mean technical trading return of buy or sell 119873119887119906119910(119904119890119897119897) is the
number of trades for the buy or sell signal 120583 and N are the unconditional mean
return and number of observations respectively and 1205902 is the estimated sample
variance In testing long-short strategies (buy-sell) t-statistics is computed as
follows
119905119887119906119910minus119904119890119897119897 = 120583119887119906119910minus120583119904119890119897119897
radic120590119861119906119910
2
119873119861119906119910+
1205901198781198901198971198972
119873119878119890119897119897
(2)
where 120583119887119906119910 and 120583119904119890119897119897 are the mean returns of buy signal and sell signals 120590119861119906119910 and
120590119878119890119897119897 are the estimated sample standard deviations of buy and sell signals
respectively 119873119861119906119910 and 119873119878119890119897119897 are the number of buy and sell signals respectively
Performance Measures
Sharpe Ratio
Reward to total risk is calculated using Sharpe Ratio which measures the
expected return to per unit of total risk taken In the perspective of trading the
standard Sharpe ratio is modified by excluding the risk free rate by assuming that
the trader needs to maintain the liquidity and not investing in risk free rate Hence
Sharpe ratio is calculated as per Equation 3
119878ℎ119886119903119901119890 119877119886119905119894119900 (119878119877) =
120590119877 (3)
Muruganandan
35
where and 120590119877 are respectively the expected return and the total risk of a trading
rule in a given period Higher the ratio superior the performance indicated by it
Ratio of Average Profit to Average Loss (APAL)
This ratio is calculated by dividing the average profit from profitable trade by
average loss from the unprofitable trade The ratio of more than one indicates on
average the trading system correctly predicts the price movement than misleading
the traders Hence a higher ratio indicates the superior ability of the technical
trading rules to predict the future price movement The absolute value of this ratio is
calculated as per Equation 4
119860119875
119860119871= |
119860119907119890119903119886119892119890 119875119903119900119891119894119905
119860119907119890119903119886119892119890 119897119900119904119904| (4)
Percentage of Profitable Trade ( of PT)
This ratio indicates the proportion of profitable trade to total trade signal High
percentage indicates that the trading system identifies price change more accurately
This ratio considers the number of profitable trade to total trading signals and
ignores the value of profit (loss) earned (incurred) This performance metric is
calculated as per Equation 5
119900119891 119875119879 = 119873119906119898119887119890119903 119900119891 119875119903119900119891119894119905119886119887119897119890 119879119903119886119889119894119899119892
119879119900119905119886119897 119873119906119898119887119890119903 119900119891 119879119903119886119889119894119899119892 119904119894119892119899119886119897119904 (5)
Results and Discussion
The summary statistics for the unconditional intraday return for the entire
sample period and the nine non-overlapping sub-periods are presented in Table 3
The intraday mean returns for the entire sample period and for the sub-periods are
negative except for the period Bull-2 Bear-2 period exhibits the highest standard
deviation of 001009 Both highest (0030) and lowest (-0047) daily return for the
entire study period recorded in Bull-1 period The high value of Kurtosis indicates
that the intraday return of BSE Sensex is not normally distributed and there are
outliers However when the market is moving in the Sideway the intraday returns
become more or less normally distributed as evidenced from the low Kurtosis The
evidence of excessive Kurtosis in Bull period indicates that the unconditional
intraday returns were leptokurtic with thicker tails than the Bear and Sideway
markets Hence the variance during Bull periods results from the outliers The
Colombo Business Journal 11(1) 2020
36
negative skewness indicates that the unconditional daily returns were moderately
negatively skewed except for Sideway-1
Table 3 Descriptive Statistics for Unconditional Intraday Return
Cycle Mean Standard
deviation Kurtosis Skew Min Max Count
Overall -000041 000576 48482 -0531 -0047 0030 4545
Bear ndash 1 -000119 000855 12148 -0286 -0035 0026 437
Sideway ndash 1 -000042 000451 06693 0028 -0018 0015 411
Bull ndash 1 -000015 000605 5415 -0785 -0047 0030 1165
Bear ndash 2 -000093 001009 09469 -0359 -0038 0024 280
Bull ndash 2 000025 000583 22848 0049 -0028 0025 411
Sideway ndash 2 -000049 000423 0568 -0217 -0016 0011 679
Bull ndash 3 -000032 000349 22438 -0127 -0018 0012 381
Bear ndash 3 -000098 000406 09085 -0630 -0016 0009 225
Bull ndash 4 -000028 000279 3073 0332 -0009 0016 556
Note Unconditional intraday return defined as the log difference of closing value to opening value by
assuming that the trader buys at the opening value and sells at the closing value
The result of RSI trading rule for BSE Sensex is presented in Table 4 The first
two columns exhibit the number of buy (119873119861) and sell (119873119878) signals generated using
RSI trading rules for the overall period and non-overlapping sub-sample periods
Third and fourth column show the average buy (120583119861) and sell (120583119878) returns along
with t-test in parenthesis The basic assumption of t-test is that the observations are
normally distributed However Table 1 reveals that the returns were not normally
distributed which may question the validity of t-test results and its interpretations In
order to overcome this phenomenon Brock et al (1992) suggested the bootstrap
method developed by Efron (1979) Hence this paper employs the bootstrap
method adopted by McKenzie (2007) which mimics the procedure followed by
Brock et al (1992) Bootstrap process was repeated for 500 times and the resultant t
values and corresponding p values are reported in parentheses and square brackets
respectively However the acceptance and rejection of hypothesis were similar both
in bootstrap p values and t-test In addition standard deviation of buy and sell
signals and the mean difference between buy and sell signals are also presented in
the column five six and seven respectively
Muruganandan
37
Table 4 Statistical Results for RSI Trading Rule
Category NB NS microB microS σB σS microB - microS
Overall 116 178
-000065
(-0352)
[0739]
000003
(1308)
[0232]
000729 000434
-000068
(-0905)
[0367]
Bear ndash 1 15 13
-000002
(0489)
[0645]
00025
(2150)
[0066]
000908 000601
-000252
(-0876)
[0401]
Sideway ndash 1 14 16
-000051
(-0084)
[0946]
000065
(0859)
[0419]
000406 00049
-000116
(-0711)
[0499]
Bull ndash 1 15 54
-000199
(-0801)
[0445]
-00009
(-1273)
[0186]
000892 000414
-00011
(-0464)
[0617]
Bear ndash 2 17 7
000031
(0439)
[0661]
00009
(0488)
[0631]
001134 000979
-000059
(-0128)
[0876]
Bull ndash 2 5 21
000486
(1624)
[0076]
-000039
(-0601)
[0599]
00063 000474
000525
(1749)
[0071]
Sideway ndash 2 26 19
-000165
(-0969)
[0325]
-000009
(0831)
[0411]
0006 000205
-000156
(-1231)
[0246]
Bull ndash 3 4 16
-000121
(-0949)
[0355]
-000037
(-0063)
[0952]
000184 000294
-000084
(-0713)
[0476]
Bear ndash 3 13 5
-000149
(0415)
[0681]
000214
(1296)
[0124]
000373 000279
-00036
(-1357)
[0185]
Bull ndash 4 7 27
00000032
(0334)
[0729]
000037
(1533)
[0162]
000218 000208
-000037
(-0395)
[0691]
Notes 1 NB and NS denote the number of buy and sell signals during the period respectively microB and
microS denote the average return of buy and sell signals respectively σB and σS denote the
standard deviation of buy and sell signal returns respectively
2 Numbers in parentheses are t values and numbers in square brackets are the bootstrap p
values
Colombo Business Journal 11(1) 2020
38
RSI generates more sell signals than buy signals during the Bull market On the
contrary during the Bear and Sideway market RSI produced higher number of buy
signals than sell signals Since RSI has the upper band of 100 if the stock price goes
up continuously RSI remains in the overbought regime and produce more number
of sell signals than buy signals In this case a trader shorting the opportunity based
on RSI sell signals may not make profit as the price will move to the differentother
orbit On the other hand if the stock price goes down continuously the RSI
generates more number of buy signals than the sell signals as opposed to the current
price movement Hence the application of RSI during the long Bull and Bear
markets may not help the trader to make profit even before adjusting the transaction
cost From the result of t-test and bootstrap p values it can be concluded that buy
and sell signals does not reject the null hypothesis that the mean return of buy or sell
signals is not significantly different from the unconditional mean return Moreover
averages of buy signal returns and sell signal returns are not significantly different
from each other These results provide evidence of the existence of weak form
efficiency across the market cycle Hence it can be concluded that traders cannot
outperform the market using the RSI signals during the upward or downward
movement of the market
Table 5 Performance of RSI Trading Signal
Category
Buy Signal Performance Sell Signal Performance
SR APAL of
PT SR APAL
of
PT
Overall -00892 1007 4397 00069 10669 4888
Bear ndash 1 -00022 1489 4000 04160 14933 6923
Sideway ndash 1 -01256 0529 5714 01327 13950 5000
Bull ndash 1 -02242 0896 4000 -02174 10832 3519
Bear ndash 2 00273 1203 4706 00919 09491 5714
Bull ndash 2 07714 1766 8000 -00823 07273 5238
Sideway ndash 2 -02750 0781 3846 -00439 09970 4737
Bull ndash 3 -06576 0298 2500 -01259 07136 5000
Bear ndash 3 -02601 0742 4000 02294 13570 5938
Bull ndash 4 00014 1338 4286 01779 10837 5926
Note SR denotes the Sharpe Ratio APAL denotes the ratio of average profit to average loss
of PT denotes the percentage of profitable trade to total trading signal
Muruganandan
39
Table 5 exhibits the results of Sharpe Ratio (SR) average profit to average loss
ratio (APAL) and percentage of profitable trade to total trading signals For the
overall study period and almost all sub-samples periods buy signal underperforms
the sell signal as per the modified Sharpe ratio The absolute value of average profit
to average loss more than one indicates that the average of profitable trade is more
than the average of unprofitable trade However percentage of profitable trade less
than 50 indicates that RSI generate a higher number of unprofitable trades than
profitable trade Hence average return on buy signal is negative for the overall
study period and for six out of nine sub-sample periods On the other hand RSI sell
signal generated the positive Sharpe ratio for overall period and five out of nine sub-
sample periods Profitable trade to total trade signal indicates sell signal produced
more profitable trade in all sub-sample period except Bull-1 and Sidway-1 market
Though percentage of profitable trade to total trade for overall period is less than
50 (ie 4888) which indicate that the number of unprofitable trades is higher
than the profitable trades the profit per profitable trade is sufficiently enough to
compensate the loss in unprofitable trade The sell signal trading strategy makes
money not only from correctly predicting the market movement but also minimising
the loss quickly and allows the profit to run
The Table 6 exhibits the statistical results for the MACD trading rules During
the study period MACD generated 1522 sell signals and 858 buy signals with the
average return of 000861 and -000128 respectively The standard deviations of buy
signal returns (00179) and sell signal returns (001068) are also presented along
with mean return difference between buy and sell signals (-00021) Buy signal
produced the average negative return for all the sub-sample periods and they were
also not significantly different from the average unconditional mean return Hence
the null hypothesis was accepted and it can be concluded that buy signal produced a
return similar to that of unconditional intraday return However the sell signal
generated positive average return for the overall period and all sub-sample periods
except Bull-2 period In contrast the sell signal returns were significantly different
for the overall period and five out of nine sub-sample periods
Table 6 Statistical Results for MACD Trading Rule
Category NB NS microB microS σB σS microB -microS
Overall 858 1522
-000128
(-142)
[0170]
0000861
(443)
[0002]
0017908 0010686
-000215
(-3203)
[0008]
Colombo Business Journal 11(1) 2020
40
Category NB NS microB microS σB σS microB -microS
Bear ndash 1 141 59
-000021
(0494)
[0631]
0006379
(317)
[0002]
0023008 0018028
-000659
(-2165)
[0036]
Sideway ndash 1 131 71
-000226
(-1524)
[0142]
0000543
(0623)
[0509]
0013614 001285
-000281
(-1452)
[0162]
Bull ndash 1 85 581
-000004
(0043)
[0962]
0000196
(0703)
[0483]
0023623 0011
-000023
(-0090)
[0908]
Bear ndash 2 109 33
-000350
(-0989)
[0337]
0004699
(231)
[0036]
0026444 0013532
-00082
(-2371)
[002]
Bull ndash 2 39 192
-000031
(-0224)
[0816]
-000085
(-1066)
[0311]
0015615 0013721
0000532
(0198)
[0838]
Sideway ndash 2 166 171
-000035
(0171)
[0852]
000195
(375)
[0002]
0011182 0008263
-00023
(-2141)
[0032]
Bull ndash 3 32 165
-000171
(-0514)
[0591]
0000902
(220)
[0028]
0015215 0006737
-000261
(-0952)
[0291]
Bear ndash 3 88 25
-000146
(-0457)
[0643]
0004442
(341)
[0002]
0009516 0007832
-000591
(-3164)
[0004]
Bull ndash 4 67 225
-000205
(-1306)
[0188]
0000871
(2905)
[0008]
0011064 0005643
-000292
(-2080)
[004]
Notes 1 NB and NS denote the number of buy and sell signals during the period respectively microB
and microS denote the average return of buy and sell signals respectively σB and σS denote the
standard deviation of buy and sell signal returns respectively
2 Numbers in parenthesis are t-values and numbers in square brackets are the bootstrap p
values
3 denotes p lt 05
The risk measured by standard deviation is higher in buy signal than sell signal
trading rules for the entire study period and for all the sub-sample periods This
clearly indicates that the trading on buy signal is riskier than the sell signal
Moreover the sell signal average returns were significantly different from the
Muruganandan
41
average buy signal returns in all the Bear market periods and for the overall study
period This result supports the sell signal over buy signal specifically during the
Bear market phases This result sharply contradicts to Tharavanij et al (2015) who
found buy signals outperform the sell signals in Southeast Asian markets
Sharpe ratio average profit to average loss ratio and percentage of profitable
trade to total trade signal for MACD trading rule are presented in Table 7 For the
buy signals percentage of profitable trade to total trade has more than 50 in four
out of nine sub-sample periods but average profit to average loss is less than one
which implies that the profit from correctly predicting market direction is not
sufficient enough to cut down the loss from the failure to predict market direction
Hence Sharpe ratios for all sub-sample periods and the entire study period were
negative However the sell signals correctly predict the market with highest
percentage of profitable trade to total trade of 80 in Bear-3 period Moreover
with less ability to predict market direction in Sideway-1 (4789) and Bull-1
(4905) periods sell signal generated profit to cut down the loss from unprofitable
trade which results in average profit to average loss ratio of more than one for
Sideway-1 (122) and Bull-1 (109) period Overall the result supports the sell
signals over buy signals before considering the transaction costs in the Indian
context
Table 7 Performance of MACD Trading Signal
Category
Buy Signal Performance Sell Signal Performance
SR APAL of
PT SR APAL
of
PT
Overall -0072 0897 47669 008 106 5414
Bear ndash 1 -0009 1110 46809 035 219 5763
Sideway ndash 1 -0166 0701 47328 004 122 4789
Bull ndash 1 -0002 0805 55294 002 109 4905
Bear ndash 2 -0133 0940 43119 035 115 6667
Bull ndash 2 -0020 0734 56410 -006 084 5000
Sideway ndash 2 -0031 1122 45181 024 108 6374
Bull ndash 3 -0112 0563 56250 013 100 5879
Bear ndash 3 -0154 0682 50000 057 108 8000
Bull ndash 4 -0185 0827 41791 015 116 5644
Note SR denotes the Sharpe Ratio APAL denotes the ratio of average profit to average loss
of PT denotes the percentage of profitable trade to total trading signal
Colombo Business Journal 11(1) 2020
42
Conclusion
This paper examines the profitability of RSI and MACD technical trading rules
in the Indian market across market cycles BSE Sensex data for the period from
February 2000 to May 2018 were collected from BSE data base and classified into
nine non-overlapping periods as Bull and Bear markets based on the index
movement The t-tests were applied to test the hypothesis that returns from technical
trading rules were not significantly different from the unconditional daily returns In
addition Sharpe ratio average profit to average loss ratio and percentage of
profitable trade to total trade signal were also employed to have a microscopic view
on technical trading rules
Results support the weak-form efficient theory as RSI failed to deliver the
positive returns even before deducting the transaction costs RSI buy and sell signal
returns were not significantly different from the unconditional intraday return In
terms of market timing RSI wrongly predict the market movement and delivered
the percentage of profitable trade to total trade less than 50 Moreover profitable
trades were insufficient to overcome the loss from unprofitable trade Hence buy
signal generated a negative average return and sell signal posted a low positive
average return before deducting transaction costs Therefore after deducting
transaction costs RSI may not leave any profit in the hands of traders
MACD sell signal produced significant positive returns compared to buy signal
and unconditional intraday return However as per Sharpe ratio MACD sell signal
failed to produce the return in line with risk taken Sharpe ratio of less than one
indicates that risk associated with the technical trading rule is more than the return
generated by RSI and MACD In addition even profitable MACD sell signal does
not help in market timing It makes money from higher average profit from
profitable trade than average loss from unprofitable trade However MACD does
not help to reduce the unprofitable trade Hence the study concludes that the trader
cannot earn abnormal return consistently with the help of RSI and MACD across
market cycle in the Indian context RSI and MACD are very old and yet still widely
used as technical tools in real time stock price prediction On the other hand latest
development in information technology and changes in legal systems may have
helped the market to absorb RSI and MACD signals in current price with no time
and cost However in order to empirically validate this assumption a future study
may be extended using a proxy for information technology development and its
impact on trading rules across industries and individual stocks in emerging markets
Muruganandan
43
Declaration of Conflict of Interest
The author declared no potential conflict of interest with respect to the research
authorship and publication of this article
Acknowledgement
I would like to thank anonymous reviewers for their valuable suggestions
References
Allen F amp Karjalainen R (1999) Using genetic algorithms to find technical
trading rules Journal of Financial Economics 51(2) 245ndash271
httpsdoiorg101016S0304-405X(98)00052-X
Almujamed H I Fifield S amp Power D (2013) An investigation of the role of
technical analysis in Kuwait Qualitative Research in Financial Markets 5(1)
43ndash64 httpsdoiorg10110817554171311308959
Anghel G D I (2015) Stock market efficiency and the MACD Evidence from
countries around the world Procedia Economics and Finance 32 1414ndash1431
httpsdoiorg101016S2212-5671(15)01518-X
Atanasova C V amp Hudson R S (2010) Technical trading rules and calendar
anomalies mdash Are they the same phenomena Economics Letters 106(2) 128ndash
130 httpsdoiorg101016jeconlet200911001
Balsara N J Chen G amp Zheng L (2007) The Chinese stock market An
examination of the random walk model and technical trading rules Quarterly
Journal of Business amp Economics 46(2) 43ndash63 httpswwwjstororgstable
40473435
Balsara N Chen J amp Zheng L (2009) Profiting from a contrarian application of
technical trading rules in the US stock market Journal of Asset Management
10(2) 97ndash123 httpsdoiorg101057jam200844
Brock W Lakonishok J amp LeBaron B (1992) Simple technical trading rules
and stochastic properties of stock returns The Journal of Finance 47(5) 1731ndash
1764 httpsdoiorg101111j1540-62611992tb04681x
Chang E J Lima E J A amp Tabak B M (2004) Testing for predictability in
emerging equity markets Emerging Markets Review 5(3) 295ndash316
httpsdoi101016jememar200403005
Chiang Y-C Ke M-C Liao T L amp Wang C D (2012) Are technical trading
strategies still profitable - Evidence from the Taiwan Stock Index Futures
Market Applied Financial Economics 22(12) 955ndash965 httpsdoiorg
101080096031072011631893
Chong T T-L amp Ng W-K (2008) Technical analysis and the London stock
exchange Testing the MACD and RSI rules using the FT30 Applied
Colombo Business Journal 11(1) 2020
44
Economics Letters 15(14) 1111ndash1114 httpsdoiorg10108013504850600
993598
Cohen G amp Cabiri E (2015) Can technical oscillators outperform the buy and
hold strategy Applied Economics 47(30) 3189ndash3197 httpsdoiorg101080
0003684620151013609
Efron B (1979) Bootstrap methods Another look at the Jackknife The Annals of
Statistics 7(1)1ndash26 httpsprojecteuclidorgeuclidaos 1176344552
Fama (1970) Efficient capital markets a review of theory and empirical work
Journal of Finance 25(2) 383-417 httpswwwjstororgstable2325486
Gencay R (1998) The predictability of security returns with simple technical
trading rules Journal of Empirical Finance 5(4) 347ndash359 httpsdoiorg
101016S0927-5398(97)00022-4
Gunasekarage A amp Power D M (2001) The profitability of moving average
trading rules in South Asian stock markets Emerging Markets Review 2(1)
17ndash33 httpsdoiorg101016S1566-0141(00)00017-0
Henderson C (2002) Currency strategy The practitionerrsquos guide to currency
investing hedging and forecasting John Willy amp Sons
Heng P amp Niblock S J (2014) Trading with tigers A technical analysis of
Southeast Asian stock index futures International Economic Journal 28(4)
679ndash692 httpsdoiorg101080101687372014928895
Hudson R Dempsey M amp Keasey K (1996) A note on weak form efficiency of
capital markets The application of simple technical trading rules to UK stock
prices- 1935-1994 Journal of Banking and Finance 20(6) 1121ndash1132
httpsdoiorg1010160378-4266(95)00043-7
Jensen M C amp Benington G A (1970) Random walk and technical theories
Some additional evidence Journal of Finance 25 469ndash482
httpswwwjstororgstable2325495
Krausz J Lee S-Y amp Nam K (2009) Profitability of nonlinear dynamics
under technical trading rules Evidence from Pacific basin stock markets
Emerging Markets Finance amp Trade 45(4) 13ndash35 httpsdoiorg102753
REE1540-496X450402
Khatua A (2016) An application of moving average convergence and divergence
(MACD) indicator on selected stocks listed on National Stock Exchange (NSE)
httpdxdoiorg102139ssrn2872665
Kulkarni A D amp More A (2014) An application of moving average convergence
divergence (MACD) indicator on selected stocks listed on Bombay Stock
Exchange (BSE) Oriental Journal of Computer Science and Technology 7(3)
396ndash400 httpwwwcomputerscijournalorgp=1500
Lokeshwarri S K (2017 April 07) The big story ndash Sit back go passive The Hindu
Business Line (Coimbatore Edition) p 2
Muruganandan
45
Marshall B R Cahan R H amp Cahan J M (2008) Does intraday technical
analysis in the US equity market have value Journal of Empirical Finance
15(2) 199ndash210 httpsdoiorg101016jjempfin200605003
Marshall B R Young M R amp Cahan R (2008) Are candlestick technical
trading strategies profitable in the Japanese equity market Review of
Quantitative Finance and Accounting 31(2) 191ndash207 httpsdoiorg101007
s11156-007-0068-1
Metghalchi M Chen C-P Hajilee M (2016) Moving average trading rules for
NASDAQ composite index Applied Finance Letters 5(2) 45ndash57
httpsdoiorg1024135aflv5i254
Metghalchi M amp Hayes L A Niroomand F (2019) A technical approach to
equity investing in emerging markets Review of Financial Economics 37(3)
389ndash403 httpsdoiorg101002rfe1041
McKenzie M D (2007) Technical trading rules in emerging market and the 1997
Asian currency crises Emerging Market Finance and Trade 43(4) 46ndash73
httpsdoiorg102753REE1540-496X430403
Ming-Ming L Balachandher K G amp Nor F M (2002) An examination of the
random walk model and technical trading rules in the Malaysian stock market
Quarterly Journal of Business amp Economics 41(1) 81ndash104
httpswwwjstororgstable40473346
Ming-Ming L amp Siok-Hwa L (2006) The profitability of the simple moving
averages and trading range breakout in the Asian stock markets Journal of
Asian Economics 17(1) 144ndash170 httpsdoiorg101016jasieco200512001
Mitra S K (2011) How rewarding is technical analysis in Indian stock market
Quantitative Finance 11(2) 287ndash297 httpsdoiorg101080
14697680903493581
Nazario R T F Silva J L amp Sobrero V A (2017) A literature review of
technical analysis on stock markets The Quarterly Review of Economics and
Finance 66 115ndash126 httpsdoiorg101016jqref201701014
Neftccedili S N (1991) Naiumlve trading rules in financial markets and Wiener-
Kolmogorov prediction theory A study of ldquotechnical analysisrdquo Journal of
Business 64(4) 549ndash571
Ni Y Day M-Y Huang P ampYu S-R (2020) The profitability of Bollinger
Bamps Evidence from the constituent stocks of Taiwan 50 Physica A Statistical
Mechanics and Its Applications Advance online publication httpsdoiorg
101016jphysa2020124144
Nor S M amp Wickremasinghe G (2014) The profitability of MACD and RSI
trading rules in the Australian stock market Investment Management and
Financial Innovation 11(4) 194ndash199
Colombo Business Journal 11(1) 2020
46
Rosillo R de La Fuente D amp Brugos J A L (2013) Technical analysis and the
Spanish stock market Testing the RSI and MACD momentum and stochastic
rule using Spanish market companies Applied Economics 45(12) 1541ndash1550
httpsdoiorg101080000368462011631894
Sehgal S amp Garhyan A (2002) Abnormal returns using technical returns The
Indian experience Finance India 16(1) 181ndash203
Sehgal S amp Gupta M (2007) Tests of technical analysis in India Vision The
Journal of Business Perspective 11(3) 11ndash23 httpsdoiorg101177
097226290701100303
Sobreiro V A da Costa T R C C Nazaacuterio R T F e Silva J L Moreira E
A Filho M C L Kimura H amp Zambrano J C A (2016) The profitability
of moving average trading rules in BRICS and emerging stock markets North
American Journal of Economics and Finance 38 86ndash101 httpsdoiorg
101016jnajef201608003
Tian G G Wan G H amp Guo M (2002) Market efficiency and the returns to
simple technical trading rules New evidence from US equity market and
Chinese equity markets Asia-Pacific Financial Markets 9(3) 241ndash258
httpsdoiorg101023A1024181515265
Tharavanij P Siraprapasiri V amp Rajchamaha K (2015) Performance of
technical trading rules Evidence from Southeast Asian Stock Market
Springerplus 4552 httpsdoiorg101186s40064-015-1334-7
Wang J-L amp Chan S-H (2007) Stock market trading rule discovery using
pattern recognition and technical analysis Expert Systems with Applications
33(2) 304ndash315 httpsdoiorg101016jeswa200605002
Welles J Jr (1978) New concepts in technical trading systems Hunter Publishing
Company
Wong W-K Manzur M amp Chew B-K (2003) How rewarding is technical
analysis Evidence from Singapore stock market Journal of Applied Financial
Economics 13(7) 543ndash551 httpsdoiorg1010800960310022000020906
Yu H Nartea G V Gan C amp Yao L J (2013) Predictive ability and
profitability of simple technical trading rules Recent evidence from Southeast
Asian stock markets International Review of Economics and Finance 25 356ndash
371 httpsdoiorg101016jiref201207016
Zhu H Jiang Z-Q Li S-P amp Zhou W-X (2015) Profitability of simple
technical trading rules of Chinese stock exchange indexes Physica A
Statistical Mechanics and Its Applications 439 75ndash84 httpsdoiorg101016
jphysa201507032

Muruganandan
27
Moving Average (MA) and Trading Range Breakout (TRB) cannot beat the
standard buy-and-hold strategy for the Chinese stock exchange indexes
Metghalchi et al (2016) examined the profitability of Moving Average (MA)
RSI and MACD technical trading rules for NASDAQ Composite index from 1972
to 2015 and concluded that trading rules have strong predictive power However
the predictability of trading rules reduced in the recent past sub-sample period from
2005 to 2015 and generated negative return after deducting transaction cost
Metghalchi et al (2019) examined the profitability of Technical Analysis (TA) for
the Morgan Stanly Capital International (MSCI) Emerging Market Index (EMI)
over the period of November 1988 to January 2018 They found strong empirical
evidence for TA even after considering risk and transaction cost using technical
tools like Moving Average RSI MACD and Rate of Change Chong and Ng (2008)
examine the strength of MACD and RSI using 60 years data of the London Stock
Exchange FT30 Index and concluded that trading rules generate higher return than
simple buy-and-hold strategy Atanasova and Hudson (2010) identified the
interaction between technical trading rules and calendar anomalies for Dow Jones
Index from 1897 to 2009 and concluded that the predictability of trading rule
reduced to a greater extent after removing the calendar anomalies
Krausz et al (2009) concluded that nullifying the profits from technical trading
rules is merely impossible as long as stock information is asymmetric Balsara et al
(2009) found that the moving average crossover rule the channel breakout rule and
the Bollinger band breakout rule underperform the buy-and-hold strategy between
1990 and 2007 However they observe significant positive returns on trades
generated by the contrarian version of these three technical trading rules even after
considering a 05 transaction costs on all trades Wong et al (2003) studied the
profitability of MACD and RSI technical indicators in Singapore stock market and
found that technical indicators offered significant positive returns
Marshall Young and Cahan (2008) concluded that candlestick technical trading
strategies for Japanese stock market failed to add value in both Bull or Bear
markets Wang and Chan (2007) empirical results indicate that the technical trading
rules correctly predict the direction of changes in the NASDAQ and Taiwan
Weighted Index (TWI) Nor and Wickremasinghe (2014) investigated the
profitability of MACD and RSI and concluded that Australian investors can make
consistent abnormal return with technical trading rules Chiang et al (2012) found
that the technical analysis helped to earn profits even after deducting transaction
Colombo Business Journal 11(1) 2020
28
costs in Taiwan Cohen and Cabiri (2015) employed DJI FTSE NK225 and TA100
index data for the period from 2007 to 2012 and found RSI and MACD
outperformed the indices in Bear market and delivered negative return during Bull
market
Anghel (2015) tested the profitability of Moving Average Convergence and
Divergence (MACD) with 1336 stocks of 75 countries with temporal data from 1st
of January 2001 to 31st of December 2012 The study found that certain companies
delivered risk adjusted abnormal return even after deducting trading cost and
rejected the random walk hypothesis for many countries Tian et al (2002) found
that technical trading rules have less power in the US stock market to earn profit
whereas the Chinese market gives profit even after deducting trading cost Chang et
al (2004) examined the power of simple Moving average trading rules in 11
emerging and developed markets (US and Japan) and suggested that emerging
equity indices exhibit the scope to earn abnormal return with technical trading rules
whereas developed countriesrsquo stock indices (US and Japan) do not reject the EMH
Sobreiro et al (2016) studied the profitability of MACD RSI and algorithm trading
rules in Brazil Russia India China and South Africa (BRICS) and emerging
markets and concluded that moving averages outperformed the buy-and-hold
strategy in most of the emerging markets except Brazil Russia and Argentina Yu et
al (2013) examined the profitability of technical trading rules in seven Asian
markets including Indonesia Malaysia Singapore The Philippines Thailand Hong
Kong and Japan Fixed and variable moving average and trading range breakout
rules were employed and concluded that technical trading tools were more powerful
in emerging markets than in developed markets However profits from technical
analysis disappeared after transaction costs Similarly Heng and Niblock (2014)
examined the predictive power of technical analysis for stock index futures of
Indonesia Malaysia Thailand and The Philippines They employed EMA and
MACD and found emerging markets were slowly reaching its informational
efficiency after considering the transaction cost In contrast Ming-Ming and Siok-
Hwa (2006) found that Fixed Moving Averages (FMAs) in China Thailand
Taiwan Malaysian Singaporean Hong Kong Korean and Indonesian stock
markets were profitable
From a contextual perspective research on profitability of technical trading
analyses is limited in the Indian context Sehgal and Gupta (2007) evaluated the
economic feasibility of technical analysis using individual stock data and found the
technical trading strategy failed to outperform the passive strategy irrespective of
Muruganandan
29
market cycle conditions They used the daily closing price and volume information
of 65 companies constituted in BSE 100 index for the period from January 1999 to
December 2004 They concluded that past price and volume information of large
size companies were immediately incorporated in current price as these stocks were
tracked by several investors and fund managers Gunasekarage and Power (2001)
applied variable length moving average and fixed length moving average in South
Asian stock markets and generated excess returns in Colombo Stock Exchange
(CSE) Dhaka Stock Exchange (DSE) and Karachi Stock Exchange (KSE) whereas
Bombay Stock Exchange (BSE) supported the EMH Sehgal and Garhyan (2002)
examined the On Balance Volume (OBV) technical analysis with transaction cost
using daily data of 21 companies listed in BSE for the period from April 1996 to
March 1998 The result supports the technical analysis and rejects the EMH Mitra
(2011) analysed the profitability of moving average in Indian stock index for the
period from 1998 to 2008 He predicted the direction of index movement using
moving average but failed to deliver positive return after transaction costs Kulkarni
and Mode (2014) and Khatua (2016) examined the MACDrsquos prediction ability of
individual stocks and supported the technical analysis However these studies
considered limited data with a small number of companies and ignored the risk
adjusted return in Indian context
Significant earlier studies support the EMH and reject the technical analysis in
developed markets at least in weak form (Allen amp Karjalainen 1999 Chang et al
2004 Hudson et al 1996 Gencay 1998 Neftci 1991 Tian et al 2002) On the
contrary studies in emerging markets concluded that technical analysts in emerging
markets were able to make profit than their counterparts in developed markets
(Balsara et al 2007 Chang et al 2004 Chiang et al 2012 Ming-Ming et al
2002 Metghalchi et al 2019 Ni et al 2020) This may be due to the inherent
characteristics of emerging markets such as weak competition inefficient legal
systems absence of strong supervising institutions less market participants and lack
of infrastructure for information dissemination On the other hand the most recent
studies question the profitability of technical trading rules in emerging markets after
considering transaction costs (Heng amp Niblock 2014 Sehga amp Gupta 2007
Tharavanji et al 2015 Yu et al 2013 Zhu et al 2015) Nazario et al (2017)
consolidated the outcome of 85 research papers in a scientific way and concluded
that a considerable number of research papers favour weak form of market
efficiency without considering the risk adjusted return However Marshall Cahan
and Cahan (2008) survey of market participants indicates that stock traders and
investors place more emphasis on technical analysis than fundamental factors
Colombo Business Journal 11(1) 2020
30
This existing discrepancy in literature demands research on emerging marketsrsquo
information efficiency in the recent past Further the ability of technical trading
rules to predict stock returns is inadequately researched in emerging markets
Hence this study attempts to analyse the profitability of technical trading rules in
economically dynamic and rapidly growing emerging markets such as India
Further the total study period was classified as Bull and Bear market and employed
risk adjusted performance measures like Sharpe ratio ratio of average profit to
average loss and percentage of profitable trade to have a microscopic view on the
performance of technical analysis in the Indian context
Data and Methodology
This empirical study covers the period from February 2000 to May 2018 and the
total study period is categorised into Bull and Bear market as per Lokeshwarri
(2017) which is shown in Table 1 and supported by Figure1
Table 1 Cyclical Bull and Bear Phases in Sensex
Start Date End Date Change in
percentage Category
Time in
Months
Feb ndash 2000 Sep ndash 2001 -5781 Bear ndash 1 19
Sep ndash 2001 May ndash 2003 1310 Sideway ndash 1 20
May ndash 2003 Jan ndash 2008 62263 Bull ndash 1 56
Jan ndash 2008 Mar ndash 2009 -6205 Bear ndash 2 13
Mar ndash 2009 Nov ndash 2010 16231 Bull ndash 2 20
Nov ndash 2010 Aug ndash 2013 -1734 Sideway ndash 2 33
Aug ndash 2013 Mar ndash 2015 7208 Bull ndash 3 19
Mar ndash 2015 Feb ndash 2016 -2508 Bear ndash 3 11
Feb ndash 2016 May ndash 2018 5560 Bull ndash 4 27
Source Lokeshwarri (2017)
The daily opening closing high and low values for BSE Sensex were extracted
from BSE data base The widely used trading rules such as Relative Strength Index
(RSI) and Moving Average Convergence and Divergence (MACD) are employed to
generate Buy Hold and Sell signals which are explained below
Figure 1 Bull and Bear Phases of BSE Sensex during the Study Period
112002112001112000
6000
4500
3000
112003112002
3500
3000
2500
112008112006112004
20000
1700015000
10000
5000
2000
112009712008112008
20000
15000
10000
112011112010112009
20000
15000
10000
112014112013112012112011
20000
17500
15000
112015112014
30000
25000
20000
112016912015512015112015
30000
27500
25000
112018112017112016
35000
30000
25000
Bear 1 Sideway 1 Bull 1
Bear 2 Bull 2 Sideway 2
Bull 3 Bear 3 Bull 4
Mu
rug
an
and
an
31
Colombo Business Journal 11(1) 2020
32
Relative Strength Index (RSI)
RSI is a technical indicator which used to identify the overbought and oversold
condition of financial securities First relative strength is calculated by dividing the
simple average of closing values on up days by the average of closing values on
down days over a given period of time which is 14 days in this study The step-by-
step trading decision based on RSI is demonstrated as follows
Steps in generating Buy Hold and Sell Signals
1 Input Closing (119862119905) and Opening (119874119905) value of the Index on day t
2 Up Days (119880119905) 119862119905 119894119891 (119862119905 minus 119862119905minus1) gt 0 119890119897119904119890 0
3 Down Days (119863119905) 119862119905 119894119891 (119862119905 minus 119862119905minus1) lt 0 119890119897119904119890 0
4 Relative Strength (119877119878)
119877119878119905 =
sum 119880119905 119894=119905minus(119899minus1)119894=119905
119899
sum 119863119905 119894=119905minus(119899minus1)119894=119905
119899
5 Relative Strength Index (119877119878119868119905)
119877119878119868119905 = 100 minus (100
1 + 119877119878119905)
6 Trading Decision1 119861119906119910 119874119905+1
119894119891119877119878119868119905 gt 30 amp 119877119878119868119905minus1 le 30
Else
119878119886119897119890 119874119905+1
119894119891 119877119878119868119905 gt 70 amp 119877119878119868119905minus1 le 70
Or
Hold
7 Output Calculation of Return
119894119891 119887119906119910 119874119905+1 =
(119897119900119892(119862119905+1) minus 119897119900119892(119874119905+1))
119894119891 119878119886119897119890 119874119905+1 =
(119897119900119892(119874119905+1) minus 119897119900119892(119862119905+1))
1 The trading rules were applied as per Welles (1978) Henderson (2002) and Rosillo et al
(2013) Unlike previous studies in order to imitate the real time stock trading scenario
opening and closing values were considered for executing the trading signals and calculation
of return
Muruganandan
33
Moving Average Convergence and Divergence (MACD)
MACD is constructed based on historical exponential moving average of
closing value of index to identify the trend changes in its value It is computed
based on the difference between longer exponential moving averages (26 days)
from a shorter exponential moving average (12 days) In addition nine days simple
moving average of MACD is used as a sign to generate buy and sell signals Step-
by-step trading decision is presented as follows
Steps in generating Buy Hold and Sell Signals
1 Input Closing (119862119905) and Opening (119874119905) value of the Index on day t
2 Exponential Moving Average
119899 = 12 119886119899119889 26 119889119886119910119904 119891119900119903 119904ℎ119900119903119905 119886119899119889 119897119900119899119892 119864119872119860 119903119890119904119901119890119888119905119894119907119890119897119910
119864119872119860119905(119899) = sum (2
1+119899)
119894=119905minus(119899minus1)119894=119905 times 119862119905 + (1 minus
2
1+119899) times 119864119872119860119905minus1(119899)
3 119872119860119862119863 119864119872119860119905(119878ℎ119900119903119905119890119903) minus 119864119872119860119905(119871119900119899119892119890119903)
4 Signal Line 119878119894119892119899119905 = 1198781198721198609(119872119860119862119863)
5 Trading Decision2 119861119906119910 119874119905+1
119894119891119872119860119862119863119905 lt 0 119878119894119892119899119905 lt 0 amp 119878119894119892119899119905 gt 119872119860119862119863119905
Else
119878119886119897119890 119874119905+1
119894119891119872119860119862119863119905 gt 0 119878119894119892119899119905 gt 0 amp 119878119894119892119899119905 lt 119872119860119862119863119905
Or
Hold
6 Output Calculation of Return
119894119891 119887119906119910 119874119905+1 =
(119897119900119892(119862119905+1) minus 119897119900119892(119874119905+1))
119894119891 119878119886119897119890 119874119905+1 =
(119897119900119892(119874119905+1) minus 119897119900119892(119862119905+1))
Further the following hypotheses were framed to test whether returns of buy or
sell signals are different from the unconditional mean return and also whether the
mean buy signal return is different from mean sell signal return The null and
alternative hypotheses of the study are stated in Table 2
2 The trading rules were applied as per Rosillo et al (2013) Unlike previous studies in
order to imitate the real time stock trading scenario opening and closing values were
considered for executing the trading signals and calculation of return
Colombo Business Journal 11(1) 2020
34
Table2 Hypotheses of the Study
Buy-Unconditional
Return
Sell-Unconditional
Return
Buy ndash Sell
Return
Ho 120583119861 minus 120583119880 = 0 120583119878 minus 120583119880 = 0 120583119861 minus 120583119878 = 0
Ha 120583119861 minus 120583119880 ne 0 120583119878 minus 120583119880 ne 0 120583119861 minus 120583119878 ne 0
After the formulation of hypotheses t-statistics were used to test the null
hypothesis of equality between unconditional mean return (120583) and mean return of
trading rules (120583119903) which is specified in Equation 1
119905119903 = 120583119887119906119910 (119904119890119897119897)minus120583
radic120590119887119906119910( 119904119890119897119897)
2
119873119887119906119910(119904119890119897119897)+
1205902
119873
(1)
where 120583119887119906119910 (119904119890119897119897) is the mean technical trading return of buy or sell 119873119887119906119910(119904119890119897119897) is the
number of trades for the buy or sell signal 120583 and N are the unconditional mean
return and number of observations respectively and 1205902 is the estimated sample
variance In testing long-short strategies (buy-sell) t-statistics is computed as
follows
119905119887119906119910minus119904119890119897119897 = 120583119887119906119910minus120583119904119890119897119897
radic120590119861119906119910
2
119873119861119906119910+
1205901198781198901198971198972
119873119878119890119897119897
(2)
where 120583119887119906119910 and 120583119904119890119897119897 are the mean returns of buy signal and sell signals 120590119861119906119910 and
120590119878119890119897119897 are the estimated sample standard deviations of buy and sell signals
respectively 119873119861119906119910 and 119873119878119890119897119897 are the number of buy and sell signals respectively
Performance Measures
Sharpe Ratio
Reward to total risk is calculated using Sharpe Ratio which measures the
expected return to per unit of total risk taken In the perspective of trading the
standard Sharpe ratio is modified by excluding the risk free rate by assuming that
the trader needs to maintain the liquidity and not investing in risk free rate Hence
Sharpe ratio is calculated as per Equation 3
119878ℎ119886119903119901119890 119877119886119905119894119900 (119878119877) =
120590119877 (3)
Muruganandan
35
where and 120590119877 are respectively the expected return and the total risk of a trading
rule in a given period Higher the ratio superior the performance indicated by it
Ratio of Average Profit to Average Loss (APAL)
This ratio is calculated by dividing the average profit from profitable trade by
average loss from the unprofitable trade The ratio of more than one indicates on
average the trading system correctly predicts the price movement than misleading
the traders Hence a higher ratio indicates the superior ability of the technical
trading rules to predict the future price movement The absolute value of this ratio is
calculated as per Equation 4
119860119875
119860119871= |
119860119907119890119903119886119892119890 119875119903119900119891119894119905
119860119907119890119903119886119892119890 119897119900119904119904| (4)
Percentage of Profitable Trade ( of PT)
This ratio indicates the proportion of profitable trade to total trade signal High
percentage indicates that the trading system identifies price change more accurately
This ratio considers the number of profitable trade to total trading signals and
ignores the value of profit (loss) earned (incurred) This performance metric is
calculated as per Equation 5
119900119891 119875119879 = 119873119906119898119887119890119903 119900119891 119875119903119900119891119894119905119886119887119897119890 119879119903119886119889119894119899119892
119879119900119905119886119897 119873119906119898119887119890119903 119900119891 119879119903119886119889119894119899119892 119904119894119892119899119886119897119904 (5)
Results and Discussion
The summary statistics for the unconditional intraday return for the entire
sample period and the nine non-overlapping sub-periods are presented in Table 3
The intraday mean returns for the entire sample period and for the sub-periods are
negative except for the period Bull-2 Bear-2 period exhibits the highest standard
deviation of 001009 Both highest (0030) and lowest (-0047) daily return for the
entire study period recorded in Bull-1 period The high value of Kurtosis indicates
that the intraday return of BSE Sensex is not normally distributed and there are
outliers However when the market is moving in the Sideway the intraday returns
become more or less normally distributed as evidenced from the low Kurtosis The
evidence of excessive Kurtosis in Bull period indicates that the unconditional
intraday returns were leptokurtic with thicker tails than the Bear and Sideway
markets Hence the variance during Bull periods results from the outliers The
Colombo Business Journal 11(1) 2020
36
negative skewness indicates that the unconditional daily returns were moderately
negatively skewed except for Sideway-1
Table 3 Descriptive Statistics for Unconditional Intraday Return
Cycle Mean Standard
deviation Kurtosis Skew Min Max Count
Overall -000041 000576 48482 -0531 -0047 0030 4545
Bear ndash 1 -000119 000855 12148 -0286 -0035 0026 437
Sideway ndash 1 -000042 000451 06693 0028 -0018 0015 411
Bull ndash 1 -000015 000605 5415 -0785 -0047 0030 1165
Bear ndash 2 -000093 001009 09469 -0359 -0038 0024 280
Bull ndash 2 000025 000583 22848 0049 -0028 0025 411
Sideway ndash 2 -000049 000423 0568 -0217 -0016 0011 679
Bull ndash 3 -000032 000349 22438 -0127 -0018 0012 381
Bear ndash 3 -000098 000406 09085 -0630 -0016 0009 225
Bull ndash 4 -000028 000279 3073 0332 -0009 0016 556
Note Unconditional intraday return defined as the log difference of closing value to opening value by
assuming that the trader buys at the opening value and sells at the closing value
The result of RSI trading rule for BSE Sensex is presented in Table 4 The first
two columns exhibit the number of buy (119873119861) and sell (119873119878) signals generated using
RSI trading rules for the overall period and non-overlapping sub-sample periods
Third and fourth column show the average buy (120583119861) and sell (120583119878) returns along
with t-test in parenthesis The basic assumption of t-test is that the observations are
normally distributed However Table 1 reveals that the returns were not normally
distributed which may question the validity of t-test results and its interpretations In
order to overcome this phenomenon Brock et al (1992) suggested the bootstrap
method developed by Efron (1979) Hence this paper employs the bootstrap
method adopted by McKenzie (2007) which mimics the procedure followed by
Brock et al (1992) Bootstrap process was repeated for 500 times and the resultant t
values and corresponding p values are reported in parentheses and square brackets
respectively However the acceptance and rejection of hypothesis were similar both
in bootstrap p values and t-test In addition standard deviation of buy and sell
signals and the mean difference between buy and sell signals are also presented in
the column five six and seven respectively
Muruganandan
37
Table 4 Statistical Results for RSI Trading Rule
Category NB NS microB microS σB σS microB - microS
Overall 116 178
-000065
(-0352)
[0739]
000003
(1308)
[0232]
000729 000434
-000068
(-0905)
[0367]
Bear ndash 1 15 13
-000002
(0489)
[0645]
00025
(2150)
[0066]
000908 000601
-000252
(-0876)
[0401]
Sideway ndash 1 14 16
-000051
(-0084)
[0946]
000065
(0859)
[0419]
000406 00049
-000116
(-0711)
[0499]
Bull ndash 1 15 54
-000199
(-0801)
[0445]
-00009
(-1273)
[0186]
000892 000414
-00011
(-0464)
[0617]
Bear ndash 2 17 7
000031
(0439)
[0661]
00009
(0488)
[0631]
001134 000979
-000059
(-0128)
[0876]
Bull ndash 2 5 21
000486
(1624)
[0076]
-000039
(-0601)
[0599]
00063 000474
000525
(1749)
[0071]
Sideway ndash 2 26 19
-000165
(-0969)
[0325]
-000009
(0831)
[0411]
0006 000205
-000156
(-1231)
[0246]
Bull ndash 3 4 16
-000121
(-0949)
[0355]
-000037
(-0063)
[0952]
000184 000294
-000084
(-0713)
[0476]
Bear ndash 3 13 5
-000149
(0415)
[0681]
000214
(1296)
[0124]
000373 000279
-00036
(-1357)
[0185]
Bull ndash 4 7 27
00000032
(0334)
[0729]
000037
(1533)
[0162]
000218 000208
-000037
(-0395)
[0691]
Notes 1 NB and NS denote the number of buy and sell signals during the period respectively microB and
microS denote the average return of buy and sell signals respectively σB and σS denote the
standard deviation of buy and sell signal returns respectively
2 Numbers in parentheses are t values and numbers in square brackets are the bootstrap p
values
Colombo Business Journal 11(1) 2020
38
RSI generates more sell signals than buy signals during the Bull market On the
contrary during the Bear and Sideway market RSI produced higher number of buy
signals than sell signals Since RSI has the upper band of 100 if the stock price goes
up continuously RSI remains in the overbought regime and produce more number
of sell signals than buy signals In this case a trader shorting the opportunity based
on RSI sell signals may not make profit as the price will move to the differentother
orbit On the other hand if the stock price goes down continuously the RSI
generates more number of buy signals than the sell signals as opposed to the current
price movement Hence the application of RSI during the long Bull and Bear
markets may not help the trader to make profit even before adjusting the transaction
cost From the result of t-test and bootstrap p values it can be concluded that buy
and sell signals does not reject the null hypothesis that the mean return of buy or sell
signals is not significantly different from the unconditional mean return Moreover
averages of buy signal returns and sell signal returns are not significantly different
from each other These results provide evidence of the existence of weak form
efficiency across the market cycle Hence it can be concluded that traders cannot
outperform the market using the RSI signals during the upward or downward
movement of the market
Table 5 Performance of RSI Trading Signal
Category
Buy Signal Performance Sell Signal Performance
SR APAL of
PT SR APAL
of
PT
Overall -00892 1007 4397 00069 10669 4888
Bear ndash 1 -00022 1489 4000 04160 14933 6923
Sideway ndash 1 -01256 0529 5714 01327 13950 5000
Bull ndash 1 -02242 0896 4000 -02174 10832 3519
Bear ndash 2 00273 1203 4706 00919 09491 5714
Bull ndash 2 07714 1766 8000 -00823 07273 5238
Sideway ndash 2 -02750 0781 3846 -00439 09970 4737
Bull ndash 3 -06576 0298 2500 -01259 07136 5000
Bear ndash 3 -02601 0742 4000 02294 13570 5938
Bull ndash 4 00014 1338 4286 01779 10837 5926
Note SR denotes the Sharpe Ratio APAL denotes the ratio of average profit to average loss
of PT denotes the percentage of profitable trade to total trading signal
Muruganandan
39
Table 5 exhibits the results of Sharpe Ratio (SR) average profit to average loss
ratio (APAL) and percentage of profitable trade to total trading signals For the
overall study period and almost all sub-samples periods buy signal underperforms
the sell signal as per the modified Sharpe ratio The absolute value of average profit
to average loss more than one indicates that the average of profitable trade is more
than the average of unprofitable trade However percentage of profitable trade less
than 50 indicates that RSI generate a higher number of unprofitable trades than
profitable trade Hence average return on buy signal is negative for the overall
study period and for six out of nine sub-sample periods On the other hand RSI sell
signal generated the positive Sharpe ratio for overall period and five out of nine sub-
sample periods Profitable trade to total trade signal indicates sell signal produced
more profitable trade in all sub-sample period except Bull-1 and Sidway-1 market
Though percentage of profitable trade to total trade for overall period is less than
50 (ie 4888) which indicate that the number of unprofitable trades is higher
than the profitable trades the profit per profitable trade is sufficiently enough to
compensate the loss in unprofitable trade The sell signal trading strategy makes
money not only from correctly predicting the market movement but also minimising
the loss quickly and allows the profit to run
The Table 6 exhibits the statistical results for the MACD trading rules During
the study period MACD generated 1522 sell signals and 858 buy signals with the
average return of 000861 and -000128 respectively The standard deviations of buy
signal returns (00179) and sell signal returns (001068) are also presented along
with mean return difference between buy and sell signals (-00021) Buy signal
produced the average negative return for all the sub-sample periods and they were
also not significantly different from the average unconditional mean return Hence
the null hypothesis was accepted and it can be concluded that buy signal produced a
return similar to that of unconditional intraday return However the sell signal
generated positive average return for the overall period and all sub-sample periods
except Bull-2 period In contrast the sell signal returns were significantly different
for the overall period and five out of nine sub-sample periods
Table 6 Statistical Results for MACD Trading Rule
Category NB NS microB microS σB σS microB -microS
Overall 858 1522
-000128
(-142)
[0170]
0000861
(443)
[0002]
0017908 0010686
-000215
(-3203)
[0008]
Colombo Business Journal 11(1) 2020
40
Category NB NS microB microS σB σS microB -microS
Bear ndash 1 141 59
-000021
(0494)
[0631]
0006379
(317)
[0002]
0023008 0018028
-000659
(-2165)
[0036]
Sideway ndash 1 131 71
-000226
(-1524)
[0142]
0000543
(0623)
[0509]
0013614 001285
-000281
(-1452)
[0162]
Bull ndash 1 85 581
-000004
(0043)
[0962]
0000196
(0703)
[0483]
0023623 0011
-000023
(-0090)
[0908]
Bear ndash 2 109 33
-000350
(-0989)
[0337]
0004699
(231)
[0036]
0026444 0013532
-00082
(-2371)
[002]
Bull ndash 2 39 192
-000031
(-0224)
[0816]
-000085
(-1066)
[0311]
0015615 0013721
0000532
(0198)
[0838]
Sideway ndash 2 166 171
-000035
(0171)
[0852]
000195
(375)
[0002]
0011182 0008263
-00023
(-2141)
[0032]
Bull ndash 3 32 165
-000171
(-0514)
[0591]
0000902
(220)
[0028]
0015215 0006737
-000261
(-0952)
[0291]
Bear ndash 3 88 25
-000146
(-0457)
[0643]
0004442
(341)
[0002]
0009516 0007832
-000591
(-3164)
[0004]
Bull ndash 4 67 225
-000205
(-1306)
[0188]
0000871
(2905)
[0008]
0011064 0005643
-000292
(-2080)
[004]
Notes 1 NB and NS denote the number of buy and sell signals during the period respectively microB
and microS denote the average return of buy and sell signals respectively σB and σS denote the
standard deviation of buy and sell signal returns respectively
2 Numbers in parenthesis are t-values and numbers in square brackets are the bootstrap p
values
3 denotes p lt 05
The risk measured by standard deviation is higher in buy signal than sell signal
trading rules for the entire study period and for all the sub-sample periods This
clearly indicates that the trading on buy signal is riskier than the sell signal
Moreover the sell signal average returns were significantly different from the
Muruganandan
41
average buy signal returns in all the Bear market periods and for the overall study
period This result supports the sell signal over buy signal specifically during the
Bear market phases This result sharply contradicts to Tharavanij et al (2015) who
found buy signals outperform the sell signals in Southeast Asian markets
Sharpe ratio average profit to average loss ratio and percentage of profitable
trade to total trade signal for MACD trading rule are presented in Table 7 For the
buy signals percentage of profitable trade to total trade has more than 50 in four
out of nine sub-sample periods but average profit to average loss is less than one
which implies that the profit from correctly predicting market direction is not
sufficient enough to cut down the loss from the failure to predict market direction
Hence Sharpe ratios for all sub-sample periods and the entire study period were
negative However the sell signals correctly predict the market with highest
percentage of profitable trade to total trade of 80 in Bear-3 period Moreover
with less ability to predict market direction in Sideway-1 (4789) and Bull-1
(4905) periods sell signal generated profit to cut down the loss from unprofitable
trade which results in average profit to average loss ratio of more than one for
Sideway-1 (122) and Bull-1 (109) period Overall the result supports the sell
signals over buy signals before considering the transaction costs in the Indian
context
Table 7 Performance of MACD Trading Signal
Category
Buy Signal Performance Sell Signal Performance
SR APAL of
PT SR APAL
of
PT
Overall -0072 0897 47669 008 106 5414
Bear ndash 1 -0009 1110 46809 035 219 5763
Sideway ndash 1 -0166 0701 47328 004 122 4789
Bull ndash 1 -0002 0805 55294 002 109 4905
Bear ndash 2 -0133 0940 43119 035 115 6667
Bull ndash 2 -0020 0734 56410 -006 084 5000
Sideway ndash 2 -0031 1122 45181 024 108 6374
Bull ndash 3 -0112 0563 56250 013 100 5879
Bear ndash 3 -0154 0682 50000 057 108 8000
Bull ndash 4 -0185 0827 41791 015 116 5644
Note SR denotes the Sharpe Ratio APAL denotes the ratio of average profit to average loss
of PT denotes the percentage of profitable trade to total trading signal
Colombo Business Journal 11(1) 2020
42
Conclusion
This paper examines the profitability of RSI and MACD technical trading rules
in the Indian market across market cycles BSE Sensex data for the period from
February 2000 to May 2018 were collected from BSE data base and classified into
nine non-overlapping periods as Bull and Bear markets based on the index
movement The t-tests were applied to test the hypothesis that returns from technical
trading rules were not significantly different from the unconditional daily returns In
addition Sharpe ratio average profit to average loss ratio and percentage of
profitable trade to total trade signal were also employed to have a microscopic view
on technical trading rules
Results support the weak-form efficient theory as RSI failed to deliver the
positive returns even before deducting the transaction costs RSI buy and sell signal
returns were not significantly different from the unconditional intraday return In
terms of market timing RSI wrongly predict the market movement and delivered
the percentage of profitable trade to total trade less than 50 Moreover profitable
trades were insufficient to overcome the loss from unprofitable trade Hence buy
signal generated a negative average return and sell signal posted a low positive
average return before deducting transaction costs Therefore after deducting
transaction costs RSI may not leave any profit in the hands of traders
MACD sell signal produced significant positive returns compared to buy signal
and unconditional intraday return However as per Sharpe ratio MACD sell signal
failed to produce the return in line with risk taken Sharpe ratio of less than one
indicates that risk associated with the technical trading rule is more than the return
generated by RSI and MACD In addition even profitable MACD sell signal does
not help in market timing It makes money from higher average profit from
profitable trade than average loss from unprofitable trade However MACD does
not help to reduce the unprofitable trade Hence the study concludes that the trader
cannot earn abnormal return consistently with the help of RSI and MACD across
market cycle in the Indian context RSI and MACD are very old and yet still widely
used as technical tools in real time stock price prediction On the other hand latest
development in information technology and changes in legal systems may have
helped the market to absorb RSI and MACD signals in current price with no time
and cost However in order to empirically validate this assumption a future study
may be extended using a proxy for information technology development and its
impact on trading rules across industries and individual stocks in emerging markets
Muruganandan
43
Declaration of Conflict of Interest
The author declared no potential conflict of interest with respect to the research
authorship and publication of this article
Acknowledgement
I would like to thank anonymous reviewers for their valuable suggestions
References
Allen F amp Karjalainen R (1999) Using genetic algorithms to find technical
trading rules Journal of Financial Economics 51(2) 245ndash271
httpsdoiorg101016S0304-405X(98)00052-X
Almujamed H I Fifield S amp Power D (2013) An investigation of the role of
technical analysis in Kuwait Qualitative Research in Financial Markets 5(1)
43ndash64 httpsdoiorg10110817554171311308959
Anghel G D I (2015) Stock market efficiency and the MACD Evidence from
countries around the world Procedia Economics and Finance 32 1414ndash1431
httpsdoiorg101016S2212-5671(15)01518-X
Atanasova C V amp Hudson R S (2010) Technical trading rules and calendar
anomalies mdash Are they the same phenomena Economics Letters 106(2) 128ndash
130 httpsdoiorg101016jeconlet200911001
Balsara N J Chen G amp Zheng L (2007) The Chinese stock market An
examination of the random walk model and technical trading rules Quarterly
Journal of Business amp Economics 46(2) 43ndash63 httpswwwjstororgstable
40473435
Balsara N Chen J amp Zheng L (2009) Profiting from a contrarian application of
technical trading rules in the US stock market Journal of Asset Management
10(2) 97ndash123 httpsdoiorg101057jam200844
Brock W Lakonishok J amp LeBaron B (1992) Simple technical trading rules
and stochastic properties of stock returns The Journal of Finance 47(5) 1731ndash
1764 httpsdoiorg101111j1540-62611992tb04681x
Chang E J Lima E J A amp Tabak B M (2004) Testing for predictability in
emerging equity markets Emerging Markets Review 5(3) 295ndash316
httpsdoi101016jememar200403005
Chiang Y-C Ke M-C Liao T L amp Wang C D (2012) Are technical trading
strategies still profitable - Evidence from the Taiwan Stock Index Futures
Market Applied Financial Economics 22(12) 955ndash965 httpsdoiorg
101080096031072011631893
Chong T T-L amp Ng W-K (2008) Technical analysis and the London stock
exchange Testing the MACD and RSI rules using the FT30 Applied
Colombo Business Journal 11(1) 2020
44
Economics Letters 15(14) 1111ndash1114 httpsdoiorg10108013504850600
993598
Cohen G amp Cabiri E (2015) Can technical oscillators outperform the buy and
hold strategy Applied Economics 47(30) 3189ndash3197 httpsdoiorg101080
0003684620151013609
Efron B (1979) Bootstrap methods Another look at the Jackknife The Annals of
Statistics 7(1)1ndash26 httpsprojecteuclidorgeuclidaos 1176344552
Fama (1970) Efficient capital markets a review of theory and empirical work
Journal of Finance 25(2) 383-417 httpswwwjstororgstable2325486
Gencay R (1998) The predictability of security returns with simple technical
trading rules Journal of Empirical Finance 5(4) 347ndash359 httpsdoiorg
101016S0927-5398(97)00022-4
Gunasekarage A amp Power D M (2001) The profitability of moving average
trading rules in South Asian stock markets Emerging Markets Review 2(1)
17ndash33 httpsdoiorg101016S1566-0141(00)00017-0
Henderson C (2002) Currency strategy The practitionerrsquos guide to currency
investing hedging and forecasting John Willy amp Sons
Heng P amp Niblock S J (2014) Trading with tigers A technical analysis of
Southeast Asian stock index futures International Economic Journal 28(4)
679ndash692 httpsdoiorg101080101687372014928895
Hudson R Dempsey M amp Keasey K (1996) A note on weak form efficiency of
capital markets The application of simple technical trading rules to UK stock
prices- 1935-1994 Journal of Banking and Finance 20(6) 1121ndash1132
httpsdoiorg1010160378-4266(95)00043-7
Jensen M C amp Benington G A (1970) Random walk and technical theories
Some additional evidence Journal of Finance 25 469ndash482
httpswwwjstororgstable2325495
Krausz J Lee S-Y amp Nam K (2009) Profitability of nonlinear dynamics
under technical trading rules Evidence from Pacific basin stock markets
Emerging Markets Finance amp Trade 45(4) 13ndash35 httpsdoiorg102753
REE1540-496X450402
Khatua A (2016) An application of moving average convergence and divergence
(MACD) indicator on selected stocks listed on National Stock Exchange (NSE)
httpdxdoiorg102139ssrn2872665
Kulkarni A D amp More A (2014) An application of moving average convergence
divergence (MACD) indicator on selected stocks listed on Bombay Stock
Exchange (BSE) Oriental Journal of Computer Science and Technology 7(3)
396ndash400 httpwwwcomputerscijournalorgp=1500
Lokeshwarri S K (2017 April 07) The big story ndash Sit back go passive The Hindu
Business Line (Coimbatore Edition) p 2
Muruganandan
45
Marshall B R Cahan R H amp Cahan J M (2008) Does intraday technical
analysis in the US equity market have value Journal of Empirical Finance
15(2) 199ndash210 httpsdoiorg101016jjempfin200605003
Marshall B R Young M R amp Cahan R (2008) Are candlestick technical
trading strategies profitable in the Japanese equity market Review of
Quantitative Finance and Accounting 31(2) 191ndash207 httpsdoiorg101007
s11156-007-0068-1
Metghalchi M Chen C-P Hajilee M (2016) Moving average trading rules for
NASDAQ composite index Applied Finance Letters 5(2) 45ndash57
httpsdoiorg1024135aflv5i254
Metghalchi M amp Hayes L A Niroomand F (2019) A technical approach to
equity investing in emerging markets Review of Financial Economics 37(3)
389ndash403 httpsdoiorg101002rfe1041
McKenzie M D (2007) Technical trading rules in emerging market and the 1997
Asian currency crises Emerging Market Finance and Trade 43(4) 46ndash73
httpsdoiorg102753REE1540-496X430403
Ming-Ming L Balachandher K G amp Nor F M (2002) An examination of the
random walk model and technical trading rules in the Malaysian stock market
Quarterly Journal of Business amp Economics 41(1) 81ndash104
httpswwwjstororgstable40473346
Ming-Ming L amp Siok-Hwa L (2006) The profitability of the simple moving
averages and trading range breakout in the Asian stock markets Journal of
Asian Economics 17(1) 144ndash170 httpsdoiorg101016jasieco200512001
Mitra S K (2011) How rewarding is technical analysis in Indian stock market
Quantitative Finance 11(2) 287ndash297 httpsdoiorg101080
14697680903493581
Nazario R T F Silva J L amp Sobrero V A (2017) A literature review of
technical analysis on stock markets The Quarterly Review of Economics and
Finance 66 115ndash126 httpsdoiorg101016jqref201701014
Neftccedili S N (1991) Naiumlve trading rules in financial markets and Wiener-
Kolmogorov prediction theory A study of ldquotechnical analysisrdquo Journal of
Business 64(4) 549ndash571
Ni Y Day M-Y Huang P ampYu S-R (2020) The profitability of Bollinger
Bamps Evidence from the constituent stocks of Taiwan 50 Physica A Statistical
Mechanics and Its Applications Advance online publication httpsdoiorg
101016jphysa2020124144
Nor S M amp Wickremasinghe G (2014) The profitability of MACD and RSI
trading rules in the Australian stock market Investment Management and
Financial Innovation 11(4) 194ndash199
Colombo Business Journal 11(1) 2020
46
Rosillo R de La Fuente D amp Brugos J A L (2013) Technical analysis and the
Spanish stock market Testing the RSI and MACD momentum and stochastic
rule using Spanish market companies Applied Economics 45(12) 1541ndash1550
httpsdoiorg101080000368462011631894
Sehgal S amp Garhyan A (2002) Abnormal returns using technical returns The
Indian experience Finance India 16(1) 181ndash203
Sehgal S amp Gupta M (2007) Tests of technical analysis in India Vision The
Journal of Business Perspective 11(3) 11ndash23 httpsdoiorg101177
097226290701100303
Sobreiro V A da Costa T R C C Nazaacuterio R T F e Silva J L Moreira E
A Filho M C L Kimura H amp Zambrano J C A (2016) The profitability
of moving average trading rules in BRICS and emerging stock markets North
American Journal of Economics and Finance 38 86ndash101 httpsdoiorg
101016jnajef201608003
Tian G G Wan G H amp Guo M (2002) Market efficiency and the returns to
simple technical trading rules New evidence from US equity market and
Chinese equity markets Asia-Pacific Financial Markets 9(3) 241ndash258
httpsdoiorg101023A1024181515265
Tharavanij P Siraprapasiri V amp Rajchamaha K (2015) Performance of
technical trading rules Evidence from Southeast Asian Stock Market
Springerplus 4552 httpsdoiorg101186s40064-015-1334-7
Wang J-L amp Chan S-H (2007) Stock market trading rule discovery using
pattern recognition and technical analysis Expert Systems with Applications
33(2) 304ndash315 httpsdoiorg101016jeswa200605002
Welles J Jr (1978) New concepts in technical trading systems Hunter Publishing
Company
Wong W-K Manzur M amp Chew B-K (2003) How rewarding is technical
analysis Evidence from Singapore stock market Journal of Applied Financial
Economics 13(7) 543ndash551 httpsdoiorg1010800960310022000020906
Yu H Nartea G V Gan C amp Yao L J (2013) Predictive ability and
profitability of simple technical trading rules Recent evidence from Southeast
Asian stock markets International Review of Economics and Finance 25 356ndash
371 httpsdoiorg101016jiref201207016
Zhu H Jiang Z-Q Li S-P amp Zhou W-X (2015) Profitability of simple
technical trading rules of Chinese stock exchange indexes Physica A
Statistical Mechanics and Its Applications 439 75ndash84 httpsdoiorg101016
jphysa201507032

Colombo Business Journal 11(1) 2020
28
costs in Taiwan Cohen and Cabiri (2015) employed DJI FTSE NK225 and TA100
index data for the period from 2007 to 2012 and found RSI and MACD
outperformed the indices in Bear market and delivered negative return during Bull
market
Anghel (2015) tested the profitability of Moving Average Convergence and
Divergence (MACD) with 1336 stocks of 75 countries with temporal data from 1st
of January 2001 to 31st of December 2012 The study found that certain companies
delivered risk adjusted abnormal return even after deducting trading cost and
rejected the random walk hypothesis for many countries Tian et al (2002) found
that technical trading rules have less power in the US stock market to earn profit
whereas the Chinese market gives profit even after deducting trading cost Chang et
al (2004) examined the power of simple Moving average trading rules in 11
emerging and developed markets (US and Japan) and suggested that emerging
equity indices exhibit the scope to earn abnormal return with technical trading rules
whereas developed countriesrsquo stock indices (US and Japan) do not reject the EMH
Sobreiro et al (2016) studied the profitability of MACD RSI and algorithm trading
rules in Brazil Russia India China and South Africa (BRICS) and emerging
markets and concluded that moving averages outperformed the buy-and-hold
strategy in most of the emerging markets except Brazil Russia and Argentina Yu et
al (2013) examined the profitability of technical trading rules in seven Asian
markets including Indonesia Malaysia Singapore The Philippines Thailand Hong
Kong and Japan Fixed and variable moving average and trading range breakout
rules were employed and concluded that technical trading tools were more powerful
in emerging markets than in developed markets However profits from technical
analysis disappeared after transaction costs Similarly Heng and Niblock (2014)
examined the predictive power of technical analysis for stock index futures of
Indonesia Malaysia Thailand and The Philippines They employed EMA and
MACD and found emerging markets were slowly reaching its informational
efficiency after considering the transaction cost In contrast Ming-Ming and Siok-
Hwa (2006) found that Fixed Moving Averages (FMAs) in China Thailand
Taiwan Malaysian Singaporean Hong Kong Korean and Indonesian stock
markets were profitable
From a contextual perspective research on profitability of technical trading
analyses is limited in the Indian context Sehgal and Gupta (2007) evaluated the
economic feasibility of technical analysis using individual stock data and found the
technical trading strategy failed to outperform the passive strategy irrespective of
Muruganandan
29
market cycle conditions They used the daily closing price and volume information
of 65 companies constituted in BSE 100 index for the period from January 1999 to
December 2004 They concluded that past price and volume information of large
size companies were immediately incorporated in current price as these stocks were
tracked by several investors and fund managers Gunasekarage and Power (2001)
applied variable length moving average and fixed length moving average in South
Asian stock markets and generated excess returns in Colombo Stock Exchange
(CSE) Dhaka Stock Exchange (DSE) and Karachi Stock Exchange (KSE) whereas
Bombay Stock Exchange (BSE) supported the EMH Sehgal and Garhyan (2002)
examined the On Balance Volume (OBV) technical analysis with transaction cost
using daily data of 21 companies listed in BSE for the period from April 1996 to
March 1998 The result supports the technical analysis and rejects the EMH Mitra
(2011) analysed the profitability of moving average in Indian stock index for the
period from 1998 to 2008 He predicted the direction of index movement using
moving average but failed to deliver positive return after transaction costs Kulkarni
and Mode (2014) and Khatua (2016) examined the MACDrsquos prediction ability of
individual stocks and supported the technical analysis However these studies
considered limited data with a small number of companies and ignored the risk
adjusted return in Indian context
Significant earlier studies support the EMH and reject the technical analysis in
developed markets at least in weak form (Allen amp Karjalainen 1999 Chang et al
2004 Hudson et al 1996 Gencay 1998 Neftci 1991 Tian et al 2002) On the
contrary studies in emerging markets concluded that technical analysts in emerging
markets were able to make profit than their counterparts in developed markets
(Balsara et al 2007 Chang et al 2004 Chiang et al 2012 Ming-Ming et al
2002 Metghalchi et al 2019 Ni et al 2020) This may be due to the inherent
characteristics of emerging markets such as weak competition inefficient legal
systems absence of strong supervising institutions less market participants and lack
of infrastructure for information dissemination On the other hand the most recent
studies question the profitability of technical trading rules in emerging markets after
considering transaction costs (Heng amp Niblock 2014 Sehga amp Gupta 2007
Tharavanji et al 2015 Yu et al 2013 Zhu et al 2015) Nazario et al (2017)
consolidated the outcome of 85 research papers in a scientific way and concluded
that a considerable number of research papers favour weak form of market
efficiency without considering the risk adjusted return However Marshall Cahan
and Cahan (2008) survey of market participants indicates that stock traders and
investors place more emphasis on technical analysis than fundamental factors
Colombo Business Journal 11(1) 2020
30
This existing discrepancy in literature demands research on emerging marketsrsquo
information efficiency in the recent past Further the ability of technical trading
rules to predict stock returns is inadequately researched in emerging markets
Hence this study attempts to analyse the profitability of technical trading rules in
economically dynamic and rapidly growing emerging markets such as India
Further the total study period was classified as Bull and Bear market and employed
risk adjusted performance measures like Sharpe ratio ratio of average profit to
average loss and percentage of profitable trade to have a microscopic view on the
performance of technical analysis in the Indian context
Data and Methodology
This empirical study covers the period from February 2000 to May 2018 and the
total study period is categorised into Bull and Bear market as per Lokeshwarri
(2017) which is shown in Table 1 and supported by Figure1
Table 1 Cyclical Bull and Bear Phases in Sensex
Start Date End Date Change in
percentage Category
Time in
Months
Feb ndash 2000 Sep ndash 2001 -5781 Bear ndash 1 19
Sep ndash 2001 May ndash 2003 1310 Sideway ndash 1 20
May ndash 2003 Jan ndash 2008 62263 Bull ndash 1 56
Jan ndash 2008 Mar ndash 2009 -6205 Bear ndash 2 13
Mar ndash 2009 Nov ndash 2010 16231 Bull ndash 2 20
Nov ndash 2010 Aug ndash 2013 -1734 Sideway ndash 2 33
Aug ndash 2013 Mar ndash 2015 7208 Bull ndash 3 19
Mar ndash 2015 Feb ndash 2016 -2508 Bear ndash 3 11
Feb ndash 2016 May ndash 2018 5560 Bull ndash 4 27
Source Lokeshwarri (2017)
The daily opening closing high and low values for BSE Sensex were extracted
from BSE data base The widely used trading rules such as Relative Strength Index
(RSI) and Moving Average Convergence and Divergence (MACD) are employed to
generate Buy Hold and Sell signals which are explained below
Figure 1 Bull and Bear Phases of BSE Sensex during the Study Period
112002112001112000
6000
4500
3000
112003112002
3500
3000
2500
112008112006112004
20000
1700015000
10000
5000
2000
112009712008112008
20000
15000
10000
112011112010112009
20000
15000
10000
112014112013112012112011
20000
17500
15000
112015112014
30000
25000
20000
112016912015512015112015
30000
27500
25000
112018112017112016
35000
30000
25000
Bear 1 Sideway 1 Bull 1
Bear 2 Bull 2 Sideway 2
Bull 3 Bear 3 Bull 4
Mu
rug
an
and
an
31
Colombo Business Journal 11(1) 2020
32
Relative Strength Index (RSI)
RSI is a technical indicator which used to identify the overbought and oversold
condition of financial securities First relative strength is calculated by dividing the
simple average of closing values on up days by the average of closing values on
down days over a given period of time which is 14 days in this study The step-by-
step trading decision based on RSI is demonstrated as follows
Steps in generating Buy Hold and Sell Signals
1 Input Closing (119862119905) and Opening (119874119905) value of the Index on day t
2 Up Days (119880119905) 119862119905 119894119891 (119862119905 minus 119862119905minus1) gt 0 119890119897119904119890 0
3 Down Days (119863119905) 119862119905 119894119891 (119862119905 minus 119862119905minus1) lt 0 119890119897119904119890 0
4 Relative Strength (119877119878)
119877119878119905 =
sum 119880119905 119894=119905minus(119899minus1)119894=119905
119899
sum 119863119905 119894=119905minus(119899minus1)119894=119905
119899
5 Relative Strength Index (119877119878119868119905)
119877119878119868119905 = 100 minus (100
1 + 119877119878119905)
6 Trading Decision1 119861119906119910 119874119905+1
119894119891119877119878119868119905 gt 30 amp 119877119878119868119905minus1 le 30
Else
119878119886119897119890 119874119905+1
119894119891 119877119878119868119905 gt 70 amp 119877119878119868119905minus1 le 70
Or
Hold
7 Output Calculation of Return
119894119891 119887119906119910 119874119905+1 =
(119897119900119892(119862119905+1) minus 119897119900119892(119874119905+1))
119894119891 119878119886119897119890 119874119905+1 =
(119897119900119892(119874119905+1) minus 119897119900119892(119862119905+1))
1 The trading rules were applied as per Welles (1978) Henderson (2002) and Rosillo et al
(2013) Unlike previous studies in order to imitate the real time stock trading scenario
opening and closing values were considered for executing the trading signals and calculation
of return
Muruganandan
33
Moving Average Convergence and Divergence (MACD)
MACD is constructed based on historical exponential moving average of
closing value of index to identify the trend changes in its value It is computed
based on the difference between longer exponential moving averages (26 days)
from a shorter exponential moving average (12 days) In addition nine days simple
moving average of MACD is used as a sign to generate buy and sell signals Step-
by-step trading decision is presented as follows
Steps in generating Buy Hold and Sell Signals
1 Input Closing (119862119905) and Opening (119874119905) value of the Index on day t
2 Exponential Moving Average
119899 = 12 119886119899119889 26 119889119886119910119904 119891119900119903 119904ℎ119900119903119905 119886119899119889 119897119900119899119892 119864119872119860 119903119890119904119901119890119888119905119894119907119890119897119910
119864119872119860119905(119899) = sum (2
1+119899)
119894=119905minus(119899minus1)119894=119905 times 119862119905 + (1 minus
2
1+119899) times 119864119872119860119905minus1(119899)
3 119872119860119862119863 119864119872119860119905(119878ℎ119900119903119905119890119903) minus 119864119872119860119905(119871119900119899119892119890119903)
4 Signal Line 119878119894119892119899119905 = 1198781198721198609(119872119860119862119863)
5 Trading Decision2 119861119906119910 119874119905+1
119894119891119872119860119862119863119905 lt 0 119878119894119892119899119905 lt 0 amp 119878119894119892119899119905 gt 119872119860119862119863119905
Else
119878119886119897119890 119874119905+1
119894119891119872119860119862119863119905 gt 0 119878119894119892119899119905 gt 0 amp 119878119894119892119899119905 lt 119872119860119862119863119905
Or
Hold
6 Output Calculation of Return
119894119891 119887119906119910 119874119905+1 =
(119897119900119892(119862119905+1) minus 119897119900119892(119874119905+1))
119894119891 119878119886119897119890 119874119905+1 =
(119897119900119892(119874119905+1) minus 119897119900119892(119862119905+1))
Further the following hypotheses were framed to test whether returns of buy or
sell signals are different from the unconditional mean return and also whether the
mean buy signal return is different from mean sell signal return The null and
alternative hypotheses of the study are stated in Table 2
2 The trading rules were applied as per Rosillo et al (2013) Unlike previous studies in
order to imitate the real time stock trading scenario opening and closing values were
considered for executing the trading signals and calculation of return
Colombo Business Journal 11(1) 2020
34
Table2 Hypotheses of the Study
Buy-Unconditional
Return
Sell-Unconditional
Return
Buy ndash Sell
Return
Ho 120583119861 minus 120583119880 = 0 120583119878 minus 120583119880 = 0 120583119861 minus 120583119878 = 0
Ha 120583119861 minus 120583119880 ne 0 120583119878 minus 120583119880 ne 0 120583119861 minus 120583119878 ne 0
After the formulation of hypotheses t-statistics were used to test the null
hypothesis of equality between unconditional mean return (120583) and mean return of
trading rules (120583119903) which is specified in Equation 1
119905119903 = 120583119887119906119910 (119904119890119897119897)minus120583
radic120590119887119906119910( 119904119890119897119897)
2
119873119887119906119910(119904119890119897119897)+
1205902
119873
(1)
where 120583119887119906119910 (119904119890119897119897) is the mean technical trading return of buy or sell 119873119887119906119910(119904119890119897119897) is the
number of trades for the buy or sell signal 120583 and N are the unconditional mean
return and number of observations respectively and 1205902 is the estimated sample
variance In testing long-short strategies (buy-sell) t-statistics is computed as
follows
119905119887119906119910minus119904119890119897119897 = 120583119887119906119910minus120583119904119890119897119897
radic120590119861119906119910
2
119873119861119906119910+
1205901198781198901198971198972
119873119878119890119897119897
(2)
where 120583119887119906119910 and 120583119904119890119897119897 are the mean returns of buy signal and sell signals 120590119861119906119910 and
120590119878119890119897119897 are the estimated sample standard deviations of buy and sell signals
respectively 119873119861119906119910 and 119873119878119890119897119897 are the number of buy and sell signals respectively
Performance Measures
Sharpe Ratio
Reward to total risk is calculated using Sharpe Ratio which measures the
expected return to per unit of total risk taken In the perspective of trading the
standard Sharpe ratio is modified by excluding the risk free rate by assuming that
the trader needs to maintain the liquidity and not investing in risk free rate Hence
Sharpe ratio is calculated as per Equation 3
119878ℎ119886119903119901119890 119877119886119905119894119900 (119878119877) =
120590119877 (3)
Muruganandan
35
where and 120590119877 are respectively the expected return and the total risk of a trading
rule in a given period Higher the ratio superior the performance indicated by it
Ratio of Average Profit to Average Loss (APAL)
This ratio is calculated by dividing the average profit from profitable trade by
average loss from the unprofitable trade The ratio of more than one indicates on
average the trading system correctly predicts the price movement than misleading
the traders Hence a higher ratio indicates the superior ability of the technical
trading rules to predict the future price movement The absolute value of this ratio is
calculated as per Equation 4
119860119875
119860119871= |
119860119907119890119903119886119892119890 119875119903119900119891119894119905
119860119907119890119903119886119892119890 119897119900119904119904| (4)
Percentage of Profitable Trade ( of PT)
This ratio indicates the proportion of profitable trade to total trade signal High
percentage indicates that the trading system identifies price change more accurately
This ratio considers the number of profitable trade to total trading signals and
ignores the value of profit (loss) earned (incurred) This performance metric is
calculated as per Equation 5
119900119891 119875119879 = 119873119906119898119887119890119903 119900119891 119875119903119900119891119894119905119886119887119897119890 119879119903119886119889119894119899119892
119879119900119905119886119897 119873119906119898119887119890119903 119900119891 119879119903119886119889119894119899119892 119904119894119892119899119886119897119904 (5)
Results and Discussion
The summary statistics for the unconditional intraday return for the entire
sample period and the nine non-overlapping sub-periods are presented in Table 3
The intraday mean returns for the entire sample period and for the sub-periods are
negative except for the period Bull-2 Bear-2 period exhibits the highest standard
deviation of 001009 Both highest (0030) and lowest (-0047) daily return for the
entire study period recorded in Bull-1 period The high value of Kurtosis indicates
that the intraday return of BSE Sensex is not normally distributed and there are
outliers However when the market is moving in the Sideway the intraday returns
become more or less normally distributed as evidenced from the low Kurtosis The
evidence of excessive Kurtosis in Bull period indicates that the unconditional
intraday returns were leptokurtic with thicker tails than the Bear and Sideway
markets Hence the variance during Bull periods results from the outliers The
Colombo Business Journal 11(1) 2020
36
negative skewness indicates that the unconditional daily returns were moderately
negatively skewed except for Sideway-1
Table 3 Descriptive Statistics for Unconditional Intraday Return
Cycle Mean Standard
deviation Kurtosis Skew Min Max Count
Overall -000041 000576 48482 -0531 -0047 0030 4545
Bear ndash 1 -000119 000855 12148 -0286 -0035 0026 437
Sideway ndash 1 -000042 000451 06693 0028 -0018 0015 411
Bull ndash 1 -000015 000605 5415 -0785 -0047 0030 1165
Bear ndash 2 -000093 001009 09469 -0359 -0038 0024 280
Bull ndash 2 000025 000583 22848 0049 -0028 0025 411
Sideway ndash 2 -000049 000423 0568 -0217 -0016 0011 679
Bull ndash 3 -000032 000349 22438 -0127 -0018 0012 381
Bear ndash 3 -000098 000406 09085 -0630 -0016 0009 225
Bull ndash 4 -000028 000279 3073 0332 -0009 0016 556
Note Unconditional intraday return defined as the log difference of closing value to opening value by
assuming that the trader buys at the opening value and sells at the closing value
The result of RSI trading rule for BSE Sensex is presented in Table 4 The first
two columns exhibit the number of buy (119873119861) and sell (119873119878) signals generated using
RSI trading rules for the overall period and non-overlapping sub-sample periods
Third and fourth column show the average buy (120583119861) and sell (120583119878) returns along
with t-test in parenthesis The basic assumption of t-test is that the observations are
normally distributed However Table 1 reveals that the returns were not normally
distributed which may question the validity of t-test results and its interpretations In
order to overcome this phenomenon Brock et al (1992) suggested the bootstrap
method developed by Efron (1979) Hence this paper employs the bootstrap
method adopted by McKenzie (2007) which mimics the procedure followed by
Brock et al (1992) Bootstrap process was repeated for 500 times and the resultant t
values and corresponding p values are reported in parentheses and square brackets
respectively However the acceptance and rejection of hypothesis were similar both
in bootstrap p values and t-test In addition standard deviation of buy and sell
signals and the mean difference between buy and sell signals are also presented in
the column five six and seven respectively
Muruganandan
37
Table 4 Statistical Results for RSI Trading Rule
Category NB NS microB microS σB σS microB - microS
Overall 116 178
-000065
(-0352)
[0739]
000003
(1308)
[0232]
000729 000434
-000068
(-0905)
[0367]
Bear ndash 1 15 13
-000002
(0489)
[0645]
00025
(2150)
[0066]
000908 000601
-000252
(-0876)
[0401]
Sideway ndash 1 14 16
-000051
(-0084)
[0946]
000065
(0859)
[0419]
000406 00049
-000116
(-0711)
[0499]
Bull ndash 1 15 54
-000199
(-0801)
[0445]
-00009
(-1273)
[0186]
000892 000414
-00011
(-0464)
[0617]
Bear ndash 2 17 7
000031
(0439)
[0661]
00009
(0488)
[0631]
001134 000979
-000059
(-0128)
[0876]
Bull ndash 2 5 21
000486
(1624)
[0076]
-000039
(-0601)
[0599]
00063 000474
000525
(1749)
[0071]
Sideway ndash 2 26 19
-000165
(-0969)
[0325]
-000009
(0831)
[0411]
0006 000205
-000156
(-1231)
[0246]
Bull ndash 3 4 16
-000121
(-0949)
[0355]
-000037
(-0063)
[0952]
000184 000294
-000084
(-0713)
[0476]
Bear ndash 3 13 5
-000149
(0415)
[0681]
000214
(1296)
[0124]
000373 000279
-00036
(-1357)
[0185]
Bull ndash 4 7 27
00000032
(0334)
[0729]
000037
(1533)
[0162]
000218 000208
-000037
(-0395)
[0691]
Notes 1 NB and NS denote the number of buy and sell signals during the period respectively microB and
microS denote the average return of buy and sell signals respectively σB and σS denote the
standard deviation of buy and sell signal returns respectively
2 Numbers in parentheses are t values and numbers in square brackets are the bootstrap p
values
Colombo Business Journal 11(1) 2020
38
RSI generates more sell signals than buy signals during the Bull market On the
contrary during the Bear and Sideway market RSI produced higher number of buy
signals than sell signals Since RSI has the upper band of 100 if the stock price goes
up continuously RSI remains in the overbought regime and produce more number
of sell signals than buy signals In this case a trader shorting the opportunity based
on RSI sell signals may not make profit as the price will move to the differentother
orbit On the other hand if the stock price goes down continuously the RSI
generates more number of buy signals than the sell signals as opposed to the current
price movement Hence the application of RSI during the long Bull and Bear
markets may not help the trader to make profit even before adjusting the transaction
cost From the result of t-test and bootstrap p values it can be concluded that buy
and sell signals does not reject the null hypothesis that the mean return of buy or sell
signals is not significantly different from the unconditional mean return Moreover
averages of buy signal returns and sell signal returns are not significantly different
from each other These results provide evidence of the existence of weak form
efficiency across the market cycle Hence it can be concluded that traders cannot
outperform the market using the RSI signals during the upward or downward
movement of the market
Table 5 Performance of RSI Trading Signal
Category
Buy Signal Performance Sell Signal Performance
SR APAL of
PT SR APAL
of
PT
Overall -00892 1007 4397 00069 10669 4888
Bear ndash 1 -00022 1489 4000 04160 14933 6923
Sideway ndash 1 -01256 0529 5714 01327 13950 5000
Bull ndash 1 -02242 0896 4000 -02174 10832 3519
Bear ndash 2 00273 1203 4706 00919 09491 5714
Bull ndash 2 07714 1766 8000 -00823 07273 5238
Sideway ndash 2 -02750 0781 3846 -00439 09970 4737
Bull ndash 3 -06576 0298 2500 -01259 07136 5000
Bear ndash 3 -02601 0742 4000 02294 13570 5938
Bull ndash 4 00014 1338 4286 01779 10837 5926
Note SR denotes the Sharpe Ratio APAL denotes the ratio of average profit to average loss
of PT denotes the percentage of profitable trade to total trading signal
Muruganandan
39
Table 5 exhibits the results of Sharpe Ratio (SR) average profit to average loss
ratio (APAL) and percentage of profitable trade to total trading signals For the
overall study period and almost all sub-samples periods buy signal underperforms
the sell signal as per the modified Sharpe ratio The absolute value of average profit
to average loss more than one indicates that the average of profitable trade is more
than the average of unprofitable trade However percentage of profitable trade less
than 50 indicates that RSI generate a higher number of unprofitable trades than
profitable trade Hence average return on buy signal is negative for the overall
study period and for six out of nine sub-sample periods On the other hand RSI sell
signal generated the positive Sharpe ratio for overall period and five out of nine sub-
sample periods Profitable trade to total trade signal indicates sell signal produced
more profitable trade in all sub-sample period except Bull-1 and Sidway-1 market
Though percentage of profitable trade to total trade for overall period is less than
50 (ie 4888) which indicate that the number of unprofitable trades is higher
than the profitable trades the profit per profitable trade is sufficiently enough to
compensate the loss in unprofitable trade The sell signal trading strategy makes
money not only from correctly predicting the market movement but also minimising
the loss quickly and allows the profit to run
The Table 6 exhibits the statistical results for the MACD trading rules During
the study period MACD generated 1522 sell signals and 858 buy signals with the
average return of 000861 and -000128 respectively The standard deviations of buy
signal returns (00179) and sell signal returns (001068) are also presented along
with mean return difference between buy and sell signals (-00021) Buy signal
produced the average negative return for all the sub-sample periods and they were
also not significantly different from the average unconditional mean return Hence
the null hypothesis was accepted and it can be concluded that buy signal produced a
return similar to that of unconditional intraday return However the sell signal
generated positive average return for the overall period and all sub-sample periods
except Bull-2 period In contrast the sell signal returns were significantly different
for the overall period and five out of nine sub-sample periods
Table 6 Statistical Results for MACD Trading Rule
Category NB NS microB microS σB σS microB -microS
Overall 858 1522
-000128
(-142)
[0170]
0000861
(443)
[0002]
0017908 0010686
-000215
(-3203)
[0008]
Colombo Business Journal 11(1) 2020
40
Category NB NS microB microS σB σS microB -microS
Bear ndash 1 141 59
-000021
(0494)
[0631]
0006379
(317)
[0002]
0023008 0018028
-000659
(-2165)
[0036]
Sideway ndash 1 131 71
-000226
(-1524)
[0142]
0000543
(0623)
[0509]
0013614 001285
-000281
(-1452)
[0162]
Bull ndash 1 85 581
-000004
(0043)
[0962]
0000196
(0703)
[0483]
0023623 0011
-000023
(-0090)
[0908]
Bear ndash 2 109 33
-000350
(-0989)
[0337]
0004699
(231)
[0036]
0026444 0013532
-00082
(-2371)
[002]
Bull ndash 2 39 192
-000031
(-0224)
[0816]
-000085
(-1066)
[0311]
0015615 0013721
0000532
(0198)
[0838]
Sideway ndash 2 166 171
-000035
(0171)
[0852]
000195
(375)
[0002]
0011182 0008263
-00023
(-2141)
[0032]
Bull ndash 3 32 165
-000171
(-0514)
[0591]
0000902
(220)
[0028]
0015215 0006737
-000261
(-0952)
[0291]
Bear ndash 3 88 25
-000146
(-0457)
[0643]
0004442
(341)
[0002]
0009516 0007832
-000591
(-3164)
[0004]
Bull ndash 4 67 225
-000205
(-1306)
[0188]
0000871
(2905)
[0008]
0011064 0005643
-000292
(-2080)
[004]
Notes 1 NB and NS denote the number of buy and sell signals during the period respectively microB
and microS denote the average return of buy and sell signals respectively σB and σS denote the
standard deviation of buy and sell signal returns respectively
2 Numbers in parenthesis are t-values and numbers in square brackets are the bootstrap p
values
3 denotes p lt 05
The risk measured by standard deviation is higher in buy signal than sell signal
trading rules for the entire study period and for all the sub-sample periods This
clearly indicates that the trading on buy signal is riskier than the sell signal
Moreover the sell signal average returns were significantly different from the
Muruganandan
41
average buy signal returns in all the Bear market periods and for the overall study
period This result supports the sell signal over buy signal specifically during the
Bear market phases This result sharply contradicts to Tharavanij et al (2015) who
found buy signals outperform the sell signals in Southeast Asian markets
Sharpe ratio average profit to average loss ratio and percentage of profitable
trade to total trade signal for MACD trading rule are presented in Table 7 For the
buy signals percentage of profitable trade to total trade has more than 50 in four
out of nine sub-sample periods but average profit to average loss is less than one
which implies that the profit from correctly predicting market direction is not
sufficient enough to cut down the loss from the failure to predict market direction
Hence Sharpe ratios for all sub-sample periods and the entire study period were
negative However the sell signals correctly predict the market with highest
percentage of profitable trade to total trade of 80 in Bear-3 period Moreover
with less ability to predict market direction in Sideway-1 (4789) and Bull-1
(4905) periods sell signal generated profit to cut down the loss from unprofitable
trade which results in average profit to average loss ratio of more than one for
Sideway-1 (122) and Bull-1 (109) period Overall the result supports the sell
signals over buy signals before considering the transaction costs in the Indian
context
Table 7 Performance of MACD Trading Signal
Category
Buy Signal Performance Sell Signal Performance
SR APAL of
PT SR APAL
of
PT
Overall -0072 0897 47669 008 106 5414
Bear ndash 1 -0009 1110 46809 035 219 5763
Sideway ndash 1 -0166 0701 47328 004 122 4789
Bull ndash 1 -0002 0805 55294 002 109 4905
Bear ndash 2 -0133 0940 43119 035 115 6667
Bull ndash 2 -0020 0734 56410 -006 084 5000
Sideway ndash 2 -0031 1122 45181 024 108 6374
Bull ndash 3 -0112 0563 56250 013 100 5879
Bear ndash 3 -0154 0682 50000 057 108 8000
Bull ndash 4 -0185 0827 41791 015 116 5644
Note SR denotes the Sharpe Ratio APAL denotes the ratio of average profit to average loss
of PT denotes the percentage of profitable trade to total trading signal
Colombo Business Journal 11(1) 2020
42
Conclusion
This paper examines the profitability of RSI and MACD technical trading rules
in the Indian market across market cycles BSE Sensex data for the period from
February 2000 to May 2018 were collected from BSE data base and classified into
nine non-overlapping periods as Bull and Bear markets based on the index
movement The t-tests were applied to test the hypothesis that returns from technical
trading rules were not significantly different from the unconditional daily returns In
addition Sharpe ratio average profit to average loss ratio and percentage of
profitable trade to total trade signal were also employed to have a microscopic view
on technical trading rules
Results support the weak-form efficient theory as RSI failed to deliver the
positive returns even before deducting the transaction costs RSI buy and sell signal
returns were not significantly different from the unconditional intraday return In
terms of market timing RSI wrongly predict the market movement and delivered
the percentage of profitable trade to total trade less than 50 Moreover profitable
trades were insufficient to overcome the loss from unprofitable trade Hence buy
signal generated a negative average return and sell signal posted a low positive
average return before deducting transaction costs Therefore after deducting
transaction costs RSI may not leave any profit in the hands of traders
MACD sell signal produced significant positive returns compared to buy signal
and unconditional intraday return However as per Sharpe ratio MACD sell signal
failed to produce the return in line with risk taken Sharpe ratio of less than one
indicates that risk associated with the technical trading rule is more than the return
generated by RSI and MACD In addition even profitable MACD sell signal does
not help in market timing It makes money from higher average profit from
profitable trade than average loss from unprofitable trade However MACD does
not help to reduce the unprofitable trade Hence the study concludes that the trader
cannot earn abnormal return consistently with the help of RSI and MACD across
market cycle in the Indian context RSI and MACD are very old and yet still widely
used as technical tools in real time stock price prediction On the other hand latest
development in information technology and changes in legal systems may have
helped the market to absorb RSI and MACD signals in current price with no time
and cost However in order to empirically validate this assumption a future study
may be extended using a proxy for information technology development and its
impact on trading rules across industries and individual stocks in emerging markets
Muruganandan
43
Declaration of Conflict of Interest
The author declared no potential conflict of interest with respect to the research
authorship and publication of this article
Acknowledgement
I would like to thank anonymous reviewers for their valuable suggestions
References
Allen F amp Karjalainen R (1999) Using genetic algorithms to find technical
trading rules Journal of Financial Economics 51(2) 245ndash271
httpsdoiorg101016S0304-405X(98)00052-X
Almujamed H I Fifield S amp Power D (2013) An investigation of the role of
technical analysis in Kuwait Qualitative Research in Financial Markets 5(1)
43ndash64 httpsdoiorg10110817554171311308959
Anghel G D I (2015) Stock market efficiency and the MACD Evidence from
countries around the world Procedia Economics and Finance 32 1414ndash1431
httpsdoiorg101016S2212-5671(15)01518-X
Atanasova C V amp Hudson R S (2010) Technical trading rules and calendar
anomalies mdash Are they the same phenomena Economics Letters 106(2) 128ndash
130 httpsdoiorg101016jeconlet200911001
Balsara N J Chen G amp Zheng L (2007) The Chinese stock market An
examination of the random walk model and technical trading rules Quarterly
Journal of Business amp Economics 46(2) 43ndash63 httpswwwjstororgstable
40473435
Balsara N Chen J amp Zheng L (2009) Profiting from a contrarian application of
technical trading rules in the US stock market Journal of Asset Management
10(2) 97ndash123 httpsdoiorg101057jam200844
Brock W Lakonishok J amp LeBaron B (1992) Simple technical trading rules
and stochastic properties of stock returns The Journal of Finance 47(5) 1731ndash
1764 httpsdoiorg101111j1540-62611992tb04681x
Chang E J Lima E J A amp Tabak B M (2004) Testing for predictability in
emerging equity markets Emerging Markets Review 5(3) 295ndash316
httpsdoi101016jememar200403005
Chiang Y-C Ke M-C Liao T L amp Wang C D (2012) Are technical trading
strategies still profitable - Evidence from the Taiwan Stock Index Futures
Market Applied Financial Economics 22(12) 955ndash965 httpsdoiorg
101080096031072011631893
Chong T T-L amp Ng W-K (2008) Technical analysis and the London stock
exchange Testing the MACD and RSI rules using the FT30 Applied
Colombo Business Journal 11(1) 2020
44
Economics Letters 15(14) 1111ndash1114 httpsdoiorg10108013504850600
993598
Cohen G amp Cabiri E (2015) Can technical oscillators outperform the buy and
hold strategy Applied Economics 47(30) 3189ndash3197 httpsdoiorg101080
0003684620151013609
Efron B (1979) Bootstrap methods Another look at the Jackknife The Annals of
Statistics 7(1)1ndash26 httpsprojecteuclidorgeuclidaos 1176344552
Fama (1970) Efficient capital markets a review of theory and empirical work
Journal of Finance 25(2) 383-417 httpswwwjstororgstable2325486
Gencay R (1998) The predictability of security returns with simple technical
trading rules Journal of Empirical Finance 5(4) 347ndash359 httpsdoiorg
101016S0927-5398(97)00022-4
Gunasekarage A amp Power D M (2001) The profitability of moving average
trading rules in South Asian stock markets Emerging Markets Review 2(1)
17ndash33 httpsdoiorg101016S1566-0141(00)00017-0
Henderson C (2002) Currency strategy The practitionerrsquos guide to currency
investing hedging and forecasting John Willy amp Sons
Heng P amp Niblock S J (2014) Trading with tigers A technical analysis of
Southeast Asian stock index futures International Economic Journal 28(4)
679ndash692 httpsdoiorg101080101687372014928895
Hudson R Dempsey M amp Keasey K (1996) A note on weak form efficiency of
capital markets The application of simple technical trading rules to UK stock
prices- 1935-1994 Journal of Banking and Finance 20(6) 1121ndash1132
httpsdoiorg1010160378-4266(95)00043-7
Jensen M C amp Benington G A (1970) Random walk and technical theories
Some additional evidence Journal of Finance 25 469ndash482
httpswwwjstororgstable2325495
Krausz J Lee S-Y amp Nam K (2009) Profitability of nonlinear dynamics
under technical trading rules Evidence from Pacific basin stock markets
Emerging Markets Finance amp Trade 45(4) 13ndash35 httpsdoiorg102753
REE1540-496X450402
Khatua A (2016) An application of moving average convergence and divergence
(MACD) indicator on selected stocks listed on National Stock Exchange (NSE)
httpdxdoiorg102139ssrn2872665
Kulkarni A D amp More A (2014) An application of moving average convergence
divergence (MACD) indicator on selected stocks listed on Bombay Stock
Exchange (BSE) Oriental Journal of Computer Science and Technology 7(3)
396ndash400 httpwwwcomputerscijournalorgp=1500
Lokeshwarri S K (2017 April 07) The big story ndash Sit back go passive The Hindu
Business Line (Coimbatore Edition) p 2
Muruganandan
45
Marshall B R Cahan R H amp Cahan J M (2008) Does intraday technical
analysis in the US equity market have value Journal of Empirical Finance
15(2) 199ndash210 httpsdoiorg101016jjempfin200605003
Marshall B R Young M R amp Cahan R (2008) Are candlestick technical
trading strategies profitable in the Japanese equity market Review of
Quantitative Finance and Accounting 31(2) 191ndash207 httpsdoiorg101007
s11156-007-0068-1
Metghalchi M Chen C-P Hajilee M (2016) Moving average trading rules for
NASDAQ composite index Applied Finance Letters 5(2) 45ndash57
httpsdoiorg1024135aflv5i254
Metghalchi M amp Hayes L A Niroomand F (2019) A technical approach to
equity investing in emerging markets Review of Financial Economics 37(3)
389ndash403 httpsdoiorg101002rfe1041
McKenzie M D (2007) Technical trading rules in emerging market and the 1997
Asian currency crises Emerging Market Finance and Trade 43(4) 46ndash73
httpsdoiorg102753REE1540-496X430403
Ming-Ming L Balachandher K G amp Nor F M (2002) An examination of the
random walk model and technical trading rules in the Malaysian stock market
Quarterly Journal of Business amp Economics 41(1) 81ndash104
httpswwwjstororgstable40473346
Ming-Ming L amp Siok-Hwa L (2006) The profitability of the simple moving
averages and trading range breakout in the Asian stock markets Journal of
Asian Economics 17(1) 144ndash170 httpsdoiorg101016jasieco200512001
Mitra S K (2011) How rewarding is technical analysis in Indian stock market
Quantitative Finance 11(2) 287ndash297 httpsdoiorg101080
14697680903493581
Nazario R T F Silva J L amp Sobrero V A (2017) A literature review of
technical analysis on stock markets The Quarterly Review of Economics and
Finance 66 115ndash126 httpsdoiorg101016jqref201701014
Neftccedili S N (1991) Naiumlve trading rules in financial markets and Wiener-
Kolmogorov prediction theory A study of ldquotechnical analysisrdquo Journal of
Business 64(4) 549ndash571
Ni Y Day M-Y Huang P ampYu S-R (2020) The profitability of Bollinger
Bamps Evidence from the constituent stocks of Taiwan 50 Physica A Statistical
Mechanics and Its Applications Advance online publication httpsdoiorg
101016jphysa2020124144
Nor S M amp Wickremasinghe G (2014) The profitability of MACD and RSI
trading rules in the Australian stock market Investment Management and
Financial Innovation 11(4) 194ndash199
Colombo Business Journal 11(1) 2020
46
Rosillo R de La Fuente D amp Brugos J A L (2013) Technical analysis and the
Spanish stock market Testing the RSI and MACD momentum and stochastic
rule using Spanish market companies Applied Economics 45(12) 1541ndash1550
httpsdoiorg101080000368462011631894
Sehgal S amp Garhyan A (2002) Abnormal returns using technical returns The
Indian experience Finance India 16(1) 181ndash203
Sehgal S amp Gupta M (2007) Tests of technical analysis in India Vision The
Journal of Business Perspective 11(3) 11ndash23 httpsdoiorg101177
097226290701100303
Sobreiro V A da Costa T R C C Nazaacuterio R T F e Silva J L Moreira E
A Filho M C L Kimura H amp Zambrano J C A (2016) The profitability
of moving average trading rules in BRICS and emerging stock markets North
American Journal of Economics and Finance 38 86ndash101 httpsdoiorg
101016jnajef201608003
Tian G G Wan G H amp Guo M (2002) Market efficiency and the returns to
simple technical trading rules New evidence from US equity market and
Chinese equity markets Asia-Pacific Financial Markets 9(3) 241ndash258
httpsdoiorg101023A1024181515265
Tharavanij P Siraprapasiri V amp Rajchamaha K (2015) Performance of
technical trading rules Evidence from Southeast Asian Stock Market
Springerplus 4552 httpsdoiorg101186s40064-015-1334-7
Wang J-L amp Chan S-H (2007) Stock market trading rule discovery using
pattern recognition and technical analysis Expert Systems with Applications
33(2) 304ndash315 httpsdoiorg101016jeswa200605002
Welles J Jr (1978) New concepts in technical trading systems Hunter Publishing
Company
Wong W-K Manzur M amp Chew B-K (2003) How rewarding is technical
analysis Evidence from Singapore stock market Journal of Applied Financial
Economics 13(7) 543ndash551 httpsdoiorg1010800960310022000020906
Yu H Nartea G V Gan C amp Yao L J (2013) Predictive ability and
profitability of simple technical trading rules Recent evidence from Southeast
Asian stock markets International Review of Economics and Finance 25 356ndash
371 httpsdoiorg101016jiref201207016
Zhu H Jiang Z-Q Li S-P amp Zhou W-X (2015) Profitability of simple
technical trading rules of Chinese stock exchange indexes Physica A
Statistical Mechanics and Its Applications 439 75ndash84 httpsdoiorg101016
jphysa201507032

Muruganandan
29
market cycle conditions They used the daily closing price and volume information
of 65 companies constituted in BSE 100 index for the period from January 1999 to
December 2004 They concluded that past price and volume information of large
size companies were immediately incorporated in current price as these stocks were
tracked by several investors and fund managers Gunasekarage and Power (2001)
applied variable length moving average and fixed length moving average in South
Asian stock markets and generated excess returns in Colombo Stock Exchange
(CSE) Dhaka Stock Exchange (DSE) and Karachi Stock Exchange (KSE) whereas
Bombay Stock Exchange (BSE) supported the EMH Sehgal and Garhyan (2002)
examined the On Balance Volume (OBV) technical analysis with transaction cost
using daily data of 21 companies listed in BSE for the period from April 1996 to
March 1998 The result supports the technical analysis and rejects the EMH Mitra
(2011) analysed the profitability of moving average in Indian stock index for the
period from 1998 to 2008 He predicted the direction of index movement using
moving average but failed to deliver positive return after transaction costs Kulkarni
and Mode (2014) and Khatua (2016) examined the MACDrsquos prediction ability of
individual stocks and supported the technical analysis However these studies
considered limited data with a small number of companies and ignored the risk
adjusted return in Indian context
Significant earlier studies support the EMH and reject the technical analysis in
developed markets at least in weak form (Allen amp Karjalainen 1999 Chang et al
2004 Hudson et al 1996 Gencay 1998 Neftci 1991 Tian et al 2002) On the
contrary studies in emerging markets concluded that technical analysts in emerging
markets were able to make profit than their counterparts in developed markets
(Balsara et al 2007 Chang et al 2004 Chiang et al 2012 Ming-Ming et al
2002 Metghalchi et al 2019 Ni et al 2020) This may be due to the inherent
characteristics of emerging markets such as weak competition inefficient legal
systems absence of strong supervising institutions less market participants and lack
of infrastructure for information dissemination On the other hand the most recent
studies question the profitability of technical trading rules in emerging markets after
considering transaction costs (Heng amp Niblock 2014 Sehga amp Gupta 2007
Tharavanji et al 2015 Yu et al 2013 Zhu et al 2015) Nazario et al (2017)
consolidated the outcome of 85 research papers in a scientific way and concluded
that a considerable number of research papers favour weak form of market
efficiency without considering the risk adjusted return However Marshall Cahan
and Cahan (2008) survey of market participants indicates that stock traders and
investors place more emphasis on technical analysis than fundamental factors
Colombo Business Journal 11(1) 2020
30
This existing discrepancy in literature demands research on emerging marketsrsquo
information efficiency in the recent past Further the ability of technical trading
rules to predict stock returns is inadequately researched in emerging markets
Hence this study attempts to analyse the profitability of technical trading rules in
economically dynamic and rapidly growing emerging markets such as India
Further the total study period was classified as Bull and Bear market and employed
risk adjusted performance measures like Sharpe ratio ratio of average profit to
average loss and percentage of profitable trade to have a microscopic view on the
performance of technical analysis in the Indian context
Data and Methodology
This empirical study covers the period from February 2000 to May 2018 and the
total study period is categorised into Bull and Bear market as per Lokeshwarri
(2017) which is shown in Table 1 and supported by Figure1
Table 1 Cyclical Bull and Bear Phases in Sensex
Start Date End Date Change in
percentage Category
Time in
Months
Feb ndash 2000 Sep ndash 2001 -5781 Bear ndash 1 19
Sep ndash 2001 May ndash 2003 1310 Sideway ndash 1 20
May ndash 2003 Jan ndash 2008 62263 Bull ndash 1 56
Jan ndash 2008 Mar ndash 2009 -6205 Bear ndash 2 13
Mar ndash 2009 Nov ndash 2010 16231 Bull ndash 2 20
Nov ndash 2010 Aug ndash 2013 -1734 Sideway ndash 2 33
Aug ndash 2013 Mar ndash 2015 7208 Bull ndash 3 19
Mar ndash 2015 Feb ndash 2016 -2508 Bear ndash 3 11
Feb ndash 2016 May ndash 2018 5560 Bull ndash 4 27
Source Lokeshwarri (2017)
The daily opening closing high and low values for BSE Sensex were extracted
from BSE data base The widely used trading rules such as Relative Strength Index
(RSI) and Moving Average Convergence and Divergence (MACD) are employed to
generate Buy Hold and Sell signals which are explained below
Figure 1 Bull and Bear Phases of BSE Sensex during the Study Period
112002112001112000
6000
4500
3000
112003112002
3500
3000
2500
112008112006112004
20000
1700015000
10000
5000
2000
112009712008112008
20000
15000
10000
112011112010112009
20000
15000
10000
112014112013112012112011
20000
17500
15000
112015112014
30000
25000
20000
112016912015512015112015
30000
27500
25000
112018112017112016
35000
30000
25000
Bear 1 Sideway 1 Bull 1
Bear 2 Bull 2 Sideway 2
Bull 3 Bear 3 Bull 4
Mu
rug
an
and
an
31
Colombo Business Journal 11(1) 2020
32
Relative Strength Index (RSI)
RSI is a technical indicator which used to identify the overbought and oversold
condition of financial securities First relative strength is calculated by dividing the
simple average of closing values on up days by the average of closing values on
down days over a given period of time which is 14 days in this study The step-by-
step trading decision based on RSI is demonstrated as follows
Steps in generating Buy Hold and Sell Signals
1 Input Closing (119862119905) and Opening (119874119905) value of the Index on day t
2 Up Days (119880119905) 119862119905 119894119891 (119862119905 minus 119862119905minus1) gt 0 119890119897119904119890 0
3 Down Days (119863119905) 119862119905 119894119891 (119862119905 minus 119862119905minus1) lt 0 119890119897119904119890 0
4 Relative Strength (119877119878)
119877119878119905 =
sum 119880119905 119894=119905minus(119899minus1)119894=119905
119899
sum 119863119905 119894=119905minus(119899minus1)119894=119905
119899
5 Relative Strength Index (119877119878119868119905)
119877119878119868119905 = 100 minus (100
1 + 119877119878119905)
6 Trading Decision1 119861119906119910 119874119905+1
119894119891119877119878119868119905 gt 30 amp 119877119878119868119905minus1 le 30
Else
119878119886119897119890 119874119905+1
119894119891 119877119878119868119905 gt 70 amp 119877119878119868119905minus1 le 70
Or
Hold
7 Output Calculation of Return
119894119891 119887119906119910 119874119905+1 =
(119897119900119892(119862119905+1) minus 119897119900119892(119874119905+1))
119894119891 119878119886119897119890 119874119905+1 =
(119897119900119892(119874119905+1) minus 119897119900119892(119862119905+1))
1 The trading rules were applied as per Welles (1978) Henderson (2002) and Rosillo et al
(2013) Unlike previous studies in order to imitate the real time stock trading scenario
opening and closing values were considered for executing the trading signals and calculation
of return
Muruganandan
33
Moving Average Convergence and Divergence (MACD)
MACD is constructed based on historical exponential moving average of
closing value of index to identify the trend changes in its value It is computed
based on the difference between longer exponential moving averages (26 days)
from a shorter exponential moving average (12 days) In addition nine days simple
moving average of MACD is used as a sign to generate buy and sell signals Step-
by-step trading decision is presented as follows
Steps in generating Buy Hold and Sell Signals
1 Input Closing (119862119905) and Opening (119874119905) value of the Index on day t
2 Exponential Moving Average
119899 = 12 119886119899119889 26 119889119886119910119904 119891119900119903 119904ℎ119900119903119905 119886119899119889 119897119900119899119892 119864119872119860 119903119890119904119901119890119888119905119894119907119890119897119910
119864119872119860119905(119899) = sum (2
1+119899)
119894=119905minus(119899minus1)119894=119905 times 119862119905 + (1 minus
2
1+119899) times 119864119872119860119905minus1(119899)
3 119872119860119862119863 119864119872119860119905(119878ℎ119900119903119905119890119903) minus 119864119872119860119905(119871119900119899119892119890119903)
4 Signal Line 119878119894119892119899119905 = 1198781198721198609(119872119860119862119863)
5 Trading Decision2 119861119906119910 119874119905+1
119894119891119872119860119862119863119905 lt 0 119878119894119892119899119905 lt 0 amp 119878119894119892119899119905 gt 119872119860119862119863119905
Else
119878119886119897119890 119874119905+1
119894119891119872119860119862119863119905 gt 0 119878119894119892119899119905 gt 0 amp 119878119894119892119899119905 lt 119872119860119862119863119905
Or
Hold
6 Output Calculation of Return
119894119891 119887119906119910 119874119905+1 =
(119897119900119892(119862119905+1) minus 119897119900119892(119874119905+1))
119894119891 119878119886119897119890 119874119905+1 =
(119897119900119892(119874119905+1) minus 119897119900119892(119862119905+1))
Further the following hypotheses were framed to test whether returns of buy or
sell signals are different from the unconditional mean return and also whether the
mean buy signal return is different from mean sell signal return The null and
alternative hypotheses of the study are stated in Table 2
2 The trading rules were applied as per Rosillo et al (2013) Unlike previous studies in
order to imitate the real time stock trading scenario opening and closing values were
considered for executing the trading signals and calculation of return
Colombo Business Journal 11(1) 2020
34
Table2 Hypotheses of the Study
Buy-Unconditional
Return
Sell-Unconditional
Return
Buy ndash Sell
Return
Ho 120583119861 minus 120583119880 = 0 120583119878 minus 120583119880 = 0 120583119861 minus 120583119878 = 0
Ha 120583119861 minus 120583119880 ne 0 120583119878 minus 120583119880 ne 0 120583119861 minus 120583119878 ne 0
After the formulation of hypotheses t-statistics were used to test the null
hypothesis of equality between unconditional mean return (120583) and mean return of
trading rules (120583119903) which is specified in Equation 1
119905119903 = 120583119887119906119910 (119904119890119897119897)minus120583
radic120590119887119906119910( 119904119890119897119897)
2
119873119887119906119910(119904119890119897119897)+
1205902
119873
(1)
where 120583119887119906119910 (119904119890119897119897) is the mean technical trading return of buy or sell 119873119887119906119910(119904119890119897119897) is the
number of trades for the buy or sell signal 120583 and N are the unconditional mean
return and number of observations respectively and 1205902 is the estimated sample
variance In testing long-short strategies (buy-sell) t-statistics is computed as
follows
119905119887119906119910minus119904119890119897119897 = 120583119887119906119910minus120583119904119890119897119897
radic120590119861119906119910
2
119873119861119906119910+
1205901198781198901198971198972
119873119878119890119897119897
(2)
where 120583119887119906119910 and 120583119904119890119897119897 are the mean returns of buy signal and sell signals 120590119861119906119910 and
120590119878119890119897119897 are the estimated sample standard deviations of buy and sell signals
respectively 119873119861119906119910 and 119873119878119890119897119897 are the number of buy and sell signals respectively
Performance Measures
Sharpe Ratio
Reward to total risk is calculated using Sharpe Ratio which measures the
expected return to per unit of total risk taken In the perspective of trading the
standard Sharpe ratio is modified by excluding the risk free rate by assuming that
the trader needs to maintain the liquidity and not investing in risk free rate Hence
Sharpe ratio is calculated as per Equation 3
119878ℎ119886119903119901119890 119877119886119905119894119900 (119878119877) =
120590119877 (3)
Muruganandan
35
where and 120590119877 are respectively the expected return and the total risk of a trading
rule in a given period Higher the ratio superior the performance indicated by it
Ratio of Average Profit to Average Loss (APAL)
This ratio is calculated by dividing the average profit from profitable trade by
average loss from the unprofitable trade The ratio of more than one indicates on
average the trading system correctly predicts the price movement than misleading
the traders Hence a higher ratio indicates the superior ability of the technical
trading rules to predict the future price movement The absolute value of this ratio is
calculated as per Equation 4
119860119875
119860119871= |
119860119907119890119903119886119892119890 119875119903119900119891119894119905
119860119907119890119903119886119892119890 119897119900119904119904| (4)
Percentage of Profitable Trade ( of PT)
This ratio indicates the proportion of profitable trade to total trade signal High
percentage indicates that the trading system identifies price change more accurately
This ratio considers the number of profitable trade to total trading signals and
ignores the value of profit (loss) earned (incurred) This performance metric is
calculated as per Equation 5
119900119891 119875119879 = 119873119906119898119887119890119903 119900119891 119875119903119900119891119894119905119886119887119897119890 119879119903119886119889119894119899119892
119879119900119905119886119897 119873119906119898119887119890119903 119900119891 119879119903119886119889119894119899119892 119904119894119892119899119886119897119904 (5)
Results and Discussion
The summary statistics for the unconditional intraday return for the entire
sample period and the nine non-overlapping sub-periods are presented in Table 3
The intraday mean returns for the entire sample period and for the sub-periods are
negative except for the period Bull-2 Bear-2 period exhibits the highest standard
deviation of 001009 Both highest (0030) and lowest (-0047) daily return for the
entire study period recorded in Bull-1 period The high value of Kurtosis indicates
that the intraday return of BSE Sensex is not normally distributed and there are
outliers However when the market is moving in the Sideway the intraday returns
become more or less normally distributed as evidenced from the low Kurtosis The
evidence of excessive Kurtosis in Bull period indicates that the unconditional
intraday returns were leptokurtic with thicker tails than the Bear and Sideway
markets Hence the variance during Bull periods results from the outliers The
Colombo Business Journal 11(1) 2020
36
negative skewness indicates that the unconditional daily returns were moderately
negatively skewed except for Sideway-1
Table 3 Descriptive Statistics for Unconditional Intraday Return
Cycle Mean Standard
deviation Kurtosis Skew Min Max Count
Overall -000041 000576 48482 -0531 -0047 0030 4545
Bear ndash 1 -000119 000855 12148 -0286 -0035 0026 437
Sideway ndash 1 -000042 000451 06693 0028 -0018 0015 411
Bull ndash 1 -000015 000605 5415 -0785 -0047 0030 1165
Bear ndash 2 -000093 001009 09469 -0359 -0038 0024 280
Bull ndash 2 000025 000583 22848 0049 -0028 0025 411
Sideway ndash 2 -000049 000423 0568 -0217 -0016 0011 679
Bull ndash 3 -000032 000349 22438 -0127 -0018 0012 381
Bear ndash 3 -000098 000406 09085 -0630 -0016 0009 225
Bull ndash 4 -000028 000279 3073 0332 -0009 0016 556
Note Unconditional intraday return defined as the log difference of closing value to opening value by
assuming that the trader buys at the opening value and sells at the closing value
The result of RSI trading rule for BSE Sensex is presented in Table 4 The first
two columns exhibit the number of buy (119873119861) and sell (119873119878) signals generated using
RSI trading rules for the overall period and non-overlapping sub-sample periods
Third and fourth column show the average buy (120583119861) and sell (120583119878) returns along
with t-test in parenthesis The basic assumption of t-test is that the observations are
normally distributed However Table 1 reveals that the returns were not normally
distributed which may question the validity of t-test results and its interpretations In
order to overcome this phenomenon Brock et al (1992) suggested the bootstrap
method developed by Efron (1979) Hence this paper employs the bootstrap
method adopted by McKenzie (2007) which mimics the procedure followed by
Brock et al (1992) Bootstrap process was repeated for 500 times and the resultant t
values and corresponding p values are reported in parentheses and square brackets
respectively However the acceptance and rejection of hypothesis were similar both
in bootstrap p values and t-test In addition standard deviation of buy and sell
signals and the mean difference between buy and sell signals are also presented in
the column five six and seven respectively
Muruganandan
37
Table 4 Statistical Results for RSI Trading Rule
Category NB NS microB microS σB σS microB - microS
Overall 116 178
-000065
(-0352)
[0739]
000003
(1308)
[0232]
000729 000434
-000068
(-0905)
[0367]
Bear ndash 1 15 13
-000002
(0489)
[0645]
00025
(2150)
[0066]
000908 000601
-000252
(-0876)
[0401]
Sideway ndash 1 14 16
-000051
(-0084)
[0946]
000065
(0859)
[0419]
000406 00049
-000116
(-0711)
[0499]
Bull ndash 1 15 54
-000199
(-0801)
[0445]
-00009
(-1273)
[0186]
000892 000414
-00011
(-0464)
[0617]
Bear ndash 2 17 7
000031
(0439)
[0661]
00009
(0488)
[0631]
001134 000979
-000059
(-0128)
[0876]
Bull ndash 2 5 21
000486
(1624)
[0076]
-000039
(-0601)
[0599]
00063 000474
000525
(1749)
[0071]
Sideway ndash 2 26 19
-000165
(-0969)
[0325]
-000009
(0831)
[0411]
0006 000205
-000156
(-1231)
[0246]
Bull ndash 3 4 16
-000121
(-0949)
[0355]
-000037
(-0063)
[0952]
000184 000294
-000084
(-0713)
[0476]
Bear ndash 3 13 5
-000149
(0415)
[0681]
000214
(1296)
[0124]
000373 000279
-00036
(-1357)
[0185]
Bull ndash 4 7 27
00000032
(0334)
[0729]
000037
(1533)
[0162]
000218 000208
-000037
(-0395)
[0691]
Notes 1 NB and NS denote the number of buy and sell signals during the period respectively microB and
microS denote the average return of buy and sell signals respectively σB and σS denote the
standard deviation of buy and sell signal returns respectively
2 Numbers in parentheses are t values and numbers in square brackets are the bootstrap p
values
Colombo Business Journal 11(1) 2020
38
RSI generates more sell signals than buy signals during the Bull market On the
contrary during the Bear and Sideway market RSI produced higher number of buy
signals than sell signals Since RSI has the upper band of 100 if the stock price goes
up continuously RSI remains in the overbought regime and produce more number
of sell signals than buy signals In this case a trader shorting the opportunity based
on RSI sell signals may not make profit as the price will move to the differentother
orbit On the other hand if the stock price goes down continuously the RSI
generates more number of buy signals than the sell signals as opposed to the current
price movement Hence the application of RSI during the long Bull and Bear
markets may not help the trader to make profit even before adjusting the transaction
cost From the result of t-test and bootstrap p values it can be concluded that buy
and sell signals does not reject the null hypothesis that the mean return of buy or sell
signals is not significantly different from the unconditional mean return Moreover
averages of buy signal returns and sell signal returns are not significantly different
from each other These results provide evidence of the existence of weak form
efficiency across the market cycle Hence it can be concluded that traders cannot
outperform the market using the RSI signals during the upward or downward
movement of the market
Table 5 Performance of RSI Trading Signal
Category
Buy Signal Performance Sell Signal Performance
SR APAL of
PT SR APAL
of
PT
Overall -00892 1007 4397 00069 10669 4888
Bear ndash 1 -00022 1489 4000 04160 14933 6923
Sideway ndash 1 -01256 0529 5714 01327 13950 5000
Bull ndash 1 -02242 0896 4000 -02174 10832 3519
Bear ndash 2 00273 1203 4706 00919 09491 5714
Bull ndash 2 07714 1766 8000 -00823 07273 5238
Sideway ndash 2 -02750 0781 3846 -00439 09970 4737
Bull ndash 3 -06576 0298 2500 -01259 07136 5000
Bear ndash 3 -02601 0742 4000 02294 13570 5938
Bull ndash 4 00014 1338 4286 01779 10837 5926
Note SR denotes the Sharpe Ratio APAL denotes the ratio of average profit to average loss
of PT denotes the percentage of profitable trade to total trading signal
Muruganandan
39
Table 5 exhibits the results of Sharpe Ratio (SR) average profit to average loss
ratio (APAL) and percentage of profitable trade to total trading signals For the
overall study period and almost all sub-samples periods buy signal underperforms
the sell signal as per the modified Sharpe ratio The absolute value of average profit
to average loss more than one indicates that the average of profitable trade is more
than the average of unprofitable trade However percentage of profitable trade less
than 50 indicates that RSI generate a higher number of unprofitable trades than
profitable trade Hence average return on buy signal is negative for the overall
study period and for six out of nine sub-sample periods On the other hand RSI sell
signal generated the positive Sharpe ratio for overall period and five out of nine sub-
sample periods Profitable trade to total trade signal indicates sell signal produced
more profitable trade in all sub-sample period except Bull-1 and Sidway-1 market
Though percentage of profitable trade to total trade for overall period is less than
50 (ie 4888) which indicate that the number of unprofitable trades is higher
than the profitable trades the profit per profitable trade is sufficiently enough to
compensate the loss in unprofitable trade The sell signal trading strategy makes
money not only from correctly predicting the market movement but also minimising
the loss quickly and allows the profit to run
The Table 6 exhibits the statistical results for the MACD trading rules During
the study period MACD generated 1522 sell signals and 858 buy signals with the
average return of 000861 and -000128 respectively The standard deviations of buy
signal returns (00179) and sell signal returns (001068) are also presented along
with mean return difference between buy and sell signals (-00021) Buy signal
produced the average negative return for all the sub-sample periods and they were
also not significantly different from the average unconditional mean return Hence
the null hypothesis was accepted and it can be concluded that buy signal produced a
return similar to that of unconditional intraday return However the sell signal
generated positive average return for the overall period and all sub-sample periods
except Bull-2 period In contrast the sell signal returns were significantly different
for the overall period and five out of nine sub-sample periods
Table 6 Statistical Results for MACD Trading Rule
Category NB NS microB microS σB σS microB -microS
Overall 858 1522
-000128
(-142)
[0170]
0000861
(443)
[0002]
0017908 0010686
-000215
(-3203)
[0008]
Colombo Business Journal 11(1) 2020
40
Category NB NS microB microS σB σS microB -microS
Bear ndash 1 141 59
-000021
(0494)
[0631]
0006379
(317)
[0002]
0023008 0018028
-000659
(-2165)
[0036]
Sideway ndash 1 131 71
-000226
(-1524)
[0142]
0000543
(0623)
[0509]
0013614 001285
-000281
(-1452)
[0162]
Bull ndash 1 85 581
-000004
(0043)
[0962]
0000196
(0703)
[0483]
0023623 0011
-000023
(-0090)
[0908]
Bear ndash 2 109 33
-000350
(-0989)
[0337]
0004699
(231)
[0036]
0026444 0013532
-00082
(-2371)
[002]
Bull ndash 2 39 192
-000031
(-0224)
[0816]
-000085
(-1066)
[0311]
0015615 0013721
0000532
(0198)
[0838]
Sideway ndash 2 166 171
-000035
(0171)
[0852]
000195
(375)
[0002]
0011182 0008263
-00023
(-2141)
[0032]
Bull ndash 3 32 165
-000171
(-0514)
[0591]
0000902
(220)
[0028]
0015215 0006737
-000261
(-0952)
[0291]
Bear ndash 3 88 25
-000146
(-0457)
[0643]
0004442
(341)
[0002]
0009516 0007832
-000591
(-3164)
[0004]
Bull ndash 4 67 225
-000205
(-1306)
[0188]
0000871
(2905)
[0008]
0011064 0005643
-000292
(-2080)
[004]
Notes 1 NB and NS denote the number of buy and sell signals during the period respectively microB
and microS denote the average return of buy and sell signals respectively σB and σS denote the
standard deviation of buy and sell signal returns respectively
2 Numbers in parenthesis are t-values and numbers in square brackets are the bootstrap p
values
3 denotes p lt 05
The risk measured by standard deviation is higher in buy signal than sell signal
trading rules for the entire study period and for all the sub-sample periods This
clearly indicates that the trading on buy signal is riskier than the sell signal
Moreover the sell signal average returns were significantly different from the
Muruganandan
41
average buy signal returns in all the Bear market periods and for the overall study
period This result supports the sell signal over buy signal specifically during the
Bear market phases This result sharply contradicts to Tharavanij et al (2015) who
found buy signals outperform the sell signals in Southeast Asian markets
Sharpe ratio average profit to average loss ratio and percentage of profitable
trade to total trade signal for MACD trading rule are presented in Table 7 For the
buy signals percentage of profitable trade to total trade has more than 50 in four
out of nine sub-sample periods but average profit to average loss is less than one
which implies that the profit from correctly predicting market direction is not
sufficient enough to cut down the loss from the failure to predict market direction
Hence Sharpe ratios for all sub-sample periods and the entire study period were
negative However the sell signals correctly predict the market with highest
percentage of profitable trade to total trade of 80 in Bear-3 period Moreover
with less ability to predict market direction in Sideway-1 (4789) and Bull-1
(4905) periods sell signal generated profit to cut down the loss from unprofitable
trade which results in average profit to average loss ratio of more than one for
Sideway-1 (122) and Bull-1 (109) period Overall the result supports the sell
signals over buy signals before considering the transaction costs in the Indian
context
Table 7 Performance of MACD Trading Signal
Category
Buy Signal Performance Sell Signal Performance
SR APAL of
PT SR APAL
of
PT
Overall -0072 0897 47669 008 106 5414
Bear ndash 1 -0009 1110 46809 035 219 5763
Sideway ndash 1 -0166 0701 47328 004 122 4789
Bull ndash 1 -0002 0805 55294 002 109 4905
Bear ndash 2 -0133 0940 43119 035 115 6667
Bull ndash 2 -0020 0734 56410 -006 084 5000
Sideway ndash 2 -0031 1122 45181 024 108 6374
Bull ndash 3 -0112 0563 56250 013 100 5879
Bear ndash 3 -0154 0682 50000 057 108 8000
Bull ndash 4 -0185 0827 41791 015 116 5644
Note SR denotes the Sharpe Ratio APAL denotes the ratio of average profit to average loss
of PT denotes the percentage of profitable trade to total trading signal
Colombo Business Journal 11(1) 2020
42
Conclusion
This paper examines the profitability of RSI and MACD technical trading rules
in the Indian market across market cycles BSE Sensex data for the period from
February 2000 to May 2018 were collected from BSE data base and classified into
nine non-overlapping periods as Bull and Bear markets based on the index
movement The t-tests were applied to test the hypothesis that returns from technical
trading rules were not significantly different from the unconditional daily returns In
addition Sharpe ratio average profit to average loss ratio and percentage of
profitable trade to total trade signal were also employed to have a microscopic view
on technical trading rules
Results support the weak-form efficient theory as RSI failed to deliver the
positive returns even before deducting the transaction costs RSI buy and sell signal
returns were not significantly different from the unconditional intraday return In
terms of market timing RSI wrongly predict the market movement and delivered
the percentage of profitable trade to total trade less than 50 Moreover profitable
trades were insufficient to overcome the loss from unprofitable trade Hence buy
signal generated a negative average return and sell signal posted a low positive
average return before deducting transaction costs Therefore after deducting
transaction costs RSI may not leave any profit in the hands of traders
MACD sell signal produced significant positive returns compared to buy signal
and unconditional intraday return However as per Sharpe ratio MACD sell signal
failed to produce the return in line with risk taken Sharpe ratio of less than one
indicates that risk associated with the technical trading rule is more than the return
generated by RSI and MACD In addition even profitable MACD sell signal does
not help in market timing It makes money from higher average profit from
profitable trade than average loss from unprofitable trade However MACD does
not help to reduce the unprofitable trade Hence the study concludes that the trader
cannot earn abnormal return consistently with the help of RSI and MACD across
market cycle in the Indian context RSI and MACD are very old and yet still widely
used as technical tools in real time stock price prediction On the other hand latest
development in information technology and changes in legal systems may have
helped the market to absorb RSI and MACD signals in current price with no time
and cost However in order to empirically validate this assumption a future study
may be extended using a proxy for information technology development and its
impact on trading rules across industries and individual stocks in emerging markets
Muruganandan
43
Declaration of Conflict of Interest
The author declared no potential conflict of interest with respect to the research
authorship and publication of this article
Acknowledgement
I would like to thank anonymous reviewers for their valuable suggestions
References
Allen F amp Karjalainen R (1999) Using genetic algorithms to find technical
trading rules Journal of Financial Economics 51(2) 245ndash271
httpsdoiorg101016S0304-405X(98)00052-X
Almujamed H I Fifield S amp Power D (2013) An investigation of the role of
technical analysis in Kuwait Qualitative Research in Financial Markets 5(1)
43ndash64 httpsdoiorg10110817554171311308959
Anghel G D I (2015) Stock market efficiency and the MACD Evidence from
countries around the world Procedia Economics and Finance 32 1414ndash1431
httpsdoiorg101016S2212-5671(15)01518-X
Atanasova C V amp Hudson R S (2010) Technical trading rules and calendar
anomalies mdash Are they the same phenomena Economics Letters 106(2) 128ndash
130 httpsdoiorg101016jeconlet200911001
Balsara N J Chen G amp Zheng L (2007) The Chinese stock market An
examination of the random walk model and technical trading rules Quarterly
Journal of Business amp Economics 46(2) 43ndash63 httpswwwjstororgstable
40473435
Balsara N Chen J amp Zheng L (2009) Profiting from a contrarian application of
technical trading rules in the US stock market Journal of Asset Management
10(2) 97ndash123 httpsdoiorg101057jam200844
Brock W Lakonishok J amp LeBaron B (1992) Simple technical trading rules
and stochastic properties of stock returns The Journal of Finance 47(5) 1731ndash
1764 httpsdoiorg101111j1540-62611992tb04681x
Chang E J Lima E J A amp Tabak B M (2004) Testing for predictability in
emerging equity markets Emerging Markets Review 5(3) 295ndash316
httpsdoi101016jememar200403005
Chiang Y-C Ke M-C Liao T L amp Wang C D (2012) Are technical trading
strategies still profitable - Evidence from the Taiwan Stock Index Futures
Market Applied Financial Economics 22(12) 955ndash965 httpsdoiorg
101080096031072011631893
Chong T T-L amp Ng W-K (2008) Technical analysis and the London stock
exchange Testing the MACD and RSI rules using the FT30 Applied
Colombo Business Journal 11(1) 2020
44
Economics Letters 15(14) 1111ndash1114 httpsdoiorg10108013504850600
993598
Cohen G amp Cabiri E (2015) Can technical oscillators outperform the buy and
hold strategy Applied Economics 47(30) 3189ndash3197 httpsdoiorg101080
0003684620151013609
Efron B (1979) Bootstrap methods Another look at the Jackknife The Annals of
Statistics 7(1)1ndash26 httpsprojecteuclidorgeuclidaos 1176344552
Fama (1970) Efficient capital markets a review of theory and empirical work
Journal of Finance 25(2) 383-417 httpswwwjstororgstable2325486
Gencay R (1998) The predictability of security returns with simple technical
trading rules Journal of Empirical Finance 5(4) 347ndash359 httpsdoiorg
101016S0927-5398(97)00022-4
Gunasekarage A amp Power D M (2001) The profitability of moving average
trading rules in South Asian stock markets Emerging Markets Review 2(1)
17ndash33 httpsdoiorg101016S1566-0141(00)00017-0
Henderson C (2002) Currency strategy The practitionerrsquos guide to currency
investing hedging and forecasting John Willy amp Sons
Heng P amp Niblock S J (2014) Trading with tigers A technical analysis of
Southeast Asian stock index futures International Economic Journal 28(4)
679ndash692 httpsdoiorg101080101687372014928895
Hudson R Dempsey M amp Keasey K (1996) A note on weak form efficiency of
capital markets The application of simple technical trading rules to UK stock
prices- 1935-1994 Journal of Banking and Finance 20(6) 1121ndash1132
httpsdoiorg1010160378-4266(95)00043-7
Jensen M C amp Benington G A (1970) Random walk and technical theories
Some additional evidence Journal of Finance 25 469ndash482
httpswwwjstororgstable2325495
Krausz J Lee S-Y amp Nam K (2009) Profitability of nonlinear dynamics
under technical trading rules Evidence from Pacific basin stock markets
Emerging Markets Finance amp Trade 45(4) 13ndash35 httpsdoiorg102753
REE1540-496X450402
Khatua A (2016) An application of moving average convergence and divergence
(MACD) indicator on selected stocks listed on National Stock Exchange (NSE)
httpdxdoiorg102139ssrn2872665
Kulkarni A D amp More A (2014) An application of moving average convergence
divergence (MACD) indicator on selected stocks listed on Bombay Stock
Exchange (BSE) Oriental Journal of Computer Science and Technology 7(3)
396ndash400 httpwwwcomputerscijournalorgp=1500
Lokeshwarri S K (2017 April 07) The big story ndash Sit back go passive The Hindu
Business Line (Coimbatore Edition) p 2
Muruganandan
45
Marshall B R Cahan R H amp Cahan J M (2008) Does intraday technical
analysis in the US equity market have value Journal of Empirical Finance
15(2) 199ndash210 httpsdoiorg101016jjempfin200605003
Marshall B R Young M R amp Cahan R (2008) Are candlestick technical
trading strategies profitable in the Japanese equity market Review of
Quantitative Finance and Accounting 31(2) 191ndash207 httpsdoiorg101007
s11156-007-0068-1
Metghalchi M Chen C-P Hajilee M (2016) Moving average trading rules for
NASDAQ composite index Applied Finance Letters 5(2) 45ndash57
httpsdoiorg1024135aflv5i254
Metghalchi M amp Hayes L A Niroomand F (2019) A technical approach to
equity investing in emerging markets Review of Financial Economics 37(3)
389ndash403 httpsdoiorg101002rfe1041
McKenzie M D (2007) Technical trading rules in emerging market and the 1997
Asian currency crises Emerging Market Finance and Trade 43(4) 46ndash73
httpsdoiorg102753REE1540-496X430403
Ming-Ming L Balachandher K G amp Nor F M (2002) An examination of the
random walk model and technical trading rules in the Malaysian stock market
Quarterly Journal of Business amp Economics 41(1) 81ndash104
httpswwwjstororgstable40473346
Ming-Ming L amp Siok-Hwa L (2006) The profitability of the simple moving
averages and trading range breakout in the Asian stock markets Journal of
Asian Economics 17(1) 144ndash170 httpsdoiorg101016jasieco200512001
Mitra S K (2011) How rewarding is technical analysis in Indian stock market
Quantitative Finance 11(2) 287ndash297 httpsdoiorg101080
14697680903493581
Nazario R T F Silva J L amp Sobrero V A (2017) A literature review of
technical analysis on stock markets The Quarterly Review of Economics and
Finance 66 115ndash126 httpsdoiorg101016jqref201701014
Neftccedili S N (1991) Naiumlve trading rules in financial markets and Wiener-
Kolmogorov prediction theory A study of ldquotechnical analysisrdquo Journal of
Business 64(4) 549ndash571
Ni Y Day M-Y Huang P ampYu S-R (2020) The profitability of Bollinger
Bamps Evidence from the constituent stocks of Taiwan 50 Physica A Statistical
Mechanics and Its Applications Advance online publication httpsdoiorg
101016jphysa2020124144
Nor S M amp Wickremasinghe G (2014) The profitability of MACD and RSI
trading rules in the Australian stock market Investment Management and
Financial Innovation 11(4) 194ndash199
Colombo Business Journal 11(1) 2020
46
Rosillo R de La Fuente D amp Brugos J A L (2013) Technical analysis and the
Spanish stock market Testing the RSI and MACD momentum and stochastic
rule using Spanish market companies Applied Economics 45(12) 1541ndash1550
httpsdoiorg101080000368462011631894
Sehgal S amp Garhyan A (2002) Abnormal returns using technical returns The
Indian experience Finance India 16(1) 181ndash203
Sehgal S amp Gupta M (2007) Tests of technical analysis in India Vision The
Journal of Business Perspective 11(3) 11ndash23 httpsdoiorg101177
097226290701100303
Sobreiro V A da Costa T R C C Nazaacuterio R T F e Silva J L Moreira E
A Filho M C L Kimura H amp Zambrano J C A (2016) The profitability
of moving average trading rules in BRICS and emerging stock markets North
American Journal of Economics and Finance 38 86ndash101 httpsdoiorg
101016jnajef201608003
Tian G G Wan G H amp Guo M (2002) Market efficiency and the returns to
simple technical trading rules New evidence from US equity market and
Chinese equity markets Asia-Pacific Financial Markets 9(3) 241ndash258
httpsdoiorg101023A1024181515265
Tharavanij P Siraprapasiri V amp Rajchamaha K (2015) Performance of
technical trading rules Evidence from Southeast Asian Stock Market
Springerplus 4552 httpsdoiorg101186s40064-015-1334-7
Wang J-L amp Chan S-H (2007) Stock market trading rule discovery using
pattern recognition and technical analysis Expert Systems with Applications
33(2) 304ndash315 httpsdoiorg101016jeswa200605002
Welles J Jr (1978) New concepts in technical trading systems Hunter Publishing
Company
Wong W-K Manzur M amp Chew B-K (2003) How rewarding is technical
analysis Evidence from Singapore stock market Journal of Applied Financial
Economics 13(7) 543ndash551 httpsdoiorg1010800960310022000020906
Yu H Nartea G V Gan C amp Yao L J (2013) Predictive ability and
profitability of simple technical trading rules Recent evidence from Southeast
Asian stock markets International Review of Economics and Finance 25 356ndash
371 httpsdoiorg101016jiref201207016
Zhu H Jiang Z-Q Li S-P amp Zhou W-X (2015) Profitability of simple
technical trading rules of Chinese stock exchange indexes Physica A
Statistical Mechanics and Its Applications 439 75ndash84 httpsdoiorg101016
jphysa201507032

Colombo Business Journal 11(1) 2020
30
This existing discrepancy in literature demands research on emerging marketsrsquo
information efficiency in the recent past Further the ability of technical trading
rules to predict stock returns is inadequately researched in emerging markets
Hence this study attempts to analyse the profitability of technical trading rules in
economically dynamic and rapidly growing emerging markets such as India
Further the total study period was classified as Bull and Bear market and employed
risk adjusted performance measures like Sharpe ratio ratio of average profit to
average loss and percentage of profitable trade to have a microscopic view on the
performance of technical analysis in the Indian context
Data and Methodology
This empirical study covers the period from February 2000 to May 2018 and the
total study period is categorised into Bull and Bear market as per Lokeshwarri
(2017) which is shown in Table 1 and supported by Figure1
Table 1 Cyclical Bull and Bear Phases in Sensex
Start Date End Date Change in
percentage Category
Time in
Months
Feb ndash 2000 Sep ndash 2001 -5781 Bear ndash 1 19
Sep ndash 2001 May ndash 2003 1310 Sideway ndash 1 20
May ndash 2003 Jan ndash 2008 62263 Bull ndash 1 56
Jan ndash 2008 Mar ndash 2009 -6205 Bear ndash 2 13
Mar ndash 2009 Nov ndash 2010 16231 Bull ndash 2 20
Nov ndash 2010 Aug ndash 2013 -1734 Sideway ndash 2 33
Aug ndash 2013 Mar ndash 2015 7208 Bull ndash 3 19
Mar ndash 2015 Feb ndash 2016 -2508 Bear ndash 3 11
Feb ndash 2016 May ndash 2018 5560 Bull ndash 4 27
Source Lokeshwarri (2017)
The daily opening closing high and low values for BSE Sensex were extracted
from BSE data base The widely used trading rules such as Relative Strength Index
(RSI) and Moving Average Convergence and Divergence (MACD) are employed to
generate Buy Hold and Sell signals which are explained below
Figure 1 Bull and Bear Phases of BSE Sensex during the Study Period
112002112001112000
6000
4500
3000
112003112002
3500
3000
2500
112008112006112004
20000
1700015000
10000
5000
2000
112009712008112008
20000
15000
10000
112011112010112009
20000
15000
10000
112014112013112012112011
20000
17500
15000
112015112014
30000
25000
20000
112016912015512015112015
30000
27500
25000
112018112017112016
35000
30000
25000
Bear 1 Sideway 1 Bull 1
Bear 2 Bull 2 Sideway 2
Bull 3 Bear 3 Bull 4
Mu
rug
an
and
an
31
Colombo Business Journal 11(1) 2020
32
Relative Strength Index (RSI)
RSI is a technical indicator which used to identify the overbought and oversold
condition of financial securities First relative strength is calculated by dividing the
simple average of closing values on up days by the average of closing values on
down days over a given period of time which is 14 days in this study The step-by-
step trading decision based on RSI is demonstrated as follows
Steps in generating Buy Hold and Sell Signals
1 Input Closing (119862119905) and Opening (119874119905) value of the Index on day t
2 Up Days (119880119905) 119862119905 119894119891 (119862119905 minus 119862119905minus1) gt 0 119890119897119904119890 0
3 Down Days (119863119905) 119862119905 119894119891 (119862119905 minus 119862119905minus1) lt 0 119890119897119904119890 0
4 Relative Strength (119877119878)
119877119878119905 =
sum 119880119905 119894=119905minus(119899minus1)119894=119905
119899
sum 119863119905 119894=119905minus(119899minus1)119894=119905
119899
5 Relative Strength Index (119877119878119868119905)
119877119878119868119905 = 100 minus (100
1 + 119877119878119905)
6 Trading Decision1 119861119906119910 119874119905+1
119894119891119877119878119868119905 gt 30 amp 119877119878119868119905minus1 le 30
Else
119878119886119897119890 119874119905+1
119894119891 119877119878119868119905 gt 70 amp 119877119878119868119905minus1 le 70
Or
Hold
7 Output Calculation of Return
119894119891 119887119906119910 119874119905+1 =
(119897119900119892(119862119905+1) minus 119897119900119892(119874119905+1))
119894119891 119878119886119897119890 119874119905+1 =
(119897119900119892(119874119905+1) minus 119897119900119892(119862119905+1))
1 The trading rules were applied as per Welles (1978) Henderson (2002) and Rosillo et al
(2013) Unlike previous studies in order to imitate the real time stock trading scenario
opening and closing values were considered for executing the trading signals and calculation
of return
Muruganandan
33
Moving Average Convergence and Divergence (MACD)
MACD is constructed based on historical exponential moving average of
closing value of index to identify the trend changes in its value It is computed
based on the difference between longer exponential moving averages (26 days)
from a shorter exponential moving average (12 days) In addition nine days simple
moving average of MACD is used as a sign to generate buy and sell signals Step-
by-step trading decision is presented as follows
Steps in generating Buy Hold and Sell Signals
1 Input Closing (119862119905) and Opening (119874119905) value of the Index on day t
2 Exponential Moving Average
119899 = 12 119886119899119889 26 119889119886119910119904 119891119900119903 119904ℎ119900119903119905 119886119899119889 119897119900119899119892 119864119872119860 119903119890119904119901119890119888119905119894119907119890119897119910
119864119872119860119905(119899) = sum (2
1+119899)
119894=119905minus(119899minus1)119894=119905 times 119862119905 + (1 minus
2
1+119899) times 119864119872119860119905minus1(119899)
3 119872119860119862119863 119864119872119860119905(119878ℎ119900119903119905119890119903) minus 119864119872119860119905(119871119900119899119892119890119903)
4 Signal Line 119878119894119892119899119905 = 1198781198721198609(119872119860119862119863)
5 Trading Decision2 119861119906119910 119874119905+1
119894119891119872119860119862119863119905 lt 0 119878119894119892119899119905 lt 0 amp 119878119894119892119899119905 gt 119872119860119862119863119905
Else
119878119886119897119890 119874119905+1
119894119891119872119860119862119863119905 gt 0 119878119894119892119899119905 gt 0 amp 119878119894119892119899119905 lt 119872119860119862119863119905
Or
Hold
6 Output Calculation of Return
119894119891 119887119906119910 119874119905+1 =
(119897119900119892(119862119905+1) minus 119897119900119892(119874119905+1))
119894119891 119878119886119897119890 119874119905+1 =
(119897119900119892(119874119905+1) minus 119897119900119892(119862119905+1))
Further the following hypotheses were framed to test whether returns of buy or
sell signals are different from the unconditional mean return and also whether the
mean buy signal return is different from mean sell signal return The null and
alternative hypotheses of the study are stated in Table 2
2 The trading rules were applied as per Rosillo et al (2013) Unlike previous studies in
order to imitate the real time stock trading scenario opening and closing values were
considered for executing the trading signals and calculation of return
Colombo Business Journal 11(1) 2020
34
Table2 Hypotheses of the Study
Buy-Unconditional
Return
Sell-Unconditional
Return
Buy ndash Sell
Return
Ho 120583119861 minus 120583119880 = 0 120583119878 minus 120583119880 = 0 120583119861 minus 120583119878 = 0
Ha 120583119861 minus 120583119880 ne 0 120583119878 minus 120583119880 ne 0 120583119861 minus 120583119878 ne 0
After the formulation of hypotheses t-statistics were used to test the null
hypothesis of equality between unconditional mean return (120583) and mean return of
trading rules (120583119903) which is specified in Equation 1
119905119903 = 120583119887119906119910 (119904119890119897119897)minus120583
radic120590119887119906119910( 119904119890119897119897)
2
119873119887119906119910(119904119890119897119897)+
1205902
119873
(1)
where 120583119887119906119910 (119904119890119897119897) is the mean technical trading return of buy or sell 119873119887119906119910(119904119890119897119897) is the
number of trades for the buy or sell signal 120583 and N are the unconditional mean
return and number of observations respectively and 1205902 is the estimated sample
variance In testing long-short strategies (buy-sell) t-statistics is computed as
follows
119905119887119906119910minus119904119890119897119897 = 120583119887119906119910minus120583119904119890119897119897
radic120590119861119906119910
2
119873119861119906119910+
1205901198781198901198971198972
119873119878119890119897119897
(2)
where 120583119887119906119910 and 120583119904119890119897119897 are the mean returns of buy signal and sell signals 120590119861119906119910 and
120590119878119890119897119897 are the estimated sample standard deviations of buy and sell signals
respectively 119873119861119906119910 and 119873119878119890119897119897 are the number of buy and sell signals respectively
Performance Measures
Sharpe Ratio
Reward to total risk is calculated using Sharpe Ratio which measures the
expected return to per unit of total risk taken In the perspective of trading the
standard Sharpe ratio is modified by excluding the risk free rate by assuming that
the trader needs to maintain the liquidity and not investing in risk free rate Hence
Sharpe ratio is calculated as per Equation 3
119878ℎ119886119903119901119890 119877119886119905119894119900 (119878119877) =
120590119877 (3)
Muruganandan
35
where and 120590119877 are respectively the expected return and the total risk of a trading
rule in a given period Higher the ratio superior the performance indicated by it
Ratio of Average Profit to Average Loss (APAL)
This ratio is calculated by dividing the average profit from profitable trade by
average loss from the unprofitable trade The ratio of more than one indicates on
average the trading system correctly predicts the price movement than misleading
the traders Hence a higher ratio indicates the superior ability of the technical
trading rules to predict the future price movement The absolute value of this ratio is
calculated as per Equation 4
119860119875
119860119871= |
119860119907119890119903119886119892119890 119875119903119900119891119894119905
119860119907119890119903119886119892119890 119897119900119904119904| (4)
Percentage of Profitable Trade ( of PT)
This ratio indicates the proportion of profitable trade to total trade signal High
percentage indicates that the trading system identifies price change more accurately
This ratio considers the number of profitable trade to total trading signals and
ignores the value of profit (loss) earned (incurred) This performance metric is
calculated as per Equation 5
119900119891 119875119879 = 119873119906119898119887119890119903 119900119891 119875119903119900119891119894119905119886119887119897119890 119879119903119886119889119894119899119892
119879119900119905119886119897 119873119906119898119887119890119903 119900119891 119879119903119886119889119894119899119892 119904119894119892119899119886119897119904 (5)
Results and Discussion
The summary statistics for the unconditional intraday return for the entire
sample period and the nine non-overlapping sub-periods are presented in Table 3
The intraday mean returns for the entire sample period and for the sub-periods are
negative except for the period Bull-2 Bear-2 period exhibits the highest standard
deviation of 001009 Both highest (0030) and lowest (-0047) daily return for the
entire study period recorded in Bull-1 period The high value of Kurtosis indicates
that the intraday return of BSE Sensex is not normally distributed and there are
outliers However when the market is moving in the Sideway the intraday returns
become more or less normally distributed as evidenced from the low Kurtosis The
evidence of excessive Kurtosis in Bull period indicates that the unconditional
intraday returns were leptokurtic with thicker tails than the Bear and Sideway
markets Hence the variance during Bull periods results from the outliers The
Colombo Business Journal 11(1) 2020
36
negative skewness indicates that the unconditional daily returns were moderately
negatively skewed except for Sideway-1
Table 3 Descriptive Statistics for Unconditional Intraday Return
Cycle Mean Standard
deviation Kurtosis Skew Min Max Count
Overall -000041 000576 48482 -0531 -0047 0030 4545
Bear ndash 1 -000119 000855 12148 -0286 -0035 0026 437
Sideway ndash 1 -000042 000451 06693 0028 -0018 0015 411
Bull ndash 1 -000015 000605 5415 -0785 -0047 0030 1165
Bear ndash 2 -000093 001009 09469 -0359 -0038 0024 280
Bull ndash 2 000025 000583 22848 0049 -0028 0025 411
Sideway ndash 2 -000049 000423 0568 -0217 -0016 0011 679
Bull ndash 3 -000032 000349 22438 -0127 -0018 0012 381
Bear ndash 3 -000098 000406 09085 -0630 -0016 0009 225
Bull ndash 4 -000028 000279 3073 0332 -0009 0016 556
Note Unconditional intraday return defined as the log difference of closing value to opening value by
assuming that the trader buys at the opening value and sells at the closing value
The result of RSI trading rule for BSE Sensex is presented in Table 4 The first
two columns exhibit the number of buy (119873119861) and sell (119873119878) signals generated using
RSI trading rules for the overall period and non-overlapping sub-sample periods
Third and fourth column show the average buy (120583119861) and sell (120583119878) returns along
with t-test in parenthesis The basic assumption of t-test is that the observations are
normally distributed However Table 1 reveals that the returns were not normally
distributed which may question the validity of t-test results and its interpretations In
order to overcome this phenomenon Brock et al (1992) suggested the bootstrap
method developed by Efron (1979) Hence this paper employs the bootstrap
method adopted by McKenzie (2007) which mimics the procedure followed by
Brock et al (1992) Bootstrap process was repeated for 500 times and the resultant t
values and corresponding p values are reported in parentheses and square brackets
respectively However the acceptance and rejection of hypothesis were similar both
in bootstrap p values and t-test In addition standard deviation of buy and sell
signals and the mean difference between buy and sell signals are also presented in
the column five six and seven respectively
Muruganandan
37
Table 4 Statistical Results for RSI Trading Rule
Category NB NS microB microS σB σS microB - microS
Overall 116 178
-000065
(-0352)
[0739]
000003
(1308)
[0232]
000729 000434
-000068
(-0905)
[0367]
Bear ndash 1 15 13
-000002
(0489)
[0645]
00025
(2150)
[0066]
000908 000601
-000252
(-0876)
[0401]
Sideway ndash 1 14 16
-000051
(-0084)
[0946]
000065
(0859)
[0419]
000406 00049
-000116
(-0711)
[0499]
Bull ndash 1 15 54
-000199
(-0801)
[0445]
-00009
(-1273)
[0186]
000892 000414
-00011
(-0464)
[0617]
Bear ndash 2 17 7
000031
(0439)
[0661]
00009
(0488)
[0631]
001134 000979
-000059
(-0128)
[0876]
Bull ndash 2 5 21
000486
(1624)
[0076]
-000039
(-0601)
[0599]
00063 000474
000525
(1749)
[0071]
Sideway ndash 2 26 19
-000165
(-0969)
[0325]
-000009
(0831)
[0411]
0006 000205
-000156
(-1231)
[0246]
Bull ndash 3 4 16
-000121
(-0949)
[0355]
-000037
(-0063)
[0952]
000184 000294
-000084
(-0713)
[0476]
Bear ndash 3 13 5
-000149
(0415)
[0681]
000214
(1296)
[0124]
000373 000279
-00036
(-1357)
[0185]
Bull ndash 4 7 27
00000032
(0334)
[0729]
000037
(1533)
[0162]
000218 000208
-000037
(-0395)
[0691]
Notes 1 NB and NS denote the number of buy and sell signals during the period respectively microB and
microS denote the average return of buy and sell signals respectively σB and σS denote the
standard deviation of buy and sell signal returns respectively
2 Numbers in parentheses are t values and numbers in square brackets are the bootstrap p
values
Colombo Business Journal 11(1) 2020
38
RSI generates more sell signals than buy signals during the Bull market On the
contrary during the Bear and Sideway market RSI produced higher number of buy
signals than sell signals Since RSI has the upper band of 100 if the stock price goes
up continuously RSI remains in the overbought regime and produce more number
of sell signals than buy signals In this case a trader shorting the opportunity based
on RSI sell signals may not make profit as the price will move to the differentother
orbit On the other hand if the stock price goes down continuously the RSI
generates more number of buy signals than the sell signals as opposed to the current
price movement Hence the application of RSI during the long Bull and Bear
markets may not help the trader to make profit even before adjusting the transaction
cost From the result of t-test and bootstrap p values it can be concluded that buy
and sell signals does not reject the null hypothesis that the mean return of buy or sell
signals is not significantly different from the unconditional mean return Moreover
averages of buy signal returns and sell signal returns are not significantly different
from each other These results provide evidence of the existence of weak form
efficiency across the market cycle Hence it can be concluded that traders cannot
outperform the market using the RSI signals during the upward or downward
movement of the market
Table 5 Performance of RSI Trading Signal
Category
Buy Signal Performance Sell Signal Performance
SR APAL of
PT SR APAL
of
PT
Overall -00892 1007 4397 00069 10669 4888
Bear ndash 1 -00022 1489 4000 04160 14933 6923
Sideway ndash 1 -01256 0529 5714 01327 13950 5000
Bull ndash 1 -02242 0896 4000 -02174 10832 3519
Bear ndash 2 00273 1203 4706 00919 09491 5714
Bull ndash 2 07714 1766 8000 -00823 07273 5238
Sideway ndash 2 -02750 0781 3846 -00439 09970 4737
Bull ndash 3 -06576 0298 2500 -01259 07136 5000
Bear ndash 3 -02601 0742 4000 02294 13570 5938
Bull ndash 4 00014 1338 4286 01779 10837 5926
Note SR denotes the Sharpe Ratio APAL denotes the ratio of average profit to average loss
of PT denotes the percentage of profitable trade to total trading signal
Muruganandan
39
Table 5 exhibits the results of Sharpe Ratio (SR) average profit to average loss
ratio (APAL) and percentage of profitable trade to total trading signals For the
overall study period and almost all sub-samples periods buy signal underperforms
the sell signal as per the modified Sharpe ratio The absolute value of average profit
to average loss more than one indicates that the average of profitable trade is more
than the average of unprofitable trade However percentage of profitable trade less
than 50 indicates that RSI generate a higher number of unprofitable trades than
profitable trade Hence average return on buy signal is negative for the overall
study period and for six out of nine sub-sample periods On the other hand RSI sell
signal generated the positive Sharpe ratio for overall period and five out of nine sub-
sample periods Profitable trade to total trade signal indicates sell signal produced
more profitable trade in all sub-sample period except Bull-1 and Sidway-1 market
Though percentage of profitable trade to total trade for overall period is less than
50 (ie 4888) which indicate that the number of unprofitable trades is higher
than the profitable trades the profit per profitable trade is sufficiently enough to
compensate the loss in unprofitable trade The sell signal trading strategy makes
money not only from correctly predicting the market movement but also minimising
the loss quickly and allows the profit to run
The Table 6 exhibits the statistical results for the MACD trading rules During
the study period MACD generated 1522 sell signals and 858 buy signals with the
average return of 000861 and -000128 respectively The standard deviations of buy
signal returns (00179) and sell signal returns (001068) are also presented along
with mean return difference between buy and sell signals (-00021) Buy signal
produced the average negative return for all the sub-sample periods and they were
also not significantly different from the average unconditional mean return Hence
the null hypothesis was accepted and it can be concluded that buy signal produced a
return similar to that of unconditional intraday return However the sell signal
generated positive average return for the overall period and all sub-sample periods
except Bull-2 period In contrast the sell signal returns were significantly different
for the overall period and five out of nine sub-sample periods
Table 6 Statistical Results for MACD Trading Rule
Category NB NS microB microS σB σS microB -microS
Overall 858 1522
-000128
(-142)
[0170]
0000861
(443)
[0002]
0017908 0010686
-000215
(-3203)
[0008]
Colombo Business Journal 11(1) 2020
40
Category NB NS microB microS σB σS microB -microS
Bear ndash 1 141 59
-000021
(0494)
[0631]
0006379
(317)
[0002]
0023008 0018028
-000659
(-2165)
[0036]
Sideway ndash 1 131 71
-000226
(-1524)
[0142]
0000543
(0623)
[0509]
0013614 001285
-000281
(-1452)
[0162]
Bull ndash 1 85 581
-000004
(0043)
[0962]
0000196
(0703)
[0483]
0023623 0011
-000023
(-0090)
[0908]
Bear ndash 2 109 33
-000350
(-0989)
[0337]
0004699
(231)
[0036]
0026444 0013532
-00082
(-2371)
[002]
Bull ndash 2 39 192
-000031
(-0224)
[0816]
-000085
(-1066)
[0311]
0015615 0013721
0000532
(0198)
[0838]
Sideway ndash 2 166 171
-000035
(0171)
[0852]
000195
(375)
[0002]
0011182 0008263
-00023
(-2141)
[0032]
Bull ndash 3 32 165
-000171
(-0514)
[0591]
0000902
(220)
[0028]
0015215 0006737
-000261
(-0952)
[0291]
Bear ndash 3 88 25
-000146
(-0457)
[0643]
0004442
(341)
[0002]
0009516 0007832
-000591
(-3164)
[0004]
Bull ndash 4 67 225
-000205
(-1306)
[0188]
0000871
(2905)
[0008]
0011064 0005643
-000292
(-2080)
[004]
Notes 1 NB and NS denote the number of buy and sell signals during the period respectively microB
and microS denote the average return of buy and sell signals respectively σB and σS denote the
standard deviation of buy and sell signal returns respectively
2 Numbers in parenthesis are t-values and numbers in square brackets are the bootstrap p
values
3 denotes p lt 05
The risk measured by standard deviation is higher in buy signal than sell signal
trading rules for the entire study period and for all the sub-sample periods This
clearly indicates that the trading on buy signal is riskier than the sell signal
Moreover the sell signal average returns were significantly different from the
Muruganandan
41
average buy signal returns in all the Bear market periods and for the overall study
period This result supports the sell signal over buy signal specifically during the
Bear market phases This result sharply contradicts to Tharavanij et al (2015) who
found buy signals outperform the sell signals in Southeast Asian markets
Sharpe ratio average profit to average loss ratio and percentage of profitable
trade to total trade signal for MACD trading rule are presented in Table 7 For the
buy signals percentage of profitable trade to total trade has more than 50 in four
out of nine sub-sample periods but average profit to average loss is less than one
which implies that the profit from correctly predicting market direction is not
sufficient enough to cut down the loss from the failure to predict market direction
Hence Sharpe ratios for all sub-sample periods and the entire study period were
negative However the sell signals correctly predict the market with highest
percentage of profitable trade to total trade of 80 in Bear-3 period Moreover
with less ability to predict market direction in Sideway-1 (4789) and Bull-1
(4905) periods sell signal generated profit to cut down the loss from unprofitable
trade which results in average profit to average loss ratio of more than one for
Sideway-1 (122) and Bull-1 (109) period Overall the result supports the sell
signals over buy signals before considering the transaction costs in the Indian
context
Table 7 Performance of MACD Trading Signal
Category
Buy Signal Performance Sell Signal Performance
SR APAL of
PT SR APAL
of
PT
Overall -0072 0897 47669 008 106 5414
Bear ndash 1 -0009 1110 46809 035 219 5763
Sideway ndash 1 -0166 0701 47328 004 122 4789
Bull ndash 1 -0002 0805 55294 002 109 4905
Bear ndash 2 -0133 0940 43119 035 115 6667
Bull ndash 2 -0020 0734 56410 -006 084 5000
Sideway ndash 2 -0031 1122 45181 024 108 6374
Bull ndash 3 -0112 0563 56250 013 100 5879
Bear ndash 3 -0154 0682 50000 057 108 8000
Bull ndash 4 -0185 0827 41791 015 116 5644
Note SR denotes the Sharpe Ratio APAL denotes the ratio of average profit to average loss
of PT denotes the percentage of profitable trade to total trading signal
Colombo Business Journal 11(1) 2020
42
Conclusion
This paper examines the profitability of RSI and MACD technical trading rules
in the Indian market across market cycles BSE Sensex data for the period from
February 2000 to May 2018 were collected from BSE data base and classified into
nine non-overlapping periods as Bull and Bear markets based on the index
movement The t-tests were applied to test the hypothesis that returns from technical
trading rules were not significantly different from the unconditional daily returns In
addition Sharpe ratio average profit to average loss ratio and percentage of
profitable trade to total trade signal were also employed to have a microscopic view
on technical trading rules
Results support the weak-form efficient theory as RSI failed to deliver the
positive returns even before deducting the transaction costs RSI buy and sell signal
returns were not significantly different from the unconditional intraday return In
terms of market timing RSI wrongly predict the market movement and delivered
the percentage of profitable trade to total trade less than 50 Moreover profitable
trades were insufficient to overcome the loss from unprofitable trade Hence buy
signal generated a negative average return and sell signal posted a low positive
average return before deducting transaction costs Therefore after deducting
transaction costs RSI may not leave any profit in the hands of traders
MACD sell signal produced significant positive returns compared to buy signal
and unconditional intraday return However as per Sharpe ratio MACD sell signal
failed to produce the return in line with risk taken Sharpe ratio of less than one
indicates that risk associated with the technical trading rule is more than the return
generated by RSI and MACD In addition even profitable MACD sell signal does
not help in market timing It makes money from higher average profit from
profitable trade than average loss from unprofitable trade However MACD does
not help to reduce the unprofitable trade Hence the study concludes that the trader
cannot earn abnormal return consistently with the help of RSI and MACD across
market cycle in the Indian context RSI and MACD are very old and yet still widely
used as technical tools in real time stock price prediction On the other hand latest
development in information technology and changes in legal systems may have
helped the market to absorb RSI and MACD signals in current price with no time
and cost However in order to empirically validate this assumption a future study
may be extended using a proxy for information technology development and its
impact on trading rules across industries and individual stocks in emerging markets
Muruganandan
43
Declaration of Conflict of Interest
The author declared no potential conflict of interest with respect to the research
authorship and publication of this article
Acknowledgement
I would like to thank anonymous reviewers for their valuable suggestions
References
Allen F amp Karjalainen R (1999) Using genetic algorithms to find technical
trading rules Journal of Financial Economics 51(2) 245ndash271
httpsdoiorg101016S0304-405X(98)00052-X
Almujamed H I Fifield S amp Power D (2013) An investigation of the role of
technical analysis in Kuwait Qualitative Research in Financial Markets 5(1)
43ndash64 httpsdoiorg10110817554171311308959
Anghel G D I (2015) Stock market efficiency and the MACD Evidence from
countries around the world Procedia Economics and Finance 32 1414ndash1431
httpsdoiorg101016S2212-5671(15)01518-X
Atanasova C V amp Hudson R S (2010) Technical trading rules and calendar
anomalies mdash Are they the same phenomena Economics Letters 106(2) 128ndash
130 httpsdoiorg101016jeconlet200911001
Balsara N J Chen G amp Zheng L (2007) The Chinese stock market An
examination of the random walk model and technical trading rules Quarterly
Journal of Business amp Economics 46(2) 43ndash63 httpswwwjstororgstable
40473435
Balsara N Chen J amp Zheng L (2009) Profiting from a contrarian application of
technical trading rules in the US stock market Journal of Asset Management
10(2) 97ndash123 httpsdoiorg101057jam200844
Brock W Lakonishok J amp LeBaron B (1992) Simple technical trading rules
and stochastic properties of stock returns The Journal of Finance 47(5) 1731ndash
1764 httpsdoiorg101111j1540-62611992tb04681x
Chang E J Lima E J A amp Tabak B M (2004) Testing for predictability in
emerging equity markets Emerging Markets Review 5(3) 295ndash316
httpsdoi101016jememar200403005
Chiang Y-C Ke M-C Liao T L amp Wang C D (2012) Are technical trading
strategies still profitable - Evidence from the Taiwan Stock Index Futures
Market Applied Financial Economics 22(12) 955ndash965 httpsdoiorg
101080096031072011631893
Chong T T-L amp Ng W-K (2008) Technical analysis and the London stock
exchange Testing the MACD and RSI rules using the FT30 Applied
Colombo Business Journal 11(1) 2020
44
Economics Letters 15(14) 1111ndash1114 httpsdoiorg10108013504850600
993598
Cohen G amp Cabiri E (2015) Can technical oscillators outperform the buy and
hold strategy Applied Economics 47(30) 3189ndash3197 httpsdoiorg101080
0003684620151013609
Efron B (1979) Bootstrap methods Another look at the Jackknife The Annals of
Statistics 7(1)1ndash26 httpsprojecteuclidorgeuclidaos 1176344552
Fama (1970) Efficient capital markets a review of theory and empirical work
Journal of Finance 25(2) 383-417 httpswwwjstororgstable2325486
Gencay R (1998) The predictability of security returns with simple technical
trading rules Journal of Empirical Finance 5(4) 347ndash359 httpsdoiorg
101016S0927-5398(97)00022-4
Gunasekarage A amp Power D M (2001) The profitability of moving average
trading rules in South Asian stock markets Emerging Markets Review 2(1)
17ndash33 httpsdoiorg101016S1566-0141(00)00017-0
Henderson C (2002) Currency strategy The practitionerrsquos guide to currency
investing hedging and forecasting John Willy amp Sons
Heng P amp Niblock S J (2014) Trading with tigers A technical analysis of
Southeast Asian stock index futures International Economic Journal 28(4)
679ndash692 httpsdoiorg101080101687372014928895
Hudson R Dempsey M amp Keasey K (1996) A note on weak form efficiency of
capital markets The application of simple technical trading rules to UK stock
prices- 1935-1994 Journal of Banking and Finance 20(6) 1121ndash1132
httpsdoiorg1010160378-4266(95)00043-7
Jensen M C amp Benington G A (1970) Random walk and technical theories
Some additional evidence Journal of Finance 25 469ndash482
httpswwwjstororgstable2325495
Krausz J Lee S-Y amp Nam K (2009) Profitability of nonlinear dynamics
under technical trading rules Evidence from Pacific basin stock markets
Emerging Markets Finance amp Trade 45(4) 13ndash35 httpsdoiorg102753
REE1540-496X450402
Khatua A (2016) An application of moving average convergence and divergence
(MACD) indicator on selected stocks listed on National Stock Exchange (NSE)
httpdxdoiorg102139ssrn2872665
Kulkarni A D amp More A (2014) An application of moving average convergence
divergence (MACD) indicator on selected stocks listed on Bombay Stock
Exchange (BSE) Oriental Journal of Computer Science and Technology 7(3)
396ndash400 httpwwwcomputerscijournalorgp=1500
Lokeshwarri S K (2017 April 07) The big story ndash Sit back go passive The Hindu
Business Line (Coimbatore Edition) p 2
Muruganandan
45
Marshall B R Cahan R H amp Cahan J M (2008) Does intraday technical
analysis in the US equity market have value Journal of Empirical Finance
15(2) 199ndash210 httpsdoiorg101016jjempfin200605003
Marshall B R Young M R amp Cahan R (2008) Are candlestick technical
trading strategies profitable in the Japanese equity market Review of
Quantitative Finance and Accounting 31(2) 191ndash207 httpsdoiorg101007
s11156-007-0068-1
Metghalchi M Chen C-P Hajilee M (2016) Moving average trading rules for
NASDAQ composite index Applied Finance Letters 5(2) 45ndash57
httpsdoiorg1024135aflv5i254
Metghalchi M amp Hayes L A Niroomand F (2019) A technical approach to
equity investing in emerging markets Review of Financial Economics 37(3)
389ndash403 httpsdoiorg101002rfe1041
McKenzie M D (2007) Technical trading rules in emerging market and the 1997
Asian currency crises Emerging Market Finance and Trade 43(4) 46ndash73
httpsdoiorg102753REE1540-496X430403
Ming-Ming L Balachandher K G amp Nor F M (2002) An examination of the
random walk model and technical trading rules in the Malaysian stock market
Quarterly Journal of Business amp Economics 41(1) 81ndash104
httpswwwjstororgstable40473346
Ming-Ming L amp Siok-Hwa L (2006) The profitability of the simple moving
averages and trading range breakout in the Asian stock markets Journal of
Asian Economics 17(1) 144ndash170 httpsdoiorg101016jasieco200512001
Mitra S K (2011) How rewarding is technical analysis in Indian stock market
Quantitative Finance 11(2) 287ndash297 httpsdoiorg101080
14697680903493581
Nazario R T F Silva J L amp Sobrero V A (2017) A literature review of
technical analysis on stock markets The Quarterly Review of Economics and
Finance 66 115ndash126 httpsdoiorg101016jqref201701014
Neftccedili S N (1991) Naiumlve trading rules in financial markets and Wiener-
Kolmogorov prediction theory A study of ldquotechnical analysisrdquo Journal of
Business 64(4) 549ndash571
Ni Y Day M-Y Huang P ampYu S-R (2020) The profitability of Bollinger
Bamps Evidence from the constituent stocks of Taiwan 50 Physica A Statistical
Mechanics and Its Applications Advance online publication httpsdoiorg
101016jphysa2020124144
Nor S M amp Wickremasinghe G (2014) The profitability of MACD and RSI
trading rules in the Australian stock market Investment Management and
Financial Innovation 11(4) 194ndash199
Colombo Business Journal 11(1) 2020
46
Rosillo R de La Fuente D amp Brugos J A L (2013) Technical analysis and the
Spanish stock market Testing the RSI and MACD momentum and stochastic
rule using Spanish market companies Applied Economics 45(12) 1541ndash1550
httpsdoiorg101080000368462011631894
Sehgal S amp Garhyan A (2002) Abnormal returns using technical returns The
Indian experience Finance India 16(1) 181ndash203
Sehgal S amp Gupta M (2007) Tests of technical analysis in India Vision The
Journal of Business Perspective 11(3) 11ndash23 httpsdoiorg101177
097226290701100303
Sobreiro V A da Costa T R C C Nazaacuterio R T F e Silva J L Moreira E
A Filho M C L Kimura H amp Zambrano J C A (2016) The profitability
of moving average trading rules in BRICS and emerging stock markets North
American Journal of Economics and Finance 38 86ndash101 httpsdoiorg
101016jnajef201608003
Tian G G Wan G H amp Guo M (2002) Market efficiency and the returns to
simple technical trading rules New evidence from US equity market and
Chinese equity markets Asia-Pacific Financial Markets 9(3) 241ndash258
httpsdoiorg101023A1024181515265
Tharavanij P Siraprapasiri V amp Rajchamaha K (2015) Performance of
technical trading rules Evidence from Southeast Asian Stock Market
Springerplus 4552 httpsdoiorg101186s40064-015-1334-7
Wang J-L amp Chan S-H (2007) Stock market trading rule discovery using
pattern recognition and technical analysis Expert Systems with Applications
33(2) 304ndash315 httpsdoiorg101016jeswa200605002
Welles J Jr (1978) New concepts in technical trading systems Hunter Publishing
Company
Wong W-K Manzur M amp Chew B-K (2003) How rewarding is technical
analysis Evidence from Singapore stock market Journal of Applied Financial
Economics 13(7) 543ndash551 httpsdoiorg1010800960310022000020906
Yu H Nartea G V Gan C amp Yao L J (2013) Predictive ability and
profitability of simple technical trading rules Recent evidence from Southeast
Asian stock markets International Review of Economics and Finance 25 356ndash
371 httpsdoiorg101016jiref201207016
Zhu H Jiang Z-Q Li S-P amp Zhou W-X (2015) Profitability of simple
technical trading rules of Chinese stock exchange indexes Physica A
Statistical Mechanics and Its Applications 439 75ndash84 httpsdoiorg101016
jphysa201507032
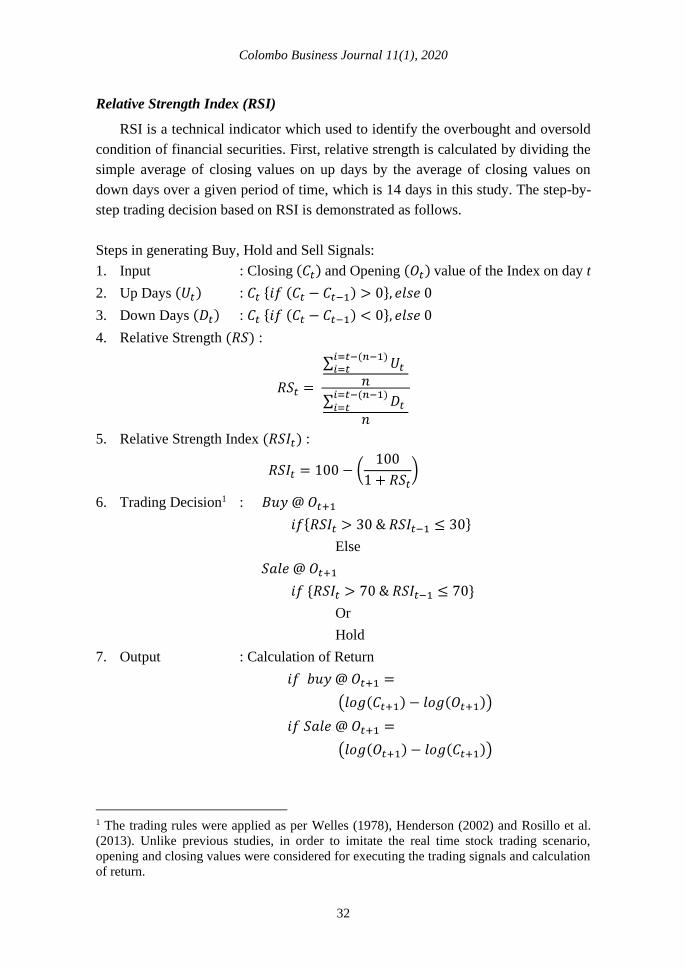
Colombo Business Journal 11(1) 2020
32
Relative Strength Index (RSI)
RSI is a technical indicator which used to identify the overbought and oversold
condition of financial securities First relative strength is calculated by dividing the
simple average of closing values on up days by the average of closing values on
down days over a given period of time which is 14 days in this study The step-by-
step trading decision based on RSI is demonstrated as follows
Steps in generating Buy Hold and Sell Signals
1 Input Closing (119862119905) and Opening (119874119905) value of the Index on day t
2 Up Days (119880119905) 119862119905 119894119891 (119862119905 minus 119862119905minus1) gt 0 119890119897119904119890 0
3 Down Days (119863119905) 119862119905 119894119891 (119862119905 minus 119862119905minus1) lt 0 119890119897119904119890 0
4 Relative Strength (119877119878)
119877119878119905 =
sum 119880119905 119894=119905minus(119899minus1)119894=119905
119899
sum 119863119905 119894=119905minus(119899minus1)119894=119905
119899
5 Relative Strength Index (119877119878119868119905)
119877119878119868119905 = 100 minus (100
1 + 119877119878119905)
6 Trading Decision1 119861119906119910 119874119905+1
119894119891119877119878119868119905 gt 30 amp 119877119878119868119905minus1 le 30
Else
119878119886119897119890 119874119905+1
119894119891 119877119878119868119905 gt 70 amp 119877119878119868119905minus1 le 70
Or
Hold
7 Output Calculation of Return
119894119891 119887119906119910 119874119905+1 =
(119897119900119892(119862119905+1) minus 119897119900119892(119874119905+1))
119894119891 119878119886119897119890 119874119905+1 =
(119897119900119892(119874119905+1) minus 119897119900119892(119862119905+1))
1 The trading rules were applied as per Welles (1978) Henderson (2002) and Rosillo et al
(2013) Unlike previous studies in order to imitate the real time stock trading scenario
opening and closing values were considered for executing the trading signals and calculation
of return
Muruganandan
33
Moving Average Convergence and Divergence (MACD)
MACD is constructed based on historical exponential moving average of
closing value of index to identify the trend changes in its value It is computed
based on the difference between longer exponential moving averages (26 days)
from a shorter exponential moving average (12 days) In addition nine days simple
moving average of MACD is used as a sign to generate buy and sell signals Step-
by-step trading decision is presented as follows
Steps in generating Buy Hold and Sell Signals
1 Input Closing (119862119905) and Opening (119874119905) value of the Index on day t
2 Exponential Moving Average
119899 = 12 119886119899119889 26 119889119886119910119904 119891119900119903 119904ℎ119900119903119905 119886119899119889 119897119900119899119892 119864119872119860 119903119890119904119901119890119888119905119894119907119890119897119910
119864119872119860119905(119899) = sum (2
1+119899)
119894=119905minus(119899minus1)119894=119905 times 119862119905 + (1 minus
2
1+119899) times 119864119872119860119905minus1(119899)
3 119872119860119862119863 119864119872119860119905(119878ℎ119900119903119905119890119903) minus 119864119872119860119905(119871119900119899119892119890119903)
4 Signal Line 119878119894119892119899119905 = 1198781198721198609(119872119860119862119863)
5 Trading Decision2 119861119906119910 119874119905+1
119894119891119872119860119862119863119905 lt 0 119878119894119892119899119905 lt 0 amp 119878119894119892119899119905 gt 119872119860119862119863119905
Else
119878119886119897119890 119874119905+1
119894119891119872119860119862119863119905 gt 0 119878119894119892119899119905 gt 0 amp 119878119894119892119899119905 lt 119872119860119862119863119905
Or
Hold
6 Output Calculation of Return
119894119891 119887119906119910 119874119905+1 =
(119897119900119892(119862119905+1) minus 119897119900119892(119874119905+1))
119894119891 119878119886119897119890 119874119905+1 =
(119897119900119892(119874119905+1) minus 119897119900119892(119862119905+1))
Further the following hypotheses were framed to test whether returns of buy or
sell signals are different from the unconditional mean return and also whether the
mean buy signal return is different from mean sell signal return The null and
alternative hypotheses of the study are stated in Table 2
2 The trading rules were applied as per Rosillo et al (2013) Unlike previous studies in
order to imitate the real time stock trading scenario opening and closing values were
considered for executing the trading signals and calculation of return
Colombo Business Journal 11(1) 2020
34
Table2 Hypotheses of the Study
Buy-Unconditional
Return
Sell-Unconditional
Return
Buy ndash Sell
Return
Ho 120583119861 minus 120583119880 = 0 120583119878 minus 120583119880 = 0 120583119861 minus 120583119878 = 0
Ha 120583119861 minus 120583119880 ne 0 120583119878 minus 120583119880 ne 0 120583119861 minus 120583119878 ne 0
After the formulation of hypotheses t-statistics were used to test the null
hypothesis of equality between unconditional mean return (120583) and mean return of
trading rules (120583119903) which is specified in Equation 1
119905119903 = 120583119887119906119910 (119904119890119897119897)minus120583
radic120590119887119906119910( 119904119890119897119897)
2
119873119887119906119910(119904119890119897119897)+
1205902
119873
(1)
where 120583119887119906119910 (119904119890119897119897) is the mean technical trading return of buy or sell 119873119887119906119910(119904119890119897119897) is the
number of trades for the buy or sell signal 120583 and N are the unconditional mean
return and number of observations respectively and 1205902 is the estimated sample
variance In testing long-short strategies (buy-sell) t-statistics is computed as
follows
119905119887119906119910minus119904119890119897119897 = 120583119887119906119910minus120583119904119890119897119897
radic120590119861119906119910
2
119873119861119906119910+
1205901198781198901198971198972
119873119878119890119897119897
(2)
where 120583119887119906119910 and 120583119904119890119897119897 are the mean returns of buy signal and sell signals 120590119861119906119910 and
120590119878119890119897119897 are the estimated sample standard deviations of buy and sell signals
respectively 119873119861119906119910 and 119873119878119890119897119897 are the number of buy and sell signals respectively
Performance Measures
Sharpe Ratio
Reward to total risk is calculated using Sharpe Ratio which measures the
expected return to per unit of total risk taken In the perspective of trading the
standard Sharpe ratio is modified by excluding the risk free rate by assuming that
the trader needs to maintain the liquidity and not investing in risk free rate Hence
Sharpe ratio is calculated as per Equation 3
119878ℎ119886119903119901119890 119877119886119905119894119900 (119878119877) =
120590119877 (3)
Muruganandan
35
where and 120590119877 are respectively the expected return and the total risk of a trading
rule in a given period Higher the ratio superior the performance indicated by it
Ratio of Average Profit to Average Loss (APAL)
This ratio is calculated by dividing the average profit from profitable trade by
average loss from the unprofitable trade The ratio of more than one indicates on
average the trading system correctly predicts the price movement than misleading
the traders Hence a higher ratio indicates the superior ability of the technical
trading rules to predict the future price movement The absolute value of this ratio is
calculated as per Equation 4
119860119875
119860119871= |
119860119907119890119903119886119892119890 119875119903119900119891119894119905
119860119907119890119903119886119892119890 119897119900119904119904| (4)
Percentage of Profitable Trade ( of PT)
This ratio indicates the proportion of profitable trade to total trade signal High
percentage indicates that the trading system identifies price change more accurately
This ratio considers the number of profitable trade to total trading signals and
ignores the value of profit (loss) earned (incurred) This performance metric is
calculated as per Equation 5
119900119891 119875119879 = 119873119906119898119887119890119903 119900119891 119875119903119900119891119894119905119886119887119897119890 119879119903119886119889119894119899119892
119879119900119905119886119897 119873119906119898119887119890119903 119900119891 119879119903119886119889119894119899119892 119904119894119892119899119886119897119904 (5)
Results and Discussion
The summary statistics for the unconditional intraday return for the entire
sample period and the nine non-overlapping sub-periods are presented in Table 3
The intraday mean returns for the entire sample period and for the sub-periods are
negative except for the period Bull-2 Bear-2 period exhibits the highest standard
deviation of 001009 Both highest (0030) and lowest (-0047) daily return for the
entire study period recorded in Bull-1 period The high value of Kurtosis indicates
that the intraday return of BSE Sensex is not normally distributed and there are
outliers However when the market is moving in the Sideway the intraday returns
become more or less normally distributed as evidenced from the low Kurtosis The
evidence of excessive Kurtosis in Bull period indicates that the unconditional
intraday returns were leptokurtic with thicker tails than the Bear and Sideway
markets Hence the variance during Bull periods results from the outliers The
Colombo Business Journal 11(1) 2020
36
negative skewness indicates that the unconditional daily returns were moderately
negatively skewed except for Sideway-1
Table 3 Descriptive Statistics for Unconditional Intraday Return
Cycle Mean Standard
deviation Kurtosis Skew Min Max Count
Overall -000041 000576 48482 -0531 -0047 0030 4545
Bear ndash 1 -000119 000855 12148 -0286 -0035 0026 437
Sideway ndash 1 -000042 000451 06693 0028 -0018 0015 411
Bull ndash 1 -000015 000605 5415 -0785 -0047 0030 1165
Bear ndash 2 -000093 001009 09469 -0359 -0038 0024 280
Bull ndash 2 000025 000583 22848 0049 -0028 0025 411
Sideway ndash 2 -000049 000423 0568 -0217 -0016 0011 679
Bull ndash 3 -000032 000349 22438 -0127 -0018 0012 381
Bear ndash 3 -000098 000406 09085 -0630 -0016 0009 225
Bull ndash 4 -000028 000279 3073 0332 -0009 0016 556
Note Unconditional intraday return defined as the log difference of closing value to opening value by
assuming that the trader buys at the opening value and sells at the closing value
The result of RSI trading rule for BSE Sensex is presented in Table 4 The first
two columns exhibit the number of buy (119873119861) and sell (119873119878) signals generated using
RSI trading rules for the overall period and non-overlapping sub-sample periods
Third and fourth column show the average buy (120583119861) and sell (120583119878) returns along
with t-test in parenthesis The basic assumption of t-test is that the observations are
normally distributed However Table 1 reveals that the returns were not normally
distributed which may question the validity of t-test results and its interpretations In
order to overcome this phenomenon Brock et al (1992) suggested the bootstrap
method developed by Efron (1979) Hence this paper employs the bootstrap
method adopted by McKenzie (2007) which mimics the procedure followed by
Brock et al (1992) Bootstrap process was repeated for 500 times and the resultant t
values and corresponding p values are reported in parentheses and square brackets
respectively However the acceptance and rejection of hypothesis were similar both
in bootstrap p values and t-test In addition standard deviation of buy and sell
signals and the mean difference between buy and sell signals are also presented in
the column five six and seven respectively
Muruganandan
37
Table 4 Statistical Results for RSI Trading Rule
Category NB NS microB microS σB σS microB - microS
Overall 116 178
-000065
(-0352)
[0739]
000003
(1308)
[0232]
000729 000434
-000068
(-0905)
[0367]
Bear ndash 1 15 13
-000002
(0489)
[0645]
00025
(2150)
[0066]
000908 000601
-000252
(-0876)
[0401]
Sideway ndash 1 14 16
-000051
(-0084)
[0946]
000065
(0859)
[0419]
000406 00049
-000116
(-0711)
[0499]
Bull ndash 1 15 54
-000199
(-0801)
[0445]
-00009
(-1273)
[0186]
000892 000414
-00011
(-0464)
[0617]
Bear ndash 2 17 7
000031
(0439)
[0661]
00009
(0488)
[0631]
001134 000979
-000059
(-0128)
[0876]
Bull ndash 2 5 21
000486
(1624)
[0076]
-000039
(-0601)
[0599]
00063 000474
000525
(1749)
[0071]
Sideway ndash 2 26 19
-000165
(-0969)
[0325]
-000009
(0831)
[0411]
0006 000205
-000156
(-1231)
[0246]
Bull ndash 3 4 16
-000121
(-0949)
[0355]
-000037
(-0063)
[0952]
000184 000294
-000084
(-0713)
[0476]
Bear ndash 3 13 5
-000149
(0415)
[0681]
000214
(1296)
[0124]
000373 000279
-00036
(-1357)
[0185]
Bull ndash 4 7 27
00000032
(0334)
[0729]
000037
(1533)
[0162]
000218 000208
-000037
(-0395)
[0691]
Notes 1 NB and NS denote the number of buy and sell signals during the period respectively microB and
microS denote the average return of buy and sell signals respectively σB and σS denote the
standard deviation of buy and sell signal returns respectively
2 Numbers in parentheses are t values and numbers in square brackets are the bootstrap p
values
Colombo Business Journal 11(1) 2020
38
RSI generates more sell signals than buy signals during the Bull market On the
contrary during the Bear and Sideway market RSI produced higher number of buy
signals than sell signals Since RSI has the upper band of 100 if the stock price goes
up continuously RSI remains in the overbought regime and produce more number
of sell signals than buy signals In this case a trader shorting the opportunity based
on RSI sell signals may not make profit as the price will move to the differentother
orbit On the other hand if the stock price goes down continuously the RSI
generates more number of buy signals than the sell signals as opposed to the current
price movement Hence the application of RSI during the long Bull and Bear
markets may not help the trader to make profit even before adjusting the transaction
cost From the result of t-test and bootstrap p values it can be concluded that buy
and sell signals does not reject the null hypothesis that the mean return of buy or sell
signals is not significantly different from the unconditional mean return Moreover
averages of buy signal returns and sell signal returns are not significantly different
from each other These results provide evidence of the existence of weak form
efficiency across the market cycle Hence it can be concluded that traders cannot
outperform the market using the RSI signals during the upward or downward
movement of the market
Table 5 Performance of RSI Trading Signal
Category
Buy Signal Performance Sell Signal Performance
SR APAL of
PT SR APAL
of
PT
Overall -00892 1007 4397 00069 10669 4888
Bear ndash 1 -00022 1489 4000 04160 14933 6923
Sideway ndash 1 -01256 0529 5714 01327 13950 5000
Bull ndash 1 -02242 0896 4000 -02174 10832 3519
Bear ndash 2 00273 1203 4706 00919 09491 5714
Bull ndash 2 07714 1766 8000 -00823 07273 5238
Sideway ndash 2 -02750 0781 3846 -00439 09970 4737
Bull ndash 3 -06576 0298 2500 -01259 07136 5000
Bear ndash 3 -02601 0742 4000 02294 13570 5938
Bull ndash 4 00014 1338 4286 01779 10837 5926
Note SR denotes the Sharpe Ratio APAL denotes the ratio of average profit to average loss
of PT denotes the percentage of profitable trade to total trading signal
Muruganandan
39
Table 5 exhibits the results of Sharpe Ratio (SR) average profit to average loss
ratio (APAL) and percentage of profitable trade to total trading signals For the
overall study period and almost all sub-samples periods buy signal underperforms
the sell signal as per the modified Sharpe ratio The absolute value of average profit
to average loss more than one indicates that the average of profitable trade is more
than the average of unprofitable trade However percentage of profitable trade less
than 50 indicates that RSI generate a higher number of unprofitable trades than
profitable trade Hence average return on buy signal is negative for the overall
study period and for six out of nine sub-sample periods On the other hand RSI sell
signal generated the positive Sharpe ratio for overall period and five out of nine sub-
sample periods Profitable trade to total trade signal indicates sell signal produced
more profitable trade in all sub-sample period except Bull-1 and Sidway-1 market
Though percentage of profitable trade to total trade for overall period is less than
50 (ie 4888) which indicate that the number of unprofitable trades is higher
than the profitable trades the profit per profitable trade is sufficiently enough to
compensate the loss in unprofitable trade The sell signal trading strategy makes
money not only from correctly predicting the market movement but also minimising
the loss quickly and allows the profit to run
The Table 6 exhibits the statistical results for the MACD trading rules During
the study period MACD generated 1522 sell signals and 858 buy signals with the
average return of 000861 and -000128 respectively The standard deviations of buy
signal returns (00179) and sell signal returns (001068) are also presented along
with mean return difference between buy and sell signals (-00021) Buy signal
produced the average negative return for all the sub-sample periods and they were
also not significantly different from the average unconditional mean return Hence
the null hypothesis was accepted and it can be concluded that buy signal produced a
return similar to that of unconditional intraday return However the sell signal
generated positive average return for the overall period and all sub-sample periods
except Bull-2 period In contrast the sell signal returns were significantly different
for the overall period and five out of nine sub-sample periods
Table 6 Statistical Results for MACD Trading Rule
Category NB NS microB microS σB σS microB -microS
Overall 858 1522
-000128
(-142)
[0170]
0000861
(443)
[0002]
0017908 0010686
-000215
(-3203)
[0008]
Colombo Business Journal 11(1) 2020
40
Category NB NS microB microS σB σS microB -microS
Bear ndash 1 141 59
-000021
(0494)
[0631]
0006379
(317)
[0002]
0023008 0018028
-000659
(-2165)
[0036]
Sideway ndash 1 131 71
-000226
(-1524)
[0142]
0000543
(0623)
[0509]
0013614 001285
-000281
(-1452)
[0162]
Bull ndash 1 85 581
-000004
(0043)
[0962]
0000196
(0703)
[0483]
0023623 0011
-000023
(-0090)
[0908]
Bear ndash 2 109 33
-000350
(-0989)
[0337]
0004699
(231)
[0036]
0026444 0013532
-00082
(-2371)
[002]
Bull ndash 2 39 192
-000031
(-0224)
[0816]
-000085
(-1066)
[0311]
0015615 0013721
0000532
(0198)
[0838]
Sideway ndash 2 166 171
-000035
(0171)
[0852]
000195
(375)
[0002]
0011182 0008263
-00023
(-2141)
[0032]
Bull ndash 3 32 165
-000171
(-0514)
[0591]
0000902
(220)
[0028]
0015215 0006737
-000261
(-0952)
[0291]
Bear ndash 3 88 25
-000146
(-0457)
[0643]
0004442
(341)
[0002]
0009516 0007832
-000591
(-3164)
[0004]
Bull ndash 4 67 225
-000205
(-1306)
[0188]
0000871
(2905)
[0008]
0011064 0005643
-000292
(-2080)
[004]
Notes 1 NB and NS denote the number of buy and sell signals during the period respectively microB
and microS denote the average return of buy and sell signals respectively σB and σS denote the
standard deviation of buy and sell signal returns respectively
2 Numbers in parenthesis are t-values and numbers in square brackets are the bootstrap p
values
3 denotes p lt 05
The risk measured by standard deviation is higher in buy signal than sell signal
trading rules for the entire study period and for all the sub-sample periods This
clearly indicates that the trading on buy signal is riskier than the sell signal
Moreover the sell signal average returns were significantly different from the
Muruganandan
41
average buy signal returns in all the Bear market periods and for the overall study
period This result supports the sell signal over buy signal specifically during the
Bear market phases This result sharply contradicts to Tharavanij et al (2015) who
found buy signals outperform the sell signals in Southeast Asian markets
Sharpe ratio average profit to average loss ratio and percentage of profitable
trade to total trade signal for MACD trading rule are presented in Table 7 For the
buy signals percentage of profitable trade to total trade has more than 50 in four
out of nine sub-sample periods but average profit to average loss is less than one
which implies that the profit from correctly predicting market direction is not
sufficient enough to cut down the loss from the failure to predict market direction
Hence Sharpe ratios for all sub-sample periods and the entire study period were
negative However the sell signals correctly predict the market with highest
percentage of profitable trade to total trade of 80 in Bear-3 period Moreover
with less ability to predict market direction in Sideway-1 (4789) and Bull-1
(4905) periods sell signal generated profit to cut down the loss from unprofitable
trade which results in average profit to average loss ratio of more than one for
Sideway-1 (122) and Bull-1 (109) period Overall the result supports the sell
signals over buy signals before considering the transaction costs in the Indian
context
Table 7 Performance of MACD Trading Signal
Category
Buy Signal Performance Sell Signal Performance
SR APAL of
PT SR APAL
of
PT
Overall -0072 0897 47669 008 106 5414
Bear ndash 1 -0009 1110 46809 035 219 5763
Sideway ndash 1 -0166 0701 47328 004 122 4789
Bull ndash 1 -0002 0805 55294 002 109 4905
Bear ndash 2 -0133 0940 43119 035 115 6667
Bull ndash 2 -0020 0734 56410 -006 084 5000
Sideway ndash 2 -0031 1122 45181 024 108 6374
Bull ndash 3 -0112 0563 56250 013 100 5879
Bear ndash 3 -0154 0682 50000 057 108 8000
Bull ndash 4 -0185 0827 41791 015 116 5644
Note SR denotes the Sharpe Ratio APAL denotes the ratio of average profit to average loss
of PT denotes the percentage of profitable trade to total trading signal
Colombo Business Journal 11(1) 2020
42
Conclusion
This paper examines the profitability of RSI and MACD technical trading rules
in the Indian market across market cycles BSE Sensex data for the period from
February 2000 to May 2018 were collected from BSE data base and classified into
nine non-overlapping periods as Bull and Bear markets based on the index
movement The t-tests were applied to test the hypothesis that returns from technical
trading rules were not significantly different from the unconditional daily returns In
addition Sharpe ratio average profit to average loss ratio and percentage of
profitable trade to total trade signal were also employed to have a microscopic view
on technical trading rules
Results support the weak-form efficient theory as RSI failed to deliver the
positive returns even before deducting the transaction costs RSI buy and sell signal
returns were not significantly different from the unconditional intraday return In
terms of market timing RSI wrongly predict the market movement and delivered
the percentage of profitable trade to total trade less than 50 Moreover profitable
trades were insufficient to overcome the loss from unprofitable trade Hence buy
signal generated a negative average return and sell signal posted a low positive
average return before deducting transaction costs Therefore after deducting
transaction costs RSI may not leave any profit in the hands of traders
MACD sell signal produced significant positive returns compared to buy signal
and unconditional intraday return However as per Sharpe ratio MACD sell signal
failed to produce the return in line with risk taken Sharpe ratio of less than one
indicates that risk associated with the technical trading rule is more than the return
generated by RSI and MACD In addition even profitable MACD sell signal does
not help in market timing It makes money from higher average profit from
profitable trade than average loss from unprofitable trade However MACD does
not help to reduce the unprofitable trade Hence the study concludes that the trader
cannot earn abnormal return consistently with the help of RSI and MACD across
market cycle in the Indian context RSI and MACD are very old and yet still widely
used as technical tools in real time stock price prediction On the other hand latest
development in information technology and changes in legal systems may have
helped the market to absorb RSI and MACD signals in current price with no time
and cost However in order to empirically validate this assumption a future study
may be extended using a proxy for information technology development and its
impact on trading rules across industries and individual stocks in emerging markets
Muruganandan
43
Declaration of Conflict of Interest
The author declared no potential conflict of interest with respect to the research
authorship and publication of this article
Acknowledgement
I would like to thank anonymous reviewers for their valuable suggestions
References
Allen F amp Karjalainen R (1999) Using genetic algorithms to find technical
trading rules Journal of Financial Economics 51(2) 245ndash271
httpsdoiorg101016S0304-405X(98)00052-X
Almujamed H I Fifield S amp Power D (2013) An investigation of the role of
technical analysis in Kuwait Qualitative Research in Financial Markets 5(1)
43ndash64 httpsdoiorg10110817554171311308959
Anghel G D I (2015) Stock market efficiency and the MACD Evidence from
countries around the world Procedia Economics and Finance 32 1414ndash1431
httpsdoiorg101016S2212-5671(15)01518-X
Atanasova C V amp Hudson R S (2010) Technical trading rules and calendar
anomalies mdash Are they the same phenomena Economics Letters 106(2) 128ndash
130 httpsdoiorg101016jeconlet200911001
Balsara N J Chen G amp Zheng L (2007) The Chinese stock market An
examination of the random walk model and technical trading rules Quarterly
Journal of Business amp Economics 46(2) 43ndash63 httpswwwjstororgstable
40473435
Balsara N Chen J amp Zheng L (2009) Profiting from a contrarian application of
technical trading rules in the US stock market Journal of Asset Management
10(2) 97ndash123 httpsdoiorg101057jam200844
Brock W Lakonishok J amp LeBaron B (1992) Simple technical trading rules
and stochastic properties of stock returns The Journal of Finance 47(5) 1731ndash
1764 httpsdoiorg101111j1540-62611992tb04681x
Chang E J Lima E J A amp Tabak B M (2004) Testing for predictability in
emerging equity markets Emerging Markets Review 5(3) 295ndash316
httpsdoi101016jememar200403005
Chiang Y-C Ke M-C Liao T L amp Wang C D (2012) Are technical trading
strategies still profitable - Evidence from the Taiwan Stock Index Futures
Market Applied Financial Economics 22(12) 955ndash965 httpsdoiorg
101080096031072011631893
Chong T T-L amp Ng W-K (2008) Technical analysis and the London stock
exchange Testing the MACD and RSI rules using the FT30 Applied
Colombo Business Journal 11(1) 2020
44
Economics Letters 15(14) 1111ndash1114 httpsdoiorg10108013504850600
993598
Cohen G amp Cabiri E (2015) Can technical oscillators outperform the buy and
hold strategy Applied Economics 47(30) 3189ndash3197 httpsdoiorg101080
0003684620151013609
Efron B (1979) Bootstrap methods Another look at the Jackknife The Annals of
Statistics 7(1)1ndash26 httpsprojecteuclidorgeuclidaos 1176344552
Fama (1970) Efficient capital markets a review of theory and empirical work
Journal of Finance 25(2) 383-417 httpswwwjstororgstable2325486
Gencay R (1998) The predictability of security returns with simple technical
trading rules Journal of Empirical Finance 5(4) 347ndash359 httpsdoiorg
101016S0927-5398(97)00022-4
Gunasekarage A amp Power D M (2001) The profitability of moving average
trading rules in South Asian stock markets Emerging Markets Review 2(1)
17ndash33 httpsdoiorg101016S1566-0141(00)00017-0
Henderson C (2002) Currency strategy The practitionerrsquos guide to currency
investing hedging and forecasting John Willy amp Sons
Heng P amp Niblock S J (2014) Trading with tigers A technical analysis of
Southeast Asian stock index futures International Economic Journal 28(4)
679ndash692 httpsdoiorg101080101687372014928895
Hudson R Dempsey M amp Keasey K (1996) A note on weak form efficiency of
capital markets The application of simple technical trading rules to UK stock
prices- 1935-1994 Journal of Banking and Finance 20(6) 1121ndash1132
httpsdoiorg1010160378-4266(95)00043-7
Jensen M C amp Benington G A (1970) Random walk and technical theories
Some additional evidence Journal of Finance 25 469ndash482
httpswwwjstororgstable2325495
Krausz J Lee S-Y amp Nam K (2009) Profitability of nonlinear dynamics
under technical trading rules Evidence from Pacific basin stock markets
Emerging Markets Finance amp Trade 45(4) 13ndash35 httpsdoiorg102753
REE1540-496X450402
Khatua A (2016) An application of moving average convergence and divergence
(MACD) indicator on selected stocks listed on National Stock Exchange (NSE)
httpdxdoiorg102139ssrn2872665
Kulkarni A D amp More A (2014) An application of moving average convergence
divergence (MACD) indicator on selected stocks listed on Bombay Stock
Exchange (BSE) Oriental Journal of Computer Science and Technology 7(3)
396ndash400 httpwwwcomputerscijournalorgp=1500
Lokeshwarri S K (2017 April 07) The big story ndash Sit back go passive The Hindu
Business Line (Coimbatore Edition) p 2
Muruganandan
45
Marshall B R Cahan R H amp Cahan J M (2008) Does intraday technical
analysis in the US equity market have value Journal of Empirical Finance
15(2) 199ndash210 httpsdoiorg101016jjempfin200605003
Marshall B R Young M R amp Cahan R (2008) Are candlestick technical
trading strategies profitable in the Japanese equity market Review of
Quantitative Finance and Accounting 31(2) 191ndash207 httpsdoiorg101007
s11156-007-0068-1
Metghalchi M Chen C-P Hajilee M (2016) Moving average trading rules for
NASDAQ composite index Applied Finance Letters 5(2) 45ndash57
httpsdoiorg1024135aflv5i254
Metghalchi M amp Hayes L A Niroomand F (2019) A technical approach to
equity investing in emerging markets Review of Financial Economics 37(3)
389ndash403 httpsdoiorg101002rfe1041
McKenzie M D (2007) Technical trading rules in emerging market and the 1997
Asian currency crises Emerging Market Finance and Trade 43(4) 46ndash73
httpsdoiorg102753REE1540-496X430403
Ming-Ming L Balachandher K G amp Nor F M (2002) An examination of the
random walk model and technical trading rules in the Malaysian stock market
Quarterly Journal of Business amp Economics 41(1) 81ndash104
httpswwwjstororgstable40473346
Ming-Ming L amp Siok-Hwa L (2006) The profitability of the simple moving
averages and trading range breakout in the Asian stock markets Journal of
Asian Economics 17(1) 144ndash170 httpsdoiorg101016jasieco200512001
Mitra S K (2011) How rewarding is technical analysis in Indian stock market
Quantitative Finance 11(2) 287ndash297 httpsdoiorg101080
14697680903493581
Nazario R T F Silva J L amp Sobrero V A (2017) A literature review of
technical analysis on stock markets The Quarterly Review of Economics and
Finance 66 115ndash126 httpsdoiorg101016jqref201701014
Neftccedili S N (1991) Naiumlve trading rules in financial markets and Wiener-
Kolmogorov prediction theory A study of ldquotechnical analysisrdquo Journal of
Business 64(4) 549ndash571
Ni Y Day M-Y Huang P ampYu S-R (2020) The profitability of Bollinger
Bamps Evidence from the constituent stocks of Taiwan 50 Physica A Statistical
Mechanics and Its Applications Advance online publication httpsdoiorg
101016jphysa2020124144
Nor S M amp Wickremasinghe G (2014) The profitability of MACD and RSI
trading rules in the Australian stock market Investment Management and
Financial Innovation 11(4) 194ndash199
Colombo Business Journal 11(1) 2020
46
Rosillo R de La Fuente D amp Brugos J A L (2013) Technical analysis and the
Spanish stock market Testing the RSI and MACD momentum and stochastic
rule using Spanish market companies Applied Economics 45(12) 1541ndash1550
httpsdoiorg101080000368462011631894
Sehgal S amp Garhyan A (2002) Abnormal returns using technical returns The
Indian experience Finance India 16(1) 181ndash203
Sehgal S amp Gupta M (2007) Tests of technical analysis in India Vision The
Journal of Business Perspective 11(3) 11ndash23 httpsdoiorg101177
097226290701100303
Sobreiro V A da Costa T R C C Nazaacuterio R T F e Silva J L Moreira E
A Filho M C L Kimura H amp Zambrano J C A (2016) The profitability
of moving average trading rules in BRICS and emerging stock markets North
American Journal of Economics and Finance 38 86ndash101 httpsdoiorg
101016jnajef201608003
Tian G G Wan G H amp Guo M (2002) Market efficiency and the returns to
simple technical trading rules New evidence from US equity market and
Chinese equity markets Asia-Pacific Financial Markets 9(3) 241ndash258
httpsdoiorg101023A1024181515265
Tharavanij P Siraprapasiri V amp Rajchamaha K (2015) Performance of
technical trading rules Evidence from Southeast Asian Stock Market
Springerplus 4552 httpsdoiorg101186s40064-015-1334-7
Wang J-L amp Chan S-H (2007) Stock market trading rule discovery using
pattern recognition and technical analysis Expert Systems with Applications
33(2) 304ndash315 httpsdoiorg101016jeswa200605002
Welles J Jr (1978) New concepts in technical trading systems Hunter Publishing
Company
Wong W-K Manzur M amp Chew B-K (2003) How rewarding is technical
analysis Evidence from Singapore stock market Journal of Applied Financial
Economics 13(7) 543ndash551 httpsdoiorg1010800960310022000020906
Yu H Nartea G V Gan C amp Yao L J (2013) Predictive ability and
profitability of simple technical trading rules Recent evidence from Southeast
Asian stock markets International Review of Economics and Finance 25 356ndash
371 httpsdoiorg101016jiref201207016
Zhu H Jiang Z-Q Li S-P amp Zhou W-X (2015) Profitability of simple
technical trading rules of Chinese stock exchange indexes Physica A
Statistical Mechanics and Its Applications 439 75ndash84 httpsdoiorg101016
jphysa201507032

Muruganandan
33
Moving Average Convergence and Divergence (MACD)
MACD is constructed based on historical exponential moving average of
closing value of index to identify the trend changes in its value It is computed
based on the difference between longer exponential moving averages (26 days)
from a shorter exponential moving average (12 days) In addition nine days simple
moving average of MACD is used as a sign to generate buy and sell signals Step-
by-step trading decision is presented as follows
Steps in generating Buy Hold and Sell Signals
1 Input Closing (119862119905) and Opening (119874119905) value of the Index on day t
2 Exponential Moving Average
119899 = 12 119886119899119889 26 119889119886119910119904 119891119900119903 119904ℎ119900119903119905 119886119899119889 119897119900119899119892 119864119872119860 119903119890119904119901119890119888119905119894119907119890119897119910
119864119872119860119905(119899) = sum (2
1+119899)
119894=119905minus(119899minus1)119894=119905 times 119862119905 + (1 minus
2
1+119899) times 119864119872119860119905minus1(119899)
3 119872119860119862119863 119864119872119860119905(119878ℎ119900119903119905119890119903) minus 119864119872119860119905(119871119900119899119892119890119903)
4 Signal Line 119878119894119892119899119905 = 1198781198721198609(119872119860119862119863)
5 Trading Decision2 119861119906119910 119874119905+1
119894119891119872119860119862119863119905 lt 0 119878119894119892119899119905 lt 0 amp 119878119894119892119899119905 gt 119872119860119862119863119905
Else
119878119886119897119890 119874119905+1
119894119891119872119860119862119863119905 gt 0 119878119894119892119899119905 gt 0 amp 119878119894119892119899119905 lt 119872119860119862119863119905
Or
Hold
6 Output Calculation of Return
119894119891 119887119906119910 119874119905+1 =
(119897119900119892(119862119905+1) minus 119897119900119892(119874119905+1))
119894119891 119878119886119897119890 119874119905+1 =
(119897119900119892(119874119905+1) minus 119897119900119892(119862119905+1))
Further the following hypotheses were framed to test whether returns of buy or
sell signals are different from the unconditional mean return and also whether the
mean buy signal return is different from mean sell signal return The null and
alternative hypotheses of the study are stated in Table 2
2 The trading rules were applied as per Rosillo et al (2013) Unlike previous studies in
order to imitate the real time stock trading scenario opening and closing values were
considered for executing the trading signals and calculation of return
Colombo Business Journal 11(1) 2020
34
Table2 Hypotheses of the Study
Buy-Unconditional
Return
Sell-Unconditional
Return
Buy ndash Sell
Return
Ho 120583119861 minus 120583119880 = 0 120583119878 minus 120583119880 = 0 120583119861 minus 120583119878 = 0
Ha 120583119861 minus 120583119880 ne 0 120583119878 minus 120583119880 ne 0 120583119861 minus 120583119878 ne 0
After the formulation of hypotheses t-statistics were used to test the null
hypothesis of equality between unconditional mean return (120583) and mean return of
trading rules (120583119903) which is specified in Equation 1
119905119903 = 120583119887119906119910 (119904119890119897119897)minus120583
radic120590119887119906119910( 119904119890119897119897)
2
119873119887119906119910(119904119890119897119897)+
1205902
119873
(1)
where 120583119887119906119910 (119904119890119897119897) is the mean technical trading return of buy or sell 119873119887119906119910(119904119890119897119897) is the
number of trades for the buy or sell signal 120583 and N are the unconditional mean
return and number of observations respectively and 1205902 is the estimated sample
variance In testing long-short strategies (buy-sell) t-statistics is computed as
follows
119905119887119906119910minus119904119890119897119897 = 120583119887119906119910minus120583119904119890119897119897
radic120590119861119906119910
2
119873119861119906119910+
1205901198781198901198971198972
119873119878119890119897119897
(2)
where 120583119887119906119910 and 120583119904119890119897119897 are the mean returns of buy signal and sell signals 120590119861119906119910 and
120590119878119890119897119897 are the estimated sample standard deviations of buy and sell signals
respectively 119873119861119906119910 and 119873119878119890119897119897 are the number of buy and sell signals respectively
Performance Measures
Sharpe Ratio
Reward to total risk is calculated using Sharpe Ratio which measures the
expected return to per unit of total risk taken In the perspective of trading the
standard Sharpe ratio is modified by excluding the risk free rate by assuming that
the trader needs to maintain the liquidity and not investing in risk free rate Hence
Sharpe ratio is calculated as per Equation 3
119878ℎ119886119903119901119890 119877119886119905119894119900 (119878119877) =
120590119877 (3)
Muruganandan
35
where and 120590119877 are respectively the expected return and the total risk of a trading
rule in a given period Higher the ratio superior the performance indicated by it
Ratio of Average Profit to Average Loss (APAL)
This ratio is calculated by dividing the average profit from profitable trade by
average loss from the unprofitable trade The ratio of more than one indicates on
average the trading system correctly predicts the price movement than misleading
the traders Hence a higher ratio indicates the superior ability of the technical
trading rules to predict the future price movement The absolute value of this ratio is
calculated as per Equation 4
119860119875
119860119871= |
119860119907119890119903119886119892119890 119875119903119900119891119894119905
119860119907119890119903119886119892119890 119897119900119904119904| (4)
Percentage of Profitable Trade ( of PT)
This ratio indicates the proportion of profitable trade to total trade signal High
percentage indicates that the trading system identifies price change more accurately
This ratio considers the number of profitable trade to total trading signals and
ignores the value of profit (loss) earned (incurred) This performance metric is
calculated as per Equation 5
119900119891 119875119879 = 119873119906119898119887119890119903 119900119891 119875119903119900119891119894119905119886119887119897119890 119879119903119886119889119894119899119892
119879119900119905119886119897 119873119906119898119887119890119903 119900119891 119879119903119886119889119894119899119892 119904119894119892119899119886119897119904 (5)
Results and Discussion
The summary statistics for the unconditional intraday return for the entire
sample period and the nine non-overlapping sub-periods are presented in Table 3
The intraday mean returns for the entire sample period and for the sub-periods are
negative except for the period Bull-2 Bear-2 period exhibits the highest standard
deviation of 001009 Both highest (0030) and lowest (-0047) daily return for the
entire study period recorded in Bull-1 period The high value of Kurtosis indicates
that the intraday return of BSE Sensex is not normally distributed and there are
outliers However when the market is moving in the Sideway the intraday returns
become more or less normally distributed as evidenced from the low Kurtosis The
evidence of excessive Kurtosis in Bull period indicates that the unconditional
intraday returns were leptokurtic with thicker tails than the Bear and Sideway
markets Hence the variance during Bull periods results from the outliers The
Colombo Business Journal 11(1) 2020
36
negative skewness indicates that the unconditional daily returns were moderately
negatively skewed except for Sideway-1
Table 3 Descriptive Statistics for Unconditional Intraday Return
Cycle Mean Standard
deviation Kurtosis Skew Min Max Count
Overall -000041 000576 48482 -0531 -0047 0030 4545
Bear ndash 1 -000119 000855 12148 -0286 -0035 0026 437
Sideway ndash 1 -000042 000451 06693 0028 -0018 0015 411
Bull ndash 1 -000015 000605 5415 -0785 -0047 0030 1165
Bear ndash 2 -000093 001009 09469 -0359 -0038 0024 280
Bull ndash 2 000025 000583 22848 0049 -0028 0025 411
Sideway ndash 2 -000049 000423 0568 -0217 -0016 0011 679
Bull ndash 3 -000032 000349 22438 -0127 -0018 0012 381
Bear ndash 3 -000098 000406 09085 -0630 -0016 0009 225
Bull ndash 4 -000028 000279 3073 0332 -0009 0016 556
Note Unconditional intraday return defined as the log difference of closing value to opening value by
assuming that the trader buys at the opening value and sells at the closing value
The result of RSI trading rule for BSE Sensex is presented in Table 4 The first
two columns exhibit the number of buy (119873119861) and sell (119873119878) signals generated using
RSI trading rules for the overall period and non-overlapping sub-sample periods
Third and fourth column show the average buy (120583119861) and sell (120583119878) returns along
with t-test in parenthesis The basic assumption of t-test is that the observations are
normally distributed However Table 1 reveals that the returns were not normally
distributed which may question the validity of t-test results and its interpretations In
order to overcome this phenomenon Brock et al (1992) suggested the bootstrap
method developed by Efron (1979) Hence this paper employs the bootstrap
method adopted by McKenzie (2007) which mimics the procedure followed by
Brock et al (1992) Bootstrap process was repeated for 500 times and the resultant t
values and corresponding p values are reported in parentheses and square brackets
respectively However the acceptance and rejection of hypothesis were similar both
in bootstrap p values and t-test In addition standard deviation of buy and sell
signals and the mean difference between buy and sell signals are also presented in
the column five six and seven respectively
Muruganandan
37
Table 4 Statistical Results for RSI Trading Rule
Category NB NS microB microS σB σS microB - microS
Overall 116 178
-000065
(-0352)
[0739]
000003
(1308)
[0232]
000729 000434
-000068
(-0905)
[0367]
Bear ndash 1 15 13
-000002
(0489)
[0645]
00025
(2150)
[0066]
000908 000601
-000252
(-0876)
[0401]
Sideway ndash 1 14 16
-000051
(-0084)
[0946]
000065
(0859)
[0419]
000406 00049
-000116
(-0711)
[0499]
Bull ndash 1 15 54
-000199
(-0801)
[0445]
-00009
(-1273)
[0186]
000892 000414
-00011
(-0464)
[0617]
Bear ndash 2 17 7
000031
(0439)
[0661]
00009
(0488)
[0631]
001134 000979
-000059
(-0128)
[0876]
Bull ndash 2 5 21
000486
(1624)
[0076]
-000039
(-0601)
[0599]
00063 000474
000525
(1749)
[0071]
Sideway ndash 2 26 19
-000165
(-0969)
[0325]
-000009
(0831)
[0411]
0006 000205
-000156
(-1231)
[0246]
Bull ndash 3 4 16
-000121
(-0949)
[0355]
-000037
(-0063)
[0952]
000184 000294
-000084
(-0713)
[0476]
Bear ndash 3 13 5
-000149
(0415)
[0681]
000214
(1296)
[0124]
000373 000279
-00036
(-1357)
[0185]
Bull ndash 4 7 27
00000032
(0334)
[0729]
000037
(1533)
[0162]
000218 000208
-000037
(-0395)
[0691]
Notes 1 NB and NS denote the number of buy and sell signals during the period respectively microB and
microS denote the average return of buy and sell signals respectively σB and σS denote the
standard deviation of buy and sell signal returns respectively
2 Numbers in parentheses are t values and numbers in square brackets are the bootstrap p
values
Colombo Business Journal 11(1) 2020
38
RSI generates more sell signals than buy signals during the Bull market On the
contrary during the Bear and Sideway market RSI produced higher number of buy
signals than sell signals Since RSI has the upper band of 100 if the stock price goes
up continuously RSI remains in the overbought regime and produce more number
of sell signals than buy signals In this case a trader shorting the opportunity based
on RSI sell signals may not make profit as the price will move to the differentother
orbit On the other hand if the stock price goes down continuously the RSI
generates more number of buy signals than the sell signals as opposed to the current
price movement Hence the application of RSI during the long Bull and Bear
markets may not help the trader to make profit even before adjusting the transaction
cost From the result of t-test and bootstrap p values it can be concluded that buy
and sell signals does not reject the null hypothesis that the mean return of buy or sell
signals is not significantly different from the unconditional mean return Moreover
averages of buy signal returns and sell signal returns are not significantly different
from each other These results provide evidence of the existence of weak form
efficiency across the market cycle Hence it can be concluded that traders cannot
outperform the market using the RSI signals during the upward or downward
movement of the market
Table 5 Performance of RSI Trading Signal
Category
Buy Signal Performance Sell Signal Performance
SR APAL of
PT SR APAL
of
PT
Overall -00892 1007 4397 00069 10669 4888
Bear ndash 1 -00022 1489 4000 04160 14933 6923
Sideway ndash 1 -01256 0529 5714 01327 13950 5000
Bull ndash 1 -02242 0896 4000 -02174 10832 3519
Bear ndash 2 00273 1203 4706 00919 09491 5714
Bull ndash 2 07714 1766 8000 -00823 07273 5238
Sideway ndash 2 -02750 0781 3846 -00439 09970 4737
Bull ndash 3 -06576 0298 2500 -01259 07136 5000
Bear ndash 3 -02601 0742 4000 02294 13570 5938
Bull ndash 4 00014 1338 4286 01779 10837 5926
Note SR denotes the Sharpe Ratio APAL denotes the ratio of average profit to average loss
of PT denotes the percentage of profitable trade to total trading signal
Muruganandan
39
Table 5 exhibits the results of Sharpe Ratio (SR) average profit to average loss
ratio (APAL) and percentage of profitable trade to total trading signals For the
overall study period and almost all sub-samples periods buy signal underperforms
the sell signal as per the modified Sharpe ratio The absolute value of average profit
to average loss more than one indicates that the average of profitable trade is more
than the average of unprofitable trade However percentage of profitable trade less
than 50 indicates that RSI generate a higher number of unprofitable trades than
profitable trade Hence average return on buy signal is negative for the overall
study period and for six out of nine sub-sample periods On the other hand RSI sell
signal generated the positive Sharpe ratio for overall period and five out of nine sub-
sample periods Profitable trade to total trade signal indicates sell signal produced
more profitable trade in all sub-sample period except Bull-1 and Sidway-1 market
Though percentage of profitable trade to total trade for overall period is less than
50 (ie 4888) which indicate that the number of unprofitable trades is higher
than the profitable trades the profit per profitable trade is sufficiently enough to
compensate the loss in unprofitable trade The sell signal trading strategy makes
money not only from correctly predicting the market movement but also minimising
the loss quickly and allows the profit to run
The Table 6 exhibits the statistical results for the MACD trading rules During
the study period MACD generated 1522 sell signals and 858 buy signals with the
average return of 000861 and -000128 respectively The standard deviations of buy
signal returns (00179) and sell signal returns (001068) are also presented along
with mean return difference between buy and sell signals (-00021) Buy signal
produced the average negative return for all the sub-sample periods and they were
also not significantly different from the average unconditional mean return Hence
the null hypothesis was accepted and it can be concluded that buy signal produced a
return similar to that of unconditional intraday return However the sell signal
generated positive average return for the overall period and all sub-sample periods
except Bull-2 period In contrast the sell signal returns were significantly different
for the overall period and five out of nine sub-sample periods
Table 6 Statistical Results for MACD Trading Rule
Category NB NS microB microS σB σS microB -microS
Overall 858 1522
-000128
(-142)
[0170]
0000861
(443)
[0002]
0017908 0010686
-000215
(-3203)
[0008]
Colombo Business Journal 11(1) 2020
40
Category NB NS microB microS σB σS microB -microS
Bear ndash 1 141 59
-000021
(0494)
[0631]
0006379
(317)
[0002]
0023008 0018028
-000659
(-2165)
[0036]
Sideway ndash 1 131 71
-000226
(-1524)
[0142]
0000543
(0623)
[0509]
0013614 001285
-000281
(-1452)
[0162]
Bull ndash 1 85 581
-000004
(0043)
[0962]
0000196
(0703)
[0483]
0023623 0011
-000023
(-0090)
[0908]
Bear ndash 2 109 33
-000350
(-0989)
[0337]
0004699
(231)
[0036]
0026444 0013532
-00082
(-2371)
[002]
Bull ndash 2 39 192
-000031
(-0224)
[0816]
-000085
(-1066)
[0311]
0015615 0013721
0000532
(0198)
[0838]
Sideway ndash 2 166 171
-000035
(0171)
[0852]
000195
(375)
[0002]
0011182 0008263
-00023
(-2141)
[0032]
Bull ndash 3 32 165
-000171
(-0514)
[0591]
0000902
(220)
[0028]
0015215 0006737
-000261
(-0952)
[0291]
Bear ndash 3 88 25
-000146
(-0457)
[0643]
0004442
(341)
[0002]
0009516 0007832
-000591
(-3164)
[0004]
Bull ndash 4 67 225
-000205
(-1306)
[0188]
0000871
(2905)
[0008]
0011064 0005643
-000292
(-2080)
[004]
Notes 1 NB and NS denote the number of buy and sell signals during the period respectively microB
and microS denote the average return of buy and sell signals respectively σB and σS denote the
standard deviation of buy and sell signal returns respectively
2 Numbers in parenthesis are t-values and numbers in square brackets are the bootstrap p
values
3 denotes p lt 05
The risk measured by standard deviation is higher in buy signal than sell signal
trading rules for the entire study period and for all the sub-sample periods This
clearly indicates that the trading on buy signal is riskier than the sell signal
Moreover the sell signal average returns were significantly different from the
Muruganandan
41
average buy signal returns in all the Bear market periods and for the overall study
period This result supports the sell signal over buy signal specifically during the
Bear market phases This result sharply contradicts to Tharavanij et al (2015) who
found buy signals outperform the sell signals in Southeast Asian markets
Sharpe ratio average profit to average loss ratio and percentage of profitable
trade to total trade signal for MACD trading rule are presented in Table 7 For the
buy signals percentage of profitable trade to total trade has more than 50 in four
out of nine sub-sample periods but average profit to average loss is less than one
which implies that the profit from correctly predicting market direction is not
sufficient enough to cut down the loss from the failure to predict market direction
Hence Sharpe ratios for all sub-sample periods and the entire study period were
negative However the sell signals correctly predict the market with highest
percentage of profitable trade to total trade of 80 in Bear-3 period Moreover
with less ability to predict market direction in Sideway-1 (4789) and Bull-1
(4905) periods sell signal generated profit to cut down the loss from unprofitable
trade which results in average profit to average loss ratio of more than one for
Sideway-1 (122) and Bull-1 (109) period Overall the result supports the sell
signals over buy signals before considering the transaction costs in the Indian
context
Table 7 Performance of MACD Trading Signal
Category
Buy Signal Performance Sell Signal Performance
SR APAL of
PT SR APAL
of
PT
Overall -0072 0897 47669 008 106 5414
Bear ndash 1 -0009 1110 46809 035 219 5763
Sideway ndash 1 -0166 0701 47328 004 122 4789
Bull ndash 1 -0002 0805 55294 002 109 4905
Bear ndash 2 -0133 0940 43119 035 115 6667
Bull ndash 2 -0020 0734 56410 -006 084 5000
Sideway ndash 2 -0031 1122 45181 024 108 6374
Bull ndash 3 -0112 0563 56250 013 100 5879
Bear ndash 3 -0154 0682 50000 057 108 8000
Bull ndash 4 -0185 0827 41791 015 116 5644
Note SR denotes the Sharpe Ratio APAL denotes the ratio of average profit to average loss
of PT denotes the percentage of profitable trade to total trading signal
Colombo Business Journal 11(1) 2020
42
Conclusion
This paper examines the profitability of RSI and MACD technical trading rules
in the Indian market across market cycles BSE Sensex data for the period from
February 2000 to May 2018 were collected from BSE data base and classified into
nine non-overlapping periods as Bull and Bear markets based on the index
movement The t-tests were applied to test the hypothesis that returns from technical
trading rules were not significantly different from the unconditional daily returns In
addition Sharpe ratio average profit to average loss ratio and percentage of
profitable trade to total trade signal were also employed to have a microscopic view
on technical trading rules
Results support the weak-form efficient theory as RSI failed to deliver the
positive returns even before deducting the transaction costs RSI buy and sell signal
returns were not significantly different from the unconditional intraday return In
terms of market timing RSI wrongly predict the market movement and delivered
the percentage of profitable trade to total trade less than 50 Moreover profitable
trades were insufficient to overcome the loss from unprofitable trade Hence buy
signal generated a negative average return and sell signal posted a low positive
average return before deducting transaction costs Therefore after deducting
transaction costs RSI may not leave any profit in the hands of traders
MACD sell signal produced significant positive returns compared to buy signal
and unconditional intraday return However as per Sharpe ratio MACD sell signal
failed to produce the return in line with risk taken Sharpe ratio of less than one
indicates that risk associated with the technical trading rule is more than the return
generated by RSI and MACD In addition even profitable MACD sell signal does
not help in market timing It makes money from higher average profit from
profitable trade than average loss from unprofitable trade However MACD does
not help to reduce the unprofitable trade Hence the study concludes that the trader
cannot earn abnormal return consistently with the help of RSI and MACD across
market cycle in the Indian context RSI and MACD are very old and yet still widely
used as technical tools in real time stock price prediction On the other hand latest
development in information technology and changes in legal systems may have
helped the market to absorb RSI and MACD signals in current price with no time
and cost However in order to empirically validate this assumption a future study
may be extended using a proxy for information technology development and its
impact on trading rules across industries and individual stocks in emerging markets
Muruganandan
43
Declaration of Conflict of Interest
The author declared no potential conflict of interest with respect to the research
authorship and publication of this article
Acknowledgement
I would like to thank anonymous reviewers for their valuable suggestions
References
Allen F amp Karjalainen R (1999) Using genetic algorithms to find technical
trading rules Journal of Financial Economics 51(2) 245ndash271
httpsdoiorg101016S0304-405X(98)00052-X
Almujamed H I Fifield S amp Power D (2013) An investigation of the role of
technical analysis in Kuwait Qualitative Research in Financial Markets 5(1)
43ndash64 httpsdoiorg10110817554171311308959
Anghel G D I (2015) Stock market efficiency and the MACD Evidence from
countries around the world Procedia Economics and Finance 32 1414ndash1431
httpsdoiorg101016S2212-5671(15)01518-X
Atanasova C V amp Hudson R S (2010) Technical trading rules and calendar
anomalies mdash Are they the same phenomena Economics Letters 106(2) 128ndash
130 httpsdoiorg101016jeconlet200911001
Balsara N J Chen G amp Zheng L (2007) The Chinese stock market An
examination of the random walk model and technical trading rules Quarterly
Journal of Business amp Economics 46(2) 43ndash63 httpswwwjstororgstable
40473435
Balsara N Chen J amp Zheng L (2009) Profiting from a contrarian application of
technical trading rules in the US stock market Journal of Asset Management
10(2) 97ndash123 httpsdoiorg101057jam200844
Brock W Lakonishok J amp LeBaron B (1992) Simple technical trading rules
and stochastic properties of stock returns The Journal of Finance 47(5) 1731ndash
1764 httpsdoiorg101111j1540-62611992tb04681x
Chang E J Lima E J A amp Tabak B M (2004) Testing for predictability in
emerging equity markets Emerging Markets Review 5(3) 295ndash316
httpsdoi101016jememar200403005
Chiang Y-C Ke M-C Liao T L amp Wang C D (2012) Are technical trading
strategies still profitable - Evidence from the Taiwan Stock Index Futures
Market Applied Financial Economics 22(12) 955ndash965 httpsdoiorg
101080096031072011631893
Chong T T-L amp Ng W-K (2008) Technical analysis and the London stock
exchange Testing the MACD and RSI rules using the FT30 Applied
Colombo Business Journal 11(1) 2020
44
Economics Letters 15(14) 1111ndash1114 httpsdoiorg10108013504850600
993598
Cohen G amp Cabiri E (2015) Can technical oscillators outperform the buy and
hold strategy Applied Economics 47(30) 3189ndash3197 httpsdoiorg101080
0003684620151013609
Efron B (1979) Bootstrap methods Another look at the Jackknife The Annals of
Statistics 7(1)1ndash26 httpsprojecteuclidorgeuclidaos 1176344552
Fama (1970) Efficient capital markets a review of theory and empirical work
Journal of Finance 25(2) 383-417 httpswwwjstororgstable2325486
Gencay R (1998) The predictability of security returns with simple technical
trading rules Journal of Empirical Finance 5(4) 347ndash359 httpsdoiorg
101016S0927-5398(97)00022-4
Gunasekarage A amp Power D M (2001) The profitability of moving average
trading rules in South Asian stock markets Emerging Markets Review 2(1)
17ndash33 httpsdoiorg101016S1566-0141(00)00017-0
Henderson C (2002) Currency strategy The practitionerrsquos guide to currency
investing hedging and forecasting John Willy amp Sons
Heng P amp Niblock S J (2014) Trading with tigers A technical analysis of
Southeast Asian stock index futures International Economic Journal 28(4)
679ndash692 httpsdoiorg101080101687372014928895
Hudson R Dempsey M amp Keasey K (1996) A note on weak form efficiency of
capital markets The application of simple technical trading rules to UK stock
prices- 1935-1994 Journal of Banking and Finance 20(6) 1121ndash1132
httpsdoiorg1010160378-4266(95)00043-7
Jensen M C amp Benington G A (1970) Random walk and technical theories
Some additional evidence Journal of Finance 25 469ndash482
httpswwwjstororgstable2325495
Krausz J Lee S-Y amp Nam K (2009) Profitability of nonlinear dynamics
under technical trading rules Evidence from Pacific basin stock markets
Emerging Markets Finance amp Trade 45(4) 13ndash35 httpsdoiorg102753
REE1540-496X450402
Khatua A (2016) An application of moving average convergence and divergence
(MACD) indicator on selected stocks listed on National Stock Exchange (NSE)
httpdxdoiorg102139ssrn2872665
Kulkarni A D amp More A (2014) An application of moving average convergence
divergence (MACD) indicator on selected stocks listed on Bombay Stock
Exchange (BSE) Oriental Journal of Computer Science and Technology 7(3)
396ndash400 httpwwwcomputerscijournalorgp=1500
Lokeshwarri S K (2017 April 07) The big story ndash Sit back go passive The Hindu
Business Line (Coimbatore Edition) p 2
Muruganandan
45
Marshall B R Cahan R H amp Cahan J M (2008) Does intraday technical
analysis in the US equity market have value Journal of Empirical Finance
15(2) 199ndash210 httpsdoiorg101016jjempfin200605003
Marshall B R Young M R amp Cahan R (2008) Are candlestick technical
trading strategies profitable in the Japanese equity market Review of
Quantitative Finance and Accounting 31(2) 191ndash207 httpsdoiorg101007
s11156-007-0068-1
Metghalchi M Chen C-P Hajilee M (2016) Moving average trading rules for
NASDAQ composite index Applied Finance Letters 5(2) 45ndash57
httpsdoiorg1024135aflv5i254
Metghalchi M amp Hayes L A Niroomand F (2019) A technical approach to
equity investing in emerging markets Review of Financial Economics 37(3)
389ndash403 httpsdoiorg101002rfe1041
McKenzie M D (2007) Technical trading rules in emerging market and the 1997
Asian currency crises Emerging Market Finance and Trade 43(4) 46ndash73
httpsdoiorg102753REE1540-496X430403
Ming-Ming L Balachandher K G amp Nor F M (2002) An examination of the
random walk model and technical trading rules in the Malaysian stock market
Quarterly Journal of Business amp Economics 41(1) 81ndash104
httpswwwjstororgstable40473346
Ming-Ming L amp Siok-Hwa L (2006) The profitability of the simple moving
averages and trading range breakout in the Asian stock markets Journal of
Asian Economics 17(1) 144ndash170 httpsdoiorg101016jasieco200512001
Mitra S K (2011) How rewarding is technical analysis in Indian stock market
Quantitative Finance 11(2) 287ndash297 httpsdoiorg101080
14697680903493581
Nazario R T F Silva J L amp Sobrero V A (2017) A literature review of
technical analysis on stock markets The Quarterly Review of Economics and
Finance 66 115ndash126 httpsdoiorg101016jqref201701014
Neftccedili S N (1991) Naiumlve trading rules in financial markets and Wiener-
Kolmogorov prediction theory A study of ldquotechnical analysisrdquo Journal of
Business 64(4) 549ndash571
Ni Y Day M-Y Huang P ampYu S-R (2020) The profitability of Bollinger
Bamps Evidence from the constituent stocks of Taiwan 50 Physica A Statistical
Mechanics and Its Applications Advance online publication httpsdoiorg
101016jphysa2020124144
Nor S M amp Wickremasinghe G (2014) The profitability of MACD and RSI
trading rules in the Australian stock market Investment Management and
Financial Innovation 11(4) 194ndash199
Colombo Business Journal 11(1) 2020
46
Rosillo R de La Fuente D amp Brugos J A L (2013) Technical analysis and the
Spanish stock market Testing the RSI and MACD momentum and stochastic
rule using Spanish market companies Applied Economics 45(12) 1541ndash1550
httpsdoiorg101080000368462011631894
Sehgal S amp Garhyan A (2002) Abnormal returns using technical returns The
Indian experience Finance India 16(1) 181ndash203
Sehgal S amp Gupta M (2007) Tests of technical analysis in India Vision The
Journal of Business Perspective 11(3) 11ndash23 httpsdoiorg101177
097226290701100303
Sobreiro V A da Costa T R C C Nazaacuterio R T F e Silva J L Moreira E
A Filho M C L Kimura H amp Zambrano J C A (2016) The profitability
of moving average trading rules in BRICS and emerging stock markets North
American Journal of Economics and Finance 38 86ndash101 httpsdoiorg
101016jnajef201608003
Tian G G Wan G H amp Guo M (2002) Market efficiency and the returns to
simple technical trading rules New evidence from US equity market and
Chinese equity markets Asia-Pacific Financial Markets 9(3) 241ndash258
httpsdoiorg101023A1024181515265
Tharavanij P Siraprapasiri V amp Rajchamaha K (2015) Performance of
technical trading rules Evidence from Southeast Asian Stock Market
Springerplus 4552 httpsdoiorg101186s40064-015-1334-7
Wang J-L amp Chan S-H (2007) Stock market trading rule discovery using
pattern recognition and technical analysis Expert Systems with Applications
33(2) 304ndash315 httpsdoiorg101016jeswa200605002
Welles J Jr (1978) New concepts in technical trading systems Hunter Publishing
Company
Wong W-K Manzur M amp Chew B-K (2003) How rewarding is technical
analysis Evidence from Singapore stock market Journal of Applied Financial
Economics 13(7) 543ndash551 httpsdoiorg1010800960310022000020906
Yu H Nartea G V Gan C amp Yao L J (2013) Predictive ability and
profitability of simple technical trading rules Recent evidence from Southeast
Asian stock markets International Review of Economics and Finance 25 356ndash
371 httpsdoiorg101016jiref201207016
Zhu H Jiang Z-Q Li S-P amp Zhou W-X (2015) Profitability of simple
technical trading rules of Chinese stock exchange indexes Physica A
Statistical Mechanics and Its Applications 439 75ndash84 httpsdoiorg101016
jphysa201507032
Colombo Business Journal 11(1) 2020
34
Table2 Hypotheses of the Study
Buy-Unconditional
Return
Sell-Unconditional
Return
Buy ndash Sell
Return
Ho 120583119861 minus 120583119880 = 0 120583119878 minus 120583119880 = 0 120583119861 minus 120583119878 = 0
Ha 120583119861 minus 120583119880 ne 0 120583119878 minus 120583119880 ne 0 120583119861 minus 120583119878 ne 0
After the formulation of hypotheses t-statistics were used to test the null
hypothesis of equality between unconditional mean return (120583) and mean return of
trading rules (120583119903) which is specified in Equation 1
119905119903 = 120583119887119906119910 (119904119890119897119897)minus120583
radic120590119887119906119910( 119904119890119897119897)
2
119873119887119906119910(119904119890119897119897)+
1205902
119873
(1)
where 120583119887119906119910 (119904119890119897119897) is the mean technical trading return of buy or sell 119873119887119906119910(119904119890119897119897) is the
number of trades for the buy or sell signal 120583 and N are the unconditional mean
return and number of observations respectively and 1205902 is the estimated sample
variance In testing long-short strategies (buy-sell) t-statistics is computed as
follows
119905119887119906119910minus119904119890119897119897 = 120583119887119906119910minus120583119904119890119897119897
radic120590119861119906119910
2
119873119861119906119910+
1205901198781198901198971198972
119873119878119890119897119897
(2)
where 120583119887119906119910 and 120583119904119890119897119897 are the mean returns of buy signal and sell signals 120590119861119906119910 and
120590119878119890119897119897 are the estimated sample standard deviations of buy and sell signals
respectively 119873119861119906119910 and 119873119878119890119897119897 are the number of buy and sell signals respectively
Performance Measures
Sharpe Ratio
Reward to total risk is calculated using Sharpe Ratio which measures the
expected return to per unit of total risk taken In the perspective of trading the
standard Sharpe ratio is modified by excluding the risk free rate by assuming that
the trader needs to maintain the liquidity and not investing in risk free rate Hence
Sharpe ratio is calculated as per Equation 3
119878ℎ119886119903119901119890 119877119886119905119894119900 (119878119877) =
120590119877 (3)
Muruganandan
35
where and 120590119877 are respectively the expected return and the total risk of a trading
rule in a given period Higher the ratio superior the performance indicated by it
Ratio of Average Profit to Average Loss (APAL)
This ratio is calculated by dividing the average profit from profitable trade by
average loss from the unprofitable trade The ratio of more than one indicates on
average the trading system correctly predicts the price movement than misleading
the traders Hence a higher ratio indicates the superior ability of the technical
trading rules to predict the future price movement The absolute value of this ratio is
calculated as per Equation 4
119860119875
119860119871= |
119860119907119890119903119886119892119890 119875119903119900119891119894119905
119860119907119890119903119886119892119890 119897119900119904119904| (4)
Percentage of Profitable Trade ( of PT)
This ratio indicates the proportion of profitable trade to total trade signal High
percentage indicates that the trading system identifies price change more accurately
This ratio considers the number of profitable trade to total trading signals and
ignores the value of profit (loss) earned (incurred) This performance metric is
calculated as per Equation 5
119900119891 119875119879 = 119873119906119898119887119890119903 119900119891 119875119903119900119891119894119905119886119887119897119890 119879119903119886119889119894119899119892
119879119900119905119886119897 119873119906119898119887119890119903 119900119891 119879119903119886119889119894119899119892 119904119894119892119899119886119897119904 (5)
Results and Discussion
The summary statistics for the unconditional intraday return for the entire
sample period and the nine non-overlapping sub-periods are presented in Table 3
The intraday mean returns for the entire sample period and for the sub-periods are
negative except for the period Bull-2 Bear-2 period exhibits the highest standard
deviation of 001009 Both highest (0030) and lowest (-0047) daily return for the
entire study period recorded in Bull-1 period The high value of Kurtosis indicates
that the intraday return of BSE Sensex is not normally distributed and there are
outliers However when the market is moving in the Sideway the intraday returns
become more or less normally distributed as evidenced from the low Kurtosis The
evidence of excessive Kurtosis in Bull period indicates that the unconditional
intraday returns were leptokurtic with thicker tails than the Bear and Sideway
markets Hence the variance during Bull periods results from the outliers The
Colombo Business Journal 11(1) 2020
36
negative skewness indicates that the unconditional daily returns were moderately
negatively skewed except for Sideway-1
Table 3 Descriptive Statistics for Unconditional Intraday Return
Cycle Mean Standard
deviation Kurtosis Skew Min Max Count
Overall -000041 000576 48482 -0531 -0047 0030 4545
Bear ndash 1 -000119 000855 12148 -0286 -0035 0026 437
Sideway ndash 1 -000042 000451 06693 0028 -0018 0015 411
Bull ndash 1 -000015 000605 5415 -0785 -0047 0030 1165
Bear ndash 2 -000093 001009 09469 -0359 -0038 0024 280
Bull ndash 2 000025 000583 22848 0049 -0028 0025 411
Sideway ndash 2 -000049 000423 0568 -0217 -0016 0011 679
Bull ndash 3 -000032 000349 22438 -0127 -0018 0012 381
Bear ndash 3 -000098 000406 09085 -0630 -0016 0009 225
Bull ndash 4 -000028 000279 3073 0332 -0009 0016 556
Note Unconditional intraday return defined as the log difference of closing value to opening value by
assuming that the trader buys at the opening value and sells at the closing value
The result of RSI trading rule for BSE Sensex is presented in Table 4 The first
two columns exhibit the number of buy (119873119861) and sell (119873119878) signals generated using
RSI trading rules for the overall period and non-overlapping sub-sample periods
Third and fourth column show the average buy (120583119861) and sell (120583119878) returns along
with t-test in parenthesis The basic assumption of t-test is that the observations are
normally distributed However Table 1 reveals that the returns were not normally
distributed which may question the validity of t-test results and its interpretations In
order to overcome this phenomenon Brock et al (1992) suggested the bootstrap
method developed by Efron (1979) Hence this paper employs the bootstrap
method adopted by McKenzie (2007) which mimics the procedure followed by
Brock et al (1992) Bootstrap process was repeated for 500 times and the resultant t
values and corresponding p values are reported in parentheses and square brackets
respectively However the acceptance and rejection of hypothesis were similar both
in bootstrap p values and t-test In addition standard deviation of buy and sell
signals and the mean difference between buy and sell signals are also presented in
the column five six and seven respectively
Muruganandan
37
Table 4 Statistical Results for RSI Trading Rule
Category NB NS microB microS σB σS microB - microS
Overall 116 178
-000065
(-0352)
[0739]
000003
(1308)
[0232]
000729 000434
-000068
(-0905)
[0367]
Bear ndash 1 15 13
-000002
(0489)
[0645]
00025
(2150)
[0066]
000908 000601
-000252
(-0876)
[0401]
Sideway ndash 1 14 16
-000051
(-0084)
[0946]
000065
(0859)
[0419]
000406 00049
-000116
(-0711)
[0499]
Bull ndash 1 15 54
-000199
(-0801)
[0445]
-00009
(-1273)
[0186]
000892 000414
-00011
(-0464)
[0617]
Bear ndash 2 17 7
000031
(0439)
[0661]
00009
(0488)
[0631]
001134 000979
-000059
(-0128)
[0876]
Bull ndash 2 5 21
000486
(1624)
[0076]
-000039
(-0601)
[0599]
00063 000474
000525
(1749)
[0071]
Sideway ndash 2 26 19
-000165
(-0969)
[0325]
-000009
(0831)
[0411]
0006 000205
-000156
(-1231)
[0246]
Bull ndash 3 4 16
-000121
(-0949)
[0355]
-000037
(-0063)
[0952]
000184 000294
-000084
(-0713)
[0476]
Bear ndash 3 13 5
-000149
(0415)
[0681]
000214
(1296)
[0124]
000373 000279
-00036
(-1357)
[0185]
Bull ndash 4 7 27
00000032
(0334)
[0729]
000037
(1533)
[0162]
000218 000208
-000037
(-0395)
[0691]
Notes 1 NB and NS denote the number of buy and sell signals during the period respectively microB and
microS denote the average return of buy and sell signals respectively σB and σS denote the
standard deviation of buy and sell signal returns respectively
2 Numbers in parentheses are t values and numbers in square brackets are the bootstrap p
values
Colombo Business Journal 11(1) 2020
38
RSI generates more sell signals than buy signals during the Bull market On the
contrary during the Bear and Sideway market RSI produced higher number of buy
signals than sell signals Since RSI has the upper band of 100 if the stock price goes
up continuously RSI remains in the overbought regime and produce more number
of sell signals than buy signals In this case a trader shorting the opportunity based
on RSI sell signals may not make profit as the price will move to the differentother
orbit On the other hand if the stock price goes down continuously the RSI
generates more number of buy signals than the sell signals as opposed to the current
price movement Hence the application of RSI during the long Bull and Bear
markets may not help the trader to make profit even before adjusting the transaction
cost From the result of t-test and bootstrap p values it can be concluded that buy
and sell signals does not reject the null hypothesis that the mean return of buy or sell
signals is not significantly different from the unconditional mean return Moreover
averages of buy signal returns and sell signal returns are not significantly different
from each other These results provide evidence of the existence of weak form
efficiency across the market cycle Hence it can be concluded that traders cannot
outperform the market using the RSI signals during the upward or downward
movement of the market
Table 5 Performance of RSI Trading Signal
Category
Buy Signal Performance Sell Signal Performance
SR APAL of
PT SR APAL
of
PT
Overall -00892 1007 4397 00069 10669 4888
Bear ndash 1 -00022 1489 4000 04160 14933 6923
Sideway ndash 1 -01256 0529 5714 01327 13950 5000
Bull ndash 1 -02242 0896 4000 -02174 10832 3519
Bear ndash 2 00273 1203 4706 00919 09491 5714
Bull ndash 2 07714 1766 8000 -00823 07273 5238
Sideway ndash 2 -02750 0781 3846 -00439 09970 4737
Bull ndash 3 -06576 0298 2500 -01259 07136 5000
Bear ndash 3 -02601 0742 4000 02294 13570 5938
Bull ndash 4 00014 1338 4286 01779 10837 5926
Note SR denotes the Sharpe Ratio APAL denotes the ratio of average profit to average loss
of PT denotes the percentage of profitable trade to total trading signal
Muruganandan
39
Table 5 exhibits the results of Sharpe Ratio (SR) average profit to average loss
ratio (APAL) and percentage of profitable trade to total trading signals For the
overall study period and almost all sub-samples periods buy signal underperforms
the sell signal as per the modified Sharpe ratio The absolute value of average profit
to average loss more than one indicates that the average of profitable trade is more
than the average of unprofitable trade However percentage of profitable trade less
than 50 indicates that RSI generate a higher number of unprofitable trades than
profitable trade Hence average return on buy signal is negative for the overall
study period and for six out of nine sub-sample periods On the other hand RSI sell
signal generated the positive Sharpe ratio for overall period and five out of nine sub-
sample periods Profitable trade to total trade signal indicates sell signal produced
more profitable trade in all sub-sample period except Bull-1 and Sidway-1 market
Though percentage of profitable trade to total trade for overall period is less than
50 (ie 4888) which indicate that the number of unprofitable trades is higher
than the profitable trades the profit per profitable trade is sufficiently enough to
compensate the loss in unprofitable trade The sell signal trading strategy makes
money not only from correctly predicting the market movement but also minimising
the loss quickly and allows the profit to run
The Table 6 exhibits the statistical results for the MACD trading rules During
the study period MACD generated 1522 sell signals and 858 buy signals with the
average return of 000861 and -000128 respectively The standard deviations of buy
signal returns (00179) and sell signal returns (001068) are also presented along
with mean return difference between buy and sell signals (-00021) Buy signal
produced the average negative return for all the sub-sample periods and they were
also not significantly different from the average unconditional mean return Hence
the null hypothesis was accepted and it can be concluded that buy signal produced a
return similar to that of unconditional intraday return However the sell signal
generated positive average return for the overall period and all sub-sample periods
except Bull-2 period In contrast the sell signal returns were significantly different
for the overall period and five out of nine sub-sample periods
Table 6 Statistical Results for MACD Trading Rule
Category NB NS microB microS σB σS microB -microS
Overall 858 1522
-000128
(-142)
[0170]
0000861
(443)
[0002]
0017908 0010686
-000215
(-3203)
[0008]
Colombo Business Journal 11(1) 2020
40
Category NB NS microB microS σB σS microB -microS
Bear ndash 1 141 59
-000021
(0494)
[0631]
0006379
(317)
[0002]
0023008 0018028
-000659
(-2165)
[0036]
Sideway ndash 1 131 71
-000226
(-1524)
[0142]
0000543
(0623)
[0509]
0013614 001285
-000281
(-1452)
[0162]
Bull ndash 1 85 581
-000004
(0043)
[0962]
0000196
(0703)
[0483]
0023623 0011
-000023
(-0090)
[0908]
Bear ndash 2 109 33
-000350
(-0989)
[0337]
0004699
(231)
[0036]
0026444 0013532
-00082
(-2371)
[002]
Bull ndash 2 39 192
-000031
(-0224)
[0816]
-000085
(-1066)
[0311]
0015615 0013721
0000532
(0198)
[0838]
Sideway ndash 2 166 171
-000035
(0171)
[0852]
000195
(375)
[0002]
0011182 0008263
-00023
(-2141)
[0032]
Bull ndash 3 32 165
-000171
(-0514)
[0591]
0000902
(220)
[0028]
0015215 0006737
-000261
(-0952)
[0291]
Bear ndash 3 88 25
-000146
(-0457)
[0643]
0004442
(341)
[0002]
0009516 0007832
-000591
(-3164)
[0004]
Bull ndash 4 67 225
-000205
(-1306)
[0188]
0000871
(2905)
[0008]
0011064 0005643
-000292
(-2080)
[004]
Notes 1 NB and NS denote the number of buy and sell signals during the period respectively microB
and microS denote the average return of buy and sell signals respectively σB and σS denote the
standard deviation of buy and sell signal returns respectively
2 Numbers in parenthesis are t-values and numbers in square brackets are the bootstrap p
values
3 denotes p lt 05
The risk measured by standard deviation is higher in buy signal than sell signal
trading rules for the entire study period and for all the sub-sample periods This
clearly indicates that the trading on buy signal is riskier than the sell signal
Moreover the sell signal average returns were significantly different from the
Muruganandan
41
average buy signal returns in all the Bear market periods and for the overall study
period This result supports the sell signal over buy signal specifically during the
Bear market phases This result sharply contradicts to Tharavanij et al (2015) who
found buy signals outperform the sell signals in Southeast Asian markets
Sharpe ratio average profit to average loss ratio and percentage of profitable
trade to total trade signal for MACD trading rule are presented in Table 7 For the
buy signals percentage of profitable trade to total trade has more than 50 in four
out of nine sub-sample periods but average profit to average loss is less than one
which implies that the profit from correctly predicting market direction is not
sufficient enough to cut down the loss from the failure to predict market direction
Hence Sharpe ratios for all sub-sample periods and the entire study period were
negative However the sell signals correctly predict the market with highest
percentage of profitable trade to total trade of 80 in Bear-3 period Moreover
with less ability to predict market direction in Sideway-1 (4789) and Bull-1
(4905) periods sell signal generated profit to cut down the loss from unprofitable
trade which results in average profit to average loss ratio of more than one for
Sideway-1 (122) and Bull-1 (109) period Overall the result supports the sell
signals over buy signals before considering the transaction costs in the Indian
context
Table 7 Performance of MACD Trading Signal
Category
Buy Signal Performance Sell Signal Performance
SR APAL of
PT SR APAL
of
PT
Overall -0072 0897 47669 008 106 5414
Bear ndash 1 -0009 1110 46809 035 219 5763
Sideway ndash 1 -0166 0701 47328 004 122 4789
Bull ndash 1 -0002 0805 55294 002 109 4905
Bear ndash 2 -0133 0940 43119 035 115 6667
Bull ndash 2 -0020 0734 56410 -006 084 5000
Sideway ndash 2 -0031 1122 45181 024 108 6374
Bull ndash 3 -0112 0563 56250 013 100 5879
Bear ndash 3 -0154 0682 50000 057 108 8000
Bull ndash 4 -0185 0827 41791 015 116 5644
Note SR denotes the Sharpe Ratio APAL denotes the ratio of average profit to average loss
of PT denotes the percentage of profitable trade to total trading signal
Colombo Business Journal 11(1) 2020
42
Conclusion
This paper examines the profitability of RSI and MACD technical trading rules
in the Indian market across market cycles BSE Sensex data for the period from
February 2000 to May 2018 were collected from BSE data base and classified into
nine non-overlapping periods as Bull and Bear markets based on the index
movement The t-tests were applied to test the hypothesis that returns from technical
trading rules were not significantly different from the unconditional daily returns In
addition Sharpe ratio average profit to average loss ratio and percentage of
profitable trade to total trade signal were also employed to have a microscopic view
on technical trading rules
Results support the weak-form efficient theory as RSI failed to deliver the
positive returns even before deducting the transaction costs RSI buy and sell signal
returns were not significantly different from the unconditional intraday return In
terms of market timing RSI wrongly predict the market movement and delivered
the percentage of profitable trade to total trade less than 50 Moreover profitable
trades were insufficient to overcome the loss from unprofitable trade Hence buy
signal generated a negative average return and sell signal posted a low positive
average return before deducting transaction costs Therefore after deducting
transaction costs RSI may not leave any profit in the hands of traders
MACD sell signal produced significant positive returns compared to buy signal
and unconditional intraday return However as per Sharpe ratio MACD sell signal
failed to produce the return in line with risk taken Sharpe ratio of less than one
indicates that risk associated with the technical trading rule is more than the return
generated by RSI and MACD In addition even profitable MACD sell signal does
not help in market timing It makes money from higher average profit from
profitable trade than average loss from unprofitable trade However MACD does
not help to reduce the unprofitable trade Hence the study concludes that the trader
cannot earn abnormal return consistently with the help of RSI and MACD across
market cycle in the Indian context RSI and MACD are very old and yet still widely
used as technical tools in real time stock price prediction On the other hand latest
development in information technology and changes in legal systems may have
helped the market to absorb RSI and MACD signals in current price with no time
and cost However in order to empirically validate this assumption a future study
may be extended using a proxy for information technology development and its
impact on trading rules across industries and individual stocks in emerging markets
Muruganandan
43
Declaration of Conflict of Interest
The author declared no potential conflict of interest with respect to the research
authorship and publication of this article
Acknowledgement
I would like to thank anonymous reviewers for their valuable suggestions
References
Allen F amp Karjalainen R (1999) Using genetic algorithms to find technical
trading rules Journal of Financial Economics 51(2) 245ndash271
httpsdoiorg101016S0304-405X(98)00052-X
Almujamed H I Fifield S amp Power D (2013) An investigation of the role of
technical analysis in Kuwait Qualitative Research in Financial Markets 5(1)
43ndash64 httpsdoiorg10110817554171311308959
Anghel G D I (2015) Stock market efficiency and the MACD Evidence from
countries around the world Procedia Economics and Finance 32 1414ndash1431
httpsdoiorg101016S2212-5671(15)01518-X
Atanasova C V amp Hudson R S (2010) Technical trading rules and calendar
anomalies mdash Are they the same phenomena Economics Letters 106(2) 128ndash
130 httpsdoiorg101016jeconlet200911001
Balsara N J Chen G amp Zheng L (2007) The Chinese stock market An
examination of the random walk model and technical trading rules Quarterly
Journal of Business amp Economics 46(2) 43ndash63 httpswwwjstororgstable
40473435
Balsara N Chen J amp Zheng L (2009) Profiting from a contrarian application of
technical trading rules in the US stock market Journal of Asset Management
10(2) 97ndash123 httpsdoiorg101057jam200844
Brock W Lakonishok J amp LeBaron B (1992) Simple technical trading rules
and stochastic properties of stock returns The Journal of Finance 47(5) 1731ndash
1764 httpsdoiorg101111j1540-62611992tb04681x
Chang E J Lima E J A amp Tabak B M (2004) Testing for predictability in
emerging equity markets Emerging Markets Review 5(3) 295ndash316
httpsdoi101016jememar200403005
Chiang Y-C Ke M-C Liao T L amp Wang C D (2012) Are technical trading
strategies still profitable - Evidence from the Taiwan Stock Index Futures
Market Applied Financial Economics 22(12) 955ndash965 httpsdoiorg
101080096031072011631893
Chong T T-L amp Ng W-K (2008) Technical analysis and the London stock
exchange Testing the MACD and RSI rules using the FT30 Applied
Colombo Business Journal 11(1) 2020
44
Economics Letters 15(14) 1111ndash1114 httpsdoiorg10108013504850600
993598
Cohen G amp Cabiri E (2015) Can technical oscillators outperform the buy and
hold strategy Applied Economics 47(30) 3189ndash3197 httpsdoiorg101080
0003684620151013609
Efron B (1979) Bootstrap methods Another look at the Jackknife The Annals of
Statistics 7(1)1ndash26 httpsprojecteuclidorgeuclidaos 1176344552
Fama (1970) Efficient capital markets a review of theory and empirical work
Journal of Finance 25(2) 383-417 httpswwwjstororgstable2325486
Gencay R (1998) The predictability of security returns with simple technical
trading rules Journal of Empirical Finance 5(4) 347ndash359 httpsdoiorg
101016S0927-5398(97)00022-4
Gunasekarage A amp Power D M (2001) The profitability of moving average
trading rules in South Asian stock markets Emerging Markets Review 2(1)
17ndash33 httpsdoiorg101016S1566-0141(00)00017-0
Henderson C (2002) Currency strategy The practitionerrsquos guide to currency
investing hedging and forecasting John Willy amp Sons
Heng P amp Niblock S J (2014) Trading with tigers A technical analysis of
Southeast Asian stock index futures International Economic Journal 28(4)
679ndash692 httpsdoiorg101080101687372014928895
Hudson R Dempsey M amp Keasey K (1996) A note on weak form efficiency of
capital markets The application of simple technical trading rules to UK stock
prices- 1935-1994 Journal of Banking and Finance 20(6) 1121ndash1132
httpsdoiorg1010160378-4266(95)00043-7
Jensen M C amp Benington G A (1970) Random walk and technical theories
Some additional evidence Journal of Finance 25 469ndash482
httpswwwjstororgstable2325495
Krausz J Lee S-Y amp Nam K (2009) Profitability of nonlinear dynamics
under technical trading rules Evidence from Pacific basin stock markets
Emerging Markets Finance amp Trade 45(4) 13ndash35 httpsdoiorg102753
REE1540-496X450402
Khatua A (2016) An application of moving average convergence and divergence
(MACD) indicator on selected stocks listed on National Stock Exchange (NSE)
httpdxdoiorg102139ssrn2872665
Kulkarni A D amp More A (2014) An application of moving average convergence
divergence (MACD) indicator on selected stocks listed on Bombay Stock
Exchange (BSE) Oriental Journal of Computer Science and Technology 7(3)
396ndash400 httpwwwcomputerscijournalorgp=1500
Lokeshwarri S K (2017 April 07) The big story ndash Sit back go passive The Hindu
Business Line (Coimbatore Edition) p 2
Muruganandan
45
Marshall B R Cahan R H amp Cahan J M (2008) Does intraday technical
analysis in the US equity market have value Journal of Empirical Finance
15(2) 199ndash210 httpsdoiorg101016jjempfin200605003
Marshall B R Young M R amp Cahan R (2008) Are candlestick technical
trading strategies profitable in the Japanese equity market Review of
Quantitative Finance and Accounting 31(2) 191ndash207 httpsdoiorg101007
s11156-007-0068-1
Metghalchi M Chen C-P Hajilee M (2016) Moving average trading rules for
NASDAQ composite index Applied Finance Letters 5(2) 45ndash57
httpsdoiorg1024135aflv5i254
Metghalchi M amp Hayes L A Niroomand F (2019) A technical approach to
equity investing in emerging markets Review of Financial Economics 37(3)
389ndash403 httpsdoiorg101002rfe1041
McKenzie M D (2007) Technical trading rules in emerging market and the 1997
Asian currency crises Emerging Market Finance and Trade 43(4) 46ndash73
httpsdoiorg102753REE1540-496X430403
Ming-Ming L Balachandher K G amp Nor F M (2002) An examination of the
random walk model and technical trading rules in the Malaysian stock market
Quarterly Journal of Business amp Economics 41(1) 81ndash104
httpswwwjstororgstable40473346
Ming-Ming L amp Siok-Hwa L (2006) The profitability of the simple moving
averages and trading range breakout in the Asian stock markets Journal of
Asian Economics 17(1) 144ndash170 httpsdoiorg101016jasieco200512001
Mitra S K (2011) How rewarding is technical analysis in Indian stock market
Quantitative Finance 11(2) 287ndash297 httpsdoiorg101080
14697680903493581
Nazario R T F Silva J L amp Sobrero V A (2017) A literature review of
technical analysis on stock markets The Quarterly Review of Economics and
Finance 66 115ndash126 httpsdoiorg101016jqref201701014
Neftccedili S N (1991) Naiumlve trading rules in financial markets and Wiener-
Kolmogorov prediction theory A study of ldquotechnical analysisrdquo Journal of
Business 64(4) 549ndash571
Ni Y Day M-Y Huang P ampYu S-R (2020) The profitability of Bollinger
Bamps Evidence from the constituent stocks of Taiwan 50 Physica A Statistical
Mechanics and Its Applications Advance online publication httpsdoiorg
101016jphysa2020124144
Nor S M amp Wickremasinghe G (2014) The profitability of MACD and RSI
trading rules in the Australian stock market Investment Management and
Financial Innovation 11(4) 194ndash199
Colombo Business Journal 11(1) 2020
46
Rosillo R de La Fuente D amp Brugos J A L (2013) Technical analysis and the
Spanish stock market Testing the RSI and MACD momentum and stochastic
rule using Spanish market companies Applied Economics 45(12) 1541ndash1550
httpsdoiorg101080000368462011631894
Sehgal S amp Garhyan A (2002) Abnormal returns using technical returns The
Indian experience Finance India 16(1) 181ndash203
Sehgal S amp Gupta M (2007) Tests of technical analysis in India Vision The
Journal of Business Perspective 11(3) 11ndash23 httpsdoiorg101177
097226290701100303
Sobreiro V A da Costa T R C C Nazaacuterio R T F e Silva J L Moreira E
A Filho M C L Kimura H amp Zambrano J C A (2016) The profitability
of moving average trading rules in BRICS and emerging stock markets North
American Journal of Economics and Finance 38 86ndash101 httpsdoiorg
101016jnajef201608003
Tian G G Wan G H amp Guo M (2002) Market efficiency and the returns to
simple technical trading rules New evidence from US equity market and
Chinese equity markets Asia-Pacific Financial Markets 9(3) 241ndash258
httpsdoiorg101023A1024181515265
Tharavanij P Siraprapasiri V amp Rajchamaha K (2015) Performance of
technical trading rules Evidence from Southeast Asian Stock Market
Springerplus 4552 httpsdoiorg101186s40064-015-1334-7
Wang J-L amp Chan S-H (2007) Stock market trading rule discovery using
pattern recognition and technical analysis Expert Systems with Applications
33(2) 304ndash315 httpsdoiorg101016jeswa200605002
Welles J Jr (1978) New concepts in technical trading systems Hunter Publishing
Company
Wong W-K Manzur M amp Chew B-K (2003) How rewarding is technical
analysis Evidence from Singapore stock market Journal of Applied Financial
Economics 13(7) 543ndash551 httpsdoiorg1010800960310022000020906
Yu H Nartea G V Gan C amp Yao L J (2013) Predictive ability and
profitability of simple technical trading rules Recent evidence from Southeast
Asian stock markets International Review of Economics and Finance 25 356ndash
371 httpsdoiorg101016jiref201207016
Zhu H Jiang Z-Q Li S-P amp Zhou W-X (2015) Profitability of simple
technical trading rules of Chinese stock exchange indexes Physica A
Statistical Mechanics and Its Applications 439 75ndash84 httpsdoiorg101016
jphysa201507032
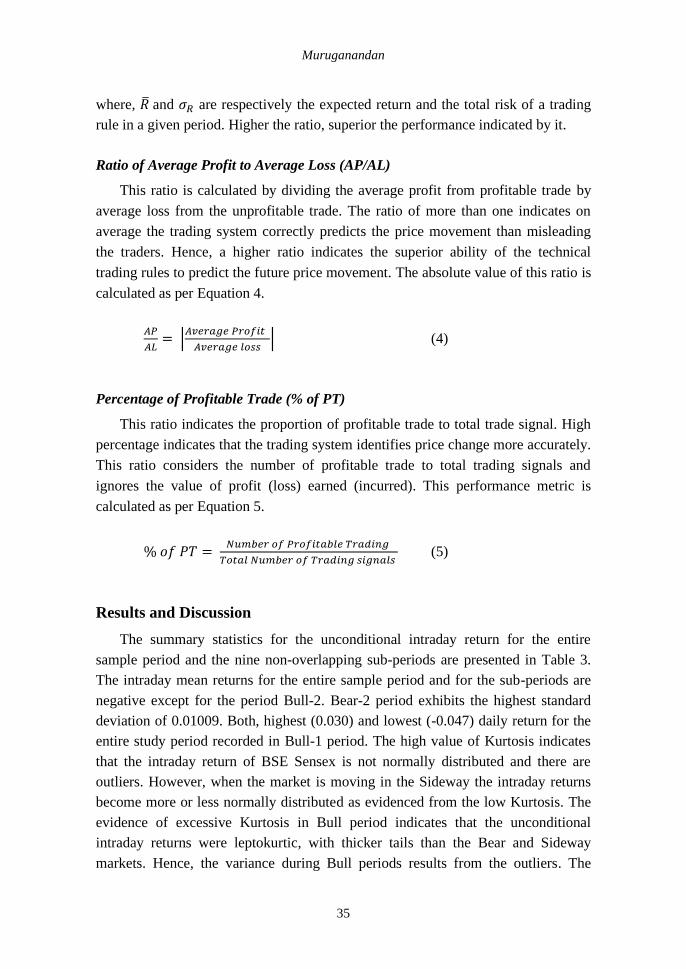
Muruganandan
35
where and 120590119877 are respectively the expected return and the total risk of a trading
rule in a given period Higher the ratio superior the performance indicated by it
Ratio of Average Profit to Average Loss (APAL)
This ratio is calculated by dividing the average profit from profitable trade by
average loss from the unprofitable trade The ratio of more than one indicates on
average the trading system correctly predicts the price movement than misleading
the traders Hence a higher ratio indicates the superior ability of the technical
trading rules to predict the future price movement The absolute value of this ratio is
calculated as per Equation 4
119860119875
119860119871= |
119860119907119890119903119886119892119890 119875119903119900119891119894119905
119860119907119890119903119886119892119890 119897119900119904119904| (4)
Percentage of Profitable Trade ( of PT)
This ratio indicates the proportion of profitable trade to total trade signal High
percentage indicates that the trading system identifies price change more accurately
This ratio considers the number of profitable trade to total trading signals and
ignores the value of profit (loss) earned (incurred) This performance metric is
calculated as per Equation 5
119900119891 119875119879 = 119873119906119898119887119890119903 119900119891 119875119903119900119891119894119905119886119887119897119890 119879119903119886119889119894119899119892
119879119900119905119886119897 119873119906119898119887119890119903 119900119891 119879119903119886119889119894119899119892 119904119894119892119899119886119897119904 (5)
Results and Discussion
The summary statistics for the unconditional intraday return for the entire
sample period and the nine non-overlapping sub-periods are presented in Table 3
The intraday mean returns for the entire sample period and for the sub-periods are
negative except for the period Bull-2 Bear-2 period exhibits the highest standard
deviation of 001009 Both highest (0030) and lowest (-0047) daily return for the
entire study period recorded in Bull-1 period The high value of Kurtosis indicates
that the intraday return of BSE Sensex is not normally distributed and there are
outliers However when the market is moving in the Sideway the intraday returns
become more or less normally distributed as evidenced from the low Kurtosis The
evidence of excessive Kurtosis in Bull period indicates that the unconditional
intraday returns were leptokurtic with thicker tails than the Bear and Sideway
markets Hence the variance during Bull periods results from the outliers The
Colombo Business Journal 11(1) 2020
36
negative skewness indicates that the unconditional daily returns were moderately
negatively skewed except for Sideway-1
Table 3 Descriptive Statistics for Unconditional Intraday Return
Cycle Mean Standard
deviation Kurtosis Skew Min Max Count
Overall -000041 000576 48482 -0531 -0047 0030 4545
Bear ndash 1 -000119 000855 12148 -0286 -0035 0026 437
Sideway ndash 1 -000042 000451 06693 0028 -0018 0015 411
Bull ndash 1 -000015 000605 5415 -0785 -0047 0030 1165
Bear ndash 2 -000093 001009 09469 -0359 -0038 0024 280
Bull ndash 2 000025 000583 22848 0049 -0028 0025 411
Sideway ndash 2 -000049 000423 0568 -0217 -0016 0011 679
Bull ndash 3 -000032 000349 22438 -0127 -0018 0012 381
Bear ndash 3 -000098 000406 09085 -0630 -0016 0009 225
Bull ndash 4 -000028 000279 3073 0332 -0009 0016 556
Note Unconditional intraday return defined as the log difference of closing value to opening value by
assuming that the trader buys at the opening value and sells at the closing value
The result of RSI trading rule for BSE Sensex is presented in Table 4 The first
two columns exhibit the number of buy (119873119861) and sell (119873119878) signals generated using
RSI trading rules for the overall period and non-overlapping sub-sample periods
Third and fourth column show the average buy (120583119861) and sell (120583119878) returns along
with t-test in parenthesis The basic assumption of t-test is that the observations are
normally distributed However Table 1 reveals that the returns were not normally
distributed which may question the validity of t-test results and its interpretations In
order to overcome this phenomenon Brock et al (1992) suggested the bootstrap
method developed by Efron (1979) Hence this paper employs the bootstrap
method adopted by McKenzie (2007) which mimics the procedure followed by
Brock et al (1992) Bootstrap process was repeated for 500 times and the resultant t
values and corresponding p values are reported in parentheses and square brackets
respectively However the acceptance and rejection of hypothesis were similar both
in bootstrap p values and t-test In addition standard deviation of buy and sell
signals and the mean difference between buy and sell signals are also presented in
the column five six and seven respectively
Muruganandan
37
Table 4 Statistical Results for RSI Trading Rule
Category NB NS microB microS σB σS microB - microS
Overall 116 178
-000065
(-0352)
[0739]
000003
(1308)
[0232]
000729 000434
-000068
(-0905)
[0367]
Bear ndash 1 15 13
-000002
(0489)
[0645]
00025
(2150)
[0066]
000908 000601
-000252
(-0876)
[0401]
Sideway ndash 1 14 16
-000051
(-0084)
[0946]
000065
(0859)
[0419]
000406 00049
-000116
(-0711)
[0499]
Bull ndash 1 15 54
-000199
(-0801)
[0445]
-00009
(-1273)
[0186]
000892 000414
-00011
(-0464)
[0617]
Bear ndash 2 17 7
000031
(0439)
[0661]
00009
(0488)
[0631]
001134 000979
-000059
(-0128)
[0876]
Bull ndash 2 5 21
000486
(1624)
[0076]
-000039
(-0601)
[0599]
00063 000474
000525
(1749)
[0071]
Sideway ndash 2 26 19
-000165
(-0969)
[0325]
-000009
(0831)
[0411]
0006 000205
-000156
(-1231)
[0246]
Bull ndash 3 4 16
-000121
(-0949)
[0355]
-000037
(-0063)
[0952]
000184 000294
-000084
(-0713)
[0476]
Bear ndash 3 13 5
-000149
(0415)
[0681]
000214
(1296)
[0124]
000373 000279
-00036
(-1357)
[0185]
Bull ndash 4 7 27
00000032
(0334)
[0729]
000037
(1533)
[0162]
000218 000208
-000037
(-0395)
[0691]
Notes 1 NB and NS denote the number of buy and sell signals during the period respectively microB and
microS denote the average return of buy and sell signals respectively σB and σS denote the
standard deviation of buy and sell signal returns respectively
2 Numbers in parentheses are t values and numbers in square brackets are the bootstrap p
values
Colombo Business Journal 11(1) 2020
38
RSI generates more sell signals than buy signals during the Bull market On the
contrary during the Bear and Sideway market RSI produced higher number of buy
signals than sell signals Since RSI has the upper band of 100 if the stock price goes
up continuously RSI remains in the overbought regime and produce more number
of sell signals than buy signals In this case a trader shorting the opportunity based
on RSI sell signals may not make profit as the price will move to the differentother
orbit On the other hand if the stock price goes down continuously the RSI
generates more number of buy signals than the sell signals as opposed to the current
price movement Hence the application of RSI during the long Bull and Bear
markets may not help the trader to make profit even before adjusting the transaction
cost From the result of t-test and bootstrap p values it can be concluded that buy
and sell signals does not reject the null hypothesis that the mean return of buy or sell
signals is not significantly different from the unconditional mean return Moreover
averages of buy signal returns and sell signal returns are not significantly different
from each other These results provide evidence of the existence of weak form
efficiency across the market cycle Hence it can be concluded that traders cannot
outperform the market using the RSI signals during the upward or downward
movement of the market
Table 5 Performance of RSI Trading Signal
Category
Buy Signal Performance Sell Signal Performance
SR APAL of
PT SR APAL
of
PT
Overall -00892 1007 4397 00069 10669 4888
Bear ndash 1 -00022 1489 4000 04160 14933 6923
Sideway ndash 1 -01256 0529 5714 01327 13950 5000
Bull ndash 1 -02242 0896 4000 -02174 10832 3519
Bear ndash 2 00273 1203 4706 00919 09491 5714
Bull ndash 2 07714 1766 8000 -00823 07273 5238
Sideway ndash 2 -02750 0781 3846 -00439 09970 4737
Bull ndash 3 -06576 0298 2500 -01259 07136 5000
Bear ndash 3 -02601 0742 4000 02294 13570 5938
Bull ndash 4 00014 1338 4286 01779 10837 5926
Note SR denotes the Sharpe Ratio APAL denotes the ratio of average profit to average loss
of PT denotes the percentage of profitable trade to total trading signal
Muruganandan
39
Table 5 exhibits the results of Sharpe Ratio (SR) average profit to average loss
ratio (APAL) and percentage of profitable trade to total trading signals For the
overall study period and almost all sub-samples periods buy signal underperforms
the sell signal as per the modified Sharpe ratio The absolute value of average profit
to average loss more than one indicates that the average of profitable trade is more
than the average of unprofitable trade However percentage of profitable trade less
than 50 indicates that RSI generate a higher number of unprofitable trades than
profitable trade Hence average return on buy signal is negative for the overall
study period and for six out of nine sub-sample periods On the other hand RSI sell
signal generated the positive Sharpe ratio for overall period and five out of nine sub-
sample periods Profitable trade to total trade signal indicates sell signal produced
more profitable trade in all sub-sample period except Bull-1 and Sidway-1 market
Though percentage of profitable trade to total trade for overall period is less than
50 (ie 4888) which indicate that the number of unprofitable trades is higher
than the profitable trades the profit per profitable trade is sufficiently enough to
compensate the loss in unprofitable trade The sell signal trading strategy makes
money not only from correctly predicting the market movement but also minimising
the loss quickly and allows the profit to run
The Table 6 exhibits the statistical results for the MACD trading rules During
the study period MACD generated 1522 sell signals and 858 buy signals with the
average return of 000861 and -000128 respectively The standard deviations of buy
signal returns (00179) and sell signal returns (001068) are also presented along
with mean return difference between buy and sell signals (-00021) Buy signal
produced the average negative return for all the sub-sample periods and they were
also not significantly different from the average unconditional mean return Hence
the null hypothesis was accepted and it can be concluded that buy signal produced a
return similar to that of unconditional intraday return However the sell signal
generated positive average return for the overall period and all sub-sample periods
except Bull-2 period In contrast the sell signal returns were significantly different
for the overall period and five out of nine sub-sample periods
Table 6 Statistical Results for MACD Trading Rule
Category NB NS microB microS σB σS microB -microS
Overall 858 1522
-000128
(-142)
[0170]
0000861
(443)
[0002]
0017908 0010686
-000215
(-3203)
[0008]
Colombo Business Journal 11(1) 2020
40
Category NB NS microB microS σB σS microB -microS
Bear ndash 1 141 59
-000021
(0494)
[0631]
0006379
(317)
[0002]
0023008 0018028
-000659
(-2165)
[0036]
Sideway ndash 1 131 71
-000226
(-1524)
[0142]
0000543
(0623)
[0509]
0013614 001285
-000281
(-1452)
[0162]
Bull ndash 1 85 581
-000004
(0043)
[0962]
0000196
(0703)
[0483]
0023623 0011
-000023
(-0090)
[0908]
Bear ndash 2 109 33
-000350
(-0989)
[0337]
0004699
(231)
[0036]
0026444 0013532
-00082
(-2371)
[002]
Bull ndash 2 39 192
-000031
(-0224)
[0816]
-000085
(-1066)
[0311]
0015615 0013721
0000532
(0198)
[0838]
Sideway ndash 2 166 171
-000035
(0171)
[0852]
000195
(375)
[0002]
0011182 0008263
-00023
(-2141)
[0032]
Bull ndash 3 32 165
-000171
(-0514)
[0591]
0000902
(220)
[0028]
0015215 0006737
-000261
(-0952)
[0291]
Bear ndash 3 88 25
-000146
(-0457)
[0643]
0004442
(341)
[0002]
0009516 0007832
-000591
(-3164)
[0004]
Bull ndash 4 67 225
-000205
(-1306)
[0188]
0000871
(2905)
[0008]
0011064 0005643
-000292
(-2080)
[004]
Notes 1 NB and NS denote the number of buy and sell signals during the period respectively microB
and microS denote the average return of buy and sell signals respectively σB and σS denote the
standard deviation of buy and sell signal returns respectively
2 Numbers in parenthesis are t-values and numbers in square brackets are the bootstrap p
values
3 denotes p lt 05
The risk measured by standard deviation is higher in buy signal than sell signal
trading rules for the entire study period and for all the sub-sample periods This
clearly indicates that the trading on buy signal is riskier than the sell signal
Moreover the sell signal average returns were significantly different from the
Muruganandan
41
average buy signal returns in all the Bear market periods and for the overall study
period This result supports the sell signal over buy signal specifically during the
Bear market phases This result sharply contradicts to Tharavanij et al (2015) who
found buy signals outperform the sell signals in Southeast Asian markets
Sharpe ratio average profit to average loss ratio and percentage of profitable
trade to total trade signal for MACD trading rule are presented in Table 7 For the
buy signals percentage of profitable trade to total trade has more than 50 in four
out of nine sub-sample periods but average profit to average loss is less than one
which implies that the profit from correctly predicting market direction is not
sufficient enough to cut down the loss from the failure to predict market direction
Hence Sharpe ratios for all sub-sample periods and the entire study period were
negative However the sell signals correctly predict the market with highest
percentage of profitable trade to total trade of 80 in Bear-3 period Moreover
with less ability to predict market direction in Sideway-1 (4789) and Bull-1
(4905) periods sell signal generated profit to cut down the loss from unprofitable
trade which results in average profit to average loss ratio of more than one for
Sideway-1 (122) and Bull-1 (109) period Overall the result supports the sell
signals over buy signals before considering the transaction costs in the Indian
context
Table 7 Performance of MACD Trading Signal
Category
Buy Signal Performance Sell Signal Performance
SR APAL of
PT SR APAL
of
PT
Overall -0072 0897 47669 008 106 5414
Bear ndash 1 -0009 1110 46809 035 219 5763
Sideway ndash 1 -0166 0701 47328 004 122 4789
Bull ndash 1 -0002 0805 55294 002 109 4905
Bear ndash 2 -0133 0940 43119 035 115 6667
Bull ndash 2 -0020 0734 56410 -006 084 5000
Sideway ndash 2 -0031 1122 45181 024 108 6374
Bull ndash 3 -0112 0563 56250 013 100 5879
Bear ndash 3 -0154 0682 50000 057 108 8000
Bull ndash 4 -0185 0827 41791 015 116 5644
Note SR denotes the Sharpe Ratio APAL denotes the ratio of average profit to average loss
of PT denotes the percentage of profitable trade to total trading signal
Colombo Business Journal 11(1) 2020
42
Conclusion
This paper examines the profitability of RSI and MACD technical trading rules
in the Indian market across market cycles BSE Sensex data for the period from
February 2000 to May 2018 were collected from BSE data base and classified into
nine non-overlapping periods as Bull and Bear markets based on the index
movement The t-tests were applied to test the hypothesis that returns from technical
trading rules were not significantly different from the unconditional daily returns In
addition Sharpe ratio average profit to average loss ratio and percentage of
profitable trade to total trade signal were also employed to have a microscopic view
on technical trading rules
Results support the weak-form efficient theory as RSI failed to deliver the
positive returns even before deducting the transaction costs RSI buy and sell signal
returns were not significantly different from the unconditional intraday return In
terms of market timing RSI wrongly predict the market movement and delivered
the percentage of profitable trade to total trade less than 50 Moreover profitable
trades were insufficient to overcome the loss from unprofitable trade Hence buy
signal generated a negative average return and sell signal posted a low positive
average return before deducting transaction costs Therefore after deducting
transaction costs RSI may not leave any profit in the hands of traders
MACD sell signal produced significant positive returns compared to buy signal
and unconditional intraday return However as per Sharpe ratio MACD sell signal
failed to produce the return in line with risk taken Sharpe ratio of less than one
indicates that risk associated with the technical trading rule is more than the return
generated by RSI and MACD In addition even profitable MACD sell signal does
not help in market timing It makes money from higher average profit from
profitable trade than average loss from unprofitable trade However MACD does
not help to reduce the unprofitable trade Hence the study concludes that the trader
cannot earn abnormal return consistently with the help of RSI and MACD across
market cycle in the Indian context RSI and MACD are very old and yet still widely
used as technical tools in real time stock price prediction On the other hand latest
development in information technology and changes in legal systems may have
helped the market to absorb RSI and MACD signals in current price with no time
and cost However in order to empirically validate this assumption a future study
may be extended using a proxy for information technology development and its
impact on trading rules across industries and individual stocks in emerging markets
Muruganandan
43
Declaration of Conflict of Interest
The author declared no potential conflict of interest with respect to the research
authorship and publication of this article
Acknowledgement
I would like to thank anonymous reviewers for their valuable suggestions
References
Allen F amp Karjalainen R (1999) Using genetic algorithms to find technical
trading rules Journal of Financial Economics 51(2) 245ndash271
httpsdoiorg101016S0304-405X(98)00052-X
Almujamed H I Fifield S amp Power D (2013) An investigation of the role of
technical analysis in Kuwait Qualitative Research in Financial Markets 5(1)
43ndash64 httpsdoiorg10110817554171311308959
Anghel G D I (2015) Stock market efficiency and the MACD Evidence from
countries around the world Procedia Economics and Finance 32 1414ndash1431
httpsdoiorg101016S2212-5671(15)01518-X
Atanasova C V amp Hudson R S (2010) Technical trading rules and calendar
anomalies mdash Are they the same phenomena Economics Letters 106(2) 128ndash
130 httpsdoiorg101016jeconlet200911001
Balsara N J Chen G amp Zheng L (2007) The Chinese stock market An
examination of the random walk model and technical trading rules Quarterly
Journal of Business amp Economics 46(2) 43ndash63 httpswwwjstororgstable
40473435
Balsara N Chen J amp Zheng L (2009) Profiting from a contrarian application of
technical trading rules in the US stock market Journal of Asset Management
10(2) 97ndash123 httpsdoiorg101057jam200844
Brock W Lakonishok J amp LeBaron B (1992) Simple technical trading rules
and stochastic properties of stock returns The Journal of Finance 47(5) 1731ndash
1764 httpsdoiorg101111j1540-62611992tb04681x
Chang E J Lima E J A amp Tabak B M (2004) Testing for predictability in
emerging equity markets Emerging Markets Review 5(3) 295ndash316
httpsdoi101016jememar200403005
Chiang Y-C Ke M-C Liao T L amp Wang C D (2012) Are technical trading
strategies still profitable - Evidence from the Taiwan Stock Index Futures
Market Applied Financial Economics 22(12) 955ndash965 httpsdoiorg
101080096031072011631893
Chong T T-L amp Ng W-K (2008) Technical analysis and the London stock
exchange Testing the MACD and RSI rules using the FT30 Applied
Colombo Business Journal 11(1) 2020
44
Economics Letters 15(14) 1111ndash1114 httpsdoiorg10108013504850600
993598
Cohen G amp Cabiri E (2015) Can technical oscillators outperform the buy and
hold strategy Applied Economics 47(30) 3189ndash3197 httpsdoiorg101080
0003684620151013609
Efron B (1979) Bootstrap methods Another look at the Jackknife The Annals of
Statistics 7(1)1ndash26 httpsprojecteuclidorgeuclidaos 1176344552
Fama (1970) Efficient capital markets a review of theory and empirical work
Journal of Finance 25(2) 383-417 httpswwwjstororgstable2325486
Gencay R (1998) The predictability of security returns with simple technical
trading rules Journal of Empirical Finance 5(4) 347ndash359 httpsdoiorg
101016S0927-5398(97)00022-4
Gunasekarage A amp Power D M (2001) The profitability of moving average
trading rules in South Asian stock markets Emerging Markets Review 2(1)
17ndash33 httpsdoiorg101016S1566-0141(00)00017-0
Henderson C (2002) Currency strategy The practitionerrsquos guide to currency
investing hedging and forecasting John Willy amp Sons
Heng P amp Niblock S J (2014) Trading with tigers A technical analysis of
Southeast Asian stock index futures International Economic Journal 28(4)
679ndash692 httpsdoiorg101080101687372014928895
Hudson R Dempsey M amp Keasey K (1996) A note on weak form efficiency of
capital markets The application of simple technical trading rules to UK stock
prices- 1935-1994 Journal of Banking and Finance 20(6) 1121ndash1132
httpsdoiorg1010160378-4266(95)00043-7
Jensen M C amp Benington G A (1970) Random walk and technical theories
Some additional evidence Journal of Finance 25 469ndash482
httpswwwjstororgstable2325495
Krausz J Lee S-Y amp Nam K (2009) Profitability of nonlinear dynamics
under technical trading rules Evidence from Pacific basin stock markets
Emerging Markets Finance amp Trade 45(4) 13ndash35 httpsdoiorg102753
REE1540-496X450402
Khatua A (2016) An application of moving average convergence and divergence
(MACD) indicator on selected stocks listed on National Stock Exchange (NSE)
httpdxdoiorg102139ssrn2872665
Kulkarni A D amp More A (2014) An application of moving average convergence
divergence (MACD) indicator on selected stocks listed on Bombay Stock
Exchange (BSE) Oriental Journal of Computer Science and Technology 7(3)
396ndash400 httpwwwcomputerscijournalorgp=1500
Lokeshwarri S K (2017 April 07) The big story ndash Sit back go passive The Hindu
Business Line (Coimbatore Edition) p 2
Muruganandan
45
Marshall B R Cahan R H amp Cahan J M (2008) Does intraday technical
analysis in the US equity market have value Journal of Empirical Finance
15(2) 199ndash210 httpsdoiorg101016jjempfin200605003
Marshall B R Young M R amp Cahan R (2008) Are candlestick technical
trading strategies profitable in the Japanese equity market Review of
Quantitative Finance and Accounting 31(2) 191ndash207 httpsdoiorg101007
s11156-007-0068-1
Metghalchi M Chen C-P Hajilee M (2016) Moving average trading rules for
NASDAQ composite index Applied Finance Letters 5(2) 45ndash57
httpsdoiorg1024135aflv5i254
Metghalchi M amp Hayes L A Niroomand F (2019) A technical approach to
equity investing in emerging markets Review of Financial Economics 37(3)
389ndash403 httpsdoiorg101002rfe1041
McKenzie M D (2007) Technical trading rules in emerging market and the 1997
Asian currency crises Emerging Market Finance and Trade 43(4) 46ndash73
httpsdoiorg102753REE1540-496X430403
Ming-Ming L Balachandher K G amp Nor F M (2002) An examination of the
random walk model and technical trading rules in the Malaysian stock market
Quarterly Journal of Business amp Economics 41(1) 81ndash104
httpswwwjstororgstable40473346
Ming-Ming L amp Siok-Hwa L (2006) The profitability of the simple moving
averages and trading range breakout in the Asian stock markets Journal of
Asian Economics 17(1) 144ndash170 httpsdoiorg101016jasieco200512001
Mitra S K (2011) How rewarding is technical analysis in Indian stock market
Quantitative Finance 11(2) 287ndash297 httpsdoiorg101080
14697680903493581
Nazario R T F Silva J L amp Sobrero V A (2017) A literature review of
technical analysis on stock markets The Quarterly Review of Economics and
Finance 66 115ndash126 httpsdoiorg101016jqref201701014
Neftccedili S N (1991) Naiumlve trading rules in financial markets and Wiener-
Kolmogorov prediction theory A study of ldquotechnical analysisrdquo Journal of
Business 64(4) 549ndash571
Ni Y Day M-Y Huang P ampYu S-R (2020) The profitability of Bollinger
Bamps Evidence from the constituent stocks of Taiwan 50 Physica A Statistical
Mechanics and Its Applications Advance online publication httpsdoiorg
101016jphysa2020124144
Nor S M amp Wickremasinghe G (2014) The profitability of MACD and RSI
trading rules in the Australian stock market Investment Management and
Financial Innovation 11(4) 194ndash199
Colombo Business Journal 11(1) 2020
46
Rosillo R de La Fuente D amp Brugos J A L (2013) Technical analysis and the
Spanish stock market Testing the RSI and MACD momentum and stochastic
rule using Spanish market companies Applied Economics 45(12) 1541ndash1550
httpsdoiorg101080000368462011631894
Sehgal S amp Garhyan A (2002) Abnormal returns using technical returns The
Indian experience Finance India 16(1) 181ndash203
Sehgal S amp Gupta M (2007) Tests of technical analysis in India Vision The
Journal of Business Perspective 11(3) 11ndash23 httpsdoiorg101177
097226290701100303
Sobreiro V A da Costa T R C C Nazaacuterio R T F e Silva J L Moreira E
A Filho M C L Kimura H amp Zambrano J C A (2016) The profitability
of moving average trading rules in BRICS and emerging stock markets North
American Journal of Economics and Finance 38 86ndash101 httpsdoiorg
101016jnajef201608003
Tian G G Wan G H amp Guo M (2002) Market efficiency and the returns to
simple technical trading rules New evidence from US equity market and
Chinese equity markets Asia-Pacific Financial Markets 9(3) 241ndash258
httpsdoiorg101023A1024181515265
Tharavanij P Siraprapasiri V amp Rajchamaha K (2015) Performance of
technical trading rules Evidence from Southeast Asian Stock Market
Springerplus 4552 httpsdoiorg101186s40064-015-1334-7
Wang J-L amp Chan S-H (2007) Stock market trading rule discovery using
pattern recognition and technical analysis Expert Systems with Applications
33(2) 304ndash315 httpsdoiorg101016jeswa200605002
Welles J Jr (1978) New concepts in technical trading systems Hunter Publishing
Company
Wong W-K Manzur M amp Chew B-K (2003) How rewarding is technical
analysis Evidence from Singapore stock market Journal of Applied Financial
Economics 13(7) 543ndash551 httpsdoiorg1010800960310022000020906
Yu H Nartea G V Gan C amp Yao L J (2013) Predictive ability and
profitability of simple technical trading rules Recent evidence from Southeast
Asian stock markets International Review of Economics and Finance 25 356ndash
371 httpsdoiorg101016jiref201207016
Zhu H Jiang Z-Q Li S-P amp Zhou W-X (2015) Profitability of simple
technical trading rules of Chinese stock exchange indexes Physica A
Statistical Mechanics and Its Applications 439 75ndash84 httpsdoiorg101016
jphysa201507032

Colombo Business Journal 11(1) 2020
36
negative skewness indicates that the unconditional daily returns were moderately
negatively skewed except for Sideway-1
Table 3 Descriptive Statistics for Unconditional Intraday Return
Cycle Mean Standard
deviation Kurtosis Skew Min Max Count
Overall -000041 000576 48482 -0531 -0047 0030 4545
Bear ndash 1 -000119 000855 12148 -0286 -0035 0026 437
Sideway ndash 1 -000042 000451 06693 0028 -0018 0015 411
Bull ndash 1 -000015 000605 5415 -0785 -0047 0030 1165
Bear ndash 2 -000093 001009 09469 -0359 -0038 0024 280
Bull ndash 2 000025 000583 22848 0049 -0028 0025 411
Sideway ndash 2 -000049 000423 0568 -0217 -0016 0011 679
Bull ndash 3 -000032 000349 22438 -0127 -0018 0012 381
Bear ndash 3 -000098 000406 09085 -0630 -0016 0009 225
Bull ndash 4 -000028 000279 3073 0332 -0009 0016 556
Note Unconditional intraday return defined as the log difference of closing value to opening value by
assuming that the trader buys at the opening value and sells at the closing value
The result of RSI trading rule for BSE Sensex is presented in Table 4 The first
two columns exhibit the number of buy (119873119861) and sell (119873119878) signals generated using
RSI trading rules for the overall period and non-overlapping sub-sample periods
Third and fourth column show the average buy (120583119861) and sell (120583119878) returns along
with t-test in parenthesis The basic assumption of t-test is that the observations are
normally distributed However Table 1 reveals that the returns were not normally
distributed which may question the validity of t-test results and its interpretations In
order to overcome this phenomenon Brock et al (1992) suggested the bootstrap
method developed by Efron (1979) Hence this paper employs the bootstrap
method adopted by McKenzie (2007) which mimics the procedure followed by
Brock et al (1992) Bootstrap process was repeated for 500 times and the resultant t
values and corresponding p values are reported in parentheses and square brackets
respectively However the acceptance and rejection of hypothesis were similar both
in bootstrap p values and t-test In addition standard deviation of buy and sell
signals and the mean difference between buy and sell signals are also presented in
the column five six and seven respectively
Muruganandan
37
Table 4 Statistical Results for RSI Trading Rule
Category NB NS microB microS σB σS microB - microS
Overall 116 178
-000065
(-0352)
[0739]
000003
(1308)
[0232]
000729 000434
-000068
(-0905)
[0367]
Bear ndash 1 15 13
-000002
(0489)
[0645]
00025
(2150)
[0066]
000908 000601
-000252
(-0876)
[0401]
Sideway ndash 1 14 16
-000051
(-0084)
[0946]
000065
(0859)
[0419]
000406 00049
-000116
(-0711)
[0499]
Bull ndash 1 15 54
-000199
(-0801)
[0445]
-00009
(-1273)
[0186]
000892 000414
-00011
(-0464)
[0617]
Bear ndash 2 17 7
000031
(0439)
[0661]
00009
(0488)
[0631]
001134 000979
-000059
(-0128)
[0876]
Bull ndash 2 5 21
000486
(1624)
[0076]
-000039
(-0601)
[0599]
00063 000474
000525
(1749)
[0071]
Sideway ndash 2 26 19
-000165
(-0969)
[0325]
-000009
(0831)
[0411]
0006 000205
-000156
(-1231)
[0246]
Bull ndash 3 4 16
-000121
(-0949)
[0355]
-000037
(-0063)
[0952]
000184 000294
-000084
(-0713)
[0476]
Bear ndash 3 13 5
-000149
(0415)
[0681]
000214
(1296)
[0124]
000373 000279
-00036
(-1357)
[0185]
Bull ndash 4 7 27
00000032
(0334)
[0729]
000037
(1533)
[0162]
000218 000208
-000037
(-0395)
[0691]
Notes 1 NB and NS denote the number of buy and sell signals during the period respectively microB and
microS denote the average return of buy and sell signals respectively σB and σS denote the
standard deviation of buy and sell signal returns respectively
2 Numbers in parentheses are t values and numbers in square brackets are the bootstrap p
values
Colombo Business Journal 11(1) 2020
38
RSI generates more sell signals than buy signals during the Bull market On the
contrary during the Bear and Sideway market RSI produced higher number of buy
signals than sell signals Since RSI has the upper band of 100 if the stock price goes
up continuously RSI remains in the overbought regime and produce more number
of sell signals than buy signals In this case a trader shorting the opportunity based
on RSI sell signals may not make profit as the price will move to the differentother
orbit On the other hand if the stock price goes down continuously the RSI
generates more number of buy signals than the sell signals as opposed to the current
price movement Hence the application of RSI during the long Bull and Bear
markets may not help the trader to make profit even before adjusting the transaction
cost From the result of t-test and bootstrap p values it can be concluded that buy
and sell signals does not reject the null hypothesis that the mean return of buy or sell
signals is not significantly different from the unconditional mean return Moreover
averages of buy signal returns and sell signal returns are not significantly different
from each other These results provide evidence of the existence of weak form
efficiency across the market cycle Hence it can be concluded that traders cannot
outperform the market using the RSI signals during the upward or downward
movement of the market
Table 5 Performance of RSI Trading Signal
Category
Buy Signal Performance Sell Signal Performance
SR APAL of
PT SR APAL
of
PT
Overall -00892 1007 4397 00069 10669 4888
Bear ndash 1 -00022 1489 4000 04160 14933 6923
Sideway ndash 1 -01256 0529 5714 01327 13950 5000
Bull ndash 1 -02242 0896 4000 -02174 10832 3519
Bear ndash 2 00273 1203 4706 00919 09491 5714
Bull ndash 2 07714 1766 8000 -00823 07273 5238
Sideway ndash 2 -02750 0781 3846 -00439 09970 4737
Bull ndash 3 -06576 0298 2500 -01259 07136 5000
Bear ndash 3 -02601 0742 4000 02294 13570 5938
Bull ndash 4 00014 1338 4286 01779 10837 5926
Note SR denotes the Sharpe Ratio APAL denotes the ratio of average profit to average loss
of PT denotes the percentage of profitable trade to total trading signal
Muruganandan
39
Table 5 exhibits the results of Sharpe Ratio (SR) average profit to average loss
ratio (APAL) and percentage of profitable trade to total trading signals For the
overall study period and almost all sub-samples periods buy signal underperforms
the sell signal as per the modified Sharpe ratio The absolute value of average profit
to average loss more than one indicates that the average of profitable trade is more
than the average of unprofitable trade However percentage of profitable trade less
than 50 indicates that RSI generate a higher number of unprofitable trades than
profitable trade Hence average return on buy signal is negative for the overall
study period and for six out of nine sub-sample periods On the other hand RSI sell
signal generated the positive Sharpe ratio for overall period and five out of nine sub-
sample periods Profitable trade to total trade signal indicates sell signal produced
more profitable trade in all sub-sample period except Bull-1 and Sidway-1 market
Though percentage of profitable trade to total trade for overall period is less than
50 (ie 4888) which indicate that the number of unprofitable trades is higher
than the profitable trades the profit per profitable trade is sufficiently enough to
compensate the loss in unprofitable trade The sell signal trading strategy makes
money not only from correctly predicting the market movement but also minimising
the loss quickly and allows the profit to run
The Table 6 exhibits the statistical results for the MACD trading rules During
the study period MACD generated 1522 sell signals and 858 buy signals with the
average return of 000861 and -000128 respectively The standard deviations of buy
signal returns (00179) and sell signal returns (001068) are also presented along
with mean return difference between buy and sell signals (-00021) Buy signal
produced the average negative return for all the sub-sample periods and they were
also not significantly different from the average unconditional mean return Hence
the null hypothesis was accepted and it can be concluded that buy signal produced a
return similar to that of unconditional intraday return However the sell signal
generated positive average return for the overall period and all sub-sample periods
except Bull-2 period In contrast the sell signal returns were significantly different
for the overall period and five out of nine sub-sample periods
Table 6 Statistical Results for MACD Trading Rule
Category NB NS microB microS σB σS microB -microS
Overall 858 1522
-000128
(-142)
[0170]
0000861
(443)
[0002]
0017908 0010686
-000215
(-3203)
[0008]
Colombo Business Journal 11(1) 2020
40
Category NB NS microB microS σB σS microB -microS
Bear ndash 1 141 59
-000021
(0494)
[0631]
0006379
(317)
[0002]
0023008 0018028
-000659
(-2165)
[0036]
Sideway ndash 1 131 71
-000226
(-1524)
[0142]
0000543
(0623)
[0509]
0013614 001285
-000281
(-1452)
[0162]
Bull ndash 1 85 581
-000004
(0043)
[0962]
0000196
(0703)
[0483]
0023623 0011
-000023
(-0090)
[0908]
Bear ndash 2 109 33
-000350
(-0989)
[0337]
0004699
(231)
[0036]
0026444 0013532
-00082
(-2371)
[002]
Bull ndash 2 39 192
-000031
(-0224)
[0816]
-000085
(-1066)
[0311]
0015615 0013721
0000532
(0198)
[0838]
Sideway ndash 2 166 171
-000035
(0171)
[0852]
000195
(375)
[0002]
0011182 0008263
-00023
(-2141)
[0032]
Bull ndash 3 32 165
-000171
(-0514)
[0591]
0000902
(220)
[0028]
0015215 0006737
-000261
(-0952)
[0291]
Bear ndash 3 88 25
-000146
(-0457)
[0643]
0004442
(341)
[0002]
0009516 0007832
-000591
(-3164)
[0004]
Bull ndash 4 67 225
-000205
(-1306)
[0188]
0000871
(2905)
[0008]
0011064 0005643
-000292
(-2080)
[004]
Notes 1 NB and NS denote the number of buy and sell signals during the period respectively microB
and microS denote the average return of buy and sell signals respectively σB and σS denote the
standard deviation of buy and sell signal returns respectively
2 Numbers in parenthesis are t-values and numbers in square brackets are the bootstrap p
values
3 denotes p lt 05
The risk measured by standard deviation is higher in buy signal than sell signal
trading rules for the entire study period and for all the sub-sample periods This
clearly indicates that the trading on buy signal is riskier than the sell signal
Moreover the sell signal average returns were significantly different from the
Muruganandan
41
average buy signal returns in all the Bear market periods and for the overall study
period This result supports the sell signal over buy signal specifically during the
Bear market phases This result sharply contradicts to Tharavanij et al (2015) who
found buy signals outperform the sell signals in Southeast Asian markets
Sharpe ratio average profit to average loss ratio and percentage of profitable
trade to total trade signal for MACD trading rule are presented in Table 7 For the
buy signals percentage of profitable trade to total trade has more than 50 in four
out of nine sub-sample periods but average profit to average loss is less than one
which implies that the profit from correctly predicting market direction is not
sufficient enough to cut down the loss from the failure to predict market direction
Hence Sharpe ratios for all sub-sample periods and the entire study period were
negative However the sell signals correctly predict the market with highest
percentage of profitable trade to total trade of 80 in Bear-3 period Moreover
with less ability to predict market direction in Sideway-1 (4789) and Bull-1
(4905) periods sell signal generated profit to cut down the loss from unprofitable
trade which results in average profit to average loss ratio of more than one for
Sideway-1 (122) and Bull-1 (109) period Overall the result supports the sell
signals over buy signals before considering the transaction costs in the Indian
context
Table 7 Performance of MACD Trading Signal
Category
Buy Signal Performance Sell Signal Performance
SR APAL of
PT SR APAL
of
PT
Overall -0072 0897 47669 008 106 5414
Bear ndash 1 -0009 1110 46809 035 219 5763
Sideway ndash 1 -0166 0701 47328 004 122 4789
Bull ndash 1 -0002 0805 55294 002 109 4905
Bear ndash 2 -0133 0940 43119 035 115 6667
Bull ndash 2 -0020 0734 56410 -006 084 5000
Sideway ndash 2 -0031 1122 45181 024 108 6374
Bull ndash 3 -0112 0563 56250 013 100 5879
Bear ndash 3 -0154 0682 50000 057 108 8000
Bull ndash 4 -0185 0827 41791 015 116 5644
Note SR denotes the Sharpe Ratio APAL denotes the ratio of average profit to average loss
of PT denotes the percentage of profitable trade to total trading signal
Colombo Business Journal 11(1) 2020
42
Conclusion
This paper examines the profitability of RSI and MACD technical trading rules
in the Indian market across market cycles BSE Sensex data for the period from
February 2000 to May 2018 were collected from BSE data base and classified into
nine non-overlapping periods as Bull and Bear markets based on the index
movement The t-tests were applied to test the hypothesis that returns from technical
trading rules were not significantly different from the unconditional daily returns In
addition Sharpe ratio average profit to average loss ratio and percentage of
profitable trade to total trade signal were also employed to have a microscopic view
on technical trading rules
Results support the weak-form efficient theory as RSI failed to deliver the
positive returns even before deducting the transaction costs RSI buy and sell signal
returns were not significantly different from the unconditional intraday return In
terms of market timing RSI wrongly predict the market movement and delivered
the percentage of profitable trade to total trade less than 50 Moreover profitable
trades were insufficient to overcome the loss from unprofitable trade Hence buy
signal generated a negative average return and sell signal posted a low positive
average return before deducting transaction costs Therefore after deducting
transaction costs RSI may not leave any profit in the hands of traders
MACD sell signal produced significant positive returns compared to buy signal
and unconditional intraday return However as per Sharpe ratio MACD sell signal
failed to produce the return in line with risk taken Sharpe ratio of less than one
indicates that risk associated with the technical trading rule is more than the return
generated by RSI and MACD In addition even profitable MACD sell signal does
not help in market timing It makes money from higher average profit from
profitable trade than average loss from unprofitable trade However MACD does
not help to reduce the unprofitable trade Hence the study concludes that the trader
cannot earn abnormal return consistently with the help of RSI and MACD across
market cycle in the Indian context RSI and MACD are very old and yet still widely
used as technical tools in real time stock price prediction On the other hand latest
development in information technology and changes in legal systems may have
helped the market to absorb RSI and MACD signals in current price with no time
and cost However in order to empirically validate this assumption a future study
may be extended using a proxy for information technology development and its
impact on trading rules across industries and individual stocks in emerging markets
Muruganandan
43
Declaration of Conflict of Interest
The author declared no potential conflict of interest with respect to the research
authorship and publication of this article
Acknowledgement
I would like to thank anonymous reviewers for their valuable suggestions
References
Allen F amp Karjalainen R (1999) Using genetic algorithms to find technical
trading rules Journal of Financial Economics 51(2) 245ndash271
httpsdoiorg101016S0304-405X(98)00052-X
Almujamed H I Fifield S amp Power D (2013) An investigation of the role of
technical analysis in Kuwait Qualitative Research in Financial Markets 5(1)
43ndash64 httpsdoiorg10110817554171311308959
Anghel G D I (2015) Stock market efficiency and the MACD Evidence from
countries around the world Procedia Economics and Finance 32 1414ndash1431
httpsdoiorg101016S2212-5671(15)01518-X
Atanasova C V amp Hudson R S (2010) Technical trading rules and calendar
anomalies mdash Are they the same phenomena Economics Letters 106(2) 128ndash
130 httpsdoiorg101016jeconlet200911001
Balsara N J Chen G amp Zheng L (2007) The Chinese stock market An
examination of the random walk model and technical trading rules Quarterly
Journal of Business amp Economics 46(2) 43ndash63 httpswwwjstororgstable
40473435
Balsara N Chen J amp Zheng L (2009) Profiting from a contrarian application of
technical trading rules in the US stock market Journal of Asset Management
10(2) 97ndash123 httpsdoiorg101057jam200844
Brock W Lakonishok J amp LeBaron B (1992) Simple technical trading rules
and stochastic properties of stock returns The Journal of Finance 47(5) 1731ndash
1764 httpsdoiorg101111j1540-62611992tb04681x
Chang E J Lima E J A amp Tabak B M (2004) Testing for predictability in
emerging equity markets Emerging Markets Review 5(3) 295ndash316
httpsdoi101016jememar200403005
Chiang Y-C Ke M-C Liao T L amp Wang C D (2012) Are technical trading
strategies still profitable - Evidence from the Taiwan Stock Index Futures
Market Applied Financial Economics 22(12) 955ndash965 httpsdoiorg
101080096031072011631893
Chong T T-L amp Ng W-K (2008) Technical analysis and the London stock
exchange Testing the MACD and RSI rules using the FT30 Applied
Colombo Business Journal 11(1) 2020
44
Economics Letters 15(14) 1111ndash1114 httpsdoiorg10108013504850600
993598
Cohen G amp Cabiri E (2015) Can technical oscillators outperform the buy and
hold strategy Applied Economics 47(30) 3189ndash3197 httpsdoiorg101080
0003684620151013609
Efron B (1979) Bootstrap methods Another look at the Jackknife The Annals of
Statistics 7(1)1ndash26 httpsprojecteuclidorgeuclidaos 1176344552
Fama (1970) Efficient capital markets a review of theory and empirical work
Journal of Finance 25(2) 383-417 httpswwwjstororgstable2325486
Gencay R (1998) The predictability of security returns with simple technical
trading rules Journal of Empirical Finance 5(4) 347ndash359 httpsdoiorg
101016S0927-5398(97)00022-4
Gunasekarage A amp Power D M (2001) The profitability of moving average
trading rules in South Asian stock markets Emerging Markets Review 2(1)
17ndash33 httpsdoiorg101016S1566-0141(00)00017-0
Henderson C (2002) Currency strategy The practitionerrsquos guide to currency
investing hedging and forecasting John Willy amp Sons
Heng P amp Niblock S J (2014) Trading with tigers A technical analysis of
Southeast Asian stock index futures International Economic Journal 28(4)
679ndash692 httpsdoiorg101080101687372014928895
Hudson R Dempsey M amp Keasey K (1996) A note on weak form efficiency of
capital markets The application of simple technical trading rules to UK stock
prices- 1935-1994 Journal of Banking and Finance 20(6) 1121ndash1132
httpsdoiorg1010160378-4266(95)00043-7
Jensen M C amp Benington G A (1970) Random walk and technical theories
Some additional evidence Journal of Finance 25 469ndash482
httpswwwjstororgstable2325495
Krausz J Lee S-Y amp Nam K (2009) Profitability of nonlinear dynamics
under technical trading rules Evidence from Pacific basin stock markets
Emerging Markets Finance amp Trade 45(4) 13ndash35 httpsdoiorg102753
REE1540-496X450402
Khatua A (2016) An application of moving average convergence and divergence
(MACD) indicator on selected stocks listed on National Stock Exchange (NSE)
httpdxdoiorg102139ssrn2872665
Kulkarni A D amp More A (2014) An application of moving average convergence
divergence (MACD) indicator on selected stocks listed on Bombay Stock
Exchange (BSE) Oriental Journal of Computer Science and Technology 7(3)
396ndash400 httpwwwcomputerscijournalorgp=1500
Lokeshwarri S K (2017 April 07) The big story ndash Sit back go passive The Hindu
Business Line (Coimbatore Edition) p 2
Muruganandan
45
Marshall B R Cahan R H amp Cahan J M (2008) Does intraday technical
analysis in the US equity market have value Journal of Empirical Finance
15(2) 199ndash210 httpsdoiorg101016jjempfin200605003
Marshall B R Young M R amp Cahan R (2008) Are candlestick technical
trading strategies profitable in the Japanese equity market Review of
Quantitative Finance and Accounting 31(2) 191ndash207 httpsdoiorg101007
s11156-007-0068-1
Metghalchi M Chen C-P Hajilee M (2016) Moving average trading rules for
NASDAQ composite index Applied Finance Letters 5(2) 45ndash57
httpsdoiorg1024135aflv5i254
Metghalchi M amp Hayes L A Niroomand F (2019) A technical approach to
equity investing in emerging markets Review of Financial Economics 37(3)
389ndash403 httpsdoiorg101002rfe1041
McKenzie M D (2007) Technical trading rules in emerging market and the 1997
Asian currency crises Emerging Market Finance and Trade 43(4) 46ndash73
httpsdoiorg102753REE1540-496X430403
Ming-Ming L Balachandher K G amp Nor F M (2002) An examination of the
random walk model and technical trading rules in the Malaysian stock market
Quarterly Journal of Business amp Economics 41(1) 81ndash104
httpswwwjstororgstable40473346
Ming-Ming L amp Siok-Hwa L (2006) The profitability of the simple moving
averages and trading range breakout in the Asian stock markets Journal of
Asian Economics 17(1) 144ndash170 httpsdoiorg101016jasieco200512001
Mitra S K (2011) How rewarding is technical analysis in Indian stock market
Quantitative Finance 11(2) 287ndash297 httpsdoiorg101080
14697680903493581
Nazario R T F Silva J L amp Sobrero V A (2017) A literature review of
technical analysis on stock markets The Quarterly Review of Economics and
Finance 66 115ndash126 httpsdoiorg101016jqref201701014
Neftccedili S N (1991) Naiumlve trading rules in financial markets and Wiener-
Kolmogorov prediction theory A study of ldquotechnical analysisrdquo Journal of
Business 64(4) 549ndash571
Ni Y Day M-Y Huang P ampYu S-R (2020) The profitability of Bollinger
Bamps Evidence from the constituent stocks of Taiwan 50 Physica A Statistical
Mechanics and Its Applications Advance online publication httpsdoiorg
101016jphysa2020124144
Nor S M amp Wickremasinghe G (2014) The profitability of MACD and RSI
trading rules in the Australian stock market Investment Management and
Financial Innovation 11(4) 194ndash199
Colombo Business Journal 11(1) 2020
46
Rosillo R de La Fuente D amp Brugos J A L (2013) Technical analysis and the
Spanish stock market Testing the RSI and MACD momentum and stochastic
rule using Spanish market companies Applied Economics 45(12) 1541ndash1550
httpsdoiorg101080000368462011631894
Sehgal S amp Garhyan A (2002) Abnormal returns using technical returns The
Indian experience Finance India 16(1) 181ndash203
Sehgal S amp Gupta M (2007) Tests of technical analysis in India Vision The
Journal of Business Perspective 11(3) 11ndash23 httpsdoiorg101177
097226290701100303
Sobreiro V A da Costa T R C C Nazaacuterio R T F e Silva J L Moreira E
A Filho M C L Kimura H amp Zambrano J C A (2016) The profitability
of moving average trading rules in BRICS and emerging stock markets North
American Journal of Economics and Finance 38 86ndash101 httpsdoiorg
101016jnajef201608003
Tian G G Wan G H amp Guo M (2002) Market efficiency and the returns to
simple technical trading rules New evidence from US equity market and
Chinese equity markets Asia-Pacific Financial Markets 9(3) 241ndash258
httpsdoiorg101023A1024181515265
Tharavanij P Siraprapasiri V amp Rajchamaha K (2015) Performance of
technical trading rules Evidence from Southeast Asian Stock Market
Springerplus 4552 httpsdoiorg101186s40064-015-1334-7
Wang J-L amp Chan S-H (2007) Stock market trading rule discovery using
pattern recognition and technical analysis Expert Systems with Applications
33(2) 304ndash315 httpsdoiorg101016jeswa200605002
Welles J Jr (1978) New concepts in technical trading systems Hunter Publishing
Company
Wong W-K Manzur M amp Chew B-K (2003) How rewarding is technical
analysis Evidence from Singapore stock market Journal of Applied Financial
Economics 13(7) 543ndash551 httpsdoiorg1010800960310022000020906
Yu H Nartea G V Gan C amp Yao L J (2013) Predictive ability and
profitability of simple technical trading rules Recent evidence from Southeast
Asian stock markets International Review of Economics and Finance 25 356ndash
371 httpsdoiorg101016jiref201207016
Zhu H Jiang Z-Q Li S-P amp Zhou W-X (2015) Profitability of simple
technical trading rules of Chinese stock exchange indexes Physica A
Statistical Mechanics and Its Applications 439 75ndash84 httpsdoiorg101016
jphysa201507032

Muruganandan
37
Table 4 Statistical Results for RSI Trading Rule
Category NB NS microB microS σB σS microB - microS
Overall 116 178
-000065
(-0352)
[0739]
000003
(1308)
[0232]
000729 000434
-000068
(-0905)
[0367]
Bear ndash 1 15 13
-000002
(0489)
[0645]
00025
(2150)
[0066]
000908 000601
-000252
(-0876)
[0401]
Sideway ndash 1 14 16
-000051
(-0084)
[0946]
000065
(0859)
[0419]
000406 00049
-000116
(-0711)
[0499]
Bull ndash 1 15 54
-000199
(-0801)
[0445]
-00009
(-1273)
[0186]
000892 000414
-00011
(-0464)
[0617]
Bear ndash 2 17 7
000031
(0439)
[0661]
00009
(0488)
[0631]
001134 000979
-000059
(-0128)
[0876]
Bull ndash 2 5 21
000486
(1624)
[0076]
-000039
(-0601)
[0599]
00063 000474
000525
(1749)
[0071]
Sideway ndash 2 26 19
-000165
(-0969)
[0325]
-000009
(0831)
[0411]
0006 000205
-000156
(-1231)
[0246]
Bull ndash 3 4 16
-000121
(-0949)
[0355]
-000037
(-0063)
[0952]
000184 000294
-000084
(-0713)
[0476]
Bear ndash 3 13 5
-000149
(0415)
[0681]
000214
(1296)
[0124]
000373 000279
-00036
(-1357)
[0185]
Bull ndash 4 7 27
00000032
(0334)
[0729]
000037
(1533)
[0162]
000218 000208
-000037
(-0395)
[0691]
Notes 1 NB and NS denote the number of buy and sell signals during the period respectively microB and
microS denote the average return of buy and sell signals respectively σB and σS denote the
standard deviation of buy and sell signal returns respectively
2 Numbers in parentheses are t values and numbers in square brackets are the bootstrap p
values
Colombo Business Journal 11(1) 2020
38
RSI generates more sell signals than buy signals during the Bull market On the
contrary during the Bear and Sideway market RSI produced higher number of buy
signals than sell signals Since RSI has the upper band of 100 if the stock price goes
up continuously RSI remains in the overbought regime and produce more number
of sell signals than buy signals In this case a trader shorting the opportunity based
on RSI sell signals may not make profit as the price will move to the differentother
orbit On the other hand if the stock price goes down continuously the RSI
generates more number of buy signals than the sell signals as opposed to the current
price movement Hence the application of RSI during the long Bull and Bear
markets may not help the trader to make profit even before adjusting the transaction
cost From the result of t-test and bootstrap p values it can be concluded that buy
and sell signals does not reject the null hypothesis that the mean return of buy or sell
signals is not significantly different from the unconditional mean return Moreover
averages of buy signal returns and sell signal returns are not significantly different
from each other These results provide evidence of the existence of weak form
efficiency across the market cycle Hence it can be concluded that traders cannot
outperform the market using the RSI signals during the upward or downward
movement of the market
Table 5 Performance of RSI Trading Signal
Category
Buy Signal Performance Sell Signal Performance
SR APAL of
PT SR APAL
of
PT
Overall -00892 1007 4397 00069 10669 4888
Bear ndash 1 -00022 1489 4000 04160 14933 6923
Sideway ndash 1 -01256 0529 5714 01327 13950 5000
Bull ndash 1 -02242 0896 4000 -02174 10832 3519
Bear ndash 2 00273 1203 4706 00919 09491 5714
Bull ndash 2 07714 1766 8000 -00823 07273 5238
Sideway ndash 2 -02750 0781 3846 -00439 09970 4737
Bull ndash 3 -06576 0298 2500 -01259 07136 5000
Bear ndash 3 -02601 0742 4000 02294 13570 5938
Bull ndash 4 00014 1338 4286 01779 10837 5926
Note SR denotes the Sharpe Ratio APAL denotes the ratio of average profit to average loss
of PT denotes the percentage of profitable trade to total trading signal
Muruganandan
39
Table 5 exhibits the results of Sharpe Ratio (SR) average profit to average loss
ratio (APAL) and percentage of profitable trade to total trading signals For the
overall study period and almost all sub-samples periods buy signal underperforms
the sell signal as per the modified Sharpe ratio The absolute value of average profit
to average loss more than one indicates that the average of profitable trade is more
than the average of unprofitable trade However percentage of profitable trade less
than 50 indicates that RSI generate a higher number of unprofitable trades than
profitable trade Hence average return on buy signal is negative for the overall
study period and for six out of nine sub-sample periods On the other hand RSI sell
signal generated the positive Sharpe ratio for overall period and five out of nine sub-
sample periods Profitable trade to total trade signal indicates sell signal produced
more profitable trade in all sub-sample period except Bull-1 and Sidway-1 market
Though percentage of profitable trade to total trade for overall period is less than
50 (ie 4888) which indicate that the number of unprofitable trades is higher
than the profitable trades the profit per profitable trade is sufficiently enough to
compensate the loss in unprofitable trade The sell signal trading strategy makes
money not only from correctly predicting the market movement but also minimising
the loss quickly and allows the profit to run
The Table 6 exhibits the statistical results for the MACD trading rules During
the study period MACD generated 1522 sell signals and 858 buy signals with the
average return of 000861 and -000128 respectively The standard deviations of buy
signal returns (00179) and sell signal returns (001068) are also presented along
with mean return difference between buy and sell signals (-00021) Buy signal
produced the average negative return for all the sub-sample periods and they were
also not significantly different from the average unconditional mean return Hence
the null hypothesis was accepted and it can be concluded that buy signal produced a
return similar to that of unconditional intraday return However the sell signal
generated positive average return for the overall period and all sub-sample periods
except Bull-2 period In contrast the sell signal returns were significantly different
for the overall period and five out of nine sub-sample periods
Table 6 Statistical Results for MACD Trading Rule
Category NB NS microB microS σB σS microB -microS
Overall 858 1522
-000128
(-142)
[0170]
0000861
(443)
[0002]
0017908 0010686
-000215
(-3203)
[0008]
Colombo Business Journal 11(1) 2020
40
Category NB NS microB microS σB σS microB -microS
Bear ndash 1 141 59
-000021
(0494)
[0631]
0006379
(317)
[0002]
0023008 0018028
-000659
(-2165)
[0036]
Sideway ndash 1 131 71
-000226
(-1524)
[0142]
0000543
(0623)
[0509]
0013614 001285
-000281
(-1452)
[0162]
Bull ndash 1 85 581
-000004
(0043)
[0962]
0000196
(0703)
[0483]
0023623 0011
-000023
(-0090)
[0908]
Bear ndash 2 109 33
-000350
(-0989)
[0337]
0004699
(231)
[0036]
0026444 0013532
-00082
(-2371)
[002]
Bull ndash 2 39 192
-000031
(-0224)
[0816]
-000085
(-1066)
[0311]
0015615 0013721
0000532
(0198)
[0838]
Sideway ndash 2 166 171
-000035
(0171)
[0852]
000195
(375)
[0002]
0011182 0008263
-00023
(-2141)
[0032]
Bull ndash 3 32 165
-000171
(-0514)
[0591]
0000902
(220)
[0028]
0015215 0006737
-000261
(-0952)
[0291]
Bear ndash 3 88 25
-000146
(-0457)
[0643]
0004442
(341)
[0002]
0009516 0007832
-000591
(-3164)
[0004]
Bull ndash 4 67 225
-000205
(-1306)
[0188]
0000871
(2905)
[0008]
0011064 0005643
-000292
(-2080)
[004]
Notes 1 NB and NS denote the number of buy and sell signals during the period respectively microB
and microS denote the average return of buy and sell signals respectively σB and σS denote the
standard deviation of buy and sell signal returns respectively
2 Numbers in parenthesis are t-values and numbers in square brackets are the bootstrap p
values
3 denotes p lt 05
The risk measured by standard deviation is higher in buy signal than sell signal
trading rules for the entire study period and for all the sub-sample periods This
clearly indicates that the trading on buy signal is riskier than the sell signal
Moreover the sell signal average returns were significantly different from the
Muruganandan
41
average buy signal returns in all the Bear market periods and for the overall study
period This result supports the sell signal over buy signal specifically during the
Bear market phases This result sharply contradicts to Tharavanij et al (2015) who
found buy signals outperform the sell signals in Southeast Asian markets
Sharpe ratio average profit to average loss ratio and percentage of profitable
trade to total trade signal for MACD trading rule are presented in Table 7 For the
buy signals percentage of profitable trade to total trade has more than 50 in four
out of nine sub-sample periods but average profit to average loss is less than one
which implies that the profit from correctly predicting market direction is not
sufficient enough to cut down the loss from the failure to predict market direction
Hence Sharpe ratios for all sub-sample periods and the entire study period were
negative However the sell signals correctly predict the market with highest
percentage of profitable trade to total trade of 80 in Bear-3 period Moreover
with less ability to predict market direction in Sideway-1 (4789) and Bull-1
(4905) periods sell signal generated profit to cut down the loss from unprofitable
trade which results in average profit to average loss ratio of more than one for
Sideway-1 (122) and Bull-1 (109) period Overall the result supports the sell
signals over buy signals before considering the transaction costs in the Indian
context
Table 7 Performance of MACD Trading Signal
Category
Buy Signal Performance Sell Signal Performance
SR APAL of
PT SR APAL
of
PT
Overall -0072 0897 47669 008 106 5414
Bear ndash 1 -0009 1110 46809 035 219 5763
Sideway ndash 1 -0166 0701 47328 004 122 4789
Bull ndash 1 -0002 0805 55294 002 109 4905
Bear ndash 2 -0133 0940 43119 035 115 6667
Bull ndash 2 -0020 0734 56410 -006 084 5000
Sideway ndash 2 -0031 1122 45181 024 108 6374
Bull ndash 3 -0112 0563 56250 013 100 5879
Bear ndash 3 -0154 0682 50000 057 108 8000
Bull ndash 4 -0185 0827 41791 015 116 5644
Note SR denotes the Sharpe Ratio APAL denotes the ratio of average profit to average loss
of PT denotes the percentage of profitable trade to total trading signal
Colombo Business Journal 11(1) 2020
42
Conclusion
This paper examines the profitability of RSI and MACD technical trading rules
in the Indian market across market cycles BSE Sensex data for the period from
February 2000 to May 2018 were collected from BSE data base and classified into
nine non-overlapping periods as Bull and Bear markets based on the index
movement The t-tests were applied to test the hypothesis that returns from technical
trading rules were not significantly different from the unconditional daily returns In
addition Sharpe ratio average profit to average loss ratio and percentage of
profitable trade to total trade signal were also employed to have a microscopic view
on technical trading rules
Results support the weak-form efficient theory as RSI failed to deliver the
positive returns even before deducting the transaction costs RSI buy and sell signal
returns were not significantly different from the unconditional intraday return In
terms of market timing RSI wrongly predict the market movement and delivered
the percentage of profitable trade to total trade less than 50 Moreover profitable
trades were insufficient to overcome the loss from unprofitable trade Hence buy
signal generated a negative average return and sell signal posted a low positive
average return before deducting transaction costs Therefore after deducting
transaction costs RSI may not leave any profit in the hands of traders
MACD sell signal produced significant positive returns compared to buy signal
and unconditional intraday return However as per Sharpe ratio MACD sell signal
failed to produce the return in line with risk taken Sharpe ratio of less than one
indicates that risk associated with the technical trading rule is more than the return
generated by RSI and MACD In addition even profitable MACD sell signal does
not help in market timing It makes money from higher average profit from
profitable trade than average loss from unprofitable trade However MACD does
not help to reduce the unprofitable trade Hence the study concludes that the trader
cannot earn abnormal return consistently with the help of RSI and MACD across
market cycle in the Indian context RSI and MACD are very old and yet still widely
used as technical tools in real time stock price prediction On the other hand latest
development in information technology and changes in legal systems may have
helped the market to absorb RSI and MACD signals in current price with no time
and cost However in order to empirically validate this assumption a future study
may be extended using a proxy for information technology development and its
impact on trading rules across industries and individual stocks in emerging markets
Muruganandan
43
Declaration of Conflict of Interest
The author declared no potential conflict of interest with respect to the research
authorship and publication of this article
Acknowledgement
I would like to thank anonymous reviewers for their valuable suggestions
References
Allen F amp Karjalainen R (1999) Using genetic algorithms to find technical
trading rules Journal of Financial Economics 51(2) 245ndash271
httpsdoiorg101016S0304-405X(98)00052-X
Almujamed H I Fifield S amp Power D (2013) An investigation of the role of
technical analysis in Kuwait Qualitative Research in Financial Markets 5(1)
43ndash64 httpsdoiorg10110817554171311308959
Anghel G D I (2015) Stock market efficiency and the MACD Evidence from
countries around the world Procedia Economics and Finance 32 1414ndash1431
httpsdoiorg101016S2212-5671(15)01518-X
Atanasova C V amp Hudson R S (2010) Technical trading rules and calendar
anomalies mdash Are they the same phenomena Economics Letters 106(2) 128ndash
130 httpsdoiorg101016jeconlet200911001
Balsara N J Chen G amp Zheng L (2007) The Chinese stock market An
examination of the random walk model and technical trading rules Quarterly
Journal of Business amp Economics 46(2) 43ndash63 httpswwwjstororgstable
40473435
Balsara N Chen J amp Zheng L (2009) Profiting from a contrarian application of
technical trading rules in the US stock market Journal of Asset Management
10(2) 97ndash123 httpsdoiorg101057jam200844
Brock W Lakonishok J amp LeBaron B (1992) Simple technical trading rules
and stochastic properties of stock returns The Journal of Finance 47(5) 1731ndash
1764 httpsdoiorg101111j1540-62611992tb04681x
Chang E J Lima E J A amp Tabak B M (2004) Testing for predictability in
emerging equity markets Emerging Markets Review 5(3) 295ndash316
httpsdoi101016jememar200403005
Chiang Y-C Ke M-C Liao T L amp Wang C D (2012) Are technical trading
strategies still profitable - Evidence from the Taiwan Stock Index Futures
Market Applied Financial Economics 22(12) 955ndash965 httpsdoiorg
101080096031072011631893
Chong T T-L amp Ng W-K (2008) Technical analysis and the London stock
exchange Testing the MACD and RSI rules using the FT30 Applied
Colombo Business Journal 11(1) 2020
44
Economics Letters 15(14) 1111ndash1114 httpsdoiorg10108013504850600
993598
Cohen G amp Cabiri E (2015) Can technical oscillators outperform the buy and
hold strategy Applied Economics 47(30) 3189ndash3197 httpsdoiorg101080
0003684620151013609
Efron B (1979) Bootstrap methods Another look at the Jackknife The Annals of
Statistics 7(1)1ndash26 httpsprojecteuclidorgeuclidaos 1176344552
Fama (1970) Efficient capital markets a review of theory and empirical work
Journal of Finance 25(2) 383-417 httpswwwjstororgstable2325486
Gencay R (1998) The predictability of security returns with simple technical
trading rules Journal of Empirical Finance 5(4) 347ndash359 httpsdoiorg
101016S0927-5398(97)00022-4
Gunasekarage A amp Power D M (2001) The profitability of moving average
trading rules in South Asian stock markets Emerging Markets Review 2(1)
17ndash33 httpsdoiorg101016S1566-0141(00)00017-0
Henderson C (2002) Currency strategy The practitionerrsquos guide to currency
investing hedging and forecasting John Willy amp Sons
Heng P amp Niblock S J (2014) Trading with tigers A technical analysis of
Southeast Asian stock index futures International Economic Journal 28(4)
679ndash692 httpsdoiorg101080101687372014928895
Hudson R Dempsey M amp Keasey K (1996) A note on weak form efficiency of
capital markets The application of simple technical trading rules to UK stock
prices- 1935-1994 Journal of Banking and Finance 20(6) 1121ndash1132
httpsdoiorg1010160378-4266(95)00043-7
Jensen M C amp Benington G A (1970) Random walk and technical theories
Some additional evidence Journal of Finance 25 469ndash482
httpswwwjstororgstable2325495
Krausz J Lee S-Y amp Nam K (2009) Profitability of nonlinear dynamics
under technical trading rules Evidence from Pacific basin stock markets
Emerging Markets Finance amp Trade 45(4) 13ndash35 httpsdoiorg102753
REE1540-496X450402
Khatua A (2016) An application of moving average convergence and divergence
(MACD) indicator on selected stocks listed on National Stock Exchange (NSE)
httpdxdoiorg102139ssrn2872665
Kulkarni A D amp More A (2014) An application of moving average convergence
divergence (MACD) indicator on selected stocks listed on Bombay Stock
Exchange (BSE) Oriental Journal of Computer Science and Technology 7(3)
396ndash400 httpwwwcomputerscijournalorgp=1500
Lokeshwarri S K (2017 April 07) The big story ndash Sit back go passive The Hindu
Business Line (Coimbatore Edition) p 2
Muruganandan
45
Marshall B R Cahan R H amp Cahan J M (2008) Does intraday technical
analysis in the US equity market have value Journal of Empirical Finance
15(2) 199ndash210 httpsdoiorg101016jjempfin200605003
Marshall B R Young M R amp Cahan R (2008) Are candlestick technical
trading strategies profitable in the Japanese equity market Review of
Quantitative Finance and Accounting 31(2) 191ndash207 httpsdoiorg101007
s11156-007-0068-1
Metghalchi M Chen C-P Hajilee M (2016) Moving average trading rules for
NASDAQ composite index Applied Finance Letters 5(2) 45ndash57
httpsdoiorg1024135aflv5i254
Metghalchi M amp Hayes L A Niroomand F (2019) A technical approach to
equity investing in emerging markets Review of Financial Economics 37(3)
389ndash403 httpsdoiorg101002rfe1041
McKenzie M D (2007) Technical trading rules in emerging market and the 1997
Asian currency crises Emerging Market Finance and Trade 43(4) 46ndash73
httpsdoiorg102753REE1540-496X430403
Ming-Ming L Balachandher K G amp Nor F M (2002) An examination of the
random walk model and technical trading rules in the Malaysian stock market
Quarterly Journal of Business amp Economics 41(1) 81ndash104
httpswwwjstororgstable40473346
Ming-Ming L amp Siok-Hwa L (2006) The profitability of the simple moving
averages and trading range breakout in the Asian stock markets Journal of
Asian Economics 17(1) 144ndash170 httpsdoiorg101016jasieco200512001
Mitra S K (2011) How rewarding is technical analysis in Indian stock market
Quantitative Finance 11(2) 287ndash297 httpsdoiorg101080
14697680903493581
Nazario R T F Silva J L amp Sobrero V A (2017) A literature review of
technical analysis on stock markets The Quarterly Review of Economics and
Finance 66 115ndash126 httpsdoiorg101016jqref201701014
Neftccedili S N (1991) Naiumlve trading rules in financial markets and Wiener-
Kolmogorov prediction theory A study of ldquotechnical analysisrdquo Journal of
Business 64(4) 549ndash571
Ni Y Day M-Y Huang P ampYu S-R (2020) The profitability of Bollinger
Bamps Evidence from the constituent stocks of Taiwan 50 Physica A Statistical
Mechanics and Its Applications Advance online publication httpsdoiorg
101016jphysa2020124144
Nor S M amp Wickremasinghe G (2014) The profitability of MACD and RSI
trading rules in the Australian stock market Investment Management and
Financial Innovation 11(4) 194ndash199
Colombo Business Journal 11(1) 2020
46
Rosillo R de La Fuente D amp Brugos J A L (2013) Technical analysis and the
Spanish stock market Testing the RSI and MACD momentum and stochastic
rule using Spanish market companies Applied Economics 45(12) 1541ndash1550
httpsdoiorg101080000368462011631894
Sehgal S amp Garhyan A (2002) Abnormal returns using technical returns The
Indian experience Finance India 16(1) 181ndash203
Sehgal S amp Gupta M (2007) Tests of technical analysis in India Vision The
Journal of Business Perspective 11(3) 11ndash23 httpsdoiorg101177
097226290701100303
Sobreiro V A da Costa T R C C Nazaacuterio R T F e Silva J L Moreira E
A Filho M C L Kimura H amp Zambrano J C A (2016) The profitability
of moving average trading rules in BRICS and emerging stock markets North
American Journal of Economics and Finance 38 86ndash101 httpsdoiorg
101016jnajef201608003
Tian G G Wan G H amp Guo M (2002) Market efficiency and the returns to
simple technical trading rules New evidence from US equity market and
Chinese equity markets Asia-Pacific Financial Markets 9(3) 241ndash258
httpsdoiorg101023A1024181515265
Tharavanij P Siraprapasiri V amp Rajchamaha K (2015) Performance of
technical trading rules Evidence from Southeast Asian Stock Market
Springerplus 4552 httpsdoiorg101186s40064-015-1334-7
Wang J-L amp Chan S-H (2007) Stock market trading rule discovery using
pattern recognition and technical analysis Expert Systems with Applications
33(2) 304ndash315 httpsdoiorg101016jeswa200605002
Welles J Jr (1978) New concepts in technical trading systems Hunter Publishing
Company
Wong W-K Manzur M amp Chew B-K (2003) How rewarding is technical
analysis Evidence from Singapore stock market Journal of Applied Financial
Economics 13(7) 543ndash551 httpsdoiorg1010800960310022000020906
Yu H Nartea G V Gan C amp Yao L J (2013) Predictive ability and
profitability of simple technical trading rules Recent evidence from Southeast
Asian stock markets International Review of Economics and Finance 25 356ndash
371 httpsdoiorg101016jiref201207016
Zhu H Jiang Z-Q Li S-P amp Zhou W-X (2015) Profitability of simple
technical trading rules of Chinese stock exchange indexes Physica A
Statistical Mechanics and Its Applications 439 75ndash84 httpsdoiorg101016
jphysa201507032

Colombo Business Journal 11(1) 2020
38
RSI generates more sell signals than buy signals during the Bull market On the
contrary during the Bear and Sideway market RSI produced higher number of buy
signals than sell signals Since RSI has the upper band of 100 if the stock price goes
up continuously RSI remains in the overbought regime and produce more number
of sell signals than buy signals In this case a trader shorting the opportunity based
on RSI sell signals may not make profit as the price will move to the differentother
orbit On the other hand if the stock price goes down continuously the RSI
generates more number of buy signals than the sell signals as opposed to the current
price movement Hence the application of RSI during the long Bull and Bear
markets may not help the trader to make profit even before adjusting the transaction
cost From the result of t-test and bootstrap p values it can be concluded that buy
and sell signals does not reject the null hypothesis that the mean return of buy or sell
signals is not significantly different from the unconditional mean return Moreover
averages of buy signal returns and sell signal returns are not significantly different
from each other These results provide evidence of the existence of weak form
efficiency across the market cycle Hence it can be concluded that traders cannot
outperform the market using the RSI signals during the upward or downward
movement of the market
Table 5 Performance of RSI Trading Signal
Category
Buy Signal Performance Sell Signal Performance
SR APAL of
PT SR APAL
of
PT
Overall -00892 1007 4397 00069 10669 4888
Bear ndash 1 -00022 1489 4000 04160 14933 6923
Sideway ndash 1 -01256 0529 5714 01327 13950 5000
Bull ndash 1 -02242 0896 4000 -02174 10832 3519
Bear ndash 2 00273 1203 4706 00919 09491 5714
Bull ndash 2 07714 1766 8000 -00823 07273 5238
Sideway ndash 2 -02750 0781 3846 -00439 09970 4737
Bull ndash 3 -06576 0298 2500 -01259 07136 5000
Bear ndash 3 -02601 0742 4000 02294 13570 5938
Bull ndash 4 00014 1338 4286 01779 10837 5926
Note SR denotes the Sharpe Ratio APAL denotes the ratio of average profit to average loss
of PT denotes the percentage of profitable trade to total trading signal
Muruganandan
39
Table 5 exhibits the results of Sharpe Ratio (SR) average profit to average loss
ratio (APAL) and percentage of profitable trade to total trading signals For the
overall study period and almost all sub-samples periods buy signal underperforms
the sell signal as per the modified Sharpe ratio The absolute value of average profit
to average loss more than one indicates that the average of profitable trade is more
than the average of unprofitable trade However percentage of profitable trade less
than 50 indicates that RSI generate a higher number of unprofitable trades than
profitable trade Hence average return on buy signal is negative for the overall
study period and for six out of nine sub-sample periods On the other hand RSI sell
signal generated the positive Sharpe ratio for overall period and five out of nine sub-
sample periods Profitable trade to total trade signal indicates sell signal produced
more profitable trade in all sub-sample period except Bull-1 and Sidway-1 market
Though percentage of profitable trade to total trade for overall period is less than
50 (ie 4888) which indicate that the number of unprofitable trades is higher
than the profitable trades the profit per profitable trade is sufficiently enough to
compensate the loss in unprofitable trade The sell signal trading strategy makes
money not only from correctly predicting the market movement but also minimising
the loss quickly and allows the profit to run
The Table 6 exhibits the statistical results for the MACD trading rules During
the study period MACD generated 1522 sell signals and 858 buy signals with the
average return of 000861 and -000128 respectively The standard deviations of buy
signal returns (00179) and sell signal returns (001068) are also presented along
with mean return difference between buy and sell signals (-00021) Buy signal
produced the average negative return for all the sub-sample periods and they were
also not significantly different from the average unconditional mean return Hence
the null hypothesis was accepted and it can be concluded that buy signal produced a
return similar to that of unconditional intraday return However the sell signal
generated positive average return for the overall period and all sub-sample periods
except Bull-2 period In contrast the sell signal returns were significantly different
for the overall period and five out of nine sub-sample periods
Table 6 Statistical Results for MACD Trading Rule
Category NB NS microB microS σB σS microB -microS
Overall 858 1522
-000128
(-142)
[0170]
0000861
(443)
[0002]
0017908 0010686
-000215
(-3203)
[0008]
Colombo Business Journal 11(1) 2020
40
Category NB NS microB microS σB σS microB -microS
Bear ndash 1 141 59
-000021
(0494)
[0631]
0006379
(317)
[0002]
0023008 0018028
-000659
(-2165)
[0036]
Sideway ndash 1 131 71
-000226
(-1524)
[0142]
0000543
(0623)
[0509]
0013614 001285
-000281
(-1452)
[0162]
Bull ndash 1 85 581
-000004
(0043)
[0962]
0000196
(0703)
[0483]
0023623 0011
-000023
(-0090)
[0908]
Bear ndash 2 109 33
-000350
(-0989)
[0337]
0004699
(231)
[0036]
0026444 0013532
-00082
(-2371)
[002]
Bull ndash 2 39 192
-000031
(-0224)
[0816]
-000085
(-1066)
[0311]
0015615 0013721
0000532
(0198)
[0838]
Sideway ndash 2 166 171
-000035
(0171)
[0852]
000195
(375)
[0002]
0011182 0008263
-00023
(-2141)
[0032]
Bull ndash 3 32 165
-000171
(-0514)
[0591]
0000902
(220)
[0028]
0015215 0006737
-000261
(-0952)
[0291]
Bear ndash 3 88 25
-000146
(-0457)
[0643]
0004442
(341)
[0002]
0009516 0007832
-000591
(-3164)
[0004]
Bull ndash 4 67 225
-000205
(-1306)
[0188]
0000871
(2905)
[0008]
0011064 0005643
-000292
(-2080)
[004]
Notes 1 NB and NS denote the number of buy and sell signals during the period respectively microB
and microS denote the average return of buy and sell signals respectively σB and σS denote the
standard deviation of buy and sell signal returns respectively
2 Numbers in parenthesis are t-values and numbers in square brackets are the bootstrap p
values
3 denotes p lt 05
The risk measured by standard deviation is higher in buy signal than sell signal
trading rules for the entire study period and for all the sub-sample periods This
clearly indicates that the trading on buy signal is riskier than the sell signal
Moreover the sell signal average returns were significantly different from the
Muruganandan
41
average buy signal returns in all the Bear market periods and for the overall study
period This result supports the sell signal over buy signal specifically during the
Bear market phases This result sharply contradicts to Tharavanij et al (2015) who
found buy signals outperform the sell signals in Southeast Asian markets
Sharpe ratio average profit to average loss ratio and percentage of profitable
trade to total trade signal for MACD trading rule are presented in Table 7 For the
buy signals percentage of profitable trade to total trade has more than 50 in four
out of nine sub-sample periods but average profit to average loss is less than one
which implies that the profit from correctly predicting market direction is not
sufficient enough to cut down the loss from the failure to predict market direction
Hence Sharpe ratios for all sub-sample periods and the entire study period were
negative However the sell signals correctly predict the market with highest
percentage of profitable trade to total trade of 80 in Bear-3 period Moreover
with less ability to predict market direction in Sideway-1 (4789) and Bull-1
(4905) periods sell signal generated profit to cut down the loss from unprofitable
trade which results in average profit to average loss ratio of more than one for
Sideway-1 (122) and Bull-1 (109) period Overall the result supports the sell
signals over buy signals before considering the transaction costs in the Indian
context
Table 7 Performance of MACD Trading Signal
Category
Buy Signal Performance Sell Signal Performance
SR APAL of
PT SR APAL
of
PT
Overall -0072 0897 47669 008 106 5414
Bear ndash 1 -0009 1110 46809 035 219 5763
Sideway ndash 1 -0166 0701 47328 004 122 4789
Bull ndash 1 -0002 0805 55294 002 109 4905
Bear ndash 2 -0133 0940 43119 035 115 6667
Bull ndash 2 -0020 0734 56410 -006 084 5000
Sideway ndash 2 -0031 1122 45181 024 108 6374
Bull ndash 3 -0112 0563 56250 013 100 5879
Bear ndash 3 -0154 0682 50000 057 108 8000
Bull ndash 4 -0185 0827 41791 015 116 5644
Note SR denotes the Sharpe Ratio APAL denotes the ratio of average profit to average loss
of PT denotes the percentage of profitable trade to total trading signal
Colombo Business Journal 11(1) 2020
42
Conclusion
This paper examines the profitability of RSI and MACD technical trading rules
in the Indian market across market cycles BSE Sensex data for the period from
February 2000 to May 2018 were collected from BSE data base and classified into
nine non-overlapping periods as Bull and Bear markets based on the index
movement The t-tests were applied to test the hypothesis that returns from technical
trading rules were not significantly different from the unconditional daily returns In
addition Sharpe ratio average profit to average loss ratio and percentage of
profitable trade to total trade signal were also employed to have a microscopic view
on technical trading rules
Results support the weak-form efficient theory as RSI failed to deliver the
positive returns even before deducting the transaction costs RSI buy and sell signal
returns were not significantly different from the unconditional intraday return In
terms of market timing RSI wrongly predict the market movement and delivered
the percentage of profitable trade to total trade less than 50 Moreover profitable
trades were insufficient to overcome the loss from unprofitable trade Hence buy
signal generated a negative average return and sell signal posted a low positive
average return before deducting transaction costs Therefore after deducting
transaction costs RSI may not leave any profit in the hands of traders
MACD sell signal produced significant positive returns compared to buy signal
and unconditional intraday return However as per Sharpe ratio MACD sell signal
failed to produce the return in line with risk taken Sharpe ratio of less than one
indicates that risk associated with the technical trading rule is more than the return
generated by RSI and MACD In addition even profitable MACD sell signal does
not help in market timing It makes money from higher average profit from
profitable trade than average loss from unprofitable trade However MACD does
not help to reduce the unprofitable trade Hence the study concludes that the trader
cannot earn abnormal return consistently with the help of RSI and MACD across
market cycle in the Indian context RSI and MACD are very old and yet still widely
used as technical tools in real time stock price prediction On the other hand latest
development in information technology and changes in legal systems may have
helped the market to absorb RSI and MACD signals in current price with no time
and cost However in order to empirically validate this assumption a future study
may be extended using a proxy for information technology development and its
impact on trading rules across industries and individual stocks in emerging markets
Muruganandan
43
Declaration of Conflict of Interest
The author declared no potential conflict of interest with respect to the research
authorship and publication of this article
Acknowledgement
I would like to thank anonymous reviewers for their valuable suggestions
References
Allen F amp Karjalainen R (1999) Using genetic algorithms to find technical
trading rules Journal of Financial Economics 51(2) 245ndash271
httpsdoiorg101016S0304-405X(98)00052-X
Almujamed H I Fifield S amp Power D (2013) An investigation of the role of
technical analysis in Kuwait Qualitative Research in Financial Markets 5(1)
43ndash64 httpsdoiorg10110817554171311308959
Anghel G D I (2015) Stock market efficiency and the MACD Evidence from
countries around the world Procedia Economics and Finance 32 1414ndash1431
httpsdoiorg101016S2212-5671(15)01518-X
Atanasova C V amp Hudson R S (2010) Technical trading rules and calendar
anomalies mdash Are they the same phenomena Economics Letters 106(2) 128ndash
130 httpsdoiorg101016jeconlet200911001
Balsara N J Chen G amp Zheng L (2007) The Chinese stock market An
examination of the random walk model and technical trading rules Quarterly
Journal of Business amp Economics 46(2) 43ndash63 httpswwwjstororgstable
40473435
Balsara N Chen J amp Zheng L (2009) Profiting from a contrarian application of
technical trading rules in the US stock market Journal of Asset Management
10(2) 97ndash123 httpsdoiorg101057jam200844
Brock W Lakonishok J amp LeBaron B (1992) Simple technical trading rules
and stochastic properties of stock returns The Journal of Finance 47(5) 1731ndash
1764 httpsdoiorg101111j1540-62611992tb04681x
Chang E J Lima E J A amp Tabak B M (2004) Testing for predictability in
emerging equity markets Emerging Markets Review 5(3) 295ndash316
httpsdoi101016jememar200403005
Chiang Y-C Ke M-C Liao T L amp Wang C D (2012) Are technical trading
strategies still profitable - Evidence from the Taiwan Stock Index Futures
Market Applied Financial Economics 22(12) 955ndash965 httpsdoiorg
101080096031072011631893
Chong T T-L amp Ng W-K (2008) Technical analysis and the London stock
exchange Testing the MACD and RSI rules using the FT30 Applied
Colombo Business Journal 11(1) 2020
44
Economics Letters 15(14) 1111ndash1114 httpsdoiorg10108013504850600
993598
Cohen G amp Cabiri E (2015) Can technical oscillators outperform the buy and
hold strategy Applied Economics 47(30) 3189ndash3197 httpsdoiorg101080
0003684620151013609
Efron B (1979) Bootstrap methods Another look at the Jackknife The Annals of
Statistics 7(1)1ndash26 httpsprojecteuclidorgeuclidaos 1176344552
Fama (1970) Efficient capital markets a review of theory and empirical work
Journal of Finance 25(2) 383-417 httpswwwjstororgstable2325486
Gencay R (1998) The predictability of security returns with simple technical
trading rules Journal of Empirical Finance 5(4) 347ndash359 httpsdoiorg
101016S0927-5398(97)00022-4
Gunasekarage A amp Power D M (2001) The profitability of moving average
trading rules in South Asian stock markets Emerging Markets Review 2(1)
17ndash33 httpsdoiorg101016S1566-0141(00)00017-0
Henderson C (2002) Currency strategy The practitionerrsquos guide to currency
investing hedging and forecasting John Willy amp Sons
Heng P amp Niblock S J (2014) Trading with tigers A technical analysis of
Southeast Asian stock index futures International Economic Journal 28(4)
679ndash692 httpsdoiorg101080101687372014928895
Hudson R Dempsey M amp Keasey K (1996) A note on weak form efficiency of
capital markets The application of simple technical trading rules to UK stock
prices- 1935-1994 Journal of Banking and Finance 20(6) 1121ndash1132
httpsdoiorg1010160378-4266(95)00043-7
Jensen M C amp Benington G A (1970) Random walk and technical theories
Some additional evidence Journal of Finance 25 469ndash482
httpswwwjstororgstable2325495
Krausz J Lee S-Y amp Nam K (2009) Profitability of nonlinear dynamics
under technical trading rules Evidence from Pacific basin stock markets
Emerging Markets Finance amp Trade 45(4) 13ndash35 httpsdoiorg102753
REE1540-496X450402
Khatua A (2016) An application of moving average convergence and divergence
(MACD) indicator on selected stocks listed on National Stock Exchange (NSE)
httpdxdoiorg102139ssrn2872665
Kulkarni A D amp More A (2014) An application of moving average convergence
divergence (MACD) indicator on selected stocks listed on Bombay Stock
Exchange (BSE) Oriental Journal of Computer Science and Technology 7(3)
396ndash400 httpwwwcomputerscijournalorgp=1500
Lokeshwarri S K (2017 April 07) The big story ndash Sit back go passive The Hindu
Business Line (Coimbatore Edition) p 2
Muruganandan
45
Marshall B R Cahan R H amp Cahan J M (2008) Does intraday technical
analysis in the US equity market have value Journal of Empirical Finance
15(2) 199ndash210 httpsdoiorg101016jjempfin200605003
Marshall B R Young M R amp Cahan R (2008) Are candlestick technical
trading strategies profitable in the Japanese equity market Review of
Quantitative Finance and Accounting 31(2) 191ndash207 httpsdoiorg101007
s11156-007-0068-1
Metghalchi M Chen C-P Hajilee M (2016) Moving average trading rules for
NASDAQ composite index Applied Finance Letters 5(2) 45ndash57
httpsdoiorg1024135aflv5i254
Metghalchi M amp Hayes L A Niroomand F (2019) A technical approach to
equity investing in emerging markets Review of Financial Economics 37(3)
389ndash403 httpsdoiorg101002rfe1041
McKenzie M D (2007) Technical trading rules in emerging market and the 1997
Asian currency crises Emerging Market Finance and Trade 43(4) 46ndash73
httpsdoiorg102753REE1540-496X430403
Ming-Ming L Balachandher K G amp Nor F M (2002) An examination of the
random walk model and technical trading rules in the Malaysian stock market
Quarterly Journal of Business amp Economics 41(1) 81ndash104
httpswwwjstororgstable40473346
Ming-Ming L amp Siok-Hwa L (2006) The profitability of the simple moving
averages and trading range breakout in the Asian stock markets Journal of
Asian Economics 17(1) 144ndash170 httpsdoiorg101016jasieco200512001
Mitra S K (2011) How rewarding is technical analysis in Indian stock market
Quantitative Finance 11(2) 287ndash297 httpsdoiorg101080
14697680903493581
Nazario R T F Silva J L amp Sobrero V A (2017) A literature review of
technical analysis on stock markets The Quarterly Review of Economics and
Finance 66 115ndash126 httpsdoiorg101016jqref201701014
Neftccedili S N (1991) Naiumlve trading rules in financial markets and Wiener-
Kolmogorov prediction theory A study of ldquotechnical analysisrdquo Journal of
Business 64(4) 549ndash571
Ni Y Day M-Y Huang P ampYu S-R (2020) The profitability of Bollinger
Bamps Evidence from the constituent stocks of Taiwan 50 Physica A Statistical
Mechanics and Its Applications Advance online publication httpsdoiorg
101016jphysa2020124144
Nor S M amp Wickremasinghe G (2014) The profitability of MACD and RSI
trading rules in the Australian stock market Investment Management and
Financial Innovation 11(4) 194ndash199
Colombo Business Journal 11(1) 2020
46
Rosillo R de La Fuente D amp Brugos J A L (2013) Technical analysis and the
Spanish stock market Testing the RSI and MACD momentum and stochastic
rule using Spanish market companies Applied Economics 45(12) 1541ndash1550
httpsdoiorg101080000368462011631894
Sehgal S amp Garhyan A (2002) Abnormal returns using technical returns The
Indian experience Finance India 16(1) 181ndash203
Sehgal S amp Gupta M (2007) Tests of technical analysis in India Vision The
Journal of Business Perspective 11(3) 11ndash23 httpsdoiorg101177
097226290701100303
Sobreiro V A da Costa T R C C Nazaacuterio R T F e Silva J L Moreira E
A Filho M C L Kimura H amp Zambrano J C A (2016) The profitability
of moving average trading rules in BRICS and emerging stock markets North
American Journal of Economics and Finance 38 86ndash101 httpsdoiorg
101016jnajef201608003
Tian G G Wan G H amp Guo M (2002) Market efficiency and the returns to
simple technical trading rules New evidence from US equity market and
Chinese equity markets Asia-Pacific Financial Markets 9(3) 241ndash258
httpsdoiorg101023A1024181515265
Tharavanij P Siraprapasiri V amp Rajchamaha K (2015) Performance of
technical trading rules Evidence from Southeast Asian Stock Market
Springerplus 4552 httpsdoiorg101186s40064-015-1334-7
Wang J-L amp Chan S-H (2007) Stock market trading rule discovery using
pattern recognition and technical analysis Expert Systems with Applications
33(2) 304ndash315 httpsdoiorg101016jeswa200605002
Welles J Jr (1978) New concepts in technical trading systems Hunter Publishing
Company
Wong W-K Manzur M amp Chew B-K (2003) How rewarding is technical
analysis Evidence from Singapore stock market Journal of Applied Financial
Economics 13(7) 543ndash551 httpsdoiorg1010800960310022000020906
Yu H Nartea G V Gan C amp Yao L J (2013) Predictive ability and
profitability of simple technical trading rules Recent evidence from Southeast
Asian stock markets International Review of Economics and Finance 25 356ndash
371 httpsdoiorg101016jiref201207016
Zhu H Jiang Z-Q Li S-P amp Zhou W-X (2015) Profitability of simple
technical trading rules of Chinese stock exchange indexes Physica A
Statistical Mechanics and Its Applications 439 75ndash84 httpsdoiorg101016
jphysa201507032

Muruganandan
39
Table 5 exhibits the results of Sharpe Ratio (SR) average profit to average loss
ratio (APAL) and percentage of profitable trade to total trading signals For the
overall study period and almost all sub-samples periods buy signal underperforms
the sell signal as per the modified Sharpe ratio The absolute value of average profit
to average loss more than one indicates that the average of profitable trade is more
than the average of unprofitable trade However percentage of profitable trade less
than 50 indicates that RSI generate a higher number of unprofitable trades than
profitable trade Hence average return on buy signal is negative for the overall
study period and for six out of nine sub-sample periods On the other hand RSI sell
signal generated the positive Sharpe ratio for overall period and five out of nine sub-
sample periods Profitable trade to total trade signal indicates sell signal produced
more profitable trade in all sub-sample period except Bull-1 and Sidway-1 market
Though percentage of profitable trade to total trade for overall period is less than
50 (ie 4888) which indicate that the number of unprofitable trades is higher
than the profitable trades the profit per profitable trade is sufficiently enough to
compensate the loss in unprofitable trade The sell signal trading strategy makes
money not only from correctly predicting the market movement but also minimising
the loss quickly and allows the profit to run
The Table 6 exhibits the statistical results for the MACD trading rules During
the study period MACD generated 1522 sell signals and 858 buy signals with the
average return of 000861 and -000128 respectively The standard deviations of buy
signal returns (00179) and sell signal returns (001068) are also presented along
with mean return difference between buy and sell signals (-00021) Buy signal
produced the average negative return for all the sub-sample periods and they were
also not significantly different from the average unconditional mean return Hence
the null hypothesis was accepted and it can be concluded that buy signal produced a
return similar to that of unconditional intraday return However the sell signal
generated positive average return for the overall period and all sub-sample periods
except Bull-2 period In contrast the sell signal returns were significantly different
for the overall period and five out of nine sub-sample periods
Table 6 Statistical Results for MACD Trading Rule
Category NB NS microB microS σB σS microB -microS
Overall 858 1522
-000128
(-142)
[0170]
0000861
(443)
[0002]
0017908 0010686
-000215
(-3203)
[0008]
Colombo Business Journal 11(1) 2020
40
Category NB NS microB microS σB σS microB -microS
Bear ndash 1 141 59
-000021
(0494)
[0631]
0006379
(317)
[0002]
0023008 0018028
-000659
(-2165)
[0036]
Sideway ndash 1 131 71
-000226
(-1524)
[0142]
0000543
(0623)
[0509]
0013614 001285
-000281
(-1452)
[0162]
Bull ndash 1 85 581
-000004
(0043)
[0962]
0000196
(0703)
[0483]
0023623 0011
-000023
(-0090)
[0908]
Bear ndash 2 109 33
-000350
(-0989)
[0337]
0004699
(231)
[0036]
0026444 0013532
-00082
(-2371)
[002]
Bull ndash 2 39 192
-000031
(-0224)
[0816]
-000085
(-1066)
[0311]
0015615 0013721
0000532
(0198)
[0838]
Sideway ndash 2 166 171
-000035
(0171)
[0852]
000195
(375)
[0002]
0011182 0008263
-00023
(-2141)
[0032]
Bull ndash 3 32 165
-000171
(-0514)
[0591]
0000902
(220)
[0028]
0015215 0006737
-000261
(-0952)
[0291]
Bear ndash 3 88 25
-000146
(-0457)
[0643]
0004442
(341)
[0002]
0009516 0007832
-000591
(-3164)
[0004]
Bull ndash 4 67 225
-000205
(-1306)
[0188]
0000871
(2905)
[0008]
0011064 0005643
-000292
(-2080)
[004]
Notes 1 NB and NS denote the number of buy and sell signals during the period respectively microB
and microS denote the average return of buy and sell signals respectively σB and σS denote the
standard deviation of buy and sell signal returns respectively
2 Numbers in parenthesis are t-values and numbers in square brackets are the bootstrap p
values
3 denotes p lt 05
The risk measured by standard deviation is higher in buy signal than sell signal
trading rules for the entire study period and for all the sub-sample periods This
clearly indicates that the trading on buy signal is riskier than the sell signal
Moreover the sell signal average returns were significantly different from the
Muruganandan
41
average buy signal returns in all the Bear market periods and for the overall study
period This result supports the sell signal over buy signal specifically during the
Bear market phases This result sharply contradicts to Tharavanij et al (2015) who
found buy signals outperform the sell signals in Southeast Asian markets
Sharpe ratio average profit to average loss ratio and percentage of profitable
trade to total trade signal for MACD trading rule are presented in Table 7 For the
buy signals percentage of profitable trade to total trade has more than 50 in four
out of nine sub-sample periods but average profit to average loss is less than one
which implies that the profit from correctly predicting market direction is not
sufficient enough to cut down the loss from the failure to predict market direction
Hence Sharpe ratios for all sub-sample periods and the entire study period were
negative However the sell signals correctly predict the market with highest
percentage of profitable trade to total trade of 80 in Bear-3 period Moreover
with less ability to predict market direction in Sideway-1 (4789) and Bull-1
(4905) periods sell signal generated profit to cut down the loss from unprofitable
trade which results in average profit to average loss ratio of more than one for
Sideway-1 (122) and Bull-1 (109) period Overall the result supports the sell
signals over buy signals before considering the transaction costs in the Indian
context
Table 7 Performance of MACD Trading Signal
Category
Buy Signal Performance Sell Signal Performance
SR APAL of
PT SR APAL
of
PT
Overall -0072 0897 47669 008 106 5414
Bear ndash 1 -0009 1110 46809 035 219 5763
Sideway ndash 1 -0166 0701 47328 004 122 4789
Bull ndash 1 -0002 0805 55294 002 109 4905
Bear ndash 2 -0133 0940 43119 035 115 6667
Bull ndash 2 -0020 0734 56410 -006 084 5000
Sideway ndash 2 -0031 1122 45181 024 108 6374
Bull ndash 3 -0112 0563 56250 013 100 5879
Bear ndash 3 -0154 0682 50000 057 108 8000
Bull ndash 4 -0185 0827 41791 015 116 5644
Note SR denotes the Sharpe Ratio APAL denotes the ratio of average profit to average loss
of PT denotes the percentage of profitable trade to total trading signal
Colombo Business Journal 11(1) 2020
42
Conclusion
This paper examines the profitability of RSI and MACD technical trading rules
in the Indian market across market cycles BSE Sensex data for the period from
February 2000 to May 2018 were collected from BSE data base and classified into
nine non-overlapping periods as Bull and Bear markets based on the index
movement The t-tests were applied to test the hypothesis that returns from technical
trading rules were not significantly different from the unconditional daily returns In
addition Sharpe ratio average profit to average loss ratio and percentage of
profitable trade to total trade signal were also employed to have a microscopic view
on technical trading rules
Results support the weak-form efficient theory as RSI failed to deliver the
positive returns even before deducting the transaction costs RSI buy and sell signal
returns were not significantly different from the unconditional intraday return In
terms of market timing RSI wrongly predict the market movement and delivered
the percentage of profitable trade to total trade less than 50 Moreover profitable
trades were insufficient to overcome the loss from unprofitable trade Hence buy
signal generated a negative average return and sell signal posted a low positive
average return before deducting transaction costs Therefore after deducting
transaction costs RSI may not leave any profit in the hands of traders
MACD sell signal produced significant positive returns compared to buy signal
and unconditional intraday return However as per Sharpe ratio MACD sell signal
failed to produce the return in line with risk taken Sharpe ratio of less than one
indicates that risk associated with the technical trading rule is more than the return
generated by RSI and MACD In addition even profitable MACD sell signal does
not help in market timing It makes money from higher average profit from
profitable trade than average loss from unprofitable trade However MACD does
not help to reduce the unprofitable trade Hence the study concludes that the trader
cannot earn abnormal return consistently with the help of RSI and MACD across
market cycle in the Indian context RSI and MACD are very old and yet still widely
used as technical tools in real time stock price prediction On the other hand latest
development in information technology and changes in legal systems may have
helped the market to absorb RSI and MACD signals in current price with no time
and cost However in order to empirically validate this assumption a future study
may be extended using a proxy for information technology development and its
impact on trading rules across industries and individual stocks in emerging markets
Muruganandan
43
Declaration of Conflict of Interest
The author declared no potential conflict of interest with respect to the research
authorship and publication of this article
Acknowledgement
I would like to thank anonymous reviewers for their valuable suggestions
References
Allen F amp Karjalainen R (1999) Using genetic algorithms to find technical
trading rules Journal of Financial Economics 51(2) 245ndash271
httpsdoiorg101016S0304-405X(98)00052-X
Almujamed H I Fifield S amp Power D (2013) An investigation of the role of
technical analysis in Kuwait Qualitative Research in Financial Markets 5(1)
43ndash64 httpsdoiorg10110817554171311308959
Anghel G D I (2015) Stock market efficiency and the MACD Evidence from
countries around the world Procedia Economics and Finance 32 1414ndash1431
httpsdoiorg101016S2212-5671(15)01518-X
Atanasova C V amp Hudson R S (2010) Technical trading rules and calendar
anomalies mdash Are they the same phenomena Economics Letters 106(2) 128ndash
130 httpsdoiorg101016jeconlet200911001
Balsara N J Chen G amp Zheng L (2007) The Chinese stock market An
examination of the random walk model and technical trading rules Quarterly
Journal of Business amp Economics 46(2) 43ndash63 httpswwwjstororgstable
40473435
Balsara N Chen J amp Zheng L (2009) Profiting from a contrarian application of
technical trading rules in the US stock market Journal of Asset Management
10(2) 97ndash123 httpsdoiorg101057jam200844
Brock W Lakonishok J amp LeBaron B (1992) Simple technical trading rules
and stochastic properties of stock returns The Journal of Finance 47(5) 1731ndash
1764 httpsdoiorg101111j1540-62611992tb04681x
Chang E J Lima E J A amp Tabak B M (2004) Testing for predictability in
emerging equity markets Emerging Markets Review 5(3) 295ndash316
httpsdoi101016jememar200403005
Chiang Y-C Ke M-C Liao T L amp Wang C D (2012) Are technical trading
strategies still profitable - Evidence from the Taiwan Stock Index Futures
Market Applied Financial Economics 22(12) 955ndash965 httpsdoiorg
101080096031072011631893
Chong T T-L amp Ng W-K (2008) Technical analysis and the London stock
exchange Testing the MACD and RSI rules using the FT30 Applied
Colombo Business Journal 11(1) 2020
44
Economics Letters 15(14) 1111ndash1114 httpsdoiorg10108013504850600
993598
Cohen G amp Cabiri E (2015) Can technical oscillators outperform the buy and
hold strategy Applied Economics 47(30) 3189ndash3197 httpsdoiorg101080
0003684620151013609
Efron B (1979) Bootstrap methods Another look at the Jackknife The Annals of
Statistics 7(1)1ndash26 httpsprojecteuclidorgeuclidaos 1176344552
Fama (1970) Efficient capital markets a review of theory and empirical work
Journal of Finance 25(2) 383-417 httpswwwjstororgstable2325486
Gencay R (1998) The predictability of security returns with simple technical
trading rules Journal of Empirical Finance 5(4) 347ndash359 httpsdoiorg
101016S0927-5398(97)00022-4
Gunasekarage A amp Power D M (2001) The profitability of moving average
trading rules in South Asian stock markets Emerging Markets Review 2(1)
17ndash33 httpsdoiorg101016S1566-0141(00)00017-0
Henderson C (2002) Currency strategy The practitionerrsquos guide to currency
investing hedging and forecasting John Willy amp Sons
Heng P amp Niblock S J (2014) Trading with tigers A technical analysis of
Southeast Asian stock index futures International Economic Journal 28(4)
679ndash692 httpsdoiorg101080101687372014928895
Hudson R Dempsey M amp Keasey K (1996) A note on weak form efficiency of
capital markets The application of simple technical trading rules to UK stock
prices- 1935-1994 Journal of Banking and Finance 20(6) 1121ndash1132
httpsdoiorg1010160378-4266(95)00043-7
Jensen M C amp Benington G A (1970) Random walk and technical theories
Some additional evidence Journal of Finance 25 469ndash482
httpswwwjstororgstable2325495
Krausz J Lee S-Y amp Nam K (2009) Profitability of nonlinear dynamics
under technical trading rules Evidence from Pacific basin stock markets
Emerging Markets Finance amp Trade 45(4) 13ndash35 httpsdoiorg102753
REE1540-496X450402
Khatua A (2016) An application of moving average convergence and divergence
(MACD) indicator on selected stocks listed on National Stock Exchange (NSE)
httpdxdoiorg102139ssrn2872665
Kulkarni A D amp More A (2014) An application of moving average convergence
divergence (MACD) indicator on selected stocks listed on Bombay Stock
Exchange (BSE) Oriental Journal of Computer Science and Technology 7(3)
396ndash400 httpwwwcomputerscijournalorgp=1500
Lokeshwarri S K (2017 April 07) The big story ndash Sit back go passive The Hindu
Business Line (Coimbatore Edition) p 2
Muruganandan
45
Marshall B R Cahan R H amp Cahan J M (2008) Does intraday technical
analysis in the US equity market have value Journal of Empirical Finance
15(2) 199ndash210 httpsdoiorg101016jjempfin200605003
Marshall B R Young M R amp Cahan R (2008) Are candlestick technical
trading strategies profitable in the Japanese equity market Review of
Quantitative Finance and Accounting 31(2) 191ndash207 httpsdoiorg101007
s11156-007-0068-1
Metghalchi M Chen C-P Hajilee M (2016) Moving average trading rules for
NASDAQ composite index Applied Finance Letters 5(2) 45ndash57
httpsdoiorg1024135aflv5i254
Metghalchi M amp Hayes L A Niroomand F (2019) A technical approach to
equity investing in emerging markets Review of Financial Economics 37(3)
389ndash403 httpsdoiorg101002rfe1041
McKenzie M D (2007) Technical trading rules in emerging market and the 1997
Asian currency crises Emerging Market Finance and Trade 43(4) 46ndash73
httpsdoiorg102753REE1540-496X430403
Ming-Ming L Balachandher K G amp Nor F M (2002) An examination of the
random walk model and technical trading rules in the Malaysian stock market
Quarterly Journal of Business amp Economics 41(1) 81ndash104
httpswwwjstororgstable40473346
Ming-Ming L amp Siok-Hwa L (2006) The profitability of the simple moving
averages and trading range breakout in the Asian stock markets Journal of
Asian Economics 17(1) 144ndash170 httpsdoiorg101016jasieco200512001
Mitra S K (2011) How rewarding is technical analysis in Indian stock market
Quantitative Finance 11(2) 287ndash297 httpsdoiorg101080
14697680903493581
Nazario R T F Silva J L amp Sobrero V A (2017) A literature review of
technical analysis on stock markets The Quarterly Review of Economics and
Finance 66 115ndash126 httpsdoiorg101016jqref201701014
Neftccedili S N (1991) Naiumlve trading rules in financial markets and Wiener-
Kolmogorov prediction theory A study of ldquotechnical analysisrdquo Journal of
Business 64(4) 549ndash571
Ni Y Day M-Y Huang P ampYu S-R (2020) The profitability of Bollinger
Bamps Evidence from the constituent stocks of Taiwan 50 Physica A Statistical
Mechanics and Its Applications Advance online publication httpsdoiorg
101016jphysa2020124144
Nor S M amp Wickremasinghe G (2014) The profitability of MACD and RSI
trading rules in the Australian stock market Investment Management and
Financial Innovation 11(4) 194ndash199
Colombo Business Journal 11(1) 2020
46
Rosillo R de La Fuente D amp Brugos J A L (2013) Technical analysis and the
Spanish stock market Testing the RSI and MACD momentum and stochastic
rule using Spanish market companies Applied Economics 45(12) 1541ndash1550
httpsdoiorg101080000368462011631894
Sehgal S amp Garhyan A (2002) Abnormal returns using technical returns The
Indian experience Finance India 16(1) 181ndash203
Sehgal S amp Gupta M (2007) Tests of technical analysis in India Vision The
Journal of Business Perspective 11(3) 11ndash23 httpsdoiorg101177
097226290701100303
Sobreiro V A da Costa T R C C Nazaacuterio R T F e Silva J L Moreira E
A Filho M C L Kimura H amp Zambrano J C A (2016) The profitability
of moving average trading rules in BRICS and emerging stock markets North
American Journal of Economics and Finance 38 86ndash101 httpsdoiorg
101016jnajef201608003
Tian G G Wan G H amp Guo M (2002) Market efficiency and the returns to
simple technical trading rules New evidence from US equity market and
Chinese equity markets Asia-Pacific Financial Markets 9(3) 241ndash258
httpsdoiorg101023A1024181515265
Tharavanij P Siraprapasiri V amp Rajchamaha K (2015) Performance of
technical trading rules Evidence from Southeast Asian Stock Market
Springerplus 4552 httpsdoiorg101186s40064-015-1334-7
Wang J-L amp Chan S-H (2007) Stock market trading rule discovery using
pattern recognition and technical analysis Expert Systems with Applications
33(2) 304ndash315 httpsdoiorg101016jeswa200605002
Welles J Jr (1978) New concepts in technical trading systems Hunter Publishing
Company
Wong W-K Manzur M amp Chew B-K (2003) How rewarding is technical
analysis Evidence from Singapore stock market Journal of Applied Financial
Economics 13(7) 543ndash551 httpsdoiorg1010800960310022000020906
Yu H Nartea G V Gan C amp Yao L J (2013) Predictive ability and
profitability of simple technical trading rules Recent evidence from Southeast
Asian stock markets International Review of Economics and Finance 25 356ndash
371 httpsdoiorg101016jiref201207016
Zhu H Jiang Z-Q Li S-P amp Zhou W-X (2015) Profitability of simple
technical trading rules of Chinese stock exchange indexes Physica A
Statistical Mechanics and Its Applications 439 75ndash84 httpsdoiorg101016
jphysa201507032
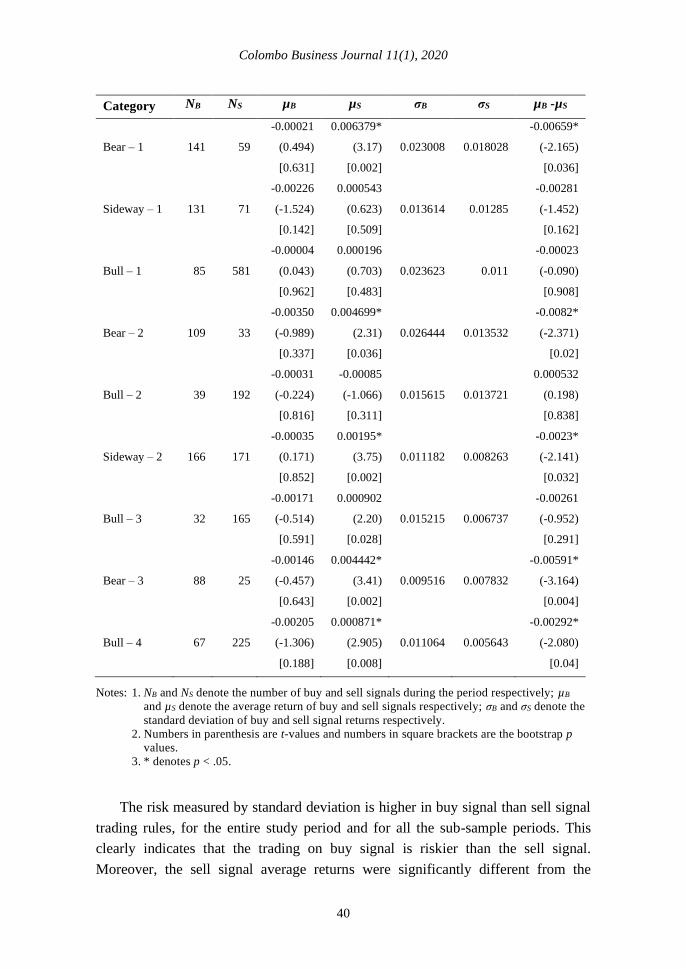
Colombo Business Journal 11(1) 2020
40
Category NB NS microB microS σB σS microB -microS
Bear ndash 1 141 59
-000021
(0494)
[0631]
0006379
(317)
[0002]
0023008 0018028
-000659
(-2165)
[0036]
Sideway ndash 1 131 71
-000226
(-1524)
[0142]
0000543
(0623)
[0509]
0013614 001285
-000281
(-1452)
[0162]
Bull ndash 1 85 581
-000004
(0043)
[0962]
0000196
(0703)
[0483]
0023623 0011
-000023
(-0090)
[0908]
Bear ndash 2 109 33
-000350
(-0989)
[0337]
0004699
(231)
[0036]
0026444 0013532
-00082
(-2371)
[002]
Bull ndash 2 39 192
-000031
(-0224)
[0816]
-000085
(-1066)
[0311]
0015615 0013721
0000532
(0198)
[0838]
Sideway ndash 2 166 171
-000035
(0171)
[0852]
000195
(375)
[0002]
0011182 0008263
-00023
(-2141)
[0032]
Bull ndash 3 32 165
-000171
(-0514)
[0591]
0000902
(220)
[0028]
0015215 0006737
-000261
(-0952)
[0291]
Bear ndash 3 88 25
-000146
(-0457)
[0643]
0004442
(341)
[0002]
0009516 0007832
-000591
(-3164)
[0004]
Bull ndash 4 67 225
-000205
(-1306)
[0188]
0000871
(2905)
[0008]
0011064 0005643
-000292
(-2080)
[004]
Notes 1 NB and NS denote the number of buy and sell signals during the period respectively microB
and microS denote the average return of buy and sell signals respectively σB and σS denote the
standard deviation of buy and sell signal returns respectively
2 Numbers in parenthesis are t-values and numbers in square brackets are the bootstrap p
values
3 denotes p lt 05
The risk measured by standard deviation is higher in buy signal than sell signal
trading rules for the entire study period and for all the sub-sample periods This
clearly indicates that the trading on buy signal is riskier than the sell signal
Moreover the sell signal average returns were significantly different from the
Muruganandan
41
average buy signal returns in all the Bear market periods and for the overall study
period This result supports the sell signal over buy signal specifically during the
Bear market phases This result sharply contradicts to Tharavanij et al (2015) who
found buy signals outperform the sell signals in Southeast Asian markets
Sharpe ratio average profit to average loss ratio and percentage of profitable
trade to total trade signal for MACD trading rule are presented in Table 7 For the
buy signals percentage of profitable trade to total trade has more than 50 in four
out of nine sub-sample periods but average profit to average loss is less than one
which implies that the profit from correctly predicting market direction is not
sufficient enough to cut down the loss from the failure to predict market direction
Hence Sharpe ratios for all sub-sample periods and the entire study period were
negative However the sell signals correctly predict the market with highest
percentage of profitable trade to total trade of 80 in Bear-3 period Moreover
with less ability to predict market direction in Sideway-1 (4789) and Bull-1
(4905) periods sell signal generated profit to cut down the loss from unprofitable
trade which results in average profit to average loss ratio of more than one for
Sideway-1 (122) and Bull-1 (109) period Overall the result supports the sell
signals over buy signals before considering the transaction costs in the Indian
context
Table 7 Performance of MACD Trading Signal
Category
Buy Signal Performance Sell Signal Performance
SR APAL of
PT SR APAL
of
PT
Overall -0072 0897 47669 008 106 5414
Bear ndash 1 -0009 1110 46809 035 219 5763
Sideway ndash 1 -0166 0701 47328 004 122 4789
Bull ndash 1 -0002 0805 55294 002 109 4905
Bear ndash 2 -0133 0940 43119 035 115 6667
Bull ndash 2 -0020 0734 56410 -006 084 5000
Sideway ndash 2 -0031 1122 45181 024 108 6374
Bull ndash 3 -0112 0563 56250 013 100 5879
Bear ndash 3 -0154 0682 50000 057 108 8000
Bull ndash 4 -0185 0827 41791 015 116 5644
Note SR denotes the Sharpe Ratio APAL denotes the ratio of average profit to average loss
of PT denotes the percentage of profitable trade to total trading signal
Colombo Business Journal 11(1) 2020
42
Conclusion
This paper examines the profitability of RSI and MACD technical trading rules
in the Indian market across market cycles BSE Sensex data for the period from
February 2000 to May 2018 were collected from BSE data base and classified into
nine non-overlapping periods as Bull and Bear markets based on the index
movement The t-tests were applied to test the hypothesis that returns from technical
trading rules were not significantly different from the unconditional daily returns In
addition Sharpe ratio average profit to average loss ratio and percentage of
profitable trade to total trade signal were also employed to have a microscopic view
on technical trading rules
Results support the weak-form efficient theory as RSI failed to deliver the
positive returns even before deducting the transaction costs RSI buy and sell signal
returns were not significantly different from the unconditional intraday return In
terms of market timing RSI wrongly predict the market movement and delivered
the percentage of profitable trade to total trade less than 50 Moreover profitable
trades were insufficient to overcome the loss from unprofitable trade Hence buy
signal generated a negative average return and sell signal posted a low positive
average return before deducting transaction costs Therefore after deducting
transaction costs RSI may not leave any profit in the hands of traders
MACD sell signal produced significant positive returns compared to buy signal
and unconditional intraday return However as per Sharpe ratio MACD sell signal
failed to produce the return in line with risk taken Sharpe ratio of less than one
indicates that risk associated with the technical trading rule is more than the return
generated by RSI and MACD In addition even profitable MACD sell signal does
not help in market timing It makes money from higher average profit from
profitable trade than average loss from unprofitable trade However MACD does
not help to reduce the unprofitable trade Hence the study concludes that the trader
cannot earn abnormal return consistently with the help of RSI and MACD across
market cycle in the Indian context RSI and MACD are very old and yet still widely
used as technical tools in real time stock price prediction On the other hand latest
development in information technology and changes in legal systems may have
helped the market to absorb RSI and MACD signals in current price with no time
and cost However in order to empirically validate this assumption a future study
may be extended using a proxy for information technology development and its
impact on trading rules across industries and individual stocks in emerging markets
Muruganandan
43
Declaration of Conflict of Interest
The author declared no potential conflict of interest with respect to the research
authorship and publication of this article
Acknowledgement
I would like to thank anonymous reviewers for their valuable suggestions
References
Allen F amp Karjalainen R (1999) Using genetic algorithms to find technical
trading rules Journal of Financial Economics 51(2) 245ndash271
httpsdoiorg101016S0304-405X(98)00052-X
Almujamed H I Fifield S amp Power D (2013) An investigation of the role of
technical analysis in Kuwait Qualitative Research in Financial Markets 5(1)
43ndash64 httpsdoiorg10110817554171311308959
Anghel G D I (2015) Stock market efficiency and the MACD Evidence from
countries around the world Procedia Economics and Finance 32 1414ndash1431
httpsdoiorg101016S2212-5671(15)01518-X
Atanasova C V amp Hudson R S (2010) Technical trading rules and calendar
anomalies mdash Are they the same phenomena Economics Letters 106(2) 128ndash
130 httpsdoiorg101016jeconlet200911001
Balsara N J Chen G amp Zheng L (2007) The Chinese stock market An
examination of the random walk model and technical trading rules Quarterly
Journal of Business amp Economics 46(2) 43ndash63 httpswwwjstororgstable
40473435
Balsara N Chen J amp Zheng L (2009) Profiting from a contrarian application of
technical trading rules in the US stock market Journal of Asset Management
10(2) 97ndash123 httpsdoiorg101057jam200844
Brock W Lakonishok J amp LeBaron B (1992) Simple technical trading rules
and stochastic properties of stock returns The Journal of Finance 47(5) 1731ndash
1764 httpsdoiorg101111j1540-62611992tb04681x
Chang E J Lima E J A amp Tabak B M (2004) Testing for predictability in
emerging equity markets Emerging Markets Review 5(3) 295ndash316
httpsdoi101016jememar200403005
Chiang Y-C Ke M-C Liao T L amp Wang C D (2012) Are technical trading
strategies still profitable - Evidence from the Taiwan Stock Index Futures
Market Applied Financial Economics 22(12) 955ndash965 httpsdoiorg
101080096031072011631893
Chong T T-L amp Ng W-K (2008) Technical analysis and the London stock
exchange Testing the MACD and RSI rules using the FT30 Applied
Colombo Business Journal 11(1) 2020
44
Economics Letters 15(14) 1111ndash1114 httpsdoiorg10108013504850600
993598
Cohen G amp Cabiri E (2015) Can technical oscillators outperform the buy and
hold strategy Applied Economics 47(30) 3189ndash3197 httpsdoiorg101080
0003684620151013609
Efron B (1979) Bootstrap methods Another look at the Jackknife The Annals of
Statistics 7(1)1ndash26 httpsprojecteuclidorgeuclidaos 1176344552
Fama (1970) Efficient capital markets a review of theory and empirical work
Journal of Finance 25(2) 383-417 httpswwwjstororgstable2325486
Gencay R (1998) The predictability of security returns with simple technical
trading rules Journal of Empirical Finance 5(4) 347ndash359 httpsdoiorg
101016S0927-5398(97)00022-4
Gunasekarage A amp Power D M (2001) The profitability of moving average
trading rules in South Asian stock markets Emerging Markets Review 2(1)
17ndash33 httpsdoiorg101016S1566-0141(00)00017-0
Henderson C (2002) Currency strategy The practitionerrsquos guide to currency
investing hedging and forecasting John Willy amp Sons
Heng P amp Niblock S J (2014) Trading with tigers A technical analysis of
Southeast Asian stock index futures International Economic Journal 28(4)
679ndash692 httpsdoiorg101080101687372014928895
Hudson R Dempsey M amp Keasey K (1996) A note on weak form efficiency of
capital markets The application of simple technical trading rules to UK stock
prices- 1935-1994 Journal of Banking and Finance 20(6) 1121ndash1132
httpsdoiorg1010160378-4266(95)00043-7
Jensen M C amp Benington G A (1970) Random walk and technical theories
Some additional evidence Journal of Finance 25 469ndash482
httpswwwjstororgstable2325495
Krausz J Lee S-Y amp Nam K (2009) Profitability of nonlinear dynamics
under technical trading rules Evidence from Pacific basin stock markets
Emerging Markets Finance amp Trade 45(4) 13ndash35 httpsdoiorg102753
REE1540-496X450402
Khatua A (2016) An application of moving average convergence and divergence
(MACD) indicator on selected stocks listed on National Stock Exchange (NSE)
httpdxdoiorg102139ssrn2872665
Kulkarni A D amp More A (2014) An application of moving average convergence
divergence (MACD) indicator on selected stocks listed on Bombay Stock
Exchange (BSE) Oriental Journal of Computer Science and Technology 7(3)
396ndash400 httpwwwcomputerscijournalorgp=1500
Lokeshwarri S K (2017 April 07) The big story ndash Sit back go passive The Hindu
Business Line (Coimbatore Edition) p 2
Muruganandan
45
Marshall B R Cahan R H amp Cahan J M (2008) Does intraday technical
analysis in the US equity market have value Journal of Empirical Finance
15(2) 199ndash210 httpsdoiorg101016jjempfin200605003
Marshall B R Young M R amp Cahan R (2008) Are candlestick technical
trading strategies profitable in the Japanese equity market Review of
Quantitative Finance and Accounting 31(2) 191ndash207 httpsdoiorg101007
s11156-007-0068-1
Metghalchi M Chen C-P Hajilee M (2016) Moving average trading rules for
NASDAQ composite index Applied Finance Letters 5(2) 45ndash57
httpsdoiorg1024135aflv5i254
Metghalchi M amp Hayes L A Niroomand F (2019) A technical approach to
equity investing in emerging markets Review of Financial Economics 37(3)
389ndash403 httpsdoiorg101002rfe1041
McKenzie M D (2007) Technical trading rules in emerging market and the 1997
Asian currency crises Emerging Market Finance and Trade 43(4) 46ndash73
httpsdoiorg102753REE1540-496X430403
Ming-Ming L Balachandher K G amp Nor F M (2002) An examination of the
random walk model and technical trading rules in the Malaysian stock market
Quarterly Journal of Business amp Economics 41(1) 81ndash104
httpswwwjstororgstable40473346
Ming-Ming L amp Siok-Hwa L (2006) The profitability of the simple moving
averages and trading range breakout in the Asian stock markets Journal of
Asian Economics 17(1) 144ndash170 httpsdoiorg101016jasieco200512001
Mitra S K (2011) How rewarding is technical analysis in Indian stock market
Quantitative Finance 11(2) 287ndash297 httpsdoiorg101080
14697680903493581
Nazario R T F Silva J L amp Sobrero V A (2017) A literature review of
technical analysis on stock markets The Quarterly Review of Economics and
Finance 66 115ndash126 httpsdoiorg101016jqref201701014
Neftccedili S N (1991) Naiumlve trading rules in financial markets and Wiener-
Kolmogorov prediction theory A study of ldquotechnical analysisrdquo Journal of
Business 64(4) 549ndash571
Ni Y Day M-Y Huang P ampYu S-R (2020) The profitability of Bollinger
Bamps Evidence from the constituent stocks of Taiwan 50 Physica A Statistical
Mechanics and Its Applications Advance online publication httpsdoiorg
101016jphysa2020124144
Nor S M amp Wickremasinghe G (2014) The profitability of MACD and RSI
trading rules in the Australian stock market Investment Management and
Financial Innovation 11(4) 194ndash199
Colombo Business Journal 11(1) 2020
46
Rosillo R de La Fuente D amp Brugos J A L (2013) Technical analysis and the
Spanish stock market Testing the RSI and MACD momentum and stochastic
rule using Spanish market companies Applied Economics 45(12) 1541ndash1550
httpsdoiorg101080000368462011631894
Sehgal S amp Garhyan A (2002) Abnormal returns using technical returns The
Indian experience Finance India 16(1) 181ndash203
Sehgal S amp Gupta M (2007) Tests of technical analysis in India Vision The
Journal of Business Perspective 11(3) 11ndash23 httpsdoiorg101177
097226290701100303
Sobreiro V A da Costa T R C C Nazaacuterio R T F e Silva J L Moreira E
A Filho M C L Kimura H amp Zambrano J C A (2016) The profitability
of moving average trading rules in BRICS and emerging stock markets North
American Journal of Economics and Finance 38 86ndash101 httpsdoiorg
101016jnajef201608003
Tian G G Wan G H amp Guo M (2002) Market efficiency and the returns to
simple technical trading rules New evidence from US equity market and
Chinese equity markets Asia-Pacific Financial Markets 9(3) 241ndash258
httpsdoiorg101023A1024181515265
Tharavanij P Siraprapasiri V amp Rajchamaha K (2015) Performance of
technical trading rules Evidence from Southeast Asian Stock Market
Springerplus 4552 httpsdoiorg101186s40064-015-1334-7
Wang J-L amp Chan S-H (2007) Stock market trading rule discovery using
pattern recognition and technical analysis Expert Systems with Applications
33(2) 304ndash315 httpsdoiorg101016jeswa200605002
Welles J Jr (1978) New concepts in technical trading systems Hunter Publishing
Company
Wong W-K Manzur M amp Chew B-K (2003) How rewarding is technical
analysis Evidence from Singapore stock market Journal of Applied Financial
Economics 13(7) 543ndash551 httpsdoiorg1010800960310022000020906
Yu H Nartea G V Gan C amp Yao L J (2013) Predictive ability and
profitability of simple technical trading rules Recent evidence from Southeast
Asian stock markets International Review of Economics and Finance 25 356ndash
371 httpsdoiorg101016jiref201207016
Zhu H Jiang Z-Q Li S-P amp Zhou W-X (2015) Profitability of simple
technical trading rules of Chinese stock exchange indexes Physica A
Statistical Mechanics and Its Applications 439 75ndash84 httpsdoiorg101016
jphysa201507032

Muruganandan
41
average buy signal returns in all the Bear market periods and for the overall study
period This result supports the sell signal over buy signal specifically during the
Bear market phases This result sharply contradicts to Tharavanij et al (2015) who
found buy signals outperform the sell signals in Southeast Asian markets
Sharpe ratio average profit to average loss ratio and percentage of profitable
trade to total trade signal for MACD trading rule are presented in Table 7 For the
buy signals percentage of profitable trade to total trade has more than 50 in four
out of nine sub-sample periods but average profit to average loss is less than one
which implies that the profit from correctly predicting market direction is not
sufficient enough to cut down the loss from the failure to predict market direction
Hence Sharpe ratios for all sub-sample periods and the entire study period were
negative However the sell signals correctly predict the market with highest
percentage of profitable trade to total trade of 80 in Bear-3 period Moreover
with less ability to predict market direction in Sideway-1 (4789) and Bull-1
(4905) periods sell signal generated profit to cut down the loss from unprofitable
trade which results in average profit to average loss ratio of more than one for
Sideway-1 (122) and Bull-1 (109) period Overall the result supports the sell
signals over buy signals before considering the transaction costs in the Indian
context
Table 7 Performance of MACD Trading Signal
Category
Buy Signal Performance Sell Signal Performance
SR APAL of
PT SR APAL
of
PT
Overall -0072 0897 47669 008 106 5414
Bear ndash 1 -0009 1110 46809 035 219 5763
Sideway ndash 1 -0166 0701 47328 004 122 4789
Bull ndash 1 -0002 0805 55294 002 109 4905
Bear ndash 2 -0133 0940 43119 035 115 6667
Bull ndash 2 -0020 0734 56410 -006 084 5000
Sideway ndash 2 -0031 1122 45181 024 108 6374
Bull ndash 3 -0112 0563 56250 013 100 5879
Bear ndash 3 -0154 0682 50000 057 108 8000
Bull ndash 4 -0185 0827 41791 015 116 5644
Note SR denotes the Sharpe Ratio APAL denotes the ratio of average profit to average loss
of PT denotes the percentage of profitable trade to total trading signal
Colombo Business Journal 11(1) 2020
42
Conclusion
This paper examines the profitability of RSI and MACD technical trading rules
in the Indian market across market cycles BSE Sensex data for the period from
February 2000 to May 2018 were collected from BSE data base and classified into
nine non-overlapping periods as Bull and Bear markets based on the index
movement The t-tests were applied to test the hypothesis that returns from technical
trading rules were not significantly different from the unconditional daily returns In
addition Sharpe ratio average profit to average loss ratio and percentage of
profitable trade to total trade signal were also employed to have a microscopic view
on technical trading rules
Results support the weak-form efficient theory as RSI failed to deliver the
positive returns even before deducting the transaction costs RSI buy and sell signal
returns were not significantly different from the unconditional intraday return In
terms of market timing RSI wrongly predict the market movement and delivered
the percentage of profitable trade to total trade less than 50 Moreover profitable
trades were insufficient to overcome the loss from unprofitable trade Hence buy
signal generated a negative average return and sell signal posted a low positive
average return before deducting transaction costs Therefore after deducting
transaction costs RSI may not leave any profit in the hands of traders
MACD sell signal produced significant positive returns compared to buy signal
and unconditional intraday return However as per Sharpe ratio MACD sell signal
failed to produce the return in line with risk taken Sharpe ratio of less than one
indicates that risk associated with the technical trading rule is more than the return
generated by RSI and MACD In addition even profitable MACD sell signal does
not help in market timing It makes money from higher average profit from
profitable trade than average loss from unprofitable trade However MACD does
not help to reduce the unprofitable trade Hence the study concludes that the trader
cannot earn abnormal return consistently with the help of RSI and MACD across
market cycle in the Indian context RSI and MACD are very old and yet still widely
used as technical tools in real time stock price prediction On the other hand latest
development in information technology and changes in legal systems may have
helped the market to absorb RSI and MACD signals in current price with no time
and cost However in order to empirically validate this assumption a future study
may be extended using a proxy for information technology development and its
impact on trading rules across industries and individual stocks in emerging markets
Muruganandan
43
Declaration of Conflict of Interest
The author declared no potential conflict of interest with respect to the research
authorship and publication of this article
Acknowledgement
I would like to thank anonymous reviewers for their valuable suggestions
References
Allen F amp Karjalainen R (1999) Using genetic algorithms to find technical
trading rules Journal of Financial Economics 51(2) 245ndash271
httpsdoiorg101016S0304-405X(98)00052-X
Almujamed H I Fifield S amp Power D (2013) An investigation of the role of
technical analysis in Kuwait Qualitative Research in Financial Markets 5(1)
43ndash64 httpsdoiorg10110817554171311308959
Anghel G D I (2015) Stock market efficiency and the MACD Evidence from
countries around the world Procedia Economics and Finance 32 1414ndash1431
httpsdoiorg101016S2212-5671(15)01518-X
Atanasova C V amp Hudson R S (2010) Technical trading rules and calendar
anomalies mdash Are they the same phenomena Economics Letters 106(2) 128ndash
130 httpsdoiorg101016jeconlet200911001
Balsara N J Chen G amp Zheng L (2007) The Chinese stock market An
examination of the random walk model and technical trading rules Quarterly
Journal of Business amp Economics 46(2) 43ndash63 httpswwwjstororgstable
40473435
Balsara N Chen J amp Zheng L (2009) Profiting from a contrarian application of
technical trading rules in the US stock market Journal of Asset Management
10(2) 97ndash123 httpsdoiorg101057jam200844
Brock W Lakonishok J amp LeBaron B (1992) Simple technical trading rules
and stochastic properties of stock returns The Journal of Finance 47(5) 1731ndash
1764 httpsdoiorg101111j1540-62611992tb04681x
Chang E J Lima E J A amp Tabak B M (2004) Testing for predictability in
emerging equity markets Emerging Markets Review 5(3) 295ndash316
httpsdoi101016jememar200403005
Chiang Y-C Ke M-C Liao T L amp Wang C D (2012) Are technical trading
strategies still profitable - Evidence from the Taiwan Stock Index Futures
Market Applied Financial Economics 22(12) 955ndash965 httpsdoiorg
101080096031072011631893
Chong T T-L amp Ng W-K (2008) Technical analysis and the London stock
exchange Testing the MACD and RSI rules using the FT30 Applied
Colombo Business Journal 11(1) 2020
44
Economics Letters 15(14) 1111ndash1114 httpsdoiorg10108013504850600
993598
Cohen G amp Cabiri E (2015) Can technical oscillators outperform the buy and
hold strategy Applied Economics 47(30) 3189ndash3197 httpsdoiorg101080
0003684620151013609
Efron B (1979) Bootstrap methods Another look at the Jackknife The Annals of
Statistics 7(1)1ndash26 httpsprojecteuclidorgeuclidaos 1176344552
Fama (1970) Efficient capital markets a review of theory and empirical work
Journal of Finance 25(2) 383-417 httpswwwjstororgstable2325486
Gencay R (1998) The predictability of security returns with simple technical
trading rules Journal of Empirical Finance 5(4) 347ndash359 httpsdoiorg
101016S0927-5398(97)00022-4
Gunasekarage A amp Power D M (2001) The profitability of moving average
trading rules in South Asian stock markets Emerging Markets Review 2(1)
17ndash33 httpsdoiorg101016S1566-0141(00)00017-0
Henderson C (2002) Currency strategy The practitionerrsquos guide to currency
investing hedging and forecasting John Willy amp Sons
Heng P amp Niblock S J (2014) Trading with tigers A technical analysis of
Southeast Asian stock index futures International Economic Journal 28(4)
679ndash692 httpsdoiorg101080101687372014928895
Hudson R Dempsey M amp Keasey K (1996) A note on weak form efficiency of
capital markets The application of simple technical trading rules to UK stock
prices- 1935-1994 Journal of Banking and Finance 20(6) 1121ndash1132
httpsdoiorg1010160378-4266(95)00043-7
Jensen M C amp Benington G A (1970) Random walk and technical theories
Some additional evidence Journal of Finance 25 469ndash482
httpswwwjstororgstable2325495
Krausz J Lee S-Y amp Nam K (2009) Profitability of nonlinear dynamics
under technical trading rules Evidence from Pacific basin stock markets
Emerging Markets Finance amp Trade 45(4) 13ndash35 httpsdoiorg102753
REE1540-496X450402
Khatua A (2016) An application of moving average convergence and divergence
(MACD) indicator on selected stocks listed on National Stock Exchange (NSE)
httpdxdoiorg102139ssrn2872665
Kulkarni A D amp More A (2014) An application of moving average convergence
divergence (MACD) indicator on selected stocks listed on Bombay Stock
Exchange (BSE) Oriental Journal of Computer Science and Technology 7(3)
396ndash400 httpwwwcomputerscijournalorgp=1500
Lokeshwarri S K (2017 April 07) The big story ndash Sit back go passive The Hindu
Business Line (Coimbatore Edition) p 2
Muruganandan
45
Marshall B R Cahan R H amp Cahan J M (2008) Does intraday technical
analysis in the US equity market have value Journal of Empirical Finance
15(2) 199ndash210 httpsdoiorg101016jjempfin200605003
Marshall B R Young M R amp Cahan R (2008) Are candlestick technical
trading strategies profitable in the Japanese equity market Review of
Quantitative Finance and Accounting 31(2) 191ndash207 httpsdoiorg101007
s11156-007-0068-1
Metghalchi M Chen C-P Hajilee M (2016) Moving average trading rules for
NASDAQ composite index Applied Finance Letters 5(2) 45ndash57
httpsdoiorg1024135aflv5i254
Metghalchi M amp Hayes L A Niroomand F (2019) A technical approach to
equity investing in emerging markets Review of Financial Economics 37(3)
389ndash403 httpsdoiorg101002rfe1041
McKenzie M D (2007) Technical trading rules in emerging market and the 1997
Asian currency crises Emerging Market Finance and Trade 43(4) 46ndash73
httpsdoiorg102753REE1540-496X430403
Ming-Ming L Balachandher K G amp Nor F M (2002) An examination of the
random walk model and technical trading rules in the Malaysian stock market
Quarterly Journal of Business amp Economics 41(1) 81ndash104
httpswwwjstororgstable40473346
Ming-Ming L amp Siok-Hwa L (2006) The profitability of the simple moving
averages and trading range breakout in the Asian stock markets Journal of
Asian Economics 17(1) 144ndash170 httpsdoiorg101016jasieco200512001
Mitra S K (2011) How rewarding is technical analysis in Indian stock market
Quantitative Finance 11(2) 287ndash297 httpsdoiorg101080
14697680903493581
Nazario R T F Silva J L amp Sobrero V A (2017) A literature review of
technical analysis on stock markets The Quarterly Review of Economics and
Finance 66 115ndash126 httpsdoiorg101016jqref201701014
Neftccedili S N (1991) Naiumlve trading rules in financial markets and Wiener-
Kolmogorov prediction theory A study of ldquotechnical analysisrdquo Journal of
Business 64(4) 549ndash571
Ni Y Day M-Y Huang P ampYu S-R (2020) The profitability of Bollinger
Bamps Evidence from the constituent stocks of Taiwan 50 Physica A Statistical
Mechanics and Its Applications Advance online publication httpsdoiorg
101016jphysa2020124144
Nor S M amp Wickremasinghe G (2014) The profitability of MACD and RSI
trading rules in the Australian stock market Investment Management and
Financial Innovation 11(4) 194ndash199
Colombo Business Journal 11(1) 2020
46
Rosillo R de La Fuente D amp Brugos J A L (2013) Technical analysis and the
Spanish stock market Testing the RSI and MACD momentum and stochastic
rule using Spanish market companies Applied Economics 45(12) 1541ndash1550
httpsdoiorg101080000368462011631894
Sehgal S amp Garhyan A (2002) Abnormal returns using technical returns The
Indian experience Finance India 16(1) 181ndash203
Sehgal S amp Gupta M (2007) Tests of technical analysis in India Vision The
Journal of Business Perspective 11(3) 11ndash23 httpsdoiorg101177
097226290701100303
Sobreiro V A da Costa T R C C Nazaacuterio R T F e Silva J L Moreira E
A Filho M C L Kimura H amp Zambrano J C A (2016) The profitability
of moving average trading rules in BRICS and emerging stock markets North
American Journal of Economics and Finance 38 86ndash101 httpsdoiorg
101016jnajef201608003
Tian G G Wan G H amp Guo M (2002) Market efficiency and the returns to
simple technical trading rules New evidence from US equity market and
Chinese equity markets Asia-Pacific Financial Markets 9(3) 241ndash258
httpsdoiorg101023A1024181515265
Tharavanij P Siraprapasiri V amp Rajchamaha K (2015) Performance of
technical trading rules Evidence from Southeast Asian Stock Market
Springerplus 4552 httpsdoiorg101186s40064-015-1334-7
Wang J-L amp Chan S-H (2007) Stock market trading rule discovery using
pattern recognition and technical analysis Expert Systems with Applications
33(2) 304ndash315 httpsdoiorg101016jeswa200605002
Welles J Jr (1978) New concepts in technical trading systems Hunter Publishing
Company
Wong W-K Manzur M amp Chew B-K (2003) How rewarding is technical
analysis Evidence from Singapore stock market Journal of Applied Financial
Economics 13(7) 543ndash551 httpsdoiorg1010800960310022000020906
Yu H Nartea G V Gan C amp Yao L J (2013) Predictive ability and
profitability of simple technical trading rules Recent evidence from Southeast
Asian stock markets International Review of Economics and Finance 25 356ndash
371 httpsdoiorg101016jiref201207016
Zhu H Jiang Z-Q Li S-P amp Zhou W-X (2015) Profitability of simple
technical trading rules of Chinese stock exchange indexes Physica A
Statistical Mechanics and Its Applications 439 75ndash84 httpsdoiorg101016
jphysa201507032

Colombo Business Journal 11(1) 2020
42
Conclusion
This paper examines the profitability of RSI and MACD technical trading rules
in the Indian market across market cycles BSE Sensex data for the period from
February 2000 to May 2018 were collected from BSE data base and classified into
nine non-overlapping periods as Bull and Bear markets based on the index
movement The t-tests were applied to test the hypothesis that returns from technical
trading rules were not significantly different from the unconditional daily returns In
addition Sharpe ratio average profit to average loss ratio and percentage of
profitable trade to total trade signal were also employed to have a microscopic view
on technical trading rules
Results support the weak-form efficient theory as RSI failed to deliver the
positive returns even before deducting the transaction costs RSI buy and sell signal
returns were not significantly different from the unconditional intraday return In
terms of market timing RSI wrongly predict the market movement and delivered
the percentage of profitable trade to total trade less than 50 Moreover profitable
trades were insufficient to overcome the loss from unprofitable trade Hence buy
signal generated a negative average return and sell signal posted a low positive
average return before deducting transaction costs Therefore after deducting
transaction costs RSI may not leave any profit in the hands of traders
MACD sell signal produced significant positive returns compared to buy signal
and unconditional intraday return However as per Sharpe ratio MACD sell signal
failed to produce the return in line with risk taken Sharpe ratio of less than one
indicates that risk associated with the technical trading rule is more than the return
generated by RSI and MACD In addition even profitable MACD sell signal does
not help in market timing It makes money from higher average profit from
profitable trade than average loss from unprofitable trade However MACD does
not help to reduce the unprofitable trade Hence the study concludes that the trader
cannot earn abnormal return consistently with the help of RSI and MACD across
market cycle in the Indian context RSI and MACD are very old and yet still widely
used as technical tools in real time stock price prediction On the other hand latest
development in information technology and changes in legal systems may have
helped the market to absorb RSI and MACD signals in current price with no time
and cost However in order to empirically validate this assumption a future study
may be extended using a proxy for information technology development and its
impact on trading rules across industries and individual stocks in emerging markets
Muruganandan
43
Declaration of Conflict of Interest
The author declared no potential conflict of interest with respect to the research
authorship and publication of this article
Acknowledgement
I would like to thank anonymous reviewers for their valuable suggestions
References
Allen F amp Karjalainen R (1999) Using genetic algorithms to find technical
trading rules Journal of Financial Economics 51(2) 245ndash271
httpsdoiorg101016S0304-405X(98)00052-X
Almujamed H I Fifield S amp Power D (2013) An investigation of the role of
technical analysis in Kuwait Qualitative Research in Financial Markets 5(1)
43ndash64 httpsdoiorg10110817554171311308959
Anghel G D I (2015) Stock market efficiency and the MACD Evidence from
countries around the world Procedia Economics and Finance 32 1414ndash1431
httpsdoiorg101016S2212-5671(15)01518-X
Atanasova C V amp Hudson R S (2010) Technical trading rules and calendar
anomalies mdash Are they the same phenomena Economics Letters 106(2) 128ndash
130 httpsdoiorg101016jeconlet200911001
Balsara N J Chen G amp Zheng L (2007) The Chinese stock market An
examination of the random walk model and technical trading rules Quarterly
Journal of Business amp Economics 46(2) 43ndash63 httpswwwjstororgstable
40473435
Balsara N Chen J amp Zheng L (2009) Profiting from a contrarian application of
technical trading rules in the US stock market Journal of Asset Management
10(2) 97ndash123 httpsdoiorg101057jam200844
Brock W Lakonishok J amp LeBaron B (1992) Simple technical trading rules
and stochastic properties of stock returns The Journal of Finance 47(5) 1731ndash
1764 httpsdoiorg101111j1540-62611992tb04681x
Chang E J Lima E J A amp Tabak B M (2004) Testing for predictability in
emerging equity markets Emerging Markets Review 5(3) 295ndash316
httpsdoi101016jememar200403005
Chiang Y-C Ke M-C Liao T L amp Wang C D (2012) Are technical trading
strategies still profitable - Evidence from the Taiwan Stock Index Futures
Market Applied Financial Economics 22(12) 955ndash965 httpsdoiorg
101080096031072011631893
Chong T T-L amp Ng W-K (2008) Technical analysis and the London stock
exchange Testing the MACD and RSI rules using the FT30 Applied
Colombo Business Journal 11(1) 2020
44
Economics Letters 15(14) 1111ndash1114 httpsdoiorg10108013504850600
993598
Cohen G amp Cabiri E (2015) Can technical oscillators outperform the buy and
hold strategy Applied Economics 47(30) 3189ndash3197 httpsdoiorg101080
0003684620151013609
Efron B (1979) Bootstrap methods Another look at the Jackknife The Annals of
Statistics 7(1)1ndash26 httpsprojecteuclidorgeuclidaos 1176344552
Fama (1970) Efficient capital markets a review of theory and empirical work
Journal of Finance 25(2) 383-417 httpswwwjstororgstable2325486
Gencay R (1998) The predictability of security returns with simple technical
trading rules Journal of Empirical Finance 5(4) 347ndash359 httpsdoiorg
101016S0927-5398(97)00022-4
Gunasekarage A amp Power D M (2001) The profitability of moving average
trading rules in South Asian stock markets Emerging Markets Review 2(1)
17ndash33 httpsdoiorg101016S1566-0141(00)00017-0
Henderson C (2002) Currency strategy The practitionerrsquos guide to currency
investing hedging and forecasting John Willy amp Sons
Heng P amp Niblock S J (2014) Trading with tigers A technical analysis of
Southeast Asian stock index futures International Economic Journal 28(4)
679ndash692 httpsdoiorg101080101687372014928895
Hudson R Dempsey M amp Keasey K (1996) A note on weak form efficiency of
capital markets The application of simple technical trading rules to UK stock
prices- 1935-1994 Journal of Banking and Finance 20(6) 1121ndash1132
httpsdoiorg1010160378-4266(95)00043-7
Jensen M C amp Benington G A (1970) Random walk and technical theories
Some additional evidence Journal of Finance 25 469ndash482
httpswwwjstororgstable2325495
Krausz J Lee S-Y amp Nam K (2009) Profitability of nonlinear dynamics
under technical trading rules Evidence from Pacific basin stock markets
Emerging Markets Finance amp Trade 45(4) 13ndash35 httpsdoiorg102753
REE1540-496X450402
Khatua A (2016) An application of moving average convergence and divergence
(MACD) indicator on selected stocks listed on National Stock Exchange (NSE)
httpdxdoiorg102139ssrn2872665
Kulkarni A D amp More A (2014) An application of moving average convergence
divergence (MACD) indicator on selected stocks listed on Bombay Stock
Exchange (BSE) Oriental Journal of Computer Science and Technology 7(3)
396ndash400 httpwwwcomputerscijournalorgp=1500
Lokeshwarri S K (2017 April 07) The big story ndash Sit back go passive The Hindu
Business Line (Coimbatore Edition) p 2
Muruganandan
45
Marshall B R Cahan R H amp Cahan J M (2008) Does intraday technical
analysis in the US equity market have value Journal of Empirical Finance
15(2) 199ndash210 httpsdoiorg101016jjempfin200605003
Marshall B R Young M R amp Cahan R (2008) Are candlestick technical
trading strategies profitable in the Japanese equity market Review of
Quantitative Finance and Accounting 31(2) 191ndash207 httpsdoiorg101007
s11156-007-0068-1
Metghalchi M Chen C-P Hajilee M (2016) Moving average trading rules for
NASDAQ composite index Applied Finance Letters 5(2) 45ndash57
httpsdoiorg1024135aflv5i254
Metghalchi M amp Hayes L A Niroomand F (2019) A technical approach to
equity investing in emerging markets Review of Financial Economics 37(3)
389ndash403 httpsdoiorg101002rfe1041
McKenzie M D (2007) Technical trading rules in emerging market and the 1997
Asian currency crises Emerging Market Finance and Trade 43(4) 46ndash73
httpsdoiorg102753REE1540-496X430403
Ming-Ming L Balachandher K G amp Nor F M (2002) An examination of the
random walk model and technical trading rules in the Malaysian stock market
Quarterly Journal of Business amp Economics 41(1) 81ndash104
httpswwwjstororgstable40473346
Ming-Ming L amp Siok-Hwa L (2006) The profitability of the simple moving
averages and trading range breakout in the Asian stock markets Journal of
Asian Economics 17(1) 144ndash170 httpsdoiorg101016jasieco200512001
Mitra S K (2011) How rewarding is technical analysis in Indian stock market
Quantitative Finance 11(2) 287ndash297 httpsdoiorg101080
14697680903493581
Nazario R T F Silva J L amp Sobrero V A (2017) A literature review of
technical analysis on stock markets The Quarterly Review of Economics and
Finance 66 115ndash126 httpsdoiorg101016jqref201701014
Neftccedili S N (1991) Naiumlve trading rules in financial markets and Wiener-
Kolmogorov prediction theory A study of ldquotechnical analysisrdquo Journal of
Business 64(4) 549ndash571
Ni Y Day M-Y Huang P ampYu S-R (2020) The profitability of Bollinger
Bamps Evidence from the constituent stocks of Taiwan 50 Physica A Statistical
Mechanics and Its Applications Advance online publication httpsdoiorg
101016jphysa2020124144
Nor S M amp Wickremasinghe G (2014) The profitability of MACD and RSI
trading rules in the Australian stock market Investment Management and
Financial Innovation 11(4) 194ndash199
Colombo Business Journal 11(1) 2020
46
Rosillo R de La Fuente D amp Brugos J A L (2013) Technical analysis and the
Spanish stock market Testing the RSI and MACD momentum and stochastic
rule using Spanish market companies Applied Economics 45(12) 1541ndash1550
httpsdoiorg101080000368462011631894
Sehgal S amp Garhyan A (2002) Abnormal returns using technical returns The
Indian experience Finance India 16(1) 181ndash203
Sehgal S amp Gupta M (2007) Tests of technical analysis in India Vision The
Journal of Business Perspective 11(3) 11ndash23 httpsdoiorg101177
097226290701100303
Sobreiro V A da Costa T R C C Nazaacuterio R T F e Silva J L Moreira E
A Filho M C L Kimura H amp Zambrano J C A (2016) The profitability
of moving average trading rules in BRICS and emerging stock markets North
American Journal of Economics and Finance 38 86ndash101 httpsdoiorg
101016jnajef201608003
Tian G G Wan G H amp Guo M (2002) Market efficiency and the returns to
simple technical trading rules New evidence from US equity market and
Chinese equity markets Asia-Pacific Financial Markets 9(3) 241ndash258
httpsdoiorg101023A1024181515265
Tharavanij P Siraprapasiri V amp Rajchamaha K (2015) Performance of
technical trading rules Evidence from Southeast Asian Stock Market
Springerplus 4552 httpsdoiorg101186s40064-015-1334-7
Wang J-L amp Chan S-H (2007) Stock market trading rule discovery using
pattern recognition and technical analysis Expert Systems with Applications
33(2) 304ndash315 httpsdoiorg101016jeswa200605002
Welles J Jr (1978) New concepts in technical trading systems Hunter Publishing
Company
Wong W-K Manzur M amp Chew B-K (2003) How rewarding is technical
analysis Evidence from Singapore stock market Journal of Applied Financial
Economics 13(7) 543ndash551 httpsdoiorg1010800960310022000020906
Yu H Nartea G V Gan C amp Yao L J (2013) Predictive ability and
profitability of simple technical trading rules Recent evidence from Southeast
Asian stock markets International Review of Economics and Finance 25 356ndash
371 httpsdoiorg101016jiref201207016
Zhu H Jiang Z-Q Li S-P amp Zhou W-X (2015) Profitability of simple
technical trading rules of Chinese stock exchange indexes Physica A
Statistical Mechanics and Its Applications 439 75ndash84 httpsdoiorg101016
jphysa201507032

Muruganandan
43
Declaration of Conflict of Interest
The author declared no potential conflict of interest with respect to the research
authorship and publication of this article
Acknowledgement
I would like to thank anonymous reviewers for their valuable suggestions
References
Allen F amp Karjalainen R (1999) Using genetic algorithms to find technical
trading rules Journal of Financial Economics 51(2) 245ndash271
httpsdoiorg101016S0304-405X(98)00052-X
Almujamed H I Fifield S amp Power D (2013) An investigation of the role of
technical analysis in Kuwait Qualitative Research in Financial Markets 5(1)
43ndash64 httpsdoiorg10110817554171311308959
Anghel G D I (2015) Stock market efficiency and the MACD Evidence from
countries around the world Procedia Economics and Finance 32 1414ndash1431
httpsdoiorg101016S2212-5671(15)01518-X
Atanasova C V amp Hudson R S (2010) Technical trading rules and calendar
anomalies mdash Are they the same phenomena Economics Letters 106(2) 128ndash
130 httpsdoiorg101016jeconlet200911001
Balsara N J Chen G amp Zheng L (2007) The Chinese stock market An
examination of the random walk model and technical trading rules Quarterly
Journal of Business amp Economics 46(2) 43ndash63 httpswwwjstororgstable
40473435
Balsara N Chen J amp Zheng L (2009) Profiting from a contrarian application of
technical trading rules in the US stock market Journal of Asset Management
10(2) 97ndash123 httpsdoiorg101057jam200844
Brock W Lakonishok J amp LeBaron B (1992) Simple technical trading rules
and stochastic properties of stock returns The Journal of Finance 47(5) 1731ndash
1764 httpsdoiorg101111j1540-62611992tb04681x
Chang E J Lima E J A amp Tabak B M (2004) Testing for predictability in
emerging equity markets Emerging Markets Review 5(3) 295ndash316
httpsdoi101016jememar200403005
Chiang Y-C Ke M-C Liao T L amp Wang C D (2012) Are technical trading
strategies still profitable - Evidence from the Taiwan Stock Index Futures
Market Applied Financial Economics 22(12) 955ndash965 httpsdoiorg
101080096031072011631893
Chong T T-L amp Ng W-K (2008) Technical analysis and the London stock
exchange Testing the MACD and RSI rules using the FT30 Applied
Colombo Business Journal 11(1) 2020
44
Economics Letters 15(14) 1111ndash1114 httpsdoiorg10108013504850600
993598
Cohen G amp Cabiri E (2015) Can technical oscillators outperform the buy and
hold strategy Applied Economics 47(30) 3189ndash3197 httpsdoiorg101080
0003684620151013609
Efron B (1979) Bootstrap methods Another look at the Jackknife The Annals of
Statistics 7(1)1ndash26 httpsprojecteuclidorgeuclidaos 1176344552
Fama (1970) Efficient capital markets a review of theory and empirical work
Journal of Finance 25(2) 383-417 httpswwwjstororgstable2325486
Gencay R (1998) The predictability of security returns with simple technical
trading rules Journal of Empirical Finance 5(4) 347ndash359 httpsdoiorg
101016S0927-5398(97)00022-4
Gunasekarage A amp Power D M (2001) The profitability of moving average
trading rules in South Asian stock markets Emerging Markets Review 2(1)
17ndash33 httpsdoiorg101016S1566-0141(00)00017-0
Henderson C (2002) Currency strategy The practitionerrsquos guide to currency
investing hedging and forecasting John Willy amp Sons
Heng P amp Niblock S J (2014) Trading with tigers A technical analysis of
Southeast Asian stock index futures International Economic Journal 28(4)
679ndash692 httpsdoiorg101080101687372014928895
Hudson R Dempsey M amp Keasey K (1996) A note on weak form efficiency of
capital markets The application of simple technical trading rules to UK stock
prices- 1935-1994 Journal of Banking and Finance 20(6) 1121ndash1132
httpsdoiorg1010160378-4266(95)00043-7
Jensen M C amp Benington G A (1970) Random walk and technical theories
Some additional evidence Journal of Finance 25 469ndash482
httpswwwjstororgstable2325495
Krausz J Lee S-Y amp Nam K (2009) Profitability of nonlinear dynamics
under technical trading rules Evidence from Pacific basin stock markets
Emerging Markets Finance amp Trade 45(4) 13ndash35 httpsdoiorg102753
REE1540-496X450402
Khatua A (2016) An application of moving average convergence and divergence
(MACD) indicator on selected stocks listed on National Stock Exchange (NSE)
httpdxdoiorg102139ssrn2872665
Kulkarni A D amp More A (2014) An application of moving average convergence
divergence (MACD) indicator on selected stocks listed on Bombay Stock
Exchange (BSE) Oriental Journal of Computer Science and Technology 7(3)
396ndash400 httpwwwcomputerscijournalorgp=1500
Lokeshwarri S K (2017 April 07) The big story ndash Sit back go passive The Hindu
Business Line (Coimbatore Edition) p 2
Muruganandan
45
Marshall B R Cahan R H amp Cahan J M (2008) Does intraday technical
analysis in the US equity market have value Journal of Empirical Finance
15(2) 199ndash210 httpsdoiorg101016jjempfin200605003
Marshall B R Young M R amp Cahan R (2008) Are candlestick technical
trading strategies profitable in the Japanese equity market Review of
Quantitative Finance and Accounting 31(2) 191ndash207 httpsdoiorg101007
s11156-007-0068-1
Metghalchi M Chen C-P Hajilee M (2016) Moving average trading rules for
NASDAQ composite index Applied Finance Letters 5(2) 45ndash57
httpsdoiorg1024135aflv5i254
Metghalchi M amp Hayes L A Niroomand F (2019) A technical approach to
equity investing in emerging markets Review of Financial Economics 37(3)
389ndash403 httpsdoiorg101002rfe1041
McKenzie M D (2007) Technical trading rules in emerging market and the 1997
Asian currency crises Emerging Market Finance and Trade 43(4) 46ndash73
httpsdoiorg102753REE1540-496X430403
Ming-Ming L Balachandher K G amp Nor F M (2002) An examination of the
random walk model and technical trading rules in the Malaysian stock market
Quarterly Journal of Business amp Economics 41(1) 81ndash104
httpswwwjstororgstable40473346
Ming-Ming L amp Siok-Hwa L (2006) The profitability of the simple moving
averages and trading range breakout in the Asian stock markets Journal of
Asian Economics 17(1) 144ndash170 httpsdoiorg101016jasieco200512001
Mitra S K (2011) How rewarding is technical analysis in Indian stock market
Quantitative Finance 11(2) 287ndash297 httpsdoiorg101080
14697680903493581
Nazario R T F Silva J L amp Sobrero V A (2017) A literature review of
technical analysis on stock markets The Quarterly Review of Economics and
Finance 66 115ndash126 httpsdoiorg101016jqref201701014
Neftccedili S N (1991) Naiumlve trading rules in financial markets and Wiener-
Kolmogorov prediction theory A study of ldquotechnical analysisrdquo Journal of
Business 64(4) 549ndash571
Ni Y Day M-Y Huang P ampYu S-R (2020) The profitability of Bollinger
Bamps Evidence from the constituent stocks of Taiwan 50 Physica A Statistical
Mechanics and Its Applications Advance online publication httpsdoiorg
101016jphysa2020124144
Nor S M amp Wickremasinghe G (2014) The profitability of MACD and RSI
trading rules in the Australian stock market Investment Management and
Financial Innovation 11(4) 194ndash199
Colombo Business Journal 11(1) 2020
46
Rosillo R de La Fuente D amp Brugos J A L (2013) Technical analysis and the
Spanish stock market Testing the RSI and MACD momentum and stochastic
rule using Spanish market companies Applied Economics 45(12) 1541ndash1550
httpsdoiorg101080000368462011631894
Sehgal S amp Garhyan A (2002) Abnormal returns using technical returns The
Indian experience Finance India 16(1) 181ndash203
Sehgal S amp Gupta M (2007) Tests of technical analysis in India Vision The
Journal of Business Perspective 11(3) 11ndash23 httpsdoiorg101177
097226290701100303
Sobreiro V A da Costa T R C C Nazaacuterio R T F e Silva J L Moreira E
A Filho M C L Kimura H amp Zambrano J C A (2016) The profitability
of moving average trading rules in BRICS and emerging stock markets North
American Journal of Economics and Finance 38 86ndash101 httpsdoiorg
101016jnajef201608003
Tian G G Wan G H amp Guo M (2002) Market efficiency and the returns to
simple technical trading rules New evidence from US equity market and
Chinese equity markets Asia-Pacific Financial Markets 9(3) 241ndash258
httpsdoiorg101023A1024181515265
Tharavanij P Siraprapasiri V amp Rajchamaha K (2015) Performance of
technical trading rules Evidence from Southeast Asian Stock Market
Springerplus 4552 httpsdoiorg101186s40064-015-1334-7
Wang J-L amp Chan S-H (2007) Stock market trading rule discovery using
pattern recognition and technical analysis Expert Systems with Applications
33(2) 304ndash315 httpsdoiorg101016jeswa200605002
Welles J Jr (1978) New concepts in technical trading systems Hunter Publishing
Company
Wong W-K Manzur M amp Chew B-K (2003) How rewarding is technical
analysis Evidence from Singapore stock market Journal of Applied Financial
Economics 13(7) 543ndash551 httpsdoiorg1010800960310022000020906
Yu H Nartea G V Gan C amp Yao L J (2013) Predictive ability and
profitability of simple technical trading rules Recent evidence from Southeast
Asian stock markets International Review of Economics and Finance 25 356ndash
371 httpsdoiorg101016jiref201207016
Zhu H Jiang Z-Q Li S-P amp Zhou W-X (2015) Profitability of simple
technical trading rules of Chinese stock exchange indexes Physica A
Statistical Mechanics and Its Applications 439 75ndash84 httpsdoiorg101016
jphysa201507032

Colombo Business Journal 11(1) 2020
44
Economics Letters 15(14) 1111ndash1114 httpsdoiorg10108013504850600
993598
Cohen G amp Cabiri E (2015) Can technical oscillators outperform the buy and
hold strategy Applied Economics 47(30) 3189ndash3197 httpsdoiorg101080
0003684620151013609
Efron B (1979) Bootstrap methods Another look at the Jackknife The Annals of
Statistics 7(1)1ndash26 httpsprojecteuclidorgeuclidaos 1176344552
Fama (1970) Efficient capital markets a review of theory and empirical work
Journal of Finance 25(2) 383-417 httpswwwjstororgstable2325486
Gencay R (1998) The predictability of security returns with simple technical
trading rules Journal of Empirical Finance 5(4) 347ndash359 httpsdoiorg
101016S0927-5398(97)00022-4
Gunasekarage A amp Power D M (2001) The profitability of moving average
trading rules in South Asian stock markets Emerging Markets Review 2(1)
17ndash33 httpsdoiorg101016S1566-0141(00)00017-0
Henderson C (2002) Currency strategy The practitionerrsquos guide to currency
investing hedging and forecasting John Willy amp Sons
Heng P amp Niblock S J (2014) Trading with tigers A technical analysis of
Southeast Asian stock index futures International Economic Journal 28(4)
679ndash692 httpsdoiorg101080101687372014928895
Hudson R Dempsey M amp Keasey K (1996) A note on weak form efficiency of
capital markets The application of simple technical trading rules to UK stock
prices- 1935-1994 Journal of Banking and Finance 20(6) 1121ndash1132
httpsdoiorg1010160378-4266(95)00043-7
Jensen M C amp Benington G A (1970) Random walk and technical theories
Some additional evidence Journal of Finance 25 469ndash482
httpswwwjstororgstable2325495
Krausz J Lee S-Y amp Nam K (2009) Profitability of nonlinear dynamics
under technical trading rules Evidence from Pacific basin stock markets
Emerging Markets Finance amp Trade 45(4) 13ndash35 httpsdoiorg102753
REE1540-496X450402
Khatua A (2016) An application of moving average convergence and divergence
(MACD) indicator on selected stocks listed on National Stock Exchange (NSE)
httpdxdoiorg102139ssrn2872665
Kulkarni A D amp More A (2014) An application of moving average convergence
divergence (MACD) indicator on selected stocks listed on Bombay Stock
Exchange (BSE) Oriental Journal of Computer Science and Technology 7(3)
396ndash400 httpwwwcomputerscijournalorgp=1500
Lokeshwarri S K (2017 April 07) The big story ndash Sit back go passive The Hindu
Business Line (Coimbatore Edition) p 2
Muruganandan
45
Marshall B R Cahan R H amp Cahan J M (2008) Does intraday technical
analysis in the US equity market have value Journal of Empirical Finance
15(2) 199ndash210 httpsdoiorg101016jjempfin200605003
Marshall B R Young M R amp Cahan R (2008) Are candlestick technical
trading strategies profitable in the Japanese equity market Review of
Quantitative Finance and Accounting 31(2) 191ndash207 httpsdoiorg101007
s11156-007-0068-1
Metghalchi M Chen C-P Hajilee M (2016) Moving average trading rules for
NASDAQ composite index Applied Finance Letters 5(2) 45ndash57
httpsdoiorg1024135aflv5i254
Metghalchi M amp Hayes L A Niroomand F (2019) A technical approach to
equity investing in emerging markets Review of Financial Economics 37(3)
389ndash403 httpsdoiorg101002rfe1041
McKenzie M D (2007) Technical trading rules in emerging market and the 1997
Asian currency crises Emerging Market Finance and Trade 43(4) 46ndash73
httpsdoiorg102753REE1540-496X430403
Ming-Ming L Balachandher K G amp Nor F M (2002) An examination of the
random walk model and technical trading rules in the Malaysian stock market
Quarterly Journal of Business amp Economics 41(1) 81ndash104
httpswwwjstororgstable40473346
Ming-Ming L amp Siok-Hwa L (2006) The profitability of the simple moving
averages and trading range breakout in the Asian stock markets Journal of
Asian Economics 17(1) 144ndash170 httpsdoiorg101016jasieco200512001
Mitra S K (2011) How rewarding is technical analysis in Indian stock market
Quantitative Finance 11(2) 287ndash297 httpsdoiorg101080
14697680903493581
Nazario R T F Silva J L amp Sobrero V A (2017) A literature review of
technical analysis on stock markets The Quarterly Review of Economics and
Finance 66 115ndash126 httpsdoiorg101016jqref201701014
Neftccedili S N (1991) Naiumlve trading rules in financial markets and Wiener-
Kolmogorov prediction theory A study of ldquotechnical analysisrdquo Journal of
Business 64(4) 549ndash571
Ni Y Day M-Y Huang P ampYu S-R (2020) The profitability of Bollinger
Bamps Evidence from the constituent stocks of Taiwan 50 Physica A Statistical
Mechanics and Its Applications Advance online publication httpsdoiorg
101016jphysa2020124144
Nor S M amp Wickremasinghe G (2014) The profitability of MACD and RSI
trading rules in the Australian stock market Investment Management and
Financial Innovation 11(4) 194ndash199
Colombo Business Journal 11(1) 2020
46
Rosillo R de La Fuente D amp Brugos J A L (2013) Technical analysis and the
Spanish stock market Testing the RSI and MACD momentum and stochastic
rule using Spanish market companies Applied Economics 45(12) 1541ndash1550
httpsdoiorg101080000368462011631894
Sehgal S amp Garhyan A (2002) Abnormal returns using technical returns The
Indian experience Finance India 16(1) 181ndash203
Sehgal S amp Gupta M (2007) Tests of technical analysis in India Vision The
Journal of Business Perspective 11(3) 11ndash23 httpsdoiorg101177
097226290701100303
Sobreiro V A da Costa T R C C Nazaacuterio R T F e Silva J L Moreira E
A Filho M C L Kimura H amp Zambrano J C A (2016) The profitability
of moving average trading rules in BRICS and emerging stock markets North
American Journal of Economics and Finance 38 86ndash101 httpsdoiorg
101016jnajef201608003
Tian G G Wan G H amp Guo M (2002) Market efficiency and the returns to
simple technical trading rules New evidence from US equity market and
Chinese equity markets Asia-Pacific Financial Markets 9(3) 241ndash258
httpsdoiorg101023A1024181515265
Tharavanij P Siraprapasiri V amp Rajchamaha K (2015) Performance of
technical trading rules Evidence from Southeast Asian Stock Market
Springerplus 4552 httpsdoiorg101186s40064-015-1334-7
Wang J-L amp Chan S-H (2007) Stock market trading rule discovery using
pattern recognition and technical analysis Expert Systems with Applications
33(2) 304ndash315 httpsdoiorg101016jeswa200605002
Welles J Jr (1978) New concepts in technical trading systems Hunter Publishing
Company
Wong W-K Manzur M amp Chew B-K (2003) How rewarding is technical
analysis Evidence from Singapore stock market Journal of Applied Financial
Economics 13(7) 543ndash551 httpsdoiorg1010800960310022000020906
Yu H Nartea G V Gan C amp Yao L J (2013) Predictive ability and
profitability of simple technical trading rules Recent evidence from Southeast
Asian stock markets International Review of Economics and Finance 25 356ndash
371 httpsdoiorg101016jiref201207016
Zhu H Jiang Z-Q Li S-P amp Zhou W-X (2015) Profitability of simple
technical trading rules of Chinese stock exchange indexes Physica A
Statistical Mechanics and Its Applications 439 75ndash84 httpsdoiorg101016
jphysa201507032
Related Documents