University of W¨ urzburg Institute of Computer Science Research Report Series Testing the IQX Hypothesis for Exponential Interdependency between QoS and QoE of Voice Codecs iLBC and G.711 Tobias Hoßfeld 1 , David Hock 1 , Phuoc Tran-Gia 1 , Kurt Tutschku 1,2 , Markus Fiedler 3 Report No. 442 March 2008 1 University of W¨ urzburg Institute of Computer Science Department of Distributed Systems Am Hubland, D-97074 W¨ urzburg, Germany {hossfeld,hock,trangia}@informatik.uni-wuerzburg.de 2 now at NICT Network Architecture Group, Network Research Center Park Court Place Tokyo, Japan. [email protected] 3 Blekinge Institute of Technology, Department of Telecommunication Systems. SE-371 79 Karlskrona, Sweden. [email protected]

Welcome message from author
This document is posted to help you gain knowledge. Please leave a comment to let me know what you think about it! Share it to your friends and learn new things together.
Transcript

University of Wurzburg
Institute of Computer Science
Research Report Series
Testing the IQX Hypothesis for
Exponential Interdependency between
QoS and QoE of Voice Codecs iLBC and
G.711
Tobias Hoßfeld1, David Hock1, Phuoc Tran-Gia1, Kurt
Tutschku1,2, Markus Fiedler3
Report No. 442 March 2008
1 University of WurzburgInstitute of Computer Science
Department of Distributed SystemsAm Hubland, D-97074 Wurzburg, Germany
{hossfeld,hock,trangia}@informatik.uni-wuerzburg.de
2 now at NICT Network Architecture Group,Network Research Center Park Court Place
Tokyo, [email protected]
3 Blekinge Institute of Technology,Department of Telecommunication Systems.
SE-371 79 Karlskrona, [email protected]


1 Introduction
Testing the IQX Hypothesis for Exponential Interdependency between
QoS and QoE of Voice Codecs iLBC and G.711
Tobias Hoßfeld, David
Hock, Phuoc Tran-GiaUniversity of Wurzburg
Institute of Computer ScienceDepartment of Distributed
SystemsAm Hubland, D-97074Wurzburg, Germany
{hossfeld,hock,trangia}@
informatik.uni-wuerzburg.
de
Kurt Tutschkunow at NICT NetworkArchitecture Group,
Network Research CenterPark Court Place
Tokyo, [email protected]
Markus FiedlerBlekinge Institute of
Technology,Department of
Telecommunication Systems.SE-371 79 Karlskrona,
Abstract
Given the growing importance of quantitative relationships between user-perceivedQuality of Experience (QoE) and network Quality of Service (QoS), this paper inves-tigates the IQX hypothesis for two voice codecs, iLBC and G.711. This hypothesisexpresses QoE as an exponential function of QoS degradation. The experimentsare carried out in a controlled environment using the softphone SJPhone, the net-work emulator NIST Net, and a tool calculating the PESQ (Perceptual Evaluation ofSpeech Quality) from sent and received audio files. The IQX hypothesis is confirmedexactly for disturbances perceived on applications level, packet loss and packet re-ordering, which clearly correlate to the main sensitivities of the used softphone topacket-level disturbances such as loss, jitter and reordering. So, besides of providinga unified relationship between QoE and QoS, the IQX also proved to be capableof identifying the QoS parameters of relevance for QoE degradations. The studyalso points out interesting tracks for future work in terms of QoS degradations andrelated QoE evaluations.
1 Introduction
User satisfaction with application and service performance in communication networkshas attracted increased attention during the recent years. The interest in how the userperceives usability, reliability, quality and price-worthiness as a means of competition isincreasing. The network and service providers need to be able to observe and react uponquality problems, at best before the customer perceives them.
The notion of QoE was introduced in several white papers, mostly in the context ofmultimedia delivery like IPTV. Besides of objective end-to-end QoS parameters, QoEfocuses on subjective valuations of service delivery by the end users. The necessity ofintroducing QoE can be explained on the example of VoIP. A voice user is not interestedin knowing performance measures like packet loss or received throughput, but mainly inthe experienced speech quality and timeliness of the connection setup.
1

1 Introduction
There is however still a lack of quantitative descriptions or exact definitions of QoE.One particular difficulty consists in matching subjective quality perception to objective,measurable QoS parameters. Subjective quality is amongst others expressed throughMean Opinion Scores (MOS) [1]. Links between MOS and QoS parameters exist pre-dominately for packetised voice such as VoIP. Numerous studies have performed mea-surements to quantify the effects of individual impairments on the speech quality on asingle MOS value for different codecs, for example G.729 [2], GSM-FR [3], iLBC used bySkype [4], or a comparison of some codecs [5]. Additionally, the E-model [6] and relatedextensions [7] assess the combined effects of different influence factors on the voice qual-ity. In [8], the logarithmic function is selected as generic function for mapping the QoE,there denoted as user level QoS, from a single parameter because of the mathematicalcharacteristics of the logarithmic function.
In this work in contrast, we motivate a fundamental relationship between the QoEand quality impairment factors such as packet loss or jitter. As an analytical solution ofthis relationship between QoE and QoS, we formulated the IQX hypothesis (exponentialinterdependency of QoE and QoS) in [9] which will be briefly reviewed in Section 2.
After that, the hypothesis is tested for two different voice codecs, iLBC and G.711.Using a common VoIP application supporting both voice codecs, we conducted a set ofmeasurements to describe the QoE in terms of mean opinion scores (MOS) dependingon QoS parameters. In our test bed, we are able to control the network conditions andto inject for example packet loss or jitter. Packet traces are captured to measure theQoS parameters. The received audio signals are compared to the originally sent audiosignals, the PESQ (Perceptual Evaluation of Speech Quality) is calculated and mappedto MOS as QoE indicator.
As stated before, the goal of this work to further quantify the relationship between QoEand QoS impairment factors. In particular, we investigate the impact of uncorrelatedand correlated delay and jitter, packet reordering, random packet losses, and burstylosses. We test the IQX hypothesis, i.e. the exponential interdependency between QoSand QoE, and show that we can confirm the hypothesis when appropriate metrics todescribe the QoS impact on application layer are chosen. Our methodology comprisesmeasurements in a test bed with controlled network conditions and optimal parametersof the mapping function are retrieved using nonlinear regression techniques.
This paper is organized as follows. In Sec. 2, we briefly review the IQX hypothesiswhich is fundamental for this work. The applied methodology is illustrated in Sec. 3which includes the setup of the test bed, the computation of the QoS and QoE param-eters, and the derivation of the exponential mapping function. Furthermore, we take aclose look at the used network emulator and check its functionality. The main contribu-tion of our paper will be in Section 4, where we present our measurement studies andtest the IQX hypothesis for several QoS parameters in different scenarios. Finally, wewill conclude this paper with an outlook on future work.
2
2 The IQX Hypothesis
2 The IQX Hypothesis
The QoE can be expressed as a function of n influence factors Ij , 1 ≤ j ≤ n:
QoE = Φ(I1, I2, · · · , In) . (1)
However, in this contribution we focus on single influence factors indicating the QoS,like the packet loss ratio, in order to motivate the fundamental relationship betweenthe QoE and an impairment factor corresponding to the QoS. The idea is to derive thefunction QoE = f(QoS) with a single impairment factor I = QoS.
In general, the subjective sensibility of the QoE is the more sensitive, the higherthis experienced quality is. If the QoE is very high, a small disruption will decreasestrongly the QoE, also stated in [8]. On the other hand, if the QoE is already low,a further disturbance is not perceived in a significant way. This relationship can bemotivated when we compare with restaurant quality of experience. If we dined in afive-star restaurant, a single spot on the clean white table cloth strongly disturbs theatmosphere. The same incident appears much less severe in a beer pub.
On this background, we assume that the change of QoE depends on the current levelof QoE – the expectation level – given the same amount of change of the QoS value.Mathematically, this relationship can be expressed in the following way. The perfor-mance degradation of the QoE with respect to a certain QoS parameter, like packet loss,is ∂QoE
∂QoS. Assuming a linear dependence on the QoE level, we arrive at the following
differential equation:∂QoE
∂QoS= −β · (QoE − γ) . (2)
The solution for this equation is easily found as an exponential function, which expressesthe basic relation of the IQX hypothesis:
QoE = α · e−β·QoS + γ . (3)
Note that in this context the IQX hypothesis is formulated with QoS as parameterreflecting the current objective service quality that grows with the impairment. Thehigher the value QoS, the lower the objective quality is. The higher the value QoE,the higher the subjective quality is. In Eq. 3, QoS is for example the packet loss ratioand QoE is described in terms of MOS. In any other cases, the algebraic signs have toadapted adequately in Eq. 3. In the limit, QoS → ∞, QoE approaches γ from above.
3 Measurement Study for testing the IQX Hypothesis
For the investigation of the interdependency between QoS parameters and the QoE forvoice calls, we emulated various network conditions, like packet loss or jitter. Therefore,a testbed was installed in the Routerlab laboratory of the University of Wurzburg. Thesetup of the testbed is described in Sec. 3.1. It allows a) to capture packet traces at theend hosts, which is required to compute QoS parameters and b) to capture the sent andthe received audio signals required to obtain MOS as QoE parameter. The definition and
3

3 Measurement Study for testing the IQX Hypothesis
computation of the applied QoS and QoE metrics in this work is given in Sec. 3.2. Themain goal is to quantify the relationship between QoS and QoE. In particular, we inves-tigate whether this relationship can be expressed by a simple exponential function withappropriate parameters. The derivation of the best parameters for a certain measure-ment scenario is done via non-linear regression techniques by minimizing the residualsobserved as difference between the exponential model and the measurement values. Ashort summary of the applied methods for this optimization problem can be found inSec. 3.3. The last paragraph of this section shows the results for the verification of themeasurement setup. In particular, we take a closer look whether the standard networkemulation tool NIST Net correctly generates the desired network conditions, i.e. packtloss, delay and jitter values, as well as autocorrelated packet streams.
3.1 Testbed Setup
The general measurement setup is the following. The voice user A sends audio datato voice user B via a network emulating machine using UDP and IP on transport andnetwork layer, respectively. The audio data is an English spoken text without noise oflength 51 seconds, sampled at a rate of 8 kHz, encoded with 16 bits per sample which isa standard audio file for evaluating VoIP and available at [10]. In the following, the usedhardware and software of the measurement testbed are explained. Detailed informationon the hardware of the used machines is given in Table 1. An overview of the actualversions of the software and the used operating systems can be found in Table 2.
3.1.1 Hardware Configuration
The measurement testbed is set up in a local area network without any connection to theInternet to avoid any noise or cross traffic. The testbed comprises two client machinesfor the voice communication, called Katie and Salma, and a dedicated machine, calledDemeter, for emulating the network conditions. The LAN is realized with Ethernet andthe voice client machines are connected via crossover-cables to the emulation machine.Demeter has an additional network interface that is used to control the measurementsremotely. Figure 1 illustrates the measurement setup and the IP address configuration.Katie and Salma are located in different subnetworks and both use Demeter as routinggateway, hence, the complete traffic between Katie and Salma can be influenced byDemeter, e.g. by introducing additional delays or dropping IP packets.
3.1.2 OS and Software
For our experiments, we use the SJPhone VoIP application [11] for several reasons. First,SJPhone implements different voice codecs, among others, the iLBC and the G.711 voicecodecs, in which we are interested in this study. The software allows to explicitly usea specified codec via the GUI or by adjusting a parameter file (in the Linux version).Second, SJPhone is open-source software that enables direct voice calls between any twohosts. Thus, the end hosts do not need to register at any SIP server in the Internet.The call initiator has to know the IP address of the machine to be called and then
4

3 Measurement Study for testing the IQX Hypothesis
Figure 1: Measurement Setup
the call is directly established via SIP or H.323. The used session protocol suite canalso be configured via the parameter file. In our measurements, we use direct SIPcalls. Third, SJPhone can be controlled from the command line and configured viaparameter files without using the GUI. This was a mandatory requirement to automatethe measurement process. As a consequence, the measurements could be repeated manytimes to get statistically significant data while reducing the human efforts for conductingthe measurements.
On the voice client machines, Knoppix Linux is used as operating system. During thecourse of this work it has been found out that conducting the measurement process withSJPhone running on Windows makes the voice client machines crash for some reasons.Additional software tools which are used in the context of this work are aumix, play,sound-recorder, and tcpdump. They are already included in the used Knoppix 5.1.1distribution. At the sender side, play makes the audio file be played locally and aumixallows to redirect the sound output as input for SJPhone. On the receiver side, sound-recorder is used to capture the received audio signals and record them into a file which islater on compared with the sent audio file to obtain the QoE. Tcpdump is used to capturepacket traces on OSI layer 2 at the sending and the receiving voice client machines inorder to get statistics on QoS parameters.
The network emulation machine demeter runs SuSe Linux and hosts NIST Net thatis a network emulation package running only on Linux. NIST Net allows a single LinuxPC set up as a router in order to emulate a wide variety of network conditions. Inparticular, selected performance effects are applied to the IP packets of the out-goingstream. Via command line, the network conditions of a single end-to-end path canbe controlled, which is again required for the automated measurement process. Thecontrollable network parameters of interest in this work are packet loss and delay. It ispossible to generate random packet losses according to a given packet loss probability pL.This means IP packets are randomly dropped with probability pL. NIST Net additionally
5

3 Measurement Study for testing the IQX Hypothesis
Table 1: Overview of the hardware configuration
Name katie demeter salma
Role Client Router Client
CPU2 x Intel Pentium III
1.3 GHz 500 MHz 1.3 GHz
RAM 512 MB
HDD 80 GB 16 GB 40 GB
NIC3COM, 100 Mbps
1 x 3 x 1 x
Table 2: Overview of the used software versions
Name Version
NIST net 2.0.12c
SJPhone v.1.60.299, 09.24.05
Aumix 2.8
Play (sox) 2.0-debian
Sound-recorder 0.06 (Oct 28 2005)
Tcpdump 3.9.5
accepts an autocorrelation parameter L for the loss, however, this parameter has noeffect on the out-going stream, which is demonstrated in Sec. 3.4. In order to control thedelay between two nodes, the average delay µd, the standard deviation σd of the delay,and the autocorrelation d can be passed to NIST Net, which uses a normal distributionwith the related parameters go randomly generate delays. The verification of the correctemulation of these parameters is shown in Sec. 3.4.
3.2 Computation of QoS and QoE Parameters
As result of the measurements we obtain the received audio file and tcpdump packettraces at the sender machine Katie and the receiver machine Salma. For each sent andreceived packet on both machines, we extract an unique ID, the size of the packet, andthe local timestamp when the packet is sent or received, respectively. Note, that theclocks at Salma and Katie are not synchronized and might drift. However, this is notnecessary for assessing the applied QoS parameters.
3.2.1 Packet loss
Let sout = {pout,1, pout,2, . . . , pout,n} be the set of packets that are sent from Katie toSalma. The packets pout,i are ordered in ascending order according to their send-
6

3 Measurement Study for testing the IQX Hypothesis
ing timestamps ts,pout,i, i.e. i < j ⇒ ts,pout,i
≤ ts,pout,j. Analogously, let sin =
{pin,1, pin,2, . . . , pin,m} ⊆ sout be the set of packets that are received by Salma fromKatie. The packets pin,i are ordered in ascending order according to the timestampstr,pin,i
when the packets are received, i.e. i < j ⇒ tr,pin,i≤ tr,pin,j
. The measured packetloss ratio simply follows as
pL = 1 −|sin|
|sout|= 1 −
m
n. (4)
On average, the measured packet loss ratio pL should be equal to the preset packet lossprobability pL of the network emulator, i.e. pL = pL.
3.2.2 One-Way Delays
The one-way delay is basically defined as the time difference between the time ts,p whensending the first bit of a packet p at the sender side until the time tr,p receiving the lastbit of the packet p at the receiver side [12]. The one-way delay dp for a packet p followsas
dp = tr,p − ts,p for p ∈ sin ⊆ sout . (5)
Note that in case of dropped packets the one-way delay is not defined. However, asthe clocks at the sender and the receiver side do not need to be synchronized and theclocks might additionally drift, the estimation of one-way delays out of measurementdata is a complex task. Binzenhofer et. al propose in [13] a method to estimate accurateone-way delays based on packet captures at the sender and at the receiver side. Thus,the estimation method is applicable in the context of this work to get one-way delays.The proposed method overcomes unsynchronized clocks and linear clock drifts. Notethat the one-way delays are only required in Sec. 3.4 to verify the emulated end-to-endone-way delays. However, we will additionally use them to show alternative metrics forjitter.
3.2.3 Jitter
The term jitter is used to express delay variations within a stream of received packets. Inliterature, there exist different definitions of how to assess the jitter. The most commonones are a) the standard deviation of the one-way delay ω = stdOWD and b) the inter-packet delay variation stdIPDV according to RFC 3393 [14]. The standard deviationof the round trip delay is also a common measure, however, it cannot be used in thecontext of VoIP, as the packets are neither acknowledged nor returned to the sender.
After computing the one-way delays dp for all received packets p ∈ sin, the standarddeviation ωsin
of the one-way delays simply follows as
ωsin= STD {dp|p ∈ sin}
=
√
√
√
√
√
1
|sin| − 1
∑
p∈sin
dp2 −
(
∑
p∈sin
dp
)2
.(6)
7

3 Measurement Study for testing the IQX Hypothesis
A different common metric for expressing jitter uses the inter-packet delay variationIPDV as defined in [14]. The IPDV compares the one-way delays of a selected pair ofpackets within a stream. It is defined as the difference between the one-way delays dp
and dq of the packets p and q. It holds IPDV (p, q) = dp−dq = (tr,p−ts,p)−(tr,q−ts,q) =(tr,p−tr,q)−(ts,p−ts,q) = ∆tr,p,q−∆ts,p,q . Thus, the IPDV of two packets is the differenceof the inter-packet delay in the outgoing stream of packets sout and the inter-packet delayin the received stream sin. As measure for the jitter of a packet stream, the standarddeviation of the IPDV any two consecutively received packets is computed as follows:
IPDVsin= STD {IPDV (pin,i, pin,i+1)|1 ≤ i < m} . (7)
3.2.4 Packet reordering
As a consequence of delay variations in a stream of packets, it might occur that packetsare reordered. Depending on the actual implementation, an application might be ableto handle jitter by using an appropriate jitter buffer, however, reordered packets mightbe more difficult to deal with on application layer and hence result into significant QoEdegradations. This performance issue was revealed during the course of this work for theapplication under study. Therefore, we also investigate this phenomenon and its influenceon the QoE, although in the Internet, it is assumed that the amount of reordered packetsis not relevant.
There exist different metrics for quantifying packet reordering. In [15], a detailedintroduction on the necessity of different packet reordering metrics is given and thecomputation of the metrics is proposed. In general, a received packet p ∈ sin is referredto as reordered packet if and only if there is at least one packet q ∈ sin which was sentafter p, i.e. ts,p < ts,q, but arrives before the packet p, i.e. tr,q < tr,p .
p is reordered ⇔ ∃q ∈ sin : ts,p < ts,q ∧ tr,q < tr,p . (8)
The ratio ρ(sin) of reordered packets within a stream of packets is denoted as Type-P-Reordered-Ratio, or reordering ratio in short. It is calculated as
ρsin=
|{p ∈ sin|p is reordered}|
|sin| − 1. (9)
The reordered ratio is a very simple metric, as it does not take into account how“much” a single packet is reordered. This can be illustrated with a simple example. LetsA be packet stream with 8 packets, sout,A = {p1, . . . , p8}. If p8 arrives for some reasonsbefore p4, but all other packets are sent in correct order, the received packet streamis sin,A = {p1, p2, p3, p8, p4, p5, p6, p7} and the resulting reordered ratio is ρsin,A
= 1/2,as p4, . . . , p7 are reordered according to the definition above. However, an applicationmight only drop packet p8 while the other packets are processed correctly, as only thepacket arriving out of order cannot be processed. If the stream sA is received as sin,B ={p2, p1, p4, p3, p6, p5, p8, p7}, we obtain the same reordered ratio ρsin,B
= 1/2. Later,we will see that this metric is sufficient to describe the relationship between packetreordering and QoE, as SJPhone seems to have problems with reordered packets.
8
3 Measurement Study for testing the IQX Hypothesis
A more complex metric to quantify packet reordering is the mean reordering late timeof a packet stream [15]. The reordering late time is the maximum distance in time froma reordered packet to the earliest packet received that has a larger sequence number.If a packet is in-order, its reordering late time is undefined. The first packet to arriveis in-order by definition and has undefined reordering late time. This metric seemsappropriate to capture the network disturbance as perceived on application layer. Aformal definition is
τ =1
|R|
∑
i∈R
tin,i − tin,j (10)
with R = {p ∈ sin : p is reordered}, j = min{k|1 ≤ k < i}.
3.2.5 Mean opinion scores
For the quantification of the QoE, we use a full reference metric, i.e. we compare thesent signal with the received one offline. Our measurement testbed allows to capture theaudio signals on the sender and the receiver side and allows to apply the full referencemetric after a measurement run. In particular, we use the mean opinion score (MOS)[1] to express the QoE of the VoIP call. Therefore, the audio file sent is comparedwith the received wav-file using the Perceptual Evaluation of Speech Quality (PESQ)method described in ITU-T P.862 [16]. The resulting PESQ value can be mapped intoa subjective MOS value according to ITU-T Recommendation ITU-T P.862.1 [17]. TheMOS can take the following values: (1) bad; (2) poor; (3) fair; (4) good; (5) excellent.
3.3 Fitting the QoS onto QoE Mapping Function
The model function f(x) = α · e−βx + γ as derived in Eq. 3 mathematically expressesthe mapping from the value x of the considered QoS parameter to the QoE measure,i.e. MOS in this work. The parameters α, β, γ of the model function are retrieved bymeans of non-linear regression. We used the optimization toolbox of Matlab to find anoptimal fitting function for the given measurement points. Optimal in this case meansto find the unknown parameters α, β, γ in Eq. 3 such that the mean squarred error E2 isminimized. The mean squarred error is defined as the average of the squared residualsr2i = (f(xi) − yi)
2 for all n measurements (xi, yi) with a measured QoS value xi and ameasured MOS yi:
E2 =1
n
n∑
i=1
r2i =
1
n
n∑
i=1
(f(xi) − yi)2 . (11)
The goodness-of-fit for the model function f(x) can be measured with different metrics,like the coefficient of correlation R between the model function and the measured dataor the coefficient of determination R2. It can be computed as follows:
R2 = 1 −
∑ni=1
(yi − f(xi))2
∑ni=1
(yi − y)2(12)
9

3 Measurement Study for testing the IQX Hypothesis
with y = 1
n
∑ni=1
yi. A value close to one means a perfect match between the modelfunction and the measured data. Other common metrics are functions of the residualswhich show a perfect match between model and measurements if the value is close tozero. Examples are the mean squarred error E2 or the normalized mean squared errorNMSE = E2/V AR[yi] which is normalized by the variance of the measured MOS values.In this paper we use the coefficient of determination R2 to test the IQX hypothesis andto show the goodness-of-fit of the proposed exponential model function for the obtainedmeasurement results.
3.4 Verification of the Emulation of Network Conditions
Although NIST Net is a common tool for emulating network conditions, we conductedseveral test runs to investigate whether the desired network condidtions are correctlyemulated or not. Summarizing, NIST Net correctly emulates a) uncorrelated packet losswith input parameter for the packet loss probability pL and correlation factor L = 0,and b) correlated as well as uncorrelated delays with input parameters for the averagedelay µd, the standard deviation of the delay σd, and the correlation factor d. How-ever, correlated packet loss streams are not correctly emulated which is discussed in thefollowing.
3.4.1 Packet loss
For verifying the emulation of uncorrelated packet loss, we investigate the inter-packetloss distance K, that is the number K of received packets between two consecutivepacket losses. For a given packet loss probability pL, the inter-packet loss distancefollows a geometric distribution and P (K = i) = pL · (1 − pL)i for i = 0, 1, 2, . . . in caseof uncorrelated loss. Figure 2 compares the theoretical and the measured cumulative
0 10 20 30 40 50 60 700
0.1
0.2
0.3
0.4
0.5
0.6
0.7
0.8
0.9
1
number of received packets between two losses
CD
F
theoretical
measured
theoretical
pL = 5%
pL = 10%
measured underemulated network
conditions
Figure 2: Verifying the emulation of uncorrelated packet loss
10
3 Measurement Study for testing the IQX Hypothesis
distribution functions (CDF) of the inter-packet loss distance for pL = 0.1 and pL = 0.05.For sufficient long test runs, the measured packet loss ratio pL approaches the presetdropping probability.
3.4.2 Delay and Jitter
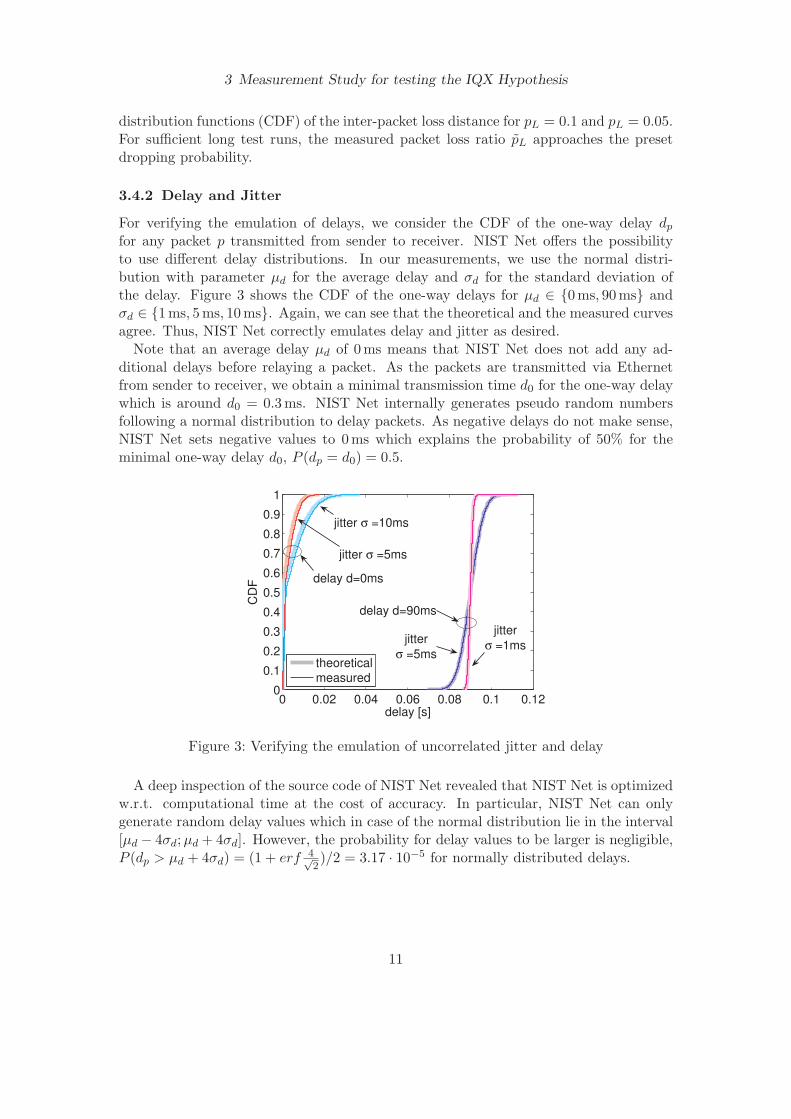
For verifying the emulation of delays, we consider the CDF of the one-way delay dp
for any packet p transmitted from sender to receiver. NIST Net offers the possibilityto use different delay distributions. In our measurements, we use the normal distri-bution with parameter µd for the average delay and σd for the standard deviation ofthe delay. Figure 3 shows the CDF of the one-way delays for µd ∈ {0 ms, 90 ms} andσd ∈ {1 ms, 5 ms, 10 ms}. Again, we can see that the theoretical and the measured curvesagree. Thus, NIST Net correctly emulates delay and jitter as desired.
Note that an average delay µd of 0 ms means that NIST Net does not add any ad-ditional delays before relaying a packet. As the packets are transmitted via Ethernetfrom sender to receiver, we obtain a minimal transmission time d0 for the one-way delaywhich is around d0 = 0.3 ms. NIST Net internally generates pseudo random numbersfollowing a normal distribution to delay packets. As negative delays do not make sense,NIST Net sets negative values to 0 ms which explains the probability of 50% for theminimal one-way delay d0, P (dp = d0) = 0.5.
0 0.02 0.04 0.06 0.08 0.1 0.120
0.1
0.2
0.3
0.4
0.5
0.6
0.7
0.8
0.9
1
delay [s]
CD
F
theoretical
measured
delay d=90ms
jitter
σ =5ms
jitter
σ =1ms
delay d=0ms
jitter σ =10ms
jitter σ =5ms
Figure 3: Verifying the emulation of uncorrelated jitter and delay
A deep inspection of the source code of NIST Net revealed that NIST Net is optimizedw.r.t. computational time at the cost of accuracy. In particular, NIST Net can onlygenerate random delay values which in case of the normal distribution lie in the interval[µd − 4σd; µd + 4σd]. However, the probability for delay values to be larger is negligible,P (dp > µd + 4σd) = (1 + erf 4√
2)/2 = 3.17 · 10−5 for normally distributed delays.
11

3 Measurement Study for testing the IQX Hypothesis
3.4.3 Autocorrelated Packet Streams
The emulation of autocorrelated packet streams is basically approximated by a first-order autoregressive process AR(1) with yi = xi · (1 − ) + yi−1 in NIST Net. Forgenerating the next random value yi the fraction of the previous random value yi−1 istaken into account which leads to an autocorrelation of at lag 1.
However, the current implementation does not correctly emulate autocorrelated packetlosses which would be one possibility to produce bursty losses. We deeply investigatedthe source code and found out that the error stems from internal conversions between16 bit and 32 bit integer values. A formal mathematical proof that for a given packetloss probability pL and a correlation factor L NIST Net generates a packet stream witha measured packet loss ratio pL = pL and ˜L = 0 (instead of ˜L = L) can be found inthe technical report [18].
0 5 10 15 20 25 30 35 40 45 500
5
10
15
20
25
30
35
40
45
50
jitter σ [ms]
std
OW
D ω
[m
s]
target valuer = 0.5r = 0.9r = 0.99r = 0.999r = 0.9999
adjusted autocorrelation rtoo high for correctemulation
Figure 4: Measured standard deviation of the one-way delays ω depending on jitter σpreset in network emulation package NistNet for different autocorrelation set-tings r = d
Next, we check the emulation of autocorrelated delay values. Figure 4 plots themeasured standard deviation ω of one-way delays on the y-axis against the given jittervalues σd passed to NIST Net on the x-axis. We varied the correlation factor d assignedto NIST Net from 0.5 to 0.9999. Independently of the preset correlation factor d,labeled with r in Figure 4, the measurement results should lie on the line ω(σd) =σd. For d < 0.9, the generated delay values are as desired. However, for very largecorrelation factors d ≥ 0.99, NIST Net does not correctly emulate the given parametersettings. In this work, we therefore investigate the impact of autcorrelated delay valuesfor correlation factors d ∈ {0.5, 0.9} only. In the following, we will investigate whetherdelay correlations in packet streams have an impact at all on the QoE.
12

4 Measurement Results and Analysis
4 Measurement Results and Analysis
The measurements presented here were conducted during January 2007 and April 2007at the Routerlab of the University of Wurzburg. We test the IQX hypothesis for differentpreset QoS parameters, that are packet loss, delay and jitter. For quantifying these QoSparameters, we use the metrics as defined in Sec. 3.2. For each of the QoS parametersetting ten individual measurement runs were repeated to gain statistical significantdata. In the following figures, Figure 5 – Figure 13, a single dot represents a singlemeasurement run with the measured QoS value as obtained by the packet trace on thex-axis and the observed mean opinion score on the y-axis.
To demonstrate whether an exponential interdependency between the QoS and theQoE can be observed when varying a single QoS parameter, we fit the measurementdata as described in Sec. 3.3. The resulting exponential model function is plotted ineach corresponding figure, the obtained optimal parameters of Eq. 3 are annotated, aswell as the coefficients of determination R2 are given as goodness-of-fit measure.
4.1 Voice quality affected by loss
We start to investigate the influence of packet loss on the user perceived quality. Fig-ure 5 and Figure 6 show the measurement results for the iLBC and the G.711 codec,respectively. In these experiments, the packet loss pL was varied from 0% up to 40%in steps of 1%. Furthermore, we performed the measurements without any additionaldelay µd = 0 ms and with an additional delay of µd = 90 ms emulated by NIST Net.
The first observation is that there is a clear exponential relationship between thepacket loss ratio and the MOS for iLBC as well as G.711. The results show that theIQX hypothesis holds for this scenario. Thus, the QoE degradation is very strong whenthe packet loss ratio increases slightly. For iLBC, the MOS is 4 without any loss, 3 for1.6% packet loss, and 2 for 4.5% packet loss. For G.711, the MOS is also 4 without anyloss, 3 for 1.4% packet loss, and 2 for 4% packet loss. The second observation is thatthe additional delay of 90 ms has no influence on this relationship – which is expected,as only large delays above 200 ms have an additional impact on the QoE according toITU-T recommendation G.114, cf [19].
13

4 Measurement Results and Analysis
0 0.05 0.1 0.15 0.2 0.25 0.3 0.35 0.41
1.5
2
2.5
3
3.5
4
4.5
5
packet loss
MO
S
R2
0ms = 0.9887
R2
90ms = 0.9885
measured with delay d=0msmeasured with delay d=90msexponential fitting
f iLBC
(pL) =2.866 ⋅ e
−26.335⋅pL+1.122
Figure 5: Measurement results and obtained mapping function fiLBC(pL) betweenpacket loss ratio pL and MOS for the iLBC codec
0 0.05 0.1 0.15 0.2 0.25 0.3 0.35 0.41
1.5
2
2.5
3
3.5
4
4.5
5
packet loss
MO
S
R2
0ms = 0.9774
R2
90ms = 0.9749
measured with delay d=0msmeasured with delay d=90msexponential fitting
f G.711
(pL) =2.861 ⋅ e
−29.816⋅pL+1.134
Figure 6: Measurement results and obtained mapping function fG.711(pL) between packetloss ratio pL and MOS for the G.711 codec
4.2 Voice quality affected by jitter and reordering
Next, the influence of jitter on the QoE is investigated. In the experiments, we vary thejitter σd from 0 ms to 30 ms in steps of 1 ms, and afterwards in steps of 5 ms up to 80 ms.Again, we executed the measurements without any additional delay µd = 0 ms and withan additional delay of µd = 90 ms. In this case, different results for both average delayvalues are expected as the variability of the delay values generated by NIST Net follows anormal distribution with parameters µd and σd. We will see that as a consequence of thejitter, packet reordering occurs, which decreases the user perceived quality. Describing
14

4 Measurement Results and Analysis
this influence on the application with an appropriate packet reordering metric allowsto verify again the IQX hypothesis for both codecs. However, their performance differssignificantly, and we therefore start to provide the results for iLBC before the G.711results are depicted.
4.2.1 iLBC
We first investigate the jitter value σd as QoS parameter to test the IQX hypothesis.Figure 7 reveals that the measurement values scatter much more around the exponentialfitting function than for the packet loss curves in the previous section. Obviously, fora certain jitter setting, no extra delay (µd = 0 ms) leads to higher MOS values than ascenario with an average delay of 90 ms.
Typically, real-time applications like VoIP or video streaming are able to handle jitterup to a certain level by using a jitter buffer. This explains why for small jitter valuesbelow 10 ms the curves are more flat and the QoE degradation is not so strong withincreasing jitter, especially for µd = 0 ms. After that the MOS again show exponentialdecays. As the fitting is done for all variations of σd, the obtained mapping funcitionfrom QoS to QoE shows a worse coefficient of determination.
However, in the experiments described above, the delay values are randomly generatedand uncorrelated. Hence, packets might overtake each other and packet reordering oc-curs. Therefore, we use now as metric the packet reordering ratio ρ to quantify the QoS.To highlight this clearly, we use the MOSs and packet traces from the measurements asin Figure 8, but as QoS metric we calculate ρ instead using σd.
As a result of Figure 8, we clearly observe an exponential relationship between theQoE and the QoS. We obtain as large goodness-of-fit values as for packet loss and henceconfirm again the IQX hypothesis. The main result of this section is that the importantchallenge consists in finding the appropriate QoS metric for describing the effect of theQoS influence on the QoE. In this particular case, this means that SJPhone gets intotrouble when packets are reordered. Obviously, on application layer, packet reorderinghas a similar impact as packet loss. If packets are reordered, they are not processed anymore by SJPhone. In particular, it is possible to convert the packet reordering ratio ρto a packet loss ratio pL such that the same MOS values are obtained f(pL) = f(g(ρ)).From the results in Figure 5 and Figure 8, we compute the conversion function g foriLBC and µd = 90 ms:
pL = g(ρ) = max{0.3837 · ρ − 0.0054, 0} . (13)
This means that the packet loss is a linear function of the reordering ratio.
15

4 Measurement Results and Analysis
0 10 20 30 40 50 60 70 801
1.5
2
2.5
3
3.5
4
4.5
5
jitter σ [ms]
MO
S
R2
0ms = 0.8846
R2
90ms = 0.8898
measured with delay d=0ms
measured with delay d=90ms
Figure 7: Measurement results and obtained mapping functions between preset jitter σand MOS for the iLBC codec
0 0.1 0.2 0.3 0.4 0.51
1.5
2
2.5
3
3.5
4
4.5
5
Type−P−Reordered−Ratio
MO
S
R2
0ms = 0.9812
R2
90ms = 0.9854
fiLBC
0ms(ρ) = 2.735 ⋅ e
−12.179⋅ρ+1.128
fiLBC
90ms(ρ) = 2.479 ⋅ e
−10.495⋅ρ+1.143
measured with delay d=0ms
measured with delay d=90ms
Figure 8: Measurement results and obtained mapping function fiLBC(ρ) between Type-P-Reordered-Ratio ρ and MOS for the iLBC codec
Table 3 shows the mean squared errors E2 of the exponential mapping function be-tween QoS and QoE when applying different QoS metrics to describe the impact of jitter.The QoS metrics are defined as in Sec. 3.2. We additionally give the results for somemore common metrics, as defined in [20], without explicitly showing the fittings due tolack of space. Table 3 includes the results for iLBC and G.711 while the delay is either0 ms or 90 ms. From the table, we conclude that in all scenarios the packet reorderingmetrics reveal the relationship to the QoE better than the pure jitter metrics. However,this is not a general statement, in particular, this is caused by the fact that the usedapplication has problems with packet reordering which affects the user perceived quality.
16

4 Measurement Results and Analysis
Table 3: Mean squarred errors E2 of the IQX hypothesis for different QoS metrics appliedto describe the impact of jitter
iLBC with delay G.711 with delay0 ms 90 ms 0 ms 90 ms
ratioreordered ρsin0.097 0.067 0.063 0.036
meann−reord 0.086 0.061 0.041 0.030
meanreord−extent 0.089 0.072 0.040 0.035
meann−times−reord 0.087 0.066 0.040 0.032
meanreordered−late−time τ 0.108 0.091 0.056 0.036
IPDVsin0.158 0.110 0.258 0.243
stdOWD ωsin0.158 0.112 0.259 0.241
jitter σd (NIST Net) 0.191 0.151 0.255 0.244
4.2.2 G.711
The impact of jitter on the QoE is analogously examined for the G.711 voice codec. InFigure 9, the jitter value σd, which is passed as input parameter to NIST Net, is usedas QoS parameter. The same observations as for iLBC are obtained. For a certain jittervalue σd > 0, a lower average delay leads to a higher MOS. If the jitter values are below10 ms, the curves are quite flat and the QoE degradation is not so strong with increasingjitter. For larger jitter values, the QoE in terms of MOS decays. However, the decay isnot so strong as for iLBC. This is caused by the fact that as soon as jitter appears, i.e.even for σd = 1 ms, the MOS drops down to a value of 2, i.e. the quality is already poor.Note that for σd = 0 ms the MOS is about 4, i.e. good quality.
An explanation for this can be found when investigating the sending pattern of theSJPhone application. Even though the G.711 codec is defined with a constant packetsending rate of 50 s−1, SJPhone uses intervals of length 32 ms to send packets. In orderto achieve the desired bit rate, several packets are sent together. In detail, we observedthe following pattern of time intervals in milliseconds between two consecutively sentpackets: 0, 32, 32, 0, 32, 32, 0, 32. In total, this leads to an average time of 20 ms betweentwo packets. Thus, the codec mean bit rate is realized, but the single inter-packet delayvaries. An inter-packet delay of 0 ms means that two packets are sent together at thesame time. For the implementation of G.711 in SJPhone, this means that 37.5% of thepackets are sent together. As a consequence, even a very small jitter like σd = 1 msmight lead to packet reordering and causes a strong QoE degradation. For σd = 1 ms,we already obtain a packet reordering ratio of roughly 15%.
In Figure 10, we use the mean reordered late time τ to describe the impact of jitterand the resulitng packet reordering as QoS parameter. Again, the IQX hypothesis canbe confirmed and an exponential relationship between QoS and QoE is found.
17

4 Measurement Results and Analysis
0 10 20 30 40 50 60 70 801
1.5
2
2.5
3
3.5
4
4.5
5
jitter σ [ms]
MO
S
R2
0ms = 0.7237
R2
90ms = 0.8339
measured with delay d=0ms
measured with delay d=90ms
Figure 9: Measurement results and obtained mapping function fG.711(σ) between presetjitter σ and MOS for the G.711 codec
0 0.01 0.02 0.03 0.04 0.05 0.061
1.5
2
2.5
3
3.5
4
4.5
5
meanreordered−late−time
τ
MO
S
R2
0ms = 0.9559
R2
90ms = 0.9733
fG.711
0ms(τ) = 1.084 ⋅ e
−213.298⋅τ+1.181
fG.711
90ms(τ) = 0.899 ⋅ e
−149.495⋅τ+1.130
measured with delay d=0ms
measured with delay d=90ms
Figure 10: Measurement results and obtained mapping function fG.711(τ) between meanreordered late time τ and MOS for the G.711 codec
4.3 Influence of Autocorrelated Packet Streams
Up to now we have investigated the impact of uncorrelated packet streams. In the contextof packet loss, this means that packets are dropped randomly. As a consequence ofuncorrelated delays, much more packet reordering occurs than for correlated delay whichmight be caused e.g. by queues at router along the end-to-end path. In the previoussection, we have already seen that for the actual implementation of the G.711 codecin SJPhone very small jitter values result in a high packet reordering ratio. For iLBCin contrast, this weird application phenomena was not observed. Therefore, we focus
18

4 Measurement Results and Analysis
on the iLBC codec using SJPhone when investigating autocorrelated packet streams.As NIST Net does not correctly emulate autocorrelated packet loss, we generate burstylosses by dropping n subsequent packets. In particular, we investigate the impact ofn ∈ {0, . . . , 300} consecutively lost voice datagrams on the QoE. Before that, we take acloser look at correlated delay values, which are correctly generated by NIST Net.
4.3.1 Autocorrelated delay values
We have already shown that NIST Net correctly emulates delay values for any correlationfactor d ≤ 0.9, that is the measured delay values show an average delay µd, a standarddeviation σd, and a autocorrelation ˜d which correspond to the parameter settings presetin NIST Net. In the scenario, we consider µd = 90 ms and no packet loss pL = 0, whilethe jitter is varied in the range σd ∈ [0 ms; 50 ms]. As correlation factor, we use eitherr = d = 0.5 or r = d = 0.9.
Figure 11 shows the measured standard deviation ω of the one-way delay vs. MOS. Thecolor of the dots indicates the preset NIST Net setting. It shows that independently of thecorrelation factor, the measured delays ω meet the preset jitter values σd. Furthermore,there is a clear difference between the curves for the different correlation factors. Forr = 0.9 the obtained MOS values are larger than for r = 0.5. This is expected as a largercorrelation reduces the reordering of packets.
Therefore, we describe the impact of the QoS on the QoE using the packet reorderingratio ρ. Figure 12 shows the measurement results using ρ instead of ω. For a highcorrelation factor r = 0.9, we obtain a reorderin ratio ρ ∈ [0; 0.15] according to thepreset jitter σd. This means at most 15% of the packets are reordered even for a jitter of50 ms. A lower correlation factor r = 0.5 means that the one-way delays of consecutivedelays do not depend so strongly on each other. As a result, a packet reordering ratioup to 45% emerges for σ = 50 ms. Nevertheless, for the same reordering ratio ρ, theobserved MOS is higher for less correlated delay r = 0.5 than for strongly correlatedones, r = 0.9. Note that in Figure 12, the majority of measurement results for r = 0.9shows a reordering ratio ρ < 5% and MOS values larger than 2.5. In contrast, forr = 0.5, the reordering ratio goes up to 25% and MOS values are only larger than 1.5.As a main result, both curves can be well fitted by an exponential distribution. However,the actual curves strongly depend on the correlation factor. A more detailed analysisand the usage of different network emulator environments to investigate autocorrelatedpacket streams is a topic of future work.
19

4 Measurement Results and Analysis
0 0.01 0.02 0.03 0.04 0.05 0.061
1.5
2
2.5
3
3.5
4
4.5
5
stdOWD
ω [ms]
MO
S
r = 0.5
r = 0.9
jitte
r σ
[m
s]
0
5
10
15
20
25
30
35
40
45
50
Figure 11: Measurement results for the iLBC codec depending on the measured one-waydelay ω
0 0.05 0.1 0.15 0.2 0.25 0.3 0.35 0.4 0.45 0.51
1.5
2
2.5
3
3.5
4
4.5
5
Type−P−Reordered−Ratio
MO
S
R2
r=0.5 = 0.9338
R2
r=0.9 = 0.8387 jit
ter
σ [
ms]
0
5
10
15
20
25
30
35
40
45
50r = 0.5r = 0.9exponential fitting
Figure 12: Measurement results for the iLBC codec depending on the measured packetreordering ratio ρ
4.3.2 Bursty Losses
Finally, the impact of bursty losses on the QoE is examined. As we know that NIST Netcannot be used for the emulation of bursty losses by adjusting the correlation factor forpacket loss, this investigation was performed in a different way. On a local machine, wepacketised the audio signal using the iLBC codec and dropped selected voice datagrams.To be more precise, we dropped n consecutive voice datagrams starting from voicedatagram n0. After that, the remaining voice datagrams were passed to the iLBC codec
20

5 Conclusion and Outlook
to be decoded as audio signal. Accordingly, the QoE was derived in the same manneras described in Sec. 3.2.
Figure 13 shows the number n of consecutively lost datagrams on the x-axis and theMOS on the y-axis. We also varied over n0 which denotes the first lost packet. Obviously,the larger n, the worse the MOS becomes. For n ≤ 50 there are no significant differencesbetween the different curves for the first lost packet n0. However, larger n > 50 makethe curves disperse. Note that this corresponds to a silent period of 1.5 s and it is notclear whether the PESQ and MOS computation is able to correctly map this silenceperiod on the real user experienced degree of satisfaction. Indeed, if the silence periodis too long, a user will probably abort a call. However, this is hardly considered in thiscomputation.
One more remarkable observation is that n = 50 consecutively lost packets means apacket loss ratio of pL = 3%, as the transmitted voice file has a length of 51 s consistingof 1700 iLBC voice datagrams. However, the observed MOS value of roughly 3.7 ismuch higher than for the same packet loss ratio with randomly dropped packets at aMOS value of 2.4. But it has to be noted that in this last experiment, the voice signalswere locally encoded and decoded, but not transmitted via the test bed. Therefore, wesuggest to modify NIST Net or use a different network emulator which easily allows toinvestigate bursty loss models. This is also a topic of future work we want to focus on.
0 50 100 150 200 250 3001
1.5
2
2.5
3
3.5
4
4.5
5
number of consecutively lost datagrams
MO
S
100300500700900
first lost
packet
Figure 13: Impact of bursty losses on the QoE for iLBC
5 Conclusion and Outlook
In this paper, we have validated an exponential interdependency of Quality of Expe-rience (QoE), reflecting the degree of user satisfaction, from Quality of Service (QoS)disturbances formulated as IQX hypothesis. This validation was performed for the voicecodecs iLBC and G.711 used in VoIP scenarios. The experimental setup consisted oftwo computers, each running the softphone SJPhone, interconnected by a third machine
21

References
hosting the network emulator software NIST Net. This software allows among others forpresetting the experimental conditions in terms of packet loss, one-way delay and delayjitter.
For each preset packet loss, delay and jitter setting, the received audio file is comparedto the undistorted file by software determining the PESQ (Perceptual Evaluation ofSpeech Quality) and subsequent calculation of MOS (Mean Opinion Score). In case ofpacket loss, the exponential decay of QoE with growing QoS disturbance was clearlyconfirmed. While the effect of (constant) one-way delay is rather limited due to thefact that the receiver receives all packets with a constant delay, delay jitter also givesraise to exponentially-looking shapes, however with some remarkable deviations for smalljitter values. A closer investigation of the traffic flow associated with SJPhone revealsthe cause for this behavior, that is a pronounced sensitity of that particular softphoneto packet reordering introduced by NIST Net. Plotting the QoE against the packetreordering ratio, we again observe a clear exponential interdependency.
In addition to these measurement results, we verified our testbed and in particularwhether the emulated network conditions are emulated as desired. As a result, we foundout that while NIST Net is capable of producing autocorrelated packet delay, it does notmanage to impose autocorrelated packet loss. Thus, we cannot use the tool to emulateburst losses that can have a distinctive effect on QoE - the receiver misses a part of thespeech.
Despite of these limitations, our investigations have shown that the IQX hypothesisappropriately captures the main vulnerabilities shown by the application SJPhone to-wards network-level disturbances, expressed in packet loss and reordering. This alsoshows the capability of the IQX hypothesis to identify the relevant performance metrics.
Future work will address autocorrelated packet streams and bursty loss models. Suchstudies require the incorporation of a different network emulator that allows for ad-vanced queuing features, for instance avoiding packet reordering and thus allowing forthe incorporation of Furthermore, the joint effect of several QoS disturbances should bestudied quantitatively.
References
[1] ITU-T Recommendation, “ITU-T Rec. P.800.1: Mean Opinion Score (MOS) Ter-minology,” 2003.
[2] M. E. Perkins, K. Evans, D. Pascal, and L. A. Thorpe, “Characterizing the sub-jective performance of the ITU-T 8 kb/s speech coding algorithm-ITU-T G.729,”IEEE Communications Magazine, vol. 35, no. 9, 1997.
[3] R. Kwitt, T. Fichtel, and T. Pfeiffenberger, “Measuring perceptual VoIP speechquality over UMTS,” in 4th International Workshop on Internet Performance, Sim-ulation, Monitoring and Measurement (IPS-MoMe 2006), (Salzburg, Austria), 2006.
[4] T. Hoßfeld, A. Binzenhofer, M. Fiedler, and K. Tutschku, “Measurement and anal-ysis of skype voIP traffic in 3g UMTS systems,” in 4th International Workshop
22

References
on Internet Performance, Simulation, Monitoring and Measurement (IPS-MoMe2006), (Salzburg, Austria), 2 2006.
[5] A. P. Markopoulou, F. A. Tobagi, and M. J. Karam, “Assessing the quality of voicecommunications over internet backbones,” IEEE/ACM Trans. Netw., vol. 11, no. 5,2003.
[6] ITU-T Recommendation, “ITU-T Rec. G107: The E-model, a computational modelfor use in transmission planning,” 1998.
[7] L. Ding and R. A. Goubran, “Speech quality prediction in VoIP using the extendedE-model,” in GLOBECOM 2003 - IEEE Global Telecommunications Conference,(San Francisco, USA), 2003.
[8] A. Richards and G. Rogers and M. Antoniades and V. Witana, “Mapping UserLevel QoS from a Single Parameter,” in In Proceedings of MMNS ’98, (Versailles,France), 1998.
[9] T. Hoßfeld, P. Tran-Gia, and M. Fiedler, “Quantification of quality of experiencefor edge-based applications,” in 20th International Teletraffic Congress (ITC20),(Ottawa, Canada), 6 2007.
[10] Signalogic, “Speech codec wav samples.” http://www.signalogic.com/melp/ En-gSamples/Orig/male.wav.
[11] “http://www.sjlabs.com.”
[12] G. Almes, S. Kalidindi, and M. Zekauskas, “A One-way Delay Metric for IPPM.”RFC 2679 (Proposed Standard), September 1999.
[13] A. Binzenhofer, D. Schlosser, K. Tutschku, and M. Fiedler, “An autonomic approachto verify end-to-end communication quality,” in Tenth IFIP-IEEE InternationalSymposium on Integrated Network Management (IM 2007), (Munich, Germany), 52007.
[14] C. Demichelis and P. Chimento, “IP Packet Delay Variation Metric for IP Perfor-mance Metrics (IPPM).” RFC 3393 (Proposed Standard), Nov. 2002.
[15] A. Morton, L. Ciavattone, G. Ramachandran, S. Shalunov, and J. Perser, “PacketReordering Metrics.” RFC 4737 (Proposed Standard), Nov. 2006.
[16] ITU-T Recommendation P.862, “Perceptual evaluation of speech quality (PESQ),an objective method for end-to-end speech quality assessment of narrowband tele-phone networks and speech codecs,” 2001.
[17] ITU-T Recommendation, “ITU-T Rec. P.862.1: Mapping function for transformingP.862 raw result scores to MOS-LQO,” 2003.
23

References
[18] T. Hoßfeld, D. Hock, K. Tutschku, P. Tran-Gia, and M. Fiedler, “Investigating theexponential interdependency between qoe and qos for voip,” tech. rep.
[19] I. T. Union, “ITU-T recommendation G.114: One-way transmission time,” tech.rep., 5 2003.
[20] A. Morton, L. Ciavattone, G. Ramachandran, S. Shalunov, and J. Perser, “Packetreordering metrics.” RFC 4737 (Proposed Standard), Nov. 2006.
24
Related Documents