Graduate eses and Dissertations Iowa State University Capstones, eses and Dissertations 2013 Testing the Effectiveness of Video to Complement or Replace the Lecture/demonstration Group Training Approach for Farmers in Kamuli District, Uganda Tian Cai Iowa State University Follow this and additional works at: hps://lib.dr.iastate.edu/etd Part of the African Languages and Societies Commons , African Studies Commons , Communication Commons , and the Sustainability Commons is esis is brought to you for free and open access by the Iowa State University Capstones, eses and Dissertations at Iowa State University Digital Repository. It has been accepted for inclusion in Graduate eses and Dissertations by an authorized administrator of Iowa State University Digital Repository. For more information, please contact [email protected]. Recommended Citation Cai, Tian, "Testing the Effectiveness of Video to Complement or Replace the Lecture/demonstration Group Training Approach for Farmers in Kamuli District, Uganda" (2013). Graduate eses and Dissertations. 13078. hps://lib.dr.iastate.edu/etd/13078

Welcome message from author
This document is posted to help you gain knowledge. Please leave a comment to let me know what you think about it! Share it to your friends and learn new things together.
Transcript

Graduate Theses and Dissertations Iowa State University Capstones, Theses andDissertations
2013
Testing the Effectiveness of Video to Complementor Replace the Lecture/demonstration GroupTraining Approach for Farmers in Kamuli District,UgandaTian CaiIowa State University
Follow this and additional works at: https://lib.dr.iastate.edu/etd
Part of the African Languages and Societies Commons, African Studies Commons,Communication Commons, and the Sustainability Commons
This Thesis is brought to you for free and open access by the Iowa State University Capstones, Theses and Dissertations at Iowa State University DigitalRepository. It has been accepted for inclusion in Graduate Theses and Dissertations by an authorized administrator of Iowa State University DigitalRepository. For more information, please contact [email protected].
Recommended CitationCai, Tian, "Testing the Effectiveness of Video to Complement or Replace the Lecture/demonstration Group Training Approach forFarmers in Kamuli District, Uganda" (2013). Graduate Theses and Dissertations. 13078.https://lib.dr.iastate.edu/etd/13078

Testing the effectiveness of video to complement or replace the lecture/demonstration
group training approach for farmers in Kamuli District, Uganda
by
Tian Cai
A thesis submitted to the graduate faculty
in partial fulfillment of the requirements for the degree of
MASTER OF SCIENCE
Major: Journalism and Mass Communication
Program of Study Committee:
Eric A. Abbott, Major Professor
Robert E. Mazur
Frederick O. Lorenz
Lulu Rodriguez
Iowa State University
Ames, Iowa
2013
Copyright © Tian Cai, 2013. All rights reserved

ii
TABLE OF CONTENTS
LIST OF FIGURES ............................................................................................................................ iv
LIST OF TABLES ............................................................................................................................... v
ACKNOWLEDGEMENTS.................................................................................................................vi
ABSTRACT ........................................................................................................................................ vii
Chapter 1 INTRODUCTION AND STATEMENT OF THE PROBLEM ..................................... 1
Chapter 2 LITERATURE REVIEW AND THEORETICAL FRAMEWORK ............................ 3
2.1 Information Processing and the Power of Visuals ...................................................................... 3
2.2 Videos in Training ....................................................................................................................... 6
2.3 Localization of Training Videos .................................................................................................. 7
2.4 Length of Training Videos ........................................................................................................... 8
2.5 Small Group Training Using Video ............................................................................................. 8
2.6 Video Training and Gender ......................................................................................................... 9
2.7 Use of Pico Projectors for Video Training ................................................................................ 10
2.8 Video as a Complement to Traditional Training Methods ........................................................ 11
2.9 Video as a Stand-Alone Training Material ................................................................................ 12
2.10 Video and Participatory Training ........................................................................................... 13
2.11 Research Questions ................................................................................................................. 14
Chapter 3 METHOD ......................................................................................................................... 16
3. 1 Geographic location of the study .............................................................................................. 16
3.2 The Study Design ....................................................................................................................... 20
3.2.1 Sampling ............................................................................................................................ 20
3.2.2 Experimental Groups .......................................................................................................... 20
3.3 Experimental Procedure ............................................................................................................ 22
3.4 Training Topic and Video .......................................................................................................... 23
3.5 Conceptual and Operational Definitions of Study Variables .................................................... 23
3.6 Data Analysis ............................................................................................................................. 27
CHAPTER 4 RESULTS AND DISCUSSION ................................................................................. 28
4.1 Comparison of Demographic Characteristics by Experimental Group .................................... 28
4.2 Research Questions 1 and 2: Video as a Complement to or Replacement for the Traditional
Lecture/Demonstration Training Method ........................................................................................ 31
4.2.1 Pre-test of Subjects’ Knowledge Level, Attitude and Adoption of Row Planting Before
Training ....................................................................................................................................... 31
4.2.2 Knowledge Scores Before Training (Time 1 Score) .......................................................... 33
4.2.3 Knowledge Test Scores After Training (Time 2 Score) ..................................................... 34

iii
4.2.4 Knowledge Scores Before and After Training ................................................................... 35
4.2.5 Attitude and Adoption Intention After Training ................................................................ 39
4.3 Evaluation of the Training Methods .......................................................................................... 39
4.3.1 Quality Evaluation .............................................................................................................. 39
4.3.2 Advantages, Disadvantages and Suggestions About the Traditional
Lecture/ Demonstration and Video Training Methods ................................................................ 40
4.4 Research Question 3: Can Video Training Decrease the Knowledge Gap Among Farmers
Who Differ by Gender, Acres Planted to Beans, and Educational Levels? ..................................... 44
4.4.1 Change in Knowledge Score by Gender ............................................................................ 45
4.4.2 Change in Knowledge Scores by Acres of Beans Planted for Each Group ....................... 49
4.4.3 Change in Knowledge Scores by Education Level ............................................................ 53
CHAPTER 5 CONCLUSIONS ......................................................................................................... 57
5.1 Findings ..................................................................................................................................... 57
5.1.1 Video Can Effectively Complement the Traditional Lecture/ Demonstration ................... 57
5.1.2 Video Can be an Effective Replacement for the Traditional Lecture/Demonstration
Method ....................................................................................................................................... 58
5.1.3 Training Decreases the Knowledge Gaps .......................................................................... 59
5.1.4 A Disadvantage of the Video Only Method: Low Interaction ........................................... 60
5.2 Limitations of the Study ............................................................................................................. 61
5.3 Suggestions for Future Study ..................................................................................................... 64
REFERENCES ................................................................................................................................... 65
APPENDIX A IRB EXEMPT FORM .............................................................................................. 69
APPENDIX B QUESTIONNAIRE .................................................................................................. 71
APPENDIX C INFORMATION SOURCES USED FOR BEAN PRODUCTION ..................... 80

iv
LIST OF FIGURES
Figure 1. Location of Kamuli District .................................................................................................. 18
Figure 2. Location of Butansi sub-county ............................................................................................ 19
Figure 3. The boxplot of Time 1 knowledge score in each experimental group .................................. 34
Figure 4. The boxplot of Time 2 Knowledge Scores for each experimental group ............................. 35
Figure 5. Knowledge scores of the three experimental groups before and after training .................... 37
Figure 6.1 Knowledge Scores at Time 1 and Time 2 by treatment and gender in traditional only
group ....................................................................................................................................... 48
Figure 6.2 Knowledge Scores at Time 1 and Time 2 by treatment and gender in traditional + video
group ....................................................................................................................................... 48
Figure 6.3 Knowledge Scores at Time 1 and Time 2 by treatment and gender in video only group ... 48
Figure 7.1 Knowledge Scores at Time 1 and Time 2 by treatment and scale of bean planted in
traditional only group .............................................................................................................. 52
Figure 7.2 Knowledge Scores at Time 1 and Time 2 by treatment and scale of bean planted in
traditional + video group ......................................................................................................... 52
Figure 7.3 Knowledge Scores at Time 1 and Time 2 by treatment and scale of bean planted in video
only group ............................................................................................................................... 52
Figure 8.1 Knowledge Scores at Time 1 and Time 2 by treatment and education levels in traditional
only group ................................................................................................................................ 56
Figure 8.2 Knowledge Scores at Time 1 and Time 2 by treatment and education levels in traditional
+ video group ........................................................................................................................... 56
Figure 8.3 Knowledge Scores at Time 1 and Time 2 by treatment and education levels in video only
group ........................................................................................................................................ 56

v
LIST OF TABLES
Table 1. The Study’s Experimental Design ......................................................................................... 21
Table 2. Knowledge Test Questions and Answers .............................................................................. 25
Table 3. Comparison of Demographic and Farming Characteristics of Subjects by Experimental
Group ................................................................................................................................................... 30
Table 4. Comparison of Demographic Characteristics of Subjects by Experimental Group ............... 30
Table 5. Problems Hindering Adoption of Row Planting ................................................................... 32
Table 6. Results of an ANOVA Testing the Difference in Knowledge Scores Among the Three
Groups at Time 1 ................................................................................................................................. 34
Table 7. Results of an ANOVA Testing the Difference in Knowledge Scores Among the Three
Groups at Time 2 ................................................................................................................................. 35
Table 8. Results of t-Tests Showing Difference in Time 1 & Time 2 Scores (Change Score) Within
Groups ......................................................................................................................................... 36
Table 9. Result of a Repeated Measures ANOVA Testing Differences in Knowledge Score at
Time 1 and Time 2 by Experimental Group ........................................................................................ 38
Table 10. Farmers’ Evaluation of Each Training Method ................................................................... 40
Table 11. Perceived Advantages of Each Training Method ................................................................ 43
Table 12. Perceived Disadvantages of Each Training Method ............................................................ 43
Table 13. Suggestions to Improve Training Methods .......................................................................... 44
Table 14. Bivariate Correlation of Knowledge Scores, Gender, Education and Acres Planted to Beans
(Acrebean) ................................................................................................................................... 45
Table 15. Knowledge Score Means (with Standard Deviations) at Time 1 and Time 2 by Treatment
and Gender ........................................................................................................................................... 47
Table 16. Results of a Repeated Measures ANOVA Testing the Differences in Knowledge Scores at
Time 1 and Time 2 Using Gender as a Covariate ................................................................................ 47
Table 17. Knowledge Means at Time 1 and Time 2 by Treatment and Bean Planting Scale .............. 51
Table 18. Results of a Repeated Measures ANOVA Testing Differences in Knowledge Scores in the
Three Groups at Time 1 and Time 2 Using Bean Planting Scale as Covariate ........................... 51
Table 19. Knowledge Score Means at Time 1 and Time 2 by Treatment and Education Level .......... 55
Table 20: Results of a Repeated Measures ANOVA Testing Differences in Knowledge Scores at
Time 1 and Time 2 Among the Experimental Groups Using Education as Covariate ........................ 55
Table 21. Use and Effectiveness of Information Sources for Bean Production ................................... 81
Table 22. The Most Frequently Used Information Sources for Bean Production ................................ 81
Table 23. Types of Information About Bean Production Received From Information Sources .......... 83

vi
ACKNOWLEDGEMENTS
I would like to thanks my major professor and committee chair, Dr. Abbott Eric, who are
always inspiring, responsible and compassionate, Dr. Robert Mazur, for his generous helps for
my filed research, Dr. Frederick O. Lorenz, for his unselfish helps in the data analysis methods
and Dr. Lulu Rodrigues, for all her important suggestions for my thesis and encourages during
my 3year-study in ISU.
In addition, I would also like to thank all the field staffs in VEDCO Kamuli Office for
helping me conducting my field training and data collection and for their company during my
stay in Kamuli. I would also like to thank all the farmers who participated in my research. I hope
they have a good harvest in this growing season.
Finally, thanks to my family for their support to all the decisions I made and
encouragements of chasing my dreams.
vii
ABSTRACT
This study explored the effectiveness of video as a tool to either complement or replace
existing lecture/demonstration training for small farmer groups. The effectiveness of video in
decreasing the knowledge gap among farmers who differ by gender, bean production volume,
and education level was also evaluated. Quantitative and qualitative data were gathered through a
quasi-experiment including a pre-test and a post-test design with three experimental groups.
Results showed that video could be an effective complement and replacement for the
conventional lecture/demonstration training method. The training method that included both
video and traditional lecture/demonstration was especially effective for groups with relatively
low prior knowledge of the training topic. Video alone or video plus traditional
lecture/demonstration were as effective as traditional training in decreasing gaps in learning
among subjects of both genders, varying education levels and scales of bean planting.
Video has advantages in rural areas because it does not require face-to-face presentation
by skilled trainers. Video might be an attractive alternative or supplement if the production cost
is low enough, or if conventional lecture/demonstration cannot meet the demand for training.
Using local actors, shooting video in the local environment and using local languages add to
video’s advantages for training purposes. When used to demonstrate a farming technique or
practice in a group setting, videos were found to enhance interaction (e.g. discussion and peer
learning) among farmers.

1
Chapter 1
INTRODUCTION AND STATEMENT OF THE PROBLEM
The purpose of this study is to learn about the effectiveness of video as a tool to either
complement or replace the existing lecture/demonstration mode of training small farmer groups.
Farmer groups in the Kamuli District of Uganda have been receiving training in topics relating to
sustainable rural livelihoods since 2005 as part of a livelihood improvement program coordinated
by Volunteer Efforts for Development Concerns (VEDCO), a Ugandan non-government
organization, the Center for Sustainable Rural Livelihoods (CSRL) at Iowa State University
(ISU), and Makerere University, Uganda. Although some interactive charts, handouts and photos
have been developed to support the traditional approach, lectures and hands-on demonstrations
have been the most commonly used training methods.
Currently, approximately 1,200 farmers are reached by the program. Training messages
are delivered by community-based trainers (CBTs), who are paid VEDCO staff members
selected from the local rural community. These CBTs have been trained and are supported by
VEDCO Program Extension Officers. Each CBT is responsible for eight to ten groups with a
total of approximately 100 farmers.
Evaluations have shown that although farmers have adopted some of the recommended
technologies, such as improved banana planting practices, there have been problems in
motivating farmers to attend group sessions. In addition, the CBTs report that farmers respond
better when different training approaches are used. Role playing, field demonstrations, and other
techniques have been tried in addition to standard lectures. Project staff members are interested
in increasing the impact of their activities in the area by expanding the number of farmers who

2 can benefit from farming recommendations. Video offers a means of complementing current
training modes or providing a stand-alone training method for other farmers.
Video is now commonly used as a training tool in many development projects. The use of
moving images and video’s flexibility of use have been cited as important advantages for
agricultural training in developing countries (Van Mele, 2011). However, in most cases, the use
of videos has not been carefully evaluated in terms of its possible complementary role as well as
its ability to replace current training approaches (Gurumurthy 2006; Gandhi, Veeraraghavan,
Toyama & Ramprasad, 2007; Zossou, Van Mele, Vodouhe & Wanvoeke, 2009a; Van Mele,
Wanwoeke & Zossou, 2010; Van Mele, 2011). The current study examines the use of locally
created videos that show local farmers on local fields using the local language.
A 2010 study by Van Mele, Wanwoeke and Zossou found that 78% of development
organizations, including universities, research institutes and non-government organizations
(NGOs) use video to train farmers. Until recently, however, video training in rural areas required
a generator, DVD player, projector and other audio-visual equipment. Farmers often had to come
to central areas to see them. These characteristics pose serious limitations to those who live in
the countryside with poor roads and where there is no electricity. In the past few years, small
battery-powered pocket projectors have been developed and tested to offset these difficulties.
Trainers on foot or bicycle can easily carry these portable devices to places where farmers live.
The increased capacity of these devices to extend training to rural areas has again focused
attention on how they might be used for training purposes. Thus, this study asks: (1) Can locally
created video enhance and/or complement existing training techniques? (2) Can video alone or
with minimal facilitation potentially replace the traditional training approach by the CBTs?

3
Chapter 2
LITERATURE REVIEW AND THEORETICAL FRAMEWORK
2.1 Information Processing and the Power of Visuals
Information processing theory emphasizes cognitive learning, which is considered to
involve receiving, processing, extracting, and remembering information initially stored in short-
term memory. Individuals construct a connection between a stimulus and prior knowledge and
store such associations in long-term memory. Information encoding and retrieval are also
important steps in the cognitive information processing approach (Miller, 1956), which
encourages learners to transfer and assimilate new information by processing, storing and
retrieving information for later use (Bovy, 1981).
In the information-processing framework, visual information has established its potential
for cognitive impact directly or by representing and allowing the elaboration of concepts,
abstractions, actions, metaphors, and modifiers (Scott 1994).
Educational literature suggests that individuals demonstrate a preference for particular
information processing styles to assimilate new information (Eastman, 2010). Other studies have
also shown that people apply different learning processes depending on the source of new
information (e.g., the channels of communication or media) (Coldevin, 2003). For example,
some learn better from and prefer the visual media compared to materials primarily delivered by
audio. MacInnis and Price (1987) compared what they call the “imagery (or symbol) process”
and “discursive (or language-oriented) process” that people generally resort to when exposed to
stimuli. The fundamental difference was that imagery processing promoted multi-sensory
experiences, such as smell, taste, sight and tactile sensations in working memory. In the

4 discursive process, sensory experience was absent, which made the discursive information
process more abstract.
Information from different media provides multiple reinforcing channels and thus is able
to accommodate various learning styles and preferences (Coldevin, 2003). That is, the use of
multiple channels that engage more senses makes it possible to present and reinforce messages in
multiple ways (Lie & Mandler, 2009, p. 20).
When it comes to quick, clear communication, visuals have advantages over text.
Psychologists (e.g., Mehrabian, 1981) have demonstrated that 93% of human communication is
nonverbal. This is so, Mehrabian (1981) explains, because the human brain deciphers image
elements simultaneously, while language is decoded in a linear, sequential manner, taking more
time to process.
Biologically, millions of years of evolution have genetically wired people to respond
differently to visuals than text. In short, some think better using pictures. Burmark (2002) writes
that "...unless our words, concepts, ideas are hooked onto an image, they will go in one ear, sail
through the brain, and go out the other ear. Words are processed by our short-term memory
where we can only retain about 7 bits of information (plus or minus 2)… Images, on the other
hand, go directly into long-term memory where they are indelibly etched" (p. 5). Therefore, it is
much easier to show than to describe with words.
The powerful images and contextualizing reality in video could help remove the learning
obstacle of low literacy people. By visually portraying many complicated issues or arguments
that might be hard for audiences to understand, video can be an effective tool for raising
awareness (Lie & Mandler, 2009).

5
In 1986, a study at the University of Minnesota School of Management found that
presenters who use visual aids were 43% more effective in persuading audience members to take
a desired course of action than presenters who did not use visuals. Researchers found that
average presenters who used visual aids were as effective as more advanced presenters who used
no visuals. In addition, the study found that the audience expected the advanced presenters to
include professional, quality visuals (Vogel, Dickson & Lehman, 1986).
Graphics have been found to quickly affect people cognitively and emotionally. At the
cognitive level, visuals expedite and increase the levels of communication. They increase
comprehension, recollection, and retention. Visual clues help people decode text, attract or direct
attention, increasing the likelihood that the audience will remember (Levie & Lentz, 1982).
People attracted to visual elements quickly absorb data more efficiently and effectively,
and also are affected emotionally. In other words, pictures also enhance or affect emotions and
attitudes (Levie & Lentz, 1982). They engage the imagination and heighten creative thinking by
stimulating other areas of the brain, which in turn leads to a more profound and accurate
understanding of the presented material (Bobrow & Norman, 1975). It also has been shown that
emotions “play an essential role in decision making, perception, learning, and more ... they
influence the very mechanisms of rational thinking" (van Oostendorp, Preece & Arnold, 1999, p.
67).
The emotional elements in video learning enhanced the effectiveness of Bangladeshi
videos when they were introduced to African audiences. The “enthusiasm, self-confidence and
emotions” of farmers who acted in the Bangladeshi video connected the African audiences and
“strongly complement the technical content” (Van Mele et al., 2010a, p. 85)

6
2.2 Videos in Training
Studies have shown that using videos increases training quality (Van Mele, 2011).
Compared with textual materials, videos, especially those done in the local language, transcend
the literacy barrier. In a 2011 survey, Van Mele found that approximately 80% of his
respondents who are members of development organizations, research institutes and NGOs, rated
videos “quite to very useful” in reaching less educated audiences. Video use in training also
decreased the technological support requirement of farmers (Gandhi et al., 2007). Videos also
can be very persuasive (Lie & Mandler, 2009). Agricultural concepts and technologies hard to
describe in words are easily understood when demonstrated visually. For example, video has
been used to demonstrate the cleanliness and low rates of breakage of parboiled rice, and was
effective in convincing farmers to increase the amount of parboiled rice they sell (Gandhi et al.,
2007). Long agricultural processes can be compressed into short video segments, thus enhancing
training efficiency (Lie & Mandler, 2009). These benefits can be harnessed as the cost of audio-
visual technologies substantially declines (Coldevin, 2003). Aspects of an actor’s character that
farmers find attractive enhance learners’ attentiveness (David & Asamoah, 2011). Video is
flexible because it can be shown anywhere at any time (Coldevin, 2003). Video also has been
used to standardize the information provided when interacting with farmers (Gandhi et al., 2007).

7
2.3 Localization of Training Videos
Effective training videos are those that depict local scenarios, examples and concerns.
Videos also are able to address local institutional barriers (Van Mele et al., 2010b). Eighty-five
percent of development organizations that responded to Van Mele’s (2011) online survey agreed
that videos in the local language and those that demonstrate farmers’ experience enhance training
effectiveness. In general, videos that integrate content, production and dissemination into the
local social condition are most likely to be accepted (Anderson, Dickey & Perkins, 2001). This is
so because such content provides evidence that recommended practices work under the local
environment (Gandhi et al., 2007). Lack of local context causes “impedance mismatches”
between audience and producers that hinder knowledge acquisition (Wang et al., 2005).
Chowdhury, Van Mele and Hauser (2011) found that farmers were more likely to be
convinced by videos featuring actors similar to themselves in dialect and accent, culture,
education and agricultural expertise. In their study, an experienced female farmer who appeared
in a Bangladesh rice video enhanced the perceived reliability of training materials. Farmer
audiences were more likely to adopt the recommended technology after seeing video showing
peers using it (Gandhi et al., 2007). Farmers’ interaction and participation in video production
and dissemination have been shown to be an effective localization method in many studies
(Zossou et al., 2009a; Gandhi et al., 2007; Shanthy & Thiagarajan, 2011).

8
2.4 Length of Training Videos
How long should these videos be? According to Van Mele (2011) videos should be
between 5 and 15 minutes in length in recognition of people’s limited information processing
capabilities. To present complex topics, AfricaRice extended its rice videos to 19 minutes. The
preferred length may also be culture-bound. For example, African farmers are more accepting of
longer videos compared with their peers in Asia (Van Mele, 2011). Special formats, such as
dramas and soap operas, are featured in these longer formats (Van Mele, 2011).
2.5 Small Group Training Using Video
When used for training purposes, videos are often shown to small groups of five to 30
farmers who live in close proximity to one another (Gandhi et al., 2007; Zossou, Van Mele,
Vodouhe & Wanvoeke, 2010; David & Asamoah, 2011). Training farmers as a group makes it
easier to repeat central points, promote discussion, collect feedback, and test trainees’
understanding (Coldevin, 2003). Digital Green formed training groups based on existing local
farmer cooperatives. In field tests, group participation guaranteed a regular schedule of content
screenings; encouraged learning, adoption and innovation through peer pressure; and even
reunited estranged family members (Gandhi et al., 2007). In Ghana, farmers in training groups
decreased the period needed to learn new technologies (David & Asamoah, 2011). The social
network built by Video Viewing Clubs (VVC) functioned beyond the duration of the project as
34% of participants continued to meet to share information even after the project was over.
Women in central Benin maintained their groups organized during video-mediated training in
which they were taught how to secure micro-finance services and how to market rice (Zossou et
al., 2010).

9
Often, a mediator/facilitator with some agricultural training organizes and manages the
training. In many instances, local facilitators are hired to conduct the training and record
attendance, feedback and adoption rates of recommended practices. Such an approach takes
advantage of available local knowledge sources and reduces logistical costs considerably. A
facilitator also had the added function of sustaining the trainees (Gandhi et al., 2007). In Ghana,
farmer-facilitators of video viewing clubs made the messages more credible to target audiences
(David & Asamoah, 2011).
2.6 Video Training and Gender
In general, individuals with higher socio-economic status are able to experiment and
adopt new technologies more quickly than those with low income and education (Rogers, 2003).
The latter characteristics often describe rural women who comprise the majority of the world’s
poorest (FAO, 2009). In addition, they lack access to information and resources that may save
labor and increase productivity (Butler & Mazur, 2007). However, women are often responsible
for multiple tasks in their family and their community.
Uganda ranked 116 out of the 141 countries in the United Nations’ Gender Inequality
Index (UNDP, 2011). Only 9.1% of Uganda females have at least secondary education (UNDP,
2011); they have limited access to information beyond their local communities (Rogers, 2003).
Because men are usually the key decision makers (Zossou, Van Mele, Vodouhe & Wanvoeke,
2009b), most females lack the opportunity to communicate outside of their families (Zossou et
al., 2010). Video-mediated training has a strong potential to overcome this information
inequality (Bery, 2003; Lie & Mandler, 2009; Zossou et al., 2010).
Studies have shown that women prefer video-mediated approaches to text materials and
are more willing to pay more to get video disks (Tumwekwase, Kisauzi & Misiko, 2009; Van

10 Mele, 2011). In Central Benin, men who lacked access to video were eager to learn from women
who have access (Van Mele, 2006). In a Bangladesh village, women became increasingly
involved in decision-making on how to spend the family’s disposable income after exposure to a
training video. Their ability to explore sources, bargain for better prices, and manage
organizational support was strengthened by training programs that made use of videos
(Chowdhury et al., 2011).
Shingi and Mody (1976) concluded that the communication effects gap could be
prevented if “appropriate communication strategies are pursued in development efforts” (p. 189).
In their field experiment, they found that the gap between farmers with different prior
knowledge levels was closed after their exposure to credible TV programs made up mostly of
training videos. Low-knowledge farmers learned more, while those with higher knowledge about
the topic before viewing the TV program gained less information because of the “ceiling effect.”
Farmers with higher knowledge before video exposure also showed lower interest in the TV
program because they perceived the content to be of low value to them.
2.7 Use of Pico Projectors for Video Training
Until recently, the shortage of electricity and limited access to the Internet and other
modern technology have limited the adoption of modern training devices such as computers and
TV to present digital content in rural areas (Jain, Birnholtz, Cutrell & Balakrishnan, 2011). The
low information and communication technology proficiency of rural training facilitators dictates
simple and easy-to-use training devices. Because videos are shown in multiple locations that do
not have electricity, low-cost battery-operated devices are a must.
Recently, a small battery-operated video projector called the “pico” has been tested in
rural areas. Smaller than a normal projector (the 3MPro150 version is 1 by 2.4 by 5.1 inches and

11 weighs 5.6 ounces) (PCMag, 2010), it is “bright, battery powered, portable, durable and
affordable” (OMPT, 2010). In two trials in India, a pico projector was connected to a camera
phone to present training materials stored on a cell phone (Jain et al., 2011; Mathur,
Ramachandran, Cutrell & Balakrishnan, 2011). Some types of pico projectors have an internal
memory or an SD card slot, so they do not need to be connected to a computer or DVD player.
Pico projector images are suitable for viewing by groups of 15-20 people (Mathur et al., 2011).
The projector, however, has two major disadvantages. First, because of its relatively low
luminosity, videos must be shown in a darkened room. Second, it requires an external speaker
because its audio capacity is not sufficient to be heard by a group of 15-20 farmers (Mathur et
al., 2011).
2.8 Video as a Complement to Traditional Training Methods
Training that combines video and traditional methods such as lectures and farmer-to-
farmer extension has proven to be more effective than traditional training methods alone (Zossou
et al., 2009b; Gandhi et al., 2007). In an experiment, greater knowledge gain was recorded for a
group of farmers given a lecture and shown a video compared to another group that received
only the lecture (Shanthy & Thiagarajan, 2011). Digital Green split villages into two groups:
those that were given regular training and those that received conventional plus video training.
One-half of those who received conventional + video training expressed greater interest in
adopting the suggested practice, which was several times more than those in the control village
(Gandhi et al., 2007).
In another study, more farmers in the group receiving video + conventional workshop
training could properly handle rice after harvest than was the case in the group that participated
only in the conventional workshop (Zossou et al., 2009b). In central Benin, 92% of farmers

12 exposed to a training video and who attended a workshop adopted the rice parboiling method
being recommended compared to 19% of those who learned about the method in a workshop
(Zossou et al., 2009b).
2.9 Video as a Stand-Alone Training Material
In many projects, video has replaced conventional training and served as a stand-alone
knowledge and innovation dissemination approach. Video training is cheaper than traditional
extension methods such as farmer-to-farmer extension and lecture, especially when more farmers
need to be trained. Stand-alone video training has been most effective when farmers already
know the scientific principles and already are practicing the techniques shown in the video (Van
Mele, 2006).
Exposure to video training alone was more successful in creating interest in rice
parboiling technology than attendance in a traditional workshop (Zossou et al., 2010). In Ghana,
experimental groups shown videos had higher knowledge test scores compared with farmers in
the control group who received conventional training (David & Asamoah, 2011). The
percentages of farmers in the video-only group that changed the technique used to reduce
moisture loss (drying rice on tarpaulins), and removing shoes when turning the paddy over were
87%, 99% and 96%, respectively. In the control group subjected to a traditional workshop, the
percentages were only 22%, 59% and 40%, respectively (Zossou et al., 2009a). Significantly
more farmers in the video group in Central Benin sold parboiled rice to earn extra money to
purchase food (Zossou et al., 2010).
In Bangladesh, farmers exposed to videos that demonstrated seed drying technologies
showed an increase in the adoption of the treatment from 9% to 67%, while a much lower
increase was found in the control village trained through extension (Van Mele, Zakaria, Begum,

13 Rashid & Magor., 2007). A total of 72% of farmers in central Benin who received only video
training innovated based on the new practice shown in the video, compared to 19% of those who
learned the same practice through workshops only (Zossou et al., 2009a).
Van Mele (2008) finds video “easy to integrate with other rural training methods” (as
cited in Zossou et al., 2009a, p. 120). In another study, video was supported by practical tasks,
oral testimony and/or farmer discussion to help enhance learning (Lie & Mandler, 2009). This
may be because information presented through multiple channels is more likely to enhance
learning (Coldevin, 2003). Learning with the use of different media also can satisfy people’s
different learning preferences (Shanthy & Thiagarajan, 2011). In some instances, videos shown
on television or cable networks were accompanied by a two-way communication channel to
enable audience members to ask questions and interact with the extension worker (Lie &
Mandler, 2009).
2.10 Video and Participatory Training
A participatory and interactive training approach involves farmers as important partners
in development decision-making and promotes their interaction with researchers,
communicators, extensionists, and educators (Coldevin, 2003). Participatory methods, such as
Farmer Field Schools, offer farmers the chance to observe, record and discuss what happens in
the field after regular training. Instead of only receiving information, farmers obtain a deep
understanding of concepts and their practical applications (Coldevin, 2003).
However, scaling up this participatory training method has met with some difficulties in
terms of resources and quality control. The zooming-in, zooming-out (ZIZO) approach involves
farmers in the process of addressing local issues, video creation, production and delivery. Local
needs and knowledge are gathered by immersion in local communities (Van Mele, 2006). Local

14 farmers’ ideas, concepts and innovations were applied to produce the training video of rice post-
harvest processes (zooming -in); the raw video was shown to farmers outside of the community
and more suggestions were collected, leading to further versions of the training video (Zossou,
2009a).
Similar to the ZIZO method, in the production of a rice training video in Bangladesh,
local knowledge was evaluated, and the technologies and video scripts were tested among rural
women who suggested how their roles were to be portrayed. Farmers also chose the dates and
location of video training (Van Mele, Salahuddin & Magor, 2005). The Video Viewing Club
offered video and field experience, reflection and conclusions through farmer group discussion.
Digital Green (2010) developed an interactive voice response question-and-answer
system based on mobile phones to collect information about farmer needs and interests and to
solicit feedback after video exposure. The toll-free voice system encouraged farmers to record
questions and receive responses concerning video production and dissemination.
2.11 Research Questions
This study has two objectives: The first is to test and compare the effectiveness of three
training approaches: (1) traditional lecture/ demonstration alone; (2) traditional lecture/
demonstration plus video; (3) video alone. Two comparisons were made to test the effectiveness
of video training both as a complement and a replacement method for traditional lecture/
demonstration within existing training groups. The effectiveness of both was measured by
changes in knowledge, attitudes and adoption intention. Two research questions are used to
address the first research objective.
RQ1: How effective is the video when used to complement conventional
lecture/demonstration training?

15
Previous research has shown that the combination of video with traditional conventional
lecture/demonstration can effectively increase knowledge and develop positive attitudes toward
the training technique and adoption of the recommended practice (Gandhi et al., 2007; Zossou et
al., 2009b). Addressing this research question involves comparing the effectiveness of traditional
lecture/demonstration only with the traditional lecture/ demonstration + video method.
RQ2: How effective is the video as a stand-alone training method with minimal
facilitator involvement?
Many studies have found that training methods using video alone can attract farmers’
interest, promote innovation and increase the adoption rate (Van Mele, 2006; Van Mele et al.,
2007; Zossou et al., 2009b and 2010). Addressing the second research question involves
comparing of effectiveness of video only with the traditional lecture/demonstration only method
in improving knowledge levels, creating positive attitudes, and enhancing adoption intention.
The second objective of the current study is to evaluate the effectiveness of alternative
training approaches in decreasing the gap in learning between male and female farmers, and
among farmers with different bean planting volumes and education levels. Quantitative and
qualitative data were gathered to answer the following research question:
RQ3: Can the video training method decrease the knowledge gap among farmers of
different gender, acres of beans, and educational level?
The knowledge gaps between female and male farmers, and between farmers with higher
or lower education levels and larger or smaller bean fields need to be understood and addressed.
Research has shown that video can increase women’s interest and involvement in the training
and has the potential to promote learning (Bery, 2003; Van Mele, 2006; Lie & Mandler, 2009;
Zossou et al., 2010; Chowdhury et al., 2011).

16
Chapter 3
METHOD
This study has three research questions: (1) to test whether video could be an effective
complement to traditional lecture/ demonstration (comparison of traditional lecture/
demonstration method with the training method including the traditional lecture/demonstration
plus video); (2) to test whether video could be an effective replacement for traditional
lecture/demonstration with minimal facilitation (comparison of the traditional
lecture/demonstration method with the video only method) ; and (3) to evaluate the effectiveness
of training methods including video as a complement or replacement for the traditional
lecture/demonstration method in decreasing knowledge gaps about row planting of beans among
farmers who differ by gender, acres of beans planted and education level.
The first and second research questions test the effects of each training approach on
farmers’ knowledge, attitudes and intended behaviors about the row planting of beans. The third
research question evaluates the effectiveness of alternative training approaches in decreasing the
gap in knowledge levels between male and female farmers, and among farmers with different
bean acreages and education levels.
The study was conducted as a quasi-experimental design, with three experimental groups
to which participants were not randomly assigned. The study was conducted in four parishes
(Naibowa, Bugeywa, Butansi and Naluwoli) in the Butansi sub-county of Kamuli district in
Uganda. Quantitative and qualitative data were gathered. Quantitative data were collected using
a pre-test/post-test design.
3. 1 Geographic location of the study

17
All farmers in Kamuli District who grew beans and were members of VEDCO’s farmer
groups (Figure 1) were eligible to participate in the study. The local extension staff and
researchers chose Butansi sub-county with its four parishes as the research area (Figure 2) in part
because farmers who were members of VEDCO groups in these four parishes had previously
participated in a project under the Dry Grain Pulse Collaborative Research Support Program
(CRSP).
The training activities in this area had been part of a joint project launched in 2004 by
VEDCO, CSRL at Iowa State University, and Makerere University (Butler & Mazur, 2007).
Before the quasi-experiment was implemented, the standard training procedures included
lectures, demonstrations and flip charts. These procedures had been delivered to groups of 8-15
farmers each month.

18 Figure 1. Location of Kamuli District
Source: http://www.ezilon.com/maps/africa/uganda-maps.html

19
Figure 2. Location of Butansi sub-county
Source: https://sites.google.com/site/ictcentreuganda/kamuli-district

20
3.2 The Study Design
3.2.1 Sampling
The evaluation portion of this study is best described as a quasi-experimental design
(Wimmer & Dominick, 2006, p.243) because participants were not randomly assigned to
experimental treatments. Instead, farmers were assigned to experimental groups based on the
sub-county district where they reside. The traditional lecture/demonstration group included
participants from two small parishes (Naibowa and Bugeywa). The traditional
lecture/demonstration + video group was composed of farmers from Butansi parish (same name
as the sub-county). The third experimental group, the video only group, was composed of
farmers from Naluwoli parish. The extent to which these groups are non-equivalent is explored
later in the results section.
3.2.2 Experimental Groups
The division of farmers into three experimental groups is outlined in Table 1.
Groups differed from each other based on the components of the training they received. They are
as follows:
The traditional lecture/demonstration (traditional only) had 111 farmers and received
only traditional lecture/demonstration training conducted by a community-based trainer (CBT).
The lecture/demonstration lasted 30 minutes. The CBT staff first presented the theory underlying
the training topic, which was followed by a field demonstration that used real tools, and the row
planting process in a natural environment.
The traditional + video group was composed of 103 farmers and received the traditional
lecture/demonstration plus the video training. Besides the same 30-minute traditional

21
lecture/demonstration that the traditional only group received, the group was shown an eight-
minute video immediately following the traditional lecture/demonstration.
The video only group was composed of 103 farmers who saw the training video (same as
the video shown in the traditional + video group) with minimal facilitation (no traditional
lecture/demonstration). For this group, the CBTs only mobilized farmers, organized the training,
and promoted discussion. The video was shown twice to this group to enhance farmers’
knowledge.
In all groups, after the lecture/demonstration and/or video, a “fellow farmer
demonstration and discussion” followed in which one or two farmer-trainees were given 5 to 10
minutes to repeat in the presence of other farmers the theory and process taught by the CBTs or
the video. A group discussion of 15-20 minutes followed.
Four CBTs were involved in this study. Two conducted the training, taking turns to
reduce variations in training quality. The two other CBTs organized training and mobilized
farmers.
Table 1. The Study’s Experimental Design
Treatment Parish Training components (in order) Duration
(min.)
Traditional lecture/
demonstration only
Naibowa &
Bugeywa
1. Traditional lecture and field demonstration 30
2. Farmer demonstration and group discussion 15
Traditional lecture/
demonstration + Video
Butansi 1. Traditional lecture and field demonstration 30
2. Video 8
3. Farmer demonstration and group discussion 15
Video only Naluwoli 1. Video 8
2. Farmer demonstration and group discussion 25
3. Video 8

22
3.3 Experimental Procedure
Before training, a knowledge test about bean row planting was administered to the
farmer-participants. This test was developed with the local extension staff and is described
further in section 3.5. Basic demographic data, such as household characteristics, bean
production data and information sources for bean production also were obtained. Although most
participants had previously received training on row planting during the June to July 2011
planting season, the local extension staff had observed that many had already forgotten some of
the main procedures the technique entails.
After training, farmers completed a post-test which included the same knowledge,
attitude, and adoption intentions test used for the pretest and were asked to evaluate the training
method to which they had been exposed. Local interviewers who spoke English and the local
languages were trained and hired to collect data. Before the experiment, they were trained by the
researchers and local extension staff about row planting and skills for interviewing and data
collection. Each participant was interviewed individually at the training site immediately before
and after the training.
A pilot study of the experimental procedure and questionnaire was conducted on Feb. 13
and 14, 2012, in a non-experimental parish where farmers had characteristics similar to those in
the test groups. The participants in this pilot-testing site received the traditional + video training
and were evaluated following a pretest/post-test design. Slight changes were made to the
questionnaire as a result of the pilot study.
In the actual experimental test sites, the researcher, through a translator, read the
informed consent document, which specified the purpose of the study and the estimated time it
would take to conduct the study. They were also told that their participation should be

23
completely voluntary. Participants were told they could choose not to answer any question that
might make them feel uncomfortable, and they were free to stop the interview at any time. The
study and its component questionnaire were approved by Iowa State University’s Institutional
Research Board and the Uganda National Council for Science and Technology.
3.4 Training Topic and Video
Row planting (or planting in lines) is a technique to improve bean yield and bean quality.
This technique requires farmers to (1) plant beans at the beginning of the rainy season (2) in
rows that are 50 cm (1.5 ft) apart with (3) each seed planted 15-20 cm (0.5 ft) apart. (4) Different
varieties should be planted at least two meters apart so they do not mix. Row planting makes
weeding, identification of pests and diseases easier, facilitates spraying, and helps the plant to
access sufficient nutrients. The main tools used for planting in rows include strings, two 1.5 ft.
sticks (pugs) and a hoe.
The video was shot in Kamuli district in July 2011 by ISU professors Eric Abbott and
Robert Mazur. In the video, a male local farmer demonstrated row planting in his own garden,
which had similar field conditions to those of the subjects in the training. He explained the
theory of row planting, including the problems it solves, the main process it involves and the
tools needed in the local language. Then, he demonstrated each step of the row planting process,
including digging the trench, measuring the distance between rows using the pug and planting
the seeds. In late August 2011, the author edited the raw video. Professors and students at ISU
and Makerere University, as well as the local extension staff reviewed the video for technical
accuracy.
3.5 Conceptual and Operational Definitions of Study Variables

24
To test the effectiveness of each training method, the participants’ knowledge, attitude
toward the training topic, and intention to adopt the innovation were measured before and after
the training.
Knowledge score. A knowledge test composed of four open-ended questions about row
planting was used to evaluate what farmers learned. The questions are: (1) What are the
problems row planting intends to solve? (2) What are the main procedures involved in row
planting? (3) What are the benefits of row planting? (4) What tools do farmers need to
implement row planting? The answers to this knowledge test are summarized in Table 2.
To measure knowledge, trained interviewers asked farmers to answer each of the four
questions in their own language. Farmers received one point for each correct answer. For
example, one participant who mentioned “higher yields” and “making spraying easier” in answer
to the question, “What are the main benefit(s) you get or would get from adopting row planting?”
received two points. The knowledge score was determined by counting the number of correct
points about bean row planting. The highest possible score was 15; the lowest was 0. The score a
participant received before training was labeled Time 1 Score. After training, the post-test score
was called the Time 2 Score

Table 2. Knowledge Test Questions and Answers
Knowledge Test Questions Answers No. of subjects with
correct answer before
training (% of N)
No. of subject with
correct answer after
training (% of N)
1. What are the problems row
planting is intended to solve?
a. Weeding difficulty 293 (90.2) 316 (97.2)
b. Spraying difficulty 145 (44.6) 304 (93.5)
c. Insufficient nutrients for plants 87 (26.8) 242 (74.5)
2. What are the main
procedures for row planting?
a. Plant at the beginning of the rainy season for
better utilization of soil moisture
273 (84.0) 309 (95.1)
b. Plant beans in rows 293 (90.2) 318 (97.8)
c. Rows should be 50cm (1.5 ft) apart 130 (40.0) 318 (97.8)
d. Seeds should be sown 15-20cm (0.5 ft) apart 122 (37.5) 310 (95.4)
3. What are the main
benefit(s) you get or would
get from adopting row
planting?
a. Higher yields 262 (80.6) 305 (93.8)
b. Making weeding easier 287 (88.3) 318 (97.8)
c. Making spraying easier 145 (44.6) 320 (92.9)
d. Increasing access to sufficient nutrients 105 (32.3) 261 (80.3)
4. What tools would you need
to adopt row planting?
a. Strings 233 (71.7) 321 (98.8)
b. 2 pugs each one 1.5 ft 130 (40.0) 308 (94.8)
c. Hoe 286 (88.0) 320 (98.5)
25

26
Attitude. Attitude toward the recommended practice was measured by asking farmers to
rate the overall value of planting beans in rows to improve production. A four-point scale gauged
the participants’ attitudes (1 for “will not be an improvement at all” and 4 for “would be a
substantial improvement”).
Adoption intention. The participants’ intention to adopt row planting was measured by
asking how likely (1 for “not likely at all” and 4 for “very likely”) it would be that they would
use the recommended practice during the next bean growing or post-harvest season.
To evaluate the quality of the three training methods, farmers were asked to rate how
clearly they heard and saw each training message.
Demographic differences among farmers can affect their learning from training. In order
to answer the third research question, gender, education level, and acres of beans planted were
used as covariates to test the effectiveness of each training method in decreasing knowledge gaps
about row planting.
Education level was measured by asking how many years of formal education the
participants had received. Acres of beans planted was calculated by the acres of beans subjects
planted in the most recent growing season.
In addition, participants rated the usefulness and technical correctness of the messages
provided during the training (1 for “lowest quality” and 4 for “highest quality”).
Open-ended questions were asked to collect in-depth opinions about which training
methods enhanced farmer understanding of row planting. Farmers were asked about perceived
advantages and disadvantages of row planting of beans, and suggestions were solicited regarding
how to improve the effectiveness of each training method.

27
3.6 Data Analysis
The first and second research questions asked whether video could effectively
complement and replace the traditional demonstration and lecture training method, respectively.
Given the between- and within-subjects design described above, differences in knowledge,
attitudes and adoption intentions before and after training were tested by using repeated
measures ANOVAs. The visual and audio quality of the training method also were evaluated to
answer the first two research questions.
The third research question examined whether the video method can decrease the
knowledge gap among farmers of different gender, acres planted to beans, and educational level.
This research question was studied by conducting three separate repeated measures ANOVAs of
knowledge scores that use the demographic variables gender and educational level and the
agriculture characteristic acres devoted to bean planting as separate covariates.
A repeated measures test was conducted to test the difference in knowledge scores
between experimental groups over time. Simple between-subjects ANOVA tests were not
employed because they assume independent observations. In this study, the before-after
knowledge score comparison violated this assumption because it measured the same subjects
before and after training.

28
CHAPTER 4
RESULTS AND DISCUSSION
The main purpose of the study was to evaluate the effectiveness of video as a training
tool in Kamuli District, Uganda. Three research questions were examined: (1) How effective is
video when used to complement conventional lecture/demonstration training? (2) How effective
is video as a replacement for conventional lecture/demonstration training with minimal facilitator
involvement? (3) Can the video only method decrease the knowledge gap among farmers who
differ by gender, farm size, and educational level? The sample for this study consisted of 325
farmers from Kamuli District, Uganda, who volunteered to participate in the study.
Tables 3 and 4 present the participants’ demographic and bean production
characteristics. Table 3 shows that 80 males and 245 females participated in this research.
Agriculture was the main occupation of all but eight participants. Table 4 shows that the average
years of education was 5.81(SD = 3.81), but 18.2% had never been to school. Only 26% had
finished primary school (seven years of education); less than 3% finished senior school (13 years
of education). The average age of all participants was almost 41 years (M = 40.97, SD = 12.12).
The average household size was eight (often with three adults and five children). The
participants planted an average of 0.54 hectares (SD = 0.41) to beans, which is about 14% of the
average total farmland they own (M = 3.85, SD = 5.07). A great majority (77.5%) said they
saved beans for seeds (N = 252, M = 19.38, SD = 18.25), 77.2% saved beans for home
consumption (N = 251, M = 38.07, SD = 37.72), and 53.2% saved beans for sale (N = 173, M=
65.40, SD = 124.90).
4.1 Comparison of Demographic Characteristics by Experimental Group
29
Chi-square tests indicate a significant difference in the percentage of men and women in
the three experimental groups (Table 3). Specifically, the percentage of men was much lower
(12.6%) in the video only group than in the other two groups.
The results of a one-way ANOVA test show significant differences among the three
groups in terms of education (F [2, 322] = 3.68, p = .03) (Table 4). A Least Significant
Difference (LSD) post hoc test indicated that members of the traditional lecture/demonstration
group had significantly higher education than those in the video only group (p < .01) (Table 4).
There were no significant differences in age (F [2, 317] = 2.71, p = .07) and farmland owned (F
[2, 314] = 1.21, p = .30).
However, the traditional lecture/demonstration group planted significantly more beans
during the 2011 growing season (Table 4). An LSD post hoc test showed that farmers in this
condition produced significantly more beans in 2011 (M = .68, SD = .49) than those in the video
only group (M = .5, SD = .35) and the traditional + video group (M = .43, SD = .31).
The difference in amount of beans used for seed among experimental groups was also
significantly different (F [2, 250] = 3.05, p = .05). An LSD post hoc test found that farmers in the
traditional group saved significantly more beans for seeds than those in the video only group.
Farmers in the traditional + video and video only groups saved fewer seeds, but sold more, which
suggests that they depended more on outside seed sources.

Table 3. Comparison of Demographic and Farming Characteristics of Subjects by Experimental Group
Traditional only Traditional + video Video only Total
Variable Category N % N % N % N Total % 𝜒2
Gender Male 37 33.3 30 27.0 13 12.6 80 24.6 12.88**
Female 74 66.7 81 73.0 90 87.4 245 75.4
Total 111 34.2 111 34.2 103 31.7 325 100
Occupation Agriculture 108 97.3 108 97.3 101 98.1 317 97.5 .17
Other 3 2.7 3 2.7 2 2.0 8 2.5 * p < .05, ** p < .01
Table 4. Comparison of Demographic Characteristics of Subjects by Experimental Group
Traditional only Traditional + video Video only Total
Mean (SD)
F
Variable Mean SD Mean SD Mean SD sig
Years of education 6.40 3.92 5.96 3.86 5.02 3.54 5.81 (3.81) 3.68*b .03
Age 39.86 12.01 43.12 13.42 39.78 10.37 40.97(12.12) 2.71 .07
Total household members 8.09 3.59 8.10 3.91 7.91 2.63 8.04 (3.42) .10 .90
Acres of farmland owned 4.29 6.82 3.99 4.29 3.23 3.27 3.85 (5.07) 1.21 .30
Acres of beans planted .68 .49 .43 .31 .50 .35 .54 (.41) 11.68**ab
.00
Beans for seeds (KG) 22.79 22.40 18.07 16.16 16.28 12.95 19.38 (18.25) 3.05*b .05
Beans for home
consumption (KG)
38.83 41.30 40.05 37.40 34.64 32.86 38.07 (37.72) .43 .65
Beans for sale (KG) 57.82 93.35 72.31 153.09 69.91 135.65 65.40 (124.90) .253 .78 aLSD post hoc test confirms a significant pairwise mean difference between traditional group and traditional + video group. bLSD post hoc test confirms a significant pairwise mean difference between traditional group and video only group.
* p < .05, ** p < .01
32

31
4.2 Research Questions 1 and 2: Video as a Complement to or Replacement for the
Traditional Lecture/Demonstration Training Method
The first research question asked whether video could be an effective complement to the
conventional lecture/ demonstration method. The second research question evaluated the
effectiveness of video in replacing the conventional lecture/ demonstration method. These
research questions were explored by evaluating participants’ knowledge of, attitudes about, and
intentions to adopt row planting.
4.2.1 Pre-test of Subjects’ Knowledge Level, Attitude and Adoption of Row Planting Before
Training
Prior to the experiment, a pre-test was conducted to assess what farmers already knew
about row planting, and how many were already using this practice. This was especially
important because the local extension staff had already conducted training on row planting
during the last growing season (September and October 2011) with the very same groups of
farmers involved in the experiment. However, the local extension staff reported that many
farmers had already forgotten their knowledge of row planting, perhaps because what they
learned had not been reinforced since the last growing season.
The pre-test showed that 92.9% had heard about row planting. Fifty-two percent said they
knew something about row planting, 30.2 % thought they knew a little, and less than 10% said
they knew a lot about row planting. A large percentage (85.5 %) reported planting their beans in
rows in the last growing season.
Open-ended questions were asked to analyze the reasons for adoption (What is the main
reason for your decision?) and to identify the problems hindering the adoption of the technique
after training (What might cause farmers like you to not adopt the practice that was

32
recommended?). The main reasons for adopting row planting included the understanding that
row planting could simplify agronomic practices and that the practice increases yield.
Information learned from training led many to adopt the row planting method.
The following are examples of reasons for adopting row planting:
“(Row planting) helps ease agronomic practices like weeding, spraying, and harvesting.”
Female, 32
“Because of the training (I received), I will be able (to plant in rows), a practice that will
give higher yields.”
Female, 52
“High yields are obtained from a small piece of land (when one practices row planting).”
Female, 52
The participants were also asked what might hinder a farmer’s adoption of the practice.
The answers were grouped into six categories listed in Table 5. Some said that although row
planting could ease weeding, spraying and harvesting, it takes more time and energy because the
farmer has to follow a certain spacing method. Moreover, the lack of seeds and training
decreased farmers’ ability to take advantage of this practice. Other reasons for non-adoption
included sickness, low appreciation of the need to plant in rows, and natural impediments such as
drought and hail.
Table 5. Problems Hindering Adoption of Row Planting
Problems
Number of people who
mentioned this problem % of N
The practice consumes a lot of time and energy 70 21.5
Insufficient seeds 21 6.5
Lack of farmers’ training 20 6.2
Low regard for row planting 8 2.5
Sick 7 2.2
Bad natural environment 5 1.5

33
The following are examples of factors cited as hindering the adoption of the row planting
technique:
“Farmers had difficulty because they have never been trained on how to do row planting.”
Male, 52
“You need two people (to do this). The work load is too much for just one person.”
Female, 48
“Some fail to get seeds or were sick at planting time.”
Female, 66
4.2.2 Knowledge Scores Before Training (Time 1 Score)
Knowledge scores across the three experimental groups before training (Time 1) were
analyzed using one-way ANOVA tests (between experimental groups). The boxplot in Figure 3
shows that all three experimental groups were approximately balanced around the median of
each group. The traditional lecture/demonstration group had a higher Time 1 score than in the
video only group and the traditional + video group. In addition, there is more variation in the
video only group than in the other two. The results shown in Table 6 suggest that before training,
the knowledge scores of farmers in the three groups were significantly different (F [2, 298] =
6.88, p<.01). An LSD post hoc test showed that the traditional lecture/demonstration group’s
score at Time 1 (M=10.02, SD=2.61) was significantly higher than that of the traditional + video
group (M=8.64, SD=2.54) (p < .01). Besides differences in education levels and acres planted to
beans, these differences could be caused by the differing effectiveness of previous training,
which might be attributed to differences in the ability of CBTs to deliver content and to mobilize
farmers to adopt row planting.

34
Figure 3. The boxplot of Time 1 knowledge score in each experimental group
experimental group
Table 6. Results of an ANOVA Testing the Difference in Knowledge Scores Among the Three Groups at
Time 1
N Mean SD M.S. df F sig
Traditional 111 10.02 2.61
Traditional + Video 111 8.64 2.54 49.14 2 6.88**a .00
Video only 103 9.34 2.86 aLSD post hoc test confirm a significant pairwise mean difference between traditional only group and traditional + video
group
** p < .01
4.2.3 Knowledge Test Scores After Training (Time 2 Score)
Farmers’ post-test knowledge scores (Time 2) across the three experimental groups also
were analyzed using a one-way ANOVA test (between experimental groups). The boxplot in
Figure 4 shows that the distribution of knowledge scores in all three experimental groups shifted
to the top part of the inter-quartile range at Time 2 (the full score was 15). The Time 2
knowledge score of the traditional + video group was almost the same (Table 7) as the Time 2
knowledge score of the traditional only group, but higher than that of the video only group. A
ceiling effect in knowledge scores may be occurring here.
35
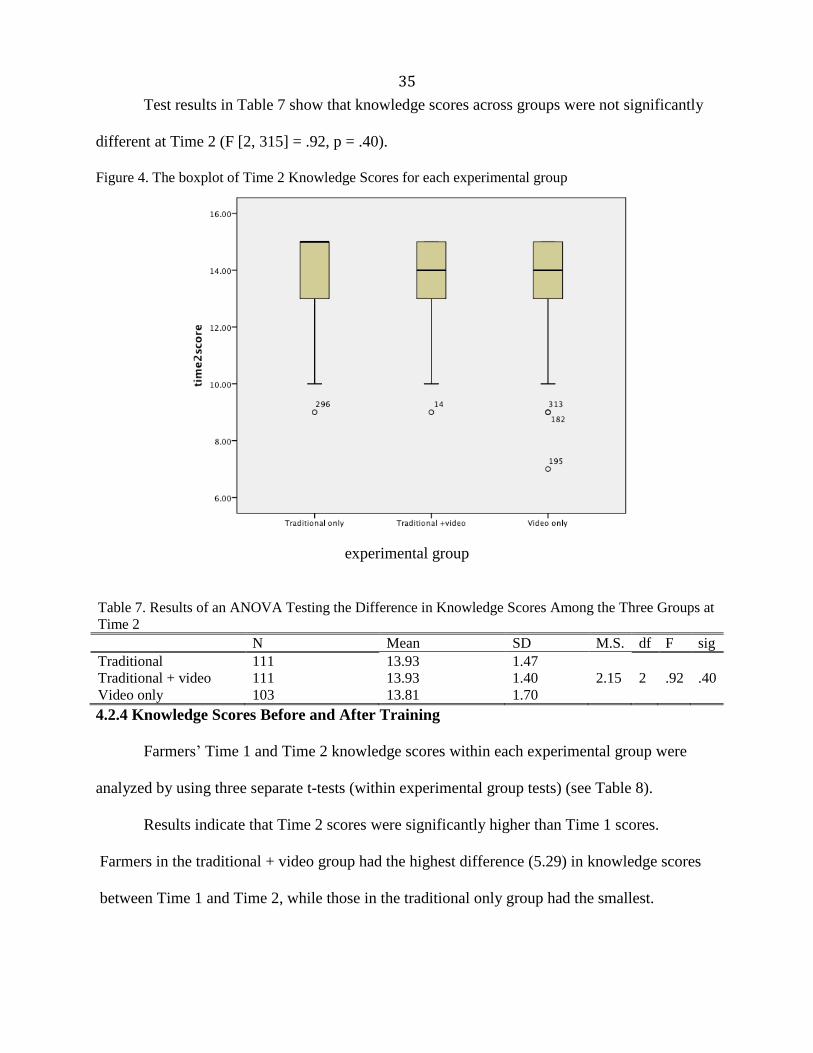
Test results in Table 7 show that knowledge scores across groups were not significantly
different at Time 2 (F [2, 315] = .92, p = .40).
Figure 4. The boxplot of Time 2 Knowledge Scores for each experimental group
experimental group
Table 7. Results of an ANOVA Testing the Difference in Knowledge Scores Among the Three Groups at
Time 2
N Mean SD M.S. df F sig
Traditional 111 13.93 1.47
Traditional + video 111 13.93 1.40 2.15 2 .92 .40
Video only 103 13.81 1.70
4.2.4 Knowledge Scores Before and After Training
Farmers’ Time 1 and Time 2 knowledge scores within each experimental group were
analyzed by using three separate t-tests (within experimental group tests) (see Table 8).
Results indicate that Time 2 scores were significantly higher than Time 1 scores.
Farmers in the traditional + video group had the highest difference (5.29) in knowledge scores
between Time 1 and Time 2, while those in the traditional only group had the smallest.

36
Table 8. Results of t-Tests Showing Difference in Time 1 & Time 2 Scores (Change Score) Within
Groups
Experimental Group df Time 2- Time 1 (SD) t-value
Traditional 105 3.92 (2.57) -15.75***
Traditional + video 97 5.29 (2.71) -19.34***
Video only 92 4.48 (2.56) -16.86***
Total 296 4.55 (2.66) -29.42***
***p < .001
Figure 5 shows the knowledge scores of the three groups at Time 1 and Time 2. The
short-dash line represents the knowledge score of the traditional lecture/demonstration group,
the solid line represents the knowledge score of the traditional + video group, and the stroke-
dash line shows the knowledge score of the video only group. All three lines show increases in
knowledge over time. However, there was a clear difference in Time 1 scores between groups.
The traditional lecture/demonstration group had the highest Time 1 score, and the traditional +
video group had the lowest. The difference in scores between groups decreased, and a crossing
of the traditional + video group and video only group lines was found, which means that at
Time 2, the traditional + video group outperformed the video only group.

37
Figure 5. Knowledge scores of the three experimental groups before and after training
A repeated ANOVA test was conducted to test whether differences in knowledge scores
between groups over time observed in Figure 5 were significant. The results, shown in Table 9,
suggest a significant within-group effect between pre-test (Time 1) and post-test (Time 2) scores
(Wilks’ lambda = .25, F [1, 294] = 904.08, p < .01) and a significant between-experimental
group effect (F [2, 295]=4.01, p = .02).
There is also evidence of a significant 2 x 3 interaction between test time and
experimental group (F [2, 295] =6.95, p= .0.01), indicating that the change in knowledge scores
was significantly different in the three groups over time. LSD post hoc tests of this interaction

38
effect revealed that the knowledge score change observed in the traditional
lecture/demonstration group, which had the highest Time 1 score (Table 7), was significantly
less than the change in scores seen in the traditional lecture/demonstration + video group (p <
.01) and the video only group (p = .04).
Table 9. Result of a Repeated Measures ANOVA Testing Differences in Knowledge Score at Time 1 and
Time 2 by Experimental Group
Df ss ms F Pr>F
Between subjects
Group 2 48.50 24.25 4.01*ab
.02
Error 295 1784.75 6.05
Within subject
Test Time 1 3085.30 3085.30 904.08** .00
Test Time*Group 2 46.74 23.37 6.95** .00
Error 294 1002.54 3.41 aLSD post hoc test confirms a significant pairwise mean difference between traditional group and traditional + video group. bLSD post hoc test confirms a significant pairwise mean difference between traditional group and video only group.
* p < .05, ** p < .01
In summary, the results indicate that all three training approaches improved knowledge
scores. The results also suggest that videos could effectively complement traditional
lecture/demonstrations, and that the training method involving both may be the most effective in
enhancing knowledge levels. The video only group’s Time 2 score was as high as that of the
other two groups after training, which suggests that videos can effectively replace the traditional
lecture/ demonstration training method.
Considering the participants’ exposure to previous lectures and demonstrations, the
relatively low change score in the traditional group may be due to a ceiling effect (Richardson,
Kitchen & Livingston, 2002, p. 339). That is, those in this group knew more about row planting
before training as evidenced by their knowledge score of 10 (out of 15). In comparison, their
counterparts in the traditional + video scored an average of 8.64 while those in the video only
group had an average score of 9.34. After the training, the knowledge scores of farmers in the
three groups were almost the same. The Time 2 scores approached 14 (out of 15).

39
4.2.5 Attitude and Adoption Intention After Training
The farmers’ attitudes toward row planting were ascertained by asking how they rated the
overall value of row planting. Their intention to adopt the practice was measured by asking how
likely they were to plant beans in rows during the next growing season.
The results were very similar across groups. Most (N = 310 farmers) agreed that row
planting could substantially improve harvest; only eight thought this technique would yield only
a slight improvement.
Nearly all (98%) said they were very likely to adopt this technique. Because of the small
variance in the answers, no further analysis was done about the relationship between the training
method and farmers’ attitude toward row planting or intention to adopt. Future studies might be
able to confirm actual adoption in the following seasons.
4.3 Evaluation of the Training Methods
After the training, participants in each group evaluated the training methods to which
they were exposed.
4.3.1 Quality Evaluation
To determine training quality, the farmers were asked four Likert-scale items that aimed
to assess the extent to which (1) they were able to hear the training, (2) they were able to see the
training, (3) they consider the training as useful, and (4) they find the training interesting. The
lowest score was zero; the highest was four. Table 10 shows that the farmers assessed the three
training methods as almost uniformly positive (4 is the highest score).

40
Table 10. Farmers’ Evaluation of Each Training Method
Training method Traditional lecture/
demonstration only group
Traditional +
video group
Video only group
Traditional Audio 3.98 4.00 -
Visual 3.96 4.00 -
Usefulness 3.97 4.00 -
Interesting 3.99 4.00 -
Video Audio - 3.98 4.00
Visual - 3.99 4.00
Usefulness - 3.98 4.00
Interesting - 3.98 4.00
4.3.2 Advantages, Disadvantages and Suggestions About the Traditional Lecture/
Demonstration and Video Training Methods
The farmers’ suggestions about ways to improve training were solicited. According to
them, the traditional lecture/ demonstration training provided clear and specific information,
gave practical examples, and offered opportunities for the trainer to interact with farmers (Table
11). These remarks reflect the fact that CBTs with locally adapted teaching skills were
knowledgeable about training topics. How they collect feedback and answer questions during
and after training were crucial for local people to understand the theory behind row planting,
adopt the technique, and solve problems encountered while implementing the practice.
The main disadvantage of the traditional approach (see Table 12) was the limited number
of CBTs who could provide training. Their resources also are limited. Each CBT needs to serve
farmers in two parishes. Bad roads and few ways to reach farming areas decrease their ability to
provide training.
The farmers said that they need frequent and good quality training, especially before and
during the growing season (Table 13). They recommended that CBTs should be further trained to
improve their ability to teach. Some suggested the CBTs bring a blackboard to training.
The following are examples mentioned as advantages of traditional training.

41
“The CBT allowed farmers to ask questions and he answered all of them.”
Female, 49
“The CBT was very near to farmers and was very clear in what she has to say.”
Female, 42
“The CBT showed farmers how to measure [distance] using the hands.”
Male, 24
A farmer said about the disadvantages of traditional training:
“The units (of measure) were not translated into the local language.”
Male, 34
The following are examples of suggestions to improve traditional training.
“CBTs should train farmers at the beginning of the (growing) season.”
Male, 25
“CBTs should visit farmers regularly so farmers will not forget (what they have been
taught).”
Female, 30
“(The CBTs) should have blackboards to make learning easy.”
Male, 32
Those who received video training were satisfied with the clarity of the information
provided, the field examples, the background information, and the localized content (Table 11).
The CBTs often find it hard to demonstrate some techniques in the field because of site
limitations. The video, recorded in the field and featuring local farmers, was able to offset this
difficulty. Videos also made it possible to show specific details. Some found video training very
engaging.
The farmers raised three disadvantages of video training (Table 12). They report not
being satisfied with the low interaction. They also said they could not ask questions of the actors.
Farmers with vision or hearing problems were disadvantaged. A female farmer complained about
the greater role of male farmers in the video.

42
Nearly a quarter of those who watched the video suggested that it be included in regular
training programs (Table 13). Some requested to add female farmers as main actors. Others
recommended adding demonstration techniques in different environments, such as row planting
on sloping land.
The following are examples of the advantages of video training mentioned by the
participants.
“The person in the video talked in the local language, had all the materials, and
demonstrated well.”
Male, 38
“The use of examples helped me to understand the topic.”
Female, 48
“(The video showed the appropriate) way to prepare land, (and) the materials for row
planting.”
Female, 48
“The video was interesting. The CBTs should continue to use them.”
Male, 25
The following are examples of the disadvantages of video training mentioned by the
participants.
“The video did not say how to use fertilizers well. In the video, the farmer did not take
care of his garden.”
Male, 60
“The video did not mention the depth of the trench where one puts the seed”
Female, 40
The following are examples of suggestions to improve video training mentioned by the
participants.
“The video should show a bigger picture.”
Female, 45

43
“The woman should participate in planting instead of leaving the man alone to do the
job.”
Female, 28
Table 11. Perceived Advantages of Each Training Method
Advantages of traditional lecture/ demo Advantages of video
1. Provides clear and specific information
2. Localization of measurement and language
3. Good teaching skills
4. Interaction between CBT and farmer
5. Gives confidence to farmer
6. Gives practical examples
7. Others
1. Gives clear training information
2. Provides good examples
3. Attractive
4. Provides background information
5. Localization
6. Teaching in a similar way as the CBT
7. Training can be done in distant places
Table 12. Perceived Disadvantages of Each Training Method
Disadvantages of lecture/ demo Disadvantages of video
1. Not enough CBTs who can train 1. Low interaction
2. Unclear visual for people with eyesight problems
3. Only male actors in the video

44
Table 13. Suggestions to Improve Training Methods
Suggestions for lecture/ demo Suggestions for video
1. Frequent and regular training
2. More interaction between CBT and
farmers
1. Include videos in regular training
2. Provide more examples under different agro-climatic
conditions
3. Include more women in the video
4. Improve the sound and enlarge the picture
5. Add more information
3. Better demonstration skills are
needed
4. CBTs should increase their own
knowledge
5. (CBTs should) bring blackboard
with them in training
4.4 Research Question 3: Can Video Training Decrease the Knowledge Gap Among
Farmers Who Differ by Gender, Acres Planted to Beans, and Educational Levels?
The third research question explored whether video training can decrease the knowledge
gap among farmers who differ by gender, acres planted to beans, and educational level. This
research question was studied by employing three repeated measures ANOVAs with a covariate
to determine differences in knowledge score change from Time 1 to Time 2 among farmers with
different characteristics.
A correlation matrix was produced to examine the relationships among knowledge
scores, education, bean acreage, and gender. Table 14 displays the results.
All three covariates had significant correlations with Time1Score. These were gender (-
.17, p < .00), education (. 27, p <. 01) and acrebean (.21, p <. 01). The associations between
gender and Time1Score indicated that females (gender = 1) have lower Time1Scores than males
(gender = 0). In addition, subjects who had higher education levels and acres planted to beans
have higher Time1Scores.

45
All three covariates also had significant correlations with Time2score. However, the
correlations were less strong than those with Time1score.
Table 14. Bivariate Correlation of Knowledge Scores, Gender, Education and Acres Planted to Beans
(Acrebean)
Time 1score Time 2score Gender Education Acrebean
Time 1score 1.00
Time 2score .32**
1.00
Gender -.17**
-.13* 1.00
Education .27**
.15**
-.29**
1.00
Acrebean .21**
.15**
-.12**
.02 1.00
* p < .05, ** p < .01
4.4.1 Change in Knowledge Score by Gender
Table 15 presents knowledge scores by group for males and females at Time 1 and Time
2. In total, women increased their average knowledge score from 9.09 at Time 1 to 13.72 at Time
2, an increase of 4.63. These scores were lower than those for males, who averaged 10.15 at
Time 1 and 14.19 at Time 2, an increase of 4.04.
Figures 6.1, 6.2 and 6.3 show the change in knowledge score by gender across groups
over time. The solid version of these lines represents the knowledge scores of males, while the
short dash lines represent the knowledge scores of females.
All six lines show increases in knowledge over time. The figures show that in each
experimental group, males had higher knowledge scores than females before and after training.
However, the gender difference in knowledge scores decreased over time, suggesting that
women learned more from the training than men. In the traditional lecture/ demonstration group,
the difference in knowledge scores between men and women narrowed from 0.63 (Time 1) to 0.1
(Time 2). In the traditional + video group, the difference in knowledge scores before training was
1.65 (men=9.82; women=8.17), while the difference between Time 2 scores for men and women
decreased to 0.4. In the video only group, there was only a slight decrease in the difference in

46
knowledge scores between men and women; women learned as much as men in the video only
group.
The changes in knowledge scores over time, the differences between treatment groups,
and differences in knowledge scores between men and women are shown in Table 16. Across
time, significant differences between groups [F (2,293) = 3.82] were detected after controlling
for the effects of gender. In addition, there were significant gender differences after controlling
for the group effect as indicated by the between-subjects average scores for men and women.
These were consistent with the finding that women started with lower scores at Time 1(9.09
compared to 10.15 for men) in all three experimental groups. This indicates that differences in
knowledge about row planting between males and females existed before the training (Table 15).
However, after the training, the gap in knowledge scores between gender decreased. Women’s
knowledge scores increased most rapidly in the traditional + video group (from 8.17 to 13.81).
There were also significant within-subjects differences, also indicated in Table 16. The F-
test associated with TestTime [F (1, 293) = 611.70] is consistent with the fact that average
knowledge scores were always higher at Time 2 compared with Time 1. There was also a
significant TestTime x Group interaction (F [2, 293] = 6.97), which indicated that the change in
knowledge scores before and after training between experimental groups was significant. The
change in knowledge score was marginally significant for the TestTime x Gender interaction
(F[1, 293] = 4, p = .05), which indicates that the change was significant for men and women.
The findings suggest that the traditional + video and the traditional only methods could
effectively close knowledge gaps between men and women. The video only method
demonstrated a lesser ability to narrow the knowledge gap. It should be noted that men,

47
especially those in the traditional group, already had high scores at Time 1 (10.44), and therefore
did not have much room to improve their scores, suggesting a ceiling effect.
Table 15. Knowledge Score Means (with Standard Deviations) at Time 1 and Time 2 by Treatment and
Gender
Traditional only Traditional + Video Video only Total
Mean SD Mean SD Mean SD Mean SD
Women T1 9.81 .31 8.17 .32 9.24 .29 9.09 2.80
Women T2 13.90 .18 13.81 .18 13.73 .17 13.72 1.59
Men T1 10.44 .46 9.82 .50 10.00 .80 10.15 2.33
Men T2 14.00 .26 14.21 .28 14.46 .45 14.19 1.26
Table 16. Results of a Repeated Measures ANOVA Testing the Differences in Knowledge Scores at Time
1 and Time 2 Using Gender as a Covariate
df SS MS F Pr>F
Between subjects
Group 2 45.09 22.54 3.82* .02
Gender 1 49.46 49.46 8.38**
.00
Error 293 1730.31 5.91
Within subject
TestTime 1 2066.44 2066.44 611.70**
.00
TestTime*Group 2 47.10 23.55 6.97**
.00
TestTime*Gender 1 13.50 13.50 4.00* .05
Error 293 989.81 3.38
* p < .05, ** p < .01

48
Figure 6.1 Knowledge Scores at Time 1 and Time 2 by treatment and gender in traditional only group
Figure 6.2 Knowledge Scores at Time 1 and Time 2 by treatment and gender in traditional + video group
Figure 6.3 Knowledge Scores at Time 1 and Time 2 by treatment and gender in video only group
10.44
14
9.81
13.9
8
9
10
11
12
13
14
15
time1 time 2
male
female
9.82
14.21
8.17
13.81
8
9
10
11
12
13
14
15
time1 time 2
male
female
10
14.46
9.24
13.73
8
9
10
11
12
13
14
15
time1 time 2
male
female
49
4.4.2 Change in Knowledge Scores by Acres of Beans Planted for Each Group
The number of acres planted to beans might also influence knowledge acquisition. As
shown in Table 17, participants were divided into large scale and small scale growers based on
the farm area devoted to beans in the 2011 growing season. Those who planted beans in on one
quarter acre or less were considered small farmers (44% of total N); those who grew beans on
more than one quarter acre were considered large farmers. Table 17 shows that the average
knowledge score of bean growers with small plots increased from 8.59 before training to 13.78
after training. The score before training for growers with larger bean plots (9.96) was higher than
the Time 1 score of farmers with small plots. The scores after training (Time 2) were almost the
same.
Figures 7.1, 7.2 and 7.3 show the change in knowledge score by acres of beans planted
across groups over time. The solid version of these lines represents the knowledge scores of
farmers with larger bean plots, while the short dash lines represent the knowledge scores of
farmers with smaller bean plots.
Farmers with small plots in the traditional lecture/demonstration group averaged 8.78 at
Time 1 and 14.06 at Time 2. The Time 1 score of farmers with small bean plots was 1.87 points
lower than those with large bean plots. However, after training, small farmers slightly
outperformed the larger bean plot farmers on the knowledge test. A similar result was found in
the traditional + video group: smaller bean growers had slightly higher knowledge scores than
larger bean growers after training even though the smaller bean plot growers had considerably
lower scores before training. In the video only group, the gap in knowledge scores between large
and small farmers did not decrease as much as those in the other two experimental groups.

50
The results of the statistical tests of these changes over time and the differences between
experimental groups and between subjects with different acres of beans planted, are presented in
Table 18. They indicate no significant difference according to groups [F (1,290) = 2.33] when
knowledge scores were averaged across time while controlling for bean plot size. However, the
between-subjects average score indicates significant differences in knowledge scores between
farmers with small and large plots after controlling for the experimental treatment effects.
There were also significant within-subjects differences, also indicated in Table 18. The
results of an F-test associated with TestTime [F (1, 290) = 164.40] were consistent with the fact
that average knowledge scores were always higher at Time 2 compared with Time 1. There was
also a significant TestTime x Group interaction (F [2, 290] = 3.96), which indicates that the
change in knowledge scores before and after training was significant for all three experimental
groups. The significant TestTime x Acrebean interaction (F [1, 290]= 14.68) indicates that the
changes in knowledge scores for farmers with large and small bean plots were significantly
different.
The findings suggest that the traditional lecture/demonstration + video and the traditional
only training could effectively close knowledge gaps between farmers with large and small bean
plots. The video only method’s effectiveness in decreasing the knowledge gap between farmers
with different bean acres was relatively lower. Farmers with smaller bean plots knew less about
row planting before training, although knowledge improved with training.

51
Table 17. Knowledge Means at Time 1 and Time 2 by Treatment and Bean Planting Scale
Traditional only Traditional + Video Video only Total
Mean SD Mean SD Mean SD Mean SD
Smaller Scale T1 8.78 2.80 8.38 2.72 8.72 2.87 8.59 2.78
Smaller Scale T2 14.06 1.60 13.90 1.47 13.35 2.11 13.78 1.72
Larger Scale T1 10.65 2.29 9.07 2.34 9.73 2.81 9.96 2.55
Larger Scale T2 13.96 1.47 13.76 1.32 13.97 1.67 13.89 1.33
Table 18. Results of a Repeated Measures ANOVA Testing Differences in Knowledge Scores in the
Three Groups at Time 1 and Time 2 Using Bean Planting Scale as Covariate
df ss ms F Pr>F
Between subjects
Group 2 27.69 13.85 2.33 .10
Acrebean 2 levels 1 57.53 57.53 9.69* .00
Error 293 1702.99 5.81
Within subject
TestTime 1 525.83 525.83 164.40**
.00
TestTime*Group 2 25.35 12.68 3.96* .02
TestTime*Acrebean 2 levels 1 46.95 46.95 14.68**
.00
Error 290 927.59 3.20
* p < .05, ** p < .01

52
Figure 7.1 Knowledge Scores at Time 1 and Time 2 by treatment and scale of bean planted in traditional
only group
Figure 7.2 Knowledge Scores at Time 1 and Time 2 by treatment and scale of bean planted in traditional
+ video group
Figure 7.3 Knowledge Scores at Time 1 and Time 2 by treatment and scale of bean planted in video only
group
8.78
14.06
10.65
13.96
8
9
10
11
12
13
14
15
time 1 time 2
lower scale
higher scale
8.38
13.9
9.07
13.76
8
9
10
11
12
13
14
15
time 1 time 2
lower scale
higher scale
8.72
13.35
9.73
13.97
8
9
10
11
12
13
14
15
time 1 time 2
lower scale
higher scale

53
4.4.3 Change in Knowledge Scores by Education Level
To examine changes in knowledge scores over time according to education level,
farmers were divided into two groups: those with no education (no schooling) and those with any
amount of formal education (81% of total). Table 19 presents the knowledge scores for each
experimental group by education levels at Time 1 and Time 2. The average knowledge score of
those without formal education was 7.98 before training and 13.41 after training. These scores
were lower than those of farmers with formal schooling,, which were 9.66 at Time 1 and 13.93 at
Time 2.
Figures 8.1, 8.2 and 8.3 show the change in knowledge scores by education level (with
and without formal education) across groups over time. The solid version of these lines
represents the knowledge scores of farmers with formal education, while the short dash lines
represent the knowledge scores of farmers without formal education.
The difference in knowledge scores between farmers with and without education varied
by experimental group. Table 19 shows that farmers without formal schooling in the traditional +
video group averaged 7.9 at Time 1 and 13.90 at Time 2, while those with education in the
traditional + video group registered average knowledge scores that increased from 8.82 to 13.91
at Time 2. The difference in knowledge scores between farmers with and without education
decreased from .92 to .01. In the traditional lecture/demonstration only group, the difference in
knowledge scores between farmers with and without education decreased from 1.84 to 0.1.
However, in the video only group, the gap in knowledge scores due to education decreased from
2.13 to 1.17. A gap in knowledge about row planting remained.
The results of statistical tests examining these changes over time, and the differences
among treatment groups and between participants with and without formal education are shown

54
in Table 20. They show marginally significant differences by group [F (2,293) = 3.67, p = .03]
when knowledge scores were averaged across time while controlling for the effects of education.
Also, the between-subjects average scores indicated significant differences [F (1, 293) = 18.29]
across time between farmers with and without formal schooling after controlling for the effects
of the experimental treatments.
There also were significant within-subjects differences as indicated in Table 20. The
results of the F-test associated with TestTime [F (1, 293) = 85.79] were consistent with the fact
that average knowledge scores were always higher at Time 2 compared with Time 1. There was
also a significant TestTime x Group interaction (F [2, 293] = 6.61), which indicates that the
changes in knowledge scores before and after training were significantly different among groups.
In addition, there was a significant TestTime x Education level interaction (F[1, 293]= 9.00),
which suggests that changes in knowledge scores were significantly different between farmers
with and without education.
The findings suggest that all three training methods could effectively close knowledge
gaps among farmers with and without formal schooling. Farmers without formal education
improved their scores more than those with formal education. The traditional
lecture/demonstration was still an effective training method for farmers without formal education.

55
Table 19. Knowledge Score Means at Time 1 and Time 2 by Treatment and Education Level
Traditional only Traditional + Video Video only Total
Mean SD Mean SD Mean SD Mean SD
No Edu Time 1 8.47 2.00 7.90 2.67 7.63 2.77 7.98 2.50
No Edu Time 2 13.88 1.41 13.90 1.84 12.72 1.71 13.41 1.72
Edu Time 1 10.31 2.61 8.82 2.50 9.76 2.74 9.66 2.68
Edu Time 2 13.98 1.49 13.91 1.28 13.89 1.64 13.93 1.47
Table 20: Results of a Repeated Measures ANOVA Testing Differences in Knowledge Scores at Time 1
and Time 2 Among the Experimental Groups Using Education as Covariate
df SS MS F Pr>F
Between subjects
Group 2 41.96 20.98 3.67* .03
Edu 1 104.58 104.58 18.29**
.00
Error 293 1675.19 5.72
Within subject
TestTime 1 285.02 285.02 85.79**
.00
TestTime*Group 2 43.91 21.96 6.61**
.00
TestTime*Edu 1 29.90 29.90 9.00**
.00
Error 293 1675.19 5.72
* p < .05, ** p < .01

56
Figure 8.1 Knowledge Scores at Time 1 and Time 2 by treatment and education levels in traditional only
group
Figure 8.2 Knowledge Scores at Time 1 and Time 2 by treatment and education levels in traditional +
video group
Figure 8.3 Knowledge Scores at Time 1 and Time 2 by treatment and education levels in video only
group
8.47
13.88
10.31
13.98
7
8
9
10
11
12
13
14
15
time 1 time 2
no education
had education
7.9
13.9
8.82
13.91
7
8
9
10
11
12
13
14
15
time 1 time 2
no education
had education
7.63
12.72
9.76
13.89
7
8
9
10
11
12
13
14
15
time 1 time 2
no education
had education

57
CHAPTER 5
CONCLUSIONS
This study tested the effectiveness of video as a complement to or replacement for the
traditional lecture/demonstration method of training farmers in Kamuli District, Uganda. It also
assessed which training methods could decrease knowledge gaps among farmers who differ by
gender, acres of beans planted, and education level. To do so, an experiment was conducted with
325 farmers who were divided into three groups, each of which received one of three training
approaches focusing on row planting for bean production: (1) traditional lecture/demonstration;
(2) traditional lecture/demonstration plus video component; and (3) video only. All three training
groups included a fellow farmer demonstration at the end of each training session. Each group
was composed of 10 to 30 farmers who have had previous training on row planting.
5.1 Findings
5.1.1 Video Can Effectively Complement the Traditional Lecture/ Demonstration
Previous research results have demonstrated that training including both traditional
lecture/ demonstration and video in training could be more effective than traditional
lecture/demonstration alone (Shanthy & Thiagarajan, 2011). In the current study, a comparison
of knowledge tests before and after training found that farmers who received the traditional
lecture/demonstration plus video treatment learned more about row planting than those who
received only the traditional lecture/demonstration. These findings suggest that video can be an
effective complement to the traditional mode of training, especially for groups with relatively
low prior knowledge about a topic.
The knowledge test scores before training showed that those in the traditional lecture/
demonstration group scored significantly higher than those in the traditional lecture/

58
demonstration plus video group. The scores after training were almost the same between the two
groups. The relatively higher scores of those in the group that received the combined traditional
and video methods support the prediction from information processing theory that the use of
multiple training methods can enhance learning (Eastman, 2011).
5.1.2 Video Can be an Effective Replacement for the Traditional Lecture/Demonstration
Method
In this study, a comparison of knowledge scores between the traditional lecture/
demonstration only group and the video only group showed that subjects in both groups had
almost the same knowledge score after the training, and that there was no significant difference
in knowledge improvement from Time 1 to Time 2 between the two groups. This result indicates
that the video only method can be as effective as the traditional lecture/demonstration only
approach.
In this case, the findings suggest that video can replace the traditional
lecture/demonstration method to help farmers learn new planting techniques. Previous studies
have shown that video training alone was more successful in creating interest in rice parboiling
technology than a traditional workshop (Zossou et al., 2010). In some cases, video alone was
more effective in increasing levels of knowledge than conventional training (David & Asamoah,
2011).
The second finding supports previous studies that provide evidence that learning
materials featuring local actors who use the local language under local environments are
effective attributes of videos for training. Previous studies that applied the information
processing theory suggest that new knowledge and sources are integrated with old information
stored in memory during the information integration phase (Hamilton & Nowak, 2005). Such
59
integration enables learners to trust the content of the training and the approaches used (Wilson
& Myers, 1999, p. 80).
The current study suggests that video may be an alternative or a supplementary method to
increase the frequency and quality of training. Besides, video could solve the difficulty of scaling
up the supply and training of trainers by reducing the technological support requirement for each
farmer (Van Mele, 2011). Video also does not require face-to-face presentation by skilled
trainers, a limited resource in rural Uganda.
Van Mele (2006) found that video training was cheaper than traditional extension
methods such as farmer-to-farmer extension and lecture, especially when more farmers need to
be trained. Research conducted by Van Mele (2011) indicated that video, as a tool for
persuasion, could provide information that could be easily processed.
5.1.3 Training Decreases the Knowledge Gaps
The present study also found that the three training methods—traditional
lecture/demonstration, traditional lecture/demonstration plus video, and video only—can
decrease the knowledge gap among farmers of different gender, educational levels, and bean
acreage sizes.
In this study, women, who had lower knowledge at Time 1, learned more than men
regardless of the training method used. Besides, gaps in knowledge about row planting between
women and men decreased in all three experimental groups. The combined lecture/demonstration
plus video method was effective in narrowing the knowledge gap between male and female
farmers.
60
Overall, farmers with smaller bean plots registered a bigger change in knowledge scores
than those with larger plots, narrowing the knowledge gap. This result held across all three
experimental groups.
Across treatment groups, those with low education also learned more from the training.
Rogers (2003) said that access to information by low social status subjects is often
restricted by their limited opportunities to be exposed to new ideas and to be connected beyond
their local communities. This is especially true for female farmers with low education and small
plots. These women often lack the opportunity to communicate with development staff or rural
extension workers (who are predominantly males) because of social norms (Zossou et al., 2010).
Disseminating training messages through “gender-sensitive” NGOs such as VEDCO could thus
help women to access information from new communication channels (video, cell phone and the
Internet) (Van Mele, 2007).
The results of the current study are consistent with those of Shingi and Mody (1976) who
suggested that the communication effects gap among farmers could be closed by credible and
understandable agriculture television programs. They found the greatest knowledge gain among
farmers who did not have access to agriculture information sources.
5.1.4 A Disadvantage of the Video Only Method: Low Interaction
According to the participants’ open-ended responses, a disadvantage of the video only
method is that it does not provide opportunities for feedback and interaction with agricultural
specialists. Participants in the video only group complained that there was no one who could
answer their questions relating to the training topic. An interactive training approach is one in
which farmers have the opportunity to observe, record, discuss, generate their own ideas, and
obtain a deep understanding of theories and their practical applications (Coldevin, 2003). In the
61
traditional lecture/demonstration group, trainers are able to answer questions about row planting
during or right after the training. The trainer is often an active mediator who encouraged
discussions.
Training in small groups (10-30 farmers) could also provide an opportunity for
interaction in video only groups. Information processing theory proposes that learning together
can create and recreate human communities so that learning occurs in relationship with others
(Boyatzis, Cowen & Kolb, 1995). In the current study, most of the training was conducted in
groups ranging in size from 10 to 30. However, because of the miscommunication between
CBTs and the group leaders, there was one group with seven farmers and another one with more
than 40 participants. The quality of learning seemed to vary in these two groups. The group with
seven members exhibited low interaction and few group discussions. However, when group size
grew to more than 40, training became messy, and farmers at the back had difficulty hearing and
watching the video.
5.2 Limitations of the Study
This study has a number of limitations. The first is that the participants were not
randomly assigned to the three experimental groups. Because of the poor quality of roads and the
lack of transportation, it was not possible to bring all farmers together in a fixed location where
they can be randomly assigned to experimental groups. Training had to be conducted by parish.
In addition, in order to reduce contamination between groups, the 325 farmers who participated
in this study were divided into groups by parishes, which were relatively far apart from each
other.
This group assignment mode led to two problems. First, because some demographic
characteristics were not equally distributed among parishes, these variables were also not evenly

62
distributed within the study sample. The second problem pertains to knowledge about row
planting in the three groups before training. Most farmers had already received training about
row planting at least once during the previous growing season. However, they were trained by
different trainers according to the parishes where they lived. Although the training had the same
content, the training effects could be different. In other words, trainers with different skills could
have affected pre-training knowledge levels.
The two problems discussed above increased the difficulty of interpreting the change in
knowledge scores from Time 1 to Time 2 and of comparing the effectiveness of each treatment.
The knowledge scores before training suggest that the group given the traditional
lecture/demonstration had the highest Time 1 score, while the group that received both the
traditional lecture/demonstration plus the video had the lowest Time 1 score. Subjects in all
groups had similar Time 2 scores.
One possible reason why the change scores of those who received only the traditional
lecture/demonstration were significantly lower is because they already had high knowledge
scores before training. In terms of knowledge question, they were limited in how much more
they could learn. This is commonly called “ceiling effect”. Subjects in the traditional
lecture/demonstration + video group had a lower Time 1 score, their potential to learn was
higher.
The second limitation of this study is the training topic. Because most participants
already had been trained about row planting, the topic was no longer new to them. In fact, the
majority had already adopted row planting practices before the training. As such, what they
know cannot be attributed to training alone; it may have also come from practice. These
experiences might have influenced farmers’ knowledge scores. For example, before training,

63
some farmers complained that planting in rows was too time and energy consuming, so they
might not use row planting in the future. During the experiment, these farmers might not have
paid enough attention, producing outcomes worse than those who had never tried row planting
before.
In the current study, all three experimental groups were trained on the same topic.
Although this enhanced the experimenter’s level of control, it makes it hard to speculate about
the potential effectiveness of video for other training topics.
The third limitation is that the evaluation of effectiveness might not accurately reflect
farmers’ knowledge, attitudes and adoption intentions. Farmers may forget some items about row
planting quickly in the absence of reinforcements. Thus, the right-after-training knowledge test
might not reflect farmers’ knowledge levels in the field. Furthermore, attitudes about the
recommendation and adoption intentions are known to change over time. Although most were
positive about row planting and expressed a strong intention to adopt row planting right after
training, actual behavior and attitudes in the field may be different.
The fourth limitation of this research is that farmers’ interest in learning from video
might decrease as they are exposed more to video training. Considering that most had never
received video training before, their interest in learning from a new method was very high, a
condition known as novelty effect. However, as their exposure to video training increases, their
interest in learning from video might decrease.
The last limitation is that there was no comparison between training conducted in small
groups and individual training. In this study, training was conducted in small groups with 10 to
30 farmers. Training in groups could assist learning by promoting discussions and interaction.
However, individual training could be more flexible. For example, farmers could be organized

64
on their own time to join the training, and the pace of training could be adjusted to suit individual
needs. Because the current study used only a group approach, it was not possible to measure the
extent to which being in a group helped or hurt training effectiveness.
5.3 Suggestions for Future Study
Future studies should explore the effectiveness of video for different agricultural
procedures (e.g., planting, post-harvest practices, and marketing) to test the video’s potential to
enhance knowledge acquisition for multiple topics, especially those that are new to farmers.
Longitudinal field research measuring actual adoption of training recommendations over time
would also be helpful to evaluate video’s effectiveness. Future studies also should assess the
cost-effectiveness of video training and compare it with that of conventional training for both
small scale and large scale training efforts. Lastly, more research concerning appropriate
projector devices to provide video training in rural areas would be useful to increase
accessibility.

65
REFERENCES
Anderson, R., Dickey, M., & Perkins, H. (2001, February). Experiences with tutored video
instruction for introductory programming courses. In Proceedings of the 32nd Technical
Symposium on Computer Science Education (pp. 347-351). Charlotte, NC: ACM Press.
Bery, R. (2003). Participatory video that empowers. In S. A. White (Ed.), Participatory video images
that transform and empower (pp. 102-121). New Delhi, India: Sage.
Bobrow, D., & Norman, D. (1975). Some principles of memory schemata. In D. Bobrow & A. Collins
(Eds.), Representation and understanding: Studies in cognitive science (pp. 131-149. New
York: Academic Press.
Bovy, R. (1981). Successful instructional methods: A cognitive information processing
approach. Educational Communication and Technology, 29(4), 203-217.
Boyatzis, R., Cowen, S., & Kolb, D. (1995). Innovation in professional education: Steps on a
journey from teaching to learning. San Francisco, CA: Jossey- Bass.
Butler, L. M., & Mazur, R. E. (2007). Principles and processes for enhancing
sustainable rural livelihoods: Collaborative learning in Uganda. International Journal of
Sustainable Development and World Ecology, 14(6), 604-617.
Burmark, L. (2002). Visual literacy: Learn to see, see to learn. Berkley, CA: Association for
Supervision and Curriculum Development.
Chowdhury, A. H., Van Mele, P., & Hauser, M. (2011). Contribution of farmer-to-
farmer video to capital assets building: Evidence from Bangladesh. Journal of Sustainable
Agriculture, 35(4), 408-435.
Coldevin, G. (2003). Participatory communication: A key to rural learning systems. Rome, Italy: The
Food and Agriculture Organization of the United Nations.
David, S., & Asamoah, C. (2011). Video as a tool for agricultural extension in Africa: A
case study from Ghana. International Journal of Education and Development Using
Information and Communication Technology, 7(1), 26–41.
Digital Green (2010). Annual Reports 2009-10. Retrieved on December 16, 2012, from
http://digitalgreen.org/annualletter
Eastman, V. (2010). Small group instruction: Reading instruction utilizing learning style
preferences and the reading achievement of first grade students. Unpublished doctoral
dissertation. Ball State University, Muncie, IN.
Food and Agriculture Organization of the United Nations [FAO]. (2009). Bridging the gap:
FAO’s programme for gender equality in agriculture and rural development. Retrieved on

66
January 1, 2012, from http://www.fao.org.
Gandhi, R., Veeraraghavan, R., Toyama, K., Ramprasad, V. (2007). Digital
Green: Participatory video for agricultural extension. Paper presented at the 2007
International Conference on Information and Communication Technologies and
Development. Bangalore, India.
Gurumurthy, A. (2006). Promoting gender equality? Some development-related uses of ICTs
by women. Development in Practice, 16(6), 611-616.
Hamilton, M. A., & Nowak, K. L. (2005). Information systems concepts across two
decades: An empirical analysis of trends in theory, methods, process, and
research domains. Journal of Communication, 55, 529–553.
Jain, M., Birnholtz, J., Cutrell, E., & Balakrishnan, R. (2011). Exploring display techniques
for mobile collaborative learning in developing regions. In Proceedings of the 13th
International Conference on Human Computer Interaction with Mobile Devices and Services.
New York, NY: ACM Press.
Levie, W. H., & Lentz, R. (1982). Effects of text illustrations: A review of research. Educational
Communications and Technology Journal, 30(4), 195-232.
Lie, R., & Mandler A. (2009). Video in development: Filming for rural change. Retrieved from
http://www.anancy.net/documents/file_en/Video_in_Development.pdf
MacInnis, D., & Price, L. (1987). The role of imagery in information processing: Review and
extensions. Journal of Consumer Research, 13(4), 473-491.
Mathur, A., Ramachandran, D., Cutrell, E., & Balakrishnan, R. (2011). An exploratory study on the
use of camera phones and pico projectors in rural India. In Proceedings of the 13th
International Conference on Human Computer Interaction with Mobile Devices and Services.
New York, NY: ACM Press.
Mehrabian, A. (1981). Silent messages: Implicit communication of emotions and
attitudes. Belmont, CA: Wadsworth.
Miller, G. (1956). The magical number seven, plus or minus two: Some limits on our
capacity for processing information. Psychological Review, 63, 81-97.
Pcmag (2010). 3M project projector MPro150. Retrieved on April 12, 2012, from
http://www.pcmag.com/article2/0,2817,2361254,00.asp
One media player pre teacher [OMPT]. (2010). Retrieved on April 12, 2012, from
http://www.ompt.org/content/video
Richardson B., Kitchen G., & Livingston G. (2002). The effect of education on knowledge and

67
management of elder abuse: A randomized controlled trial. Age and Ageing, 31(5), 335-341.
Rogers, E. (2003). Diffusion of innovations. New York, NY: Simon & Schuster.
Scott, H. V. (1994). A serious look at the 4MAT model. Retrieved from ERIC ED383654 at 3-1-10
Shanthy, T. R., & Thiagarajan, R. (2011). Interactive multimedia instruction versus
traditional training programmes: Analysis of their effectiveness and perception. Journal of
Agricultural Education and Extension, 17(5), 459-472.
Shingi, P. M., & Mody, B. (1976). The communication effects gap: A field experiment on
television and agricultural ignorance in India. Communication Research, 3(2), 171–190.
Sseguya, H. (2009). Impact of social capital on food security in southeast Uganda. Unpublished
doctoral dissertation, Iowa State University, Ames, IA
Tumwekwase Ahabwe, A., Kisauzi, T., & Misiko, M. (2009). Media, gender and rice
information in Itek-Okile irrigation scheme of Lira District, Uganda. Cotonou, Benin: Africa Rice
Center.
United Nations Development Programme [UNDP]. (2011). Gender inequality index (GII).
Retrieve on Apr. 19, from http://hdr.undp.org/en/media/HDR_2011_EN_Table4.pdf
Van Mele, P. (2006). Zooming in, zooming out: A novel method to scale up local innovations and
sustainable technologies. International Journal of Agricultural Sustainability, 4(2), 131-142.
Van Mele, P. (2011). Video-mediated farmer-to-farmer learning for sustainable
Agriculture. Ghent, Belgium: Agro-Insight.
Van Mele, P., Salahuddin, A., & Magor, N. P. (2005). Innovations in rural extension:
Case studies from Bangladesh. Wallingford, Oxfordshire, UK : CABI Publishing.
Van Mele, P. (2008) Rural service providers and scientists: Multiple approaches to enhance
communication between rice farmers, rural service providers and scientists. Outlooks on
Pest Management, 260-264
Van Mele, P., Wanvoeke, J., Akakpo, C., Dacko, R. M., Ceesay, M., Beavogui, L.,
Soumah, M., & Anyang, R. (2010a). Video bridging Asia and Africa: Overcoming
cultural and institutional barriers in technology-mediated rural learning. The
Journal of Agricultural Education and Extension, 16(1), 75-87.
Van Mele, P., Wanvoeke, J., & Zossou, E. (2010b). Enhancing rural learning,
linkages, and institutions: The rice videos in Africa. Development in Practice, 20(3), 414-421.
Van Mele, P., Zakaria, A.K.M., Begum, H. A., Rashid, H. R., & Magor, N.P. (2007).Videos that
strengthen rural women’s capability to innovate. Communication for Development and Social
Change, 1(3), 79–99.

68
van Oostendorp, H., Preece, J. & Arnold, A. G. (1999, September). Designing multimedia for human
needs and capabilities. Interacting with Computers, 12(1), pp. 1-5.
Vogel, D. R., Dickson, G. W., & Lehman, J. A. (1986). Persuasion and the role of visual presentation
support: The UM/3M study. Working Paper Series (MISRC-WP-86-11). San Francisco, CA:
Thinktwice Inc.
Wang, R., Sahni, U., Garg, N., Dasgupta, N., Sobti, S., Setia, T., & Anderson, T. (2005).
Digital networking going postal and tale of three schools, Small Change Magazine, India.
Retrieved from http://dsh.cs.washington.edu:8000/distance/SC.pdf
Wilson, B. G. , & Myers, K. M. (1999). Situated cognition in theoretical and practical contexts. In
D. Jonassen & S. Land (Eds.), Theoretical foundations of learning environments. Hillsdale,
NJ: Lawrence Erlbaum.
Wimmer, R.D., & Dominick, J. R., (2006) Mass media research: an introduction (8th Edition).
Belmont, CA: Thomson Higher Education.
Zossou, E., Van Mele, P., Vodouhe, S. D., & Wanvoeke, J. (2009a). The power of video
to trigger innovation: Rice processing in central Benin. International Journal of Agricultural
Sustainability, 7(2), 119-129.
Zossou E., Van Mele, P., Vodouhe, S. D., & J. Wanvoeke, J. (2009b). Comparing farmer-
to-farmer video with workshops to train rural women in improved rice parboiling in central
Benin. Journal of Agricultural Education and Extension, 15(4), 329-339.
Zossou, E., Van Mele, P., Vodouhe, S.D., & Wanvoeke, J. (2010). Women groups formed in response to
public video screenings on rice processing in Benin. International Journal of Agricultural
Sustainability, 8(4), 270–277.

69
APPENDIX A
IRB EXEMPT FORM

70

71
APPENDIX B
QUESTIONNAIRE
Evaluation of Training Approach
1. a. Questionnaire ID: _____________ b. Date :_________ c. Interviewer: _____________
2. a. Sub-county: _____________ b. Parish: __________ c. Zone/Village______________
3. Group name: ___________________________________________________________
4. a. Respondent Name:___________________________ b. Age______ c. Sex_____
d. Years of formal Education ________ e. Occupation as main income source _______
Section A
Let’s begin by talking about the recommended practice of today’s training: Row Planting
5. Had you heard anything about this recommended practice or used this recommended practice before
you came for training today?
(1) Yes (if yes, go to Question 6) (2) No (Stop interview)
6. If yes, how would you consider your knowledge about row planting before this particular training?
(1) I don’t know anything about row planting.
(2) I know a little about row planting, but there is a lot I don’t know about it.
(3) I already know some very important point of row planting, but could learn more.
I already have nearly all knowledge about row planting.
7. Prior to today’s training, had you ever used the practice that was recommended today?
(1) No, I have never used row planting.
(2) Yes, I have tried row planting, but I am not using it now.
(Why?______________________________________________________________ )
(3) Yes, I use the recommended practice now.
8. a. In your own words, what were the main points about row planting that were presented in today’s
training? (Address both of the following questions: (1) What problem is the technology intended to
solve? (2) What are the main procedures needed to use this technology? Tick (√) the points farmers
addressed and cross (X) the points farmers missed.
Problems intended to solve: weeding difficulty spraying difficulty
insufficient nutrients for plants

72
Main procedures:
Plant at the beginning of the rainy season for better utilization of soil moisture
Plant beans in rows
Row should be 50cm (1.5 ft) apart
Seeds should be sown 15-20cm (0.5 ft) apart
Space rows of different varieties 2 meters apart to prevent mixing of varieties.
9. What are the main benefit(s) you get or would get from adopting the practice that was recommended
in the training? Tick(√) the points farmers addressed and cross(X) the points farmers missed.
Higher yields making weeding easier
making spray easier Increase access to sufficient nutrients
10. What tools would you need to adopt the recommended practice? Tick(√) the points farmers
addressed and cross(X) the materials farmers missed.
strings 2 pugs each one 1.5 ft hoe
11. a. In your own words, what were the main points about row planting that were presented in today’s
training? (Address both of the following questions: (1) What problem is the technology intended to
solve? (2) What are the main procedures needed to use this technology? Tick (√) the points farmers
addressed and cross (X) the points farmers missed.
Problems intended to solve: weeding difficulty spraying difficulty
insufficient nutrients for plant
Main procedures:
Plant at the beginning of the rainy season for better utilization of soil moisture
Plant beans in rows
Row should be 50cm (1.5 ft) apart
Seeds should be sown 15-20cm (0.5 ft) apart
Space rows of different varieties 2 meters apart to prevent mixing of varieties.
b. Please rate your understanding of the recommended practice in the training.
Didn’t understand at all Understand little Understand some,
but not very much
Understand a lot Understand all
12. What are the main benefit(s) from adopting the practice recommended in the training? Tick(√) the
points farmers addressed and cross(X) the points farmers missed.

73
Higher yields Making weeding easier Making spray easier
Increase access to sufficient nutrients
13. What tools would you need to adopt the recommended practice? Tick(√) the points farmers
addressed and cross(X) the materials farmers missed.
Strings 2 pugs each one 1.5 ft Hoe
14. Do you have these materials now?
(1) Yes (2) No
15. Could you get the materials you need to adopt the recommended practice easily?
(1) There is no chance to get the materials (2) It is hard to get materials
(3) Getting these materials is not hard (4) It is really easy to get these materials
(5) Don’t know
16. How would you rate the overall value of the recommended practice to you? Would you say that
adopting it would not really be an improvement for your bean production, or that it would be a great
improvement?
(1) Would not be an improvement at all (2) Would not be much of an improvement
(3) Would be a slight improvement (4) Would be a substantial improvement
(5) Don’t know
17. a. Based on what you learned today, is it likely that you will use this recommended practice during
the next bean growing or post-harvest season?
(1) Not likely at all (2) Not very likely (3) Somewhat likely
(4) Very likely (5) Don’t know
b. What is the main reason for your decision?
________________________________________________________________________________
18. What might cause farmers like you to not adopt the practice that was recommended?
_________________________________________________________________________________
Section B
19. Now I would like to ask about the training presented today.
Today, three methods were used in the training. There was (1) a presentation by the CBT,
(2) a training video, then (3) a farmer’s demonstration to repeat and describe/explain what

74
was in the training. How helpful to you were each of these training methods? Let’s take them
one by one.
Let’s evaluate the video.
i. Could you hear the presentation clearly?
(1) Not clear at all (2) Partly clear (3) Mostly clear (4) Totally clear
b. Was the visual quality good enough for you to see the training method clearly?
(1) Not clear at all (2) Partly clear (3) Mostly clear (4) Totally clear
c. What were the main characteristics of the video that helped you better understand this topic?
___________________________________________________________________________
d. What were the weaknesses of the video that hindered your understanding of this topic?
___________________________________________________________________________
e. What suggestions do you have to improve the video?
___________________________________________________________________________
f. Please indicate how useful this video was for your learning:
(1) Not useful at all (2) Not very useful (3) Somewhat useful (4) Very useful
Now, when you think about the content of the video you saw today:
g. Would you say that the advice was technically correct?
(1) Not correct at all (2) Somewhat incorrect (3) Somewhat correct (4) Completely correct
h. Was the content presented to you in an interesting way?
(1) Not interesting at all (2) Not very interesting
(3) Somewhat interesting (4) Very interesting
Let’s evaluate the CBT presentation:
a. Could you hear the CBT demonstration clearly?
(1) Not clear at all (2) Partly clear (3) Mostly clear (4) Totally clear
b. Was the visual quality of overall CBT training good enough for you to see the training
method clearly?
(1) Not clear at all (2) Partly clear (3) Mostly clear (4) Totally clear
c. What were the main characteristics the CBT presentation that helped you better understand
this topic?
___________________________________________________________________________

75
What were the weaknesses of the CBT presentation that hindered your understanding of this
topic?
___________________________________________________________________________Wh
at suggestions do you have to improve the CBT presentation?
___________________________________________________________________________
d. Please indicate how useful the CBT presentation was for your learning
(1) Not useful at all (2) Not very useful (3) Somewhat useful (4) Very useful
Now, when you think about the content of the CBT presentation you saw today:
e. Would you say that the advice was technically correct?
(1) Not correct at all (2) Somewhat incorrect (3) Somewhat correct (4) Completely
correct
f. Was the content presented to you in an interesting way?
(1) Not interesting at all (2) Not very interesting (3) Somewhat interesting (4) Very
interesting
Let’s evaluate the fellow farmer’s demonstration:
a. Could you hear the fellow farmer’s demonstration clearly?
(1) Not clear at all (2) Partly clear (3) Mostly clear (4) Totally clear
b. Was the visual quality of overall fellow farmer’s demonstration good enough for you to see
the training method clearly?
(1) Not clear at all (2) Partly clear (3) Mostly clear (4) Totally clear
c. What were the characteristics of the fellow farmer’s demonstration that helped you better
understand this topic?
___________________________________________________________________________Wh
at were the weaknesses of the fellow farmer’s demonstration that hindered your understanding of
this topic?
___________________________________________________________________________Wh
at suggestions do you have to improve the demonstration by the fellow farmer?
___________________________________________________________________________
d. Please indicate how useful the fellow farmer’s demonstration was for your learning:
(1) Not useful at all (2) Not very useful (3) Somewhat useful (4) Very useful
Now, when you think about the content that was in the fellow farmer’s demonstration training
message you saw today:

76
e. Would you say that the advice was technically correct?
(1) Not correct at all (2) Not very correct
(3) Somewhat correct (4) Completely correct
f. Was it presented to you in an interesting way?
(1) Not interesting at all (2) Not very interesting
(3) Somewhat interesting (4) Very interesting
20. If you had to choose, which ONE of these three methods would you prefer? Ask farmers to ank the
three methods so that “1” represents the method the farmer likes most and “3” represents the method
the farmer likes least.
Video_________ CBT presentation_________ Fellow farmer demonstration________
Why did you rank these methods in this way?
______________________________________________________________________________
21. a. Do you think combining two or more than two methods was helpful for you to understand the
training topic?
(1) No (Please explain why you said
no:___________________________________________________________)
(2) Yes (Please explain why you said
yes:___________________________________________________________)
22. If a training approach includes two or more than two methods, which method do you want to come
first and which method do you want to come second and third? Rank so that “1” represents the
method the farmers want to come first and “3”’ represents the method the farmers want to come
third.
First method___________________ Second method____________________
Third method________________

23. Farmers learn about new ideas and practices from a variety of sources. Now, I’m going to name a number of sources besides this
training that you might have used. For each, please tell me if you have used this source to get information about bean production.
If you have used a source, I would also like to know how valuable you consider the information you received from the source.
23a. Rank the quality of the information relevant to bean production provided by these sources? In doing so, please use a scale from 1 to 7
where 1 represents the best quality, and 7 represents the worst quality. If farmer doesn’t use a source, put ‘0.’
Radio___; Politicians___; Neighbors/Friends___; Family members___; Newspapers___; NGO/Extension staff___; Others ___.
23b. Rank the information source you used most to get bean production knowledge? (‘1’ represents used most, and ‘7’ represents
used the least, if farmer doesn’t use this source, just put ‘0’)
Radio___; Politicians___; Neighbors/Friends___; Family members___; Newspapers___; NGO/Extension staff___; Others ___.
Source Have you used it?
What information relevant to bean production did you get from this information source? Not useful at all
Not very useful
Somewhat useful
Very useful
Yes No
Radio
Neighbors/ friends
Family members
Newspapers
NGO/ extension staff
Politicians Other (please specify) ____________
81

78
Section C
24. What varieties of beans did you grow during the past three years?
Growing
season
Variety
name
Acres
planted
Total
yield
Amount Sold (if any)
Price
(per kg.)
Problems (hail,
drought, flood, etc.)
1st Season 2011
Variety 1
1st Season 2011
Variety 2
1st Season 2011
Variety 3
2nd
Season 2011
Variety 1
2nd
Season 2011
Variety 2
2nd
Season 2011
Variety 3
25. Did you store beans after your harvest?
a) No (if no, go to Question 29) (2) Yes (if yes, go to Question 28)
26. How much of your bean production did you store as seed? ____.__kg ___.__kg for home
consumption? ____.__kg for sale?
a) What problems did you have storing it, if any?_________________________________
b) What method(s) do you use to control damage? __________________________________
c) How successful is your method(s) of control? ___________________________________
d) How much of the stored grain was lost to weevils (bruchids), if any? ___________________
e) When you planted stored grains as seed, approximate what percentage germinated
(sprouted and grew)? ________
27. Which varieties of beans do you plan to grow now (first season in 2012)? Is this the same area
planted in 2011, or an increase or a decrease? Please explain why.
Variety growing
2012 1st season
Increase, same, or
decrease Reason
1 =
2 =
3 =
Section D

79
28. What’s the total number of people in your household?_____________
How many adults? _______ How many children? _______
29. a. How many acres of farmland do you own? _____.___ acres
b. How many acres of farmland do you rent from others? _____.___ acres
30. Is farming the most important source of income for your family? (1) No (2) Yes

80
APPENDIX C
INFORMATION SOURCES USED FOR BEAN PRODUCTION
According to Sseguya (2009), the main information sources for farmers in Kamuli district
are fellow community members, government staff, local business people, NGOs, local leaders
and radio. To determine the farmers’ source of information for bean production, the current study
asked farmers about their use of radio, TV, neighbors/friends, family members, newspapers,
NGO/extension staff, and others to get information about beans. For each source, farmers were
asked if they used the source and if they did, they were asked what specific information about
beans they learned from that source. Farmers were asked to rate the quality of each source used.
Information Sources for Bean Production
Table 4 shows most subjects (96%) confirmed that they received bean production
information from NGO/extension staff. This answer perhaps reflects the fact that VEDCO, an
indigenous Ugandan NGO, has been active in farmers’ training. About 32% used radio to get
bean production information. Radio is the channel used with the highest frequency. In
comparison, less than 1% said that they get information from TV 3.1% from newspapers). They
also frequently mentioned two interpersonal sources: family members (31.1 %) and
neighbors/friends (27.7 %).
Frequency of Information Source Use
The farmers were asked to rank their three most frequently used information sources. As
shown in Table 5, NGO/extension was ranked first, considered as the most frequently used bean
information source. A total of 103 participants used radio, with approximately 78% ranking it as
the second most frequently used medium. Many (101) reported getting information from family
members, with around 50% ranking them as the second most frequently used information source
for bean production. For the 90 farmers who used neighbors/friends, 40% rated them as the
second most frequently used source. Another 33.22 % ranked them as the third most frequently
used information source.

81
Table 21. Use and Effectiveness of Information Sources for Bean Production
Source % who used this source Effectiveness (SD) NGO/Extension staff 96.3 3.98 (.25) Radio 31.7 3.64 (.62) Family Member 31.1 3.65 (.66) Neighbors/Friend 27.7 3.40 (.57) Others 9.2 3.32 (.48) Newspapers 3.1 3.50 (.53) TV 0.9 4.0 (0)
Table 22. The Most Frequently Used Information Sources for Bean Production
Radio % Family
Member %
Neighbors/
Friend %
NGO/
Extension %
First Frequently 5.8% 4.0% 0% 91.7%
Second
Frequently
77.7% 49.5% 40.0% 0%
Third Frequently 17.5% 24.8% 32.2% 0%
Total 104 101 90 313
Usefulness Evaluation of Information Sources
Farmers also were asked to rate the usefulness of each information source for their bean
production used from “4” (very useful) to “1” (not useful at all). Table 4 shows that
NGO/Extension staff (M = 3.98, SD = .25) also led in this aspect. The usefulness score of family
members (M = 3.65, SD = .66) and radio (M = 3.64, SD = .62) was less than that of the
NGO/extension staff, but slightly higher than neighbors/friends (M = 3.4, SD = .57) and “others”
(M = 3.32, SD = .48). Very few used TV or newspapers as an information source for bean
production, so caution is needed when examining their effectiveness ratings.
The results for usefulness of information sources was consistent with Sseguya’s (2009)
finding that in 12 rural communities of Kamuli district, the reliability and applicability of
information from NGOs was rated highly across multiple topics because the information they
provide is considered timely, of good quality, and because they regularly follow-up on the
application of recommended practices. Information from radio was also rated as being reliable.
Examples of Types of Information Provided by Each Information Source
Subjects were asked to briefly describe the bean production information they got from
each information source, and their answers were categorized into six types as listed in Table 6.
The most frequent topics mentioned as coming from the NGO/Extension staff related to bean

82
planting methods. Other types of information from this source included bean marketing, the
advantages of bean production, harvesting and storage, seed information, and the use of beans.
The following are examples of information received from NGO/Extension staff.
“VEDCO trained us on how to use the rhizobia modulates and to plant in line.”
Female, 27
“VEDCO told us to first prepare the garden, then plant beans in rows because it
produces higher yield.”
Female, 66
“They tell us to form groups, and in our group, we plant in rows and identify markets (for
our beans.)”
Female, 60
The participants also say that about 70% of bean production information they get from
the radio was relevant to planting methods, including land/garden preparation, planting, weeding,
fertilization, and disease control. For example, they learned from the radio when to plant, ways
to prepare the garden, and other good planting practices. Bean marketing was also an important
bean topic learned from radio.
The following are examples of bean production information received from radio.
“Radio told us where to market beans.”
Male, 55
“Radio told us how to make bread from beans.”
Female, 28
Other information from radio included how to assess seed quality, improve post-harvest
skills, and other advantages of bean production.
The majority of information about bean production received from family, neighbors and
friends also focused on planting practices. Also learned from these interpersonal sources were
how to market beans, uses of beans, and information about seeds.
The following are examples of topics learned from family members, neighbors or friends.
“ (My family told me) that beans are delicious (and can be eaten) with posho, mixed with
cassava.”
Female, 48
“ (My family told me about) the price of beans in the market.”

83
Female, 35
“ (My family told me) to plant in rows for easy weeding.”
Female, 35
“(My neighbor/friend taught me) how to properly plant and manage beans of different
varieties.”
Female, 40
“(From my neighbor/friend I) get information about how to market our products. We go
to market and sell our produce together.”
Male, 30
“(My neighbor/friend taught me) how to bake biscuits to earn more money from beans.”
Female, 48
Table 23. Types of Information About Bean Production Received From Information Sources
Bean
Planting
Method
Advantage
of Bean
Production
Harvest and
Storage
Bean
Marketing
Bean
usage
Seed
Information
Radio ● ● ● ● ● ●
TV ●
Family ● ● ● ●
Neighbors & Friends ● ● ● ● ●
Newspapers ● ● ● ●
NGO/Extension Staff ● ● ● ● ● ●
Others ● ● ● ●
Related Documents